Article

Particle Entrapment in Line Elastohydrodynamic Contacts and the Influence of Intermolecular (van der Waals) Forces

KADMOS Engineering Ltd., 3 Princes Mews, Hounslow TW3 3RF, UK
Lubricants 2020, 8(5), 60; https://doi.org/10.3390/lubricants8050060
Submission received: 6 April 2020 / Revised: 13 May 2020 / Accepted: 18 May 2020 / Published: 25 May 2020
(This article belongs to the Special Issue Tribology across Scales)

Abstract

:
A metallic particle passing through concentrated rolling-sliding contacts is often linked to surface damage for particles larger than the available gap. At the instant of particle pinching, force balancing dictates particle entrapment and passing through the contact or rejection. It is vital to include all major forces in this process. This study revisits the analytical entrapment model previously published by the author for spherical micro-particles by incorporating a force so far overlooked in related studies, namely the van der Waals intermolecular force and, additionally, surface roughness effects. In conjunction with particle mechanical and fluid forces, this provides an almost complete set to use for correct force balancing. A parametric analysis shows the effect of several geometrical, mechanical, rheological, and surface parameters on spherical particle entrapment and reveals the significance of the van der Waals force for particles smaller than about 5–10 μm in diameter.

Graphical Abstract

1. Introduction

The harmful effects of debris particles to the operation and life expectancy of concentrated contacts have been documented since at least the 1970s. The problem is particularly evident in metallic contacts in relative motion and under nanometric separation by a lubricating liquid or gas film. Historical literature reviews on the topic [1,2] and doctoral theses [3,4] have addressed the majority of issues related to particulate contamination and concentrated contacts met in modern machinery. For line (or rectangular) contacts in particular, which is the sole focus area of the present study, typical examples include plain journal bearings, needle roller bearings, spur gears, and camshafts (lobes-tappets). So what exactly is particle entrapment?
Particle entrapment in this article refers to the momentary pinching of an isolated solid particle by the counter-surfaces of a concentrated contact between two solids engaged in relative motion (Figure 1). In this process, the particle is compressed and, depending on its toughness, ductility, or brittleness, may be crushed and extruded, sheared, disintegrate, or be expelled and survive the incident. By this definition, entrapment pre-supposes that the isolated particle is simultaneously in contact with two other surfaces. If the particle is in contact with only one surface or is not in contact with any surface, then we are actually dealing with “entrainment”. The latter involves a different theoretical analysis and has been treated in other studies (e.g., [4,5,6,7,8]), with emphasis on elastohydrodynamically lubricated (EHL) contacts. Interested readers are also directed to Section 6 of Nikas [1] for a literature review on the particular topic of particle entrainment, including rigorous mathematical studies in the context of fluid mechanics and/or granular flow analysis in the case of suspensions instead of one isolated particle.
The aftermath of particle entrapment has been theoretically and experimentally analysed in numerous studies in terms of surface indentation, abrasion, scoring, frictional heating, acoustic emission (noise), scuffing, and, generally, reduction of the remaining life of the affected contact [1,2]. By contrast, the process of entrapment per se is only analysed in very few theoretical studies, despite its obvious criticality in potential contact damage. Specifically, for line and non-conformal contacts, the problem has been theoretically analysed for a single spherical and rigid particle by Dwyer-Joyce et al. [3,9,10], Kusano and Hutchings [11], Zhong et al. [12], and Espejel and Gabelli [13] in studies which involve the equilibrium of normal and frictional forces on the particle in the process of entrapment in order to find the direction of the resultant force. Having found the direction of the resultant force, it is straightforward to declare either particle entrapment or rejection. In those studies, there is normally a rolling contact involved, surfaces are assumed rigid, and the same coefficient of friction between the particle and each of the contact counterfaces is assumed.
In a mathematical model by the present author [4,14], conditions are extended to cover rolling-sliding contacts, unequal friction coefficients between the particle and each contact counterface, and deformable surfaces (variable curvature radius), in addition to analytically accounting for static and dynamic fluid forces on the particle in the case of EHL contacts. In fact, fluid forces were found to be weak in comparison to mechanical forces at the incidence of entrapment except for small particles with a size comparable to that of the central film thickness of the EHL contact (normally particles smaller than 10 μm) [4,14]. In the latter case, the role of fluid forces is critical in regards to particle entrapment. This is because very small particles prior to pinching can penetrate deeply inside the inlet zone of an EHL contact where the elastohydrodynamic (EHD) pressure is higher than ambient. It is then inevitable to query the role of other potential forces in the entrapment process that have so far been ignored.
Specifically, intermolecular electromagnetic forces known as van der Waals forces operate at close range of mainly less than 100 nm and down to the minimum interatomic distance of about 0.2 nm [15]. Such forces become exponentially stronger with diminishing solid separation. They are thus potentially critical for micro-particles in very close proximity or in “intimate contact” with solid walls. For two identical surfaces at nanometric separation and in vacuum, the van der Waals force is attractive. However, in the presence of a medium (e.g., liquid lubricant) with a dielectric constant and refractive index intermediate to those of the counter-surfaces, the van der Waals force becomes repulsive. Considering the nature of any physical surface with the omnipresence of roughness asperities at various size scales, the interlocking of those asperities in “contacting” surfaces and the presence of some intermediate fluid, tribofilm (e.g., oxide layer), or impurity makes the case of intermolecular interaction very much relevant to the entrapment process of solid micro-particles. Existing particle entrapment models lack this type of force or interaction. Subsequently, it is formulated in this article to include roughness effects and mated with the previous entrapment model of the author for line contacts to unify the analysis with all three critical factors, namely the mechanical forces (contact reaction and friction), the static (Poiseuille) and dynamic (Couette) fluid forces, and the intermolecular (van der Waals) forces. It is then parametrically shown that the van der Waals interaction plays a significant role in the entrapment of spherical metallic particles of diameters less than about 10 μm in EHL contacts, with the related effect being much stronger for smaller particles (e.g., 1–5 μm).

2. Mathematical Analysis

Notation: Upright bold characters are for vectors; italic characters are for scalar quantities.

2.1. Contact Geometry

The model depicted in Figure 1 consists of a rigid and spherical micro-particle with surface nanoroughness, touching two elastohydrodynamically lubricated, rolling-sliding, non-conforming, rough surfaces. The counter-surfaces move with tangential velocities u1 and u2. A Grubin-type analysis [16] is deemed sufficient in this case, as previously applied by this author [4,14]. This means that the infinitely long EHL contact consists of a flat region (ignoring roughness) of width 2b and known as the Hertzian zone, a converging inlet zone to the right of the Hertzian zone in Figure 1 and an outlet zone to the left of the Hertzian zone, which is not shown in Figure 1. A space-fixed Cartesian coordinate system Oxz is located on surface 1 and in the middle of the Hertzian zone.
The lubricated surfaces 1 and 2 have a surface finish akin to that met in polished bearing elements such as rollers and rings (raceways), that is, submicrometric root-mean-square (RMS) roughness values with asperity heights also less than 1 μm; similar though higher values are valid for gear teeth flanks [17]. Such low values, in conjunction with the very high curvature radius of the surfaces close to the nominally flat Hertzian zone, mean that the effect of roughness on the axial placement of most micro-particles at pinching, being just a small fraction of the average asperity height, is negligible, except in the case of particles with a size comparable to the height of roughness asperities. Therefore, the geometrical location of the touch points between the particle and surfaces 1 and 2 is visualised by considering ideally smooth surfaces.
In consideration of particle size effects, larger particles will touch the contact surfaces farther away from the contact centre than smaller ones. In fact, for typical contact gaps of less than 1 μm, even a 10 μm spherical particle, which is considered relatively small, will touch the contact surfaces hundreds of microns away from the entrance to the Hertzian zone [4,18] in a heavily loaded contact. At such distances, EHL pressure is very close to ambient, which means that any flow disturbance by the particle will have negligible effect on the local surface deformation prior to entrapment. This agrees with the theoretical analysis of Kang et al. [6]. On the other side, smaller particles (e.g., less than 10 μm in diameter) that enter deeply inside the contact gap prior to touching the contact counter-surfaces and have approximately attained the local fluid velocity do not possess the size necessary to significantly upset the local surface deflection and alter the local geometry, which has been theoretically shown by Han et al. [8]. Therefore, for the purpose of establishing the local surface geometry, it is rational to consider surfaces 1 and 2 as elastically undisturbed by the presence of a particle prior to it touching them.
Accordingly, the Grubin-type contact model of Figure 1 is retained in the particle’s presence. The elastic normal displacements of the contact surfaces, w1 and w2, are thus calculated in the inlet zone of the contact as follows [16]:
w i = c i { | x | b ( x b ) 2 1 ln [ | x | b + ( x b ) 2 1 ] } ,   ( | x | b ,   i = 1 ,   2 )
where
c i 2 L ( 1 ν i 2 ) π E i ,   ( i = 1 ,   2 )
L is the load per unit length of the contact, that is, the uniform load distribution in the axis perpendicular to the xz-plane, and νi and Ei stand for Poisson’s ratio and the elastic modulus, respectively. The semi-width of the contact is
b = 2 2 R L π E e
where R is the equivalent radius of curvature,
R = R 1 R 2 R 1 + R 2
R1 and R2 being the radii of curvature of the undeformed surfaces 1 and 2, respectively, and Ee is the effective modulus of elasticity,
E e = 2 1 ν 1 2 E 1 + 1 ν 2 2 E 2
Consider now the touch points A and B depicted in Figure 1. From geometrical analysis,
( tan ( a 1 ) tan ( a 2 ) ) = x ( w 1 ( x A ) w 2 ( x B ) ) ( x A x P w 1 z P x B x P w 2 + z P + h c ) = 2 b 2 ( c 1 x A 2 b 2 c 2 x B 2 b 2 )
where xA, xB, and xP are the x-coordinates of points A, B, and P (particle’s centre); zP is the ordinate of the particle’s centre and hc is the central film thickness. Moreover, points A and B belong to the surface of the spherical particle and their coordinates should satisfy the equation of the circle with centre P and radius equal to d/2, d being the particle diameter:
( x A x P ) 2 + ( w 1 z P ) 2 = d 2 4 = ( x B x P ) 2 + ( w 2 + z P + h c ) 2
For a given particle diameter and for film thickness hc calculated by any suitable published formula (see Appendix A), points A and B can be located by numerically solving the nonlinear system of Equations (6) and (7) with the aid of Equations (1) and (2) for the four unknowns xA, xB, xP, and zP.

2.2. Fluid Forces

Fluid forces on the particle stem from (a) the variable EHD pressure in the inlet zone of the contact and (b) the fluid drag caused by the difference between the particle velocity and the local fluid velocity. These have been derived analytically in Nikas [4,14]. The static or Poiseuille-type fluid force is calculated by integrating the EHD pressure on the surface of the particle with the aid of the steady-state Reynolds equation for line contacts. The dynamic or Couette-type fluid force is calculated by considering the creeping flow of fluid past the spherical particle and using an experimentally derived drag coefficient for this type of flow. The result of this analysis is summarised in the following two equations for the components of the total fluid force F in directions Ox and Oz:
F x = 3 π η 0 u 1 + u 2 2 [ h c π 4 ( d h c ) ] ,   ( d > h c )
F z = 3 π η 0 d [ u 2 sin ( a 2 ) u 1 sin ( a 1 ) ]
where η0 is the dynamic viscosity of the lubricant at operating temperature, and angles a1 and a2 are easily calculated by Equation (6):
a 1 = arctan ( 2 c 1 b 2 x A 2 b 2 )
a 2 = arctan ( 2 c 2 b 2 x B 2 b 2 )
It should be noted that, in theory, the viscosity value to use in Equations (8) and (9) may slightly exceed the atmospheric value of η0 because of the EHD pressure rise in the inlet zone. However, the pressure rise is exponential and significant only very close to the entry to the Hertzian zone, at a distance of b to 2b from said entry according to numerous published results [19]. At such distances, the elastically deformed surfaces 1 and 2 are very nearly parallel, which means that the diameter of a contacting particle is almost equal to the local film thickness:
d h c + w 1 + w 2 h c + 2 2 b 3 R x p 3 / 2 ,   ( x p < 10 b )
Equation (12) was derived by substituting w1 and w2 from Equation (1), expanding in the Taylor series and using the first term as in Johnson [16]. This is an excellent approximation for low xp (say, xp < 10b). Solving Equation (12) for xp and dividing by b yields
x p b [ 3 R 2 2 b 2 ( d h c ) ] 2 / 3 ,   ( x p < 10 b )
For typical input data referenced later in this study, Equation (13) gives x p / b values of 0.8, 1.4, 1.9, and 2.3 for particle diameters d = 1, 2, 3, and 4 μm, respectively. This means that even the smallest of particles dealt with in the present study (d = 1 to 2 μm) will make contact at a distance where the EHD pressure rise is small and, correspondingly, the local viscosity increase can safely be ignored in view of calculating the fluid force components.
Finally, it is readily found by Equation (8) that for d > ( 1 + 4 / π ) h c 2.3 h c , Fx is negative and acts in favour of particle rejection from the contact. For a typical film thickness of, say, hc = 0.5 μm, this means that particles with diameters greater than 1.14 μm are forced out of the contact by the action of Fx alone. This, of course, does not necessarily equate to particle rejection, because Fx is only one of several forces acting on the particle.

2.3. Intermolecular Forces

Intermolecular forces act on any solid particle that is in close proximity with another solid. The emphasis here is on the most well-known and precisely analysed type of intermolecular force—the van der Waals force [20]. This is practically negligible for solid separations of more than about 100 nm and becomes exponentially stronger at shorter distances, down to the minimum theoretical interatomic distance of about 0.2 nm [16]. In the present study, it is natural to consider small interatomic separations at the moment of particle pinching, that is, an “intimate” micro-contact between the particle and a counter-surface.
In EHL contacts with lubricant filtering as is normally the case, spherical debris particles are typically orders of magnitude smaller in radius than the curvature radius of the contact counter-surfaces, e.g., the radius of the roller in a needle roller bearing [1,14]. For example, at micro-contact A in Figure 1, an equivalent radius of curvature in accordance with Equation (4) would be r e = R 1 d / 2 R 1 + d / 2 = d 2 + d / R 1 . For a roller of R1 = 10 mm as in the examples presented later, even a large particle of d = 100 μm results in r e = d / 2.01 ; this means that r e d / 2 with an error of 0.5%. For smaller particles or larger radii of surface curvature, the error is obviously much less. It is, therefore, justifiable to visualise micro-contacts A and B in Figure 1 as those between a sphere and a flat (yet rough) surface.
Rumpf’s analysis [21] fits this type of problem. In Rumpf’s analysis, a macroscopically flat surface with idealised hemispherical roughness asperities interacts with a spherical particle in two ways: (a) Via the nano-contact between the particle and an asperity of the rough surface, and (b) via the force between the particle and the flat surface separated by a distance equal to the asperity radius. The total van der Waals force (G1, G2 in Figure 1) is calculated by combining the two aforementioned interactions. A modification to Rumpf’s model has been proposed by Rabinovich et al. [22] to facilitate application to rough surfaces. According to that modification, surfaces are assumed to contain an equal number of hemispherical roughness caps and troughs in a close-packing arrangement. The asperity radius, which was originally used in Rumpf’s model and is difficult to measure, was subsequently correlated by Rabinovich et al. with the commonly measured RMS roughness value. The signed van der Waals force in this context is
G i = H i d 12 s i 2 [ 1 1 + d 2.97 σ i + 1 ( 1 + 1.485 σ i s i ) 2 ] ,   ( i = 1 ,   2 )
where si stands for the separation (nearest distance of approach) between the particle surface and the engaged asperity of either surface 1 or 2, σi is the RMS roughness of surface 1 or 2, and Hi is a representative Hamaker signed constant for the interaction between the particle and each of surfaces 1 and 2. If Gi < 0, the force is attractive; if Gi > 0, it is repulsive. The RMS roughness of the particle (σp) could readily be incorporated into this model by replacing σi in Equation (14) by the composite RMS roughness σ i 2 + σ p 2 . However, given the size difference between a typical micro-particle and surfaces 1 and 2, as well as the assumption of particle sphericity with only some minor nanoroughness as earlier posed, it is justifiable to consider that σ p σ i σ i 2 + σ p 2 σ i .
Given the presence of lubricant in the EHL contact, it is only natural to consider the interaction of the particle with each of surfaces 1 and 2 taking place across a medium phase, namely a very thin lubricating film. Accordingly, Hi is the combined, nonretarded Hamaker constant calculated by Equation (13.35) in Israelachvili [15]:
H i ( h i h f ) ( h p h f ) ,   ( i = 1 ,   2 )
where hi, hf, and hp stand for the nonretarded Hamaker constants of the contact counter-surfaces, the lubricant, and the particle, respectively. This “third-phase” approach is suitable for one of the two interactions incorporated into Rumpf’s model, namely the particle-surface interaction as earlier explained, for which Equation (15) is appropriate. The second interaction of Rumpf’s model, namely the particle-asperity interaction, operates at very intimate contact. In the latter case, it might be argued that for a particle-asperity separation of less than 1 nm, an intermediate lubricant film may be wiped out. For this scenario, the combined Hamaker constant is obtained by setting hf = 0 in Equation (15), yielding H i h i h p (i = 1, 2). However, Equation (15) with hf ≠ 0 is retained in the rest of this analysis, considering that there is always a liquid film separating the particle from the asperities of surfaces 1 and 2 in sliding motion, even if that is of a thickness on the order of 0.3 nm or even partially. According to the roughness values used later in the parametric analysis, particle-asperity interaction is the dominating interaction mode.
It is easily realised by Equation (15) that, if the Hamaker constant of the lubricant, hf, is intermediate to hi and hp, then Hi < 0 and, by Equation (14), Gi > 0 (repulsive). Such effects may be critical in particle entrapment, depending on the nature of the lubricant.
An alternative approach to that used by Rumpf and Rabinovich et al. (Equation (14)) is to ignore surface roughness and the flat (non-curved) surface assumption and use Montgomery et al.’s analytical result for the van der Waals interaction energy W between a sphere and an infinite cylinder [23]. Upon algebraic simplification, the result is
W = π H 16 { 1 d s + d D + s d d + s d d + D + s 2 d + 4 D d + 2 D + 4 s 2 ln [ s ( d + 2 D + 4 s ) 2 ( d + s ) ( D + s ) ] }
where H is the Hamaker constant, D is the diameter of the cylinder, and s is the separation between the sphere and the cylinder. The corresponding van der Waals force is G = d W / d s , resulting in
G = π H 16 [ d ( D + s ) 2 d ( d + D + s ) 2 d 3 [ s ( d + s ) ] 2 2   ( d + 2 D ) 2 + 16 d s ( D + s ) ( d + 2 D + 4 s ) 2 ]
The results by Equations (14) and (17) are later compared for varying particle diameter to examine their difference and the effect of roughness.

2.4. Mechanical Forces

Mechanical forces are exerted on the particle at contact points A and B (Figure 1), namely the normal forces ( N i + G i ) and the frictional forces T i such that ( N i + G i ) · T i = 0 (i = 1, 2). Figure 2 depicts the model proposed in the present study for the contact between a spherical particle and the roughness asperities of either surface 1 or 2. For consistency with the geometry of the intermolecular-force model of Section 2.3, surface roughness consists of hemispherical caps and troughs of equal radius r. At equilibrium or at the moment of particle pinching, it is assumed that the rigid particle rests in contact with two asperities as in Figure 2. By force balancing, the magnitude of normal force P at a particle-asperity contact is P = F p 2 cos ( ϑ ) = ( F p 2 ) 2 + T 2 ; from the last equation, the magnitude of force T (the horizontal component of P) is derived as
T = tan ( ϑ ) F p 2
From triangle ABC in Figure 2,
sin ( ϑ ) = 2 r r + d 2
Solving Equation (19) for ϑ and substituting into Equation (18) gives
T = 1 2 tan [ arcsin ( 4 2 + d r ) ] F p ,   ( d > 2 r )
For given asperity and particle sizes (r and d > 2r), Equation (20) is similar to a Coulomb-type friction law with friction coefficient
μ = 1 2 tan [ arcsin ( 4 2 + d r ) ] ,   ( d > 2 r )
For increasing particle diameter d, Equation (21) gives a diminishing value of μ. At the upper limit of particle size (d → ∞), the particle is effectively morphed into a flat smooth surface and it is rational to expect a coefficient of friction (say μ0) equal to that measured by pin-on-disc tests (e.g., about 0.2 for engineering steels). However, by Equation (21), lim d ( μ ) = 0 . Therefore, to asymptotically mate microscopic and macroscopic frictional effects, it is straightforward to propose a total coefficient of friction,
μ t = μ 0 + μ
that is valid for any particle size. In this context, μ by Equation (21) is realised as a “microscale” contribution to the total coefficient of friction. As for representative examples, consider the following cases for typical RMS roughness σ = 100 nm, resulting in asperity radius (per the Rabinovich et al. model [22]) r = 1.485 × σ = 148.5 nm: For d = 1, 10, and 100 μm, μ ≅ 0.258, 0.029, and 0.003, respectively.
It is furthermore possible to impose an upper limit to μt, say μmax (μmax > μ0), in avoidance of material plasticity effects. Correspondingly, this sets a lower limit to the particle diameter, that could be considered in the frame of this model, easily calculated by using Equation (21). Thus, and in conjunction with the obvious constraint d > 2r to exclude particles fully enclosed by two asperities (Figure 2), which are of no interest, the following constraint is obtained
d > 2 r max { 2 sin [ arctan [ 2 ( μ max μ 0 ) ] ] 1 , 1 } ,   ( μ max > μ 0 )
Suppose, for example, that μmax = 0.5, μ0 = 0.2, and σ = 100 nm, resulting in r = 1.485 × σ = 148.5 nm; inequality (23) then gives d > 0.9 μm.
The magnitude of the frictional force between a particle and either surface 1 or 2 can now be expressed as
T i = μ t ( i ) ( N i + G i ) ,   ( i = 1 ,   2 )
where, by Equations (21) and (22), the total friction coefficient is
μ t ( i ) = μ 0 ( i ) + 1 2 tan [ arcsin ( 4 2 + d r ι ) ] ,   ( i = 1 ,   2 ;   d > 2 r i )
The frictional forces by Equation (24) are proportional to the normal forces with a proportionality coefficient that is constant for given solid dimensions d and ri. Naturally, N1 and N2 being contact reaction forces on the particle should be directed as shown in Figure 1. Accordingly, N1 and N2 must be nonnegative.
The proposed friction model expressed by Equations (24) and (25) suits the given problem of the contact between a smooth micro-particle and a rough surface as in Figure 1. Similarly to a cobblestone-type friction modelling approach [24], the frictional force comprises a load-dependent component and an adhesive component. It is later shown that G i N i for particles larger than 3–5 μm. This means that for most micro-particles, the adhesive contribution to friction owed to van der Waals forces is so weak that it leaves the load-dependent contribution to dominate and Coulomb’s law of friction, that is, “friction force” = “constant coefficient of friction” × “normal force”, to hold true with satisfactory approximation. There is strong theoretical and experimental evidence in the literature that such a relationship is valid down to the molecular level [24,25,26] and is shown via large-scale molecular dynamics simulations [25]. Some studies have shown a sublinear relation between frictional force and contact load for adhesive contacts, as summarised by Mo et al. [25]. Evidently, this is caused by the van der Waals contribution to friction. Equation (24) of the present article is effectively a simple manifestation of such a sublinear relation, for in all of the examples presented later, G i < 0 (attraction), therefore, μ t ( i ) ( N i + G i ) < μ t ( i ) N i .

2.5. Force Balance

The forces acting on the particle at the pinch point according to Figure 1 are as follows: The mechanical, normal, contact reaction forces N1 and N2, the frictional forces T1 and T2, the total fluid force F with components Fx and Fz, and the van der Waals forces G1 and G2. Force balancing in axes Ox and Oz yields the following linear system of equations:
{ i = 1 2 [ m i T i cos ( a i ) ( N i + G i ) sin ( a i ) ] + F x = 0 i = 1 2 ( 1 ) i [ m i T i sin ( a i ) + ( N i + G i ) cos ( a i ) ] + F z = 0 }
where m i = 1 when u i = 0 (|u1|+|u2| ≠ 0); otherwise m i = 1 (i = 1, 2). Coefficients mi cover the special case of one of the contact counterfaces being stationary and the direction of the corresponding friction force Ti being opposite to that shown in Figure 1. Although what happens after the pinch point is of no concern in this study, it is worth noting that, if a particle passes the pinch point, then if u1 > u2 ≠ 0, T2 may be reversed (be opposite to that of Figure 1); similarly, if u2 > u1 ≠ 0, T1 may be reversed. Any of the last two cases will cause new resistance in particle entrapment and it would then be a matter of surface deformation to seal the particle and EHL contact’s fate in terms of potential damage, e.g., scoring.
Upon substituting Ti by Equation (24), the system of Equation (26) has the following solution:
{ N 1 = 1 q { [ b 2 cos ( a 2 ) sin ( a 2 ) ] F z [ cos ( a 2 ) + b 2 sin ( a 2 ) ] F x } G 1 N 2 = 1 q { [ sin ( a 1 ) b 1 cos ( a 1 ) ] F z [ cos ( a 1 ) + b 1 sin ( a 1 ) ] F x } G 2 }
where b i = m i μ t ( i ) and q is the determinant of the system,
q = ( b 1 b 2 1 ) sin ( a 1 + a 2 ) + ( b 1 + b 2 ) cos ( a 1 + a 2 )

2.6. Entrapment Criterion

In accordance with Nikas [4,14], the maximum particle diameter for entrapment, dmax > hc, is the critical diameter such that, for ddmax, both N1 and N2 are computed positive, whereas for d > dmax, at least one of N1 and N2 is computed negative, meaning that at least one of micro-contacts A and B in Figure 1 expires. Mathematically, this can be expressed as follows:
d max = { d 0 > h c :   min i = 1 , 2 d < d 0 { N i } > 0   and   min i = 1 , 2 d > d 0 { N i } < 0 }
Numerically, computing dmax is achieved by checking the sign of N1 and N2 (Equation (27)) for d > hc, where the coordinate xp of the particle’s centre is increased in small steps Δxp (for example, Δxp = 1 μm) until at least one of N1 and N2 is found negative in two consecutive steps.

3. Application and Parametric Analysis

The mathematical analysis previously outlined is applied here for a broad range of operating conditions met in engineering applications involving EHL contacts such as those of spur-gear straight teeth and camshaft lobes on tappets. Such contacts are mainly rolling-sliding and the contacting elements are made of hard, heat-treated materials such as engineering steel with a high-quality surface finish. The particles considered here are also metallic. The mechanical properties of the materials involved are accordingly selected. The contact surfaces 1 and 2 in all examples belong to solid rollers. Table 1 lists the nominal values of the input data for the examples that follow.
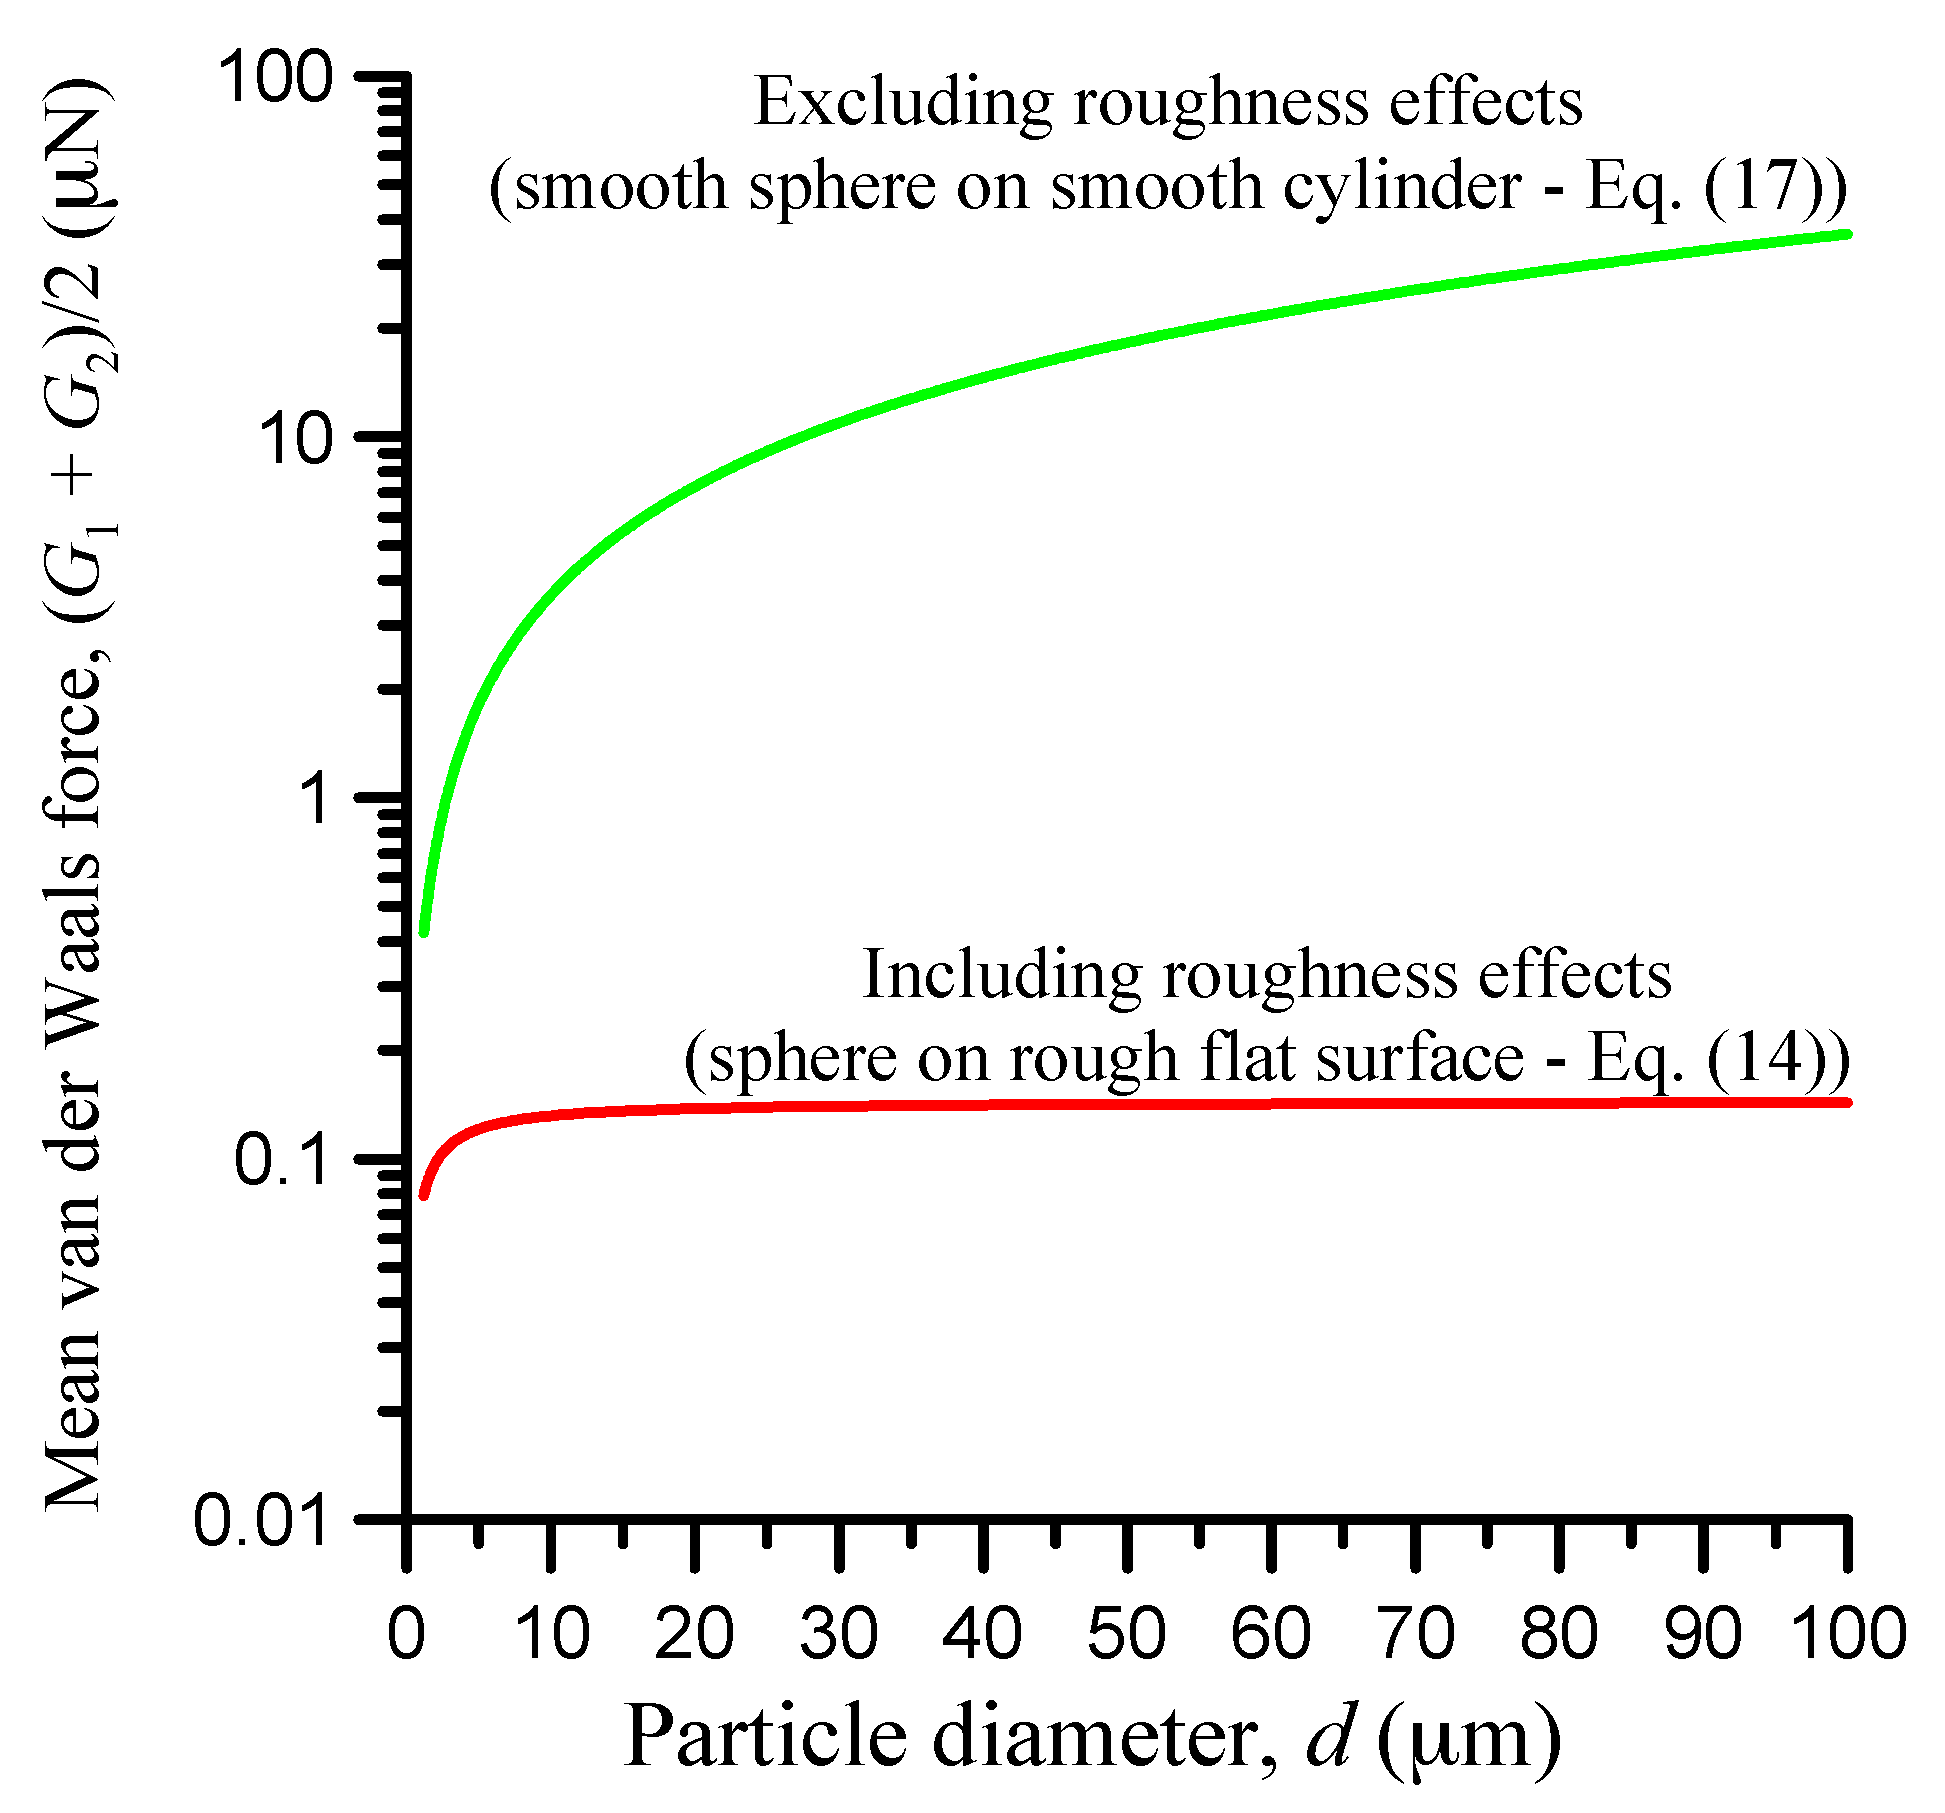
Before presenting the results of the parametric analysis, it is instructive to check the difference in the van der Waals force estimation between the rough-surface approach (micro-particle in contact with two nominally flat and rough surfaces—Equation (14)) and the ideally smooth-surface approach (micro-particle in contact with two ideally smooth cylinders—Equation (17)). Using the input data of Table 1, Figure 3 shows the comparison of the mean van der Waals force ( G 1 + G 2 ) / 2 , using a logarithmic force axis for clarity. It is seen that the particle-on-smooth-cylinder approach yields a mean van der Waals force exceeding that of the particle-on-rough-surface approach by more than 5 times for the smallest particles (1 μm ≤ d < 2 μm) and substantially more for larger particles. It is important to notice that, when roughness is ignored, the van der Waals force increases exponentially with particle size, but when roughness is accounted for, the van der Waals force rises slowly and nearly stabilises for particles greater than about 100 μm. This shows that surface roughness, even in the nanoscale as in this example, plays a major role in adhesion and should not be ignored. Therefore, in the remaining results of this study, the van der Waals force calculated by Equation (14) has been used, that is, with roughness effects.
Moving on to the parametric study, the effect of the particle diameter d on the mean van der Waals force, ( G 1 + G 2 ) / 2 , divided by the mean contact reaction force, ( N 1 + N 2 ) / 2 , is examined for various parameters as is later demonstrated. Thus, the focus in the remainder of this study is on the following dimensionless variable:
g ( G 1 + G 2 ) / 2 ( N 1 + N 2 ) / 2 = G 1 + G 2 N 1 + N 2
For brevity, g is henceforth referred to as the normalised van der Waals force.
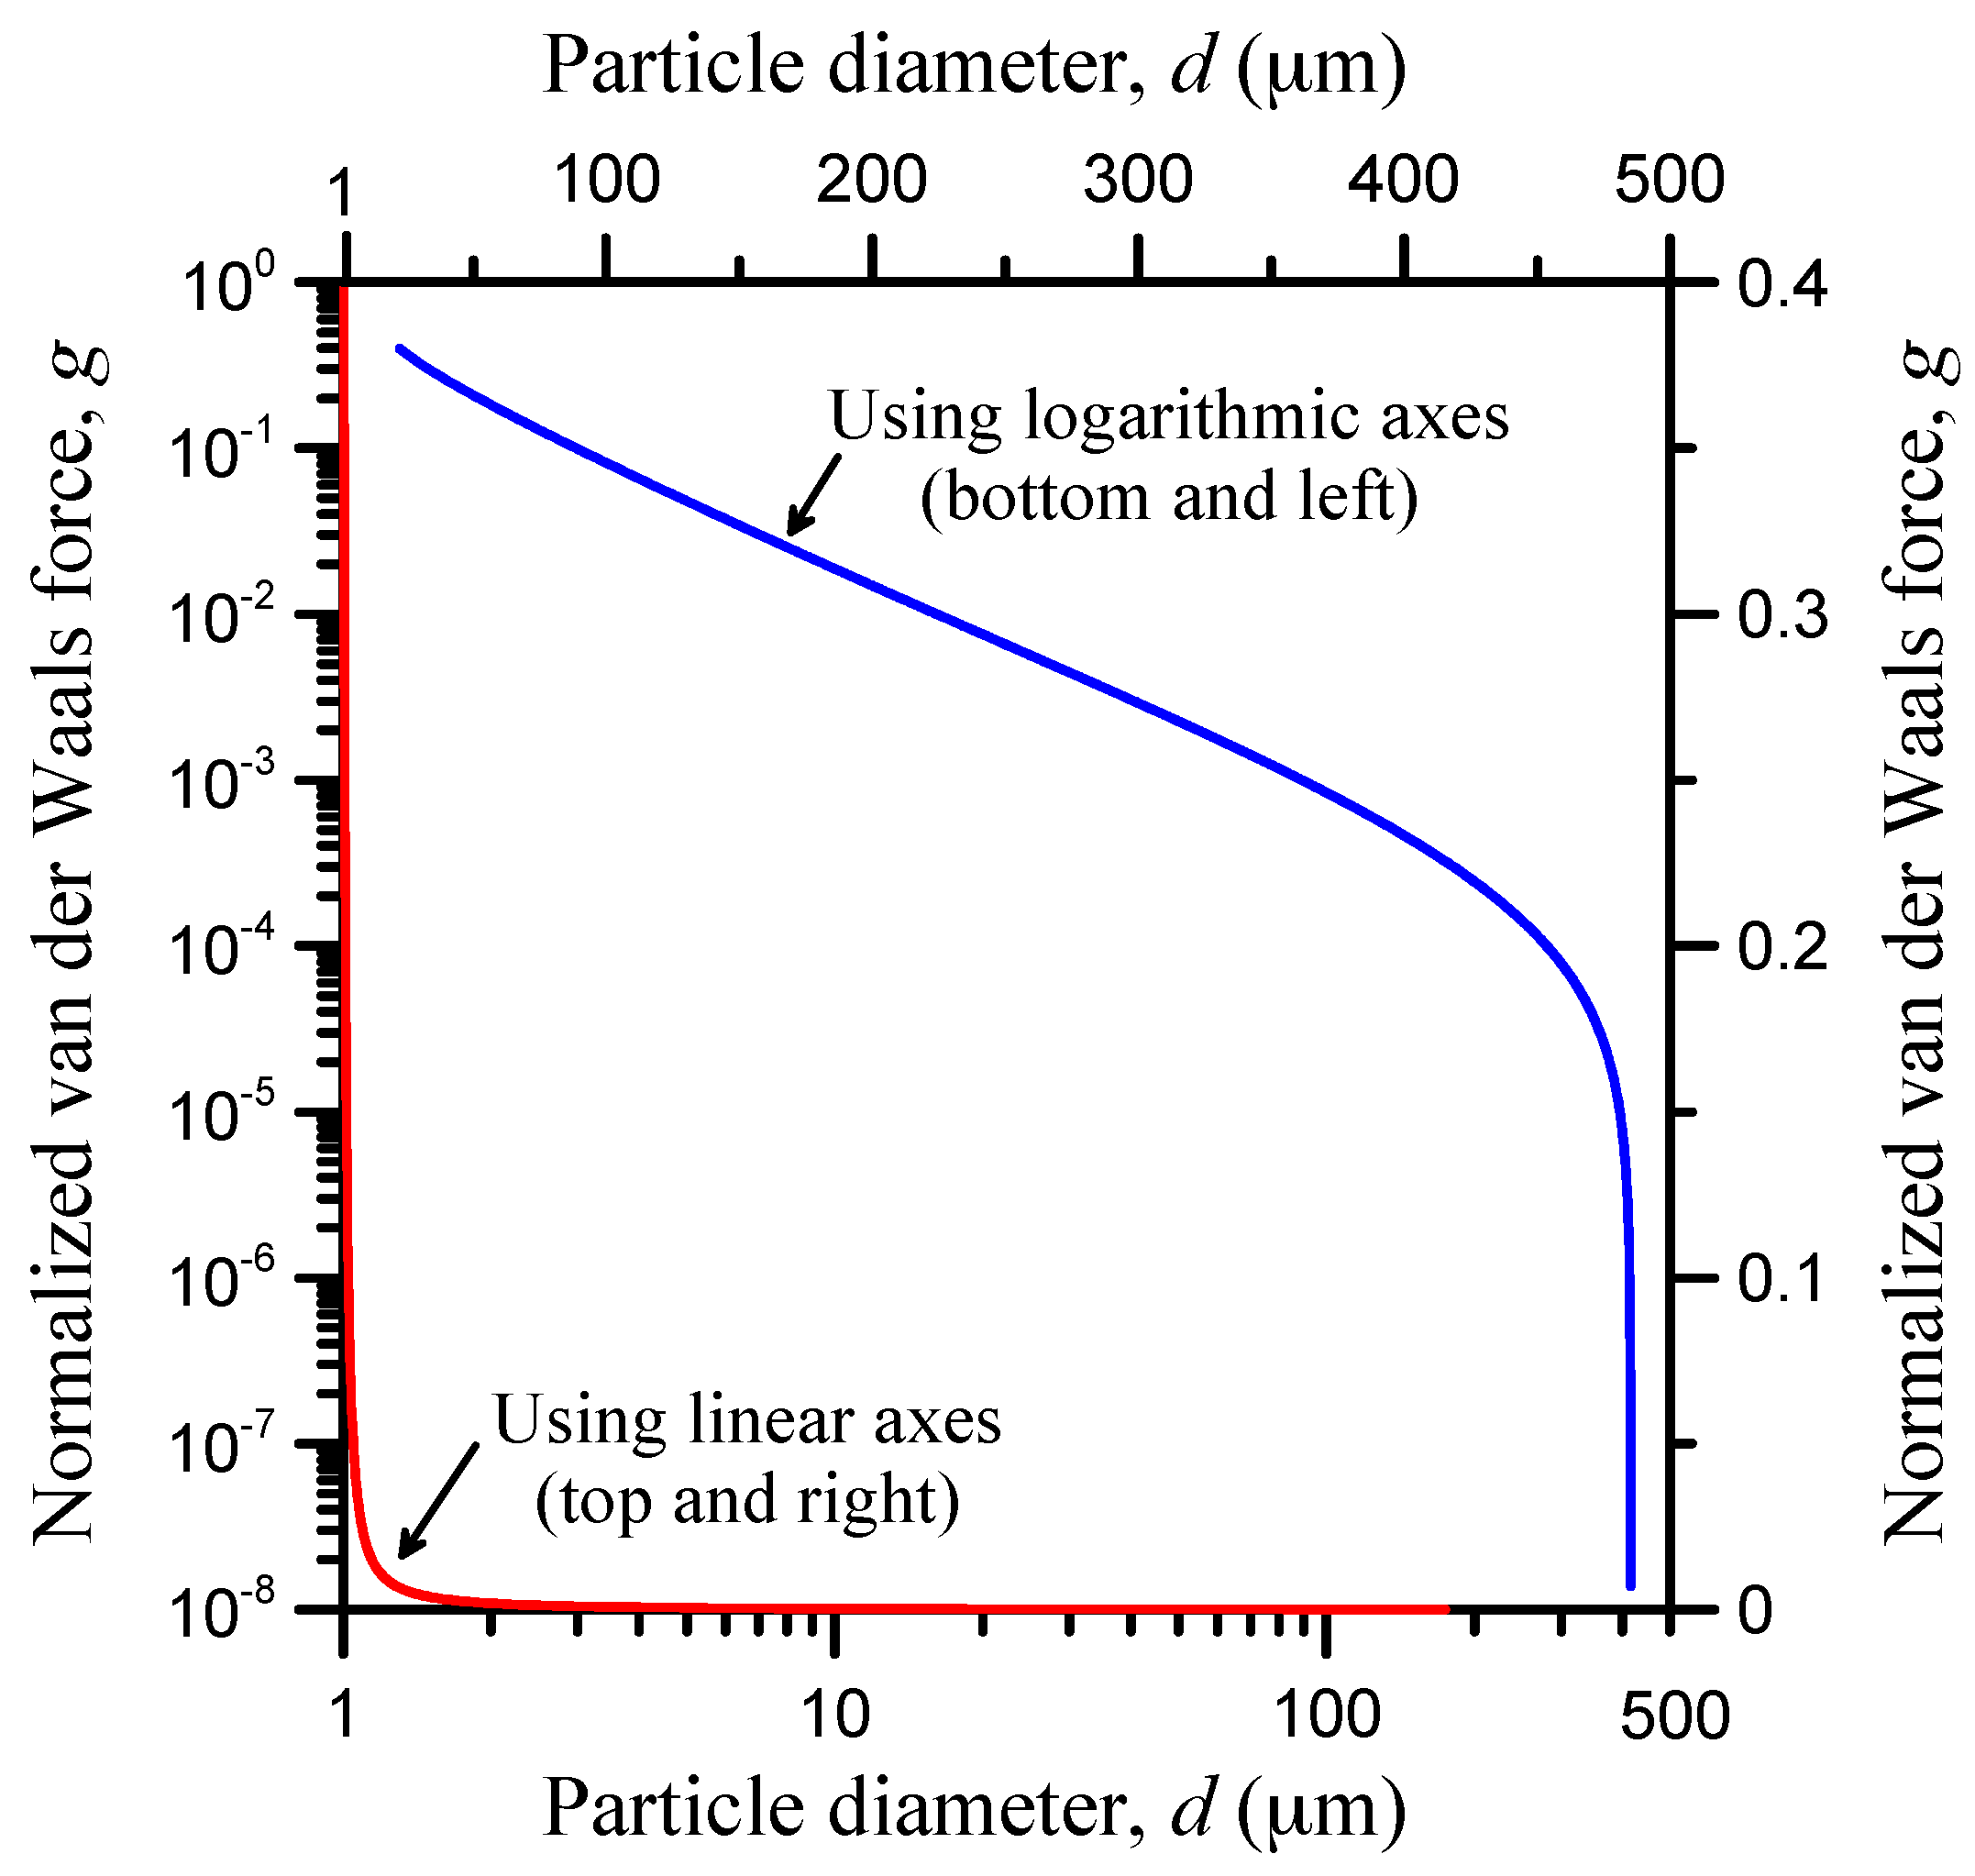
In all of the dg diagrams, it is imperative to use logarithmic axes for clarity and distinguishability of the plotted curves. However, this effective data (logarithmic) filtering hinders a physical or qualitative interpretation. To circumvent this and assist the reader, Figure 4 shows a typical example of the correlation between a curve plotted on logarithmic axes (similar to the results shown later), as well as on linear axes. It is obvious that, by using logarithmic axes, not only are the extrema of the curve immediately visible in contrast to the linear-axis diagram, but the variation in g and its abrupt drop by several orders of magnitude are also immediately traceable.
Keeping the vision of Figure 4 in mind, it is now appropriate to proceed with the parametric analysis. For comparison, the fluid force contribution is plotted alongside the normalised van der Waals force g in all remaining diagrams. Just like g, the normalised fluid force f is defined by the ratio of the fluid force on the particle over the mean reaction force:
f 2 F x 2 + F z 2 N 1 + N 2
The role of the fluid force in particle entrapment has been analysed in earlier publications of the author [4,14] and, therefore, will not be further discussed here—only visually demonstrated in the figures.

3.1. Contact-Load Effect

Increasing the load per unit length of the contact, L, increases the width 2b of the contact (Equation (3)) and the normal elastic displacements (Equations (1) and (2)), and slightly decreases the central film thickness hc (Equation (A1)). Therefore, changing L changes the EHL contact geometry and, consequently, affects the force balance on the particle. Figure 5 demonstrates this effect for L = 10, 100, and 1000 N/mm. It is seen that the van der Waals force is nearly one order of magnitude weaker than the contact reaction force (g ≅ 10–1) for a 3 μm particle and is substantially weaker for larger particles, up to 8 orders of magnitude (g ≅ 10–8) when d = dmax. The drop is very steep for particles greater than about 100 μm. On the other side, particles smaller than 3 μm are significantly affected by both the van der Waals and the fluid forces; that is, g and f both approach unity.
It is clear that the contact load makes a perceptible difference only for the smallest of particles, with lightly loaded contacts affected the most. In regards to the maximum particle diameter for entrapment, dmax, it is realised that by increasing L by two orders of magnitude from 10 to 1000 N/mm, dmax decreases by up to about 3%. It is, therefore, concluded that the contact load has a weak effect on particle entrapment and the van der Waals force contribution is significant only for the smallest of particles (d < 3 μm).

3.2. Contact-Width Effect

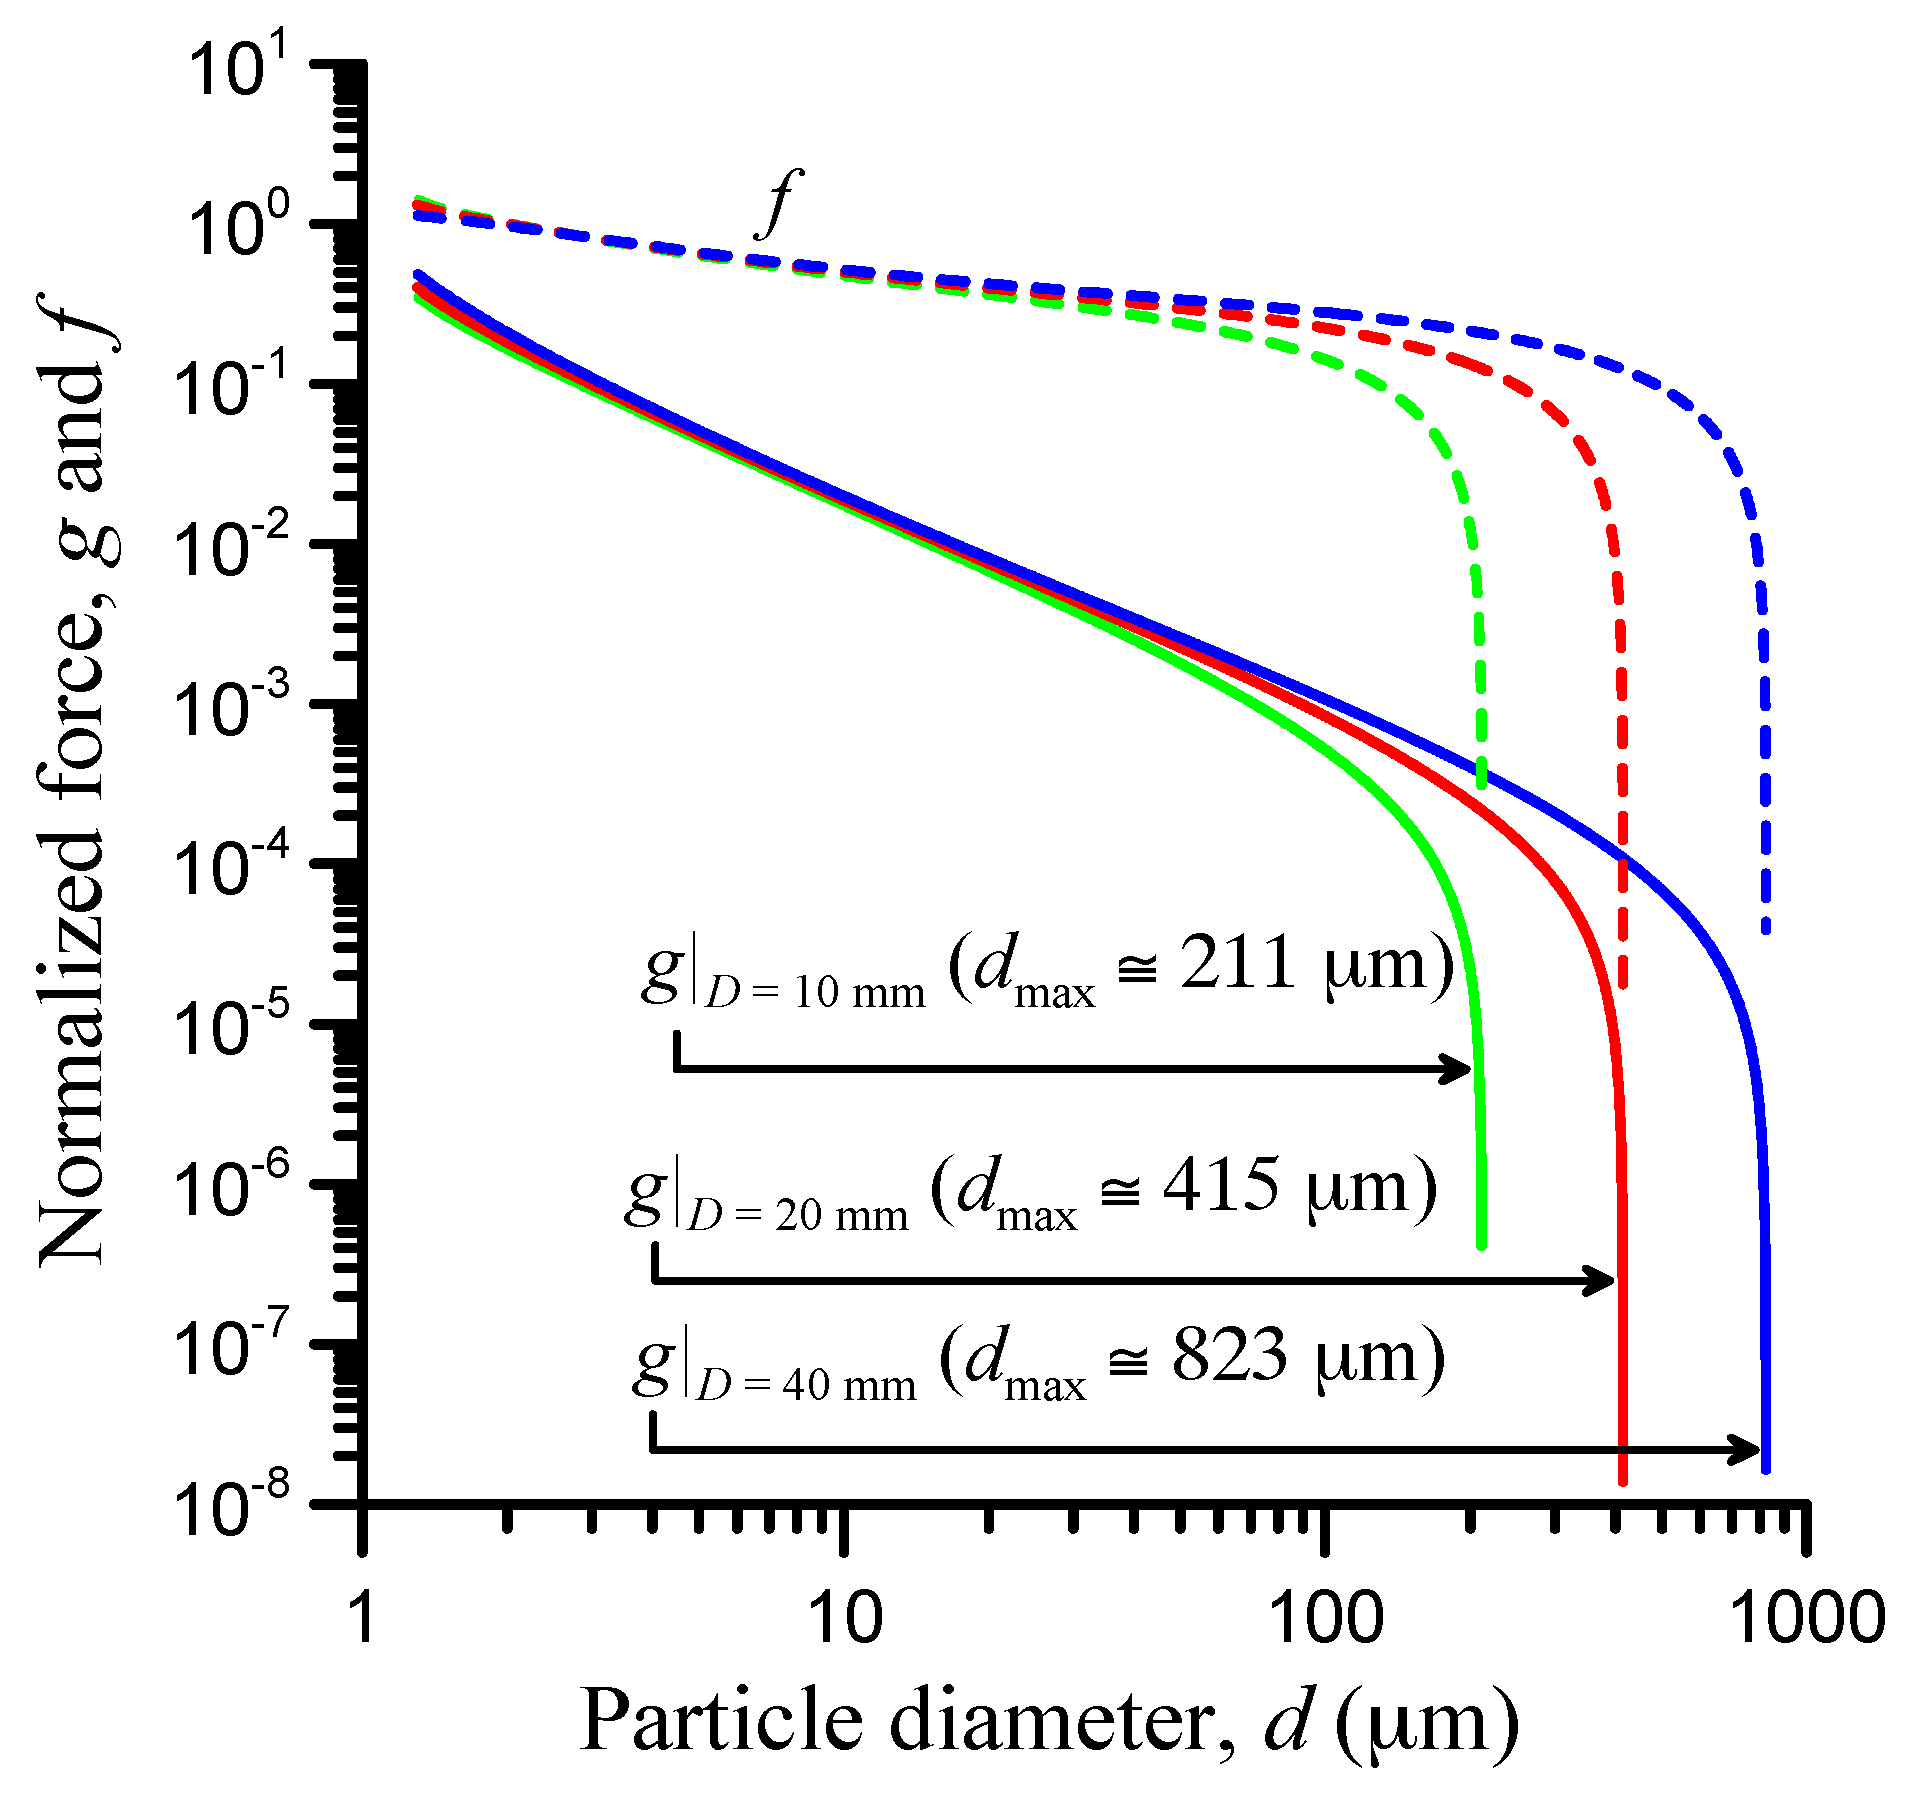
The effect of the width of the EHL contact is directly tested by changing the diameter D of the rollers. This has a significant effect on the width 2b of the contact (Equation (3)—setting R1 = R2 = D/2) and, subsequently, on the elastic displacements as well (Equation (1)) because of the change in b. Figure 6 explores this effect for D = 10, 20, and 40 mm. The van der Waals force is again found to be nearly one order of magnitude weaker than the contact reaction force (g ≅ 10–1) for a 3 μm particle and substantially weaker for larger particles, up to about 8 orders of magnitude (g ≅ 10–8) when d = dmax. It is clear that the normalised van der Waals force g has the same trend, irrespectively of the roller diameter. For very small particles (d < 3 μm), g is slightly higher for greater roller diameter. This can be attributed to the reduction in contact angles a1 and a2 with the decreasing surface curvature (Figure 1) and its effect on forces N1 and N2 (the formulation of g in Equation (14) is for nominally flat surfaces and thus excludes curvature effects). For larger particles, g is exponentially weakened and steeply drops by several orders of magnitude as the maximum particle diameter for entrapment, dmax, is approached, having no effective contribution in the process. Naturally, there is a significant effect of the contact size via the roller diameter D on dmax as is obvious in Figure 6. In summary, the van der Waals force contribution is negligible, except for very small particles (d < 3 μm), where it has a noticeable effect that is stronger for smaller particle sizes.

3.3. Elastic-Modulus Effect

The elastic modulus of contact surfaces 1 and 2 affects the contact width (Equation (3)), the elastic displacements (Equation (1)), and the central film thickness (Equation (A1)). Specifically, increasing the elastic modulus decreases the contact width, the elastic displacements, and the central film thickness ( h c ~ E e 0.056 ). However, such changes are relatively small, particularly in regards to the central film thickness, even for large changes in elastic modulus.
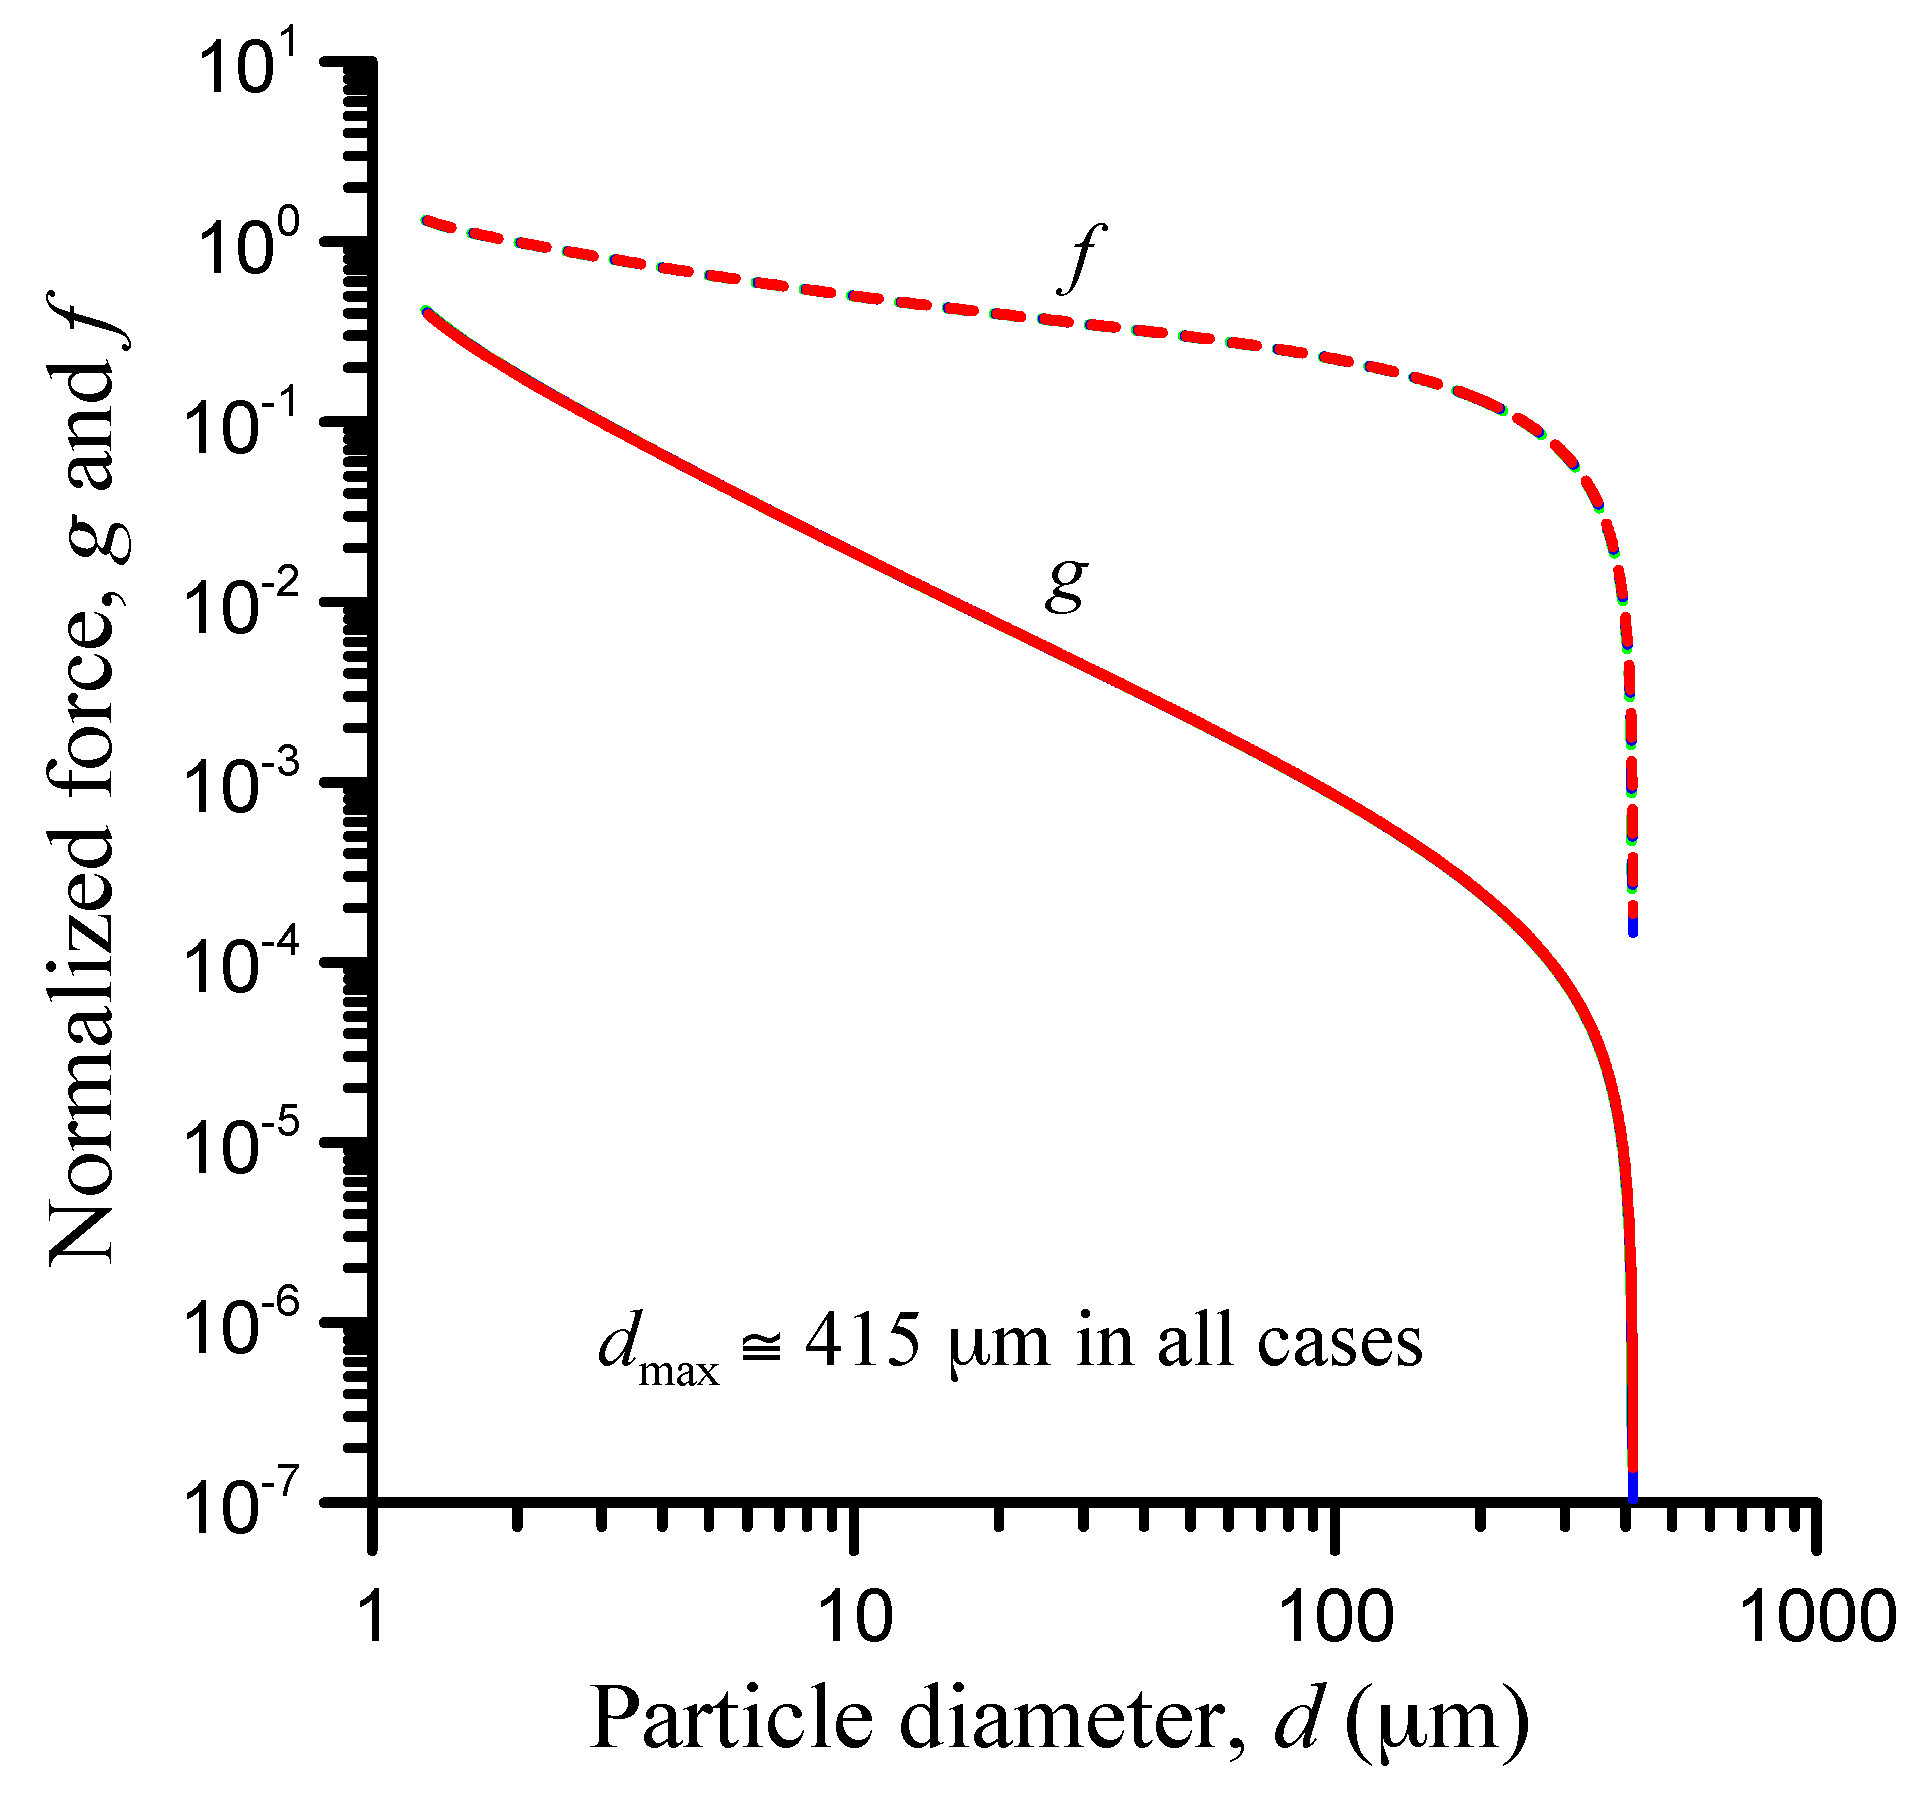
The effect of the elastic modulus E of surfaces 1 and 2, assuming that E1 = E2 = E, is depicted in Figure 7 for E = 100, 150, and 200 GPa. This is a wide variation, covering most engineering materials from brass and titanium to bearing steel. Despite this broad range of modulus variation, Figure 7 shows that the effect of the elastic modulus on the normalised van der Waals force is negligible throughout the particle size range. The effect of E on the maximum particle diameter for entrapment is also negligible. Therefore, for most metals used in engineering applications, it is concluded that the magnitude of their elastic modulus per se is not influential in the process of particle entrapment. This conclusion exclusively concerns the momentary incident of particle pinching and not the subsequent deformation of the solids involved in the process [27] in the case the particle is indeed trapped.

3.4. Speed Effect

The speed of the contact is governed by the tangential velocities u1 and u2 (Figure 1). Speed has no effect on the deformation of surfaces 1 and 2 in the inlet zone, as is realised by Equations (1) to (3), and no effect on the net van der Waals forces (Equation (14)). However, it has a strong effect on the fluid forces (Equations (8) and (9)), as well as on the central film thickness (Equation (A1)).
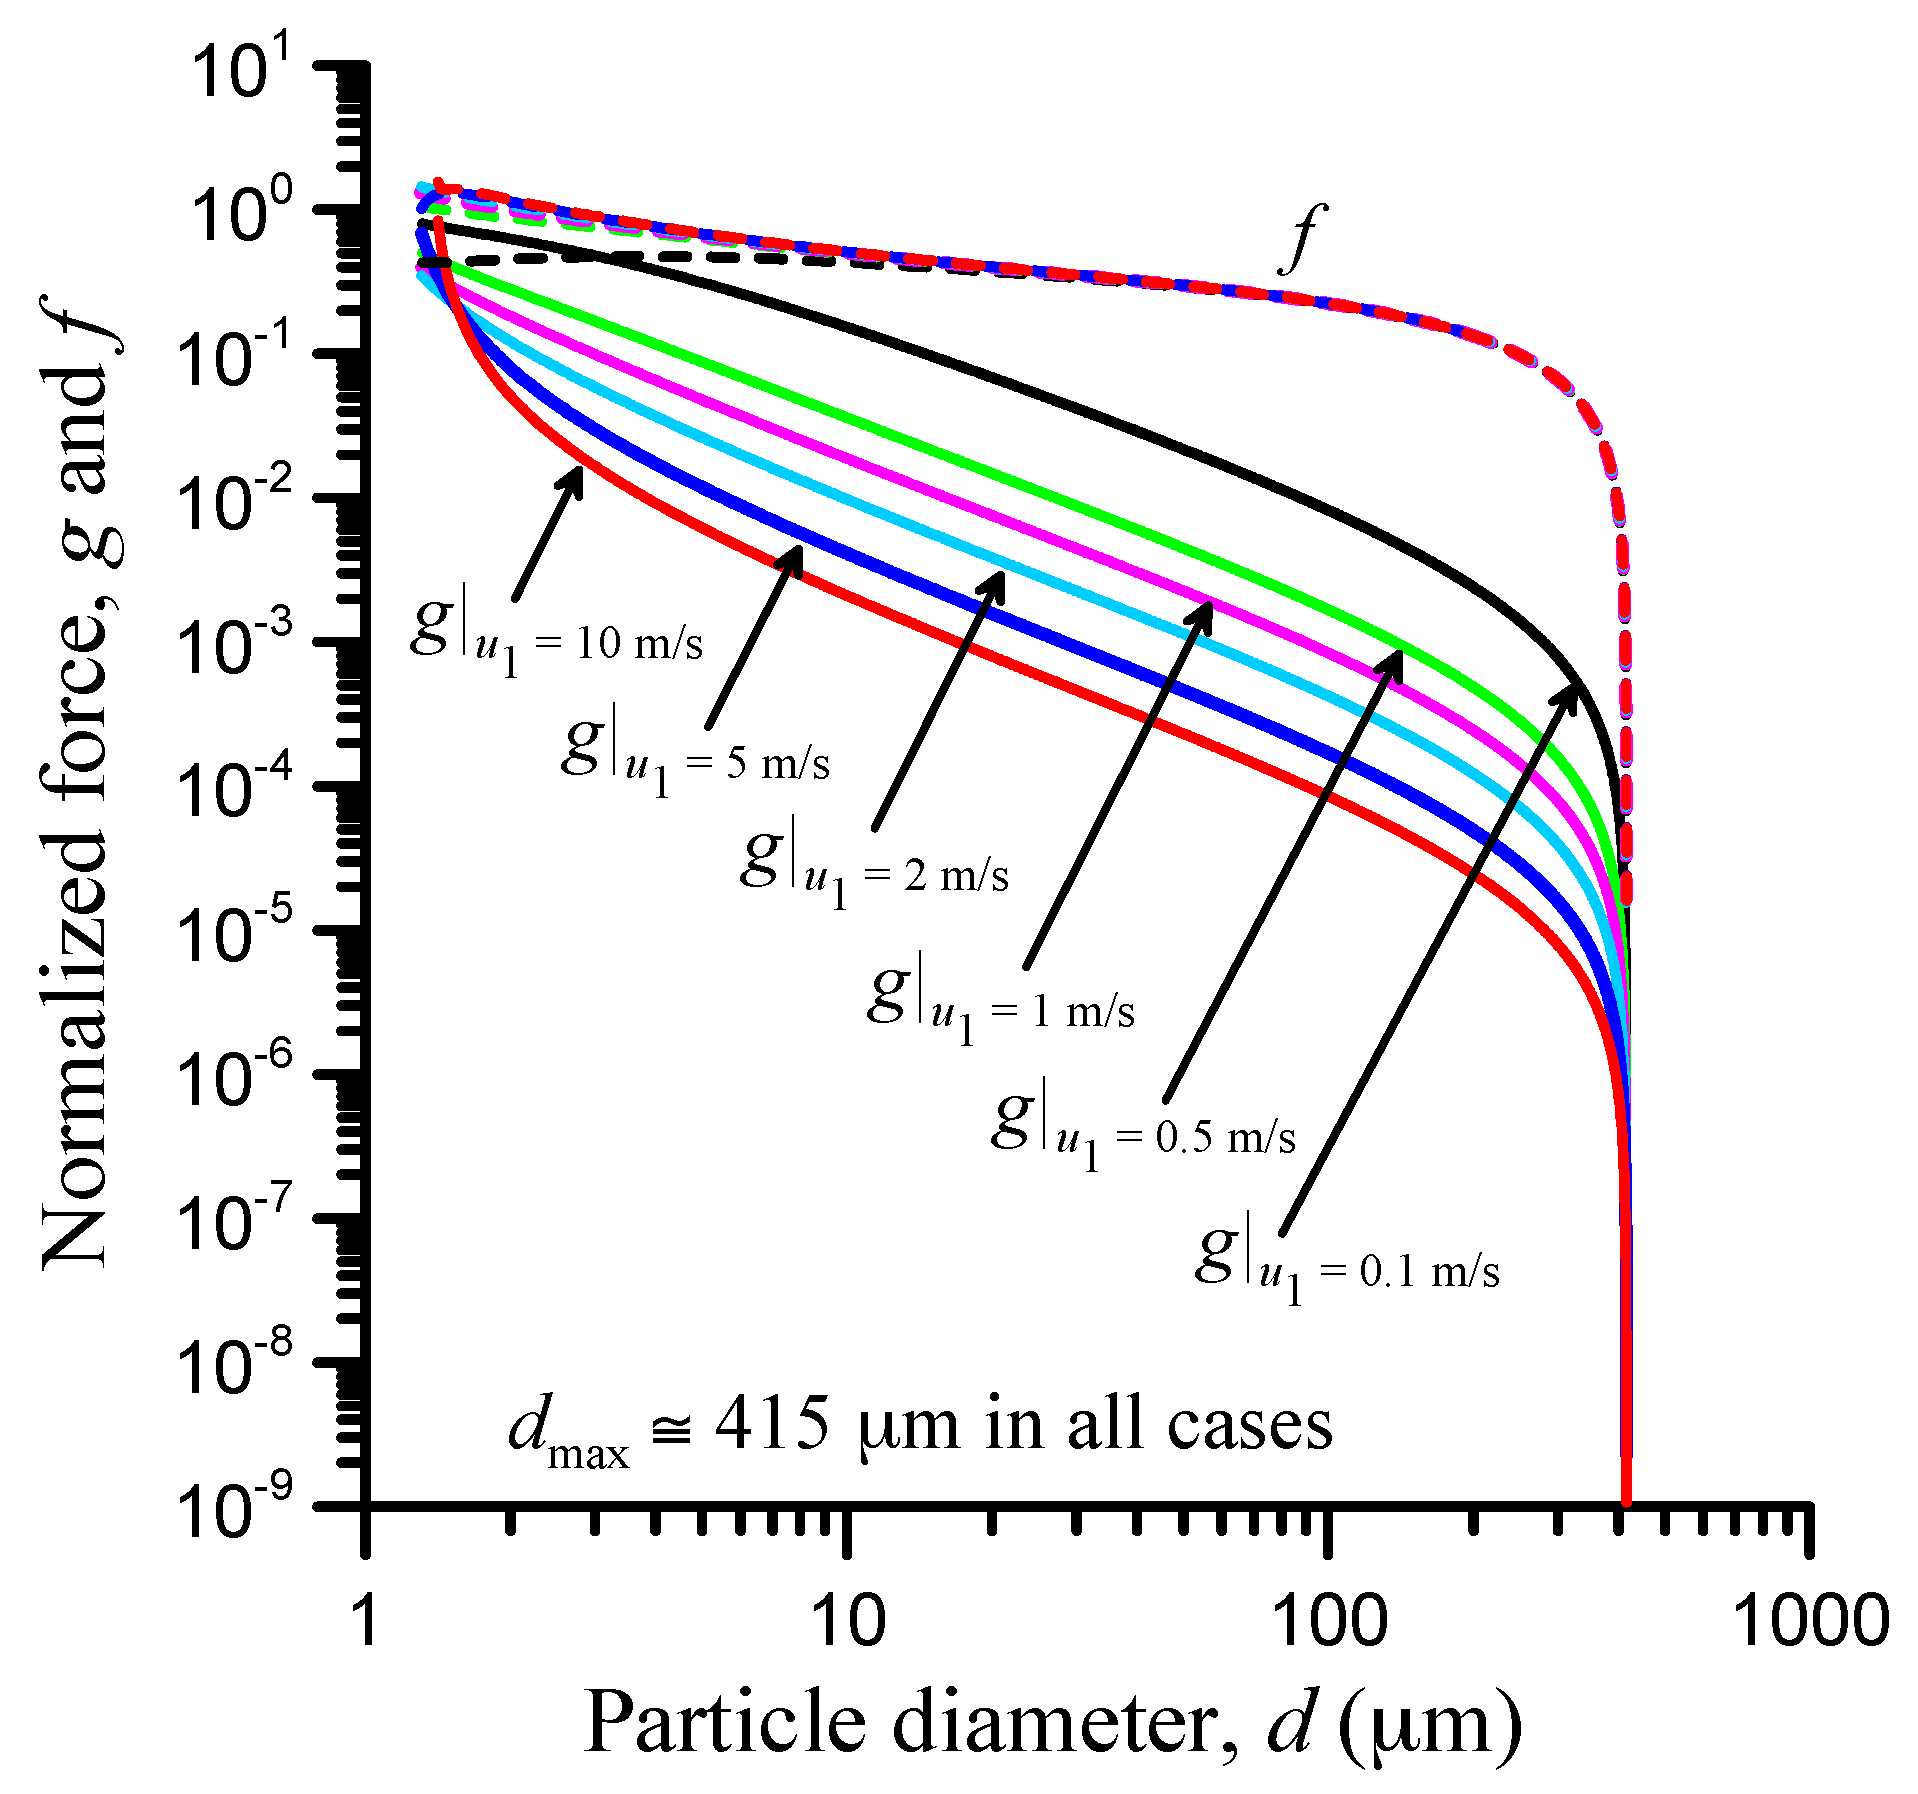
To study the effect of speed, surface 2 is kept at constant speed and almost stationary (u2 = 0.001 m/s) whilst surface 1 is allowed to move with speed u1 = 0.1, 0.5, 1, 2, 5, and 10 m/s, which is a very broad range for engineering applications. The results are presented in Figure 8 where it is clear that the effect of speed on the normalised van der Waals force is significant, particularly in the low- (u1 < 0.5 m/s) and high-speed range (u1 > 2 m/s). For example, for a 10 μm particle, g(u1 = 0.1 m/s) ≅ 4.2g(u1 = 0.5 m/s) and g(u1 = 2 m/s) ≅ 4.6g(u1 = 10 m/s). This trend of reduction of g with increasing speed u1 for a given particle diameter ceases near the maximum particle diameter dmax. In fact, dmax shows negligible variation with speed and is found approximately equal to 415 μm in all the presented speed cases.
What is also striking in Figure 8 is the change of trend of the g-curves at high speed (u1 > 2 m/s) and very small particle diameter (d < 3 μm). This is very obvious for the speed cases of 5 and 10 m/s. Given that speed does not affect the net van der Waals force as already stated, the change of trend of the g-curve is solely attributable to the change in the reaction force N (Equation (30)) and, in particular, to the effect of the fluid force components Fx and Fz on N (Equation (27)). Recall that both fluid force components are strongly affected by speed; moreover, both tend to zero for small particles and their relative influence on N becomes critical, which can be realised by inspecting Equation (27).
Finally, as with other parameters previously studied, g is found greatest for the smallest of particles, specifically for d < 5 μm. Therefore, the influence of the van der Waals force is strongest for the smallest particles and indeed strong at the extrema of the speed spectrum, that is, for u1 ≤ 0.1 m/s and for 2 < u1 ≤ 10 m/s. It should be noted here that the increase in speed results in frictional heating of the lubricant, which has been accounted for in the calculation of the central film thickness via the thermal correction factor (Equations (A1) and (A4)). Some shear heating in the inlet zone of the EHL contact as a result of increasing speed u1 is inevitable and will decrease the value of the local dynamic viscosity of the lubricant, with direct consequences on the fluid force components (Equations (8) and (9)), particularly for very small particles close to the Hertzian zone. This effect is not accounted for in the results of Figure 8. While there is almost no thermal correction applied to the central film thickness when u1 = 0.1 m/s (thermal correction factor ct ≅ 0.996—refer to Equation (A4)), there is major thermal correction when u1 = 10 m/s (ct ≅ 0.476).

3.5. Viscosity Effect

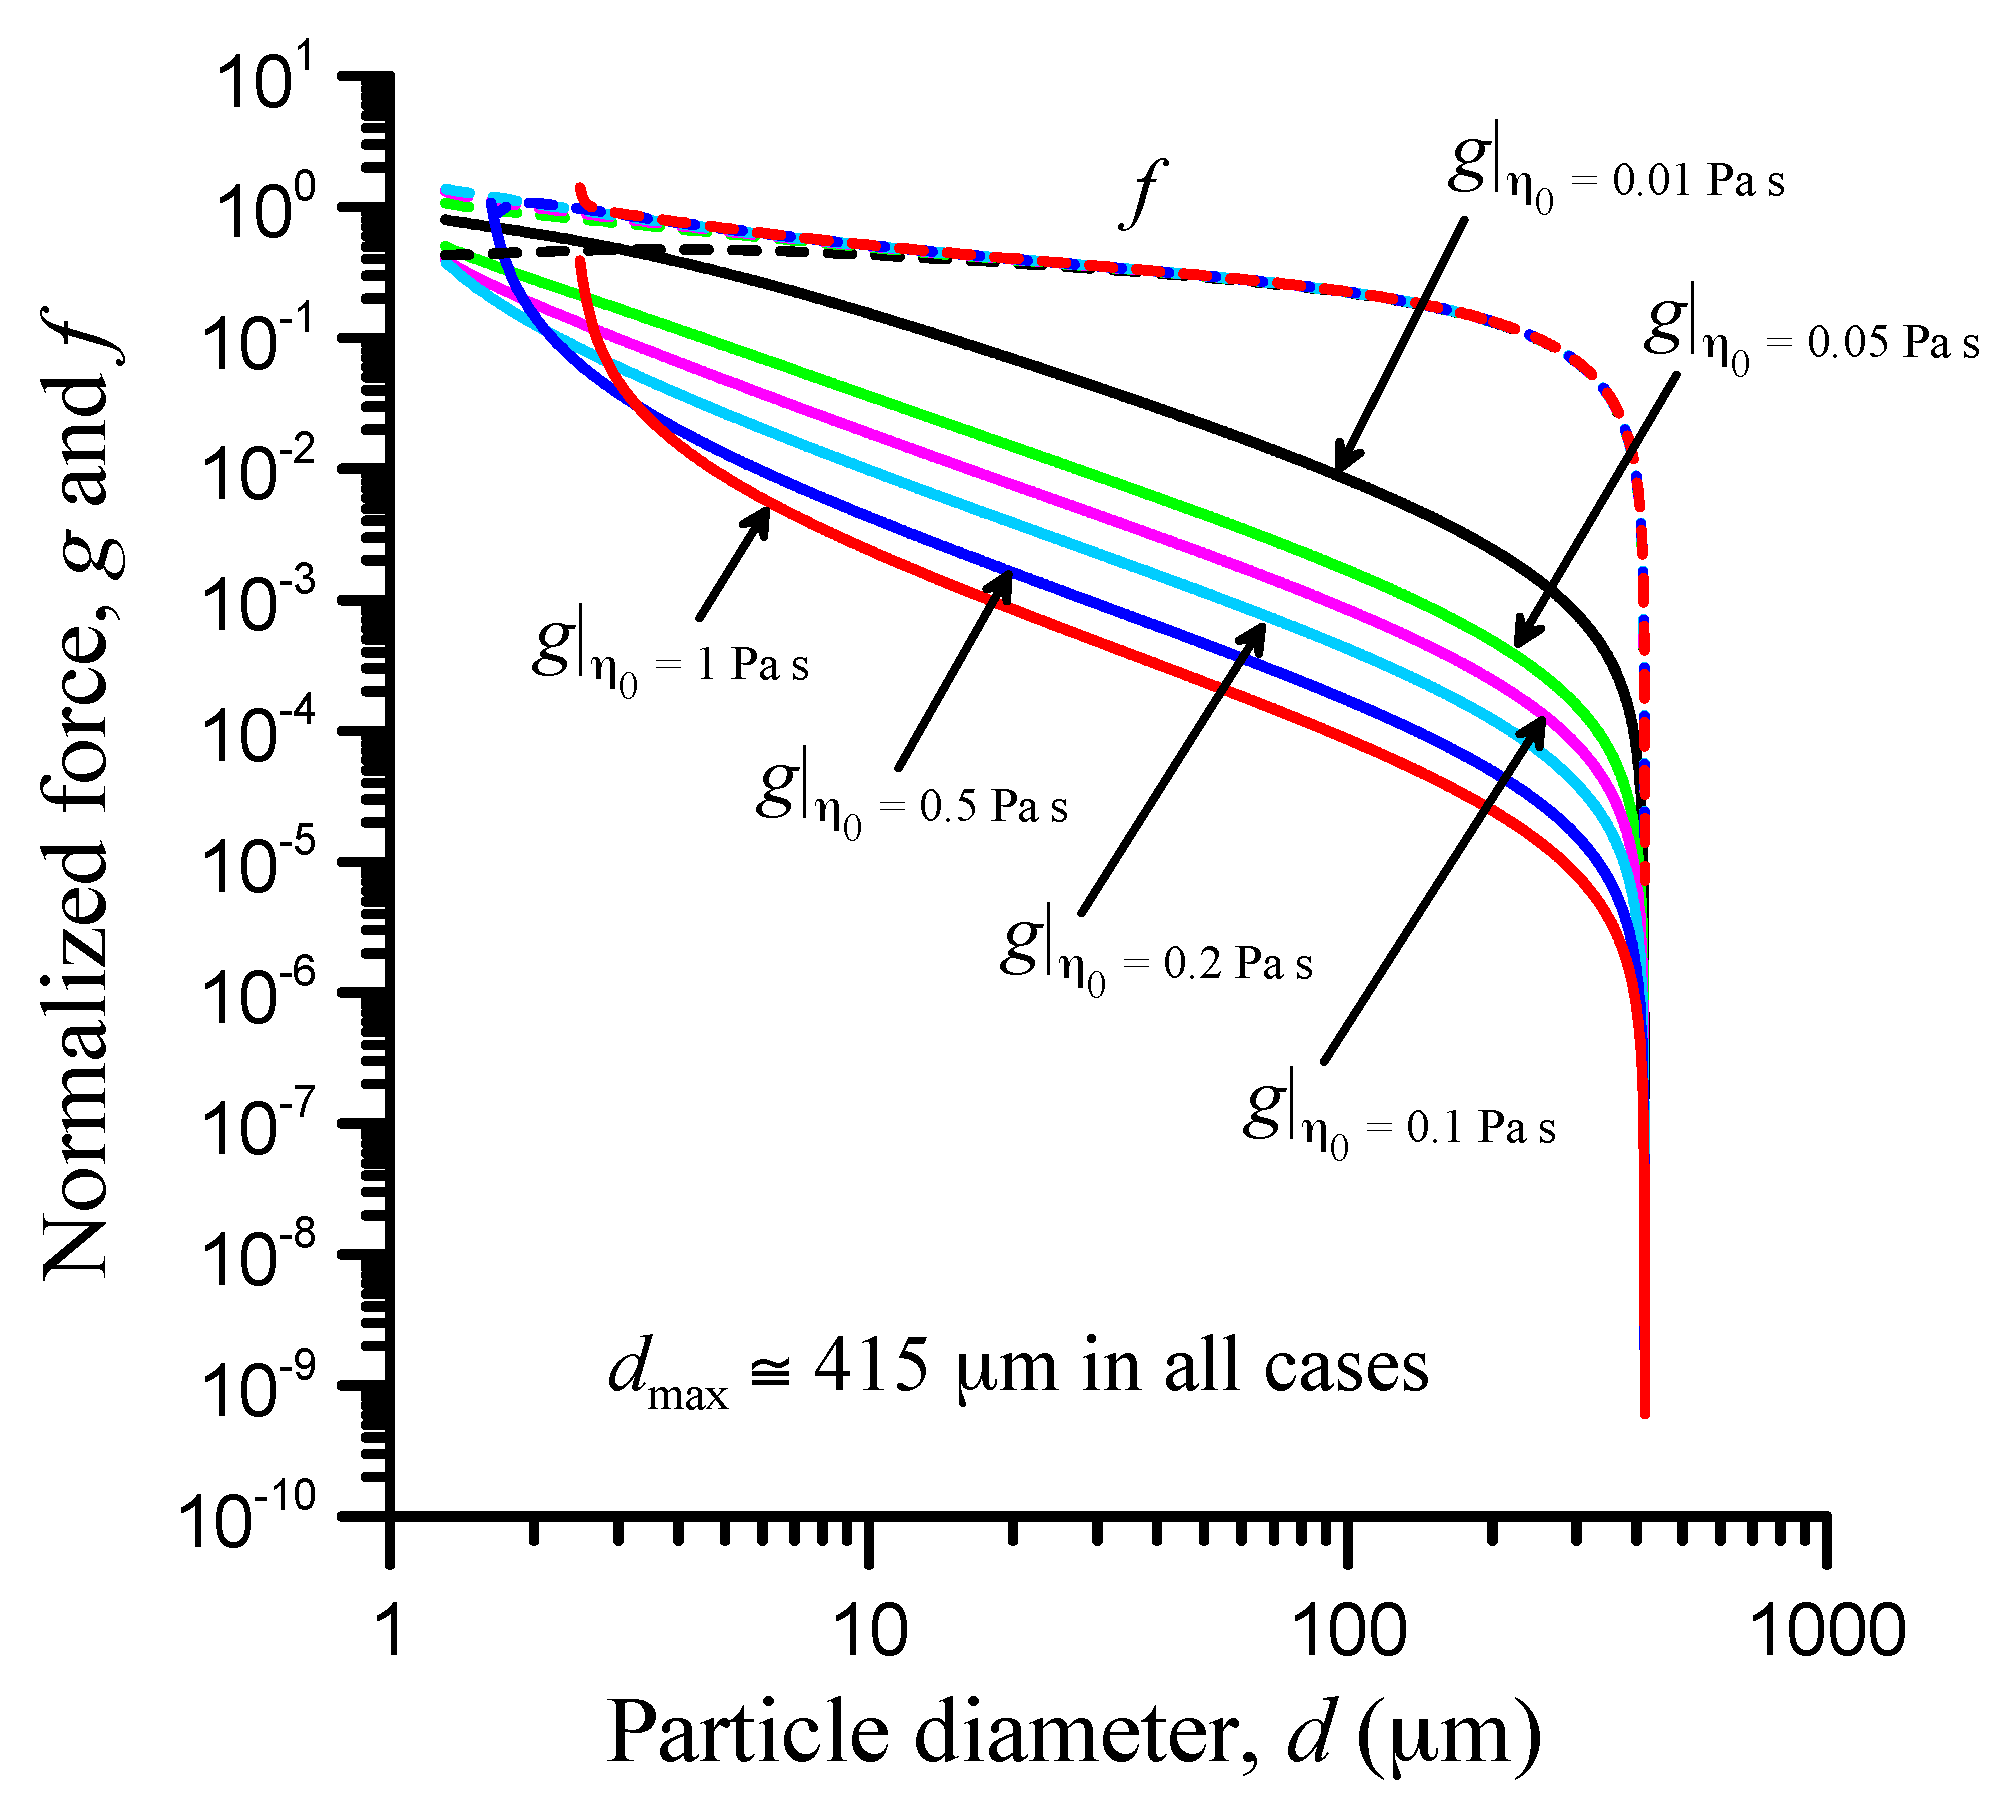
The dynamic viscosity of the lubricant at operating temperature and atmospheric pressure, η0, significantly affects the central film thickness (Equation (A1)) and the fluid force on a particle (Equations (8) and (9)). Specifically, increasing η0 nonlinearly increases the central film thickness and linearly increases both fluid force components, affecting reaction forces N1 and N2 in the process. Naturally, there is no effect of viscosity on the net van der Waals force (Equation (14)), but the normalised van der Waals force g is nonlinearly affected through the changing reaction forces N1 and N2 (Equation (27)).
The viscosity effect is examined by varying the dynamic viscosity η0, as shown in Table 2 (η0 refers to the operating temperature of 23 °C per Table 1). The mass density is considered unrelated in this process and is kept constant to concentrate on viscosity. The kinematic viscosity, which is the ratio of dynamic viscosity and mass density, is accordingly varied. Thus, the kinematic viscosities at 40 and 100 °C, varied in accordance with η0, are also given in Table 2. The results of the viscosity effect are presented in Figure 9.
It is realised that the trend observed in the speed effect (Figure 8) is replicated. Whilst there is negligible effect on the maximum particle diameter for entrapment, dmax, there is a strong effect on the normalised van der Waals force g. This clearly stems from the effect of viscosity on reaction forces N1 and N2 via the fluid force components.
According to Figure 9, the influence of the net van der Waals force is strongest for particles smaller than about 3 to 20 μm, depending on η0. For η0 ≥ 0.1 Pa s, the trend changes and the influence of the net van der Waals force becomes much stronger on smaller particles for more viscous lubricant. It should be noticed that for η0 = 0.5 Pa s and for a 2 μm particle, g > 1, which means that the mean van der Waals force on the particle exceeds the mean contact reaction force (Equation (30)) and has a dominant effect on the particle’s behaviour.

3.6. Friction-Coefficient Effect

According to the results of the experimentally verified, viscoplastic particle contact model of the author [27], the dynamic coefficient of friction at the instant of particle pinching is equal to the kinetic (lubricated) friction coefficient. By kinetic friction coefficient, we refer to that involving the lubricated contact of the particle with either surface 1 or 2. For example, if the particle is made of material “MP” and surfaces 1 and 2 are made of material “M12” (say), then by the kinetic friction coefficient, we refer to that holding for the lightly lubricated contact of two flat specimens, one made of material MP and the other made of material M12. This is of great help in choosing a proper value for the “macroscopic” (Coulomb) coefficient of friction (μ0) at points A and B in Figure 1. It is noted that past the pinch point, the dynamic coefficient of friction of a plastically deforming particle drops to very low values and bounces back near the entrance to the Hertzian zone [27]. However, what happens past the pinch point is obviously of no concern to this study.
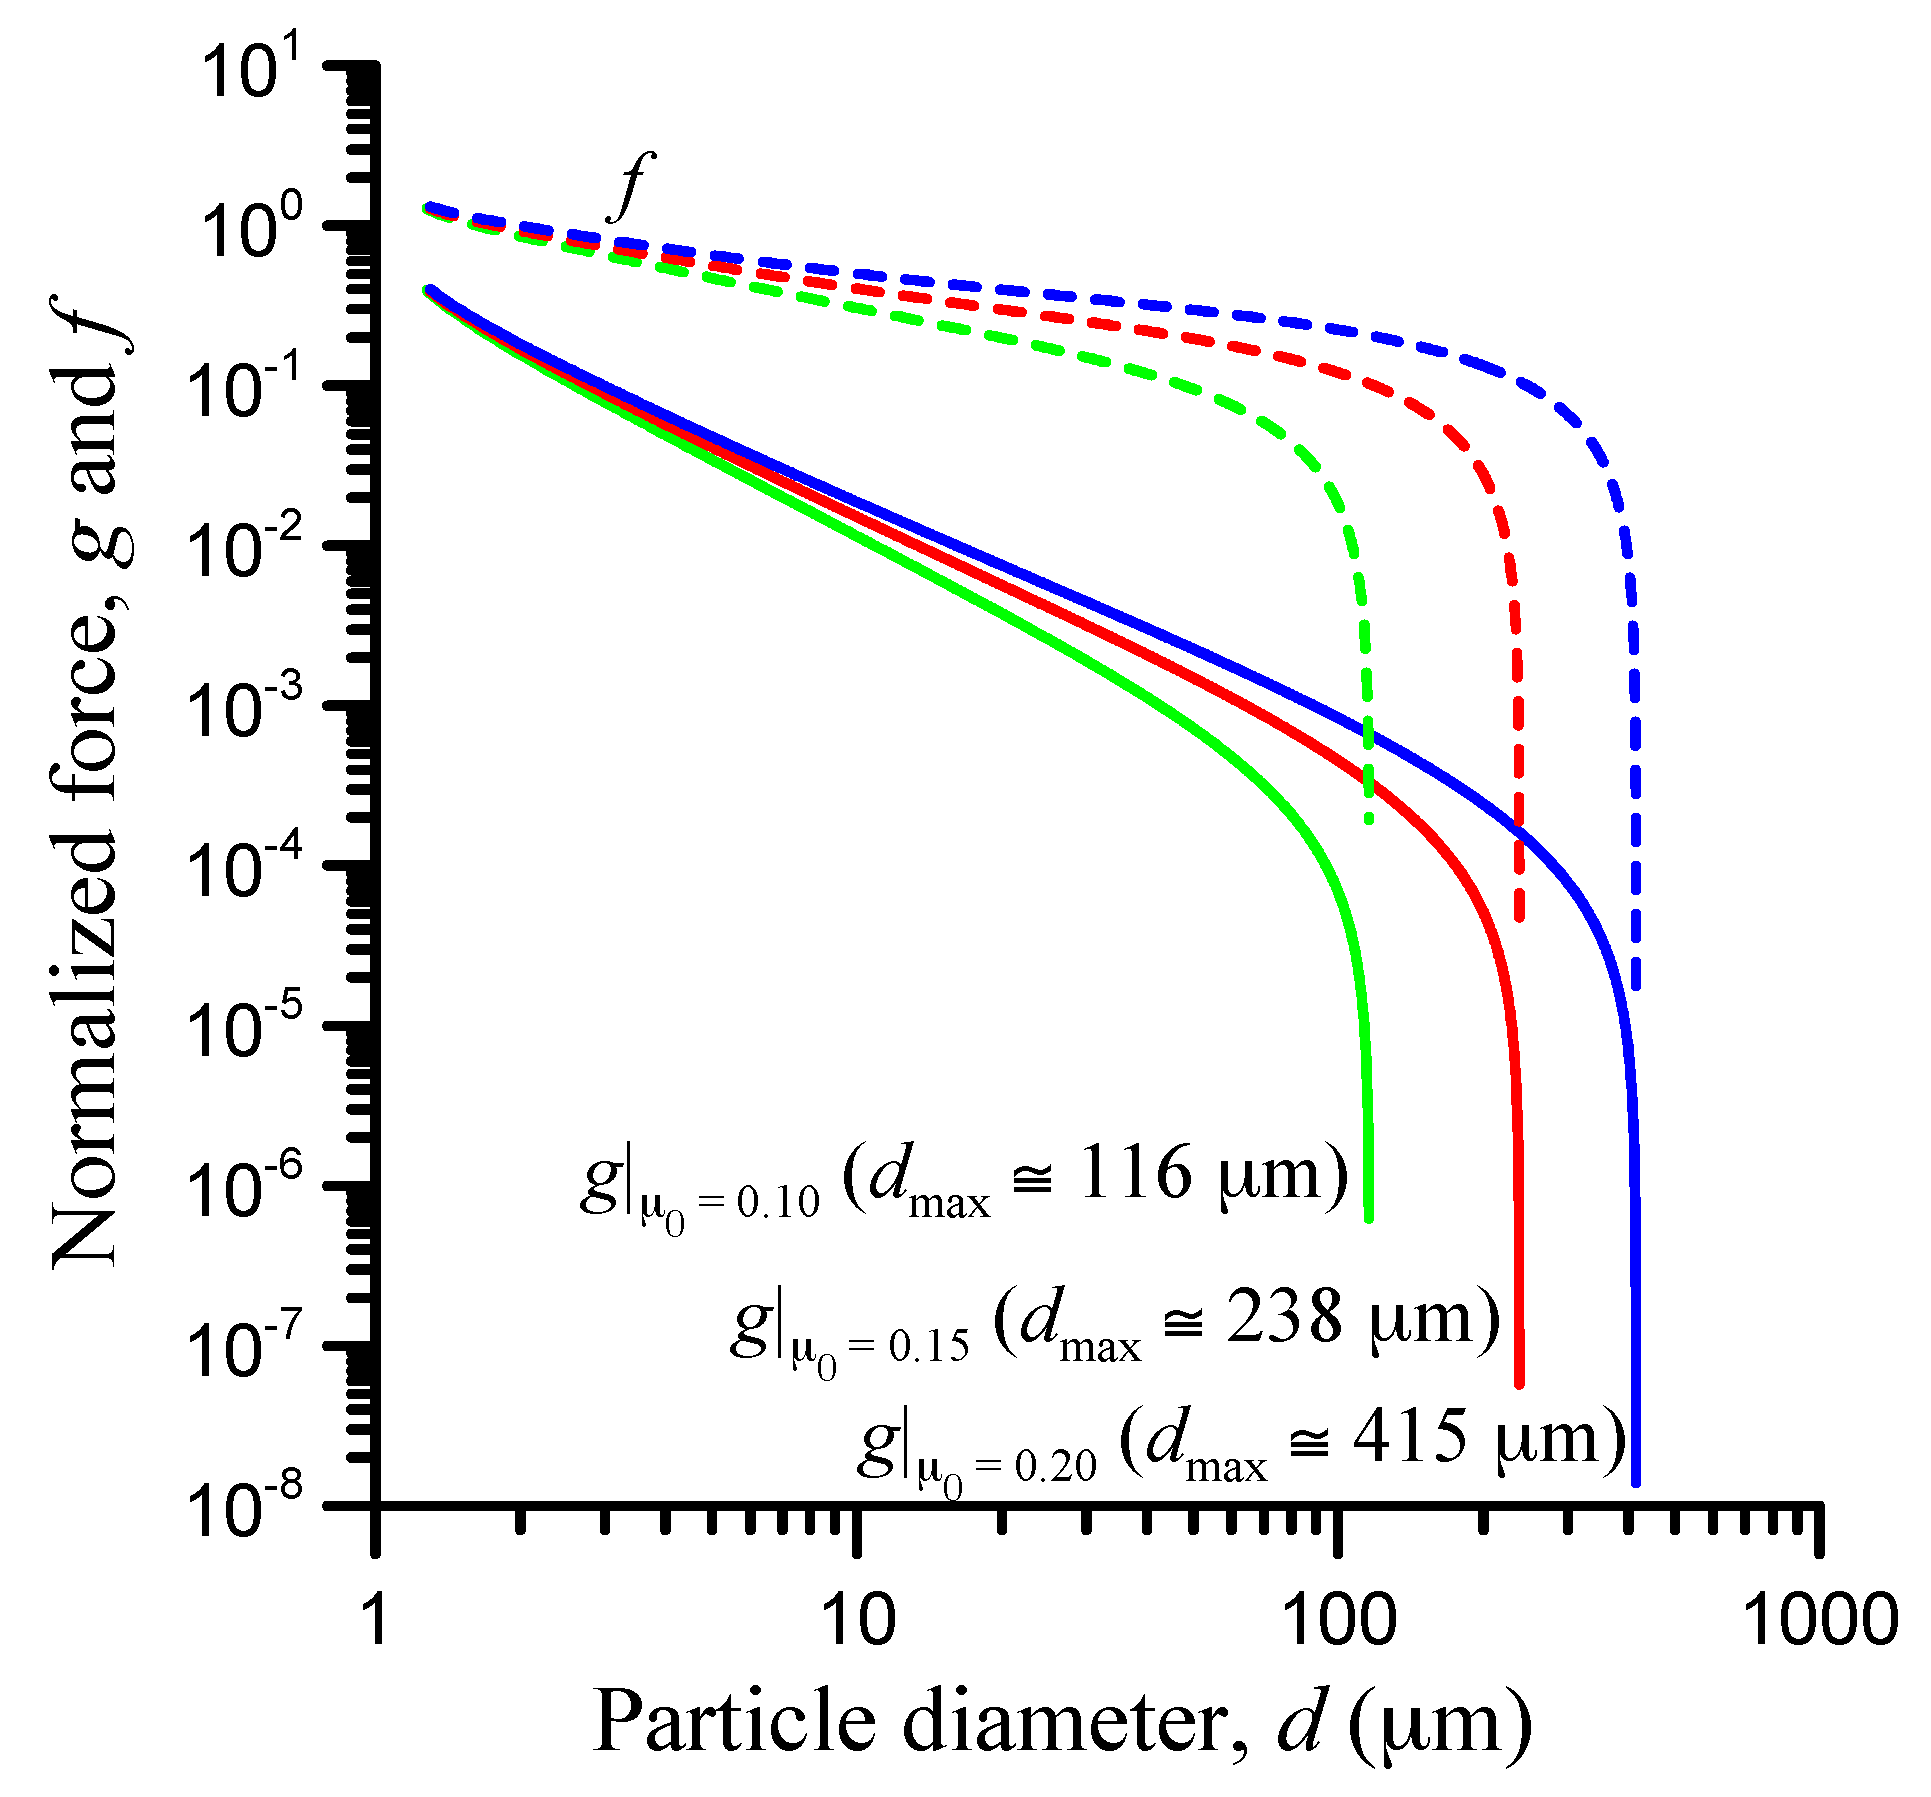
The effect of μ0 is materialised by the contact reaction forces Ni (Equation (27)) upon substitution of the total friction coefficient by Equation (25). In the context of the present model, there is no relation between μ0 and the net van der Waals force Gi (Equation (14)). The effect of μ0 on the normalised van der Waals force g is shown in Figure 10 for μ0 = 0.10, 0.15, and 0.20, values which cover most boundary and lightly lubricated metallic contacts. In this range, the effect on g is very distinctive. By force balancing, higher values of μ0 result in smaller contact reaction forces Ni (Equation (27)). Thus, higher values of μ0 result in higher values of g (Equation (30)) but at decreasing rate and mostly noticeable for particles greater than about 5 μm (Figure 10).
As with all previous results, the influence of the net van der Waals particle force is relatively much stronger for smaller particles, particularly for particles smaller than 3 μm in diameter. The effect on the maximum particle diameter for entrapment, dmax, is strong. According to Figure 10, dmax increases by approximately 205% when μ0 is increased by 50% from 0.10 to 0.15. Upon increasing μ0 by a further 33% from 0.15 to 0.20, dmax further increases by approximately 174%.

3.7. Roughness Effect

The effect of surface roughness is evaluated via the RMS value σi in the formulation of the net van der Waals force (Equation (14)). Real surfaces can have about the same RMS roughness value yet different profiles and it is roughness parameters such as the material contact area Rmr in addition to the maximum roughness height (Rz) and the total roughness (Rt) [28] that should be matched between two surfaces for correct correspondence. However, according to the Rabinovich et al. model adopted in this analysis, roughness modelling for the purpose of evaluating the van der Waals force ideally concerns closely packed, hemispherical roughness caps and troughs in equal numbers. In this context, the RMS roughness value is the only roughness parameter contemplated here. It is reminded that the nanoroughness of the particle, being much lower than those of surfaces 1 and 2, is ignored as explained in Section 2.3.
Assuming for simplicity that surfaces 1 and 2 have the same RMS roughness value, σ1 = σ2 = σ, Figure 11 shows the roughness effect for σ = 50, 100, 200, and 500 nm. This range of values is representative of polished engineering surfaces in EHL contacts such as in roller bearings [17]. Figure 11 shows that σ has a rather weak effect on the maximum particle size for entrapment: For the analysed cases, dmax varies between 408 and 421 μm and increases with σ. As for the effect on the normalised van der Waals force g, it is fairly obvious: g increases with σ. For the smallest particles (e.g., d < 5 μm), which are those mostly influenced by the intermolecular force, the increase in g with σ is significant because it brings the net van der Waals force to comparable levels to the contact reaction force. For example, a 2 μm particle experiences a net van der Waals force that is about 2% of the contact reaction force for σ = 50 nm; that percentage increases to nearly 32% for σ = 500 nm. For the same example, the net van der Waals force is about 6.2 times higher for the rougher contact (σ = 500 nm) than for the smoother one (σ = 50 nm). This trend is consistent with the Rabinovich et al. (modified Rumpf) adhesion model. It is explained by the dominance of the particle-asperity adhesion component over the particle-surface component above a critical and normally quite low RMS roughness value, as depicted in Figure 2 of Rabinovich et al. [22].
However, it must be emphasised that the Rabinovich et al. model expressed via Equation (14) has limitations. It is not appropriate for the low-nanoscale-roughness regime σ < 20 nm [22]; large RMS roughness values also pose difficulties with this approach because there are usually multiple roughness scales involved, which certainly need to be accounted for. Such deviations can cause very large discrepancies of one to two orders of magnitude between the measured and theoretically estimated adhesion force. In a sequel, Rabinovich et al. [29] examined the limitations of their modified-Rumpf model based on comparisons with experimental data, and showed that, at least in the low-nanoroughness regime (σ < 20 nm), the modified Rumpf model (Equation (14)) underestimated the measured adhesion force by more than one order of magnitude for a 10 μm particle. However, for greater roughness values, the discrepancy may be reduced. What really matters in a precise calculation of this nature, apart from accounting for other potential adhesive forces as later discussed, is the realistic estimation of the radius of roughness asperities. For a detailed review of this topic, the reader is directed to Rabinovich et al. [29]. It is, therefore, important to adhere to the roughness scale used in Figure 10 (50 nm ≤ σ ≤ 500 nm) and not anticipate the results for much lower or much higher σ values via Equation (14).

4. Discussion and Conclusions

The analysis presented in this study concerns the instantaneous contact and interaction of rigid spherical particles with lubricated solid surfaces in relative motion. This especially concerns EHD line contacts met in common engineering applications such as plain journal bearings. The focus is on the entrapment of particles with diameters greater than 1 μm. Therefore, the analysis targets micro-particles at the instant of entrapment, which naturally excludes particle entrainment or the wandering of particles in a carrier fluid. For the target particles, mechanical forces (contact reaction and friction), fluid forces (drag and pressure-gradient force), and intermolecular (van der Waals) forces are the dominant force components at the instant of entrapment (Figure 1).
It may be argued that two more forces could act at the critical moment of entrapment: The particle inertial force and an electrostatic force. However, they are generally weak, elusive, and very difficult to predict for the following two reasons.
(a)
It is almost certain that a particle collides with at least one surface and at least one time prior to the point of pinching. The probability of a particle simultaneously colliding with both surfaces 1 and 2 without prior collisions in the inlet zone is close to zero. Considering material elasticity and the fluid drag dissipating particle restitution, any particle inertia is quickly lost in such collisions.
(b)
For the reason just explained, namely particle collisions to the contact surfaces prior to pinching, any residual electrostatic charge of a (metallic) particle prior to the pinching point is reduced. However, friction during particle collisions may cause tribocharging in the case of dissimilar materials. Such effects are difficult to predict given the uncertainties in the motion of micro-particles, particularly in particle suspensions with inter-particle collisions. It should also be recalled that liquid lubricants are not insulators (their electric conductance depends on many factors such as the base oil and additives used, temperature, and others) and that surfaces are never free of some tribofilm, be it in the form of an engineered coating, an oxide layer, or an adhered contaminant [30]. This reduces the chance of electrostatic effects. Interested readers are referred to Israelachvili [15] for in-depth reading of related phenomena.
The parametric analysis in the present study showed that van der Waals forces become significant in comparison to contact reaction forces mainly for micro-particles smaller than 10 μm in diameter, particularly for particles smaller than 3–5 μm. In the latter case, the van der Waals force on a particle can exceed 10% of the contact reaction force and, in some cases, even reach the contact reaction force (for example, for high speed or high lubricant viscosity). This assists the entrapment of the smallest of particles, for the van der Waals force is usually attractive.
In regards to the maximum particle diameter for entrapment in typical EHL line contacts (dmax), the contribution of the van der Waals force is negligible, for dmax is typically of the order of tens to hundreds of microns. Particles of this size would have had a relatively strong van der Waals interaction had surface roughness effects been ignored. It is nanoscale and microscale surface roughness that prevents this and drastically reduces particle adhesion according to the modified-Rumpf model [22] adopted in the present study (Figure 2). It must be emphasised at this point that these results exclusively concern line (or rectangular) contacts. Results on point (elliptical) contacts will be published elsewhere.
The parametric analysis conducted in this study examines the normalised van der Waals force (Equation (30)), that is, the mean (net) van der Waals force (Equation (14)) divided by the mean contact reaction force (Equation (27)). This gives a perceivably relative strength of the van der Waals interaction for comparison purposes. It is shown that the relative strength of the van der Waals interaction is mostly influenced by the contact speed, the lubricant dynamic viscosity, and the RMS surface roughness; the influence of the coefficient of kinetic friction, the contact width, and the contact load is weaker, and the influence of the elastic modulus of the contact (metallic) surfaces is negligible.
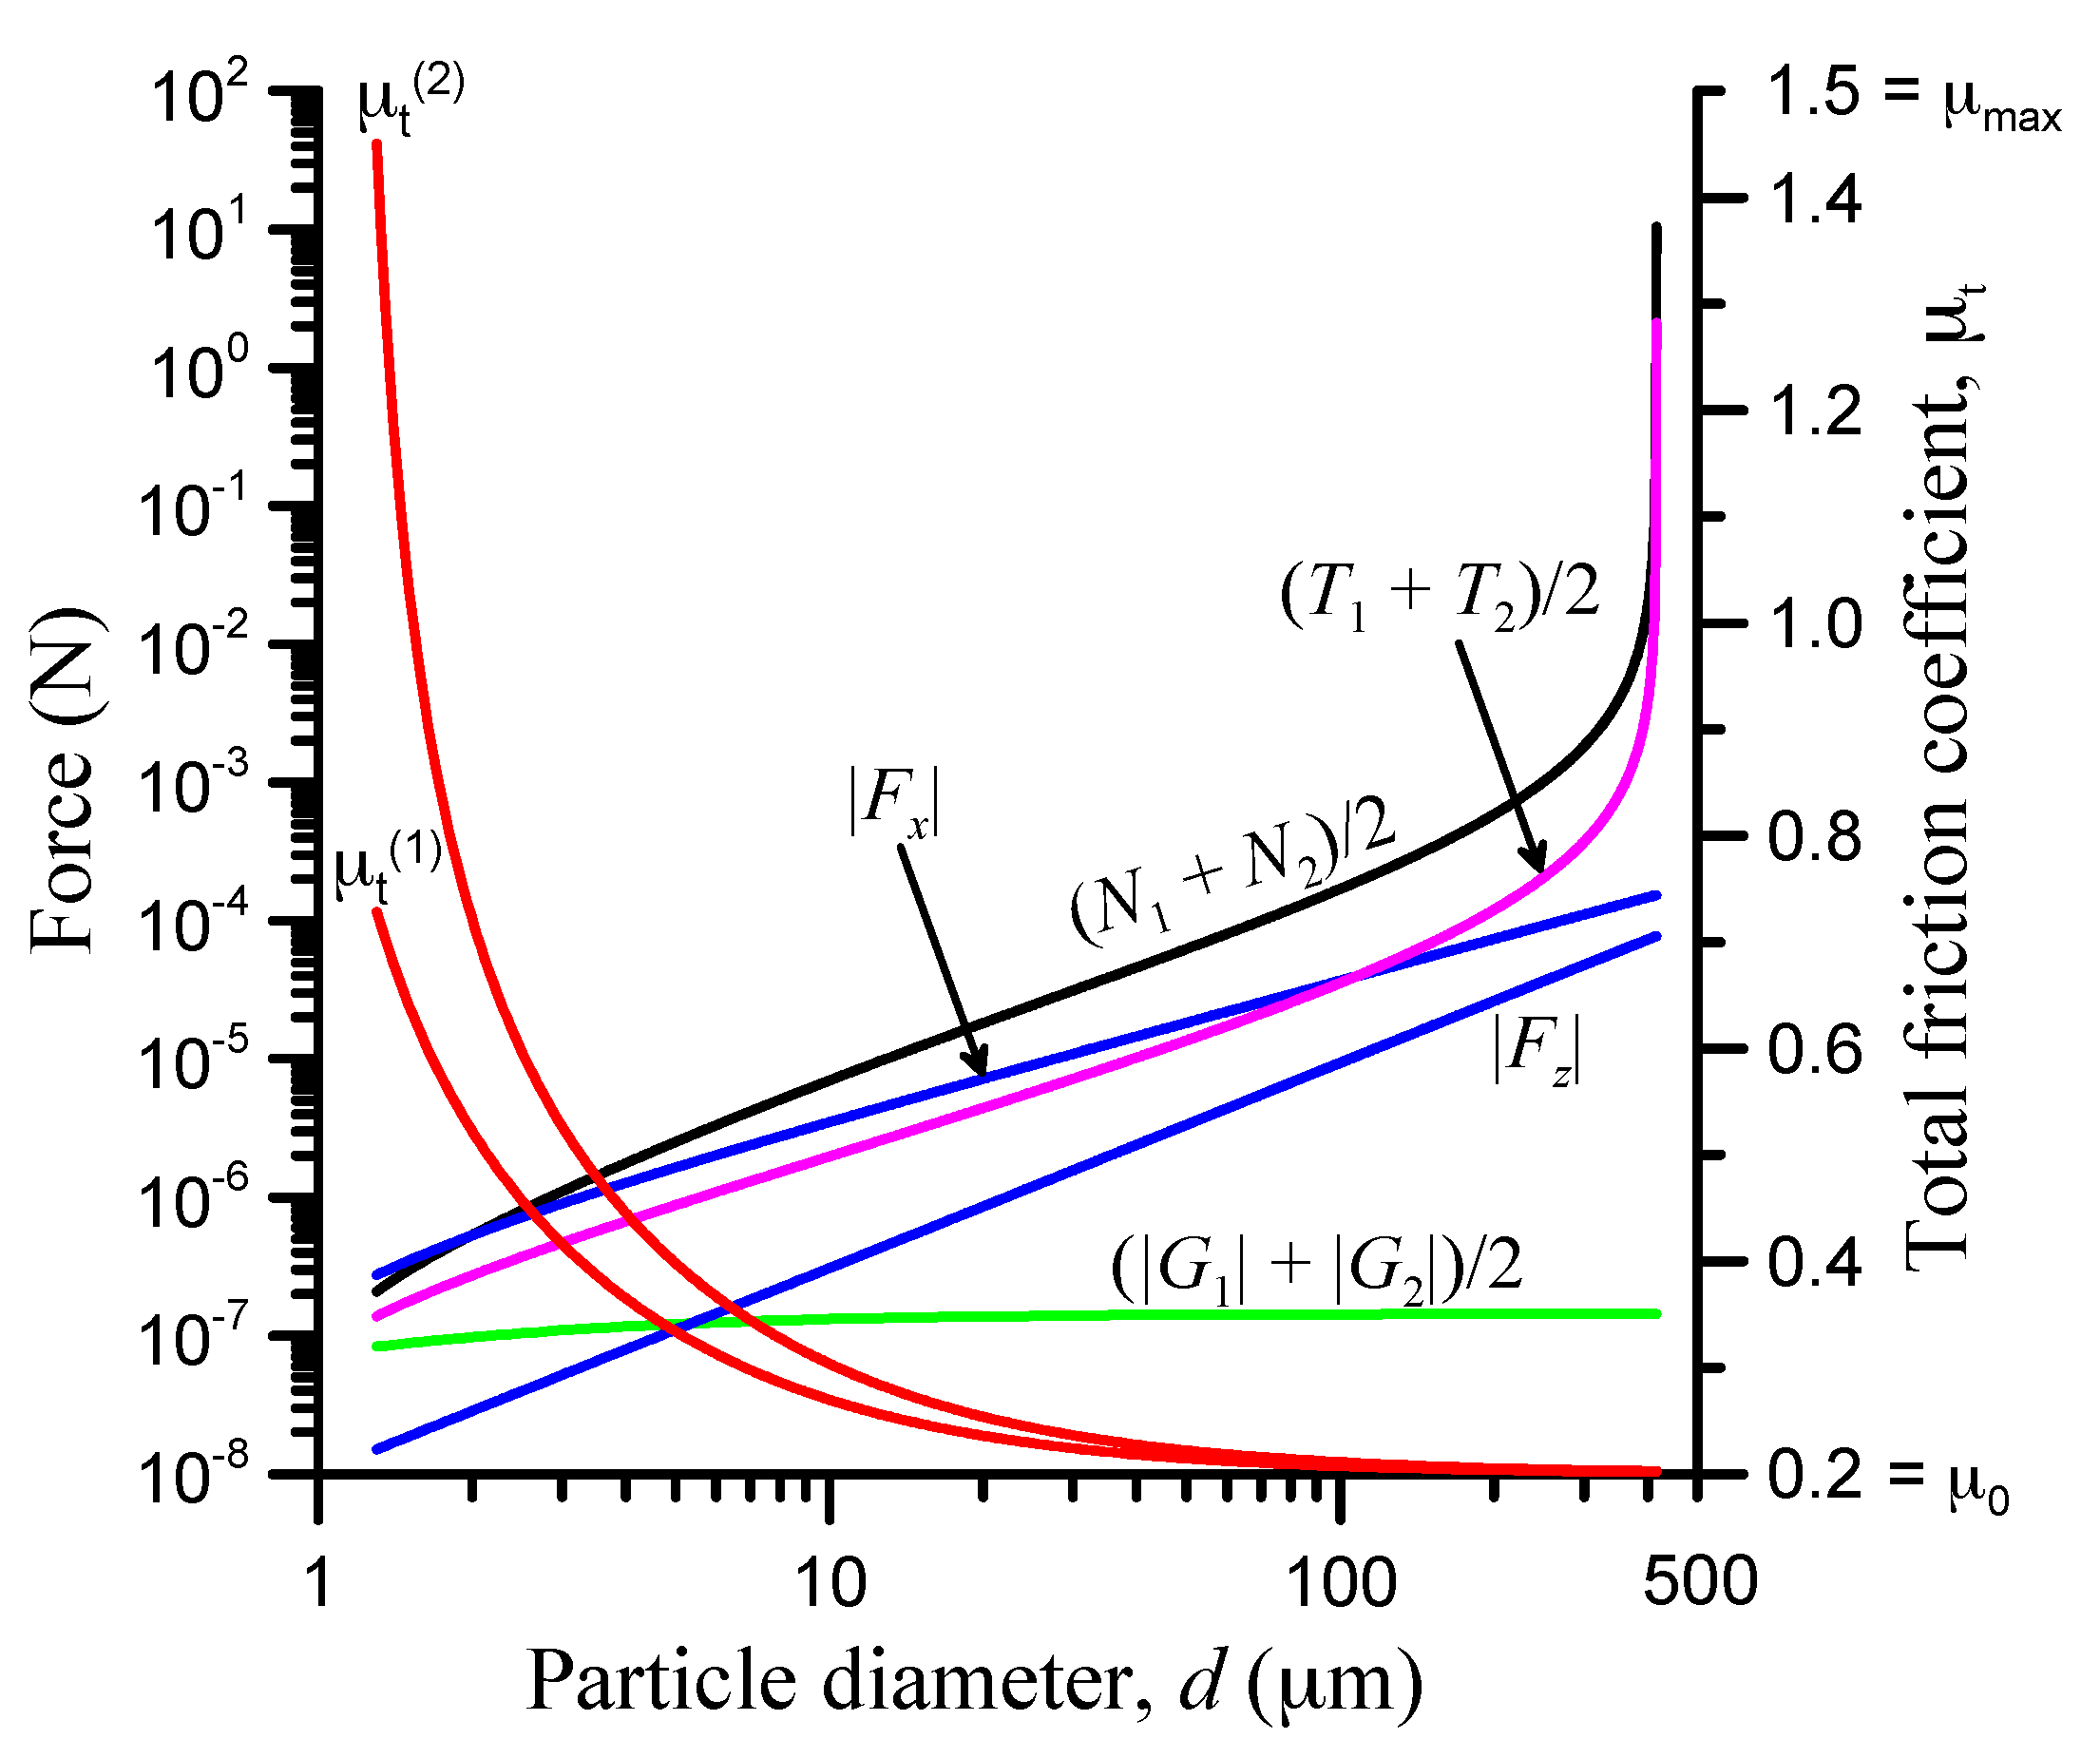
A typical example of the absolute values of the particle forces involved in this model is shown in Figure 12, based on the input data of Table 1, and using logarithmic axes for clarity.
The overlap regions of the various force components are obvious. The resultant fluid force, F = F x 2 + F z 2 , is approximately equal to the x-component of the fluid force, | F x | , because | F x | | F z | in this example. Therefore, as seen in Figure 12, the total fluid force F | F x | exceeds the mean friction force for particles smaller than 100 μm and also exceeds the mean normal reaction force for particles smaller than about 2 μm. The mean van der Waals force is of the same order of magnitude with all other forces for particles smaller than about 3 μm.
Conclusively, in line (or rectangular) EHL metallic and non-conforming contacts, particle entrapment is most often weakly influenced by van der Waals interactions, except for particles of less than 3 to 10 μm in spherical diameter depending on operating conditions, material properties, and dimensions. There are some notable cases involving high lubricant viscosity or high sliding speed where the van der Waals proportional contribution is strong.
For quick evaluation of the maximum particle diameter for entrapment, van der Waals interactions can be ignored. The precursor to the present model ([14]) has been numerically validated against the very few experimental results published in the literature to date [31,32] as reported by Nikas [4,14]. It is important to realise though that the results are based on models that idealise a complex situation with nanoscale effects, and there is a lot of room for some inadequacies or imprecision. An example is the modelling of surface roughness by hemispherical asperities of a given scale. Another example is the theoretical estimation of the nanometric or sub-nanometric separation between a particle and an opposing surface asperity, which greatly affects the magnitude of the van der Waals force, including the computation of the combined Hamaker constant. Therefore, despite the best of efforts to use enhanced theoretical tools available in the modelling of such phenomena, a significant degree of uncertainty on the quantitative side of some predictions is unavoidable.

Funding

This research received no external funding.

Conflicts of Interest

The author declares no conflict of interest.

Nomenclature

a1, a2angles (Figure 1; Equation (10), (11))
bhalf-width of the Hertzian contact zone (Figure 1; Equation (3))
b1, b2coefficients; b i = m i μ t ( i ) (i = 1, 2)
ctthermal correction factor (Equation (A4))
c1, c2constants (Equation (2))
dparticle diameter
dmaxmaximum particle diameter for entrapment (Equation (29))
d0auxiliary variable in Equation (29)
Droller diameter
Eeeffective modulus of elasticity (Equation (5))
E1, E2elastic moduli of surfaces 1 and 2
fnormalised fluid force (Equation (31))
Ftotal fluid force (Figure 1)
Fpparticle load (Figure 2)
Fx, Fzmagnitude of the components of F in Ox and Oz (Equations (8) and (9))
gnormalised van der Waals force (Equation (30))
Gsigned value of the van der Waals force between a sphere and a cylinder (Equation (17))
G, G1, G2van der Waals forces on the particle (Figure 1 and Figure 2)
G1, G2signed values of van der Waals forces (Equation (14))
hccentral film thickness (Figure 1; Equation (A1))
h1, h2, hf, hpnonretarded Hamaker constants of surfaces 1 and 2, the lubricant, and the particle
HHamaker constant
H1, H2combined, nonretarded Hamaker constants (Equation (15))
klubricant thermal conductivity at operating temperature
Lload per unit length of the contact
m1, m2coefficients; m i = 1 when u i = 0 ; otherwise, m i = 1 (i = 1, 2)
N, N1, N2contact reaction forces (Figure 1 and Figure 2)
N1, N2magnitudes of N1 and N2 (Equation (27))
p0maximum pressure of the line contact (Equation (A5))
Pparticle-asperity normal reaction force in Figure 2
Pmagnitude of P
qsystem determinant (Equation (28))
Requivalent radius of curvature (Equation (4))
R1, R2radii of curvature of surfaces 1 and 2
sseparation between sphere (particle) and cylinder (roller)
s1, s2separation between particle and asperity of surface 1 or 2
S0temperature exponent of the Roelands viscosity formula
S02ASTM slope of the lubricant between 40 and 100 °C, divided by 0.2 (Equation (A3))
T, T1, T2frictional forces (Figure 1 and Figure 2)
T, T1, T2magnitudes of T, T1, and T2, respectively (Equations (20) and (24))
u1, u2tangential velocities (Figure 1)
u1, u2magnitudes of the tangential velocities (Figure 1)
w1, w2elastic normal surface displacements (Figure 1; Equation (1))
Wvan der Waals interaction energy (Equation (16))
xcoordinate (Figure 1)
xA, xB, xPx-coordinates of points A, B, and the particle centre P
zcoordinate (Figure 1)
zPordinate of particle’s centre
Greek Symbols
αpressure-viscosity coefficient of the lubricant at operating temperature (Equation (A2))
η0lubricant dynamic viscosity at operating temperature
ϑangle (Figure 2)
θoperating temperature
θ0ambient temperature
λparameter (Equation (A6))
μ“local” coefficient of friction (Equation (21))
μmaxmaximum permissible value of μt
μ t , μ t ( 1 ) , μ t ( 2 ) total friction coefficients (Equation (22) or (25))
μ 0 , μ 0 ( 1 ) , μ 0 ( 2 ) “macroscopic” (Coulomb) coefficients of friction
ν1, ν2Poisson’s ratios of surfaces 1 and 2
ν40, ν100kinematic viscosity at 40 and 100 °C, respectively
σ1, σ2, σPRMS roughness of surface 1, 2, and the particle
Abbreviations
ASTMAmerican Society for Testing and Materials
EHLelastohydrodynamically lubricated
EHDelastohydrodynamic
RMSroot mean square

Appendix A

The central film thickness hc of the line contact between two rollers (surfaces 1 and 2) in Figure 1 is calculated for steady-state, isothermal conditions by the Pan–Hamrock formula [33] and corrected by the thermal correction factor ct of Gupta et al. [34], as suggested by Hamrock et al. [19]:
h c = c t 2.922 r ( α E e ) 0.47 [ ( u 1 + u 2 ) η 0 2 r E e ] 0.692 ( r E e L ) 0.166
where α is the pressure-viscosity coefficient of the lubricant at the operating temperature, which is estimated here by the Wu et al. formula in SI units [35],
α = 10 9 S 02 [ 1.657 + 2.332 log 10 ( 10 6 η 0 ρ 0 ) ]
where S02 is the ASTM slope of the lubricant between 40 and 100 °C [36], divided by 0.2,
S 02 = log 10 [ log 10 ( ν 40 + 0.7 ) log 10 ( ν 100 + 0.7 ) ] 0.2 log 10 ( 373.15 313.15 ) ,   ( min { ν 40 , ν 100 } > 2   mm 2 / s )
ν40 and ν100 being the kinematic viscosities of the lubricant in mm2/s at 40 °C (313.15 K) and 100 °C (373.15 K). The thermal correction factor is given by [19,34]
c t = 1 13.2 p 0 E λ 0.42 1 + [ 0.213 + 0.475 ( 2 | u 1 u 2 | u 1 + u 2 ) 0.83 ] λ 0.64
using SI units, where p0 is the maximum contact pressure,
p 0 = 2 L π b
and parameter λ is
λ = S 0 η 0 ( θ 0 + 135.15 ) S 0 4 k ( θ + 135.15 ) S 0 + 1 [ ln ( η 0 ) + 9.668 ] ( u 1 + u 2 ) 2
using SI units, except for θ and θ0, which must be in degrees Celsius.

References

  1. Nikas, G.K. A state-of-the-art review on the effects of particulate contamination and related topics in machine-element contacts. Proc. Inst. Mech. Eng. Part J J. Eng. Tribol. 2010, 224, 453–479. [Google Scholar] [CrossRef]
  2. Nikas, G.K. Review of studies on the detrimental effects of solid contaminants in lubricated machine element contacts. In Reliability Engineering Advances; Hayworth, G.I., Ed.; Nova Science Publishers: New York, NY, USA, 2009; pp. 1–44. ISBN 9781606923290. [Google Scholar]
  3. Dwyer-Joyce, R.S. The Effects of Lubricant Contamination on Rolling Bearing Performance. Ph.D. Thesis, Imperial College London, Department of Mechanical Engineering, London, UK, 1993. [Google Scholar]
  4. Nikas, G.K. Theoretical Modelling of the Entrainment and Thermomechanical Effects of Contamination Particles in Elastohydrodynamic Contacts. Ph.D. Thesis, Imperial College London, Department of Mechanical Engineering, London, UK, 1999. [Google Scholar]
  5. Nikas, G.K. Particle entrainment in elastohydrodynamic point contacts and related risks of oil starvation and surface indentation. ASME J. Tribol. 2002, 124, 461–467. [Google Scholar] [CrossRef]
  6. Kang, Y.S.; Sadeghi, F.; Ai, X. Debris effects on EHL contact. ASME J. Tribol. 2000, 122, 711–720. [Google Scholar] [CrossRef]
  7. Han, H.; Zhang, Y. Theoretical effects of contaminant particles on the lubrication considering particle rotation. In Proceedings of the STLE/ASME International Joint Tribology Conference IJTC2008, Miami, FL, USA, 20–22 October 2008; pp. 303–305. [Google Scholar] [CrossRef]
  8. Han, H.; Zhang, Y.; Zhong, Z. Effect of particle transient motion on lubrication. Ind. Lubr. Tribol. 2010, 62, 126–135. [Google Scholar] [CrossRef]
  9. Dwyer-Joyce, R.S. Predicting the abrasive wear of ball bearings by lubricant debris. Wear 1999, 233–235, 692–701. [Google Scholar] [CrossRef]
  10. Dwyer-Joyce, R.S.; Hamer, J.C.; Sayles, R.S.; Ioannides, E. Lubricant screening for debris effects to improve fatigue and wear life. In Proceedings of 18th Leeds–Lyon Symposium on Tribology; Elsevier Tribology and Interface Engineering Series; Elsevier: Lyon, France, 1991; Volume 21, pp. 57–63. [Google Scholar] [CrossRef]
  11. Kusano, Y.; Hutchings, I.M. Modelling the entrainment and motion of particles in a gap: Application to abrasive wear. Proc. Inst. Mech. Eng. Part J J. Eng. Tribol. 2003, 217, 427–433. [Google Scholar] [CrossRef]
  12. Zhong, Z.; Zhang, Y.; Han, H. A simple model of the entrainment of particles in a gap considering elasticity. In Proceedings of the STLE/ASME International Joint Tribology Conference IJTC2008, Miami, FL, USA, 20–22 October 2008; pp. 461–463. [Google Scholar] [CrossRef]
  13. Morales Espejel, G.M.; Gabelli, A. Particle entrapment and indentation process in rolling bearings. Proc. Inst. Mech. Eng. Part J J. Eng. Tribol. 2016, 230, 1572–1587. [Google Scholar] [CrossRef]
  14. Nikas, G.K. Mathematical analysis of the entrapment of solid spherical particles in non-conformal contacts. ASME J. Tribol. 2001, 123, 83–93. [Google Scholar] [CrossRef]
  15. Israelachvili, J.N. Intermolecular and Surface Forces, 3rd ed.; Academic Press (Elsevier): Oxford, UK, 2011; ISBN 9780123919274. [Google Scholar]
  16. Johnson, K.L. Contact Mechanics; Section 10.4; Cambridge University Press: Cambridge, UK, 1985; ISBN 0521347963. [Google Scholar]
  17. Khonsari, M.M.; Booser, E.R. Applied Tribology, 3rd ed.; Table 3.1.; Wiley: Hoboken, NJ, USA, 2017; ISBN 9781118700259. [Google Scholar]
  18. Nikas, G.K.; Ioannides, E.; Sayles, R.S. Thermal modeling and effects from debris particles in sliding/rolling EHD line contacts—A possible local scuffing mode. ASME J. Tribol. 1999, 121, 272–281. [Google Scholar] [CrossRef]
  19. Hamrock, B.J.; Schmid, S.R.; Jacobson, B.O. Fundamentals of Fluid Film Lubrication, 2nd ed.; Marcel Dekker, Inc.: New York, NY, USA, 2004; ISBN 0824753712. [Google Scholar]
  20. Parsegian, V.A. Van der Waals Forces: A Handbook for Biologists, Chemists, Engineers and Physicists; Cambridge University Press: Cambridge, UK, 2006; ISBN 9780521839068. [Google Scholar]
  21. Rumpf, H. Particle Technology; Chapman and Hall: London, UK, 1990; ISBN 9789401179461. [Google Scholar]
  22. Rabinovich, Y.I.; Adler, J.J.; Ata, A.; Singh, R.K.; Moudgil, B.M. Adhesion between nanoscale rough surfaces: I. Role of asperity geometry. J. Colloid Interf. Sci. 2000, 232, 10–16. [Google Scholar] [CrossRef] [PubMed]
  23. Montgomery, S.W.; Franchek, M.A.; Goldschmidt, V.W. Analytical dispersion force calculations for nontraditional geometries. J. Colloid Interf. Sci. 2000, 227, 567–584. [Google Scholar] [CrossRef] [PubMed]
  24. Berman, A.D.; Israelachvili, J.N. Microtribology and microrheology of molecularly thin liquid films. In Modern Tribology Handbook; vol. 1, chapter 16; Bhushan, B., Ed.; CRC Press LLC: London, UK, 2001; ISBN 0849384036. [Google Scholar]
  25. Mo, Y.; Turner, K.T.; Szlufarska, I. Friction laws at the nanoscale. Nature 2009, 457, 1116–1119. [Google Scholar] [CrossRef] [PubMed]
  26. Meyer, J.; Fuchs, R.; Staedler, T.; Jiang, X. Effect of surface roughness on sliding friction of micron-sized glass beads. Friction 2014, 2, 255–263. [Google Scholar] [CrossRef] [Green Version]
  27. Nikas, G.K. Particle extrusion in elastohydrodynamic line contacts: Dynamic forces and energy consumption. Proc. Inst. Mech. Eng. Part J J. Eng. Tribol. 2017, 231, 1320–1340. [Google Scholar] [CrossRef]
  28. ISO 4287:1997 Standard. Geometrical Product Specifications (GPS)—Surface Texture: Profile Method—Terms, Definitions and Surface Texture Parameters; International Organization for Standardization: Geneva, Switzerland, 1997.
  29. Rabinovich, Y.I.; Adler, J.J.; Ata, A.; Singh, R.K.; Moudgil, B.M. Adhesion between nanoscale rough surfaces: II. Measurement and comparison with theory. J. Colloid Interf. Sci. 2000, 232, 17–24. [Google Scholar] [CrossRef] [PubMed]
  30. Jacobson, S.; Hogmark, S. Tribofilms—On the Crucial Importance of Tribologically Induced Surface Modifications. In Recent Developments in Wear Prevention, Friction and Lubrication; Chapter 5; Nikas, G.K., Ed.; Research Signpost: Kerala, India, 2010; ISBN 9788130803777. [Google Scholar]
  31. Cusano, C.; Sliney, H.E. Dynamics of solid dispersions in oil during the lubrication of point contacts: Part I—Graphite. ASLE Trans. 1982, 25, 183–189. [Google Scholar] [CrossRef]
  32. Wan, G.T.Y.; Spikes, H.A. The behavior of suspended solid particles in rolling and sliding elastohydrodynamic contacts. Tribol. Trans. 1988, 31, 12–21. [Google Scholar] [CrossRef]
  33. Pan, P.; Hamrock, B.J. Simple formulas for performance parameters used in elastohydrodynamically lubricated line contacts. ASME J. Tribol. 1989, 111, 246–251. [Google Scholar] [CrossRef]
  34. Gupta, P.K.; Cheng, H.S.; Zhu, D.; Forster, N.H.; Schrand, J.B. Viscoelastic effects in MIL-L-7808-type lubricant, part I: Analytical formulation. Tribol. Trans. 1992, 35, 269–274. [Google Scholar] [CrossRef]
  35. Wu, C.S.; Klaus, E.E.; Duda, J.L. Development of a method for the prediction of pressure-viscosity coefficients of lubricating oils based on free-volume theory. ASME J. Tribol. 1989, 111, 121–128. [Google Scholar] [CrossRef]
  36. Denis, J.; Briant, J.; Hipeaux, J.C. Lubricant Properties, Analysis and Testing; Section 2.5.5.1; Editions Technip: Paris, France, 2000; ISBN 2710807467. [Google Scholar]
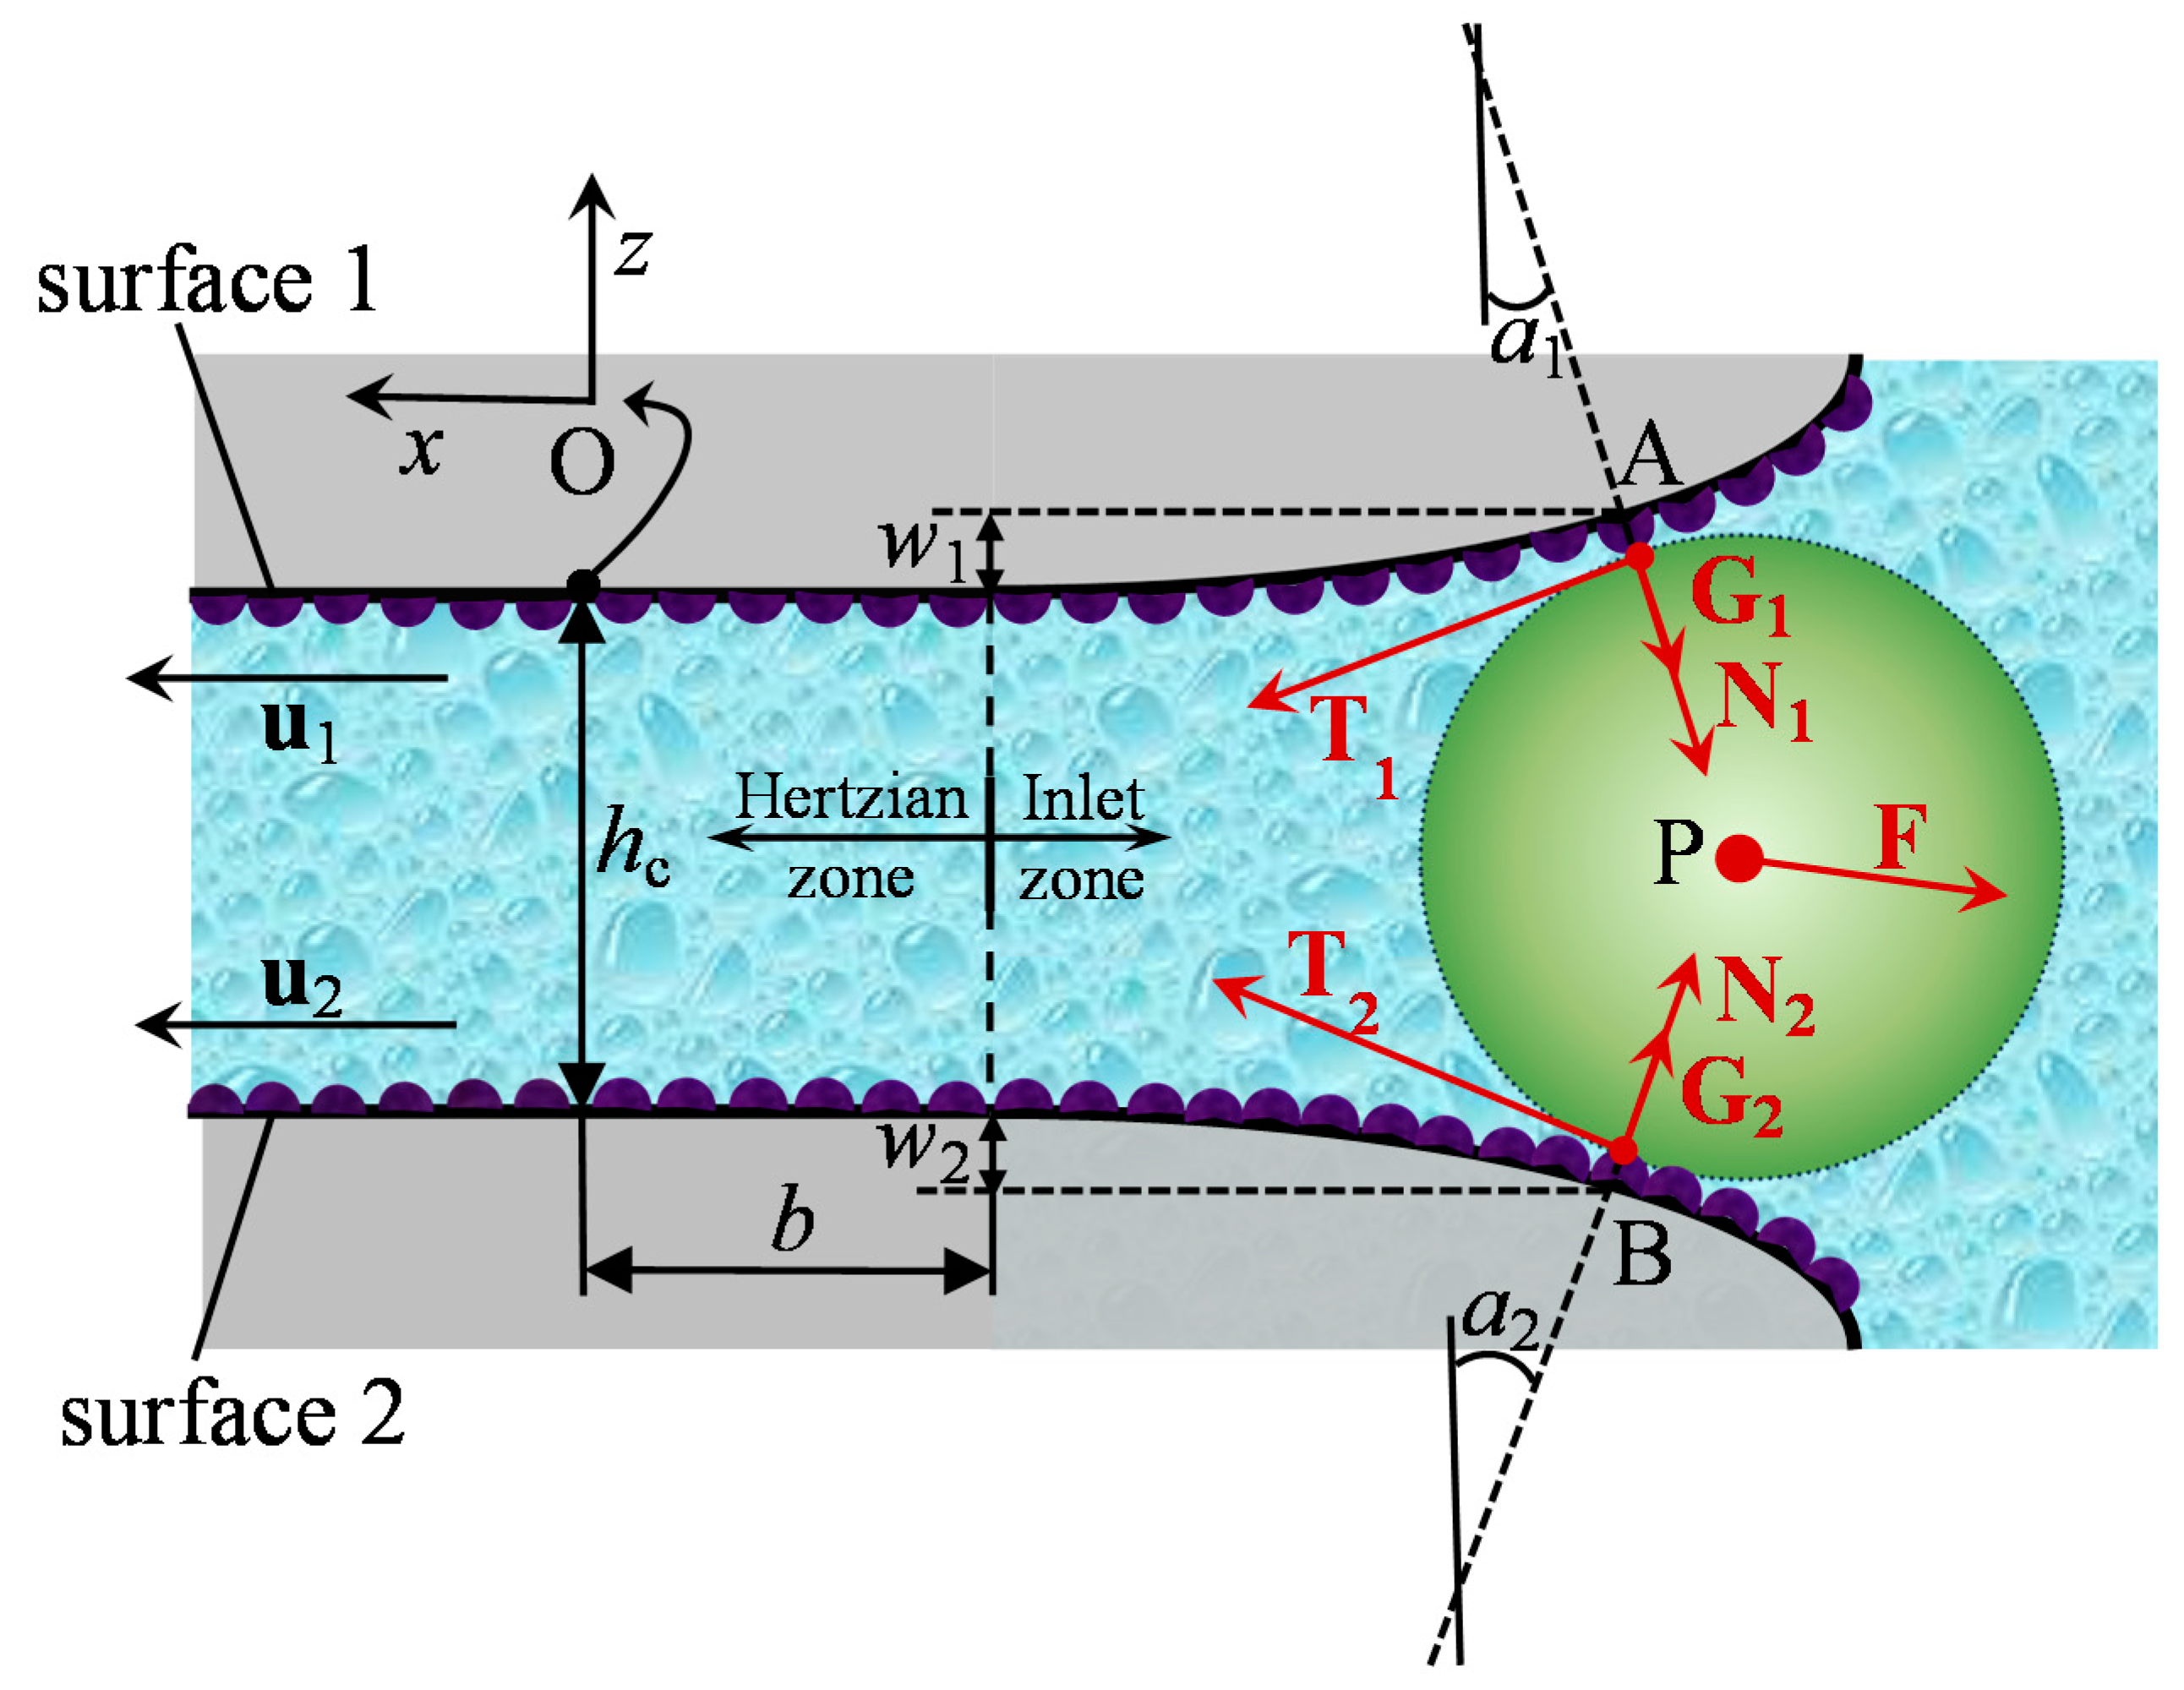
Figure 1. Model of spherical particle pinched in a line, elastohydrodynamically lubricated (EHL), rough contact. For visualisation purposes, roughness valleys are not depicted. Note that attractive van der Waals forces G are taken with a negative sign.
Lubricants 08 00060 g001
Figure 2. Rigid-contact model of spherical particle (radius d/2) with hemispherical asperities (radius r). Roughness asperities and troughs are of equal radius in a close-packing arrangement.
Lubricants 08 00060 g002
Figure 3. Comparison of the van der Waals force on the particle as estimated by the Rabinovich et al. (modified Rumpf) model [22] (sphere on rough flat surface—Equation (14)) and the Montgomery et al. model [23] (sphere on smooth cylinder—Equation (17)) (input data in Table 1).
Lubricants 08 00060 g003
Figure 4. Presentation of a typical g-curve in linear versus logarithmic axes.
Lubricants 08 00060 g004
Figure 5. Effect of the load per unit length of the contact (L) on the normalised van der Waals force (g—solid lines) and the normalised fluid force (f—dashed lines with colours corresponding to those of g) (input data in Table 1).
Lubricants 08 00060 g005
Figure 6. Effect of the diameter of the contacting rollers (D) on the normalised van der Waals force (g—solid lines) and the normalised fluid force (f—dashed lines with colours corresponding to those of g) (input data in Table 1).
Lubricants 08 00060 g006
Figure 7. Effect of the elastic modulus of the contacting rollers (E—assuming that E1 = E2 = E) on the normalised van der Waals force (g—solid lines) and the normalised fluid force (f—dashed lines with colours corresponding to those of g) (input data in Table 1). Due to overlapping, some curves are only partially visible. Green colour is used for E = 100 GPa (hardly visible), blue colour for E = 150 GPa, and red colour for E = 200 GPa.
Lubricants 08 00060 g007
Figure 8. Effect of the contact speed on the normalised van der Waals force (g—solid lines) and the normalised fluid force (f—dashed lines with colours corresponding to those of g), keeping u2 = 0.001 m/s and varying u1 (input data in Table 1).
Lubricants 08 00060 g008
Figure 9. Effect of the dynamic viscosity (η0) on the normalised van der Waals force (g—solid lines) and the normalised fluid force (f—dashed lines with colours corresponding to those of g) (input data in Table 1 and Table 2).
Lubricants 08 00060 g009
Figure 10. Effect of the “macroscopic” (Coulomb) coefficient of friction (μ0) at the instant of particle pinching on the normalised van der Waals force (g—solid lines) and the normalised fluid force (f—dashed lines with colours corresponding to those of g) (input data in Table 1).
Lubricants 08 00060 g010
Figure 11. Effect of the RMS surface roughness value on the normalised van der Waals force (g—solid lines) and the normalised fluid force (f—dashed lines with colours corresponding to those of g), assuming that σ1 = σ2 = σ and using the modified Rumpf model [22] in Equation (14) (input data in Table 1).
Lubricants 08 00060 g011
Figure 12. Particle forces and friction coefficients for the input data of Table 1: Mean normal reaction force, ( N 1 + N 2 ) / 2 ; mean friction force, ( T 1 + T 2 ) / 2 ; mean van der Waals force, ( | G 1 | + | G 2 | ) / 2 ; absolute values of the fluid force components, | F x | and | F z | ; total friction coefficients, μ t ( 1 ) and μ t ( 2 ) . The resultant fluid force is F x 2 + F z 2 | F x | , so it would be indistinguishable from | F x | in the figure.
Lubricants 08 00060 g012
Table 1. Nominal values of the input data for the numerical examples of a particle contacting two rollers. Some parameters are varied as detailed in the related figures of the parametric analysis.
ParameterValue
Elastic modulus: E1; E2 (GPa)207; 207
Poisson’s ratio: ν1; ν20.3; 0.3
Diameter of rollers 1 and 2: D (mm)20
Load per unit length of the contact: L (N/mm)100
Surface speed: u1; u2 (m/s)1; 0.001
Ambient temperature: θ0 (°C)23
Operating temperature: θ (°C)23
Lubricant mass density at operating temperature: ρ0 (kg/m3)708
Lubricant dynamic viscosity at operating temperature: η0 (Pa s)0.1
Lubricant kinematic viscosities: ν40; ν100 (mm2/s (cSt))68; 8.8
Lubricant thermal conductivity at operating temperature: k (W/(m K))0.14
Temperature exponent of the Roelands viscosity formula: S01.1 (Hamrock et al. [19])
“Macroscopic” coefficient of friction at particle pinching: μ 0 ( 1 ) ; μ 0 ( 2 ) 0.2; 0.2 (Nikas [27])
Maximum permissible coefficient of friction: μmax1.5
Nonretarded Hamaker constant: h1; h2; hp; hf (10–20 J)40; 40; 40; 5 (Israelachvili [15])
Separation between particle and surface: s1; s2 (nm)0.3; 0.3 (Rabinovich et al. [22])
RMS surface roughness: σ1; σ2 (nm)250; 380 (Khonsari and Booser [17])
Table 2. Dynamic and kinematic viscosity data for Figure 9.
η0 (Pa s)ν40 (mm2/s)ν100 (mm2/s)
0.016.80.88
0.05344.4
0.1688.8
0.213617.6
0.534044
168088