Abstract
In the following study, green carbon nanotubes and green few-layer reduced graphene oxide (rGO) were synthesized through simple, sustainable, and scalable processes starting from recycled plastic and charcoal, respectively, and with the highest number of steps involving non-harmful substances. After an extensive physicochemical characterization, which evidenced that both nano-carbons exhibit structures comparable with that of materials produced through more traditional methods and from pure sources, the samples were dispersed in two types of conventional base oils, in particular group I and group III, in order to carry out, for the first time on these green nanomaterials, an accurate study on their tribological performance. Tribological tests evidenced a remarkable reduction of coefficient of friction and wear scar diameter, especially for the green rGO dispersed at 0.1 wt% in the group III oil along with SDBS-Tween 80 surfactants mixture: 18% and 15% at ambient temperature, 12% and 13% at 80 °C, respectively. Furthermore, the tribological performance of the synthesized samples in both oils remained high for 160 min of investigation. A comparison with the same material obtained with a traditional synthesis revealed the absence of fouling phenomena in the lubrication chambers in our case, confirming the higher tribological performances of the green rGO sample, probably, as a consequence of its less ordered nature.
1. Introduction
Innovative improvements in the performance of lubricants, which have practically reached their limits, and the replacement of additives with much more environmental friendly and recyclable molecules which interfere as little as possible with other’s functions and base oils properties, would lead to additional consumption reductions, lower emissions, and enhancement of transport environmental sustainability [1,2,3,4,5,6,7,8].
In this perspective, control at the nanoscale is undoubtedly an opportunity for the development of new and more efficient additive formulations. Among the most efficient nanostructured additives, nanocarbon-based nanomaterials are able to significantly enhance anti-wear properties and friction coefficient [9]. Moreover, the effect of nanocarbons with different degree of order has been little or not analyzed. On the other hand, two recent papers report some interesting results which can be ascribed to the amorphous nature of the nano-additives or interface [10,11].
Among nanocarbons, carbon nanotubes (CNTs) show good antiwear and antifriction properties even under heavy load conditions, which makes them a valid alternative to the traditional lubricant additives [12,13,14,15,16]. Along with CNTs, graphene, a 2D nanomaterial with a hexagonal honeycomb crystalline structure made up of sp2 hybridized carbon atoms, has shown remarkable antiwear and antifriction properties due to its multilayer morphology, as well as due to its ability to increase a convective heat transfer in the base oil as a result of its high thermal conductivity [17,18,19].
On the other hand, the circular economy and recycling can further increase sustainability. For instance, the most efficient and adopted method for the synthesis of CNTs is hydrocarbon chemical vapor deposition (CVD), which allows better control of the obtained product [20,21,22,23,24]. However, it involves the usage of a high quantity of energy and resources. Adopting recycled feedstock such as carbon-rich polymer wastes for the CVD process can represent a more sustainable alternative for CNTs production. Indeed, nowadays plastic polymers represent a significant portion of the waste produced worldwide.
Among methods allowing mass production of graphene, the chemical strategy [25,26,27,28], of adopting highly pure expensive graphite as the starting material, typically produced through high-energy consumption and intensely polluting processes, is the preferable route. On the other hand, a large amount of agroforestry waste, as well as the increased costs and the still significantly detrimental environmental impact associated with the waste disposal, encourage looking for sustainable conversion of agroforestry waste into useful products [29]. For this reason and in the view of increased shift towards green chemistry, the production of graphene starting from agroforestry waste is a challenging and valid opportunity [30]. Furthermore, in the view of an even more sustainable process, the reduction step of graphene oxide can be carried out through green reactants, such as ascorbic acid.
Herein, green CNTs and green few-layer reduced graphene oxide (rGO) were synthesized through simple, sustainable, and scalable processes from recycled plastic polymers and charcoal, which is an intermediate during the procedure for lignocellulosic material valorization vs. rGO, respectively. After an extensive characterization, the samples which exhibit physico-chemical characteristics very similar to more conventional except for the degree of order, were dispersed in two types of conventional base oils, in particular group I and group III, to test their tribological performance. It is worth noticing that an accurate study on the tribological performance of rGO as well as carbon nanotubes synthesized from carbonaceous waste has never been proposed thus far. Indeed, it is undeniable that the search for high-performance and, simultaneously, eco-friendlier additive formulations are currently becoming more and more imperative in the perspective of increasingly sustainable lubricant industry. During tribological tests, a significant decrease of friction coefficient and wear were observed, proving the outstanding performance of the synthesized materials.
2. Materials and Methods
2.1. Lubricant Bases for Formulations
Two lubricant oil bases were adopted in the following study:
- ETRO IV (Group III) base oil, whose commercial family name when including further additives is SYNPLUS by RILUB SPA and which for simplicity’s sake will be called SYNPLUS in the following study.
- SN150 and BS150 mixture (Group I), whose lubricant family commercial name, when including further additives, is EUBUSH by RILUB SPA and which for simplicity’s sake will be called EUBUSH in the following study.
The obtained samples were dispersed in SYNPLUS both with and without dispersants/surfactants, no further dispersants were added in EUBUSH since the sample stability in it was quite high. The chosen dispersant/surfactants are: 1,8 diaminonaphthalene, Tween 80, sodium dodecyl benzenesulfonate (SDBS), and a commercial dispersant (HiTEC®646E Performance Additive—Polyisobutylene Succinimides) named as PS.
As can be seen in Table 1, the synthesized nanomaterials were classified into four groups for clarity’s sake, depending on the type of surfactants/dispersant they were mixed with. Concerning the first group, nanocarbons were mixed with 1.8 diaminonaphthalene (weight ratio 1:8) in 100 mL of bidistilled water, sonicated for 20 min and then dried at 80 °C. As for the second group, 50 mg of nanocarbons were mixed with 500 mg of SDBS in 100 mL of bidistilled water, sonicated for 20 min at 45 °C and air dried for a day. Subsequently, the mixture was centrifuged for 30 min at 7500 rpm and dried at 80 °C. As for the samples belonging to the third group, 50 mg of nanocarbons were mixed with 250 mg of SDBS and 250 mg of Tween 80 in 100 mL of bidistilled water. The as-prepared mixture was then sonicated for 20 min at 45 °C, air dried for a day, centrifuged for 30 min at 7500 rpm, and dried again at 80 °C. Concerning the fourth group, dispersions in PS were obtained by mixing nanocarbons at three different percentages (0.05, 0.1, and 1 wt%) with a 2 wt% of PS. The as-prepared four groups of nanomaterials were mixed in the two base oils at different percentages (0.05, 0.1, and 1 wt%) by sonication in 25 mL of oil for 1 h. Eventually, the as-obtained oil suspension was mixed with the remaining part of the base oil through a homogenizer (Silverson Homogenizer L5M).

Table 1.
Prepared dispersions. In particular, for each nano-additive, a set of three different samples was prepared at three concentrations of 0.05, 0.1, and 1 wt%.
Dispersion stability tests were performed through UV–Vis spectroscopy coupled with centrifugation. As previously mentioned, stability in EUBUSH is high even without the addition of dispersant/surfactants. Therefore, tests were performed only in SYNPLUS. In particular, the prepared dispersions underwent centrifugation at 1000 rpm for 30 min. Afterward, the absorbance of the supernatant that resulted from centrifugation was measured through UV–Vis spectroscopy. Finally, the ratio between the absorbance values before and after centrifugation (which from now on will be named as A ratio) was calculated in virtue of the proportionality absorbance/concentration by adopting the Lambert-Beer equation.
2.2. Carbon Nanotubes (CNTs) Preparation through a “Green” Approach
Carbon nanotubes (CNTs), instead of from hydrocarbon decomposition [31,32], were synthesized starting from recycled materials, in particular from polymers (such as polyethylene and polypropylene), forming recycled plastic bags and bottles. The syntheses were conducted in the pyrolysis plant adopting a cobalt and iron-based catalyst. More specifically, the catalyst, consisting of Co and Fe, was prepared using an aqueous solution containing equal amounts of cobalt acetate and iron acetate. A sodium hydroxide solution was added to the previous solution until a pH equal to 12 was reached, hence cobalt hydroxide and iron hydroxide were formed. The suspension was then washed with bidistilled water until a pH equal to 6 was reached, filtered, and dried at 150 °C (until all the water evaporated). Eventually, the as-obtained powder was mixed with the recycled polymer previously dissolved in ortho-xylene. In particular, cobalt hydroxide and iron hydroxide were added to the polymer solutions. The viscous suspension was stirred at 70 °C until uniformity is reached, and the residual solvent was removed by heating at 95 °C. The adopted quantities were as follows: 20 g of polymer, dry basis, per 1 g of Co and Fe hydroxides. Once the reactor was charged with the catalyst, nitrogen flow was sent to the reactor for 20 min to generate an inert atmosphere. The reactor was then heated up through a nitrogen flow at 750 °C for 4 h. Subsequently, the reactor was cooled down to room temperature under nitrogen flow. Finally, a purification step allowed to obtain pure carbon nanotubes. In detail, in order to remove catalyst impurities, the samples were treated with a 46 wt% HF aqueous solution for 24 h. Afterwards, the solid residue was washed with distilled water, centrifuged and, eventually, dried for 12 h at 80 °C [33].
2.3. rGO Preparation through a “Green” Approach
2.3.1. Graphitization of Charcoal
rGO has been prepared through a “green” approach by using charcoal as feedstock. Charcoal is an obligatory intermediate in the process of valorization of agroforestry waste. The first synthesis step involves the chemical graphitization of the charcoal, i.e., a series of polymerizations and rearrangements of the aromatic skeleton which lead to the formation of the multilayer atomic structure of graphite, which is most orderly and thermodynamically stable than the chaotic one of the starting amorphous charcoal [34]. At first, 1 g of charcoal was pulverized with a mortar and 0.5 g of iron chloride hexahydrate (FeCl3·6H2O) were dissolved in water through sonication. After the salt solution was stirred on a heated magnetic plate, the charcoal was dispersed in the solution, and the pH adjusted to 2 with the addition of HCl, see the first photo in Figure S1. The as-prepared solution was then heated up to 60 °C under magnetic stirring and maintained at these conditions for 5 h. After the reaction occurred, the solution was left at room temperature for a week to let water evaporate and then the graphite powder was obtained.
2.3.2. Graphite Oxide Preparation
The chemically synthesized graphite was then treated by means of a modified Hummers’ method [27] in order to oxidize the graphitic planes, hence obtaining graphite oxide (GO). In detail, 1 g of graphite was dispersed in 50 mL of sulfuric acid. The mixture was maintained under magnetic stirring and its temperature lowered below 10 °C through an ice bath. After that, potassium permanganate, 4 g, was added very slowly (20–30 min), since the dissolution of KMnO4 is a highly exothermic process. After the addition of the permanganate, the solution became green, see the second photo in Figure S1. Subsequently, the ice bath was removed and the mixture was kept under magnetic stirring for 1 h. After room temperature was reached, the solution was heated up and kept at around 35 °C for 2 h. During this phase, the exfoliation occurs due to the presence of solution ions that intercalate between the various graphite planes lowering the binding forces between them. After 2 h, 50 mL of distilled water were added to the solution very slowly to increase the temperature until 95 °C. Water brings in the solution further by oxygen groups that complete the oxygenation of the graphite started through the permanganate groups. With the addition of further water, the solution turned from green to pink, see the third photo in Figure S1. The synthesis reaction ended through the addition of 50 mL of water and 20 mL of hydrogen peroxide when temperature dropped below 50 °C. The addition of hydrogen peroxide caused the release of a large quantity of gases in solution, which, due to the removal of all the metal ions, turned to the typical brownish color of graphite oxide, see the last photo in Figure S1. Eventually, the reaction mixture was washed through centrifugation and filtration with abundant bi-distilled water, so as to remove all the excess reagents, the metal salts, and the sulfuric acid bringing back the pH to 7. The final dispersion was centrifuged, the supernatant dried in a stove, leading to the production of solid graphite oxide (GO).
2.3.3. Sonication and Reduction
The reduction of GO to rGO was carried out in water with vitamin C (ascorbic acid), which is an “environmentally friendly” antioxidant [26]. In particular, 1 g of GO was transferred into 100 mL of distilled water, obtaining a good dispersion by firstly adopting an ultrasonic bath (15 min) and then by using an ultrasonic tip (5 min). In this step, the graphite oxide layers were exfoliated and dispersion of rGO in water was produced. Subsequently, the larger particles (i.e., not completely exfoliated graphite oxide and residues of unreacted graphite) were removed from the solution through centrifugation (3 min at 600 rpm) and the supernatant phase was recovered. The yield at this point was of about 30 wt%, which can be increased by reprocessing the heavier separated fractions. This phase is made up of distilled water and graphene oxide (i.e., exfoliated graphite oxide). Afterward, 2 g of vitamin C (20 times the weight of GO) were added to the liquid solution, and the reduction was carried out at 98 °C in an oven for 1 h without stirring in a closed beaker. As a result, a dispersion of rGO in water was obtained. The material was then recovered through filtration and washing, firstly with water to remove the unreacted vitamin C and the reaction byproducts and secondly with ethanol to remove water. Eventually, the as-recovered rGO was dried in an oven at 60 °C and then characterized. Different preparation steps are shown through relative photos, in Figure S2.
2.4. Characterization Techniques
Transmission electron microscopy (TEM) (FEI Tecnai 200 kV electron microscope (Hillsboro, OR, USA) and XRD measurements by a Bruker D8 X-ray diffractometer (Bruker Corporation, Billerica, MA, USA) were used for morphological and structural characterization. SEM images were obtained with a LEO 1525 microscopy (Thornwood, NY, USA).
As for thermogravimetric analysis (TG-DTG) a SDTQ 500 Analyser (TA Instruments, New Castle, DE, USA) was used. The measurements were obtained under flowing air at a 10 K/min heating rate. Raman spectra were recorded with a Renishaw InVia spectrometer (Wotton-under-Edge, UK) at 514 nm wavelength.
2.5. Tribological Tests
Test Description
In the following study, a Ducom TR-BIO-282 tribometer (Groningen, The Netherlands), was adopted. The tested tribopair consists of a lower steel disc flooded in a temperature-controlled lubricant bath and an upper steel ball in reciprocating motion. The upper element of the tribopair is a X45Cr13 polished steel ball (diameter: 6 mm, 52–54 HRC), while the lower element is a X210Cr12 steel disc (thickness: 6 mm, diameter; 25 mm, roughness Ra: 0.30 μm, 60 HRC). A dead weight-based lever system is the source of a contact normal force varying in the range 0–20 N. The average Hertzian pressure measured at the ball/disc interface with a normal load of 19 N is of 1.17 GPa, hence the maximum attainable contact pressure is 1.76 GPa. In order to avoid starvation phenomena, the lubricant bath has a volume of 10 mL, enough to cover the disk. After the temperature reached a constant value, a load was applied. For each test, a new ball and disk were adopted. Tests were performed at both room temperatures and 80 °C, and the lubricant average temperature was maintained constant by the use of a NiCr–Ni thermocouple in the oil reservoir and an electric resistance coupled with a digital controller. The parameters of the sliding motion are the following ones: triangular speed profile with 10 Hz of frequency and 5 mm of stroke. The resulting maximum sliding speed in each stroke reached 240 mm/s, while the average speed was equal to 120 mm/s. A four disks tribometer was also used for a 24 h test at 1500 rpm, Hertzian pressure of 1 GPa, and ambient temperature. The tribological tests were performed in a mixed regime. The error for each obtained value of coefficient of friction and wear scar diameter was calculated as the average error on three experiments.
3. Results and Discussion
3.1. Green Carbon Nanotubes (CNTs) Characterization
The yield of carbon nanotubes was about 55%; the rest of the polymers was practically in gas phase. Figure 1a–d show TEM and SEM images of the nanotubes produced via “green” approach. The images highlight the formation of multiwall carbon nanotubes with a mean external diameter of 20 nm and a mean internal diameter of about 9 nm. The nanotubes have a length of few tens of microns. In particular, the image in Figure 1c at high resolution shows the twisted and less ordered walls of the produced CNT. Figure 1e shows a Raman spectrum of the synthesized sample. From the spectrum, the D band and G band can be clearly detected at 1347 cm−1 and 1588 cm−1, respectively. Furthermore, the ID/IG ratio was also calculated and equals to 0.9. The synthesized nanotubes, mainly as a consequence of the less controlled feed, are characterized, as expected, by a low level of order.
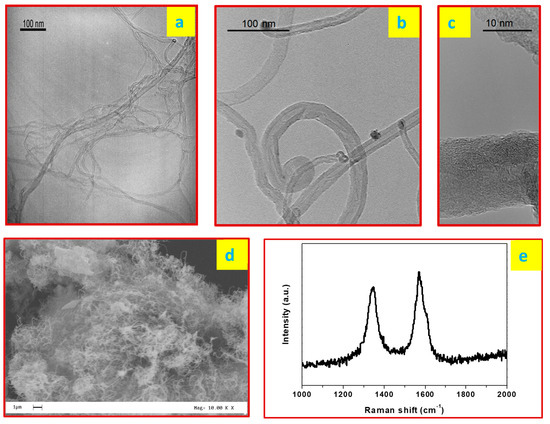
Figure 1.
Typical TEM images (a–c), SEM image (d), typical Raman spectrum (e) of the produced CNTs by catalytic chemical vapor deposition (CCVD).
3.2. Green rGO Characterization
Figure 2a,b show the TG-DTG profiles of the starting charcoal and of the final rGO. As can be seen from the graphs, the thermo-gravimetric profile of rGO, although showing a weight loss located in the same temperature region of charcoal, is sharper and with a DTG peak shifted to a higher temperature, indicating an increased homogeneity and stability for the sample. The lack of residues in the rGO after the test further confirms the successfully occurred removal of impurities.
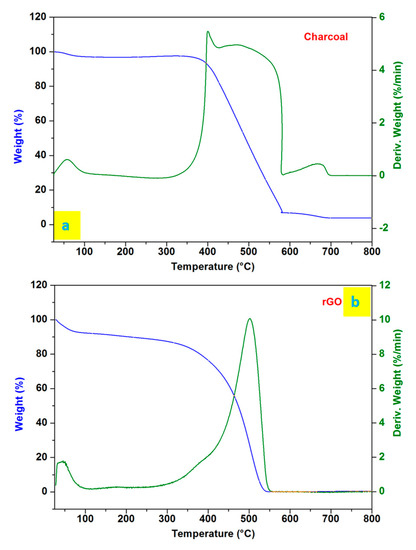
Figure 2.
TG-DTG of charcoal (a) and rGO (b) in air flow.
Figure 3 shows the Raman spectra of the different materials obtained throughout the rGO preparation. These spectra exhibit the typical bands of carbonaceous materials, namely the D band (at about 1350 cm−1), G band (at 1582 cm−1), and 2D band (at about 2700 cm−1) [35,36,37,38,39]. As can be seen from the spectra, all the materials show a certain level of disorder. Moreover, shape, intensity, and positions can be used to distinguish between them [37]. The GO and the rGO spectra show both the G bands slightly shifted towards lower wavelengths and a sharper D band which suggests lower defect concentrations. In Table 2, the positions of the D and G bands are reported for comparison, along with the ratio between the D and G bands intensities. ID/IG ratio is typically used to evaluate carbon materials order. It can be seen that GO and rGO exhibit lower ID/IG ratios, indicative of increased order, while band positions after reduction shift to lower wavelengths, as previously reported [40].
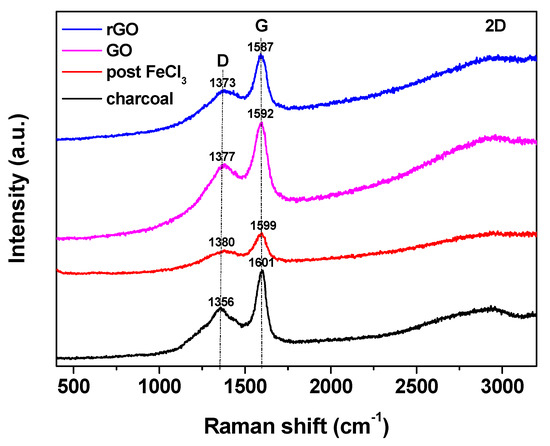
Figure 3.
Comparison of Raman spectra of charcoal (black line), post FeCl3 treatment (red line), graphite oxide (magenta line), and rGO (blue line).
Table 2.
Raman shift band position and ID/IG relative ratio.
Figure 4 shows the XRD spectra of the materials obtained during the several synthesis steps. Firstly, the starting charcoal spectrum exhibits peaks due to graphite, as well as peaks due to different impurities: in particular, the peaks at around 29.8°, 39.8° and 48.9° are ascribed to the treatment with calcite which charcoal underwent during its production process [41]. The material spectrum after the FeCl3 treatment has a peak around 26°, i.e., the reference peak of graphitic materials, confirming the presence of a graphite-like structure. Furthermore, the peak after 40° indicates the partially ordered structure of the material. After being treated with the modified Hummers’ method, GO exhibits a typical peak around 13° due to the functionalization and intercalation with water and a further peak at 23°, which is slightly lower than the typical angles of the graphitic materials, due to a partial functionalization. Finally, the rGO spectrum suggests how the reduction process led to a more ordered material, with the graphene planes closer to each other compared to those of GO. The 13° peak disappeared, whereas the 23° peak became weaker and shifted to ~26°. A broad peak above 40° can be also seen, indicating a good level of planes order. Furthermore, a comparison between the peaks intensity ratios at about 26° and 41° suggests the occurred exfoliation. Indeed, a reduced intensity of the (002) peak is expected for thinner material.
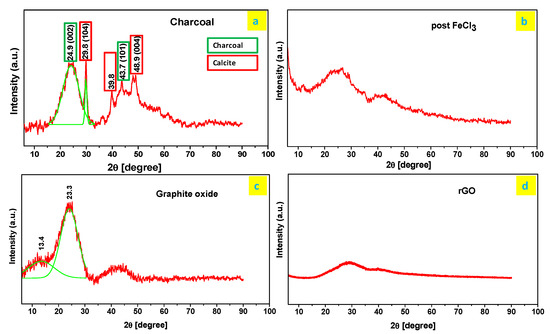
Figure 4.
XRD spectra of: charcoal (a), post FeCl3 treatment (b), graphite oxide (c), and rGO (d), respectively.
By means of the Scherrer equation, the average number of planes is calculated to be six. In particular, TEM images, Figure 5, allow evaluating the distribution of the number of sheets in the sample. rGO is mainly thin with a maximum of 10 layers; a small fraction, as typically occurs also starting from other more ordered sources, has a number of layer higher than 12.
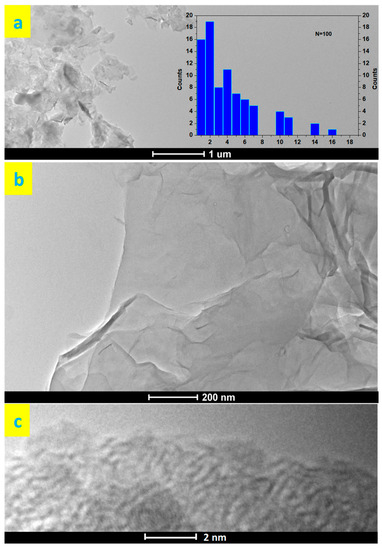
Figure 5.
TEM images of rGO at different magnifications (a–c); lowoal (a), rGO (b) and relative histogram of number of layers per sheets distribution, insert in (a).
3.3. Lubricant Preparation and Stability Dispersion Tests
In Table 3, the evaluated A ratio values were reported for the rGO sample at 0.05 wt% in SYNPLUS and at three different concentrations (0.05, 0.1, 1 wt%) in the same base oil with the additional use of dispersant/surfactants. A ratios values for CNTs were low because of the difficulty to disperse them, likely due to the intense van deer Waals forces between CNT surfaces not disturbed by the residual functional group as in rGO. Moreover, the CNT aspect ratio and the degree of entanglement further affect dispersion. Therefore, only data related to rGO are reported in the Table.
Table 3.
Stability of surfactant/dispersant assisted and free formulations.
Firstly, it can be observed that the samples disperse worse in 1,8-diaminonaphthalene than in SDBS and this is due to the stronger electric interactions of the ionic surfactant with the rGO nanosheets compared to the non-ionic one. On the other hand, it can be seen that the best dispersion was obtained in the SDBS-Tween 80 mixture, as well as in the commercial dispersant. Apart from the results obtained with the commercial dispersant, which is specifically designed for the dispersion of nanocarbons, the good dispersion achieved with the mixture SDBS-Tween 80 can be ascribed to a synergistic effect generated by the co-presence around the graphene nanosheets of both the dispersants. Indeed, by mixing SDBS and Tween 80, the strong electrostatic self-repulsions of the former and the steric self-repulsions of the latter decrease due to coexistence around the nanoparticle of both species. At the same time, ion-dipole attractions and Van der Waals forces between the hydrophilic groups of both the surfactants also contribute to strengthening the dispersion [42,43,44,45,46]. It is worth noticing that the A ratio for rGO in SDBS and Tween 80 at 0.1 wt%, as evaluated after a longer time centrifugation of 2 h, results still equal to 0.87.
3.4. Tribological Characterization
Table 4 summarizes the reductions of Coefficient of Friction (CoF) and Wear Scar Diameter (WSD) measured for the green rGO dispersed in SYNPLUS at three concentrations (0.05, 0.1, and 1 wt%), at ambient temperature. As can be seen from the Table, the green rGO dispersed at 0.1 wt% in the SDBS-Tween 80 mixture exhibits the highest reduction of both friction coefficient and WSD, 18% and 15%, respectively.
Table 4.
Mean coefficient of friction (COF) (%) and wear scar diameter reduction (%) for different formulations during 160 min of the test in a mixed regime.
Values at 80 °C were also evaluated. At this temperature, the CoF and WSD reductions are of 12% and 13%, for both friction coefficient and WSD, respectively, at an optimum concentration of 0.1 wt%, confirming the role of the additives, which at higher temperatures are the main responsible for lubrication, precipitating on the metal surfaces in contact by protecting them.
Furthermore, it is worth noticing that the surfactants were not able to significantly modify the oil behavior.
In Figure 6a,b the wear scar diameter percentage reduction and the friction coefficient for 0.1 wt% rGO and 0.1 wt% CNT in SYNPLUS with SDBS and Tween 80 surfactants, and, for 0.1 wt% rGO in EUBUSH were reported for comparison.
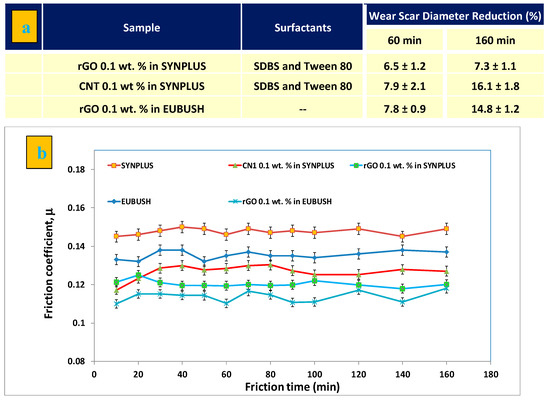
Figure 6.
Wear scar diameter reduction % (a) and evolution under friction time increase of friction coefficient (b). SYNPLUS and EUBUSH alone; rGO and CNT at 0.1 wt% in SYNPLUS + SDBS + Tween 80 surfactant; rGO at 0.1 wt% in EUBUSH.
The addition of CNTs, which disperse worse due to the difficult disaggregation of formed bundles and the presence of van der Waals interactions between them, determines a smaller reduction when compared with the rGO sample, even though, also in this case, the friction profile of the lubricant is low dependant on time, i.e., stability for the entire test, suggesting shear-induced exfoliation [47].
Moreover, wear and friction reduction in EUBUSH are quite similar to those observed in SYNPLUS, thus highlighting the role of the nano-additives.
Up to this point, it has been observed that nanocarbons produced by “green” syntheses, i.e., starting from wastes and with the highest number of steps involving non-harmful substances, such as ascorbic acid adopted for reduction, exhibit physico-chemical characteristics very similar to the ones of materials produced through more traditional methods and from pure sources and are able to guarantee reduction of friction and wear. It is worth noticing, that the main characteristic which distinguishes these materials from those produced by traditional processes is their reduced level of order, allowing increased exfoliation and fragmentation. On the other hand, this can be an intrinsic advantage, since effective lubrication requires nanomaterials able to form, through an uninterrupted supply to the contact surfaces [48], tribofilms, and this is more favoured by smaller nanoparticles guaranteeing easier access to the sliding surfaces. In detail, in Figure S3, photos of the 4 disk tribometer are shown, evidencing the presence of fouling, clearly attributable to graphene sheets (indicated by the red arrow in the Figure), after a test of 24 h carried out in the presence of SYNPLUS + SDBS + Tween 80 + rGO at 0.1 wt%. In this case, rGO obtained by reduction of expanded graphite [49] was used. This observation demonstrates the difficulty related to the use of more ordered graphene whose thicker and greatly ordered fractions probably fail to exfoliate on the surfaces in contact. With this rGO, in the same operating conditions of the tests shown in Figure 6, friction and wear reductions, in the mixed regime in which the measurements were preformed, were lower than in the presence of rGO obtained in this study and equal to 12% and 11% after 160 min, respectively. It is worth noticing that no fouling was detected after the test performed in the same operating conditions but with the rGO obtained in this study.
Finally, in Figure 7a photos of the satellite wheel and planetary wheel after contact in the presence of SYNPLUS + SDBS + Tween 80 + rGO at 0.1 wt%, are shown. The typical Raman spectra recovered by scanning the wheels after tribological test (Figure 7b,c) evidence the presence of nanocarbons and suggest the formation of a tribofilm. Moreover, as further confirmation, the Raman spectrum recorded on the planetary wheel, after cleaning with acetone and hexane to remove any deposit (Figure 7d) shows no peaks.
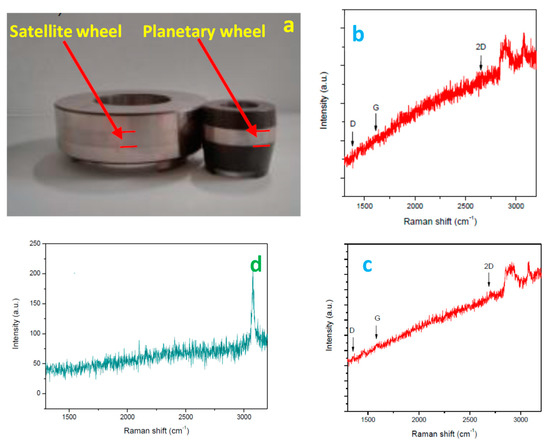
Figure 7.
Photo of the wheels after a test of 24 h in the presence of SYNPLUS + SDBS + Tween 80 + rGO at 0.1 wt% (a). Raman spectra on the wheels after test (b,c). Raman spectrum on the planetary wheel after cleaning in acetone and hexane (d).
4. Conclusions
In summary, green carbon nanotubes and green rGO have been successfully synthesized through simple, sustainable, and scalable methods starting from recycled plastic and charcoal, respectively, and with the highest number of steps involving non-harmful substances. Microscopy images highlight the formation of multiwall carbon nanotubes with an average external diameter of 20 nm and an average internal diameter of 9 nm. The synthesized nanotubes have a few dozen microns length and are well-formed. On the other hand, as a consequence of the less feed control, they are characterized by a low level of order. In particular, Raman and XRD spectra indicate the formation of rGO with a low level of order, also if compared with typical literature results, e.g., rGO obtained from expanded graphite. TEM images allow evaluating the distribution of the number of sheets in the sample. rGO is mainly thin with a maximum of 10 layers, while only a small fraction has a number of layer higher than 12. The produced nanomaterials are suitable to reduce friction and wear when added to the base oil.
In conclusion, this study demonstrates that nanocarbons produced by “green” syntheses, i.e., starting from wastes and with the highest number of steps involving non-harmful substances (e.g., use of ascorbic acid for reduction), have physico-chemical characteristics very similar to those of materials produced by traditional methods and from pure sources and are able to reduce friction and wear.
In particular, their less ordered nature is probably the fundamental aspect that allows good performances during exfoliation and covering of the surfaces in contact, even in the presence of heavier fractions, which are, in general, difficult to be avoided.
Supplementary Materials
The following are available online at https://www.mdpi.com/2075-4442/8/2/13/s1, Figure S1: Photos of different synthesis steps, Figure S2: Photos of: GO dispersion in water (a), rGO precipitates in water (b), Figure S3: Photo of a tribometer 4 disk, clean before lubrication (a); and, after test of 24 h, in the presence of SYNPLUS 75W-90 + SDBS + Tween 80 + few-layer graphene at 0.1 wt% (b).
Author Contributions
Methodology, M.S. and A.S.; validation, C.C.; formal analysis, C.C.; data curation, D.S.; writing—original draft preparation, D.S. and C.C.; writing—review and editing, M.S. and D.S.; supervision, M.S. and A.S.; funding acquisition, M.S. and A.S. All authors have read and agreed to the published version of the manuscript.
Funding
This research was supported by the National Operative Programme for Companies and Competitiveness 2014−2020—Horizon 2020, funded by the European Union (Rilub SPA, project leader. Project n. F/050190/01-02/x32—INNOLUBE—“Introduzione di nanotecnologie e materiali avanzati nel settore industrial delle trasmissioni meccaniche di potenza e, in particolare, dei lubrificanti per gli ingranaggi”/”Introduction of nanotechnologies and advanced materials in the industrial sector of mechanical power transmissions and, in particular, of gear lubricants”) and by “PON01_01750—MIUR—National Operative Programme for Research and Competitiveness 2007−2013” Regioni Convergenza “Advanced components for the reduction of frictional resistance”/”Componenti avanzati per la riduzione della resistenza all’avanzamento” funded by MIUR—Italian Ministry for Education, University and Research.
Conflicts of Interest
The authors declare no conflict of interest.
References
- Goyan, R.L.; Melley, R.E.; Wissner, P.A.; Ong, W.C. Biodegradable lubricants. Lubr. Eng. 1998, 54, 10. [Google Scholar]
- Zeng, X.; Li, J.; Wu, X.; Ren, T.; Liu, W. The Tribological Behaviors of Hydroxyl-containing Dithiocarbamate-triazine Derivatives as Additives in Rapeseed Oil. Tribol. Int. 2007, 40, 560–566. [Google Scholar] [CrossRef]
- Spikes, H. Additive-additive and additive-surface interactions in lubrication. Lubr. Sci. 1989, 2, 3–23. [Google Scholar] [CrossRef]
- Hamblin, P.; Kristen, U.; Chasan, D. Ashless antioxidants, copper deactivators and corrosion inhibitors: Their use in lubricating oils. Lubr. Sci. 1990, 2, 287–318. [Google Scholar] [CrossRef]
- Ingole, S.; Charanpahari, A.; Kakade, A.; Umare, S.S.; Bhatt, D.V.; Menghani, J. Tribological behavior of nano TiO2 as an additive in base oil. Wear 2013, 301, 776–785. [Google Scholar] [CrossRef]
- Ghalme, S.; Bhalerao, Y.J. Application of Nanoparticles as Additive for Lubricant Nano-Materials in Tribology. Recent Pat. Mater. Sci. 2017, 10, 88–96. [Google Scholar] [CrossRef]
- Tao, X.; Jiazheng, Z.; Kang, X. The ball-bearing effect of diamond nanoparticles as an oil additive. J. Phys. D 1993, 29, 2932–2937. [Google Scholar] [CrossRef]
- Shen, M.; Luo, J.; Wen, S. The tribological properties of oils added with diamond nanoparticles. Tribol. Trans. 2001, 44, 494–498. [Google Scholar] [CrossRef]
- Grierson, D.S.; Carpick, R.W. Nanotribology of carbon-based materials. Nano Today 2007, 2, 12–21. [Google Scholar] [CrossRef]
- Gong, Z.; Shi, J.; Zhang, B.; Zhang, J. Graphene nano scrolls responding to superlow friction of amorphous carbon. Carbon 2017, 116, 310–317. [Google Scholar] [CrossRef]
- Li, X.; Xu, X.; Zhou, Y.; Lee, K.R.; Wang, A. Insights into friction dependence of carbon nanoparticles as oil-based lubricant additive at amorphous carbon interface. Carbon 2019, 150, 465–474. [Google Scholar] [CrossRef]
- Rui, L. Tribological behaviour of multi-walled carbon nanotube films. AIP Adv. 2014, 4, 031309. [Google Scholar] [CrossRef]
- Chebattina, K.R.R.; Srinivas, V.; Rao, N.M. Effect of Size of Multiwalled Carbon Nanotubes Dispersed in Gear Oils for Improvement of Tribological Properties. Adv. Tribol. 2018, 2018, 2328108. [Google Scholar] [CrossRef]
- Bhaumik, S.; Prabhu, S.; Singh, K.J. Analysis of Tribological Behavior of Carbon Nanotube Based Industrial Mineral Gear Oil 250 cSt Viscosity. Adv. Tribol. 2014, 2014, 341365. [Google Scholar] [CrossRef]
- Cornelio, J.A.C.; Cuervo, P.A.; Hoyos-Palacio, L.M.; Lara-Romero, J.; Toro, A. Tribological properties of Carbon Nanotubes as lubricant additive in oil and water for a wheel-rail system. J. Mater. Res. Technol. 2016, 5, 68–76. [Google Scholar] [CrossRef]
- Joly-Pottuz, L.; Dassenoy, F.; Vacher, B.; Martin, J.M.; Mieno, T. Ultralow friction and wear behaviour of Ni/Y-based single wall carbon nanotubes (SWNTs). Tribol. Int. 2004, 37, 1013–1018. [Google Scholar] [CrossRef]
- Berman, D.; Erdemir, A.; Sumant, A.V. Graphene: A new emerging lubricant. Mater. Today 2014, 17, 31–42. [Google Scholar] [CrossRef]
- Shahnazar, S.; Bagheri, S.; Hamid, S.B.A. Enhancing lubricant properties by nanoparticle additives. Int. J. Hydrog. Energy 2016, 41, 3153–3170. [Google Scholar] [CrossRef]
- Guo, Y.B.; Zhang, S.W. The Tribological Properties of Multi-Layered Graphene as Additives of PAO2 Oil in Steel–Steel Contacts. Lubricants 2016, 4, 30. [Google Scholar] [CrossRef]
- He, Z.B.; Maurice, J.L.; Lee, C.S.; Cojocaru, C.S.; Pribat, D. Nickel catalyst faceting in plasma-enhanced direct current chemical vapor deposition of carbon nanofibers. Arabian J. Sci. Eng. Sect. B 2010, 35, 19–28. [Google Scholar]
- Andrews, R.; Jacques, D.; Rao, A.M. Continuous production of aligned carbon nanotubes: A step closer to commercial realization. Chem. Phys. Lett. 1999, 303, 467–474. [Google Scholar] [CrossRef]
- Dasgupta, K.; Veugopalan, R.; Dey, G.K.; Sathiyamoorthy, D. Novel catalytic route to bulk production of high purity carbon nanotubes. J. Nanopart. Res. 2008, 10, 69–76. [Google Scholar] [CrossRef]
- Zhang, Q.; Huang, J.Q.; Zhao, M.Q.; Qian, W.Z.; Wei, F. Carbon nanotube mass production: Principles and processes. Chem. Sus. Chem. 2011, 4, 864–889. [Google Scholar] [CrossRef]
- D’Ambrières, W. Plastics recycling worldwide: Current overview and desirable changes. Field Actions Sci. Rep. 2019, 19, 12–21. [Google Scholar]
- Stankovich, S.; Dikin, D.A.; Piner, R.D.; Kohlhaas, K.A.; Kleinhammes, A.; Jia, Y.; Nguyen, S.T.; Ruoff, R.S. Synthesis of Graphene-Based Nanosheets via Chemical Reduction of Exfoliated Graphite Oxide. Carbon 2007, 45, 1558–1565. [Google Scholar] [CrossRef]
- Paredes, J.I.; Villar-Rodil, S.; Fernández-Merino, M.J.; Guardia, L.; Martínez-Alonso, A.; Tascón, J.M.D. Environmentally Friendly Approaches Toward the Mass Production of Processable Graphene from Graphite Oxide. J. Mater. Chem. 2011, 21, 298–306. [Google Scholar] [CrossRef]
- Casa, M.; Sarno, M.; Liguori, R.; Cirillo, C.; Rubino, A.; Bezzeccheri, E.; Liu, J.; Ciambelli, P. Conductive Adhesive Based on Mussel-Inspired Graphene Decoration with Silver Nanoparticles. J. Nanosci. Nanotechnol. 2018, 18, 1176–1185. [Google Scholar] [CrossRef] [PubMed]
- Gao, J.; Liu, F.; Liu, Y.; Ma, N.; Wang, Z.; Zhang, X. Environment-Friendly Method to Produce Graphene that Employs Vitamin C and Amino Acid. Chem. Mater. 2010, 22, 2213–2218. [Google Scholar]
- Thorenz, A.; Wietschel, L.; Stindt, D.; Tuma, A. Assessment of agroforestry residue potentials for the bioeconomy in the European Union. J. Clean. Prod. 2018, 176, 348–359. [Google Scholar] [CrossRef]
- Akhavan, O.; Bijanzad, K.; Mirsepah, A. Synthesis of graphene from natural and industrial carbonaceous wastes. RSC Adv. 2014, 4, 20441–20448. [Google Scholar] [CrossRef]
- Sarno, M.; Sannino, D.; Leone, C.; Ciambelli, P. Evaluating the effects of operating conditions on the quantity, quality and catalyzed growth mechanisms of CNTs. J. Mol. Catal. Chem. 2012, 357, 26–38. [Google Scholar] [CrossRef]
- Ciambelli, P.; Sannino, D.; Sarno, M.; Fonseca, A.; Nagy, J.B. Hydrocarbon decomposition in alumina membrane: An effective way to produce carbon nanotubes bundles. J. Nanosci. Nanotechnol. 2004, 4, 779–787. [Google Scholar] [CrossRef] [PubMed]
- Altavilla, C.; Sarno, M.; Ciambelli, P.; Senatore, A.; Petrone, V. New ‘chimie douce’ approach to the synthesis of hybrid nanosheets of MoS2 on CNT and their anti-friction and anti-wear properties. Nanotechnology 2013, 24, 125601. [Google Scholar] [CrossRef] [PubMed]
- Buseck, P.R.; Beyssac, O. From Organic Matter to Graphite: Graphitization. Elements 2014, 10, 421–426. [Google Scholar] [CrossRef]
- Casiraghi, C.; Ferrari, A.C.; Robertson, J. Raman Spectroscopy of hydrogenated amorphous carbons. Phys. Rev. B 2005, 72, 085401. [Google Scholar] [CrossRef]
- Malard, L.M.; Pimenta, M.A.; Dresselhaus, G.; Dresselhaus, M.S. Raman Spectroscopy in graphene. Phys. Rep. 2009, 473, 51–87. [Google Scholar] [CrossRef]
- Ferrari, A.C. Raman spectroscopy of graphene and graphite: Disorder, electron–phonon coupling, doping and nonadiabatic effects. Solid State Commun. 2007, 143, 47–57. [Google Scholar] [CrossRef]
- Sarno, M.; Cirillo, C.; Ciambelli, P. Selective graphene covering of monodispersed magnetic nanoparticles. Chem. Eng. J. 2014, 246, 27–38. [Google Scholar] [CrossRef]
- Sarno, M.; Cirillo, C.; Scudieri, C.; Polichetti, M.; Ciambelli, P. Electrochemical Applications of Magnetic Core−Shell Graphene Coated FeCo Nanoparticles. Ind. Eng. Chem. Res. 2016, 55, 3157–3166. [Google Scholar] [CrossRef]
- Johra, F.T.; Lee, J.W.; Jung, W.G. Facile and safe graphene preparation on solution based platform. Ind. Eng. Chem. Res. 2014, 20, 2883–2887. [Google Scholar] [CrossRef]
- Chia, C.H.; Joseph, S.D.; Rawal, A.; Linser, R.; Hook, J.M.; Munroe, P. Microstructural characterization of white charcoal. J. Anal. Appl. Pyrolysis 2014, 109, 215–221. [Google Scholar] [CrossRef]
- Bera, A.; Ojha, K.; Mandal, A. Synergistic Effect of Mixed Surfactant Systems on Foam Behavior and Surface Tension. J. Surfactants Deterg. 2013, 16, 621–630. [Google Scholar] [CrossRef]
- Mohammad, D.E.; Negm, N.A.; Mishrif, M.R. Micellization and Interfacial Interaction Behaviors of Gemini Cationic Surfactants–CTAB Mixed Surfactant Systems. J. Surfactants Deterg. 2013, 16, 723–731. [Google Scholar] [CrossRef]
- Zhang, M.; Zhu, L. Effect of SDBS–Tween 80 mixed surfactants on the distribution of polycyclic aromatic hydrocarbons in soil–water system. J. Soil. Sediment. 2010, 10, 1123–1130. [Google Scholar] [CrossRef]
- Rosen, M.J. Molecular interaction and synergism in binary mixtures of surfactants. ACS Symp. Ser. 1986, 311, 144–162. [Google Scholar]
- Holland, M.; Rubingh, D.N. Mixed surfactants systems. ACS Symp. Ser. 1992, 50, 2–30. [Google Scholar]
- Kałużny, J.; Merkisz-Guranowska, A.; Giersig, M.; Kempa, K. Lubricating Performance Of Carbon Nanotubes In Internal Combustion Engines—Engine Test Results For CNT Enriched Oil. Int. J. Automot. Technol. 2017, 18, 1047–1059. [Google Scholar] [CrossRef]
- Berman, D.; Erdemir, A.; Sumant, A.V. Few layer graphene to reduce wear and friction on sliding steel surfaces. Carbon 2013, 54, 454–459. [Google Scholar] [CrossRef]
- Sarno, M.; Casa, M. Green and one-step synthesis for Ag/graphene hybrid supercapacitor with remarkable performance. J. Phys. Chem. Solids 2018, 120, 241–249. [Google Scholar] [CrossRef]


© 2020 by the authors. Licensee MDPI, Basel, Switzerland. This article is an open access article distributed under the terms and conditions of the Creative Commons Attribution (CC BY) license (http://creativecommons.org/licenses/by/4.0/).