Article

Development and Characterization of Multi-Scale Carbon Reinforced PPS Composites for Tribological Applications

Division of Machine Elements, Department of Engineering Sciences and Mathematics, Luleå University of Technology, 97187 Luleå, Sweden
*
Author to whom correspondence should be addressed.
Lubricants 2019, 7(4), 34; https://doi.org/10.3390/lubricants7040034
Submission received: 29 March 2019 / Revised: 6 April 2019 / Accepted: 8 April 2019 / Published: 10 April 2019

Abstract

:
Polymer-based materials show to be of increasing interest in replacing metal based materials in tribological applications due to their low weight, cost and easy manufacturability. To further reduce the environmental impact of these bearing materials recyclability is becoming more crucial, stimulating the need for high performing thermoplastic materials. In this study, polyphenylene sulfide (PPS) composites were prepared in an effort to enhance its tribological properties. Short carbon fibres (SCFs), graphene oxide (GO) and nano diamonds (NDs) as well as polytetrafluoroethylene (PTFE) were used as micro and nano reinforcements. The addition of SCFs especially decreased the linear coefficient of thermal expansions while enhancing the micro hardness and wettability of the polymer. Under water lubricated conditions, a decrease in friction up to 56% and a reduction of wear rate in the order of 103 was observed by the addition of SCF. The reduction in friction and wear was further enhanced by the addition of NDs, providing a synergistic effect of the reinforcements in micro and nano scale. By testing the individual reinforcements under dry conditions, PTFE and SCFs were especially effective in reducing friction while the release and consequent abrasion of NDs and SCFs increased the wear under a higher contact pressure.

Graphical Abstract

1. Introduction

Polymer based materials (PBMs) show to be of increasing interest in replacing metal-based materials due to their low weight, ease of manufacturing and low costs [1,2]. Also in the tribological industry, this trend is clearly visible with PBMs used in bushes and bearings [3]. To reduce the environmental impact of bearing materials, recyclability is of increasing importance which stimulates the need for high performing thermoplastic materials. The high wear rate of common polymers does, however, significantly limit the utilization of these materials to low load and speed applications [4]. Engineering thermoplastics such as polyphenylene sulfide (PPS), show to be promising materials for use in tribological applications. PPS is a high-performance semi-crystalline thermoplastic, extensively used in the automotive and aerospace industry due to its strength, high service temperature, chemical inertness as well as its low linear coefficient of thermal expansion [5,6]. The polymer is suitable for high demanding tribological applications given that its tribological properties are further improved [5]. A common approach to improve the tribological properties of a polymer, is by means of adding reinforcements or fillers. This makes it possible to alter and reinforce the mechanical properties and reduce both friction and wear [7].
Previously published research has indicated that the addition of short carbon fibers (SCFs) to PPS induces a reduction in specific wear rate and friction coefficient [5,7,8,9,10]. The use of nano reinforcements such as nano diamonds (NDs) and graphene oxide (GO) have also resulted in improved tribological properties for various polymers [11,12,13,14], both when used as sole reinforcement or in combination with more conventional reinforcements such as SCFs [15]. Aside of need to improve the tribological characteristics of PPS, the polymer is also known to be rather brittle polymer as given by its low fracture toughness [16]. Especially under higher demanding tribological conditions, an increased toughness may be required to prevent fracture of the bearing material. The addition of SCFs is known to increase the fracture toughness of PPS [17]. To further increase the fracture toughness while increasing the ability to form transfer films under sliding conditions, the addition of Polytetrafluorethylene (PTFE) to PPS has proved to be effective [10]. PTFE is a well known polymer with exceptional tribological properties and a higher fracture toughness than PPS [18,19].
This aims of this work is to improve the tribological properties of PPS by the addition of the above mentioned carbon based reinforcements. Both micro- and nano-scale reinforcements were used in the form of SCFs, GO and NDs. Furthermore PTFE was blended with PPS to reduce its brittle behaviour and improve the self-lubricity. The acquired composites were then tested to determine several bulk and surface properties. Furthermore, the tribological properties were determined under different loading and lubrication conditions.

2. Materials and Methods

2.1. Sample Preparation

The preparation and characterization of the composites was performed in two separate series. The test specimen were prepared with the reinforcements and percentages as presented in Table 1. The initial series was used to determine the effect of the different reinforcements on the tribological characteristics of PPS with a focus on synergistic effects of the used reinforcements. For this first series, the composites exclusively reinforced with nano-scale reinforcements contained 1% of the individual reinforcements. The multi-scale reinforced composites contained both 10% SCF and 0.5% of the individual nano scale reinforcements. The second series utilized the best performing reinforcements of the first series as well as the addition of PTFE. This series focused on determining the tribological performance of the composites at different loads and under dry and water lubricated conditions. For this latter series, no reinforcements were combined to create a better understanding of the individual effect of the used reinforcements.
Pure PPS powder with a molecular weight of M n ∼ 10,000 was supplied by Sigma–Aldrich Co., Stockholm, Sweden). Detonation nano diamonds with an average particle size of 4–5 nm were utilized from Adámas Nanotechnologies Inc. (Raleigh, NC, USA). The used GO particles were produced by NanoInnova Technologies, Madrid, Spain) with a sheet thickness of 0.7–1.2 nm and a lateral length of 3–7 nm. Milled SCFs (Teijin Carbon Europe GmbH, Wuppertal, Germany) were used with a length and diameter of 100 μ m and 7 μ m , respectively. PTFE powder was furthermore procured from Sigma–Aldrich Co. with an average particle size of 30 μ m .
The nano reinforcements were exfoliated in ethanol before the PPS was added and dispersed. The mixture was consequently ball milled using a PM 100 planetary ball mill (Retsch, Haan, Germany) at 400 rpm for 120 min to enhance the dispersion and distribution of the reinforcements. The slurry was oven dried at 160 C for 24 h. In order to blend SCFs and PTFE in the acquired powder without losing any mechanical integrity, the constituents were later added and ball milled at a lower rotational speed of 100 rpm for five minutes. The blended powders were then consolidated by means of a MiniJet Pro injection moulder (Haake, Karlsruhe, Germany).

2.2. Characterization Methods

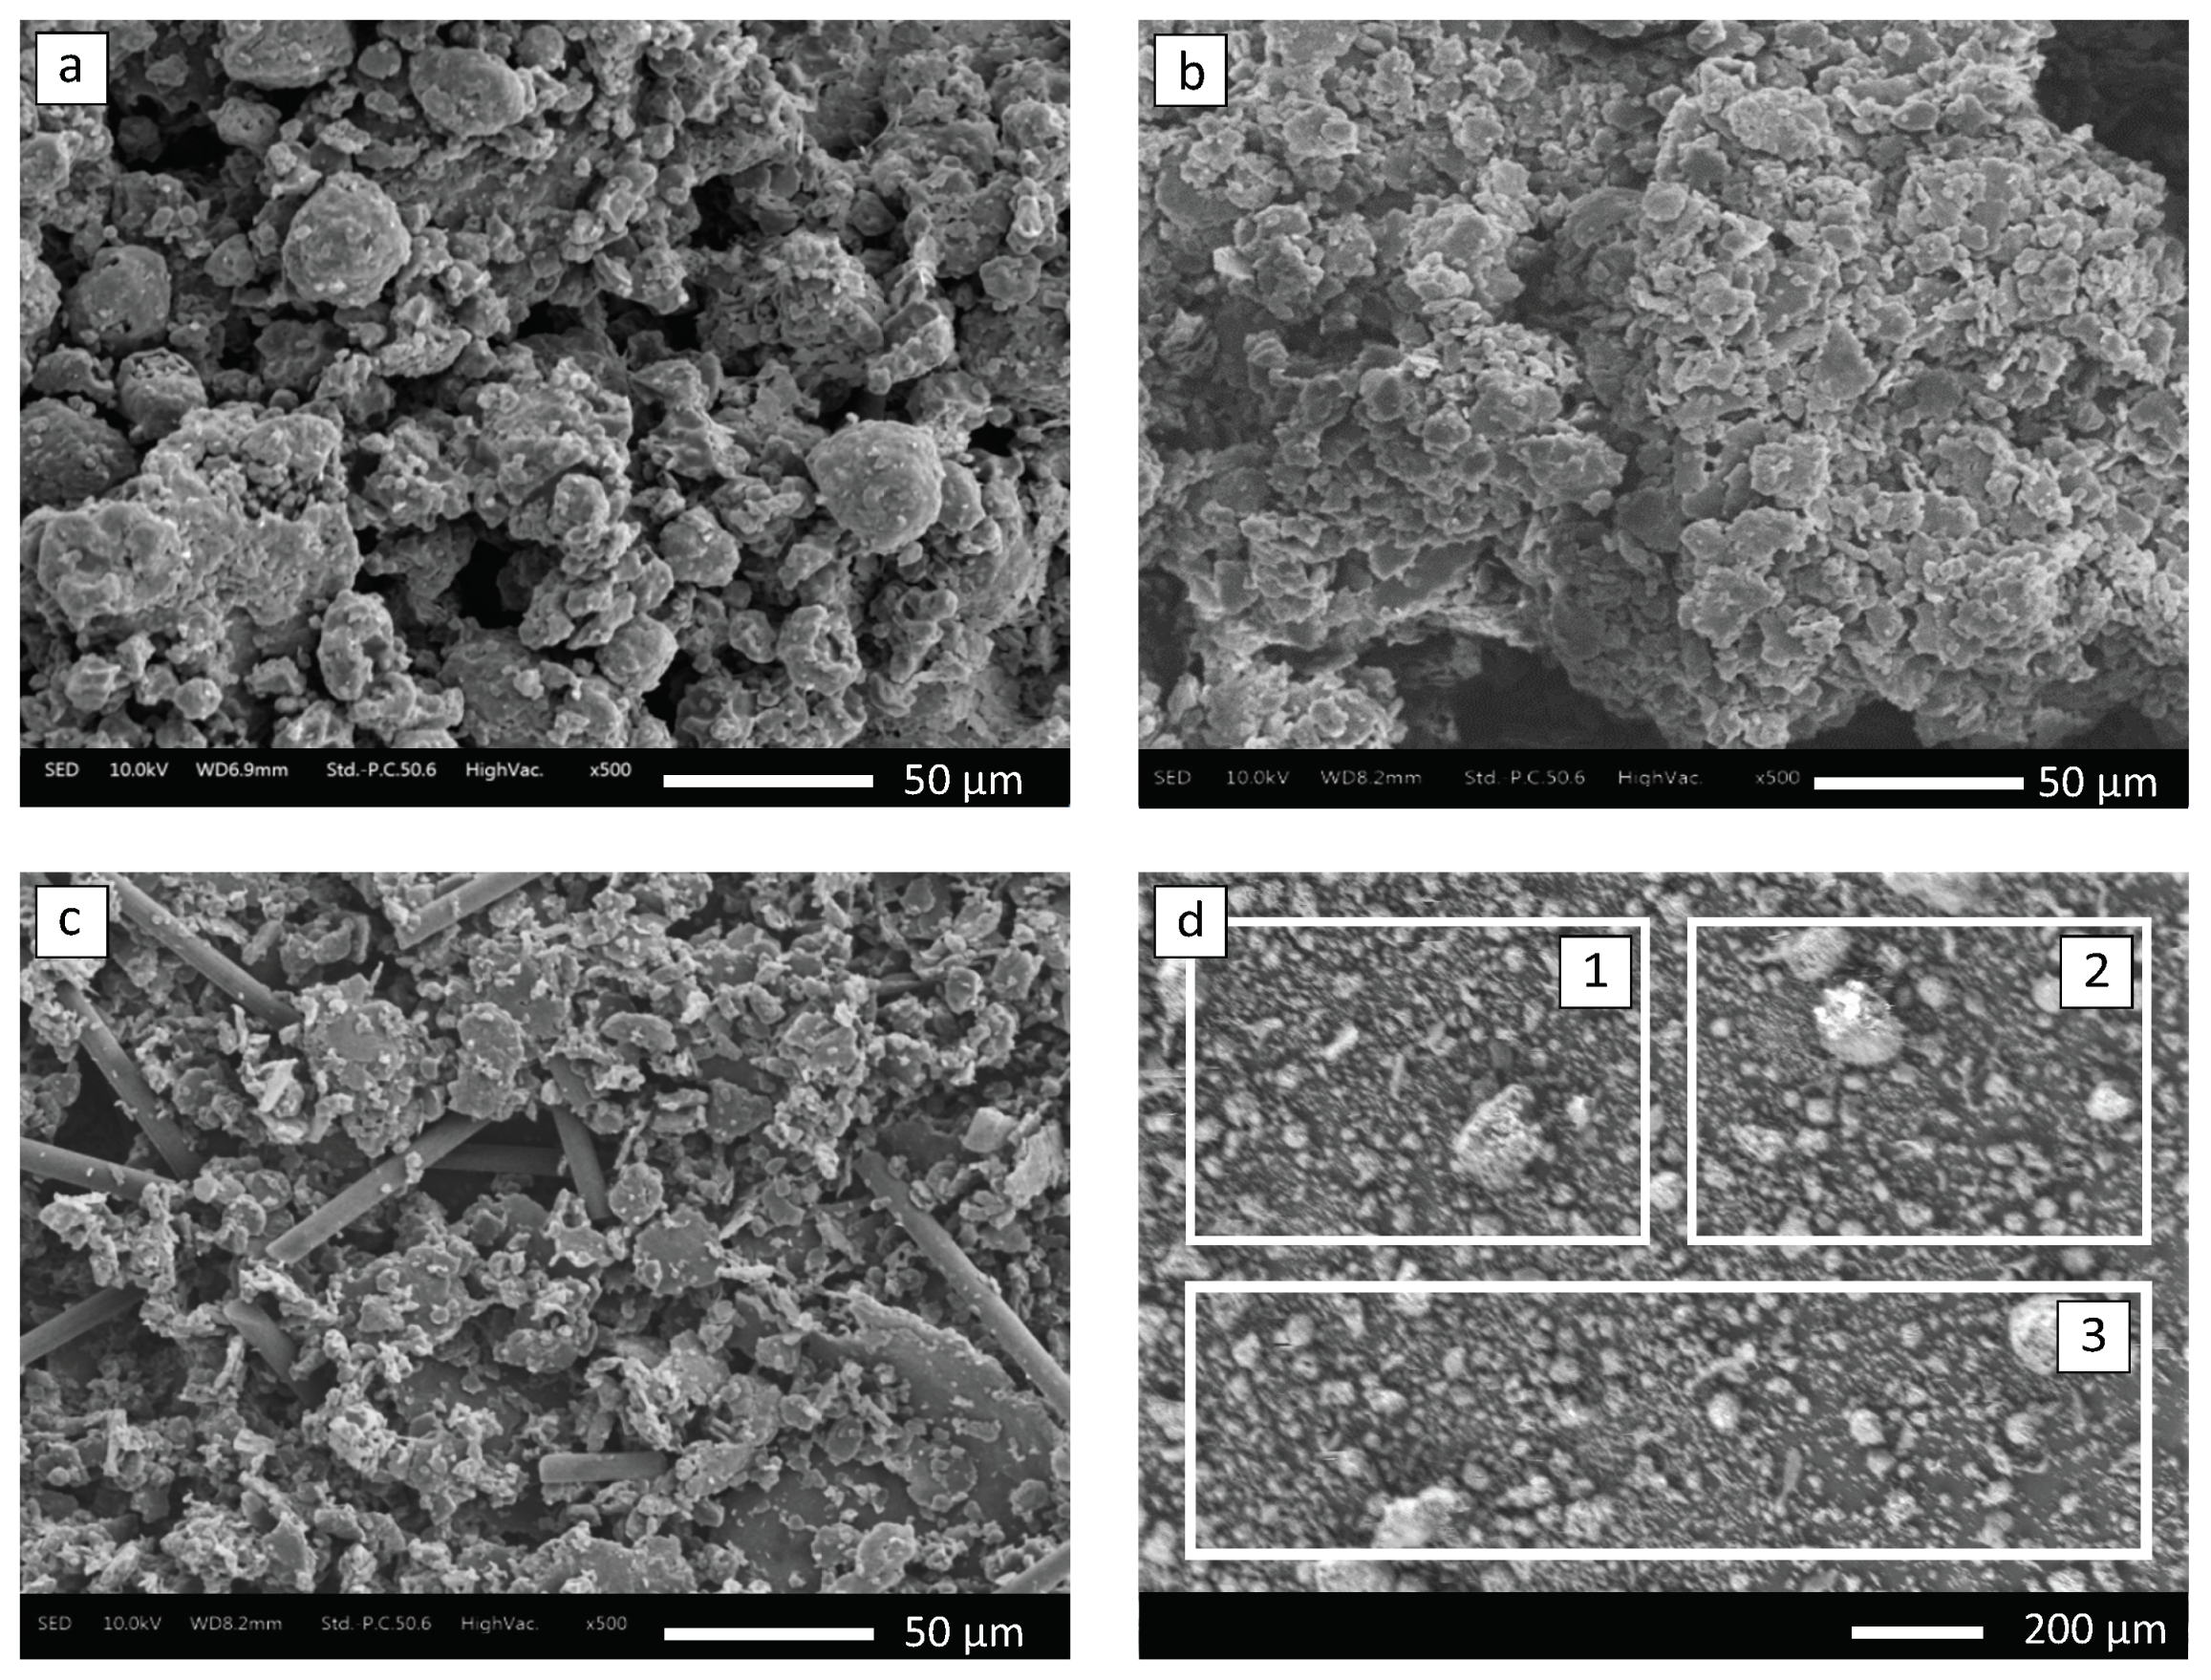
2.2.1. Morphological Characterization

The morphology of the polymer powder provides valuable information on the effect of the used processes on the polymer matrix integrity and the distribution of used reinforcements. By analyzing the powder before and after the manufacturing processes, adverse effects of the used processes may be identified. It is furthermore possible to identify agglomerations in reinforcements as well as the dispersion of the used reinforcements throughout the matrix. The powder was deposited on a conductive adhesive and analyzed using a JCM 6000 scanning electron microscope (JEOL, Peabody, MA, State, USA). Energy dispersive X-ray spectroscopy (EDS) was used to analyze the elemental composition (fluorine, sulphur and carbon) of the PTFE blended PPS and determine the degree of dispersion of the PTFE powder.

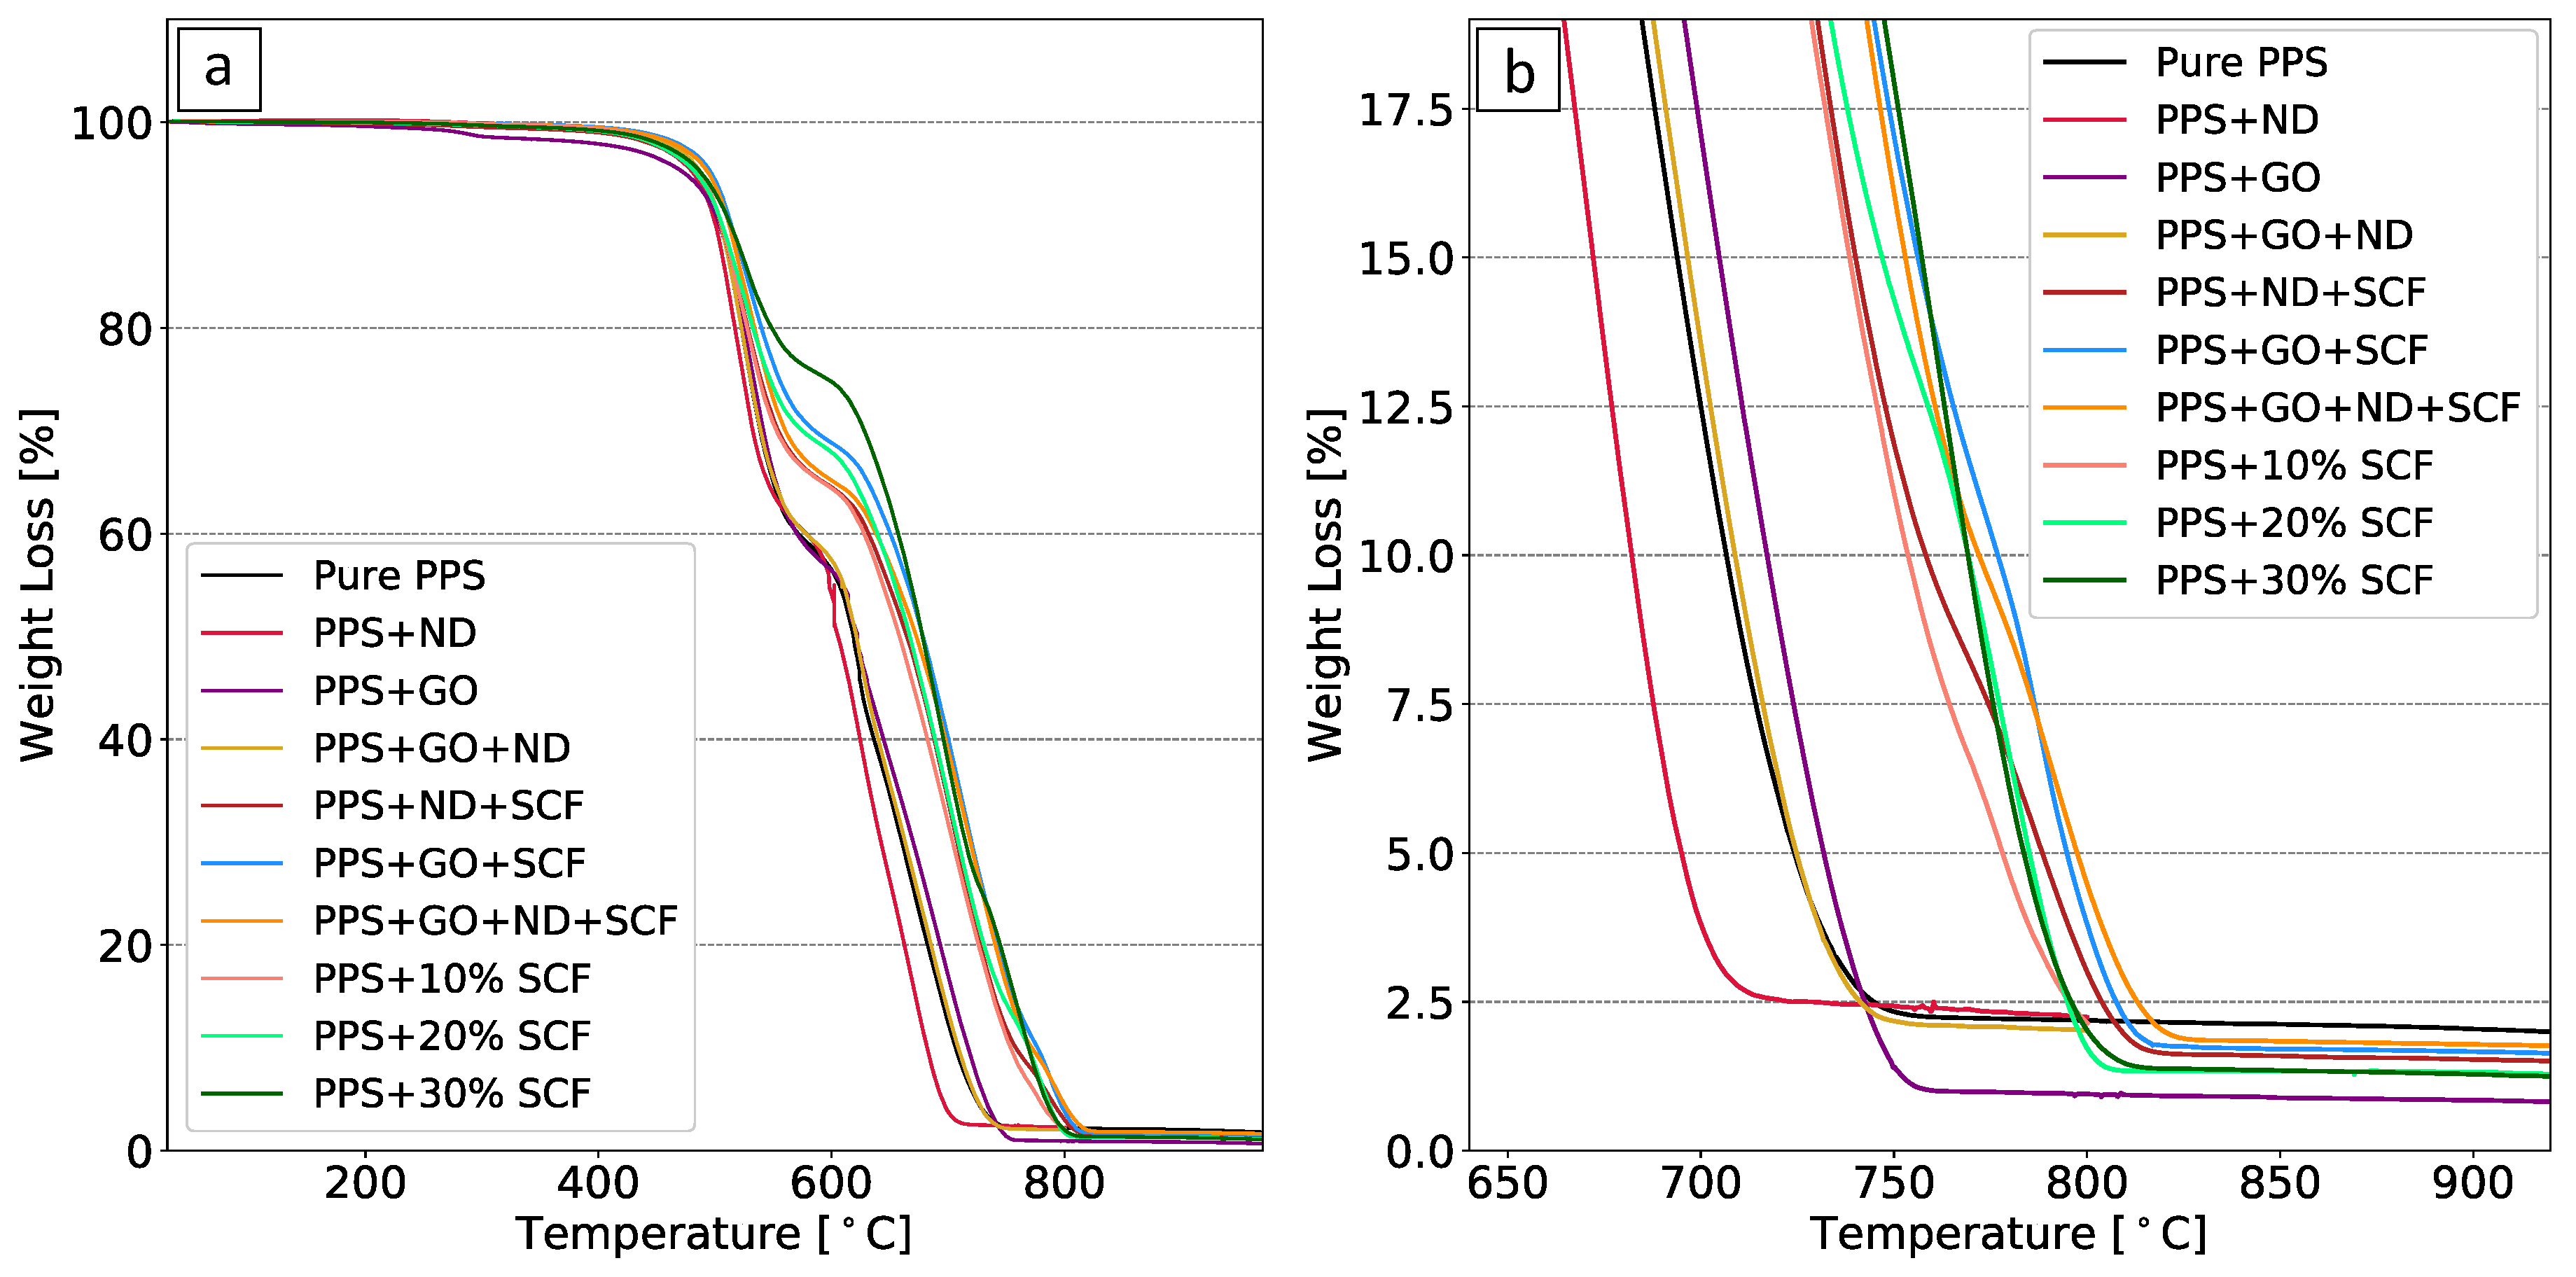
2.2.2. Thermogravimetric Analysis (TGA)

The thermal stability of the composites was analyzed by a TGA 8000 thermogravimetric analyzer (Perkin Elmer, Waltham, MA, USA). Samples with a mass of around 1.5–2.5 mg were heated in atmospheric conditions while the mass loss was recorded to determine the thermal degradation of the material. The samples were heated room temperature to 1000 C at a heating rate of 10 C/min.

2.2.3. Differential Scanning Calorimetry (DSC)

The degree of crystallinity and melting temperature of the polymer were determined by means of differential scanning calorimetry using a 821e DSC set-up (Mettler Toledo, Columbus, OH, USA). A material sample with a weight in the range of 5–10 mg was firstly heated to 370 C to remove the thermal history. The sample was then cooled back to room temperature and heated to 600 C at a heating rate of 10 C/min in an inert nitrogen atmosphere. The degree of crystallinity ( X c ) was calculated using Equation (1), in which Δ H f is the measured heat of fusion whereas Δ H f 0 is the theoretical heat of fusion of 100% crystalline PPS, which is taken as 76.5 J/g [20]. The reinforcement content (presented as w t % ) is taken into account and subtracted to calculate the crystallinity.
X c = 1 1 w t % Δ H f Δ H f 0 · 100 .

2.2.4. Micro Hardness Measurements

The micro Vickers hardness of the composites is known to be a valuable indication of the amount of plastic deformation under sliding conditions. The hardness was obtained using a MXT- α Vickers hardness indenter (Matsuzawa, Akita, Japan). A 200 gf indentation was applied for 25 s. Each indentation was repeated five times per material after which the average hardness value was taken.

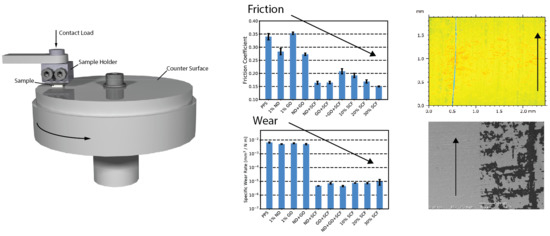
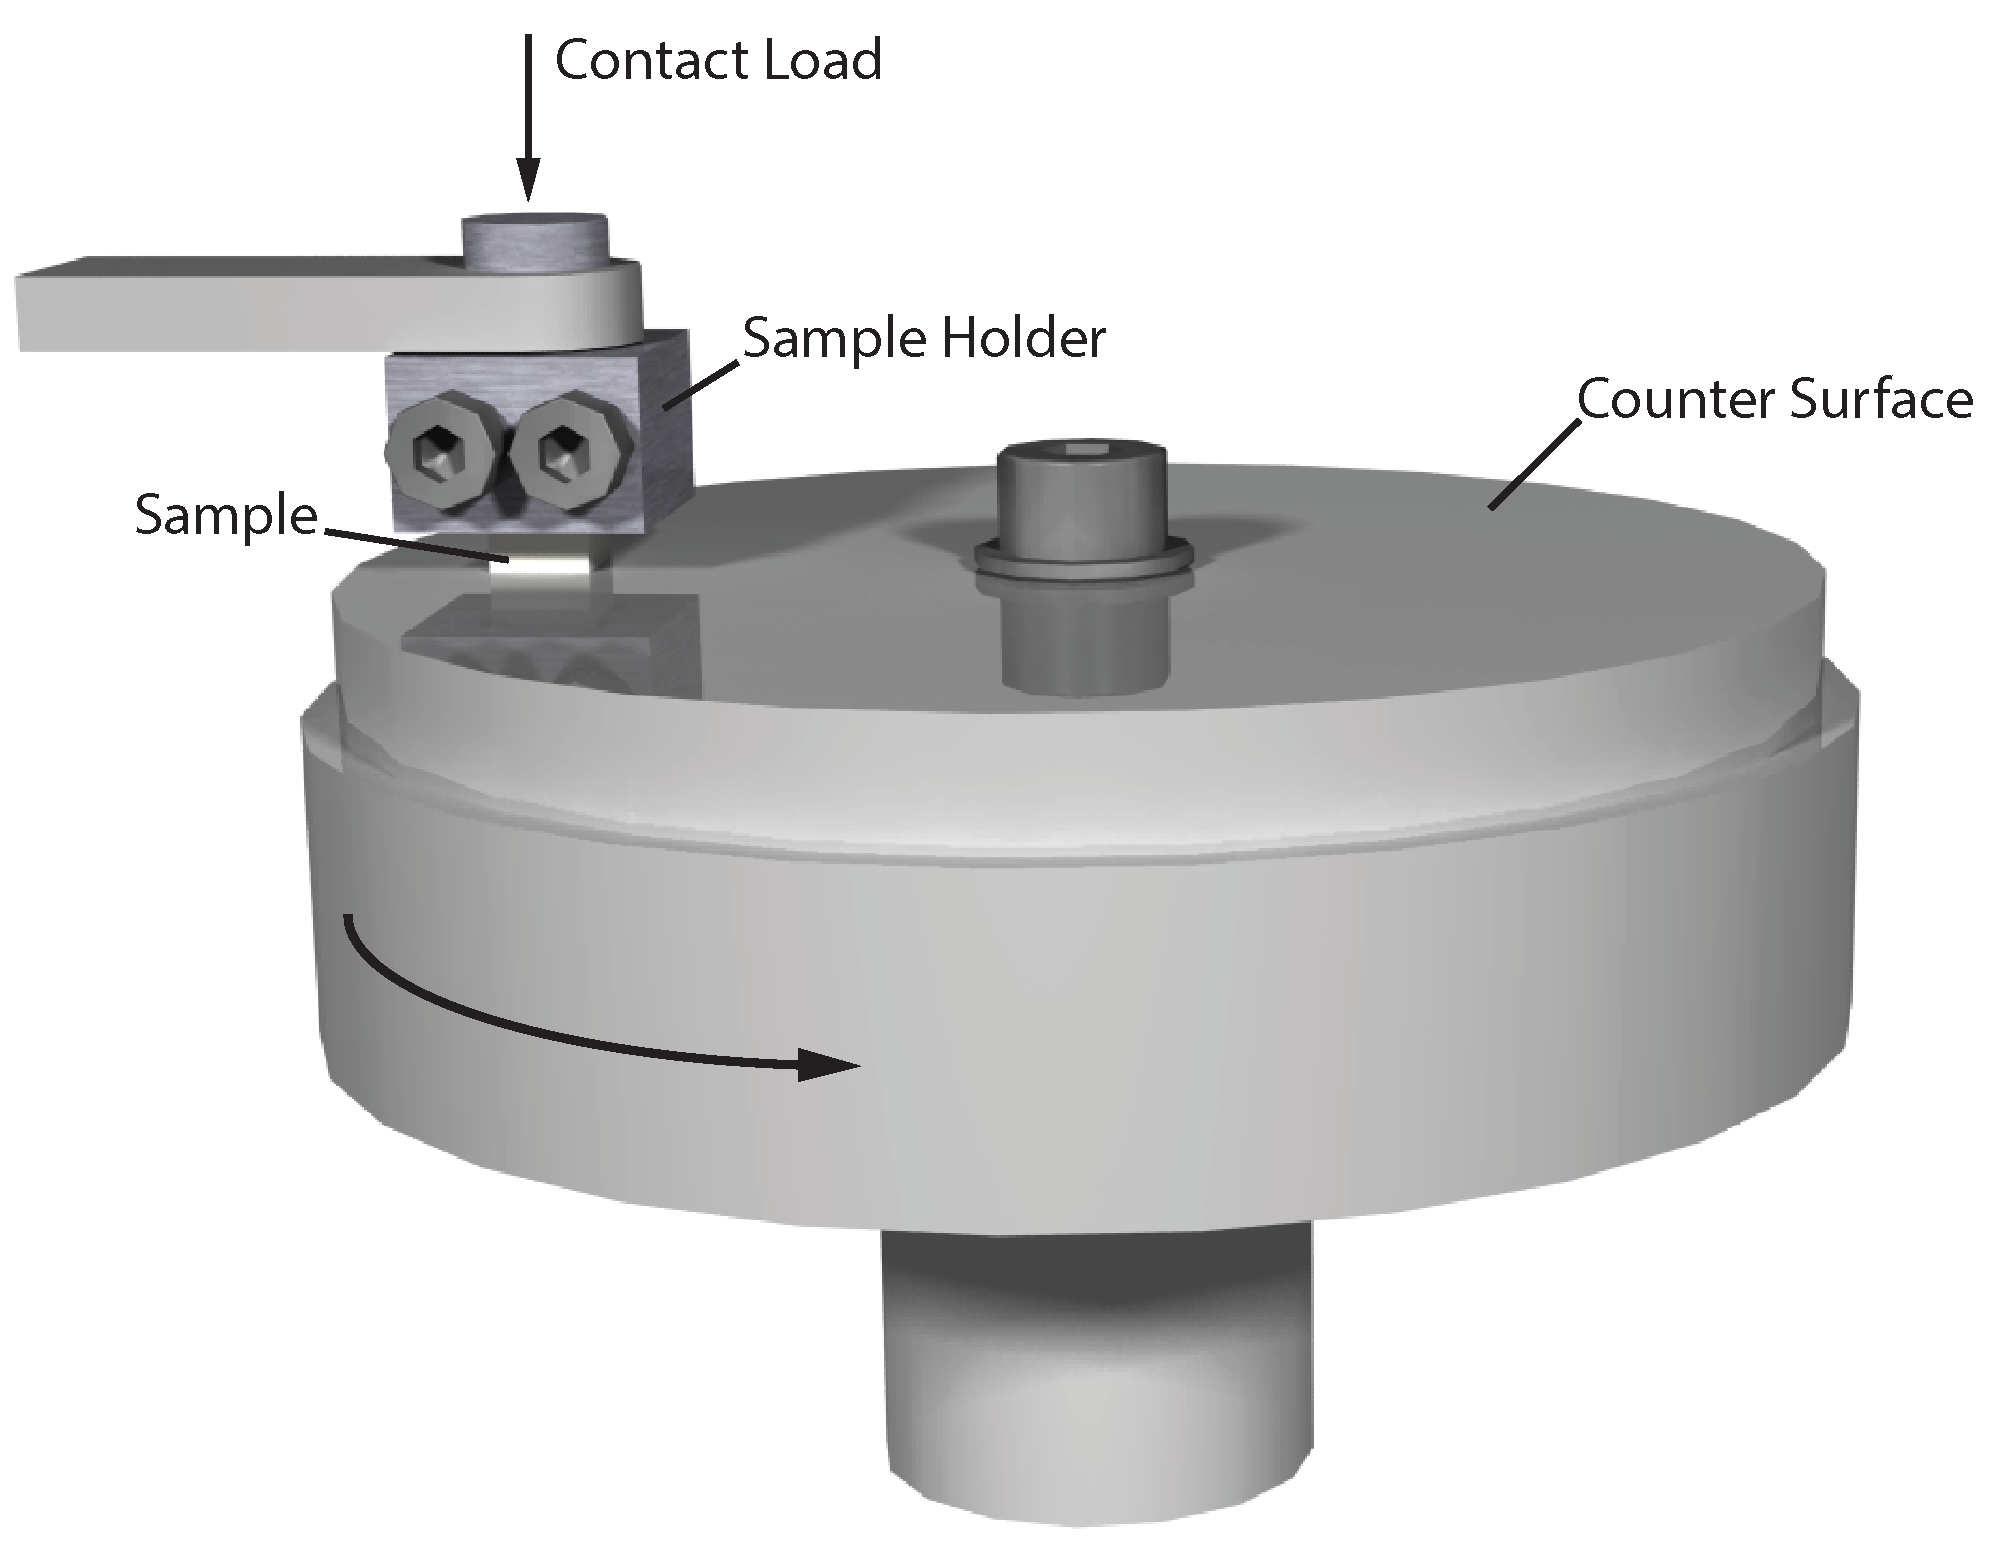
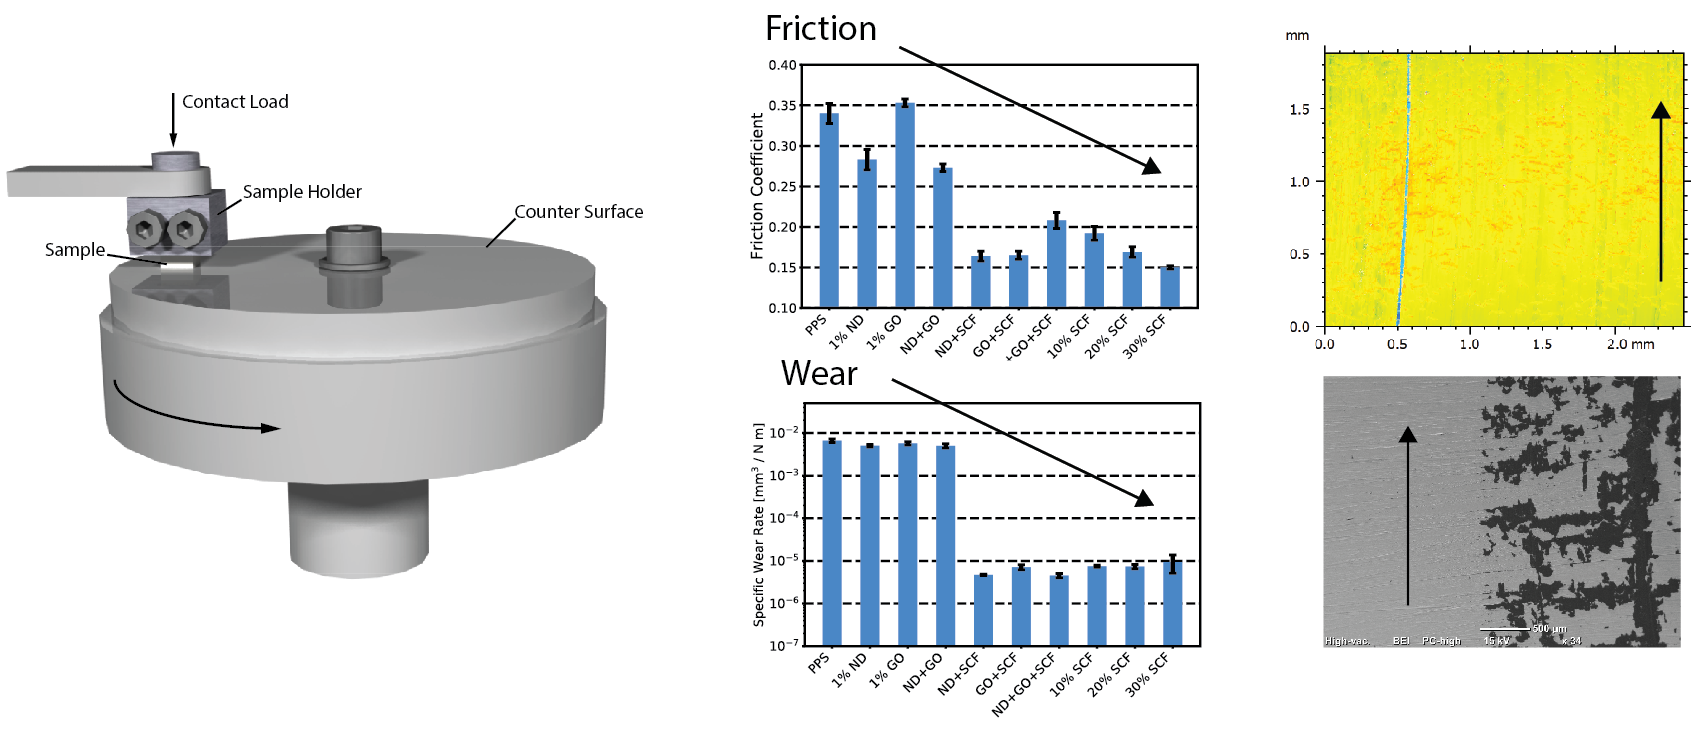
2.2.5. Tribological Characterization

The tribological properties of the materials were determined using a TE67 pin-on-disk tribometer (Phoenix Tribology Ltd., Kingsclere, UK) as schematically illustrated in Figure 1. A square pin with a surface area of 4.1 × 4.1 mm2 was slid against an Inconel 625 counter surface with a surface roughness of Ra = 0.2– 0.3 μ m . The sliding speed was initially set to 0.13 m/s with a contact pressure of 5 MPa. The first series was performed using distilled water as lubricant with the sample fully submerged at room temperature (22 C). The friction force in this set-up was determined using a strain gauge load cell whereas the wear was measured using a linear potentiometer. Each test was performed three times after which the average values for friction coefficient and specific wear rate were determined. For the second series, contact pressures of 1 MPa and 5 MPa were used in both dry and water lubricated conditions. Furthermore, the sliding speed was increased to 0.5 m/s.

2.2.6. SEM/EDS and Optical Profilometry Observations

The counter surface roughness and pin surface roughness were determined before and after sliding using and Wyko NT1100 optical profilometer (Veeco, Plainview, NY, USA). A JCM 6000 scanning electron microscope (JEOL, Peabody, MA, State, USA) was utilized to analyze the wear mechanisms as evident on the worn pin surface as well as the used counter surface after sliding. Furthermore, energy dispersive X-ray spectroscopy (EDS) analyses were performed on the used counter surface to identify a possible transfer film.

2.2.7. Wettability

The wettability of the materials was determined by performing contact angle measurements on the unmodified surface. The contact angle measurements were executed using an Attension Theta optical tensiometer (Biolin Scientific, Gothenburg, Sweden). Both distilled water and diiodomethane were deposited on the surface with a respective droplet size of 1 μ L and 4 μ L . This allowed for the determination of both the water contact angle (CA) and the surface free energy ( σ s ) using the OWRK equation [21]. The measurements were repeated six times.

2.2.8. Dilatometry

The linear coefficient of thermal expansion was determined using a mil402 C dilatometer (NETZSCH, Selb, Germany). A rectangular sample 4 × 4 × 7 mm was subjected to a temperature cycle below its melting point in atmospheric conditions. The sample was heated up from room temperature ∼25 C to a temperature of 200 C at a constant heated rate of 5 C/min. A force of 25 mN was applied while measuring the linear displacement, Δ L , at increments of 2.5 C. The linear coefficient of thermal expansion ( α L ) was determined over a temperature range between 30 C and 80 C using Equation (2). Here, L is the sample length and Δ T is the difference in temperature. The average value of α L was then calculated over the full temperature range.
Δ L L = α L Δ T

3. Results and Discussion

3.1. Morphological Characterization

The morphology of the processed composite powders of the first series (see Table 1a) was analyzed and compared to the morphology of the polymer powder as received, see Figure 2. It was observed that the preparation processes induced minor flattening of the particles although the particle size did not show to be affected. The ball milling of the SCF blended PPS showed no fracture or degradation of the SCFs. Furthermore, no agglomerations of the added nano particles were found by SEM, indicating a good dispersion of the particles throughout the polymer. By mapping the fluorine, sulphur and carbon content of the three indicated areas of Figure 2d, a rather constant fluorine and sulphur content was identified. For the specific areas, the fluorine content ranged from 21–23% while sulphur accounted for 16–17% of the spectrum with the remainder being carbon. The low degree of deviation indicates a homogeneous dispersion of the PTFE polymer throughout the PPS matrix.

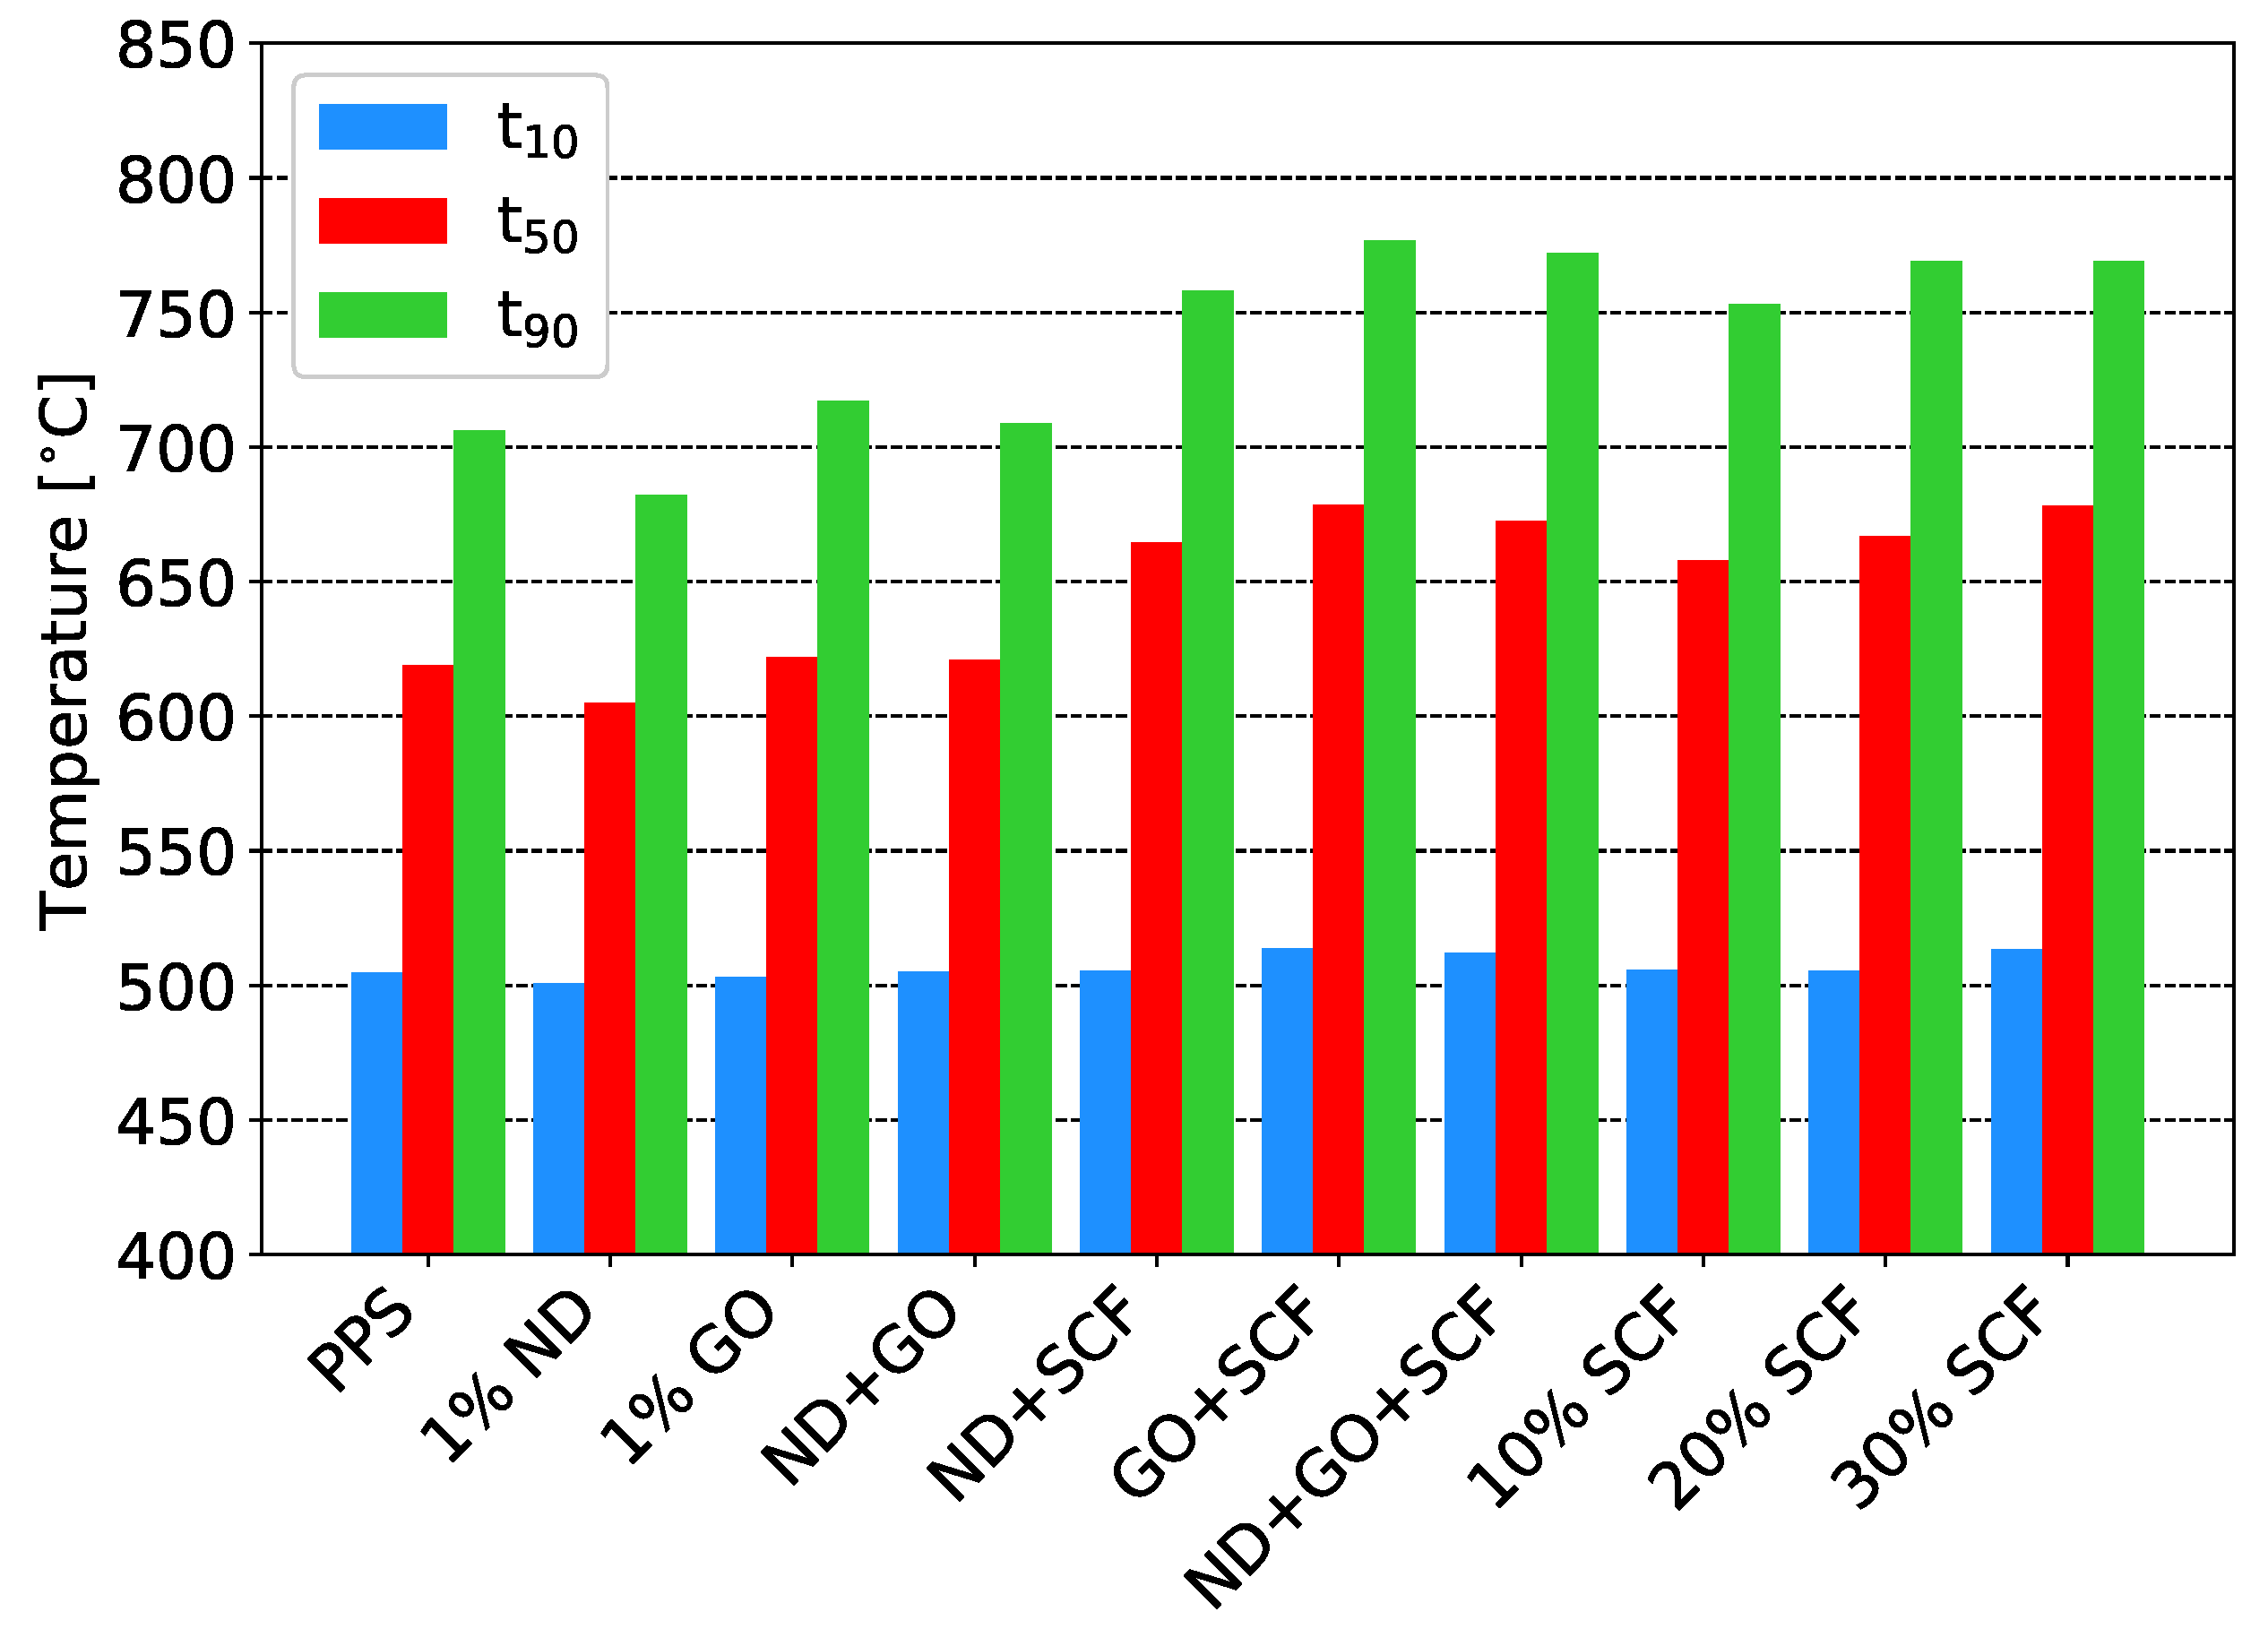
3.2. Thermogravimetric Analysis (TGA)

The thermal degradation curves of the samples of the first series (see Table 1a) are illustrated in Figure 3. As evident from Figure 3b, the oxidative degradation of the polymer is generally delayed to a higher temperature by the addition of the carbon based reinforcements. The respective decomposition curves show to be effectively shifted to a higher temperature. The degradation temperatures of 10%, 50% and 90% mass loss are presented in Figure 4 as t 10 , t 50 and t 90 , respectively. The results indicate that especially at a higher mass loss an increase in degradation temperature is present by the addition of GO and SCF. The delay in thermal degradation can be related to the higher thermal stability of the used reinforcements [22]. The t 90 temperature of 706.0 C for pure PPS, as presented in Table 2, was increased to 717.0 C by the addition of GO and to 753.0 C by using 10% SCF as reinforcement. The addition of ND interestingly provided slightly lower thermal stability when used as sole reinforcement. In combination with 10% SCF however, the degradation temperatures were increased with respect to the solely 10% SCF reinforced PPS, from 753.0 C to 771.9 C for the t 90 temperature. The addition of SCF clearly protected the polymer from thermal decomposition as a function of its content. This effect may be explained by the higher heat absorption capacity of SCFs [23].

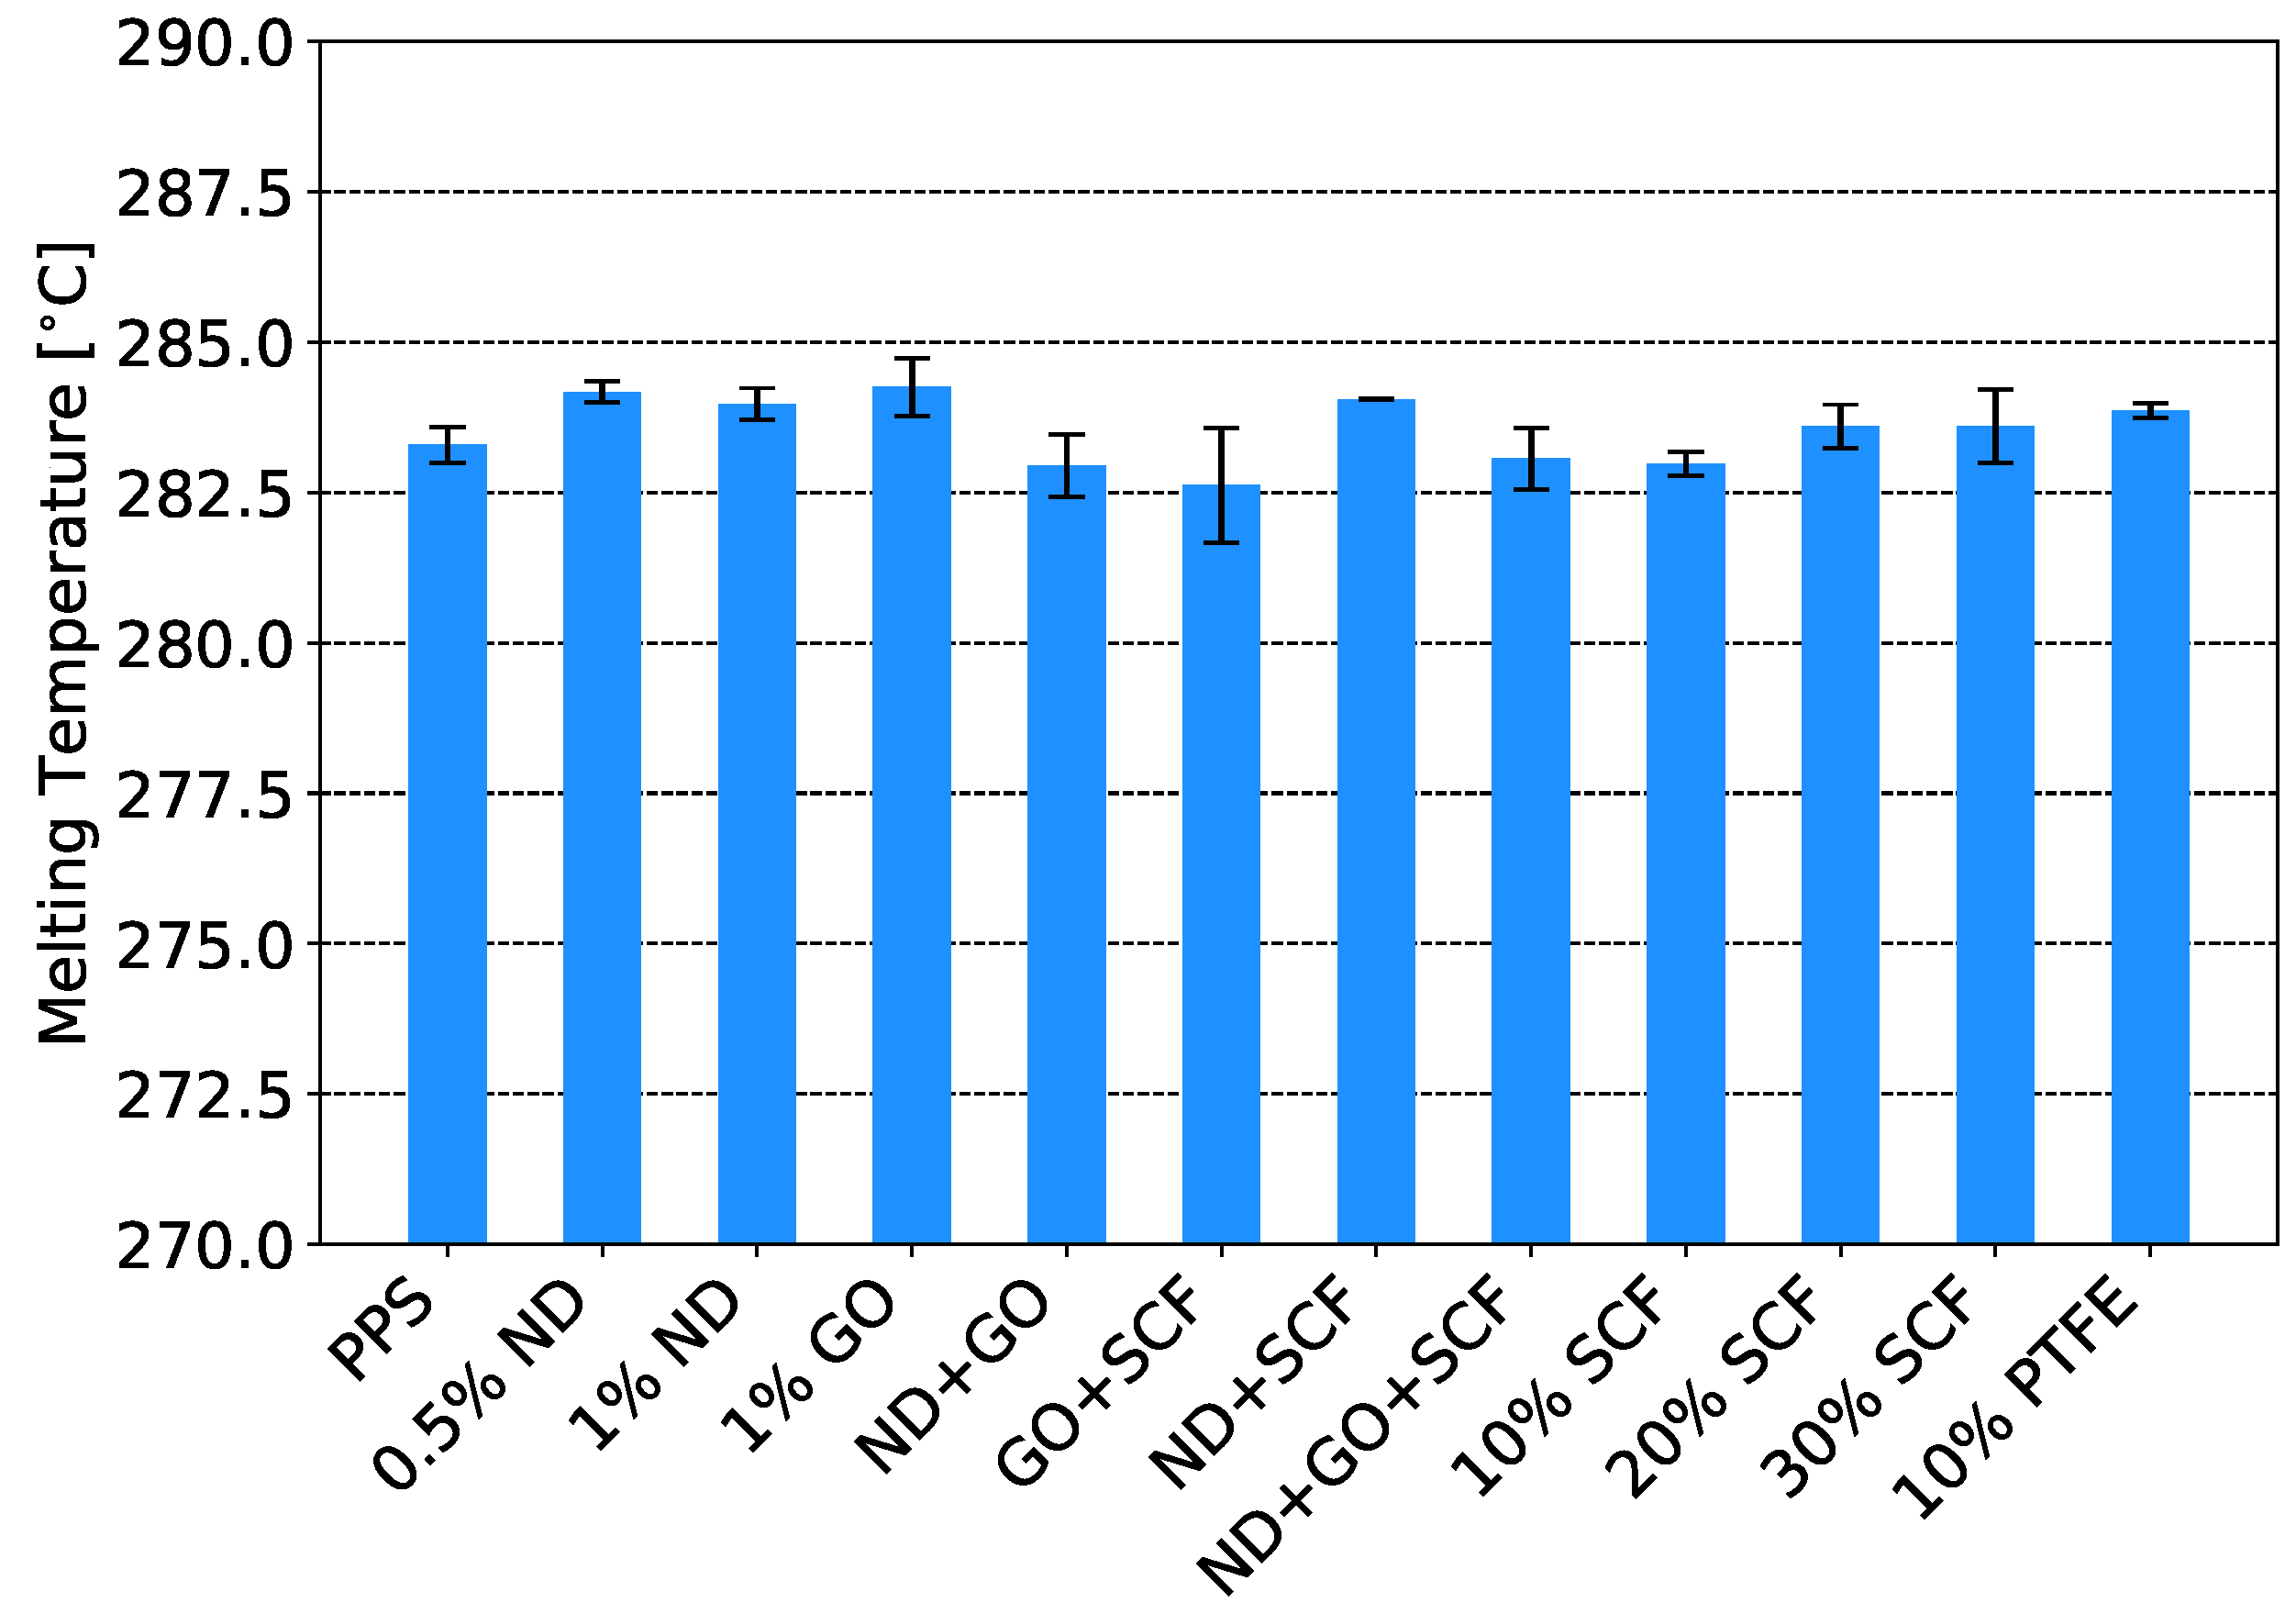
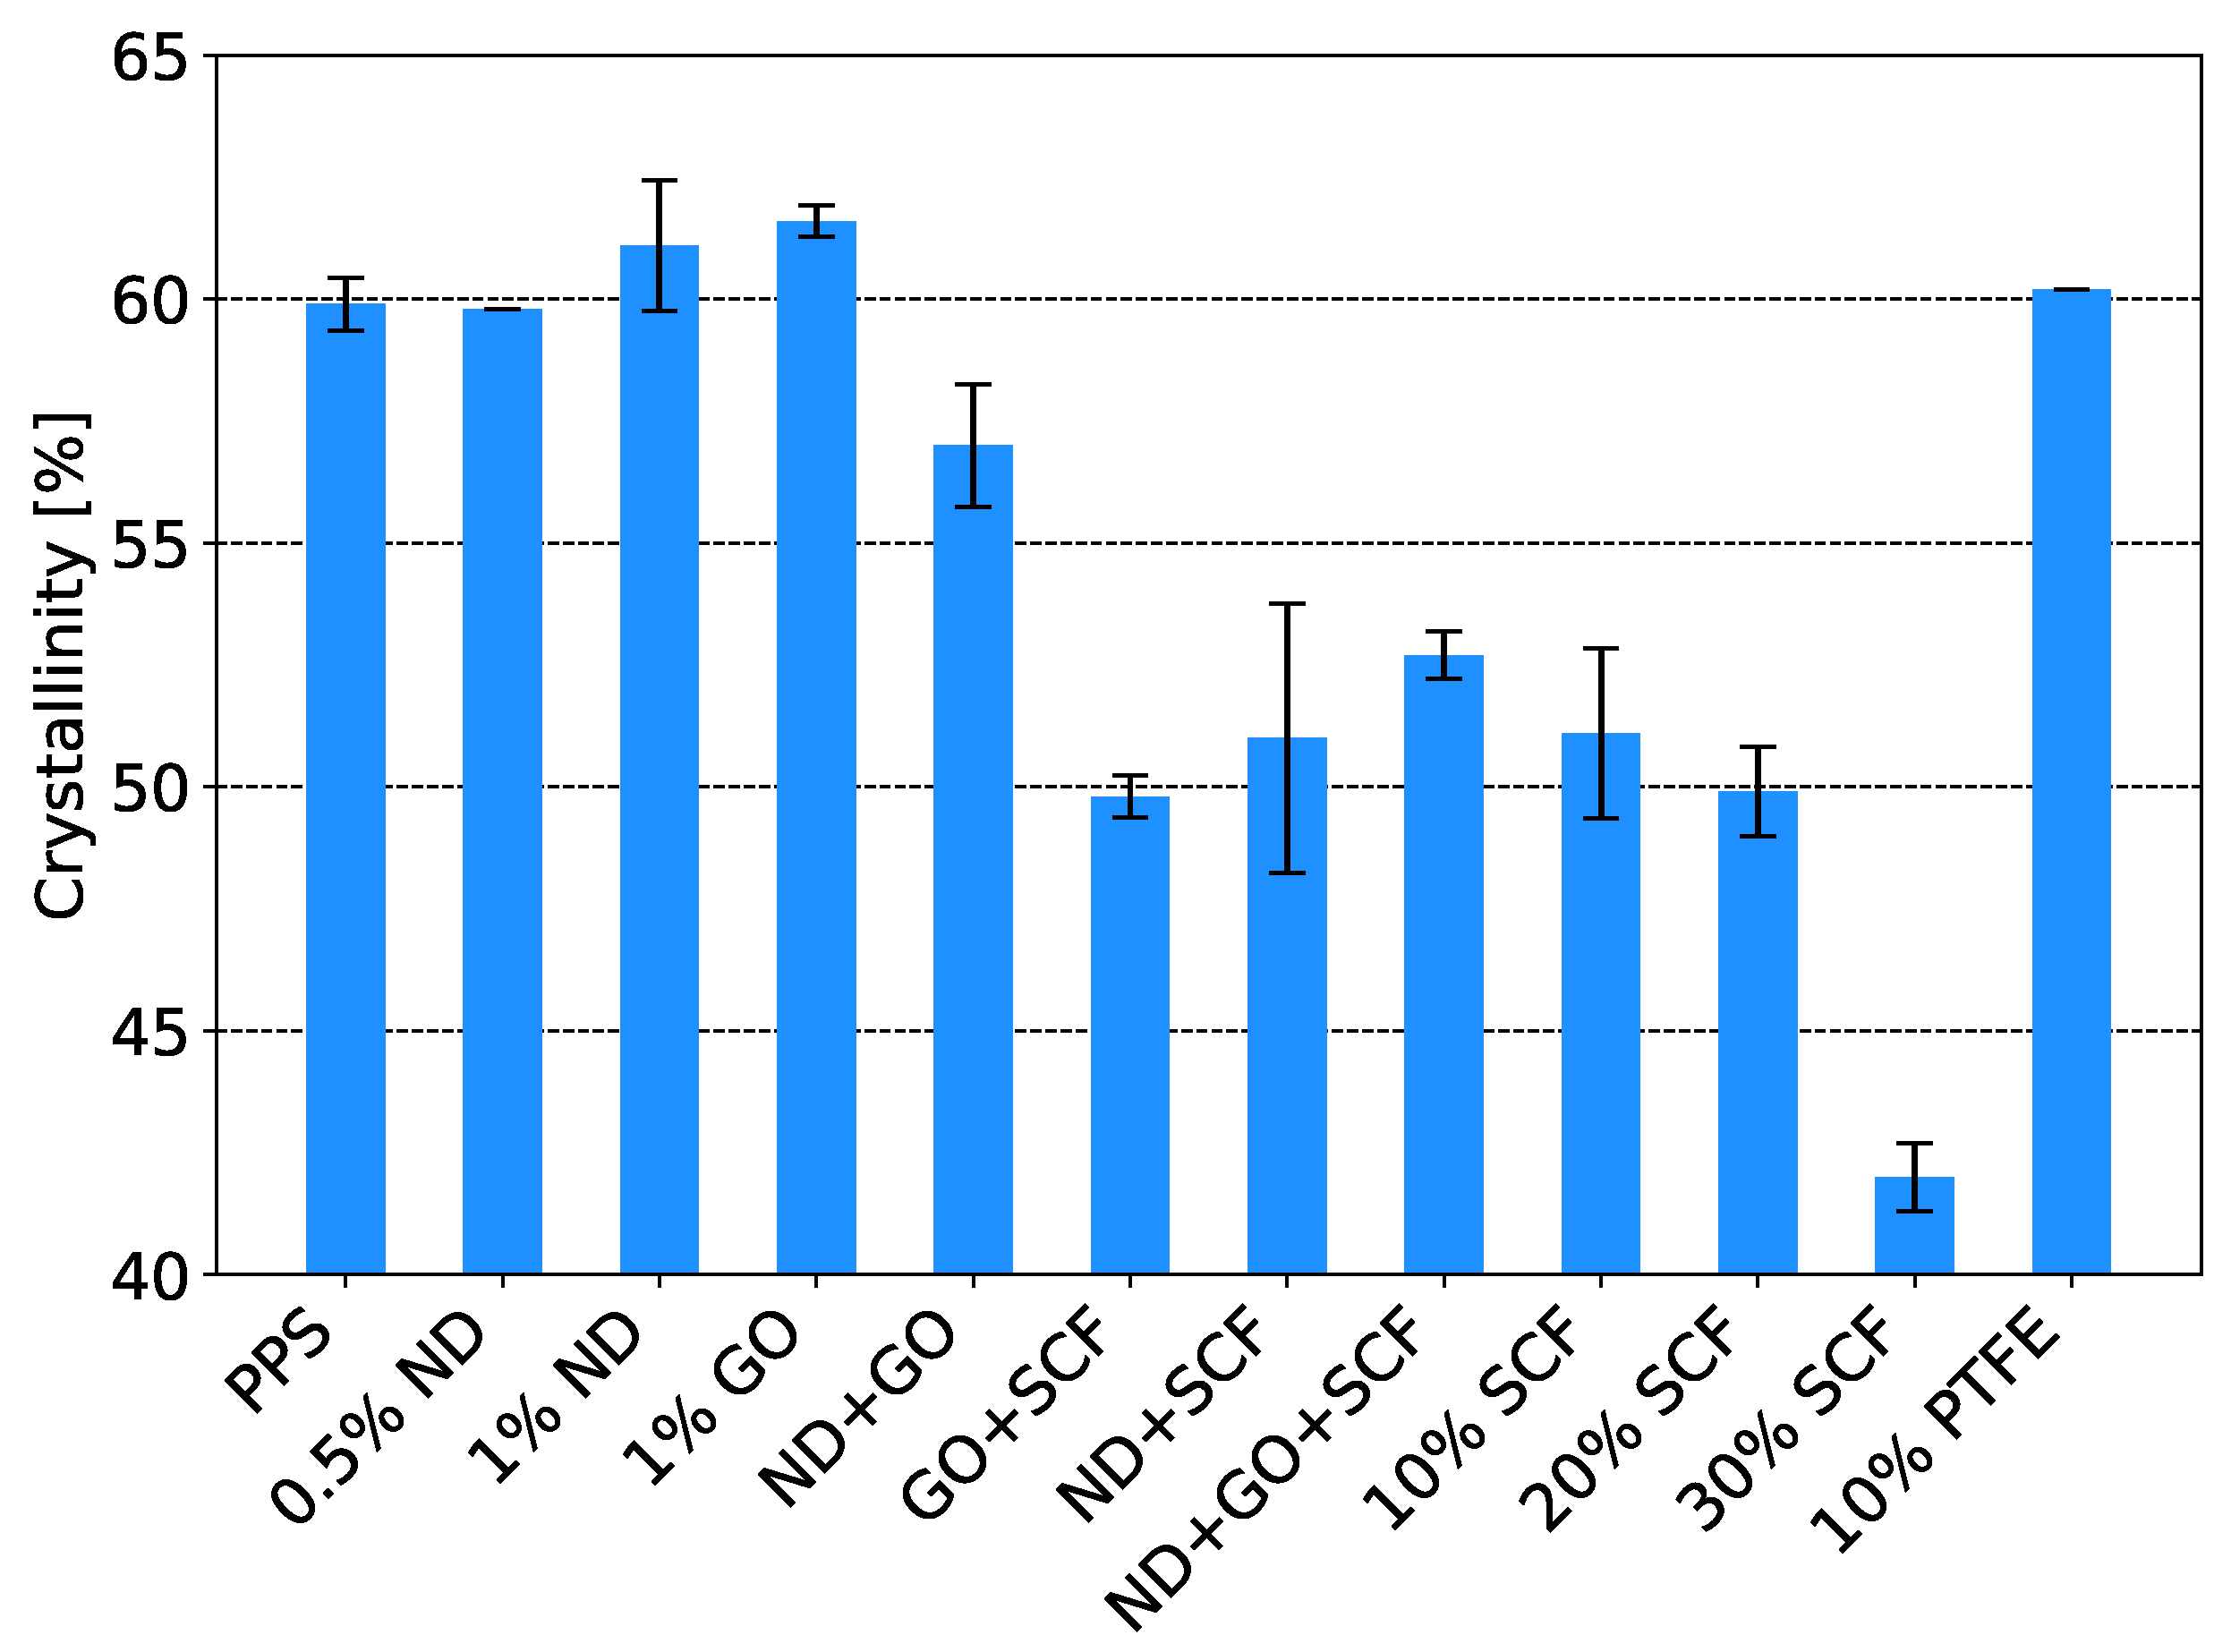
3.3. Differential Scanning Calorimetry (DSC)
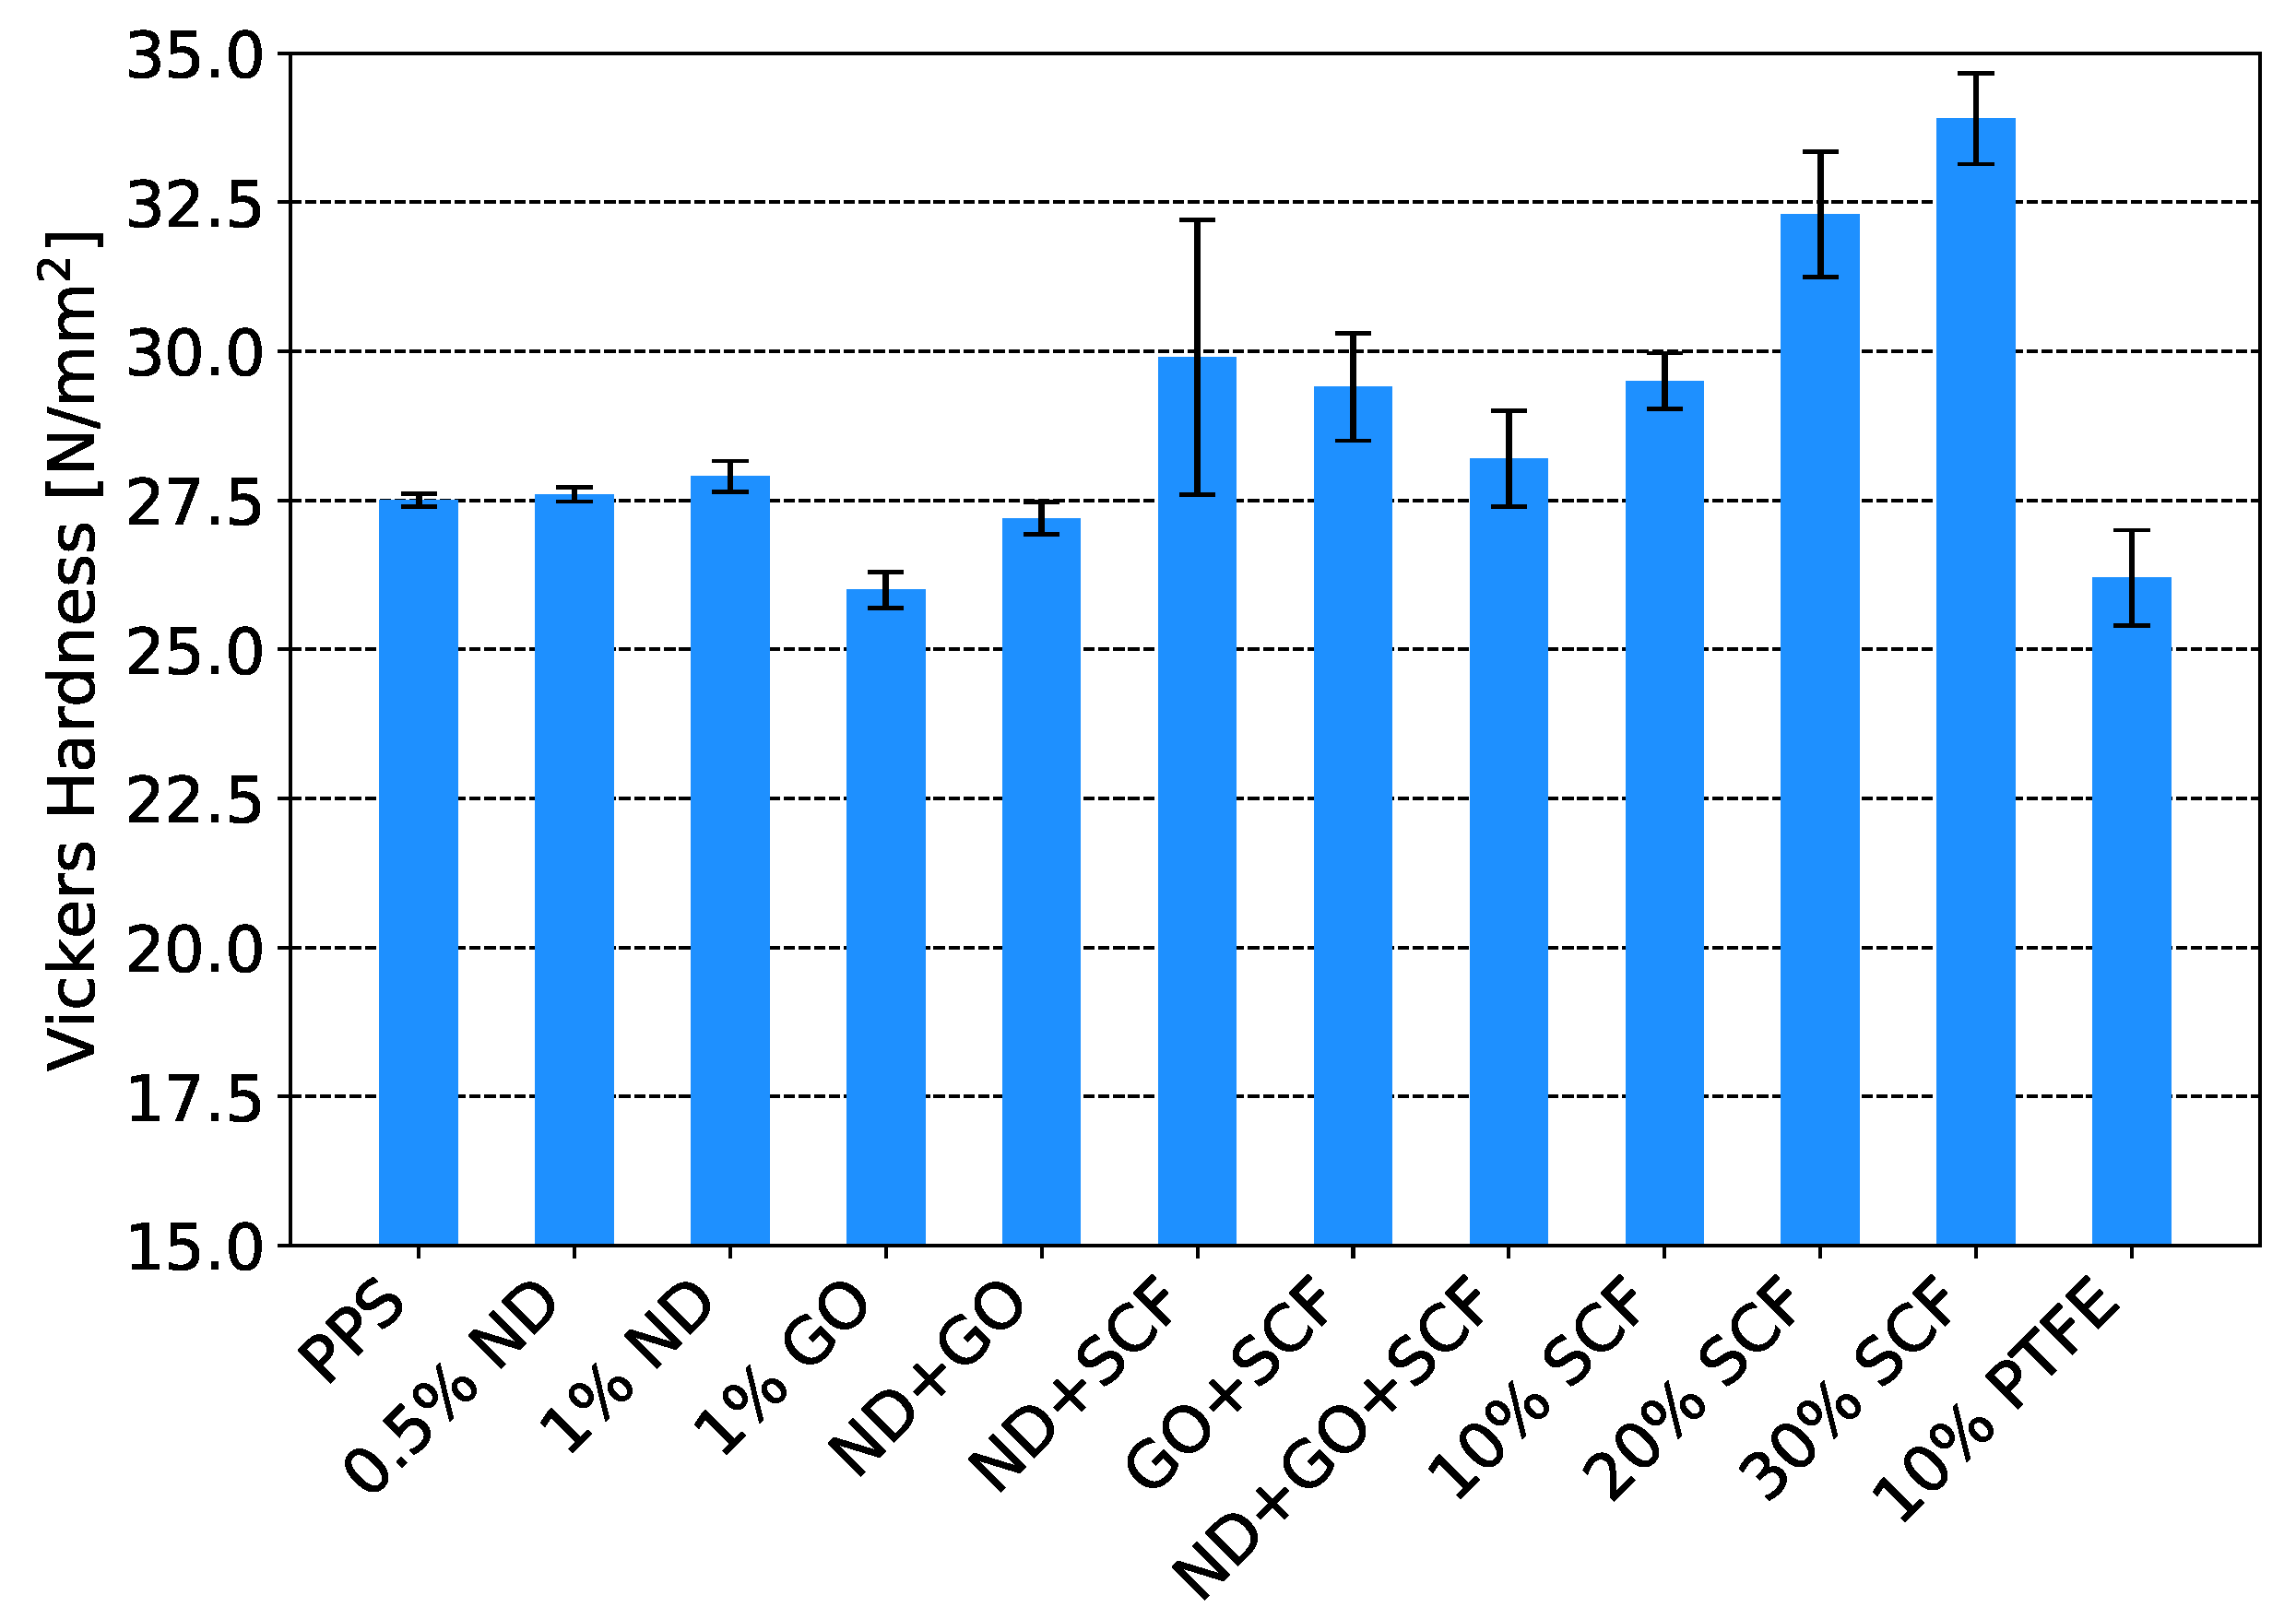
The melting temperature as found by DSC as the endothermic melting peak is presented in Figure 5. It can be observed that for the samples of both series, no significant effect of the reinforcements was present on the thermal stability of the polymer. The melting temperatures of all tested composites were found to be within a range of 1.6 C which is within the range of standard deviation.
The degree of crystallinity of the different materials is presented in Figure 6. Only minor changes in the degree of crystallinity of the composites were identified by addition of the nano-reinforcements. This indicates that the nano reinforcements do not hinder the molecular chain mobility and formation of the crystalline phases, likely due to their small size and good dispersion. The addition SCFs does show to decrease the crystallinity as a function the SCF content in the polymer. This effect may be attributed to the fact that the particles are much larger, hindering the crystallization of the polymer. The addition PTFE did not influence the degree of crystallinity of PPS at the tested percentage.

3.4. Micro Hardness

As presented in Figure 7, the addition of SCFs affected the hardness of the composite significantly. When compared to pure PPS, the hardness increased by 7%, 15% and 19% for 10%, 20% and 30% SCF, respectively. Due to the stiffness of carbon fibers and its load bearing capacity a lower degree of plastic deformation is present as a results of the indentation. The addition of the nano-reinforcements only showed minor changes as NDs increased the hardness slightly while the addition of GO allowed for a small decrease in hardness. Forthe addition of PTFE also a minor reduction in hardness was observed.

3.5. Tribological Characterization

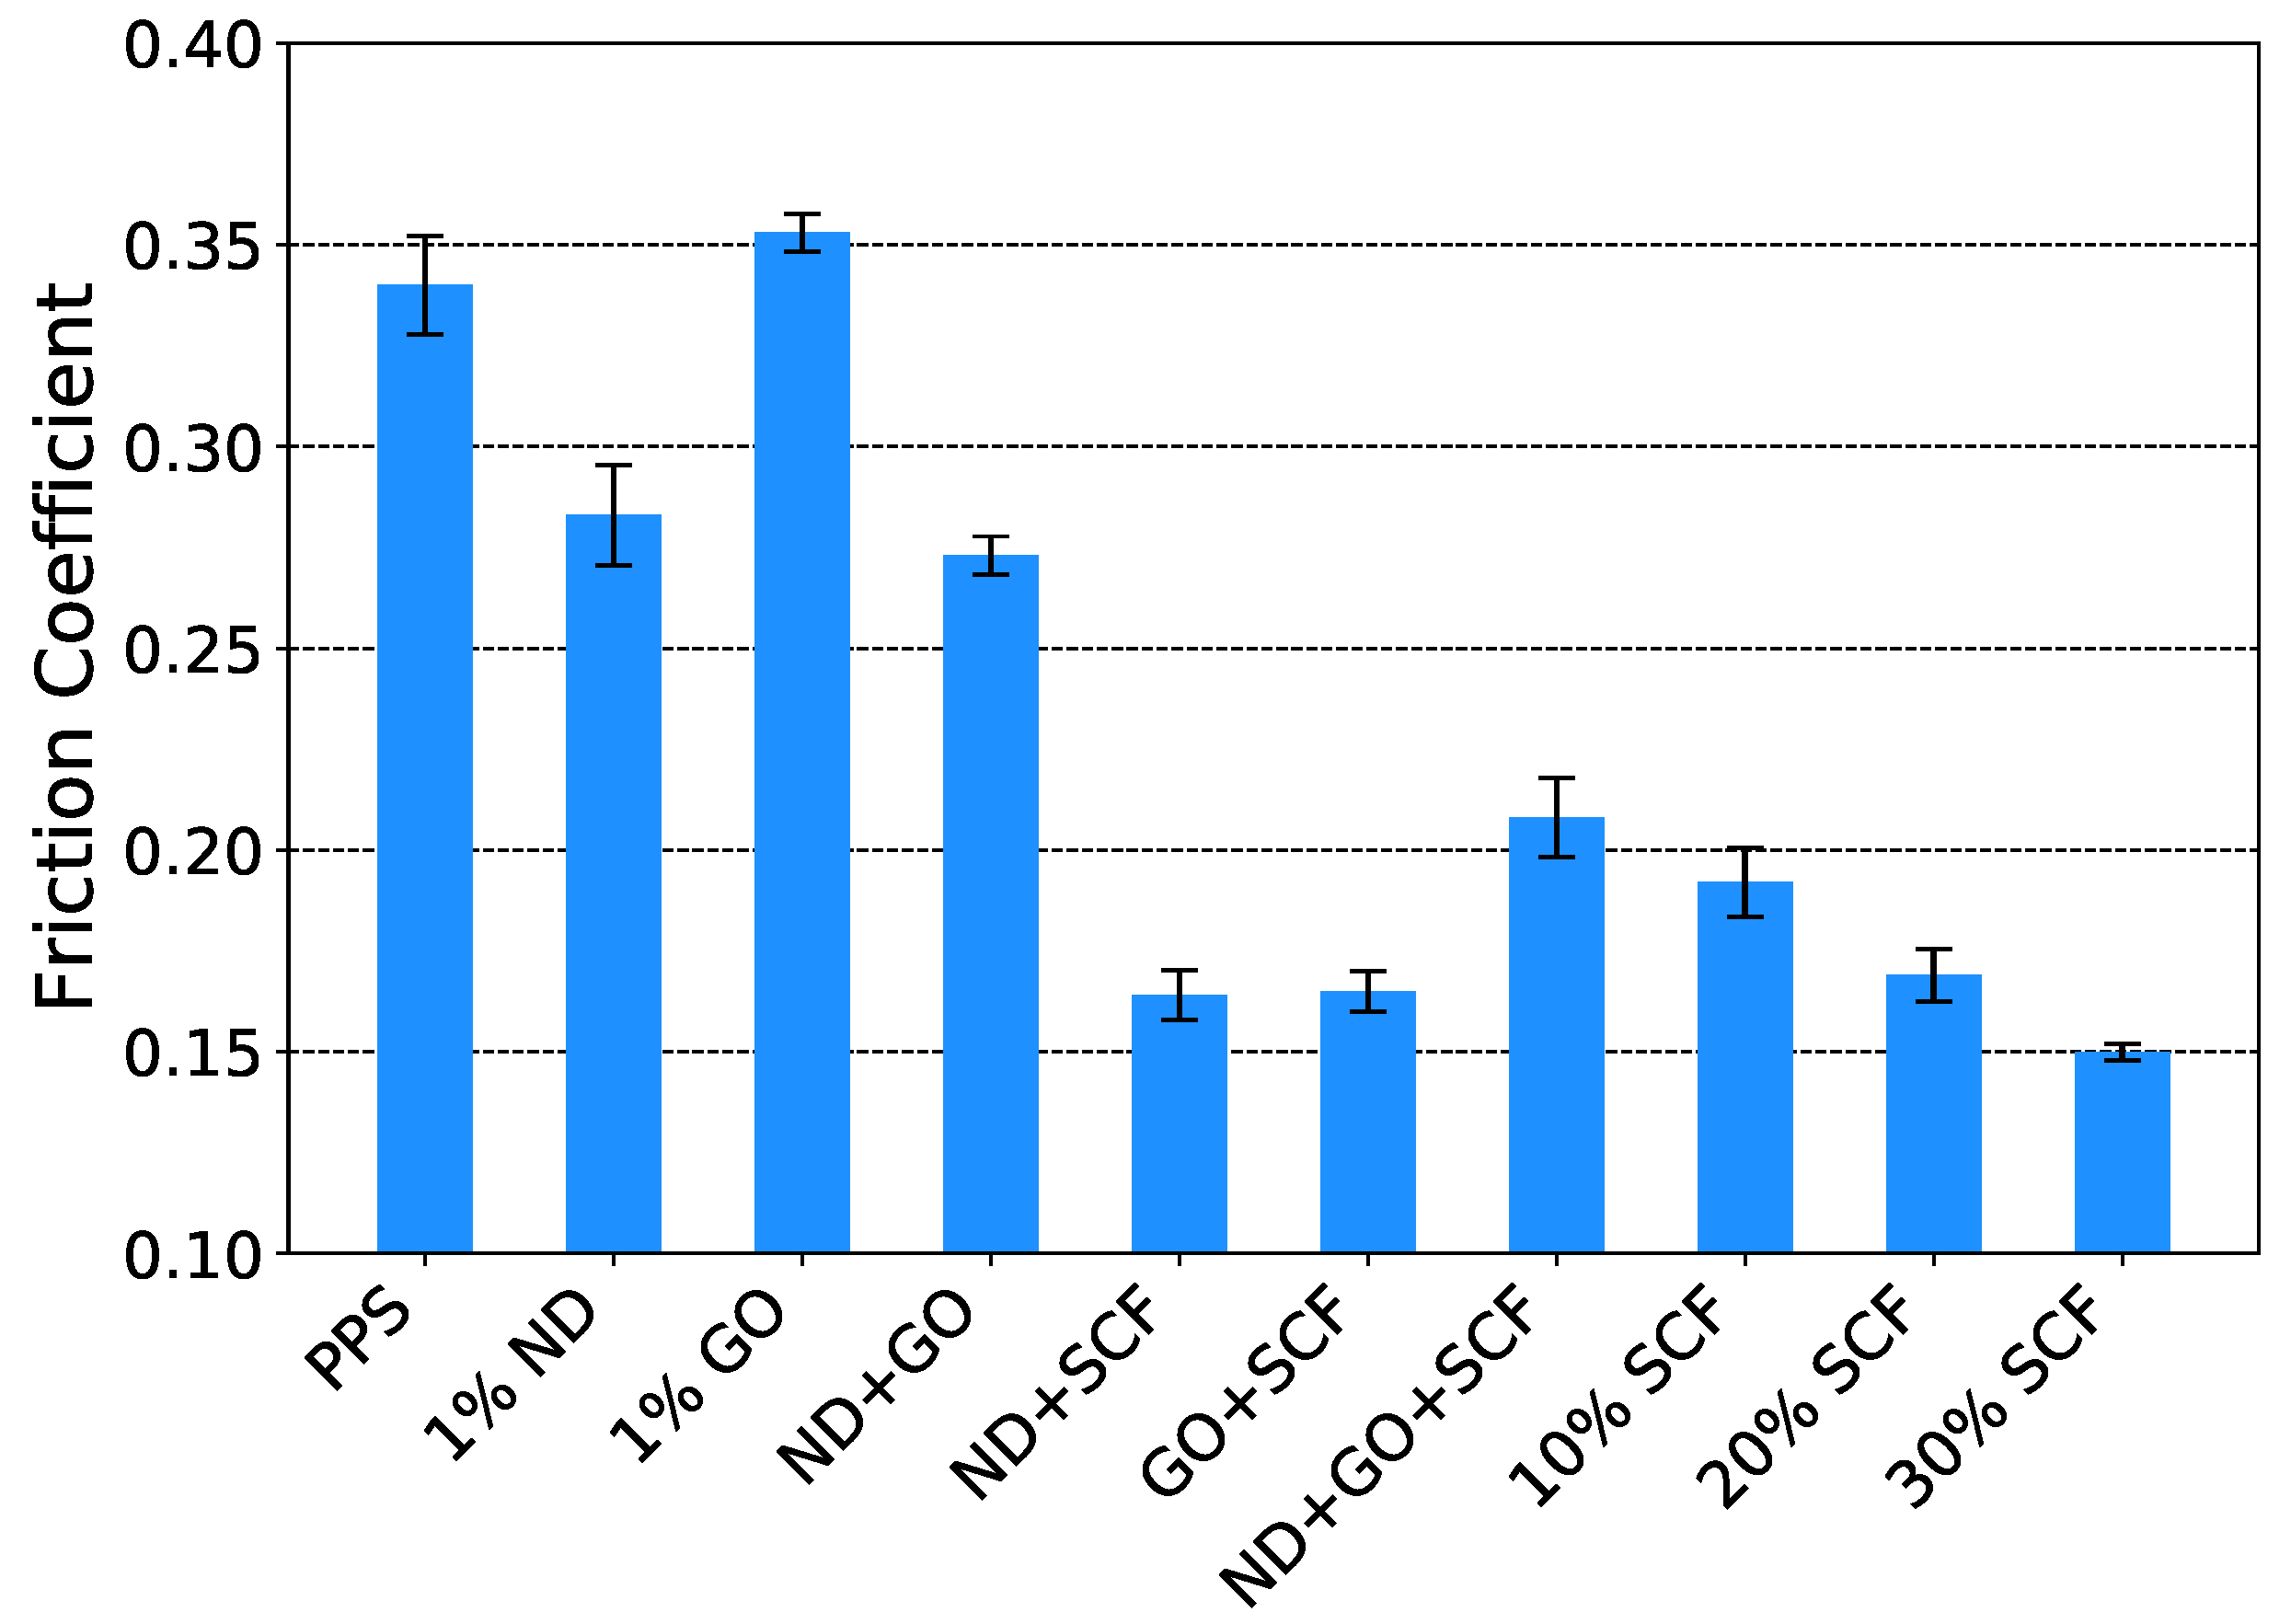
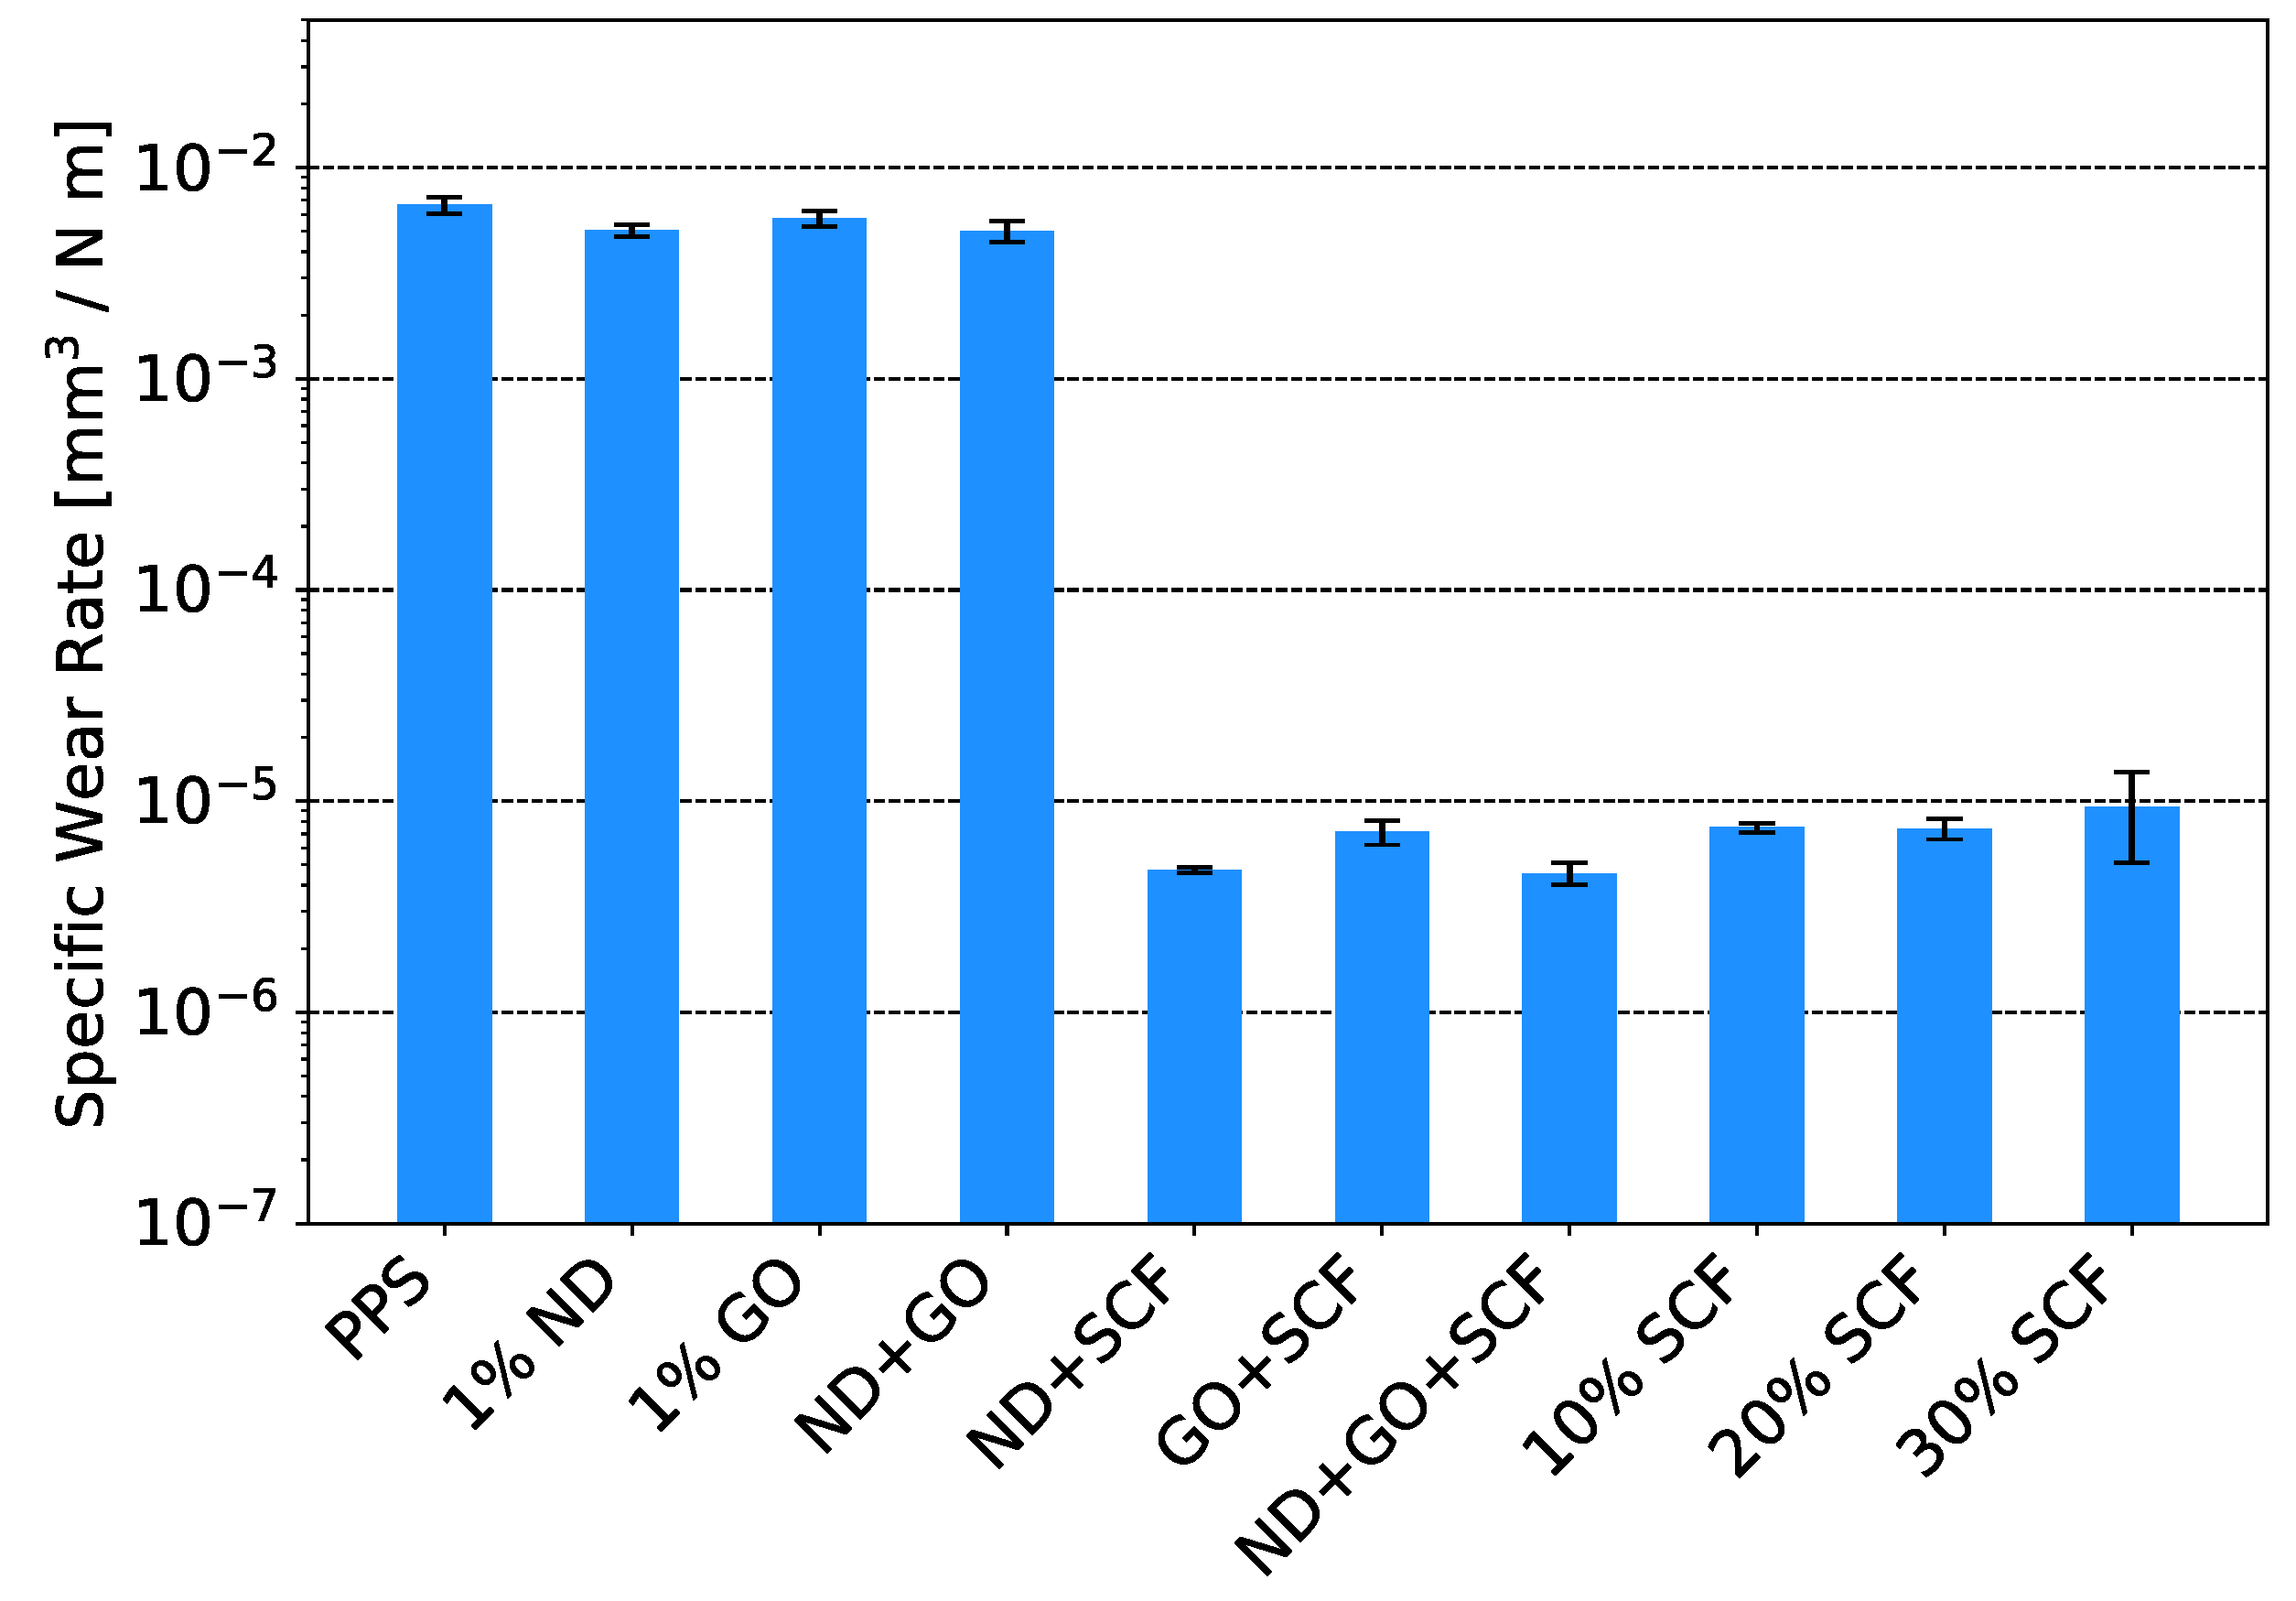
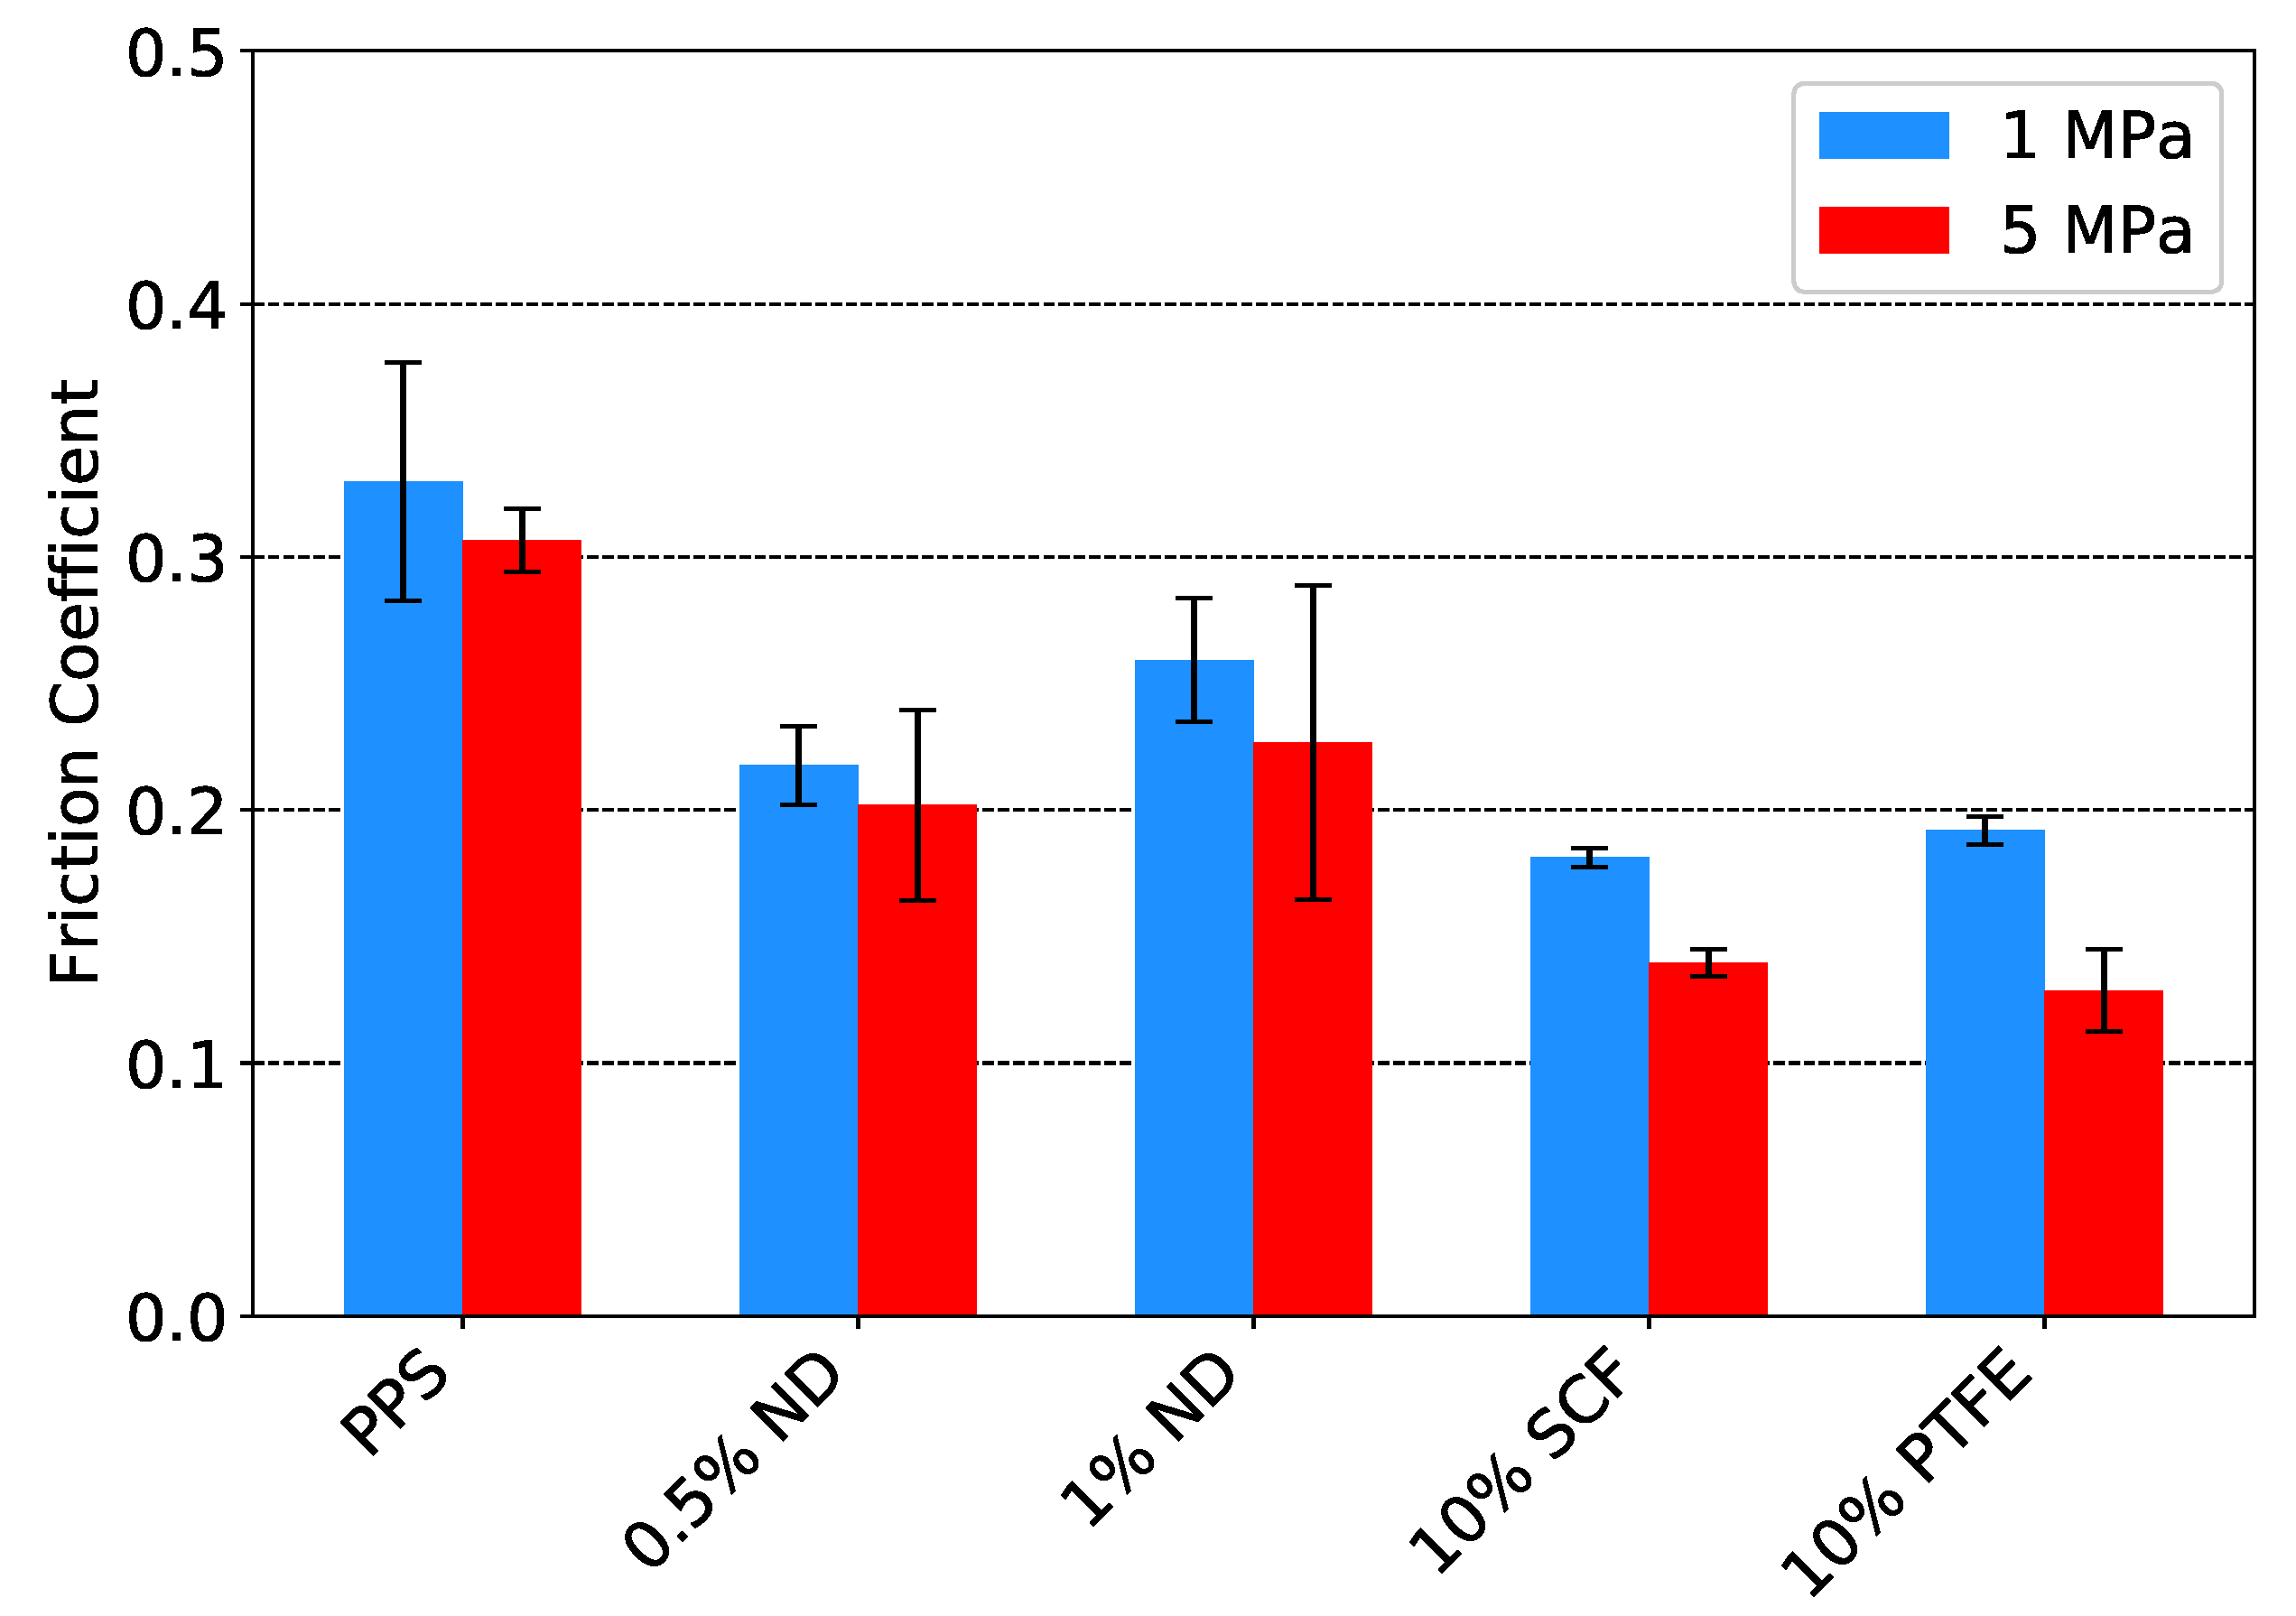
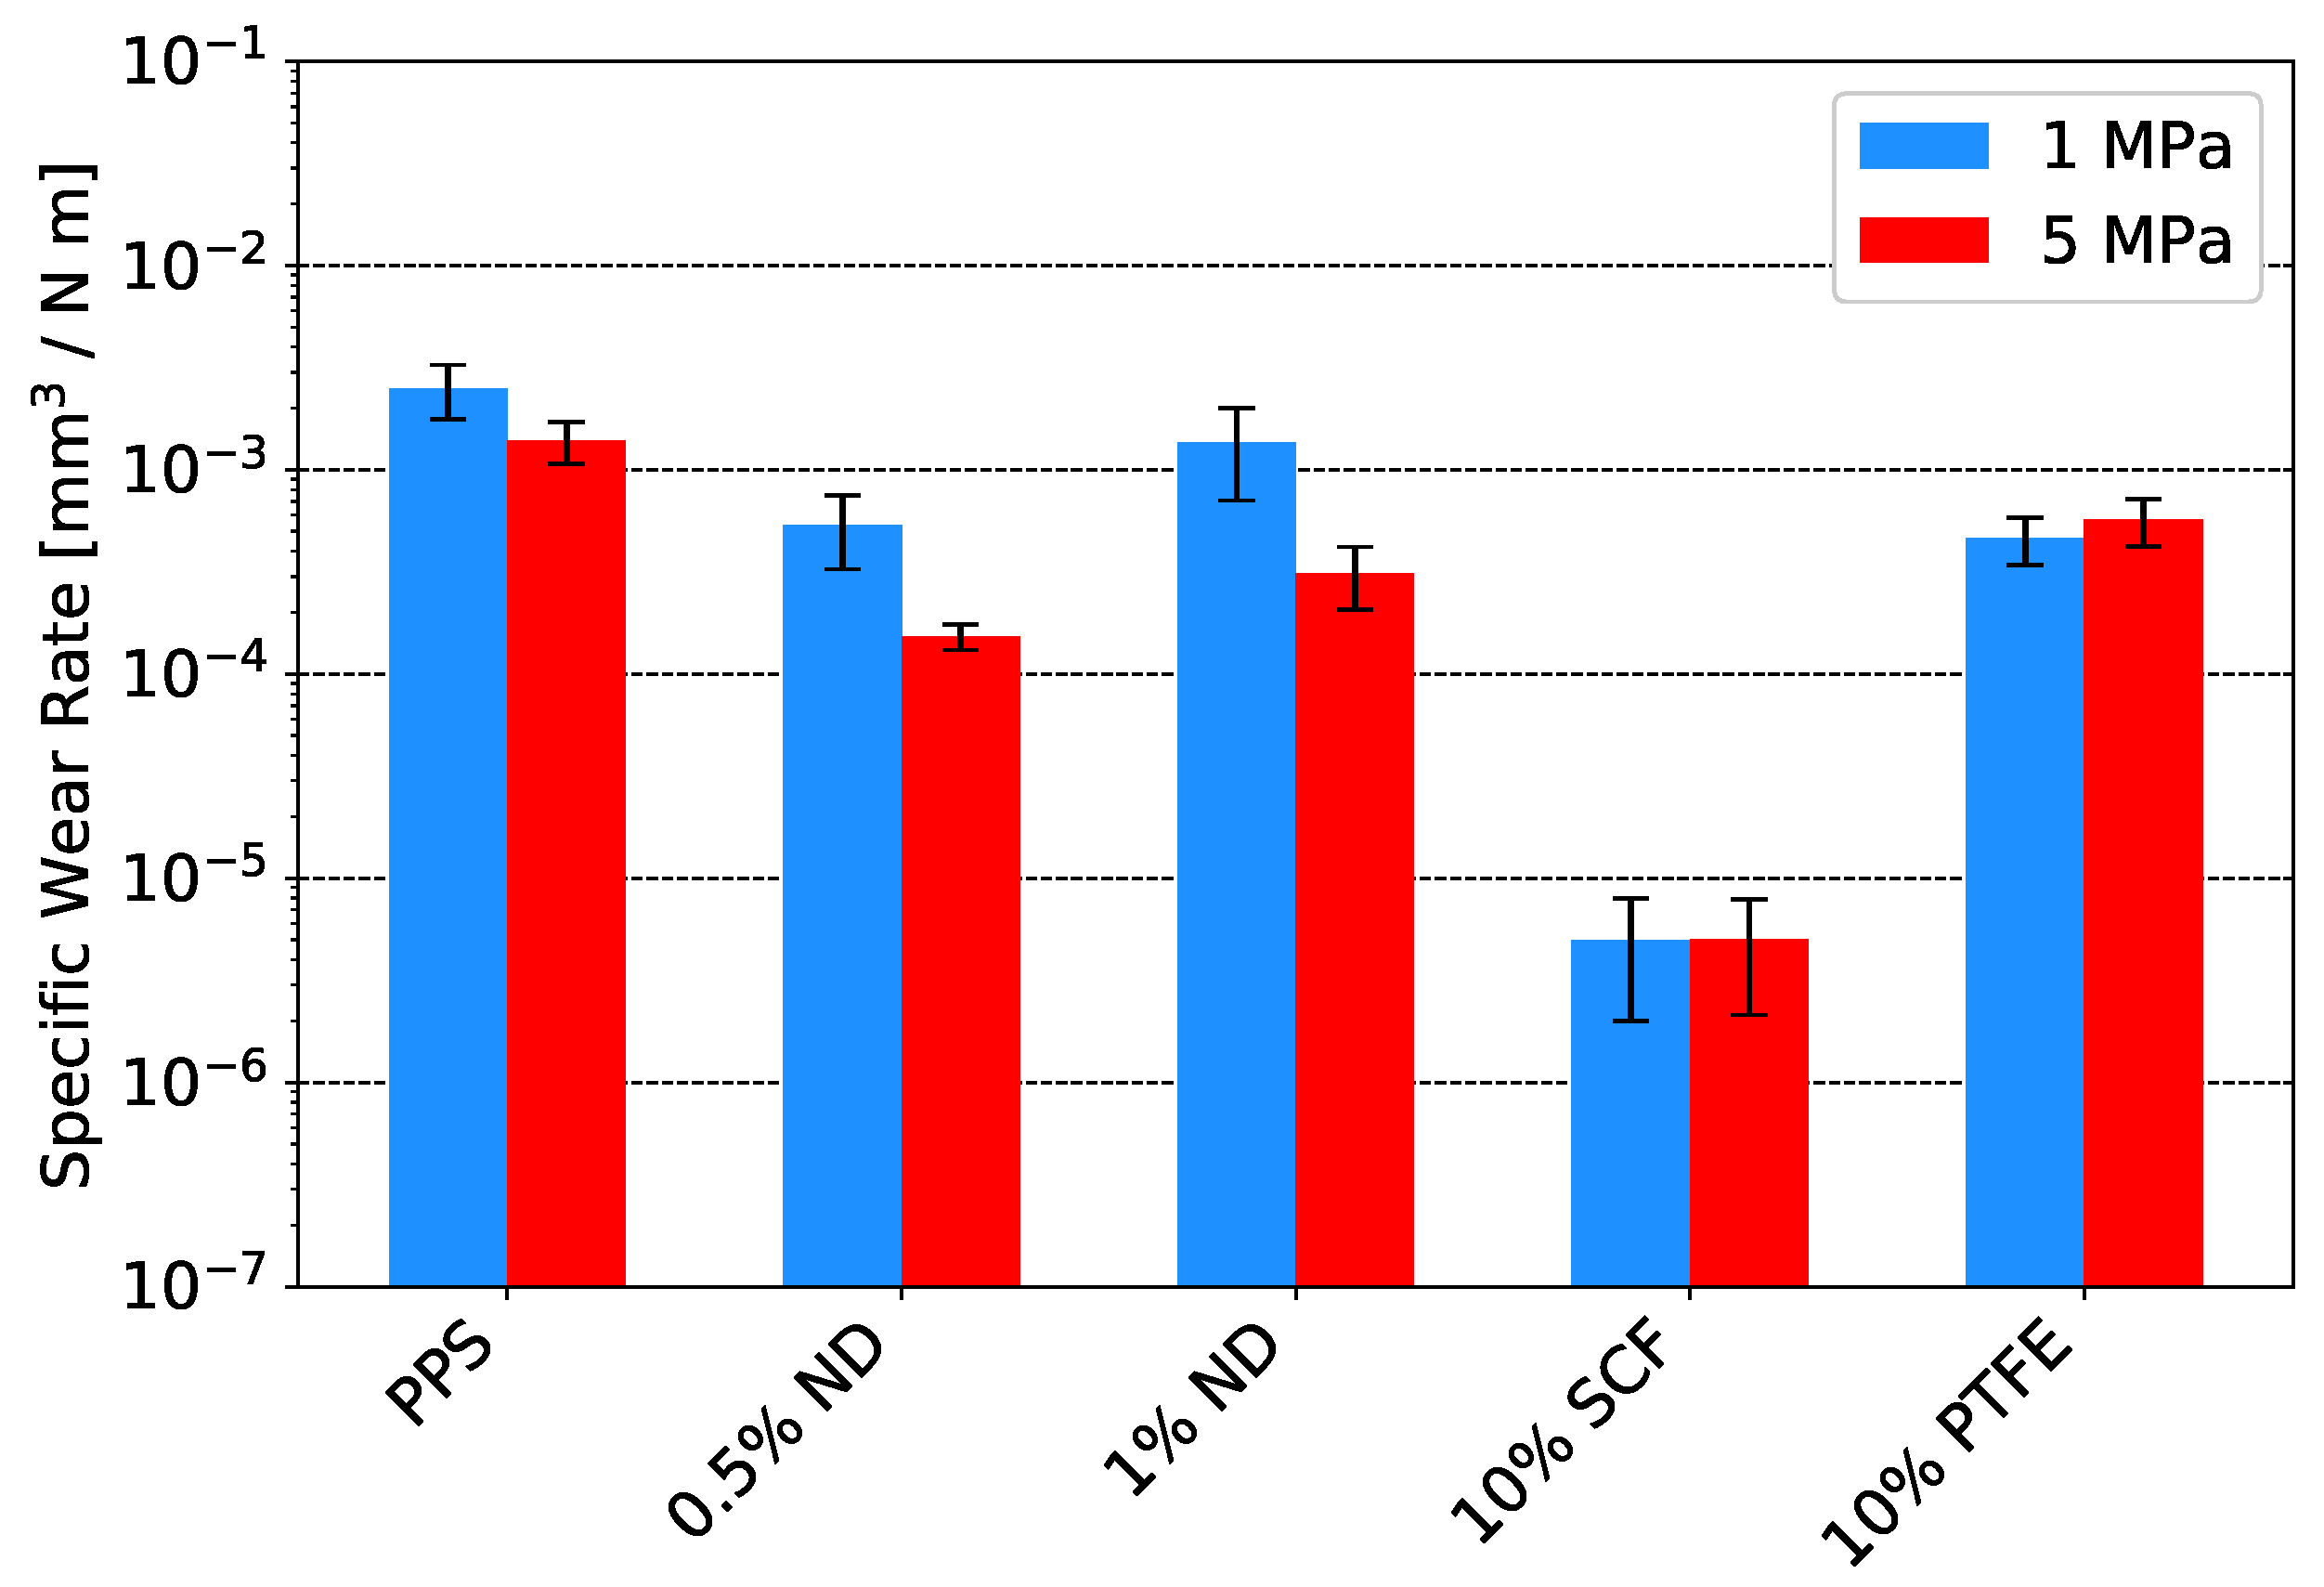
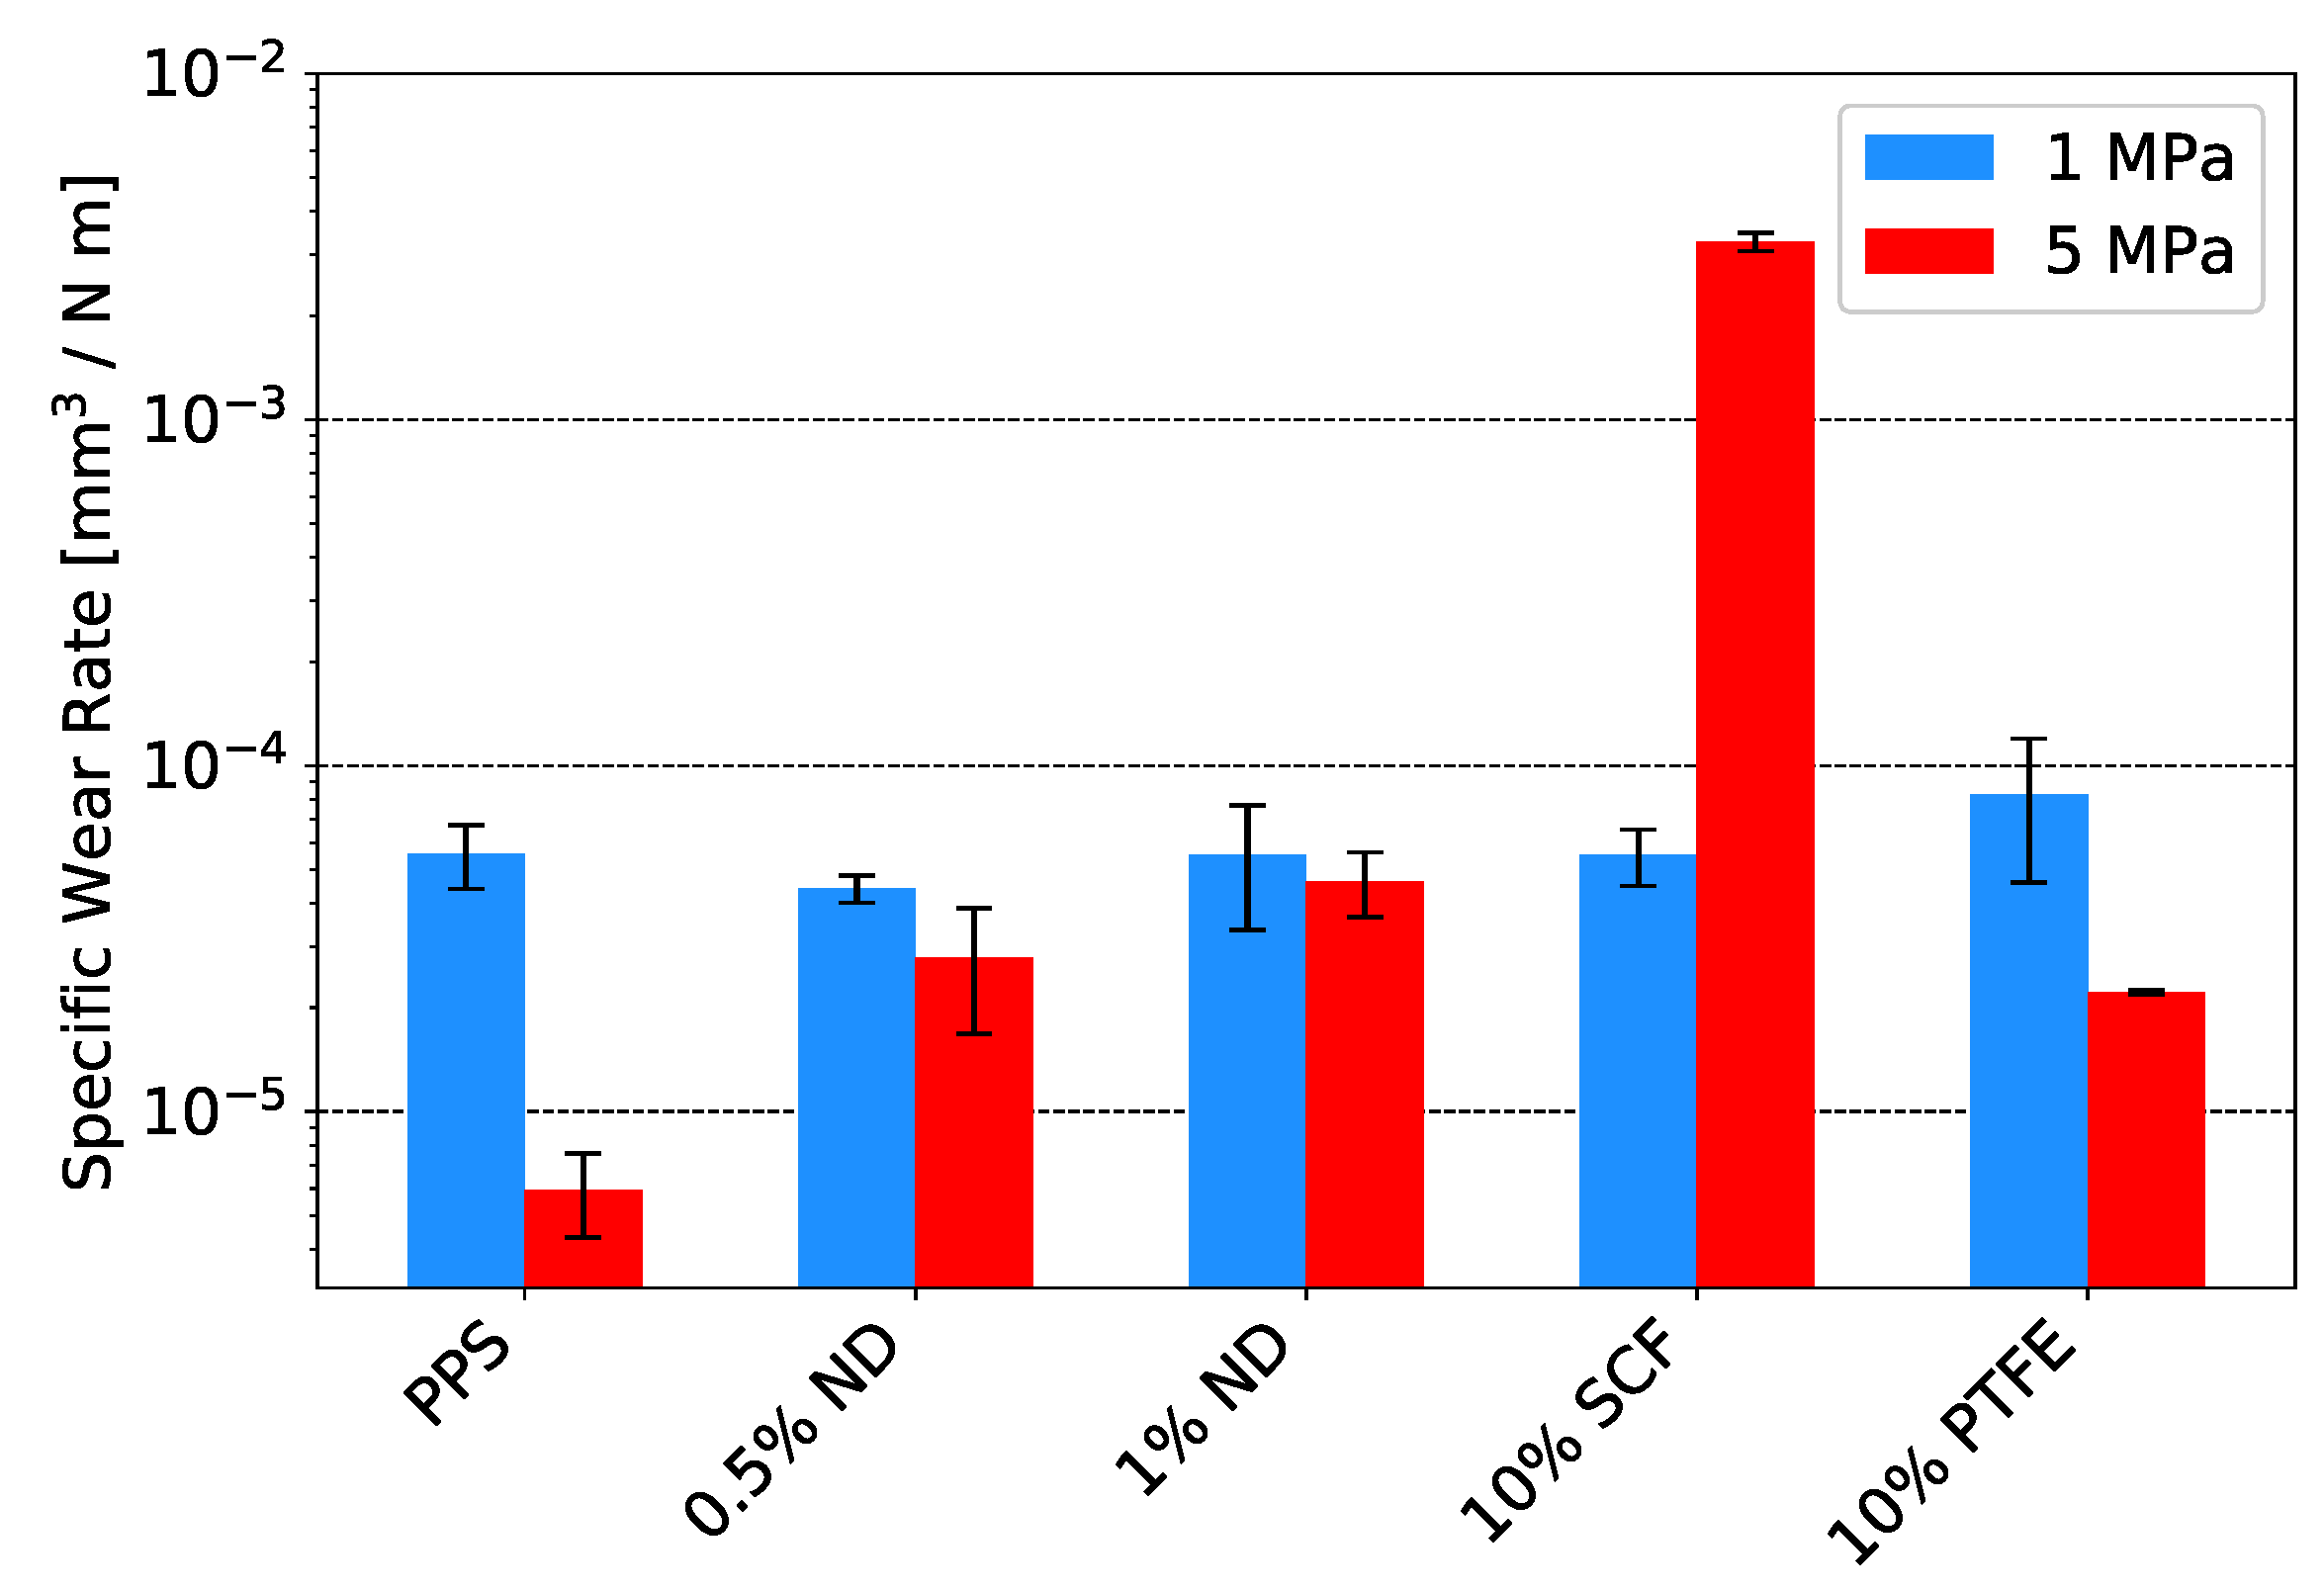
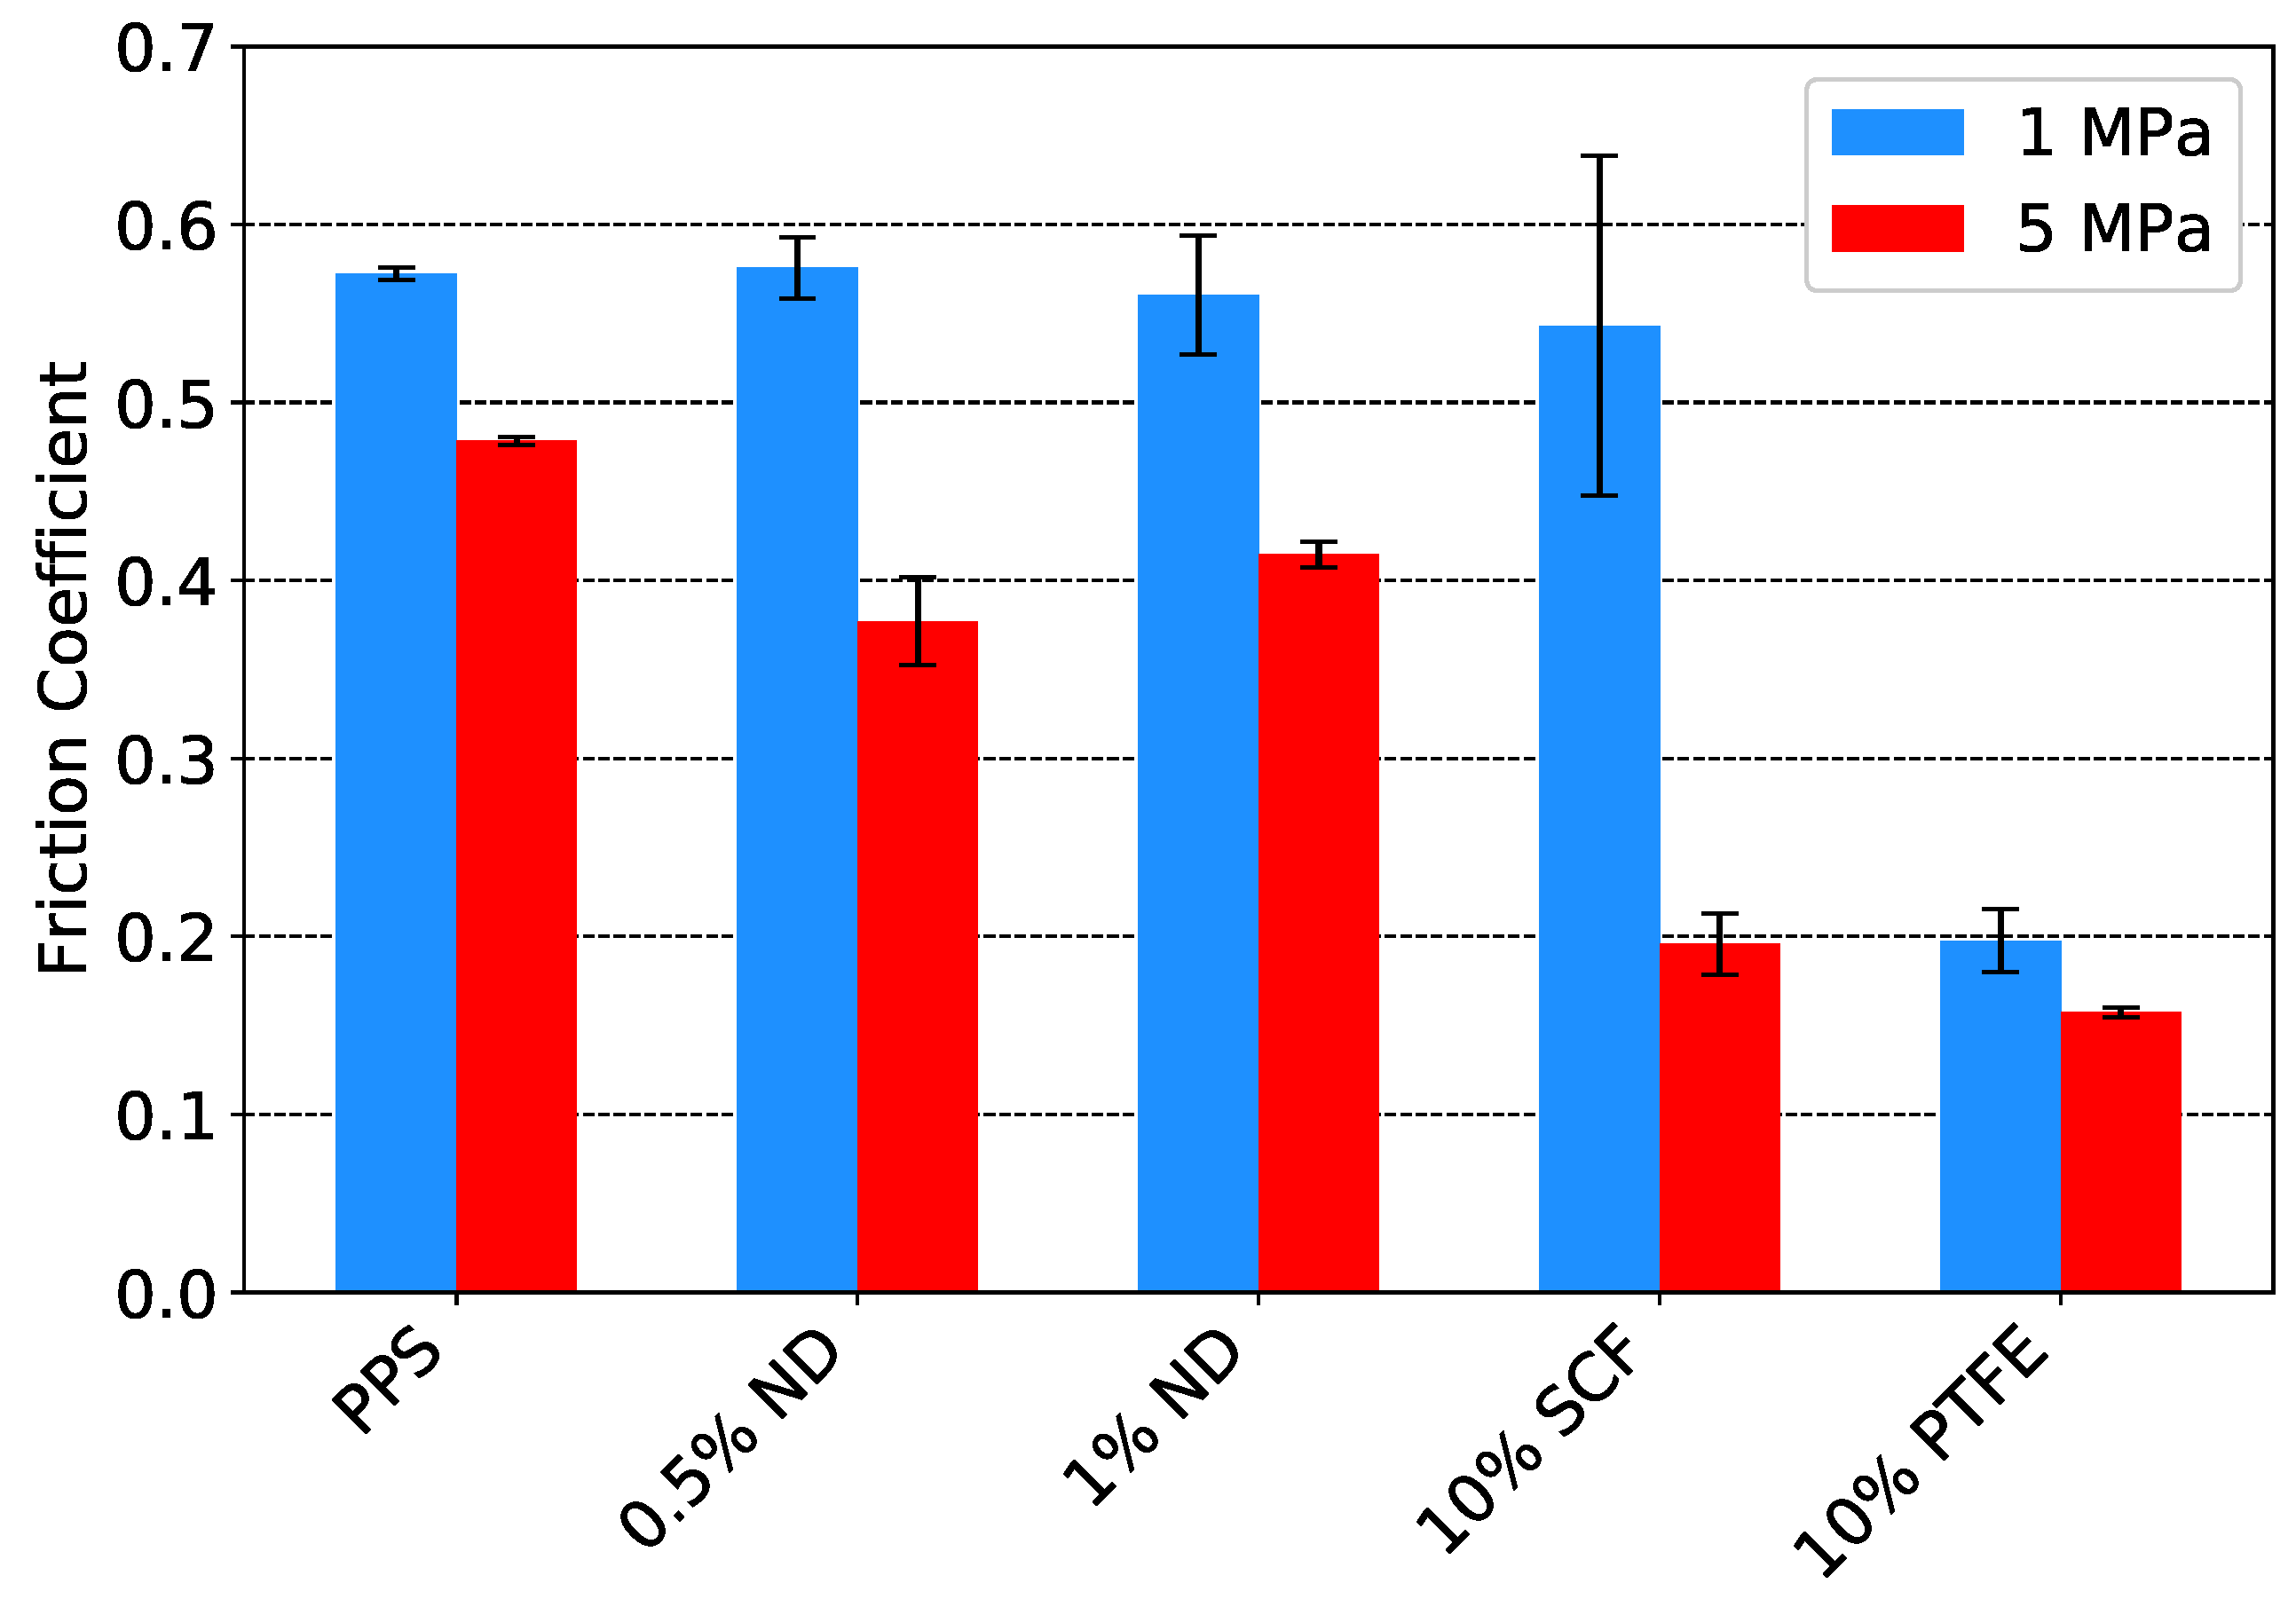
3.5.1. Friction and Wear

The friction coefficients acquired from the first series (see Table 1a) can be found in Figure 8. The addition of 10% SCFs reduced the coefficient of friction by over 40% while for an increased quantity of 30% SCF, the coefficient of friction was 55% lower with respect to pure PPS. The results show that GO does not reduce the friction when added as sole filler while in combination with SCF, a reduced friction is evident. The multi scale composite combining the different fillers showed more clearly that ND is more effective in reducing friction than the added GO, providing a reduction in friction by over 50%. This is a result of the synergistic effect of the different reinforcement sizes.
The specific wear rates of the tested materials are presented Figure 9. For the addition of SCFs, a drastic reduction in specific wear rate was observed, in the order of ∼103. Interestingly, the 10% SCF sample provided the lowest specific wear rate of the three tested percentages. When compared to the 10% SCF sample, the 20% and 30% exhibited a specific wear rate higher with a factor 2.2 and 11.3, respectively. At these higher SCF loadings, agglomerates were more likely to form which, due to the absence of a strong bonding between the fibres, act as potential weak spots in the material. The addition of both NDs and GO did not induce a clear reduction in wear rate. However, in combination with 10% SCF, a synergistic effect was observed by the addition of NDs. The multi scale composite reinforced with NDs and SCFs had a specific wear rate 40% lower than the 10% SCF reinforced PPS. The multi-scale composites with added NDs provided the lowest friction and wear characteristics of all tested materials.
Based on the above presented results, only a small selection of composites was tested in the second series (see Table 1b). The friction coefficients as acquired in water lubricated conditions are presented in Figure 10. For both of the two tested contact pressures, it is visible that addition of NDs and SCFs reduced the friction coefficient with respect to pure PPS. Notable is that under both contact pressures, the 0.5% ND samples provided a lower friction than the 1% sample. The PTFE blended PPS sample provided a lower friction coefficient in the range of the SCF reinforced material.
The corresponding specific wear rates show an identical trend for the carbon based reinforced materials although the decrease in wear is more significant under the higher contact pressure of 5 MPa, see Figure 11. Despite PTFE being rather susceptible to high wear rates in dry conditions, the specific wear rate is notably lower than that of pure PPS in water lubricated conditions. This is expected to be a result of a better lubrication film formation, reducing the contact between the two bearing surfaces. The addition of SCFs provided the most pronounced decrease in wear rate for both contact pressures, in line with the earlier discussed results of the first series.
By analysing the real time wear amount of the different composites under water lubricated conditions, it was observed that the materials without SCFs have a constant wear rate right from the initiation of the test. The SCF-filled composites exhibit a run-in period before the wear rate stabilizes. This run-in period indicates an initial surface modifications and a change in wear mechanism.
The friction coefficients of the composites as tested under dry sliding conditions can be found in Figure 12. At a contact pressure of 1 MPa, only the addition of PTFE showed to decrease the friction coefficient significantly by 65%. At 5 MPa, the effect of the reinforcements was more pronounced. NDs provided a notable decrease in friction while the addition of SCFs and PTFE resulted in a decrease of 59% and 67%, respectively.
The specific wear rates of dry tests are illustrated in Figure 13. It was found that carbon reinforcements had no major effect on the wear resistance of the material at a contact pressure of 1 MPa. The addition of PTFE increased the specific wear rate slightly. At 5 MPa, the addition of all reinforcements showed to have an adverse effect on the specific wear rate of the composites, performing worse than pure PPS. PTFE is known to posses a lower wear resistance than PPS and its effect on the wear behaviour of the composite is therefore in line with expectations. The high wear rates of the carbon-based reinforces composites is believed to be due to the release and abrasive nature of the reinforcements. The addition of nanoparticles can have a positive effect on reducing wear by preventing the release of SCFs under sliding [24]. In an effort to enhance the wear resistance of the SCF-composite, additional dry tests were performed with a multi scale composite containing both NDs and SCFs. These tests showed an improved wear resistance with respect to the SCF composite but still exhibited a lower wear resistance than the ND and PTFE composites as well as pure PPS.

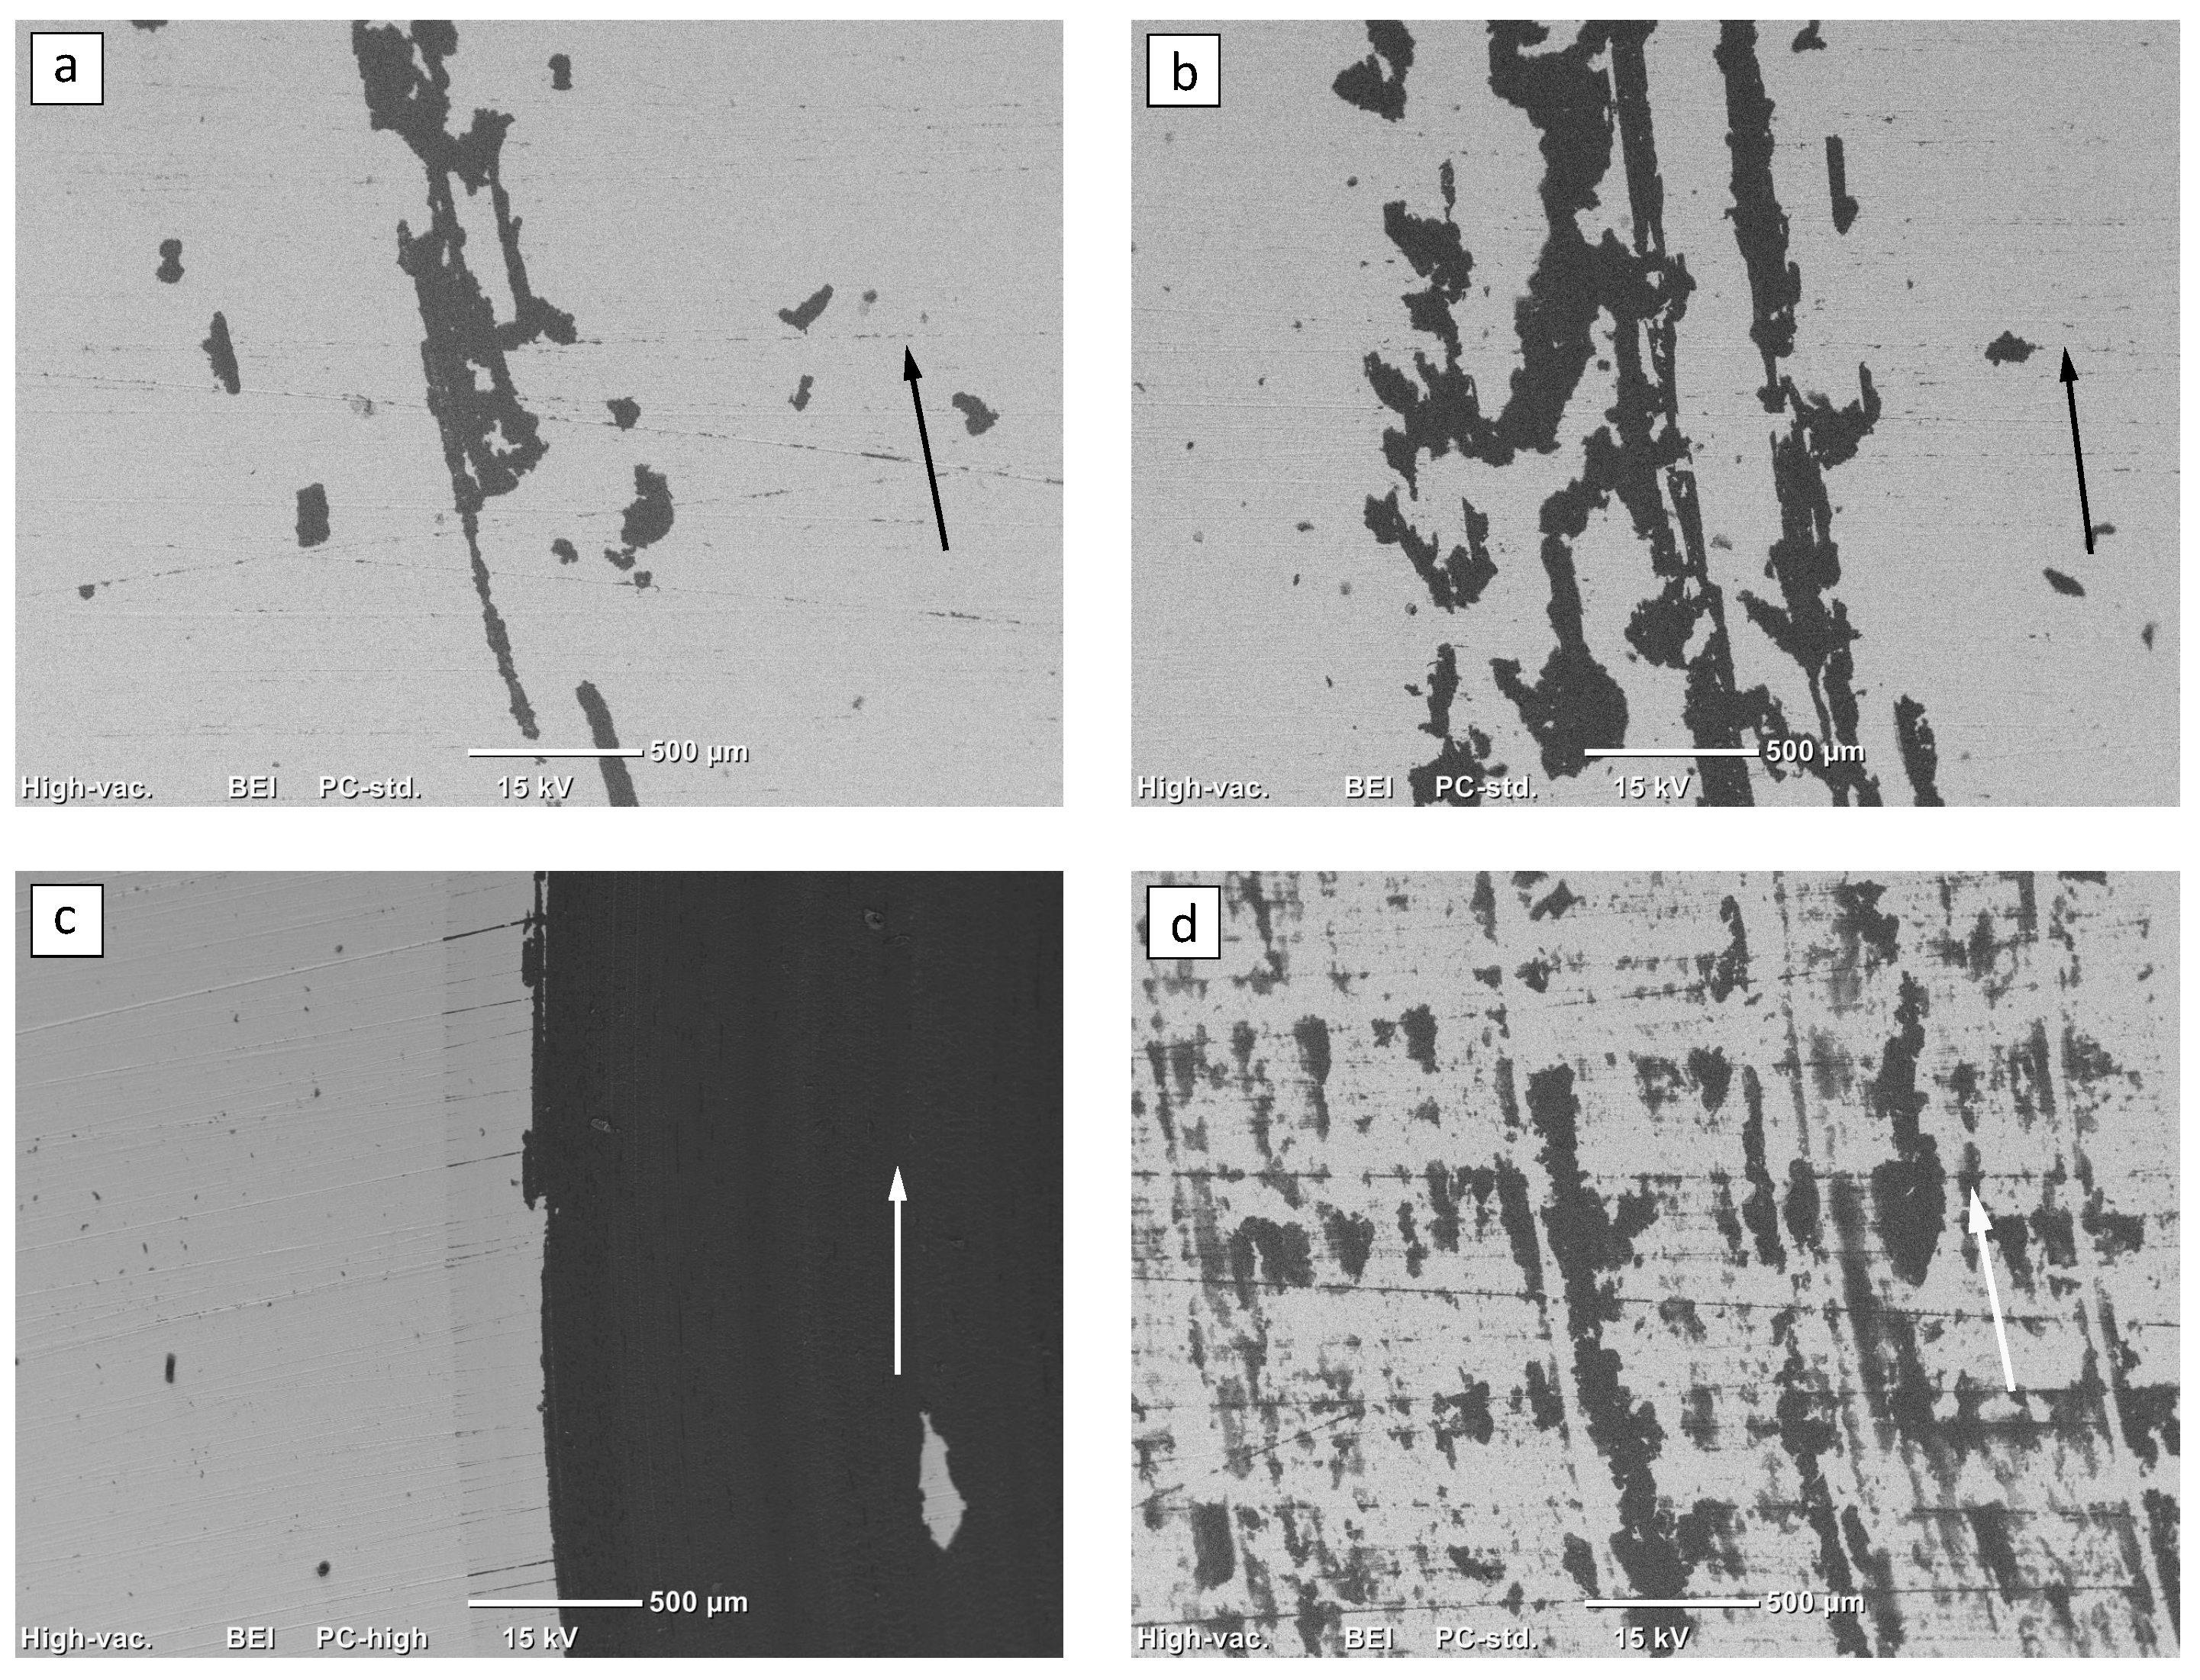
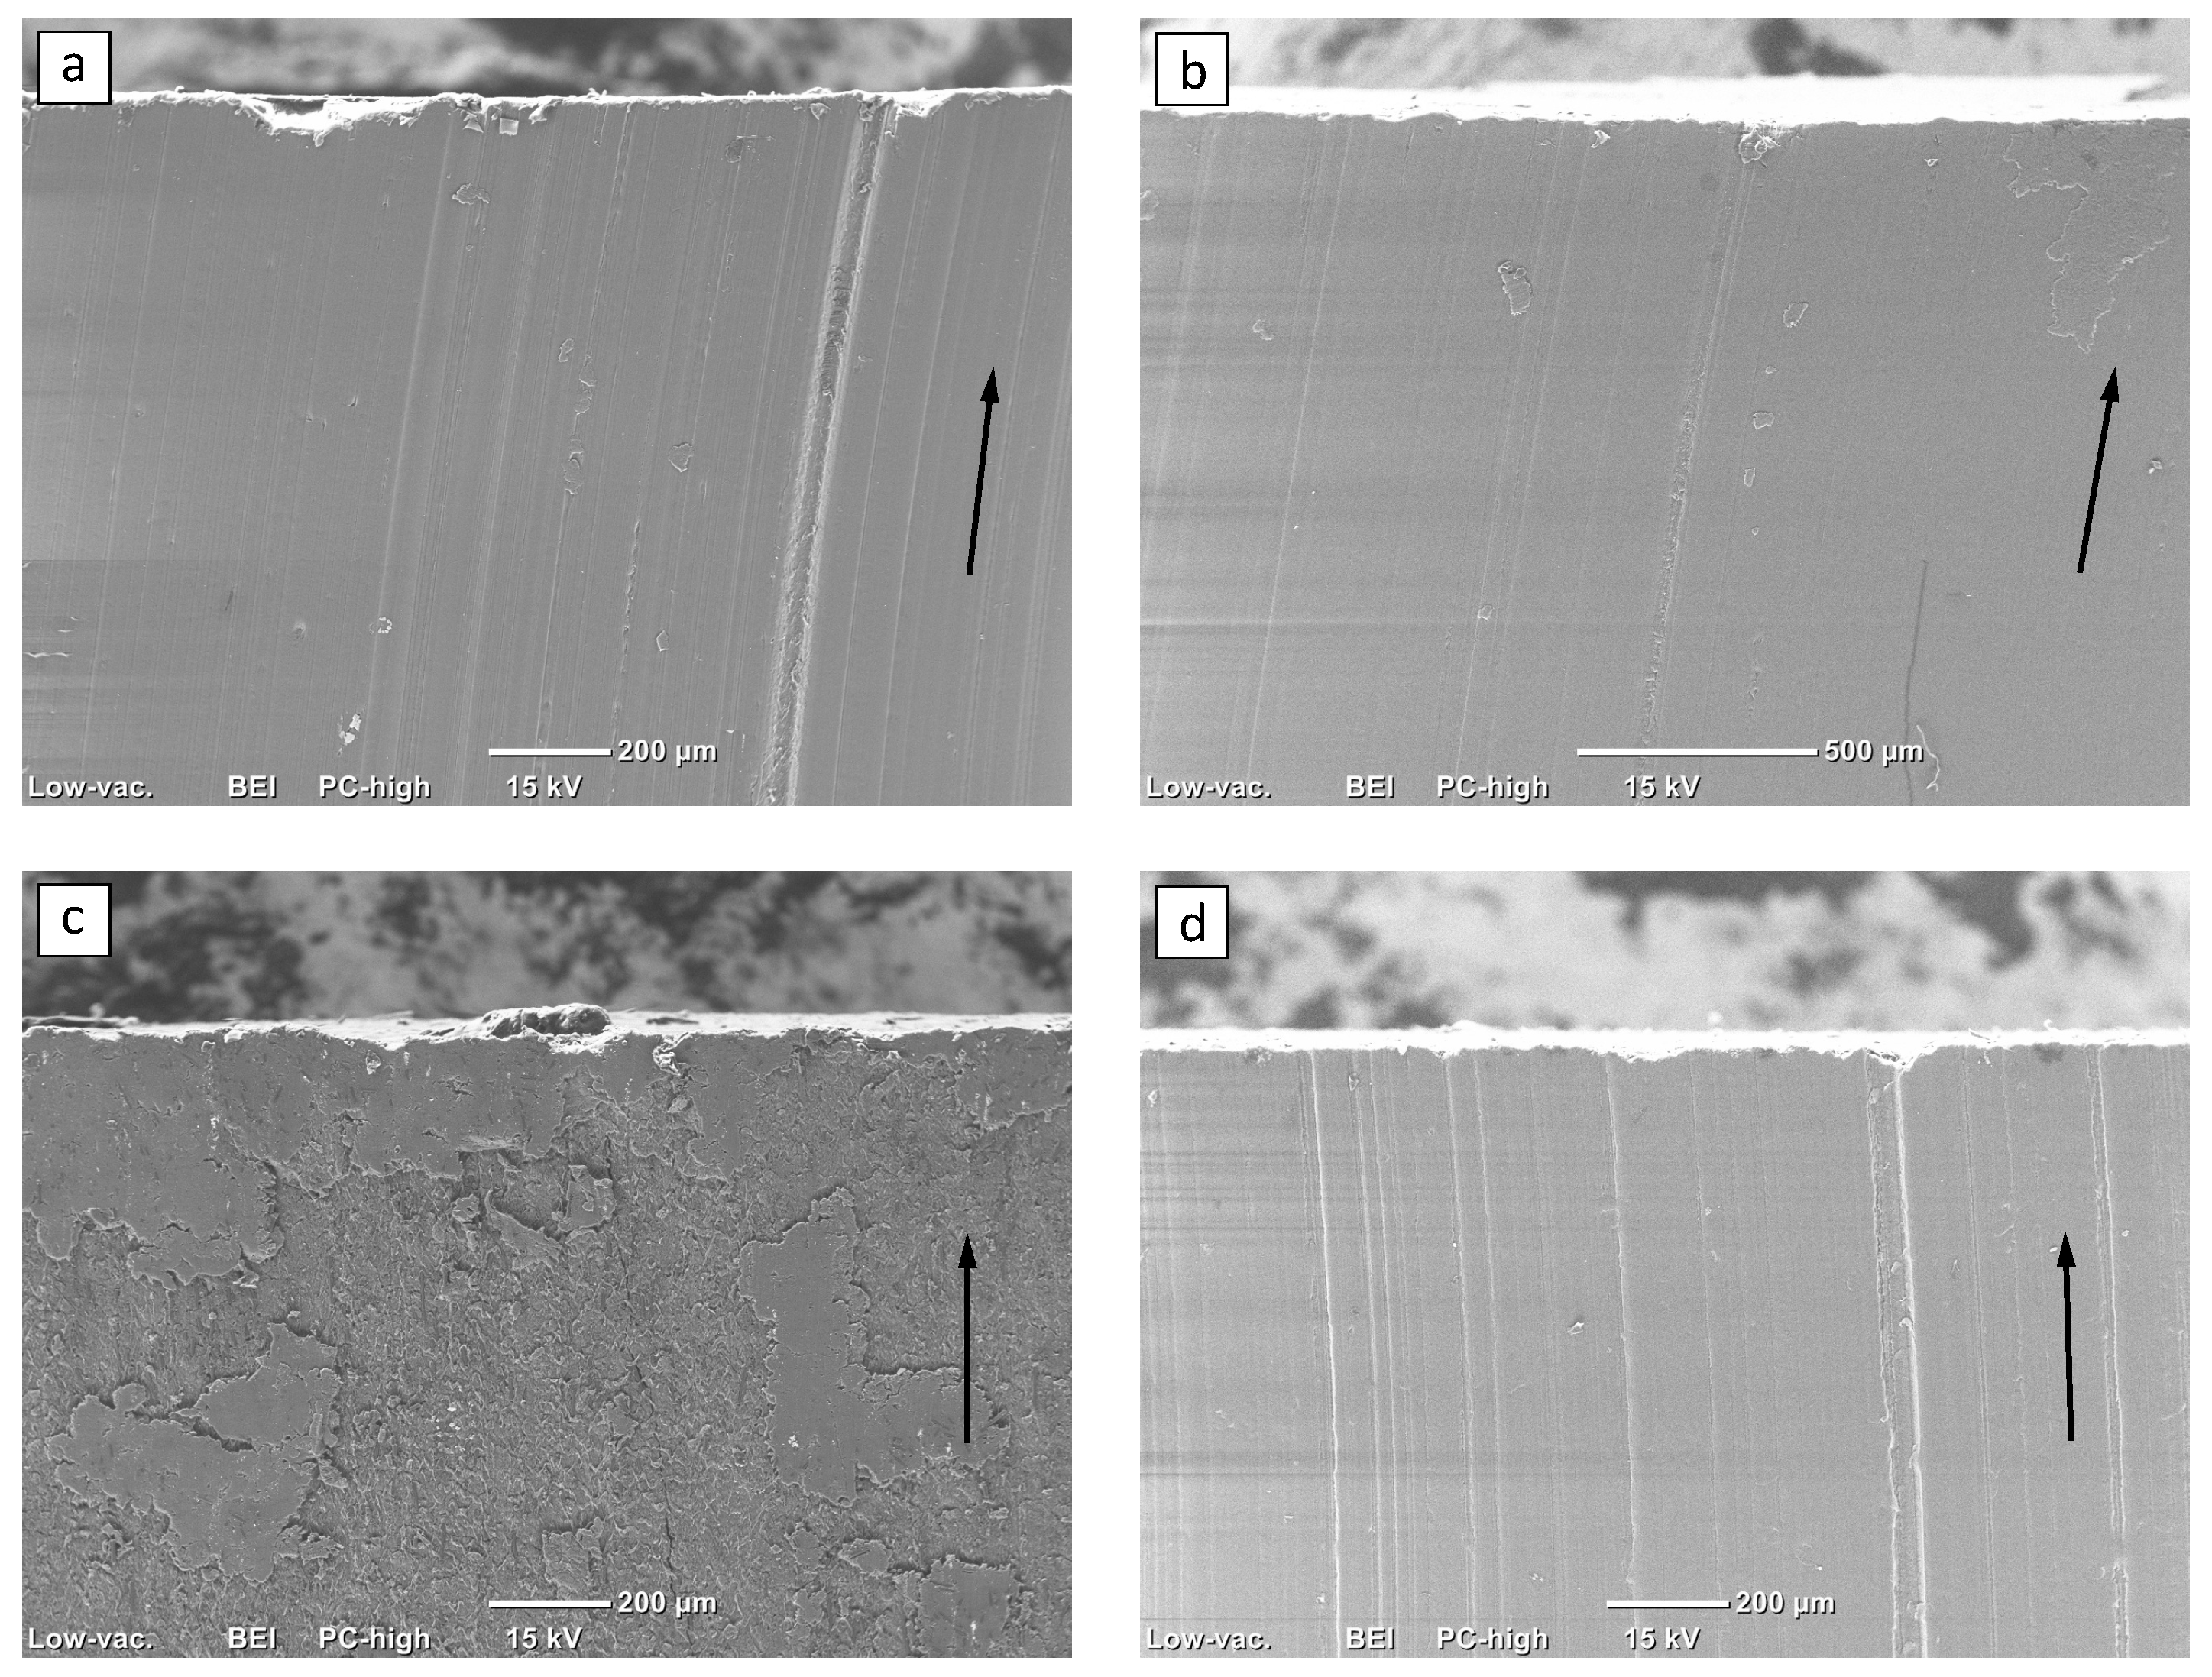
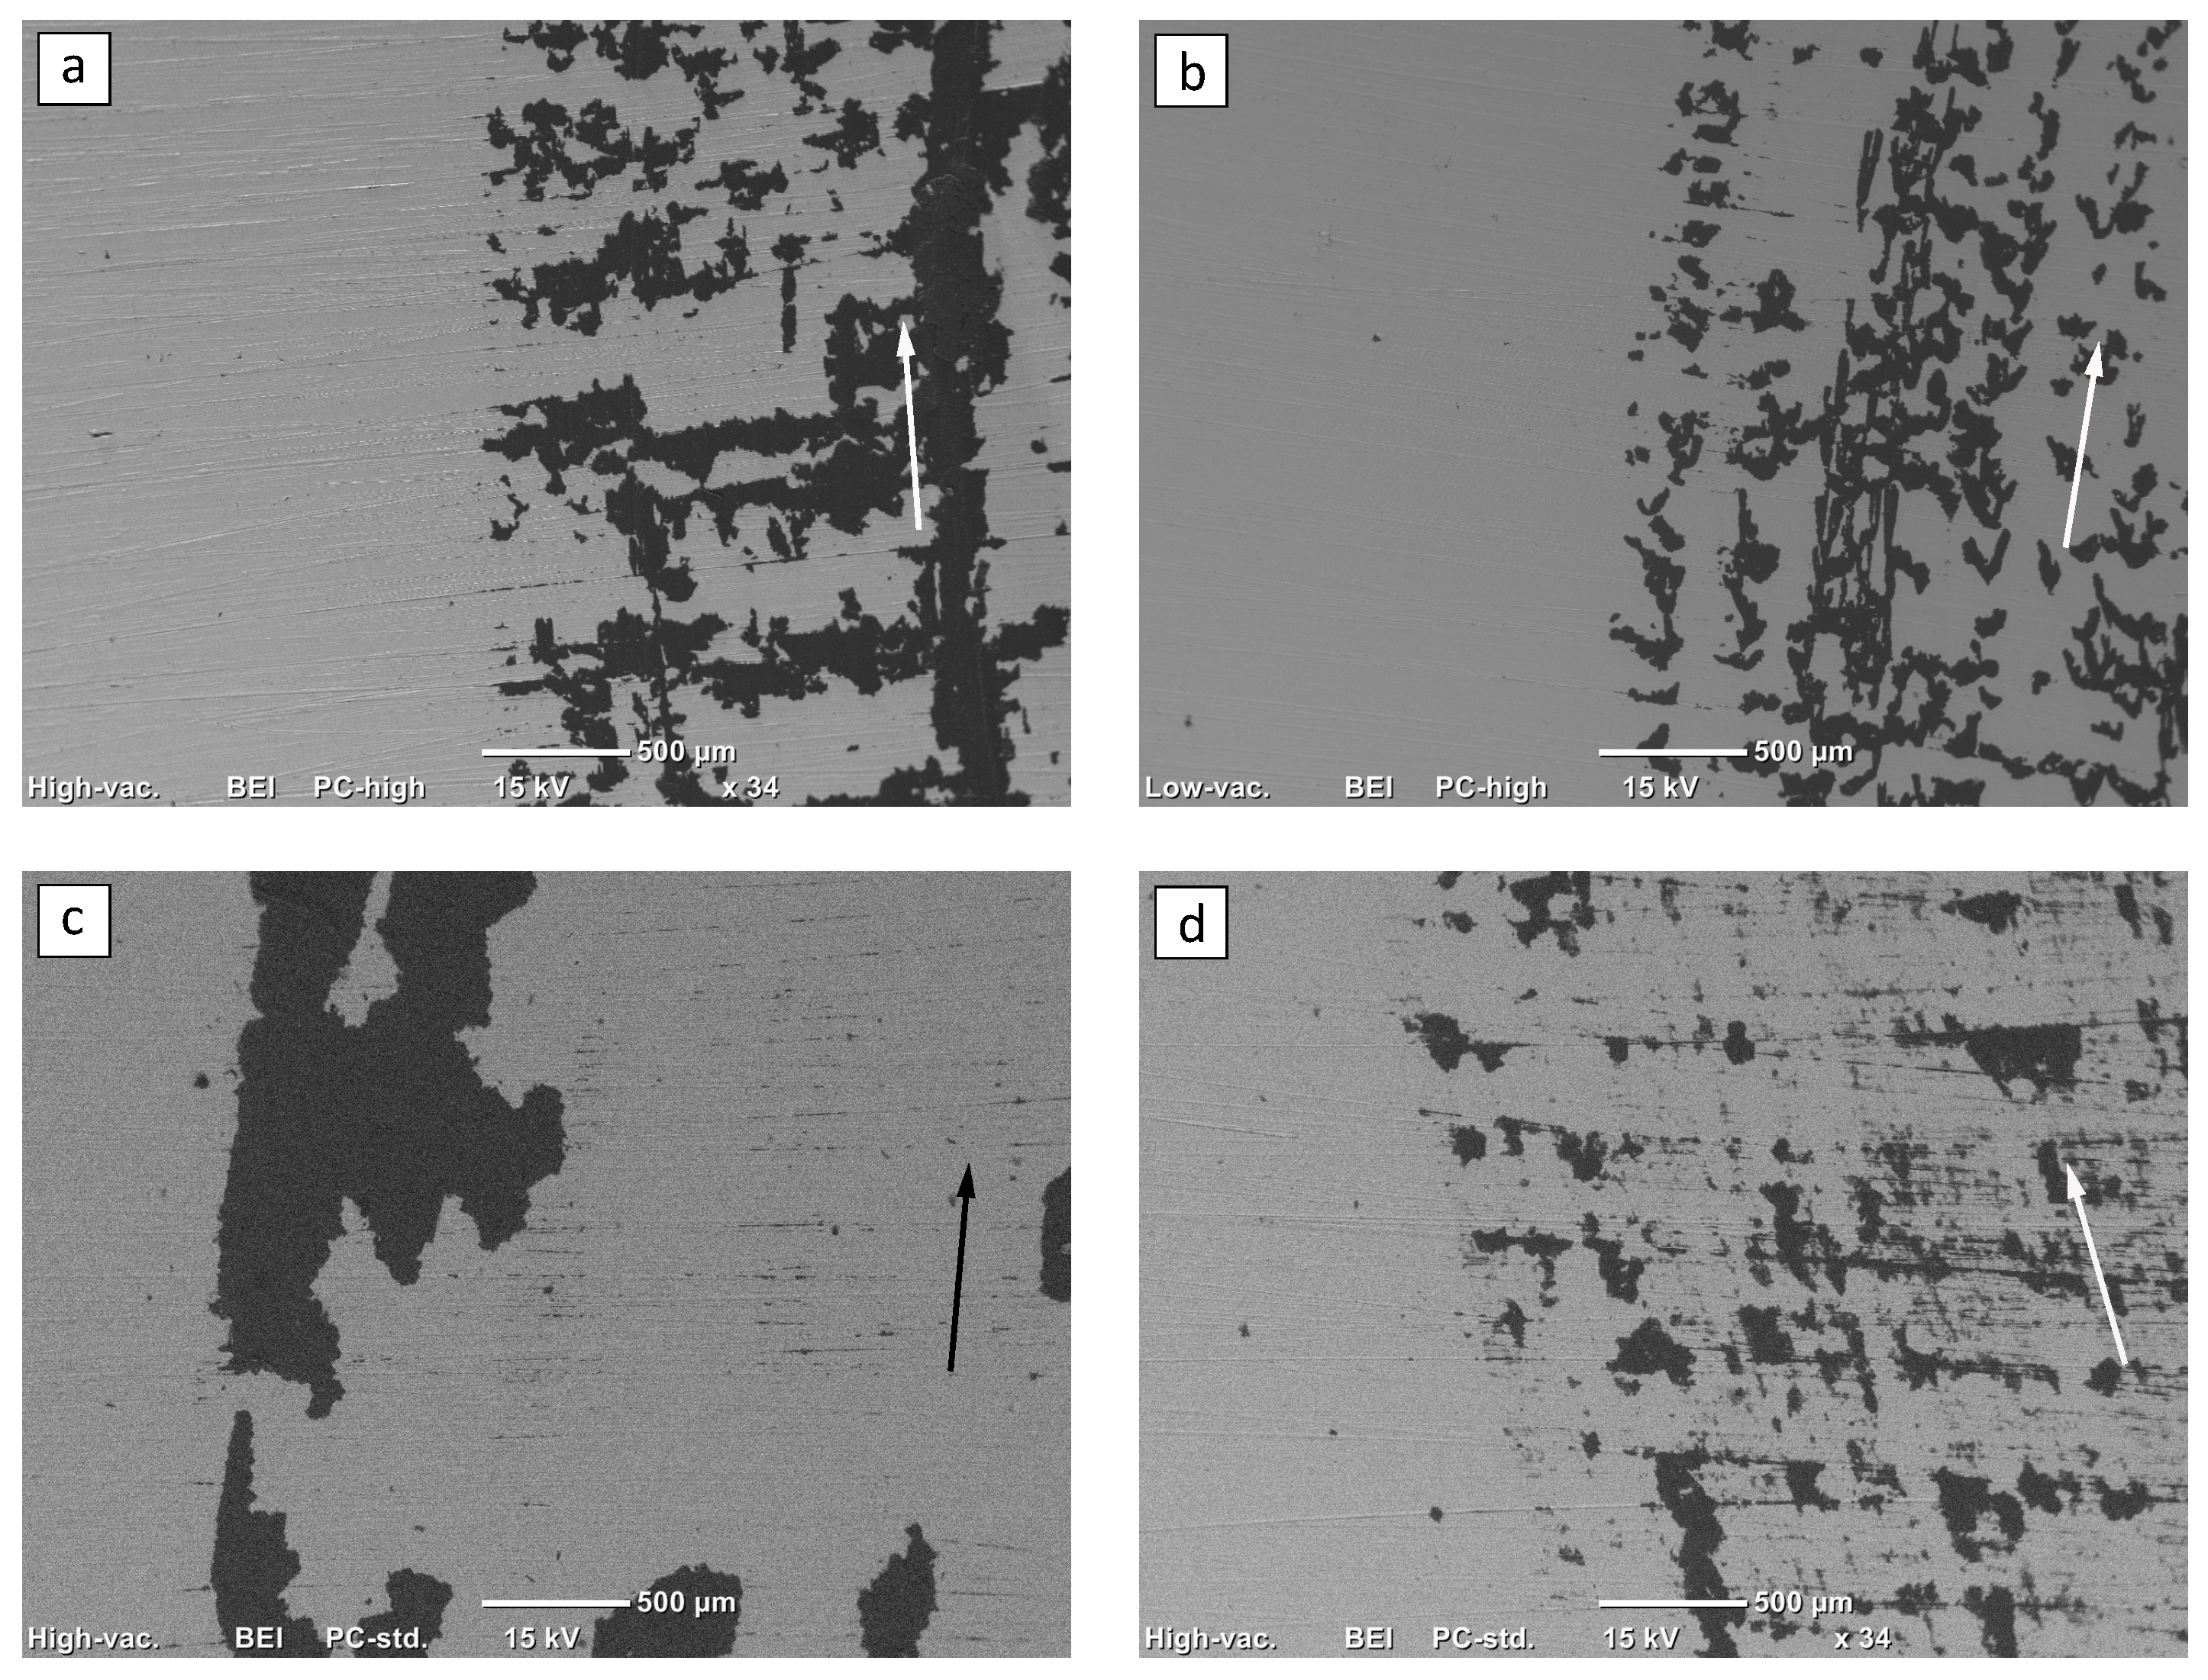
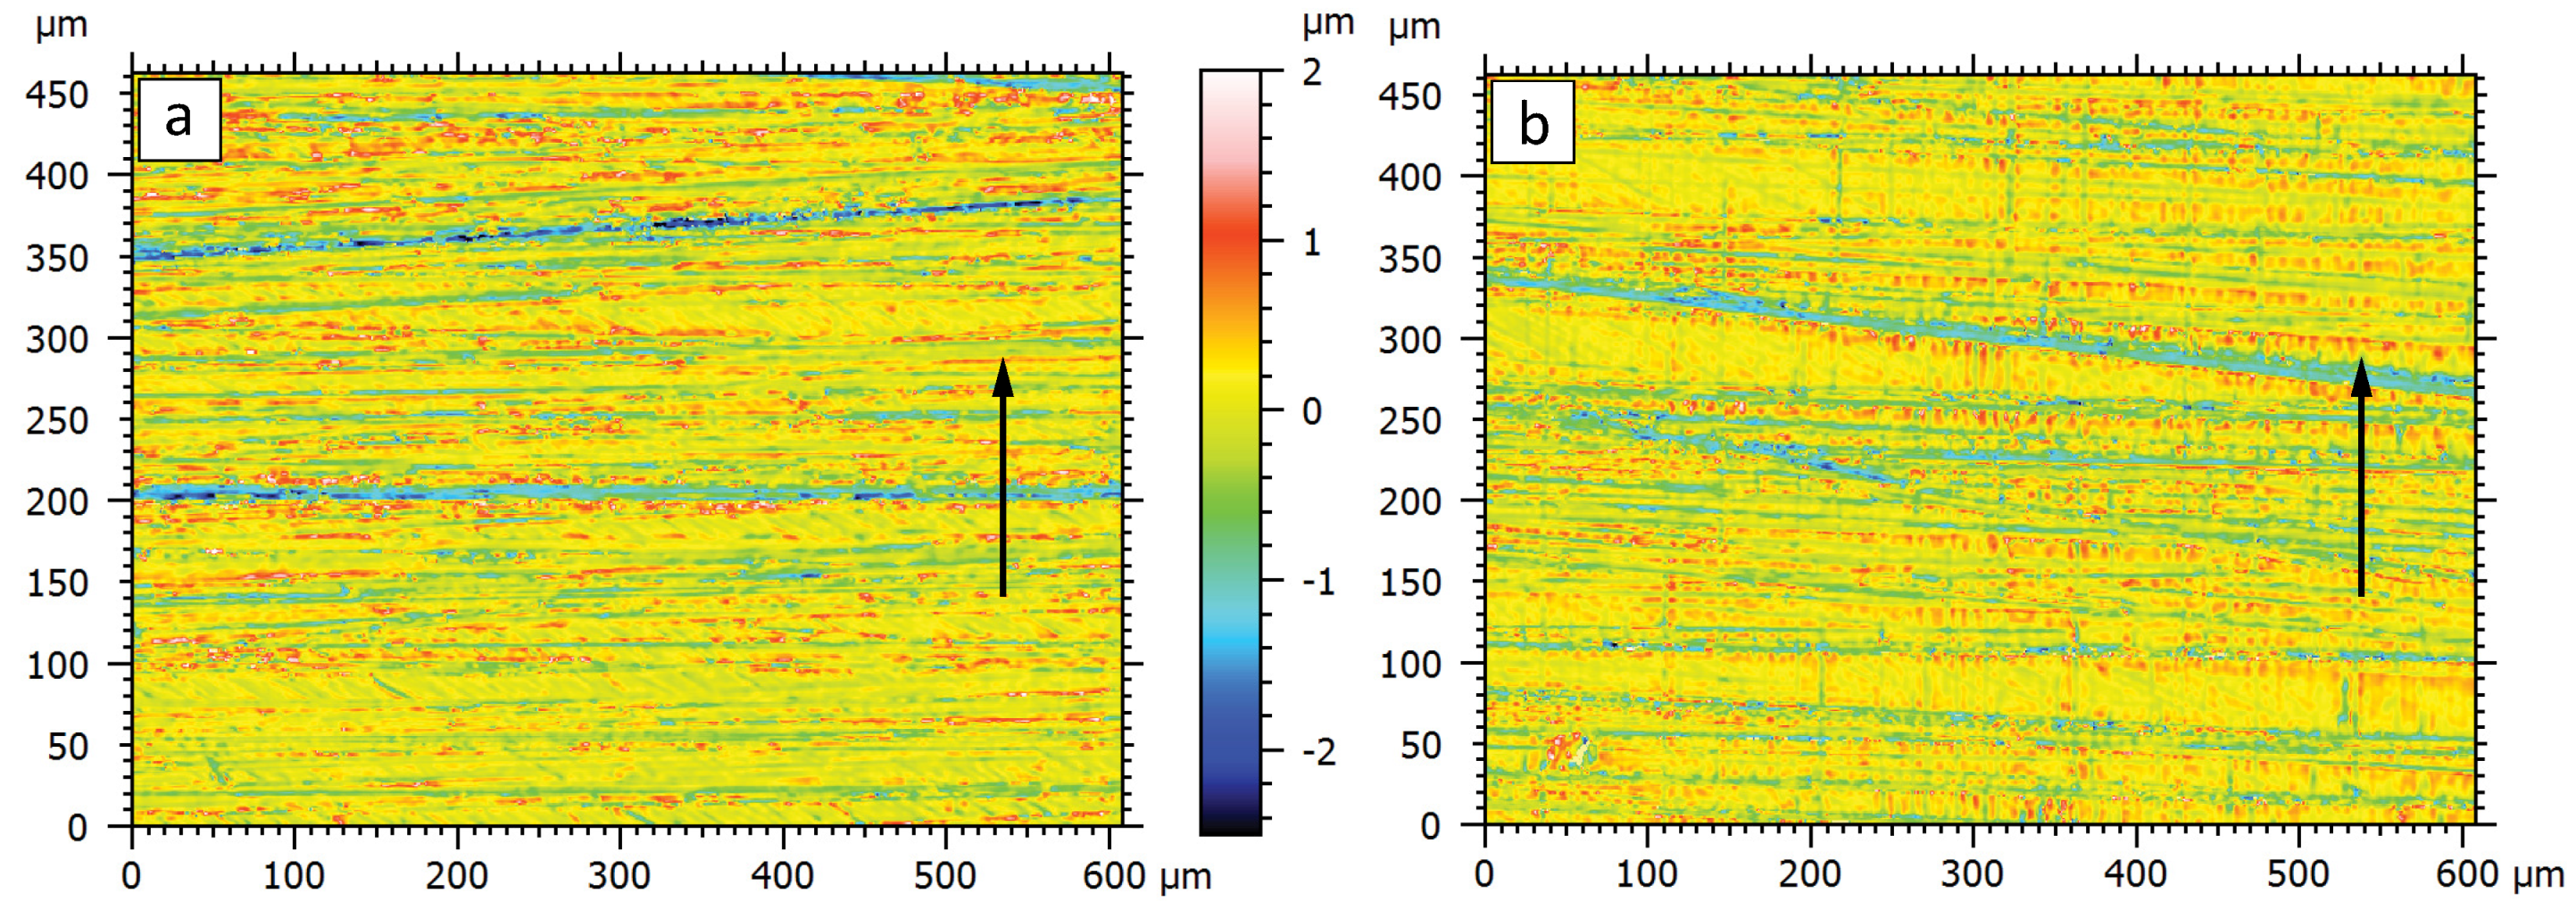
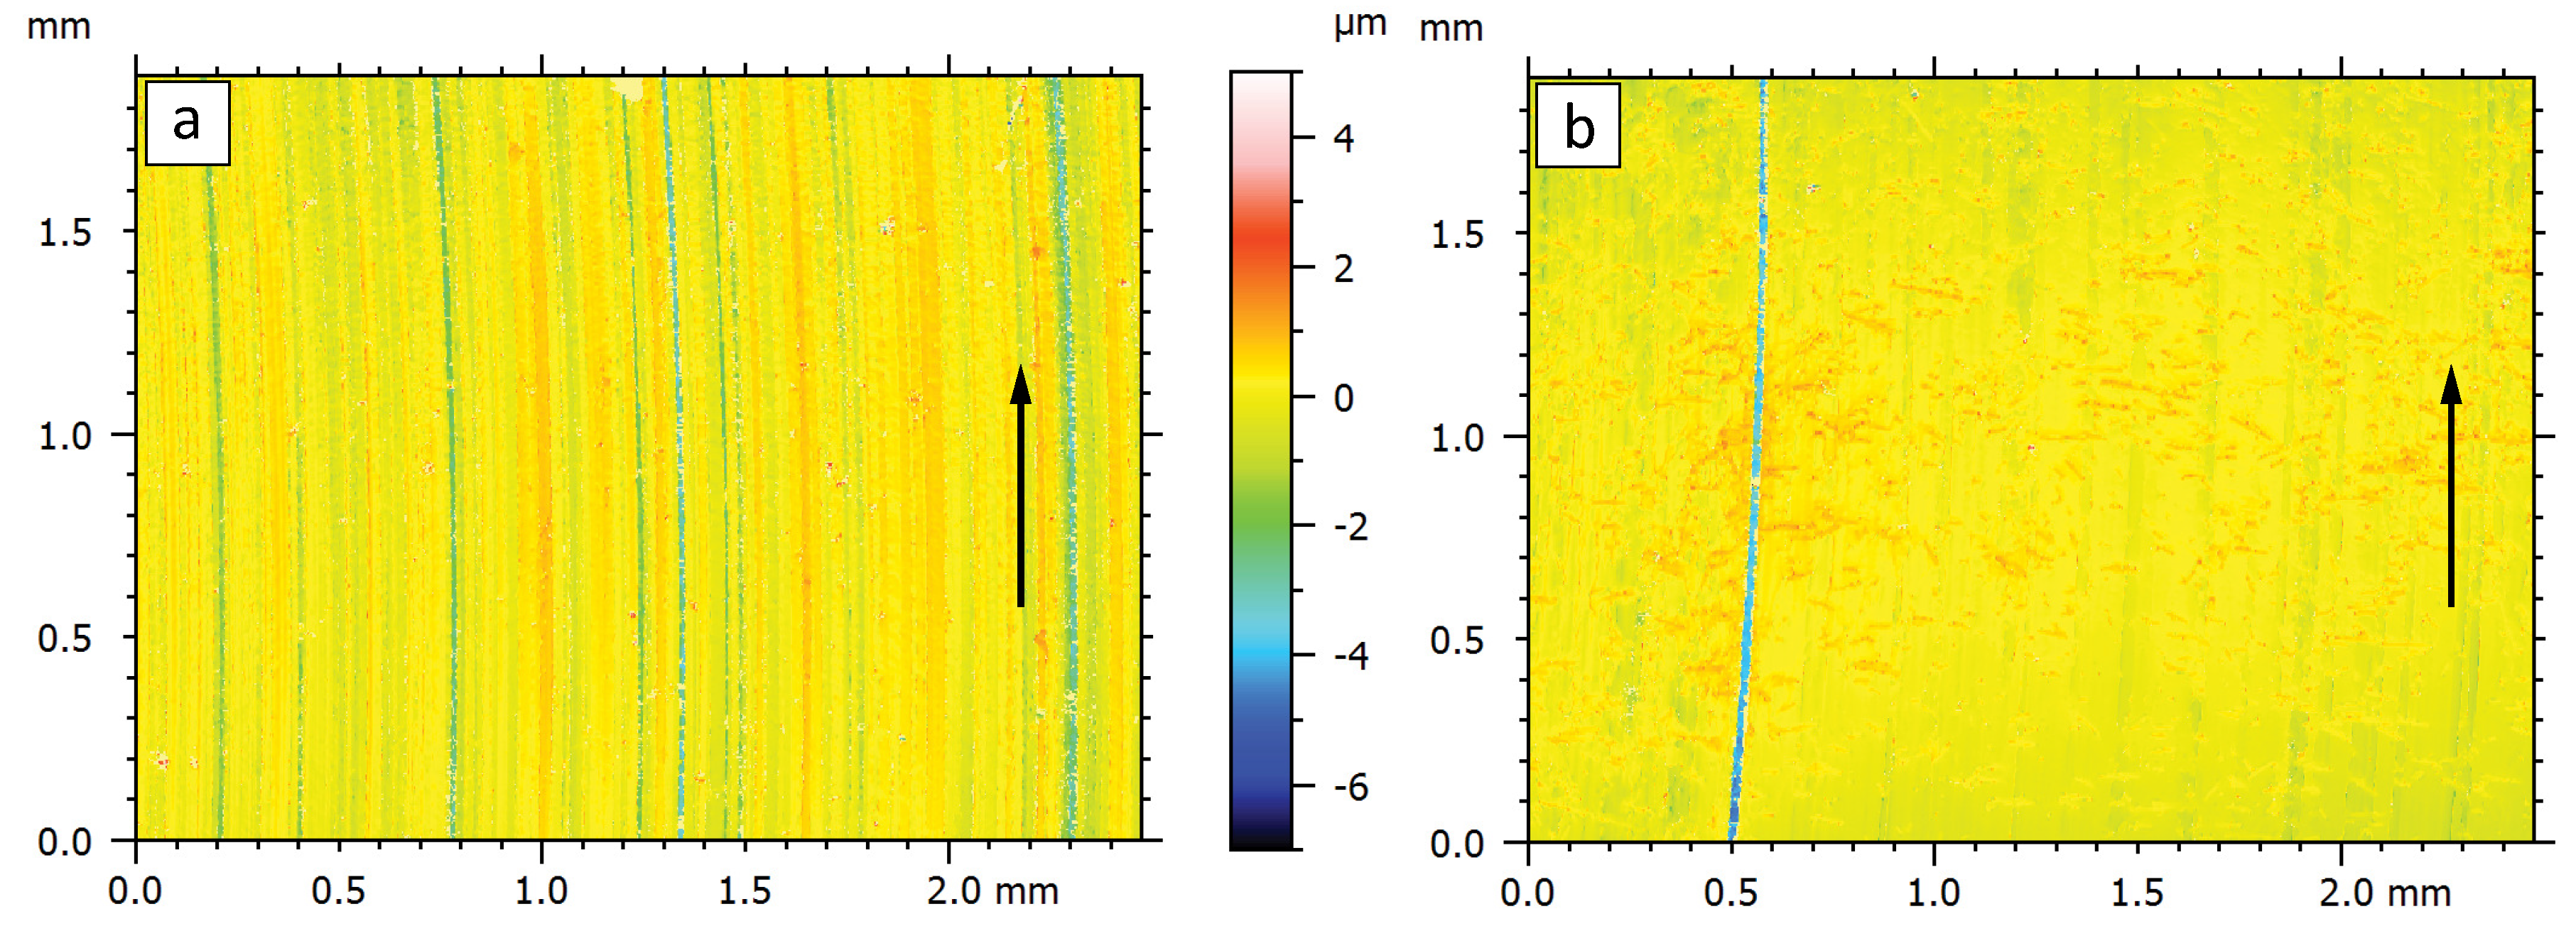
3.5.2. SEM/EDS and Optical Profilometry Observations

By means of SEM and EDS analysis of the counter surface, no transfer film formation could be identified for the counter surfaces used in water lubricated conditions. Under dry conditions, the SEM images showed the presence of transferred material on the counter surface albeit rather discontinuous for the pure PPS at 1 MPa as presented in Figure 14a. Both NDs and SCFs show to stabilize and increase the transfer film formation as may be seen in Figure 14b and Figure 14c, respectively. SCFs especially enhanced the transfer film formation, forming a thick and continues layer, whereas the PTFE showed to make the transfer film more uniform. At 5 MPa, for pure PPS, an increased transfer film formation was evident with respect to 1 MPa which may be attributed to an increased surface temperature, effectively enhancing the transfer film adhesion [25]. The addition of NDs and SCFs both show to have an adverse effect of the transfer film as can be seen in Figure 15. These results are a visual confirmation of the earlier presented tribological performance and are likely related to the abrasive nature of the added reinforcements [25]. By optical profilometry on the counter surface, see Figure 16, scratches could furthermore be identified in the sliding direction as a result of scuffing of the protruding and released SCFs and the absence of an adhered transfer film.
By inspecting the polymer pin surface, abrasive wear was identified as the most dominant wear mechanism under water lubricated conditions for both tested contact pressures. Grooves originating from the repetitive contact with the counter surface asperities are clearly visible as can be seen in Figure 17. The embedded SCFs are prominently present on the bearing surface and are expected to take up a large part of the load which corresponds to the found reduction in friction and wear. The wear mechanism for the SCF filled samples showed to be more dependent on shear thinning of embedded fibers. The addition of NDs in combination with SCF shows to protect the SCFs from extensive thinning by acting as a barrier between the two bearing surfaces [24,26]. For the sole ND reinforced samples a more smooth surface was observed with respect to pure PPS which indicates a polishing effect of released NDs, reducing both friction and wear [27], see Figure 18.
Under dry conditions the addition of NDs and PTFE showed no clear visual effect with respect to the pure PPS sample as may be seen in Figure 19. The SCF composite pin presented a rather smooth surface at a contact pressure of 1 MPa whereas at 5 MPa the surface indicated a much higher wear, see Figure 19c. The pin surface showed smooth load bearing plateaus, likely supported by embedded SCFs. Between these plateaus however, the surface appeared irregular which is a clear indication of third body abrasion. It is expected that under this higher contact pressure of 5 MPa, SCFs are released as a result of polymer cracking at the fiber-polymer interface due to stress concentrations and PPS’ brittle nature [24]. With an increased friction due to the higher contact pressure, a higher contact temperature may accelerate the polymer cracking and consequent release of reinforcements. The released particles act as a third body abrasive causing more abrasive wear and damage to the pin surface as well as inhibiting a transfer film formation on the counter surface. Due to the rolling effect of the released reinforcements, a lower friction was evident under these high wear conditions. This identical phenomenon also showed to be present for the ND filled composites, although the effect was less pronounced on the wear rate due to the particle shape, smaller particle size and lower concentration. Although three body abrasion is generally assumed to cause lower wear rates than two body abrasion, the above presented results show that the wear rate is also highly dependent on presence of a lubrication and the geometry and hardness of the abrasive media present between the two bearing surfaces.
As evident from the Figure 14 and Figure 15, an increased adhesion and transfer film formation was present for the PPS samples blended with 10% PTFE in dry sliding. While increasing the transfer film formation, the blending of PTFE with PPS is also expected to lower the brittleness of the polymer, effectively reducing the release of SCFs under sliding. A combination of these two effects is expected to suppress increase in wear rate as found by adding SCF. This reduction in wear rate is however highly dependent on the transfer film adhesion and the contact pressure, sliding speed and surface properties of the counter surface will therefore need to be considered [10]. A higher percentage of PTFE may furthermore be required to reduce the release and consequent abrasion of the embedded SCFs and NDs.

3.6. Wettability

As the wettability of a bearing material is an important factor on the tribological behaviour in lubricated conditions, the wettability of the second material series was analyzed. It was observed that the addition of SCFs and PTFE increased the water contact angle as presented in Table 3. The addition of NDs showed a slight increase in contact angle but within the range of the standard deviation. The calculated surface free energy of the NDs samples showed larger differences with respect to virgin PPS and was significantly lower, indicating a more hydrophobic surface. Also the SCF and PTFE specimen provided a great reduction in surface free energy. This is favourable property for the formation and maintenance of lubrication films [28]. Is it believed that this increase in hydrophobicity by the addition of SCFs and PTFE decreases friction and wear in water lubricated conditions as was evident in the above presented results.

3.7. Dilatometry

The dilatometry results, as presented in Table 3, indicated a clear effect of the reinforcements on the linear coefficient of thermal expansion. It was found that the addition of NDs and PTFE to PPS slightly increases the linear coefficient of thermal expansion. SCFs on the contrary, forces a significant decrease in thermal expansion reducing it by 60%. This behaviour is a consequence of the inherent stiffness of carbon fibers and low thermal expansion coefficient. The decrease is favourable with respect to dimensional stability at different temperatures which is an important factor in bearing applications.

4. Conclusions

In this study PPS based composites were successfully prepared with both micro and nano scale reinforcements as well as PTFE. From the acquired experimental results the following conclusions can be drawn:
  • The used sample preparation processes did not negatively influence the polymer powder morphology and a good reinforcement dispersion was evident.
  • The addition of the carbon based reinforcements increased the thermal stability of the polymer by delaying the thermal degradation.
  • SCF and ND were effective in reducing friction and wear in water lubricated conditions. A synergistic effect was observed by combining both reinforcements, reducing the friction coefficient by over 50% and the specific wear rate in the order of ∼103.
  • Under dry sliding conditions, the addition of ND and SCF allowed for a reduction in friction but an increase in specific wear rate was observed.
  • The addition of PTFE reduced both friction and wear in water lubricated conditions while under dry sliding conditions only the friction coefficient was reduced by over 67%.

Author Contributions

Data curation, formal analysis and investigation J.S., A.J.; methodology, conceptualization and funding acquisition: N.E.; validation and project administration: J.S., A.J.; writing original draft: J.S.; review and editing: N.E., A.J.

Funding

This research was financially supported by LTU Business AB.

Conflicts of Interest

The authors declare no conflict of interest.

References

  1. Nicolais, L.; Meo, M.; Milella, E. Composite Materials: A Vision for the Future; Bücher, Springer: London, UK, 2011. [Google Scholar] [CrossRef]
  2. Brostow, W.; Lobland, H.E.H. Materials: Introduction and Applications; John Wiley & Sons: Hoboken, NJ, USA, 2016. [Google Scholar]
  3. Briscoe, B.J.; Sinha, S.K. Chapter 1—Tribological applications of polymers and their composites—Past, present and future prospects. In Tribology of Polymeric Nanocomposites, 2nd ed.; Friedrich, K., Schlarb, A.K., Eds.; Butterworth-Heinemann: Oxford, UK, 2013; pp. 1–22. [Google Scholar] [CrossRef]
  4. Frlic, S. Tribological Behaviour of Polymer Materials for Gear Applications. Master’s Thesis, Luleå University of Technology, Luleå, Sweden, 2016. [Google Scholar]
  5. Golchin, A.; Friedrich, K.; Noll, A.; Prakash, B. Tribological behavior of carbon-filled PPS composites in water lubricated contacts. Wear 2015, 328–329, 456–463. [Google Scholar] [CrossRef]
  6. Yamamoto, Y.; Hashimoto, M. Friction and wear of water lubricated PEEK and PPS sliding contacts Part 2. Composites with carbon or glass fibre. Wear 2004, 257, 181–189. [Google Scholar] [CrossRef]
  7. Chukov, D.I.; Stepashkin, A.A.; Maksimkin, A.V.; Tcherdyntsev, V.V.; Kaloshkin, S.D.; Kuskov, K.V.; Bugakov, V.I. Investigation of structure, mechanical and tribological properties of short carbon fiber reinforced UHMWPE-matrix composites. Compos. Part B Eng. 2015, 76, 79–88. [Google Scholar] [CrossRef]
  8. Zhang, D.; Qi, H.; Zhao, F.; Zhang, G.; Wang, T.; Wang, Q. Tribological performance of PPS composites under diesel lubrication conditions. Tribol. Int. 2017, 115, 338–347. [Google Scholar] [CrossRef]
  9. Xu, H.; Feng, Z.; Chen, J.; Zhou, H. Tribological behavior of the carbon fiber reinforced polyphenylene sulfide (PPS) composite coating under dry sliding and water lubrication. Mater. Sci. Eng. A 2006, 416, 66–73. [Google Scholar] [CrossRef]
  10. Luo, W.; Liu, Q.; Li, Y.; Zhou, S.; Zou, H.; Liang, M. Enhanced mechanical and tribological properties in polyphenylene sulfide/polytetrafluoroethylene composites reinforced by short carbon fiber. Compos. Part B Eng. 2016, 91, 579–588. [Google Scholar] [CrossRef]
  11. Golchin, A.; Wikner, A.; Emami, N. An investigation into tribological behaviour of multi-walled carbon nanotube/graphene oxide reinforced UHMWPE in water lubricated contacts. Tribol. Int. 2016, 95, 156–161. [Google Scholar] [CrossRef]
  12. Ayatollahi, M.R.; Alishahi, E.; Doagou-R, S.; Shadlou, S. Tribological and mechanical properties of low content nanodiamond/epoxy nanocomposites. Compos. Part B Eng. 2012, 43, 3425–3430. [Google Scholar] [CrossRef]
  13. Neitzel, I.; Mochalin, V.; Bares, J.A.; Carpick, R.W.; Erdemir, A.; Gogotsi, Y. Tribological Properties of Nanodiamond-Epoxy Composites. Tribol. Lett. 2012, 47, 195–202. [Google Scholar] [CrossRef]
  14. Lee, J.Y.; Lim, D.S. Tribological behavior of PTFE film with nanodiamond. Surf. Coat. Technol. 2004, 188, 534–538. [Google Scholar] [CrossRef]
  15. Vadivel, H.S. Tribological Behaviour of Hybrid Carbon Filled UHMWPE Composites in Water. Master’s Thesis, Luleå University of Technology, Luleå, Sweden, 2016. [Google Scholar]
  16. Friedrich, K. Microstructural efficiency and fracture toughness of short fiber/thermoplastic matrix composites. Compos. Sci. Technol. 1985, 22, 43–74. [Google Scholar] [CrossRef]
  17. Lin, G.M.; Lai, J.K. Fracture mechanism in short fibre reinforced thermoplastic resin composites. J. Mater. Sci. 1993, 28, 5240–5246. [Google Scholar] [CrossRef]
  18. Biswas, S.; Vijayan, K. Friction and wear of PTFE—A review. Wear 1992, 158, 193–211. [Google Scholar] [CrossRef]
  19. Ashby, M.F. Materials Selection in Mechanical Design; Elsevier Science: Amsterdam, The Netherlands, 2004. [Google Scholar]
  20. Hay, J.N.; Luck, D.A. The conformation of crystalline poly(phenylene sulphide). Polymer 2001, 42, 8297–8301. [Google Scholar] [CrossRef]
  21. Owens, D.K.; Wendt, R.C. Estimation of the surface free energy of polymers. J. Appl. Polym. Sci. 1969, 13, 1741–1747. [Google Scholar] [CrossRef]
  22. Melk, L.; Emami, N. Mechanical and thermal performances of UHMWPE blended vitamin E reinforced carbon nanoparticle composites. Compos. Part B Eng. 2018, 146, 20–27. [Google Scholar] [CrossRef]
  23. Rezaei, F.; Yunus, R.; Ibrahim, N.A. Effect of fiber length on thermomechanical properties of short carbon fiber reinforced polypropylene composites. Mater. Des. 2009, 30, 260–263. [Google Scholar] [CrossRef]
  24. Chang, L.; Zhang, Z. Tribological properties of epoxy nanocomposites. Part II. A combinative effect of short carbon fibre with nano-TiO2. Wear 2006, 260, 869–878. [Google Scholar] [CrossRef]
  25. Friedrich, K.; Schlarb, A.K.; Bahadur, S.; Schwartz, C. The effect of nanoparticle fillers on transfer film formation and the tribological behavior of polymers. Tribol. Polym. Nanocompos. 2013, 23–48. [Google Scholar] [CrossRef]
  26. Zhai, W.; Srikanth, N.; Kong, L.B.; Zhou, K. Carbon nanomaterials in tribology. Carbon 2017, 119, 150–171. [Google Scholar] [CrossRef]
  27. Friedrich, K. Polymer composites for tribological applications. Adv. Ind. Eng. Polym. Res. 2018, 1, 3–39. [Google Scholar] [CrossRef]
  28. Borruto, A.; Crivellone, G.; Marani, F. Influence of Surface Energy on Friction and Wear Phenomena. J. Appl. Phys. 1961, 32, 1440–1444. [Google Scholar] [CrossRef]
Figure 1. Schematic diagram of the test configuration.
Lubricants 07 00034 g001
Figure 2. Polyphenylene sulfide (PPS) powder morphology of: (a) as received pure PPS; (b) 1% nano diamonds (ND) post ball milling; (c) 10% short carbon fibres (SCF) post ball milling; (d) 10% polytetrafluoroethylene (PTFE) post ball milling.
Lubricants 07 00034 g002
Figure 3. Thermogravimetric analysis (TGA) curves: (a) full decomposition curves, (b) decomposition curves at the final stage of linear decomposition.
Lubricants 07 00034 g003
Figure 4. Thermal degradation temperatures.
Lubricants 07 00034 g004
Figure 5. Melting temperatures.
Lubricants 07 00034 g005
Figure 6. Degree of crystallinity.
Lubricants 07 00034 g006
Figure 7. Micro-hardness.
Lubricants 07 00034 g007
Figure 8. Friction coefficient 5 MPa (series 1).
Lubricants 07 00034 g008
Figure 9. Specific wear rate at 5 MPa (series 1).
Lubricants 07 00034 g009
Figure 10. Friction coefficients for water lubricated conditions (series 2).
Lubricants 07 00034 g010
Figure 11. Specific wear rate for water lubricated conditions (series 2).
Lubricants 07 00034 g011
Figure 12. Friction coefficients for dry sliding (series 2).
Lubricants 07 00034 g012
Figure 13. Specific wear rates for dry sliding (series 2).
Lubricants 07 00034 g013
Figure 14. Dry sliding counter surfaces at 1 MPa of (a) PPS, (b) 0.5% ND, (c) 10% SCF and (d) 10% PTFE.
Lubricants 07 00034 g014
Figure 15. Dry sliding counter surfaces at 5 MPa of (a) PPS, (b) 0.5% ND, (c) 10% SCF and (d) 10% PTFE.
Lubricants 07 00034 g015
Figure 16. Dry sliding counter surface profiles at 5 MPa of (a) PPS and (b) 10% SCF.
Lubricants 07 00034 g016
Figure 17. Water lubricated pin surface profiles at 1 MPa of (a) PPS and (b) 10% SCF.
Lubricants 07 00034 g017
Figure 18. Water lubricated pin surfaces at 5 MPa of (a) PPS, (b) 0.5% ND, (c) 1% ND and (d) 10% SCF.
Lubricants 07 00034 g018
Figure 19. Dry sliding pin surface at 5 MPa of (a) PPS, (b) 0.5% ND, (c) 10% SCF and (d) 10% PTFE.
Lubricants 07 00034 g019
Table 1. Composite constituents and contents of: (a) series 1, (b) series 2.
(a)
Series 1
LabelReinforcement [%]
NDGOSCF
PPS
1% ND1
1% GO1
ND/GO11
ND/SCF0.510
GO/SCF0.510
ND/GO/SCF0.50.510
10% SCF10
20% SCF20
30% SCF30
(b)
Series 2
LabelReinforcement [%]
NDSCFPTFE
PPS
0.5% ND0.5
1% ND1
10% SCF10
10% PTFE 10
Table 2. Thermal degradation temperatures.
Samplet 10 [ C]t 50 [ C]t 90 [ C]
PPS504.7678.1706.0
1% ND500.6667.0682.0
1% GO503.0658.0717.0
ND+GO504.9672.5708.8
ND+SCF505.4678.5758.0
GO+SCF513.7664.6776.8
ND+GO+SCF512.0621.0771.9
10% SCF505.7622.0753.0
20% SCF505.3605.0769.0
30% SCF513.2618.9769.0
Table 3. Contact angle, surface free energy and dilatometry measurements.
SampleCA Water [ ]CA Dio [ ] σ s [mJ/m 2 ] α L [m/m K 1 ]
PPS83. 8 ± 3. 134. 3 ± 2. 144. 2 4.15 × 10 5
0.5% ND84. 7 ± 3. 443. 7 ± 2. 240. 1 4.63 × 10 5
1% ND85. 6 ± 0. 945. 6 ± 1. 539. 0 4.78 × 10 5
10% SCF90. 0 ± 1. 646. 1 ± 3. 537. 7 1.62 × 10 5
10% PTFE88. 6 ± 1. 546. 3 ± 2. 237. 7 4.40 × 10 5

