Article

Reduction of CO2 Emissions and Cost Analysis of Ultra-Low Viscosity Engine Oil

Graduate School of System Design and Management, Keio University, 4-1-1 Hiyoshi, Kohoku-ku, Yokohama 223-8526, Japan
*
Author to whom correspondence should be addressed.
Lubricants 2018, 6(4), 102; https://doi.org/10.3390/lubricants6040102
Submission received: 13 October 2018 / Revised: 10 November 2018 / Accepted: 14 November 2018 / Published: 18 November 2018
(This article belongs to the Special Issue Automotive Tribology)

Abstract

:
This study is focused on the reduction of CO2 emissions and costs associated with ultra-low viscosity (ULV) engine oils for passenger vehicles. Specifically, the reduction in life cycle CO2 (LCCO2) emissions from lower-viscosity engine oil and the oil drain interval (ODI) extension were estimated taking into account both mineral engine oil and synthetic engine oil. Furthermore, the cost-effectiveness of ULV engine oils were investigated by performing base-stock cost analysis. When the volatility limit of the Noack test (American Society for testing and materials (ASTM) D5800) was set to 15 wt %, the results indicated that the lower limit of kinematic viscosity at 100 °C (KV100) for mineral engine oil (with Group-III base-stock) and synthetic engine oil (with polyalphaolefin (PAO) base-stock) were approximately 5.3 and 4.5 mm2/s, respectively. Compared to conventional 0W-16 mineral engine oil (KV100 6.2 mm2/s), the effect of reducing LCCO2 emissions on ULV mineral engine oil (ULV-Mineral, KV100 5.3 mm2/s) was estimated at 0.6%, considering 1.5–1.8 L gasoline engines in New European Driving Cycles (NEDC) mode. ULV-Mineral, which continues to use a mineral base-stock, is considered highly cost-effective since its cost is similar to the conventional 0W-16 mineral engine oil. On the other hand, compared with ULV-Mineral, the vehicle fuel efficiency improvement from the use of ULV synthetic engine oil (ULV-PAO, KV100 4.5 mm2/s) was estimated to be 0.5%. However, considering CO2 emissions during engine oil production, the reduction of LCCO2 emission from ULV-PAO compared with ULV-Mineral was estimated to be only 0.1% or less using 2030 standards (assuming a vehicle fuel efficiency of 66.5 g-CO2/km) when ODI is set equivalent (7500 km) to mineral engine oil. As a result, ULV-PAO’s cost-effectiveness, considering the cost increase of PAO base-stock, was found to be nominal. Contrariwise, when the characteristics of PAO base-stock with higher oxidation stability are used comparatively with the mineral base-stock while extending the ODI to 15,000 km, the effect of reducing LCCO2 emissions of ULV-PAO was estimated to be 0.7% in 2030, making ULV-PAO a competitive and cost-effective alternative. In other words, the popularization of synthetic engine oil toward 2030 will require the consideration of both viscosity reduction and ODI extension.

Graphical Abstract

1. Introduction

In the efforts to reduce global warming, the regulation of the automobile fuel economy is becoming progressively tighter year after year. In the European Union (EU), the CO2 emissions target for 2021 is set to 95 g-CO2/km (Corporate Average Fuel Economy method) for passenger vehicles, and it seeks to further reduce CO2 emissions by 30% by the year 2030 compared to the targets set for 2021 [1]. In view of these fuel economy regulatory trends, hybrid vehicles (HEVs) and plug-in hybrid vehicles (PHEVs) are likely to become mainstream in the future. For example, according to the Toyota Motor Company, the annual sales of non-electrified vehicles, HEVs/PHEVs, and battery electric vehicle/fuel cell vehicles will be 4.5 million, 4.5 million (1.4 million units in 2016), and 1.0 million units, respectively, by 2030. The market forecasts from the Ministry of Economy, Trade, and Industry also coincide with Toyota’s goals [2,3,4]. In other words, although the automobile market is shifting to electrification, in 2030, vehicles equipped with internal combustion engines will still account for approximately 90% of the annual sales volume of passenger vehicles, and further fuel saving of internal combustion engines will be required. Subsequently, looking at the research and development (R&D) investment by Japanese automakers—Toyota, Honda, and Nissan—which are the top three Japanese companies, they invested 1.05, 0.750, and 0.525 trillion yen in 2017, respectively. With the increasing shift to electrification in vehicles, R&D will require diversified investment in a number of technologies, including vehicle electrification, autonomous driving, and artificial intelligence, and it is expected that the investment for the development of existing technologies will decrease [5]. In other words, regarding the introduction of the future technologies related to internal combustion engines, higher cost-effectiveness is required. This includes engine oils, which play many roles, such as lubrication, cleaning, rust prevention, cooling, and sealing of internal combustion engine components. Moreover, the demand for lubricating oil for automobiles in 2010 was approximately 19 million tons [6], which is roughly equivalent to half of Japan’s gasoline demand in 2015 (assumed gasoline density of 0.73 g/cm3) [7,8]. In addition, the market size for automotive lubricants in 2015 was estimated to be about 4 trillion yen, which represents a significant economic impact [9].
One of the previous studies on the analysis of the costs of automobile technology in the future reported on an analytical model (CEAMAT) of cost-effectiveness (additional cost against fuel efficiency improvement), although the engine oil was not taken into account [10]. The U.S. Energy Information Administration (EIA) reported on the cost-effectiveness of low friction lubricants in 2003. However, it is necessary to accurately characterize more recent trends associated with viscosity reduction [11]. Meanwhile, the United States Environmental Protection Agency (EPA) and the National Highway Traffic Safety Administration (NHTSA) reported on the fuel economy improvement and costs associated with fuel-saving lubricants from 2012–2016 (using 2010 as the baseline year). In this previous study, the fuel-saving effect of lubricating oil was estimated, and an additional cost (direct manufacturing cost) of engine refinement suitable for the use of the fuel-saving lubricant was also evaluated. However, the physical properties and cost of fuel-saving lubricating oil were not described [12]. In other words, to the best of our knowledge, the cost-effectiveness of future engine oil based on the analysis of fuel-saving and costs has not been well-reported. Concerning the fuel-saving effect, it is necessary to consider not only the CO2 emissions during vehicle operation, but also the vehicle life cycle CO2 (LCCO2) emissions.
In this study, the effect of reducing CO2 emissions and cost analysis of ultra-low viscosity (ULV) engine oils for passenger vehicles are considered. Specifically, the effect of reducing LCCO2 emissions by reducing both engine oil viscosity and oil drain interval (ODI) extension is estimated, taking into account both mineral engine oil and synthetic engine oil. Furthermore, the cost-effectiveness of ULV engine oils are revealed by performing a base-stocks cost analysis. Following the introduction set out in Part 1, Part 2 introduces our analytical conditions and methods. In Part 3, the results of vehicle LCCO2 emissions and cost-effectiveness of ULV engine oils are introduced. In this study, ULV engine oils are assumed to be used for vehicles with a fuel efficiency that is estimated to decrease from 130 g-CO2/km (2015 EU fleet target) to 66.5 g-CO2/km (2030 EU fleet target). In Part 4, we describe the conclusion drawn from the results obtained in this study.

2. Experimental

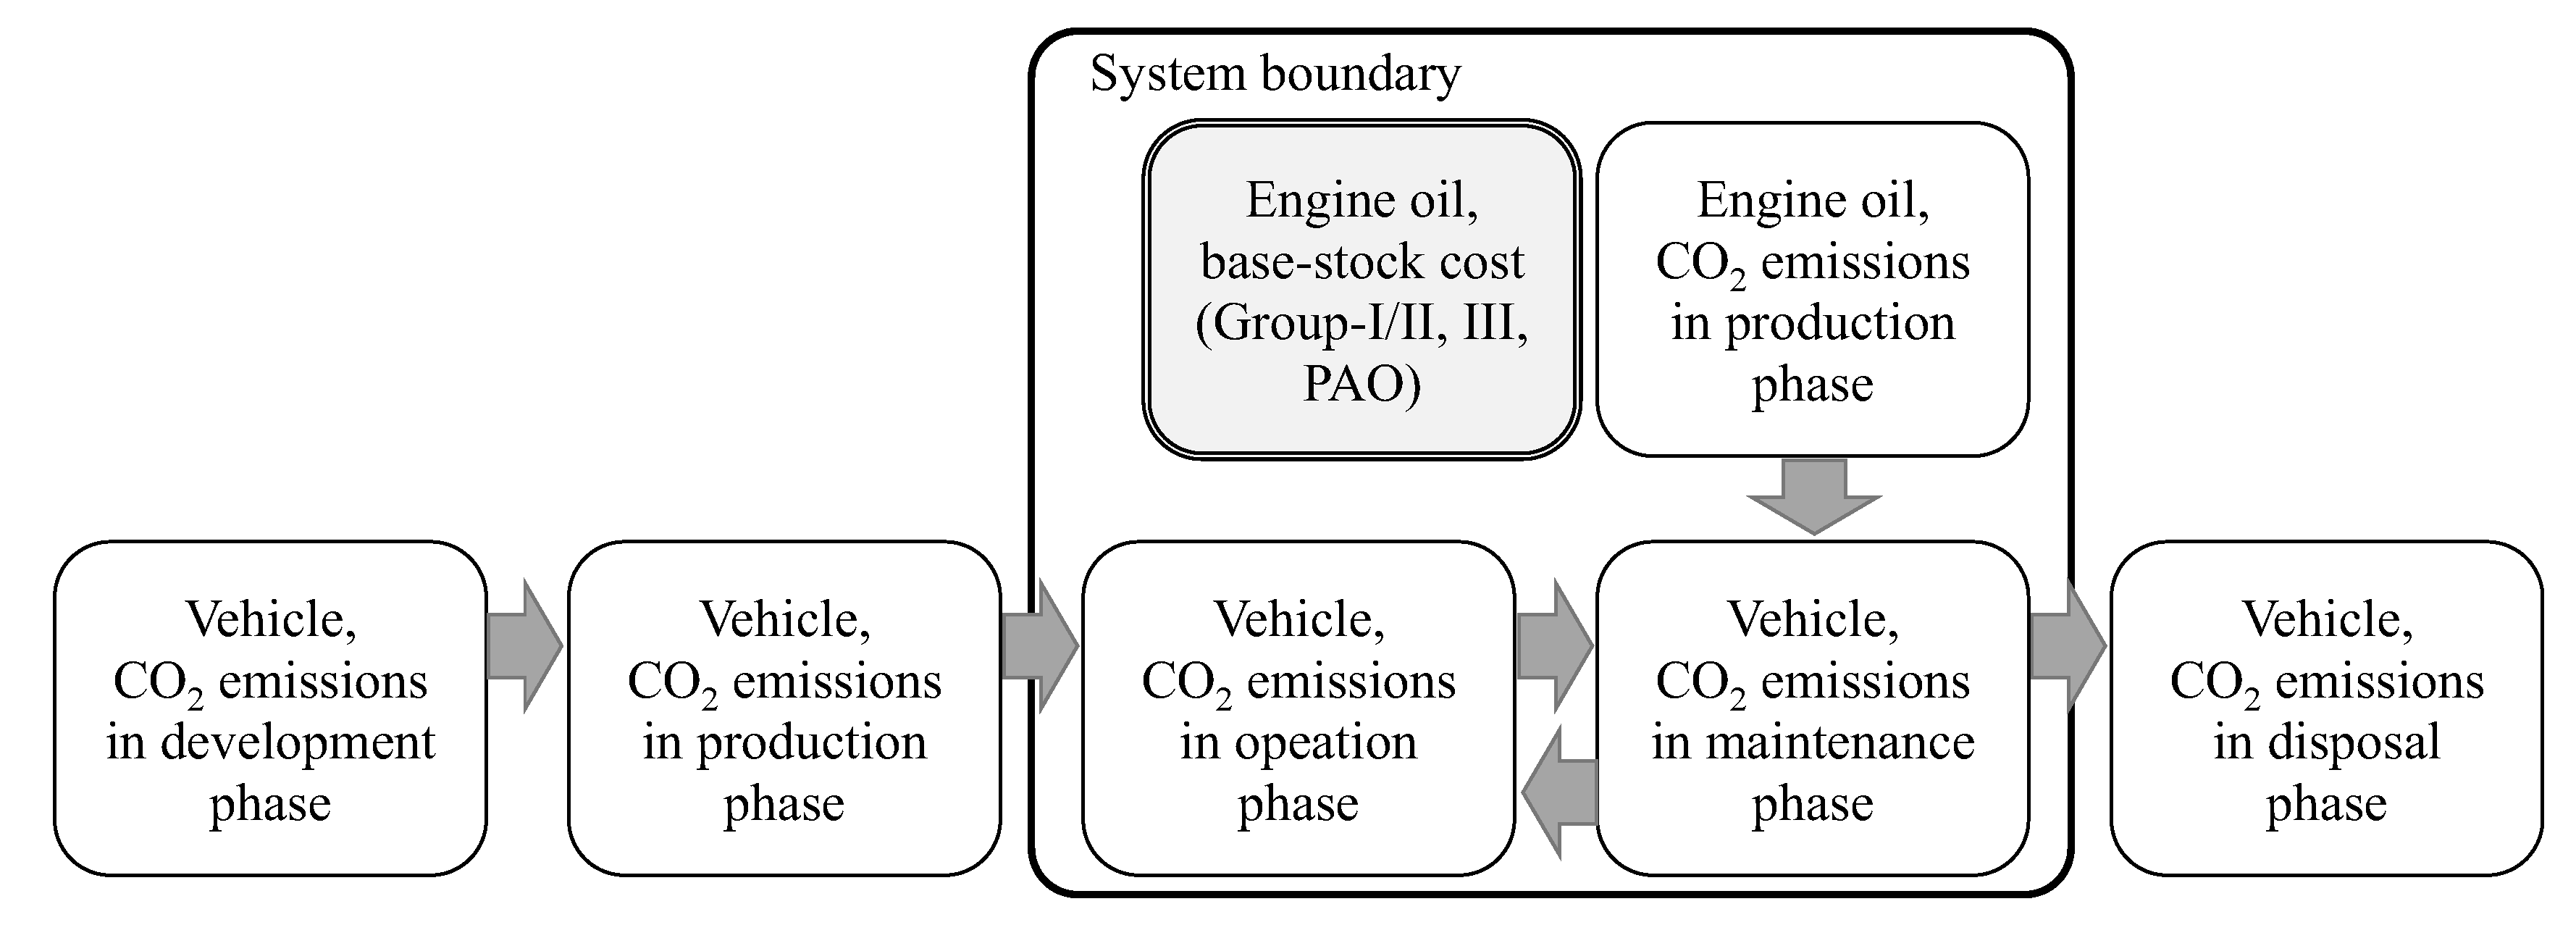
2.1. System Boundary and Analysis Method

The life cycle of automobiles consists of five phases, including development, production, operation, maintenance, and disposal. In this research, we considered two phases, i.e., the operation and maintenance, which are directly affected by the quality of the engine oil. To determine the fuel economy improvement and costs of ULV engine oils from the present time to 2030, the ULV engine oils were assumed for vehicles with a fuel efficiency targeted for a decrease from 130 g-CO2/km (2015 EU fleet target) to 66.5 g-CO2/km (2030 EU fleet target). For the maintenance phase, the engine oil was considered only consumable. Regarding the assessment of life cycle CO2 emissions of engine oil, we used the report of Girotti et al., which considered both base-stock (BS) and additives to estimate CO2 emissions from the engine oil production with a density of 0.84 g/cm3 [13,14]. Moreover, in this study, mineral and synthetic engine oil were both considered. The amount of oil was estimated to be 4.0 L [15]. The ODI was estimated by using a recommended ODI (considering both naturally aspirated and turbocharged engines) from Japanese car manufactures [16] and an annual average driving range in Japan [17]. To estimate the cost-effectiveness of ULV engine oils, the reports of the U.S. Energy Information Administration (EIA) and He et al. [12,18] were used. Figure 1 shows the system boundary of this research. The methods for analyzing the effect of improving fuel efficiency, specifications of analyzed engine oils, and cost analysis will be explained in Section 2.2, Section 2.3 and Section 2.4.

2.2. The Method of Analyzing the Effect of Improving Fuel Efficiency

According to the report of Holmberg et al., the breakdown of the engine friction loss is considered to be 58% hydrodynamic lubrication, 18% elastohydrodynamic lubrication, 19.5% mixed lubrication, and 4.5% boundary lubrication [19]. In other words, 76% of total engine loss comes from the hydrodynamic and elastohydrodynamic lubrication, and the ULV engine oil contributes to a reduction of engine friction loss. Okuyama et al. reported that the fuel economy of a 1.3 L gasoline engine in Japanese 10-15 mode was linearly improved as the lubricant’s viscosity at 80 °C decreases in the viscosity range 3.8–9.5 mPa·s [20]. Meanwhile, Mo et al. reported on the effect of improving fuel efficiency in New European Driving Cycles (NEDC) mode with six types of engine oils from 5W-30 to 0W-20 [21]. Fujimoto et al. also reported the results of fuel efficiency using two types of 0W-20 engine oils with different viscosities, and a 0.9% improvement in fuel efficiency in NEDC mode was confirmed by using lower-viscosity 0W-20 engine oil [22]. In addition, Kaneko et al. proposed newly-developed 0W-20 and 0W-16 engine oils that satisfy low-speed pre-ignition (LSPI) prevention performance, and these new fluids improve the fuel efficiency in NEDC mode by 0.5% and 1.0% respectively, compared with conventional 0W-20 engine oil [23]. Moreover, Liu et al. also introduced 0W-16 engine oil that showed a 1.0% fuel efficiency improvement compared to the conventional 0W-20 engine oil [24]. Also, according to Tamoto et al. the engine oil viscosity and torque loss were clarified using a 1.8 L gasoline engine motoring test. It has been shown that engine torque loss decreases as the viscosity decreases until the kinematic viscosity was 4.2 mm2/s at 100 °C (KV100), whereas a decrease of the viscosity below 4.2 mm2/s causes an increase in engine torque loss [25]. In this study, the improvement of the fuel efficiency of ULV engine oils was calculated from the correlation between KV100 and fuel efficiency using the results of the above-mentioned literatures [21,22,23,24], as our previous research has demonstrated [26]. A certain correlation has been confirmed with KV100 and high temperature high shear (HTHS) viscosity [27], which has been known to linearly correlate with the fuel economy in NEDC mode [28], and it is reliable to calculate the improvement of the fuel efficiency of ULV engine oils by using KV100. Moreover, in this research, the impact of the lubricant traction coefficient on the fuel efficiency has not been considered due to the fact that the Group-III and polyalphaolefin (PAO) base-stocks show similar traction property [29].

2.3. Specifications of Analyzed Engine Oils

Regarding the world base-stocks production capacity, Rudnick reported that the Group-I and II base-stocks still account for 59% and 31%, respectively, while the Group-III base-stocks account for only 9% [30]. However, as shown in Section 2.2, Liu reported that the Group-III base-stock is used for the newly developed 0W-16 engine oil [24]. Based on the report of Tamoto et al. in the case of Group-II+ base-stock (70N) for ULV engine oil (KV100 4.2 mm2/s), the Noack volatility (American Society for Testing and Materials (ASTM) D5800) increased to 33% [25]. The oil consumption increased as well. Moreover, as a result of the Japanese Automotive Standards Organization (JASO) M331-91 detergency test, it was pointed out that both viscosity and sludge increased significantly [25]. According to Masuko, the SAE8 viscosity grade, defined by Society of Automobile Engineers (SAE), and given the engine oil volatility [31], is expected have the lower limit viscosity, which is consistent with the result of Tamoto et al. [25]. Hence, the limit of the low viscosity was strongly influenced by the volatility of base-stock. The results of the Noack on the volatility of Group I, II, III, and PAO base-stocks are shown in Figure 2 [32,33]. It is thus, confirmed that the Group-III and PAO base-stocks showed lower volatility performance compared to Group-I/II. According to the International Lubricant Standardization and Approval Committee (ILSAC), the GF-5 performance standard requires that the weight loss in the Noack volatility test not be higher than 15 wt %.
In addition to the volatility performance, it is required that the engine oils to have high oxidation stability aiming to maintain the appropriate performance for a longer period during the vehicle operation. Figure 3 shows the results for the ASTM Sequence IIIE engine test, which confirmed the oxidation stability, deposit formation, wear protection, and consumption of engine oil [32]. When the upper limit of the viscosity was increased by 150% (it is the test standard), it was set as the upper limit, and it has been shown that the PAO base-stock showed to have twice as high an oxidation stability than that of the Group-III base-stock [32]. Therefore, it is expected to extend ODI by using PAO base-stocks, although it is necessary to ensure the maintaining of the LSPI prevention and anti-foam performances, among others [23,34]. In other words, it is necessary that the ULV engine oils have low viscosity, traction, and volatility, as well as high oxidation stability. It is assumed that severely hydrocracked Group-III and PAO base-stocks that meet those requirements are mainly used for ULV engine oils. For this study, the conventional 0W-16 engine oil, which is expected to be popular in the future, was selected, and the detailed data were adopted from the report of Liu et al. [24]. Then, with regard to the next generation ULV engine oils, two cases based on Group-III base-stock (hereinafter referred to as ULV-Mineral) or PAO base-stock (hereinafter referred to as ULV-PAO) were examined.
The viscosities of the base-stocks were set to the lower limits that satisfy the Noack volatility of 15 wt %. Also, the additive package (Add Pack) viscosity was referenced using Afton Chemical’s product data [35,36,37]. Japanese industrial standards (JIS) K 2283 were used to calculate the finished fluids viscometrics. The specifications of the engine oils to be investigated are listed in Table 1.

2.4. Cost Analysis Method

The engine oil is composed of base-stock and additives, and according to Lubrizol, the treat rate of the additives has increased to comply with the new ILSAC GF-6 standard in comparison to the GF-5 standard [38]. From Afton Chemical’s product data sheets, it has been shown that upgrading from GF-5 to GF-6 increases the treat rate of the additives by approximately 1% [35,36,37]. The cost of additives has been estimated at $4.40 (United States dollar (USD))/L [39]. As the impact of the product price increase due to the 1% increase in additives amount is limited, only base-stock costs were examined in this study. Regarding the investigation of Group-I/II, III, and PAO costs, the reported values in Rudnick, Erhan et al. Argus, and Machinery Lubrication [30,40,41,42,43,44]. Moreover, the base-stock prices have been reported to correlate with crude oil prices [45], since the correlation analysis between the base-stock and crude oil prices was also performed in this study. Concerning the cost-effectiveness, the ULV-Mineral with Group-III base-stock can be compared with the conventional 0W-16 mineral engine oil, which can be used as a Group-III base-stock. Meanwhile, to promote the use of ULV-PAO, it must be more cost-effective than ULV-Mineral as well as 0W-16 mineral engine oil. Therefore, the comparison target of ULV-PAO was set to ULV-Mineral.

3. Results and Discussion

3.1. Result of Analysis for Improving the Fuel Efficiency

In this study, the improvement of the fuel efficiency of ULV engine oils was calculated from the correlation between the KV100 of 5W-30 to 0W-16 engine oil and the rate of improvement of the fuel efficiency based on the values reported by Mo et al. [21], Fujimoto et al. [22], Kaneko et al. [23], and Liu et al. [24], as shown in Figure 4. Compared with conventional 0W-16 engine oil (KV100 6.2 mm2/s), the rates of improvement of the vehicle fuel economy of ULV-Mineral and ULV-PAO were estimated to be 0.6 and 1.1%, respectively. According to Koyamaishi et al., the ULV engine oil (HTHS 1.7 mPa·s) improves the fuel efficiency of 1.4 L diesel engine in NEDC mode by 4.4% compared to 5W-30 engine oil [46], and the reported value is consistent with our result. The result of this study, however, only considered the fuel economy of 1.5–1.8 L gasoline engines (i.e., Toyota 2ZR-FE) in NEDC mode during the time of 2012–2017. Hence, for example, our result does not fit well the fuel economy results of 2.2 L gasoline engine in the Federal Test Procedure (FTP) reported by Akiyama et al. in 1993 [47]. Moreover, the new Worldwide Harmonized Light Vehicles Test Procedure (WLTP) enforces stricter test conditions compared to NEDC mode, and therefore pushes the lubrication regimes more towards mixed and boundary regimes. Zacharof et al. reported that SAE20 engine oil improved the fuel efficiency of gasoline engines by up to 2.2% in NEDC mode; in contrast, the efficiency increased by up to 1.9% in WLTP cycle, compared to 5W-30 engine oil [48]. Hence, further study is needed.

3.2. CO2 Emissions from Oil Production

Figure 5 illustrates the CO2 emissions during the production of ULV-Mineral and ULV-PAO with the formulations shown in Table 1. CO2 emissions from the production of mineral engine oils were estimated at 0.99 kg-CO2/L. Meanwhile, the CO2 emissions from synthetic engine oils production were estimated to be 1.65 kg-CO2/L, which is 1.7 times higher than that of the mineral engine oils. The contribution of CO2 emissions from engine oil production in relation to CO2 emissions generated during vehicle operation will be described. As the vehicle fuel efficiency improves, the ratio of CO2 emissions from engine oil production to CO2 emissions generated during vehicle operation increased, as shown in Figure 6. Concerning the mineral engine oils, when the ODI was set to 7500 km, the CO2 emissions during vehicle operation using 2030 standards (vehicle fuel efficiency is estimated to be 66.5 g-CO2/km) increased to 0.8% and it was associated with the production of mineral engine oils. Meanwhile, when synthetic engine oil was used, CO2 emissions in vehicle operation significantly increased to 1.3% under the same conditions. By extending the ODI from 7500 to 15,000 and 25,000 km, the impact of CO2 emissions from synthetic engine oil production on CO2 emissions during the vehicle operation were effectively reduced to 0.7 and 0.4%, respectively. In other words, from the viewpoint of reducing CO2 emission, the extension of the ODI is technologically challenging but as important as the reduction of viscosity is.

3.3. The Effect of Reducing LCCO2 Emissions
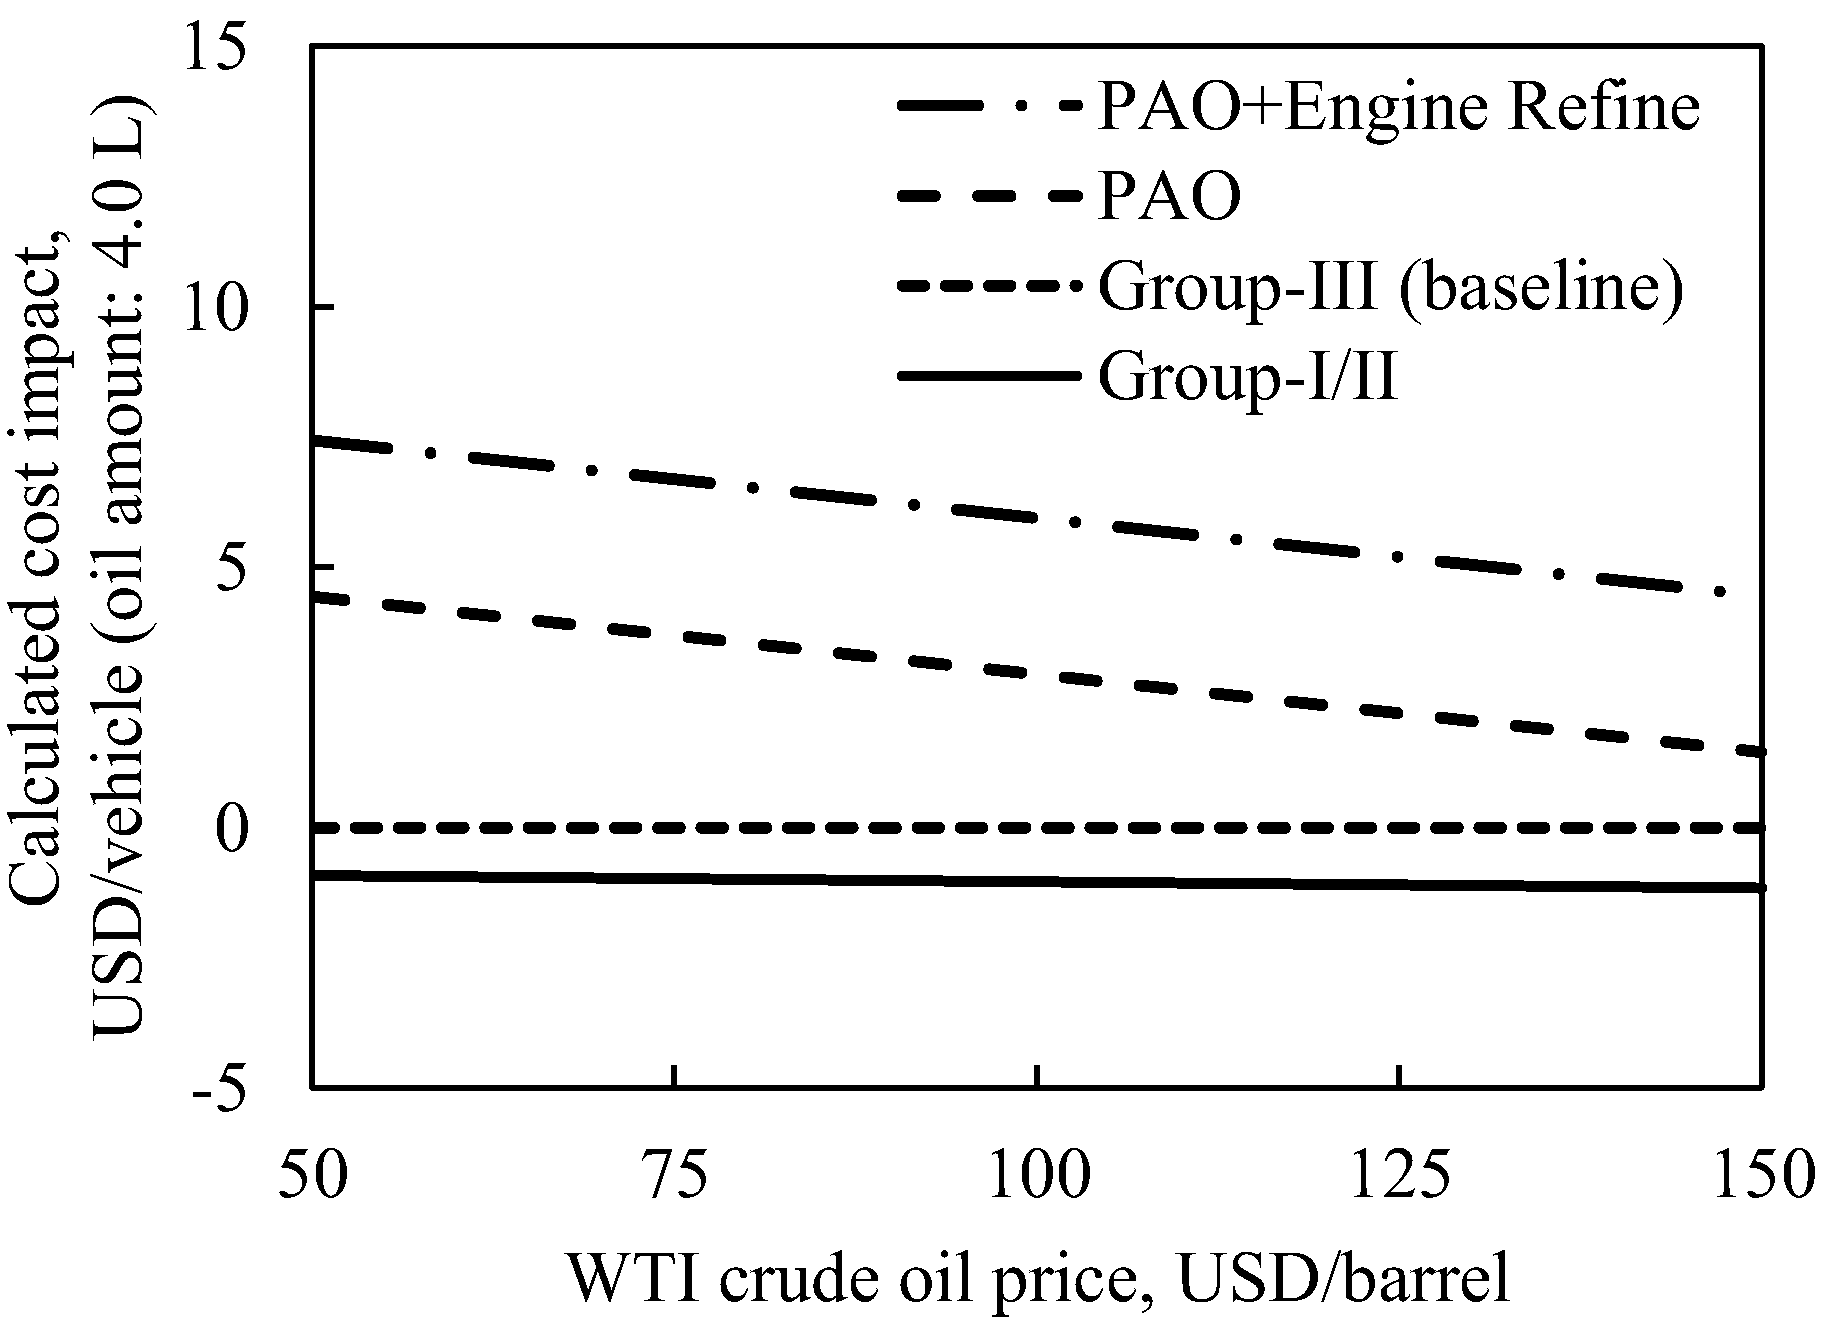
As introduced in Section 3.1 and Section 3.2, ULV-Mineral improved vehicle fuel economy by 0.6% compared to conventional 0W-16 mineral engine oil. Both conventional 0W-16 mineral engine oil and ULV-Mineral use Group-III base-stocks and CO2 emissions during production of these oils are virtually the same. In other words, ULV-Mineral reduced the vehicle LCCO2 emissions by 0.6% compared to 0W-16 mineral engine oil.
Compared to ULV-Mineral, ULV-PAO improved vehicle fuel efficiency by 0.5%. However, as shown in Figure 7 and considering the CO2 emissions during engine oil production, the reduction of LCCO2 emissions associated with ULV-PAO compared to ULV-Mineral was reduced to 0.1% or less using 2030 standards (assuming a vehicle fuel efficiency: 66.5 g-CO2/km) when the ODI was equivalent (7500 km) to mineral engine oil. When utilizing the characteristics of PAO base-stock with higher oxidation stability compared with mineral base-stock, as shown in Figure 3, and extending the ODI from 7500 to 15,000 and 25,000 km, the effects of the reduction of LCCO2 emissions of ULV-PAO are estimated to improve to 0.7% and 0.9% in 2030, respectively.

3.4. Cost Analysis

It is important to consider the base-stock prices survey results for Group-I/II, III, and PAO base-stocks. As shown in Figure 8, the mineral base-stock prices and the West Texas Intermediate (WTI) crude oil price [49] were approximately linearly correlated. However, there was no clear link between the PAO base-stock price and the crude oil price. This has to do with the gap between production capacity and market demand of PAOs. The global PAO market size is expected to slightly increase to $4210 million by 2025 from $3840 million (USD) in 2017 [50], and therefore the PAO base-stock price is likely to be stable up to 2025. Figure 9 shows the calculated cost impacts of the three different oils taking in to account the WTI crude oil price (Group-III is the baseline price).
With respect to the crude oil price, the average of its WTI in 2017 was $51 (USD)/barrel [49]. However, according to Arezki et al., the crude oil price is expected to increase to $100 (USD)/barrel or more by 2025 [51]. When the WTI crude oil price will reach $100 (USD)/barrel, the cost of synthetic engine oil will also increase to $3 (USD)/vehicle in comparison with mineral engine oil if Group-III base-stock is used. Furthermore, if the additional cost of engine refinement (direct manufacturing cost) suitable for using ULV engine oil is needed [12], the total cost increase is estimated to be $6 (USD)/vehicle.

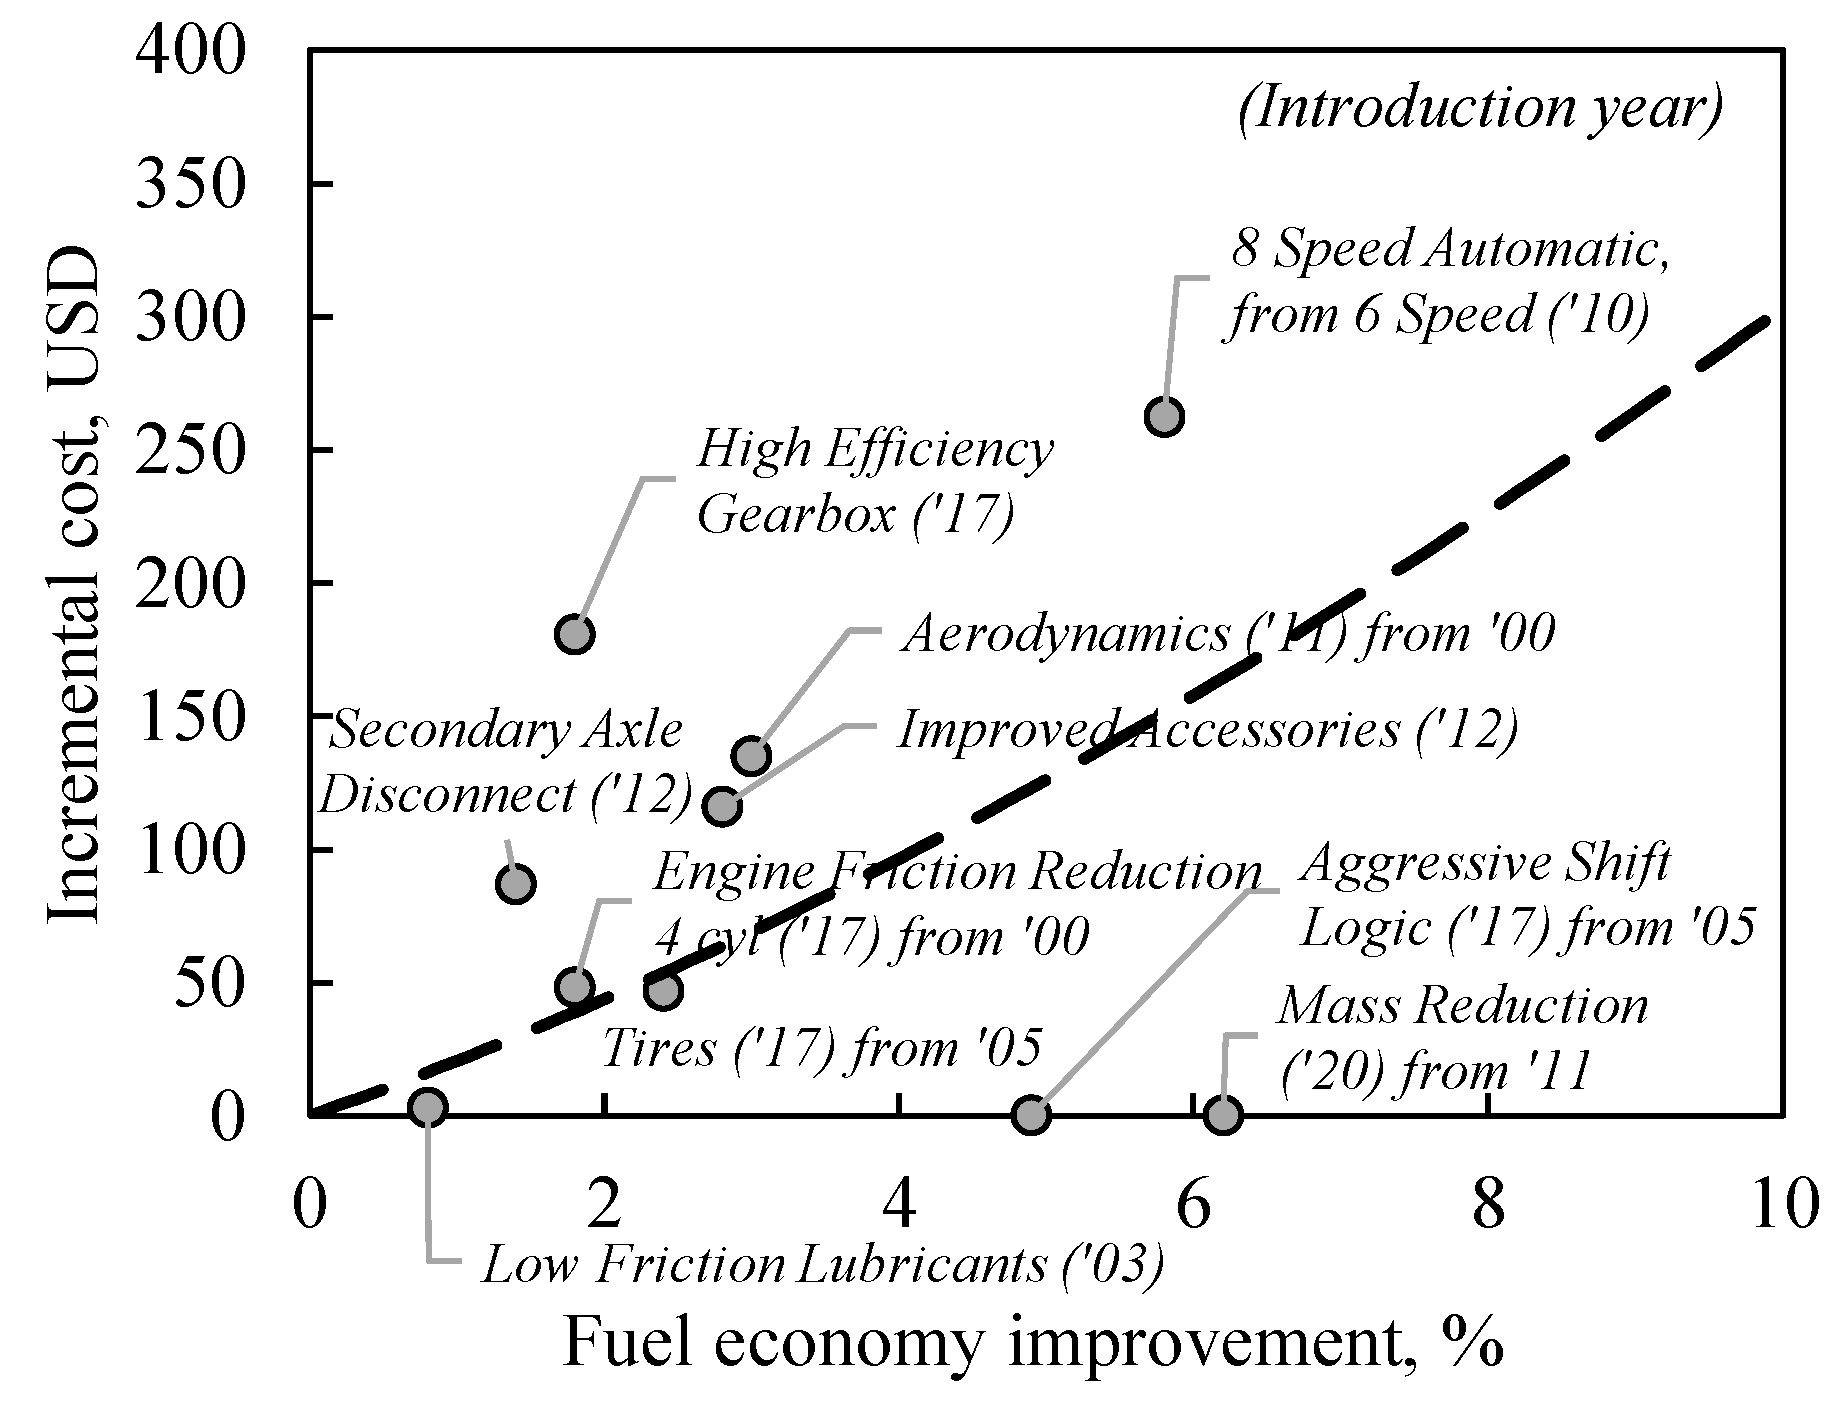
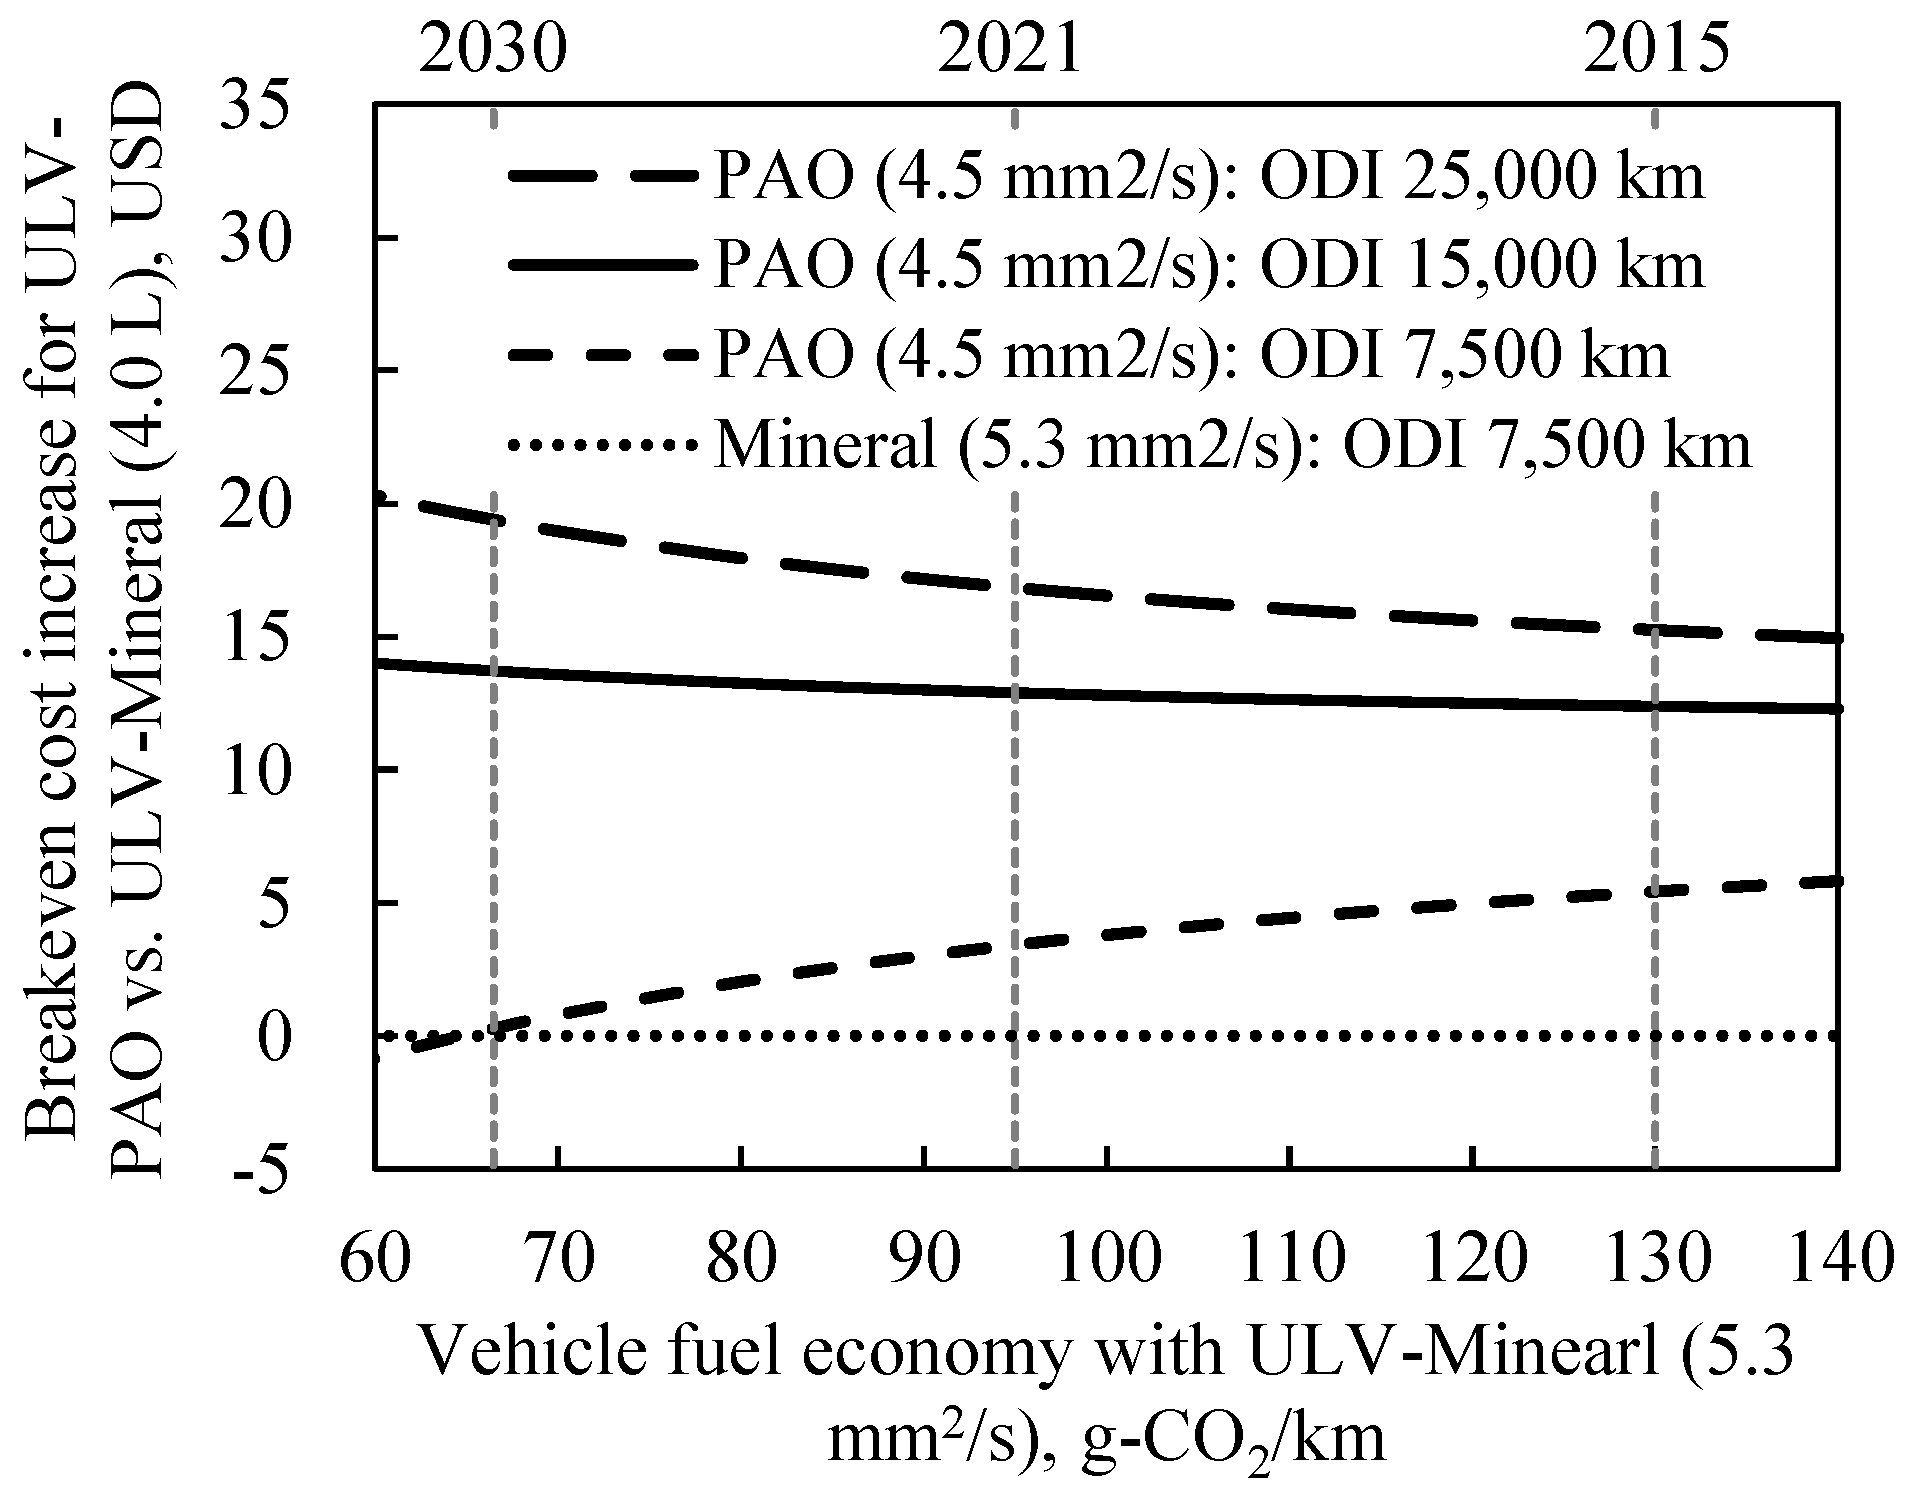
3.5. Cost-Effectiven ess (Breakeven Cost Analysis)

The cost-effectiveness results from the EIA are presented in Figure 10 [11], where the average increase cost (i.e., breakeven cost) with respect to fuel efficiency improvement can be obtained using Equation (1):
IC = −0.0135 × FEI3 + 1.228 × FEI2 + 19.45 × FEI (R2 = 0.92)
IC: Incremental cost [USD]; FEI: Fuel economy improvement [%].
As a result, the cost-effectiveness is expected to be high if the cost increase is less than $12 (USD)/vehicle for 0.6% reduction of LCCO2 emissions. In other words, the ULV-Mineral price is assumed to be virtually the same as that of the conventional 0W-16 mineral engine oil, resulting in a high cost-effectiveness value, even if additional costs for engine refinement are required [12].
Meanwhile, in comparison with ULV-Mineral, ULV-PAO improves vehicle fuel efficiency by 0.5%, and ULV-PAO has certain cost-effectiveness, if only considering CO2 emissions during the vehicle operation. However, concerning the effects on global warming, reducing of vehicle LCCO2 emissions of ULV-PAO must be considered. Figure 11 presents the results of a breakeven cost analysis of ULV-PAO (ODI 7500, 15,000, and 25,000 km) versus ULV-Mineral (ODI 7500 km) using Equation (1) and based on the results of reduction of LCCO2 emissions shown in Figure 7. Accordingly, when the ODI is set equivalent (7500 km) to mineral engine oil, the cost-effectiveness of ULV-PAO decreases when the increasing cost associated with PAO base-stock is considered. When extending the ODI from 7500 to 15,000 km, the effect of reducing LCCO2 emissions of ULV-PAO is estimated to be 0.7%. As Figure 9 and Figure 11 show, the ULV-PAO becomes a competitive and cost-effective alternative when the ODI is extended.
In addition, He et al. reported cost-effectiveness results with respect to medium-sized vehicles from 2015 to 2025 [18]. When using the estimated average fuel efficiency (66.5 g-CO2/km) for the year 2030 as a baseline and using the cost-effectiveness of 2025, the average increase cost (i.e., breakeven cost) with respect to fuel efficiency improvement can be expressed using Equation (2):
IC = −0.0001 × FEI3 + 0.134 × FEI2 + 39.91 × FEI
As a result, cost-effectiveness can be expected to be high if the cost increase is less than $28 (USD)/vehicle with a 0.7% reduction in vehicle LCCO2 emissions. However, the difference between the EIA report and data presented in He et al. has no influence on the conclusion of our research.

4. Conclusions

This study examined the reduction of CO2 emissions and cost analysis of ULV engine oils for passenger vehicles. More specifically, the effect of reducing LCCO2 emissions by reducing engine oil viscosity and extending the oil drain interval (ODI) was estimated taking into account both mineral engine oil and synthetic engine oil. Furthermore, the cost-effectiveness of ULV engine oils was revealed by the cost analysis of base-stocks. The results of this study can be generally summarized as follows.
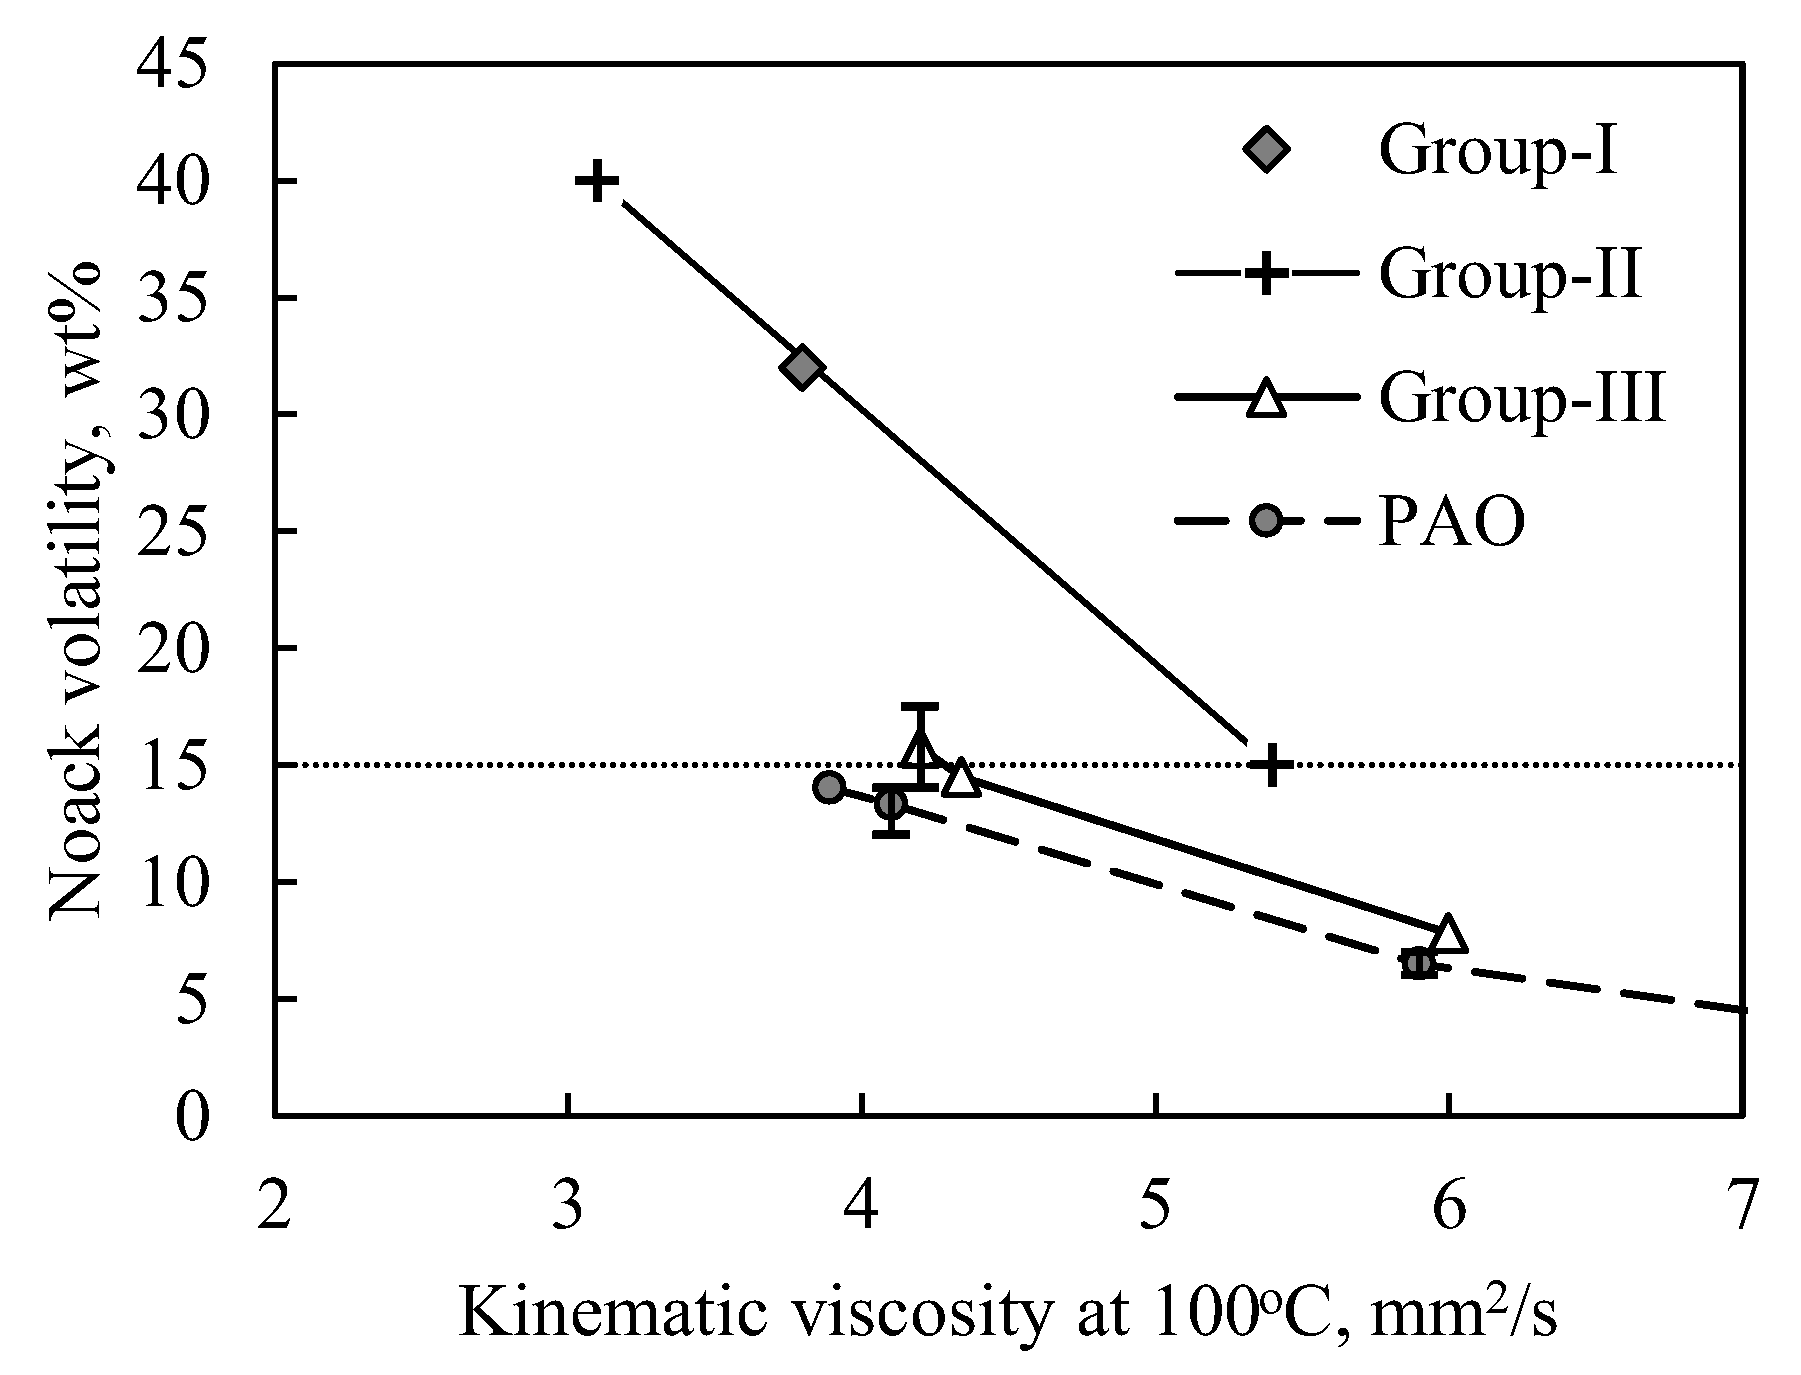
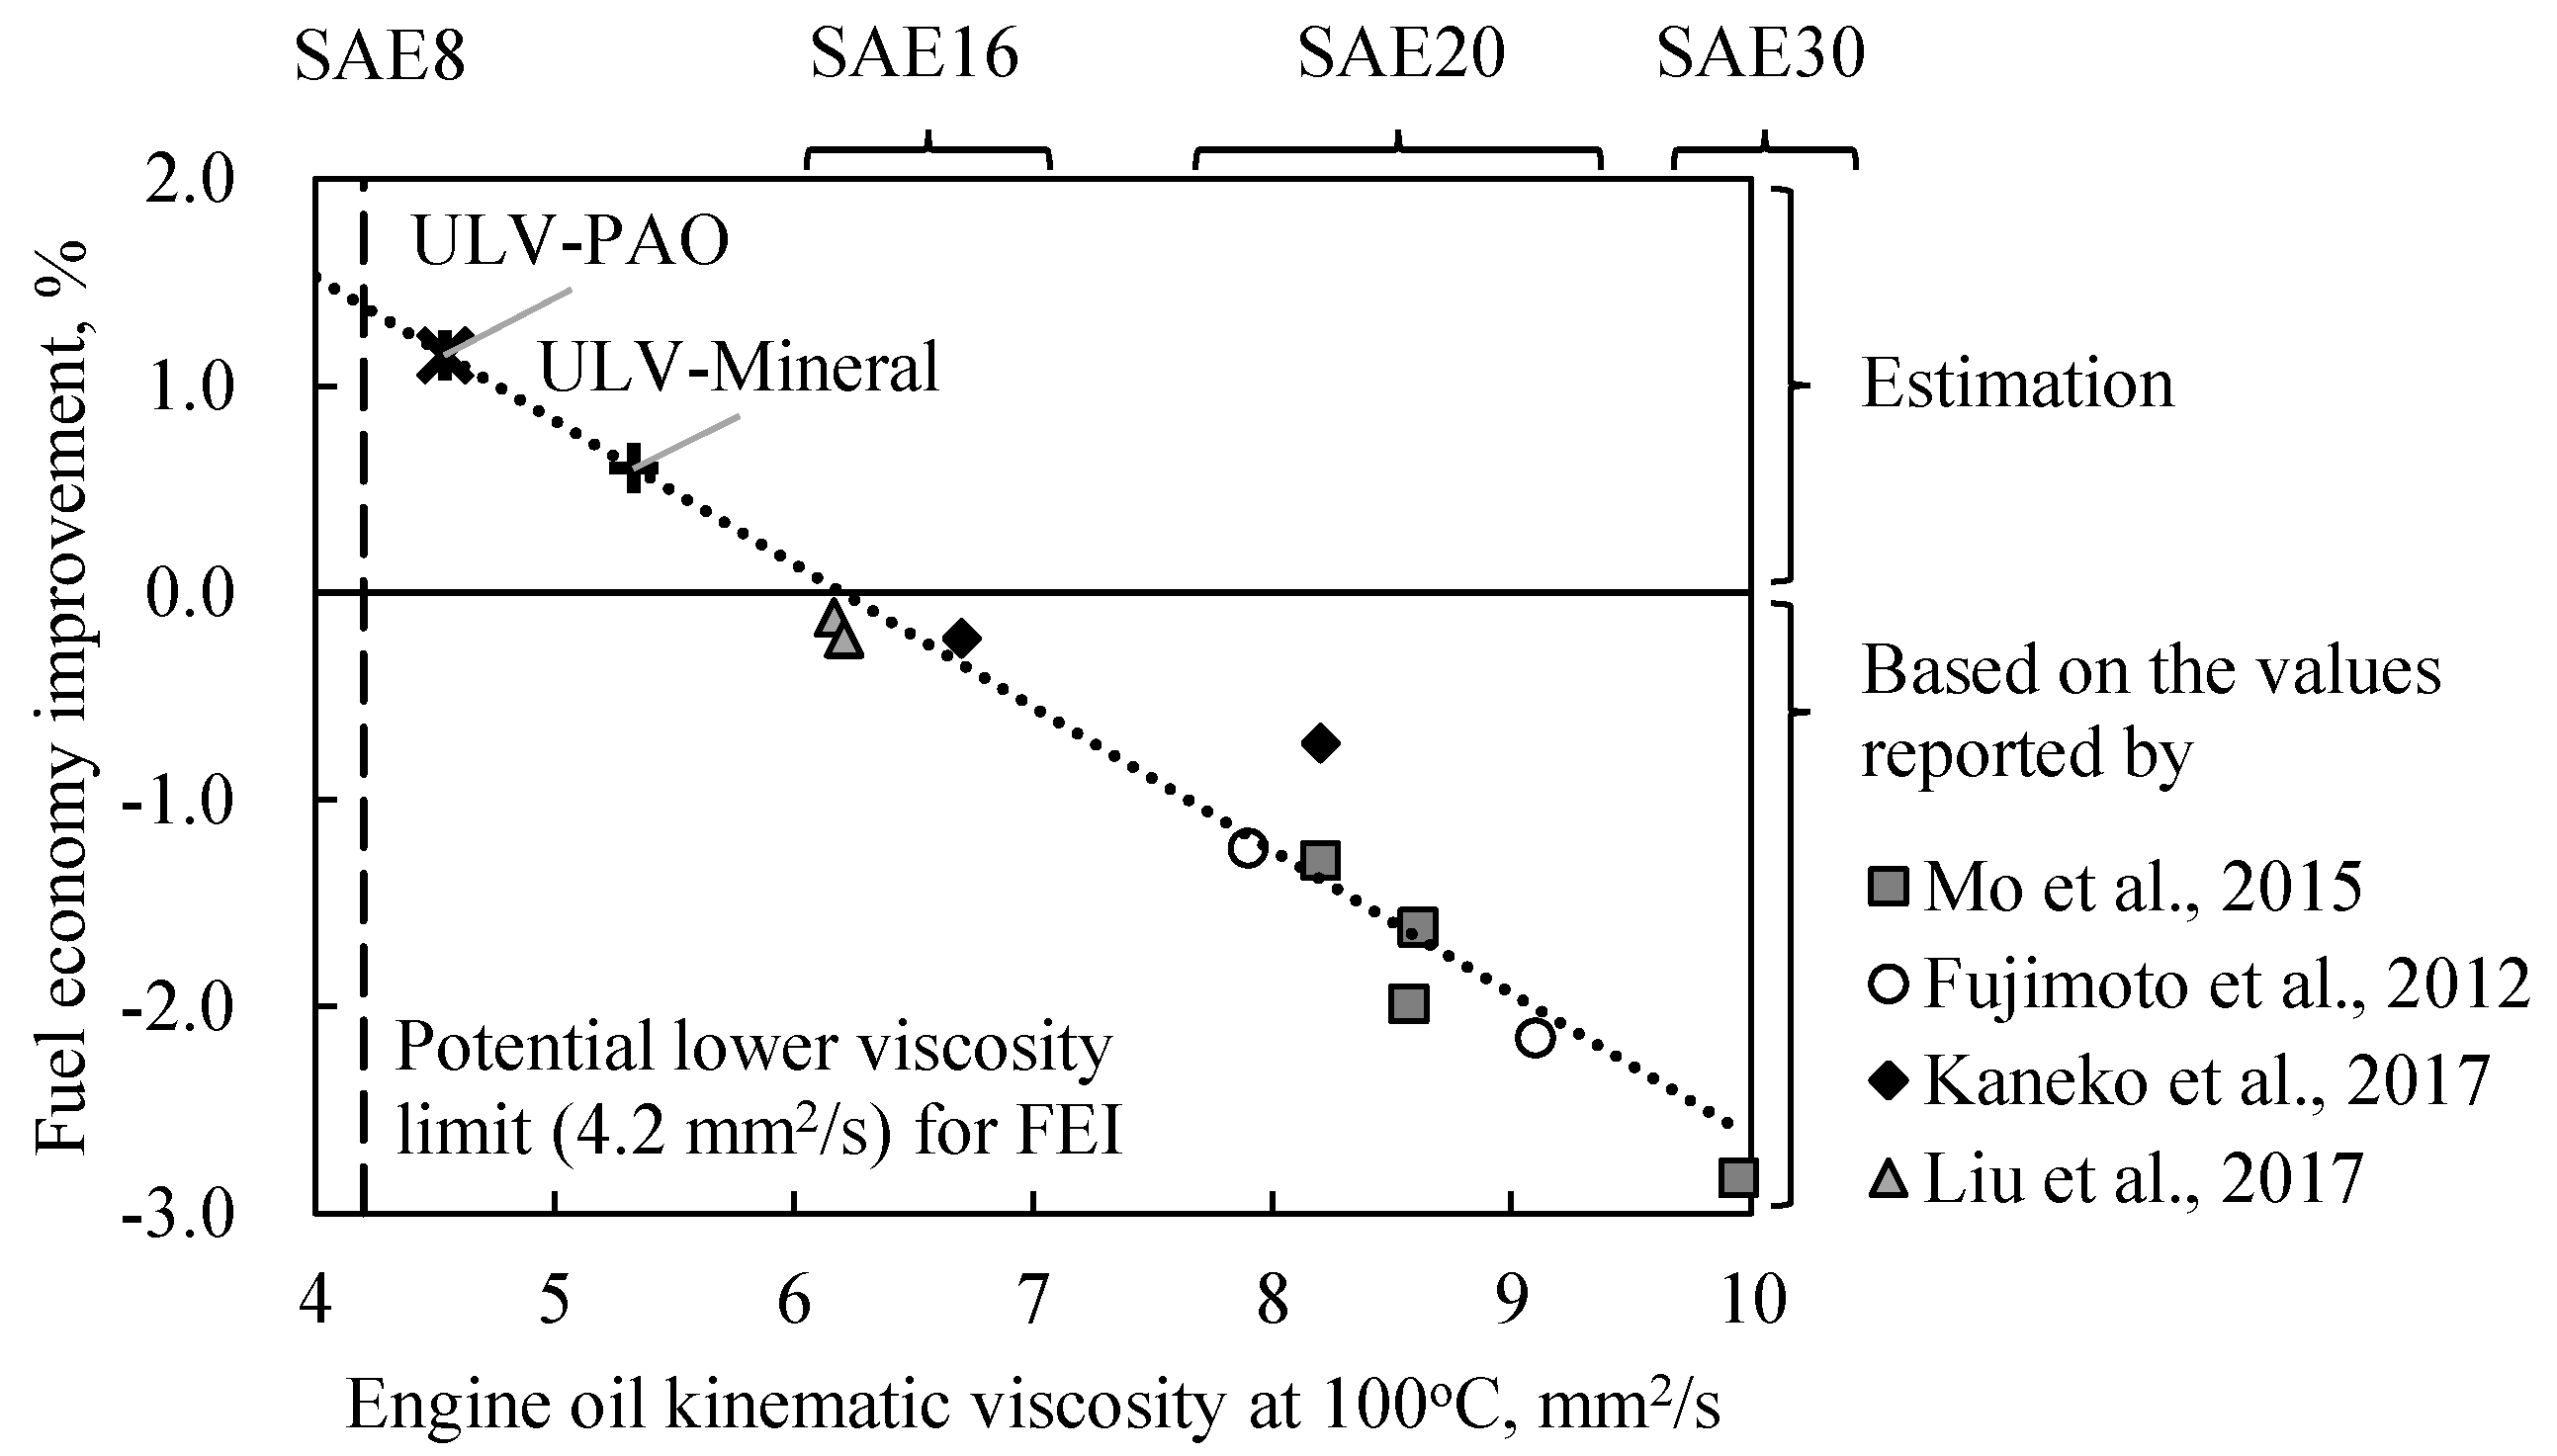
  • When the upper limit of the Noack volatility was set to 15 wt %, the lower limit of KV100 mineral engine oil with Group-III base-stock and synthetic engine oil with PAO base-stock were estimated at 5.3 and 4.5 mm2/s, respectively.
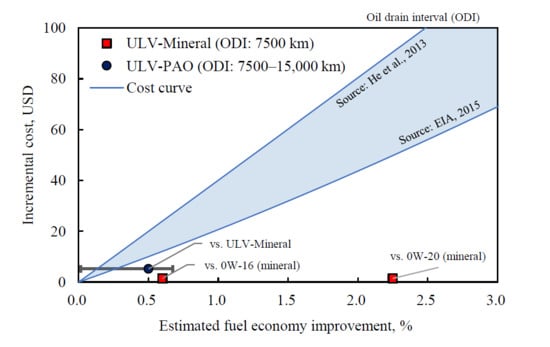
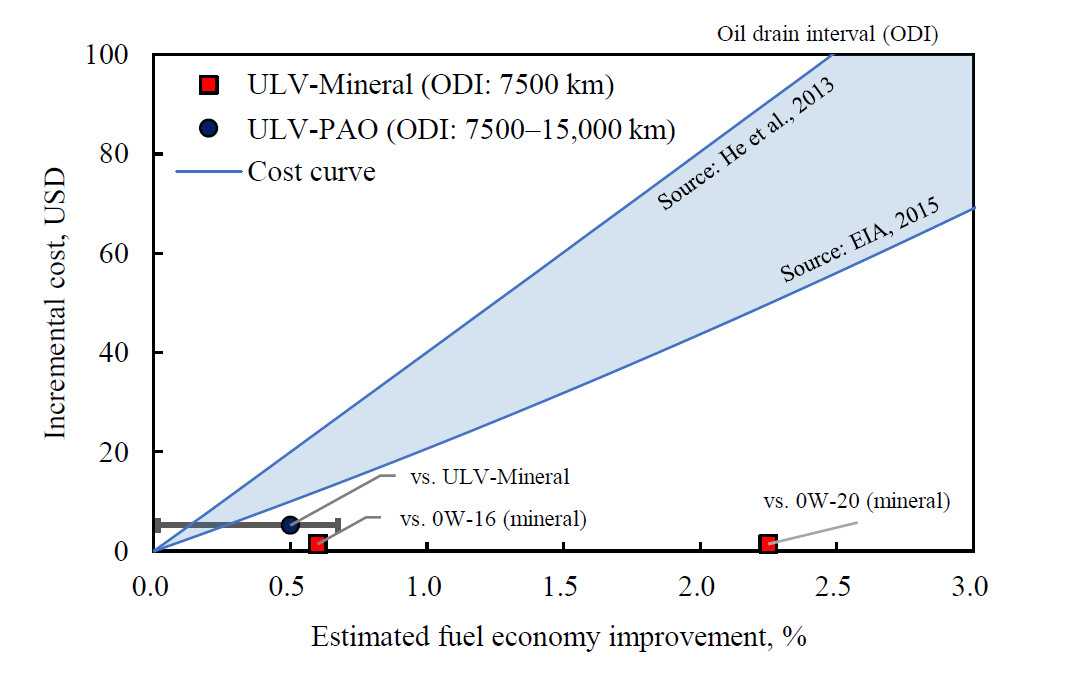
  • Compared with the conventional 0W-16 engine oil (KV100 6.2 mm2/s), ULV-Mineral (KV100 5.3 mm2/s) and ULV-PAO (KV100 4.5 mm2/s) were designed to improve vehicle fuel efficiency by 0.6 and 1.1%, respectively, considering 1.5–1.8 L gasoline engines in NEDC mode.
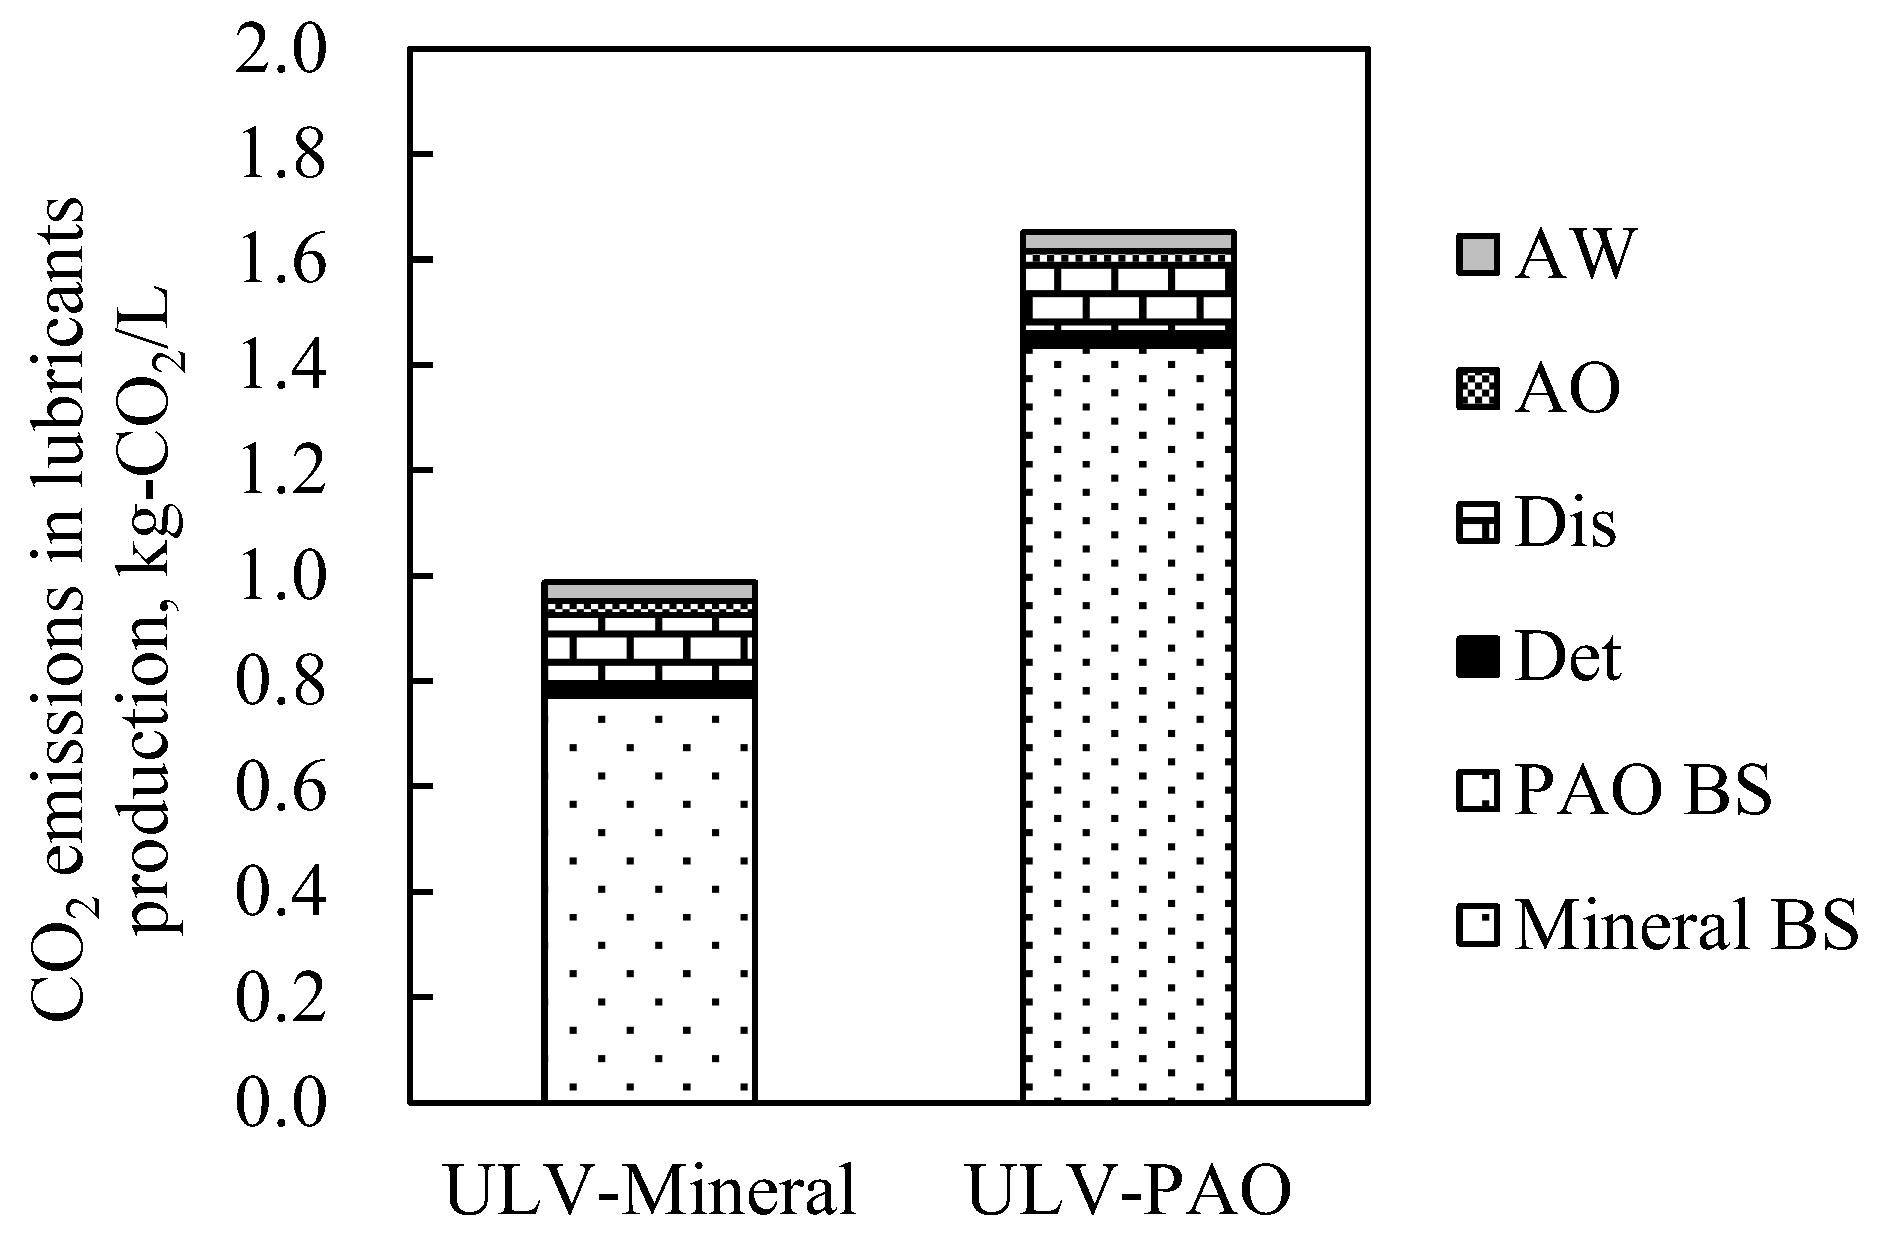
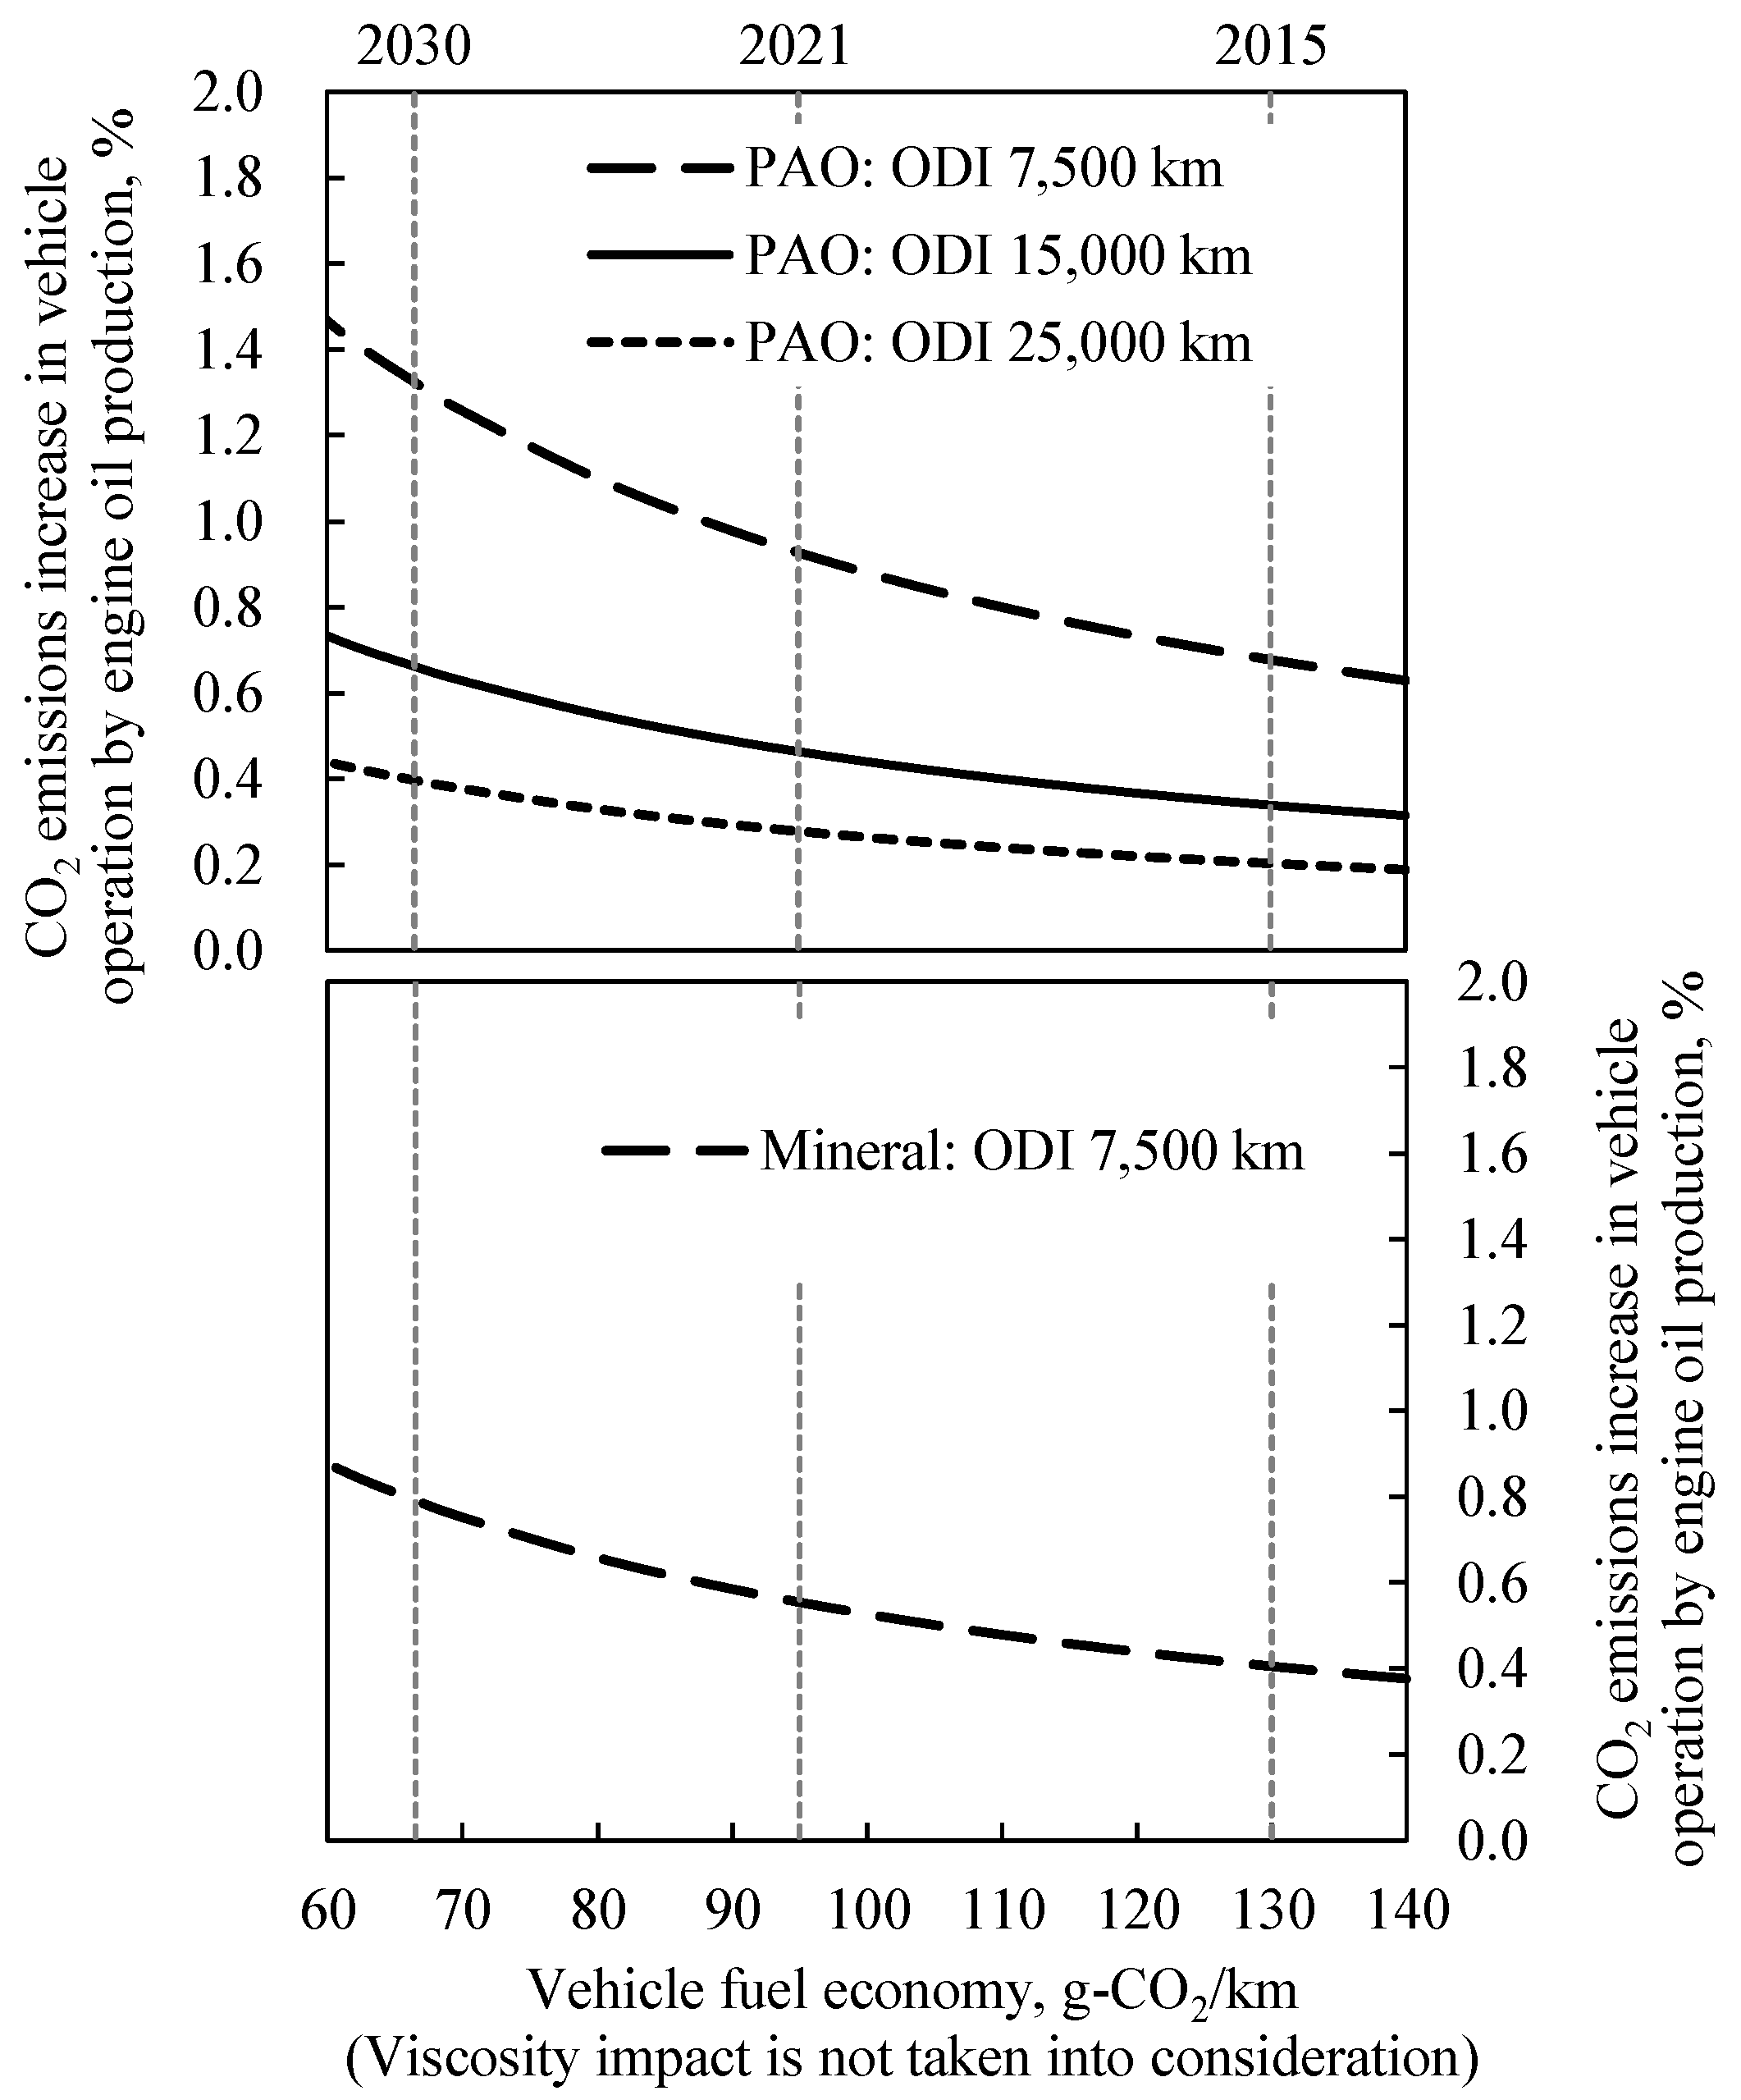
  • As vehicle fuel efficiency improves, the ratio of CO2 emissions from engine oil production to CO2 emissions during vehicle operation increases. Regarding the mineral engine oils, when the ODI was set to 7500 km, CO2 emissions during vehicle operation using 2030 standards (assuming a vehicle fuel efficiency of 66.5 g-CO2/km) increased to 0.8% by CO2 emissions for the production of mineral engine oils. Meanwhile, when synthetic engine oil was used, CO2 emissions in vehicle operation significantly increased to 1.3% under the same conditions.
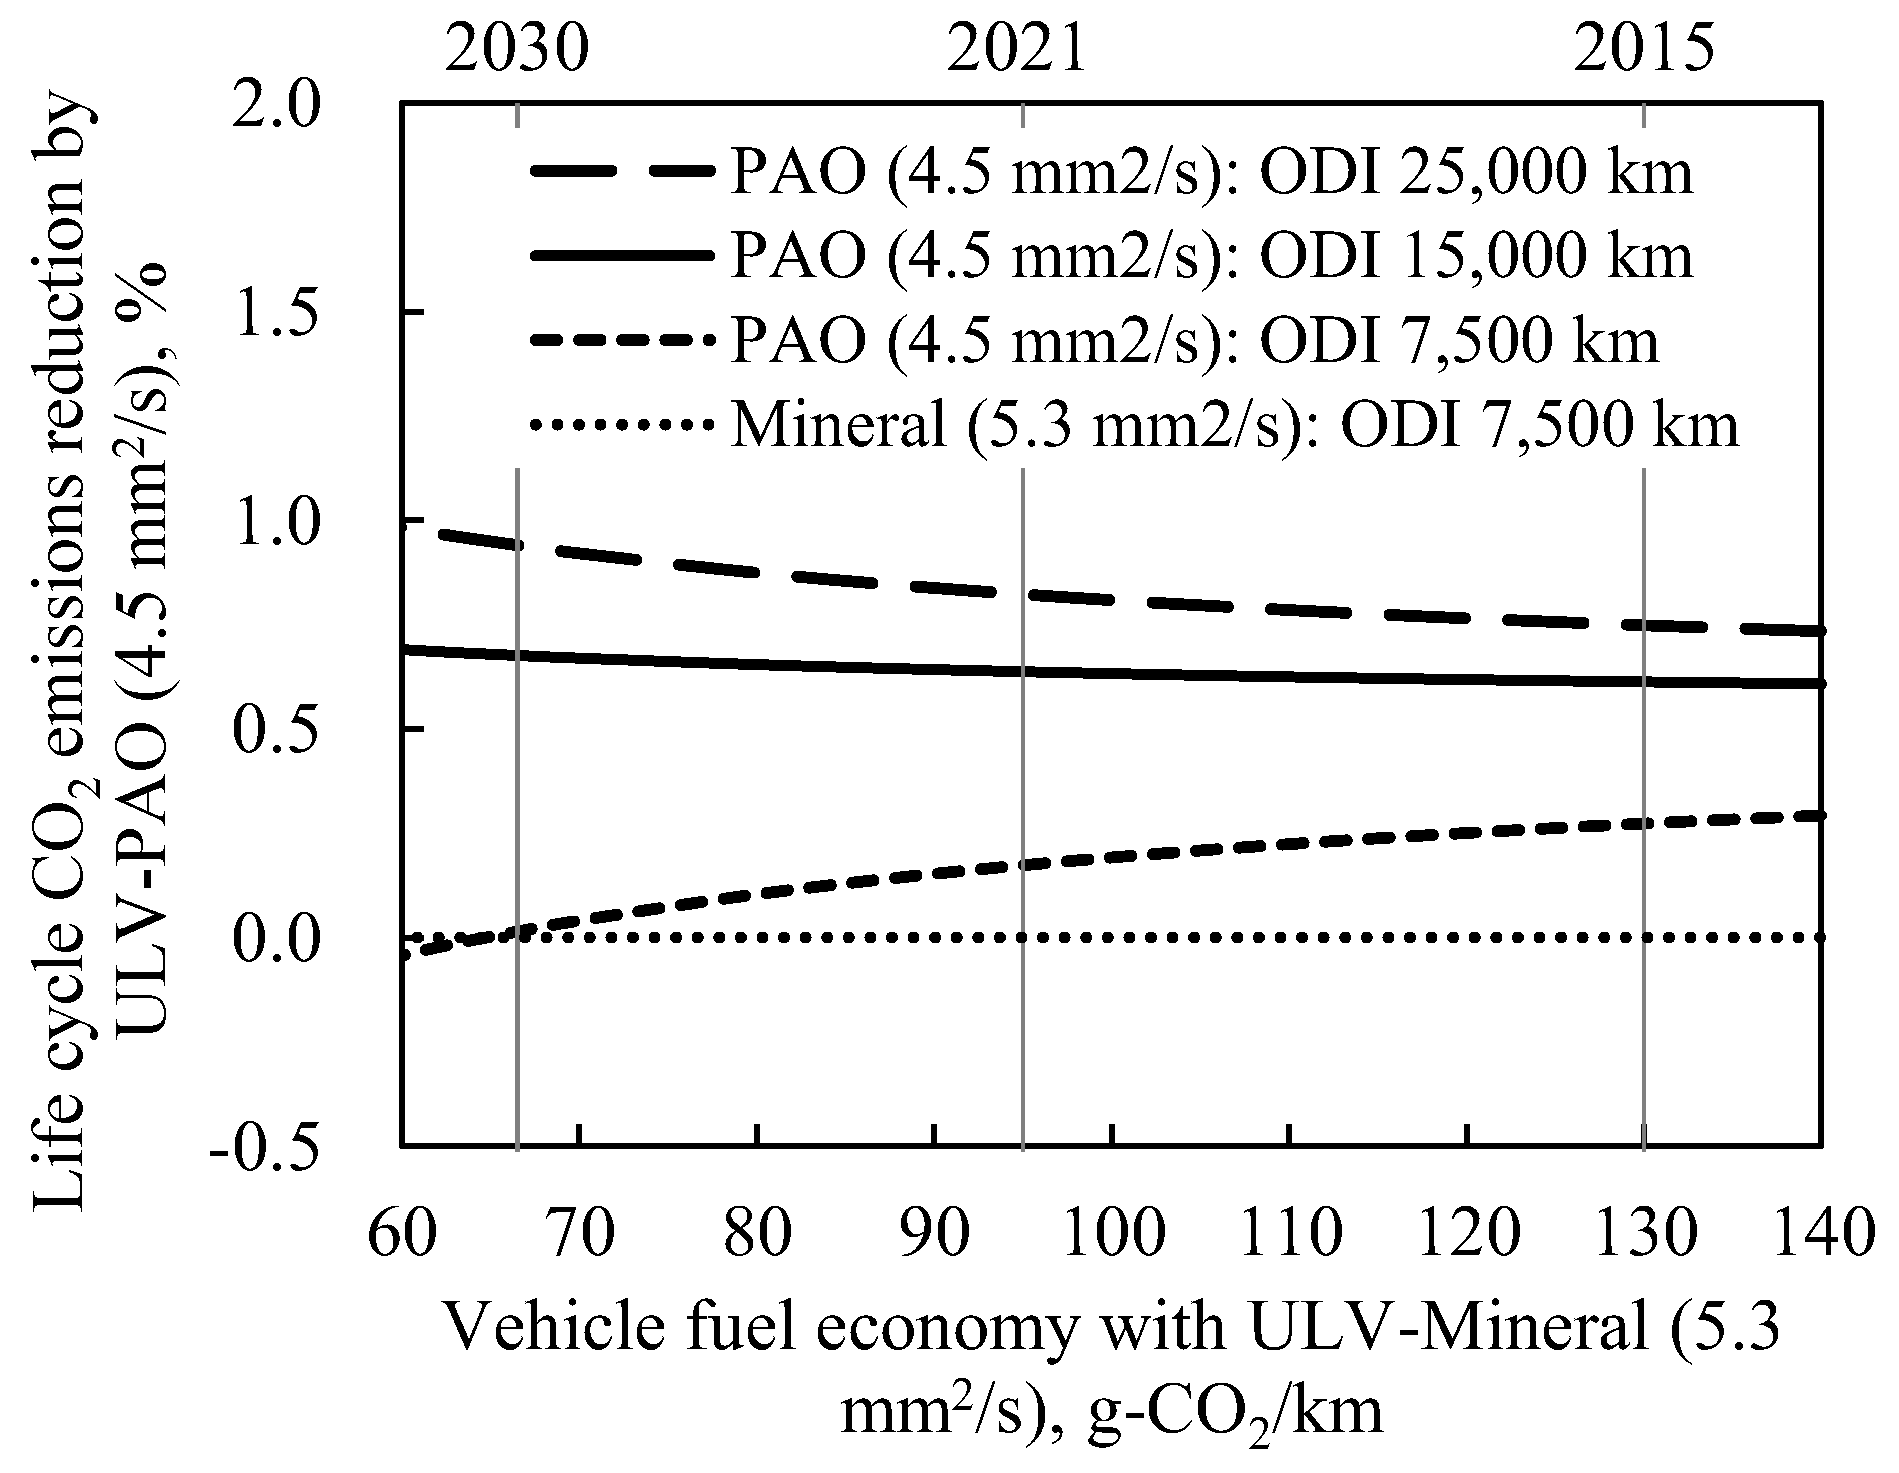
  • Compared with the conventional 0W-16 mineral engine oil, the reduction of LCCO2 emissions associated with ULV-Mineral using a Group-III base-stock was estimated at 0.6% while maintaining a constant cost. In other words, the viscosity of mineral engine oil is expected to continually decrease in the future.
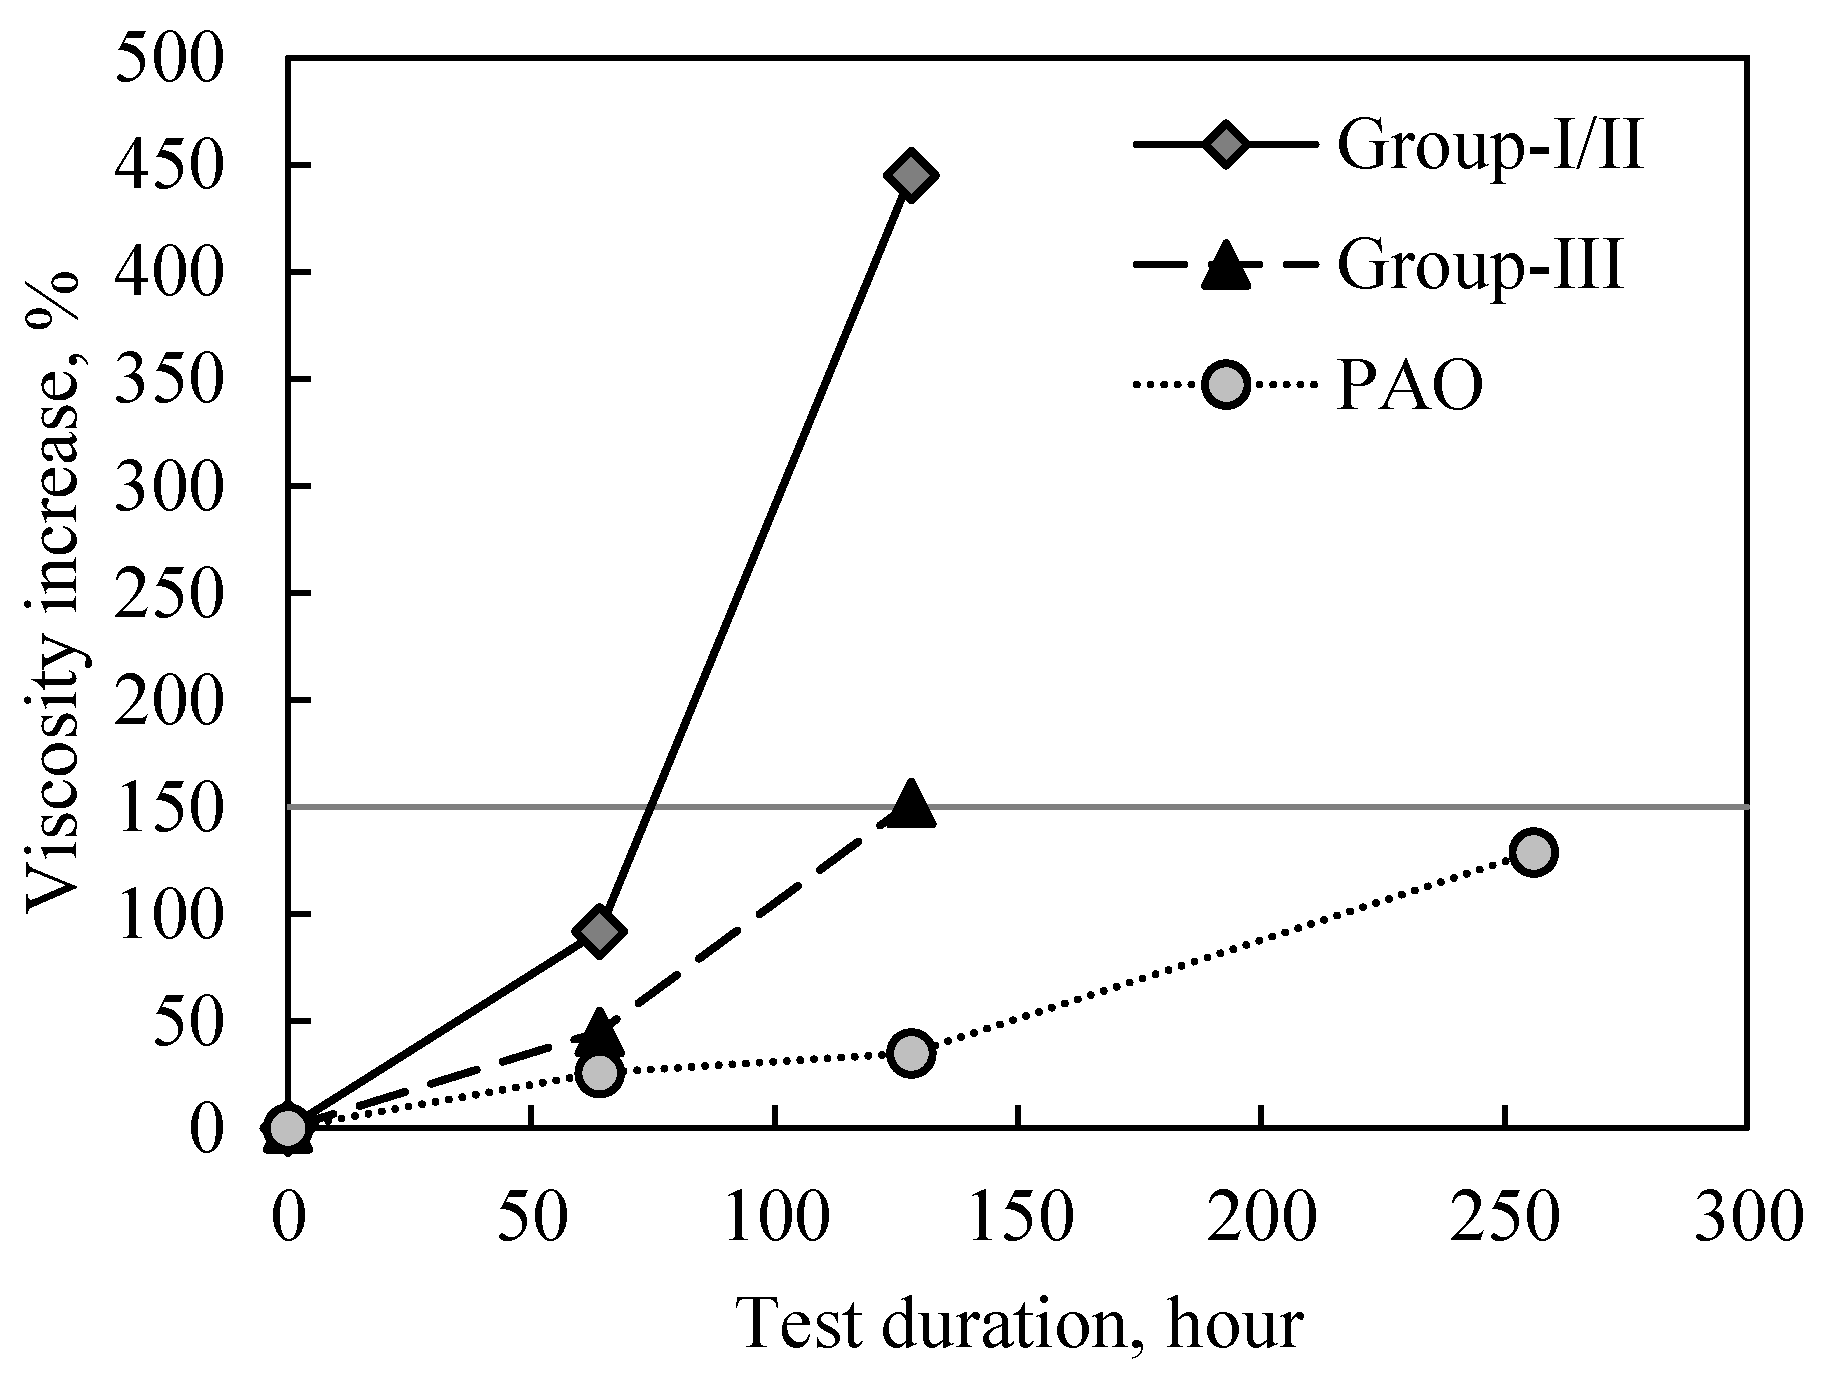
  • Compared with ULV-Mineral, ULV-PAO improves the fuel efficiency of the vehicle by 0.5%. However, considering the CO2 emissions during engine oil production, the reduction of LCCO2 emissions of ULV-PAO compared with ULV-Mineral will be of 0.1% or less in 2030 (assuming a vehicle fuel efficiency of 66.5 g-CO2/km) when the ODI is set equivalent to mineral engine oil (7500 km). Consequently, ULV-PAO loses the cost-effectiveness based on the increased cost of PAO base-stock. On the other hand, when utilizing the characteristics of PAO base-stock with higher oxidation stability in comparison with the mineral base-stock, and extending the ODI to 15,000 km, the effect of reduction of LCCO2 emissions of ULV-PAO is estimated to be 0.7% in 2030, thus making ULV-PAO a competitive and cost-effectiveness alternative. In other words, the popularization of synthetic engine oil as we move toward 2030 will require the consideration of both the reduction in viscosity and the extension of the ODI.
In this research, CO2 emissions during vehicle operation are based on small gasoline engines in NEDC mode. The new WLTP cycle enforces stricter test conditions compared to NEDC mode, and a further decrease of the viscosity potentially causes an increase in engine friction. Future study should consider the WLTP cycle.

Author Contributions

Conceptualization, K.I.; Methodology, K.I.; Validation, K.I. and M.N.; Investigation, K.I. and M.N.; Writing-Original Draft Preparation, K.I.; Writing-Review & Editing, K.I. and M.N.

Funding

This research received no external funding.

Conflicts of Interest

The authors declare no conflict of interest.

References

  1. Proposal for Post-2020 CO2 Targets for Cars and Vans. Available online: https://ec.europa.eu/clima/policies/transport/vehicles/proposal_en (accessed on 4 January 2018).
  2. Toyota Aims for Sales of More Than 5.5 Million Electrified Vehicles Including 1 Million Zero-Emission Vehicles per Year by 2030. Available online: https://newsroom.toyota.co.jp/en/corporate/20353243.html (accessed on 2 January 2018).
  3. Worldwide Sales of Toyota Hybrids Surpass 10 Million Units. Available online: https://newsroom.toyota.co.jp/en/detail/14940871 (accessed on 2 January 2018).
  4. Correspondence for Structural Change of the Automobile Industry. Available online: www.meti.go.jp/policy/economy/keiei_innovation/sangyokinyu/GB/04.pdf (accessed on 2 January 2018). (In Japanese)
  5. Osawa, H.; Yamashita, Y. Trends of R&D Investment. Finance 2017, 53, 52–53. (In Japanese) [Google Scholar]
  6. Mang, T.; Dresel, W. Lubricants and Lubrication; Wiley: Weinheim, Germany, 2007. [Google Scholar]
  7. Forecast of Demand of Petroleum Products from 2017 to 2021 (Plan). Available online: www.meti.go.jp/committee/sougouenergy/shigen_nenryo/sekiyu_gas/sekiyu_doukou_wg/pdf/004_02_00.pdf (accessed on 18 March 2018). (In Japanese)
  8. Statistical Information, Conversion Factor List. Available online: www.paj.gr.jp/statis/kansan/ (accessed on 18 March 2018). (In Japanese).
  9. Survey the World Market Related to Lubricants. Available online: www.group.fuji-keizai.co.jp/press/pdf/161018_16083.pdf (accessed on 9 December 2017). (In Japanese).
  10. Kanari, S.; Kii, M.; Suehiro, S. Reduction of CO2 and cost-effectiveness analysis by future technology of Automobile. J. Jpn. Soc. Energy Resour. 2009, 31, 4. (In Japanese) [Google Scholar]
  11. US Energy Information Administration (EIA). Assumptions to the Annual Energy Outlook 2015. Available online: https://www.eia.gov/outlooks/aeo/assumptions/pdf/0554%282015%29.pdf (accessed on 16 November 2018).
  12. U.S. EPA; NHTSA. Joint Technical Support Document: Final Rulemaking for 2017-2025 Light-Duty Vehicle Greenhouse Gas Emission Standards and Corporate Average Fuel Economy Standards. Joint Technical Support Document (EPA-420-R-12-901). Available online: https://www.nhtsa.gov/sites/nhtsa.dot.gov/files/joint_final_tsd.pdf (accessed on 16 November 2018).
  13. Girotti, G.; Raimondi, A.; Blengini, G.A.; Fino, D. The contribution of lube additives to the life cycle impacts of fully formulated petroleum-based lubricants. Am. J. Appl. Sci. 2011, 8, 1232–1240. [Google Scholar] [CrossRef]
  14. Sagawa, T.; Nakano, S.; Bito, Y.; Koike, Y.; Okuda, S.; Suzuki, R. Development of Low Viscosity API SN 0W-16 Fuel-Saving Engine Oil Considering Chain Wear Performance (2017-01-0881). SAE Int. J. Fuels Lubr. 2017, 10, 469–477. [Google Scholar] [CrossRef]
  15. Fuel Saving Engine Oil Available Models List. Available online: http://toyota.jp/pages/contents/after_service/car_care/yohin/engine_room/engine_oil/image/engine_oil_list_201503.pdf (accessed on 9 December 2017). (In Japanese).
  16. Daily Vehicle Check. Available online: http://qa.jaf.or.jp/check/daily/10.htm (accessed on 9 December 2017). (In Japanese).
  17. Actual Usage of Vehicles in Japan. Available online: http://www.mlit.go.jp/jidosha/iinkai/seibi/5th/5-2.pdf (accessed on 9 December 2017). (In Japanese)
  18. He, H.; Bandivadekar, A. Passenger Car Fuel-Effiency 2020–2025 (No.2013-3). Available online: https://www.theicct.org/sites/default/files/publications/ICCT_PVfe-feasibility_201308.pdf (accessed on 9 December 2017).
  19. Holmberg, K.; Andersson, P.; Erdemir, A. Global energy consumption due to friction in passenger cars. Tribol. Int. 2012, 47, 221–234. [Google Scholar] [CrossRef]
  20. Okuyama, Y.; Shimokoji, D.; Kawauchi, S.; Hatta, T.; Maruyama, M. Effects of Low-viscosity Engine Oil on Fuel Economy and Wear. Honda R&D Tech. Rev. 2010, 22, 158–165. [Google Scholar]
  21. Mo, Y.; Wang, J.; Wang, J.; Dong, T.; Zhou, W. Experimental Research on the Impact of Lubricating Oils on Engine Friction and Vehicle Fuel Economy. In Proceedings of the 3rd International Conference on Material, Mechanical and Manufacturing Engineering (IC3ME 2015), Guangzhou, China, 27–28 June 2015. [Google Scholar]
  22. Fujimoto, K.; Yamashita, M.; Kaneko, T.; Hirano, S.; Ito, Y.; Nemoto, S.; Onodera, K. Development of ILSAC GF-5 0W-20 fuel economy gasoline engine oil (No. 2012-01-1614). SAE Tech. Pap. 2012. [Google Scholar] [CrossRef]
  23. Kaneko, T.; Yamamori, K.; Suzuki, H.; Onodera, K. Development of Low Viscosity Engine Oil Compatible with LSPI Prevention Performance (No. 20176327). In Proceedings of the 2017 Society of Automotive Engineers of Japan (JSAE) Annual Congress (Autumn), Osaka, Japan, 11–13 October 2017. (In Japanese). [Google Scholar]
  24. Liu, H.; Jin, J.; Li, H.; Yamamori, K.; Kaneko, T.; Yamashita, M.; Zhang, L. 0W-16 Fuel Economy Gasoline Engine Oil Compatible with Low Speed Pre-Ignition Performance (2017-01-2346). SAE Int. J. Fuels Lubr. 2017, 10. [Google Scholar] [CrossRef]
  25. Tamoto, Y.; Kido, M.; Murata, H. Possibilities of ultra-low viscosity fuel saving gasoline engine oil (No. 2004-01-1936). SAE Tech. Pap. 2004. [Google Scholar] [CrossRef]
  26. Ishizaki, K.; Nakano, M. Low viscosity lubricant contribution to reduce life cycle CO2 emissions on passenger vehicle. J. Jpn. Soc. Tribol. 2018, 63, 563–572. (In Japanese) [Google Scholar]
  27. Covitch, M.J.; Brown, M.; May, C.; Selby, T.; Goldmints, I.; George, D. Extending SAE J300 to viscosity grades below SAE 20 (2010-01-2286). SAE Int. J. Fuels Lubr. 2010, 3, 1030–1040. [Google Scholar] [CrossRef]
  28. Carvalho, M.; Richard, K.; Goldmints, I.; Tomanik, E. Impact of lubricant viscosity and additives on engine fuel economy (No. 2014-36-0507). SAE Tech. Pap. 2014. [Google Scholar] [CrossRef]
  29. Vinci, J.N.; Grisso, B.A.; Schenkenberger, C.; Qureshi, F.S.; Gahagan, M.P.; Hasegawa, H. Systematic formulation of efficient and durable axle lubricants for light trucks and sport utility vehicles (No. 2004-01-3030). SAE Tech. Pap. 2004. [Google Scholar] [CrossRef]
  30. Rudnick, L.R. Synthetics, Mineral Oils, and Bio-Based Lubricants: Chemistry and Technology; CRC Press: Boca Raton, FL, USA, 2013. [Google Scholar]
  31. Masuko, M. Trends of Lubricants. J. Jpn. Soc. Tribol. 2016, 61, 35–38. (In Japanese) [Google Scholar]
  32. Wu, M.M.; Ho, S.C.; Forbus, T.R. Synthetic lubricant base stock processes and products. In Practical Advances in Petroleum Processing; Springer: New York, NY, USA, 2006; pp. 553–577. [Google Scholar]
  33. Brewer, M.L.; Smith, S.J. Liquid Fuel Compositions. United States Patent Application Publication US 2014/0338624 A1, 20 November 2014. [Google Scholar]
  34. Kimura, Y.; Kato, N.; Kataoka, T.; Takahashi, K.; Kikuchi, T. Bubble behavior in engine lubricant. Int. J. Automot. Eng. 2011, 2, 149–153. [Google Scholar]
  35. Product Data Sheet of HiTEC® 9858. Available online: www.neochemical.kz/File/HiTEC_9858_PDS.pdf (accessed on 26 May 2018).
  36. Product Data Sheet of HiTEC® 9890. Available online: http://www.oil-club.ru/forum/index.php?app=core&module=attach&section=attach&attach_id=96390 (accessed on 26 May 2018).
  37. Product Data Sheet of HiTEC® 11170. Available online: https://www.ashdowneoil.co.uk/wp-content/uploads/2017/07/HiTEC-11170_PDS.pdf (accessed on 26 May 2018).
  38. Treat Rates. Available online: https://passenger.lubrizoladditives360.com/treat-rates/ (accessed on 26 May 2018).
  39. Sloan, T. A Strategic Analysis of Bestline Lubricants’diesel Engine Treatment. Available online: http://summit.sfu.ca/item/15858 (accessed on 16 November 2018).
  40. Erhan, S.Z.; Sharma, B.K.; Doll, K.M. Opportunities for industrial uses of agricultural products. Chem. Today 2009, 27, 38–41. [Google Scholar]
  41. Base Oil Market Prices, News and Analysis in 2012. Available online: https://www.argusmedia.com/DataFiles/BASEOILS/2012-08-31/ufsaks20120831baseoils.pdf (accessed on 26 May 2018).
  42. Base Oil Market Prices, News and Analysis in 2016. Available online: http://view.argusmedia.com/rs/584-BUW-606/images/Argus%20Base%20Oils%20Review%20Preview%202016-17.pdf (accessed on 26 May 2018).
  43. Base Oil Market Prices, News and Analysis in 2017. Available online: https://www.argusmedia.com/-/media/Files/brochures/argus-base-oils-annual-review-2017.ashx?la=en&hash=861F41CD4F925DE138B7D3DE0C1D3E837177894B (accessed on 26 May 2018).
  44. Base Oil Report. Available online: http://machinerylubricationindia.com/magazine/105-2015/mar-apr/271-base-oil-report (accessed on 13 January 2018).
  45. Market Trend of Base-Stocks for Lubricants. Available online: https://www.juntsu.co.jp/tribology-doc/baseoil-markettrend.php (accessed on 13 January 2018). (In Japanese).
  46. Koyamaishi, N.; Suzuki, T.; Kamioka, R.; Murakami, M.; Yamashita, M.; Ogawa, T.; Komiya, K.; Moritani, H. Study of future engine oil (first report): Future engine oil scenario (No. 2007-01-1977). SAE Tech. Pap. 2007. [Google Scholar] [CrossRef]
  47. Akiyama, K.; Ueda, F.; Miyake, J.; Tasaka, K.; Sugiyama, S. Fuel economy performance of the highly efficient fuel economy oils using chassis dynamometer test (No. 932690). SAE Tech. Pap. 1993, 932690. [Google Scholar] [CrossRef]
  48. Zacharof, N.; Fontaras, G.; Ciuffo, B.; Tsiakmakis, S.; Anagnostopoulos, K.; Marotta, A.; Pavlovic, J. Review of in Use Factors Affecting the Fuel Consumption and CO2 Emissions of Passenger Cars; European Commission: Luxembourg, 2016. [Google Scholar]
  49. Spot Prices for Crude Oil and Petroleum Products. Available online: https://www.eia.gov/dnav/pet/hist/LeafHandler.ashx?n=PET&s=RWTC&f=M (accessed on 13 January 2018).
  50. Poly Alpha Olefin (PAO) Market Forecast by 2025. Available online: https://allindustryresearch.com/poly-alpha-olefin-pao-market-forecast-by-2025-qy-research/113298/ (accessed on 4 November 2018).
  51. Arezki, M.R.; Jakab, Z.; Laxton, M.D.; Matsumoto, M.A.; Nurbekyan, A.; Wang, H.; Yao, J. Oil Prices and the Global Economy; International Monetary Fund: Washington, DC, USA, 2017. [Google Scholar]
Figure 1. System boundary of the analysis.
Lubricants 06 00102 g001
Figure 2. Noack volatility (ASTM D5800) of base-stocks.
Lubricants 06 00102 g002
Figure 3. The oxidation stability of base-stocks (ASTM Sequence IIIE engine test).
Lubricants 06 00102 g003
Figure 4. The correlation between the kinematic viscosity at 100 °C and fuel efficiency improvement (FEI) in NEDC mode using 1.5–1.8 L gasoline engines.
Lubricants 06 00102 g004
Figure 5. CO2 emissions in the lubricants’ production of ULV-Mineral and ULV-PAO.
Lubricants 06 00102 g005
Figure 6. CO2 emissions increase in vehicle operation by engine oil production, taking into account three different ODI conditions.
Lubricants 06 00102 g006
Figure 7. Reducing of CO2 emissions in the life cycle of ULV-PAO compared to ULV-Mineral.
Lubricants 06 00102 g007
Figure 8. Base-stock prices taking into account WTI crude oil price.
Lubricants 06 00102 g008
Figure 9. Calculated three different engine oils cost impacts for a vehicle (baseline: engine oil with group-III base-stock), taking into account WTI crude oil price.
Lubricants 06 00102 g009
Figure 10. The incremental cost analysis against fuel economy improvement.
Lubricants 06 00102 g010
Figure 11. Breakeven cost increase for ULV-PAO (ODI 7500, 15,000, and 25,000 km) versus ULV-Mineral (ODI 7500 km). The amount of oil for a vehicle is assumed to be 4.0 L.
Lubricants 06 00102 g011
Table 1. Assumed lubricants’ specifications for the analysis.
Property0W-16ULV-MineralULV-PAO
Finished fluid KV1006.2 mm2/s5.3 mm2/s4.5 mm2/s
Base-stock KV100 (type)n/a (Gr-III)4.3 mm2/s (Gr-III)3.6 mm2/s (PAO)
Add Pack KV100n/a80 mm2/s80 mm2/s
Noack volatilityn/a15 wt %15 wt.%
Mineral base-stockYes89.0 wt %
PAO base-stockNo89.0 wt %
Add Packn/a11.0 wt %11.0 wt %
Detergent (Det)n/a2.0 wt %2.0 wt %
Dispersant (Dis)n/a6.0 wt %6.0 wt %
Antioxidant (AO)n/a1.0 wt %1.0 wt %
Antiwear (AW)n/a2.0 wt %2.0 wt %
Oil amount4.0 L4.0 L4.0 L
Densityn/a0.84 kg/L0.84 kg/L
ODI7500 km7500 km7500, 15,000, and 25,000 km

