1. Introduction
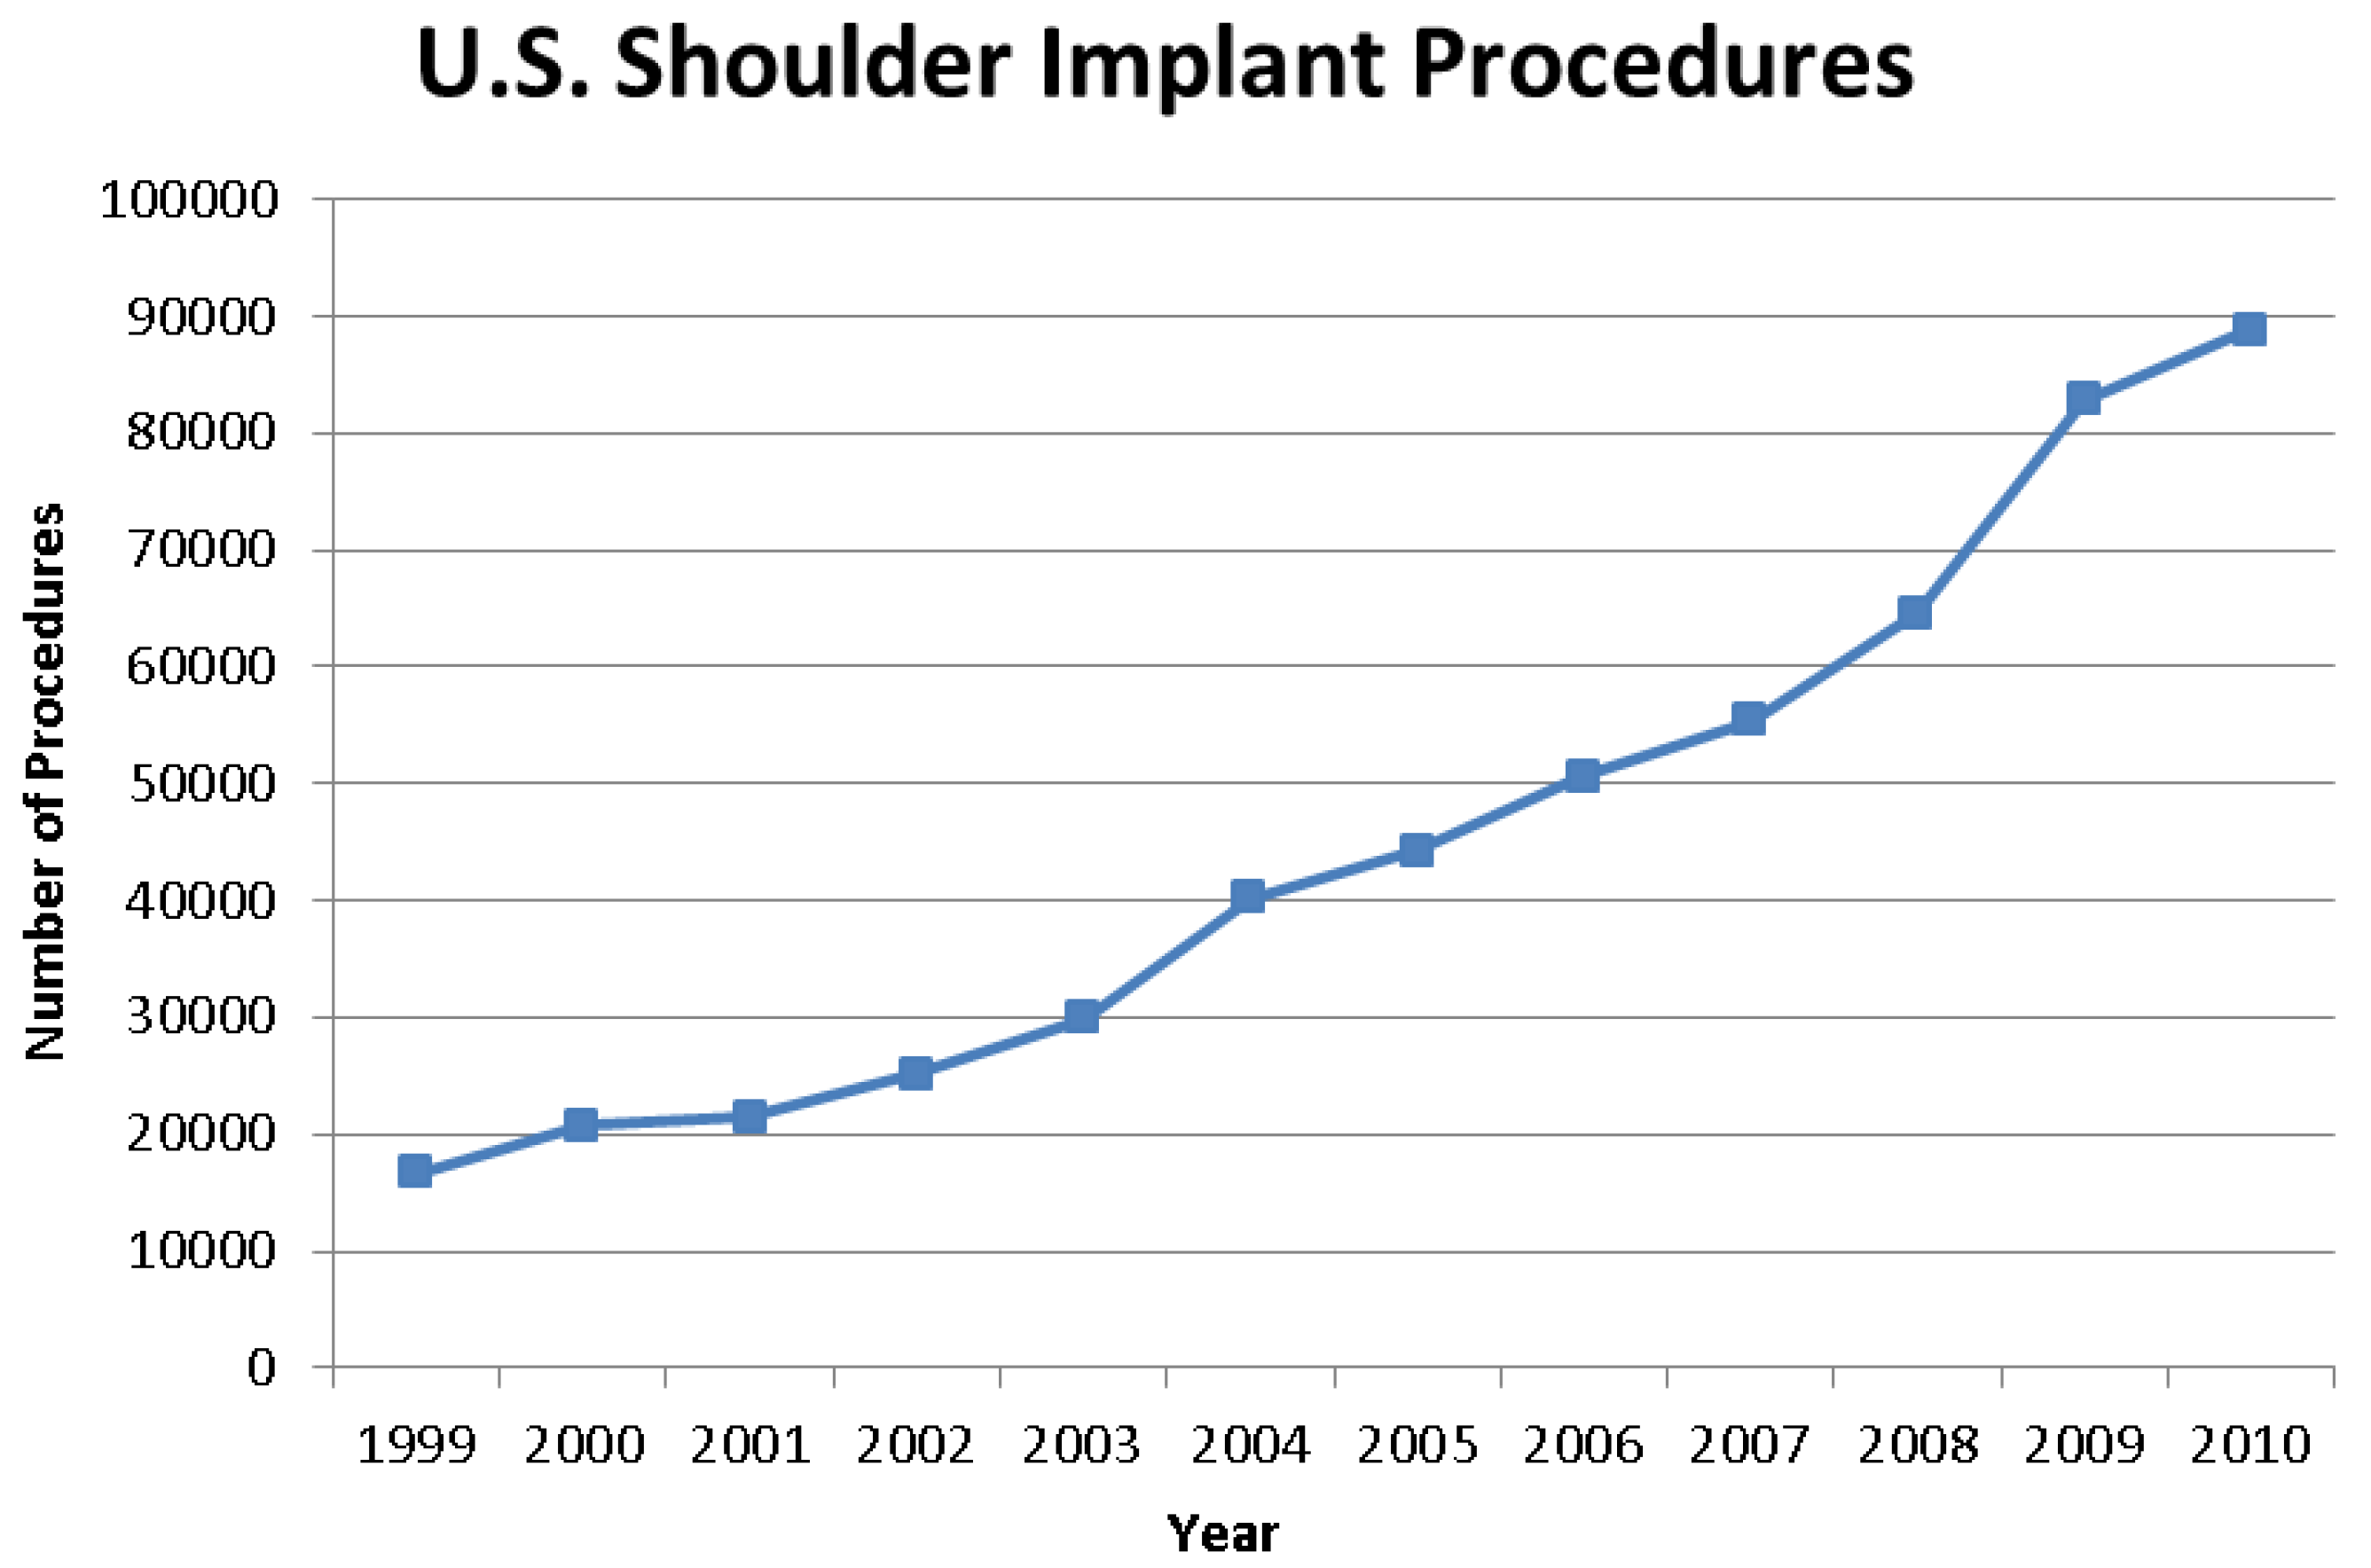
The nationwide demand for orthopedic implant surgeries is constantly increasing. The number of total shoulder arthroplasty (TSA) procedures in US hospitals increased 7.4% to 88,470 procedures between 2009 and 2010 (
Figure 1) [
1]. Shoulders represented 7% of all joint replacements in the US for 2010 [
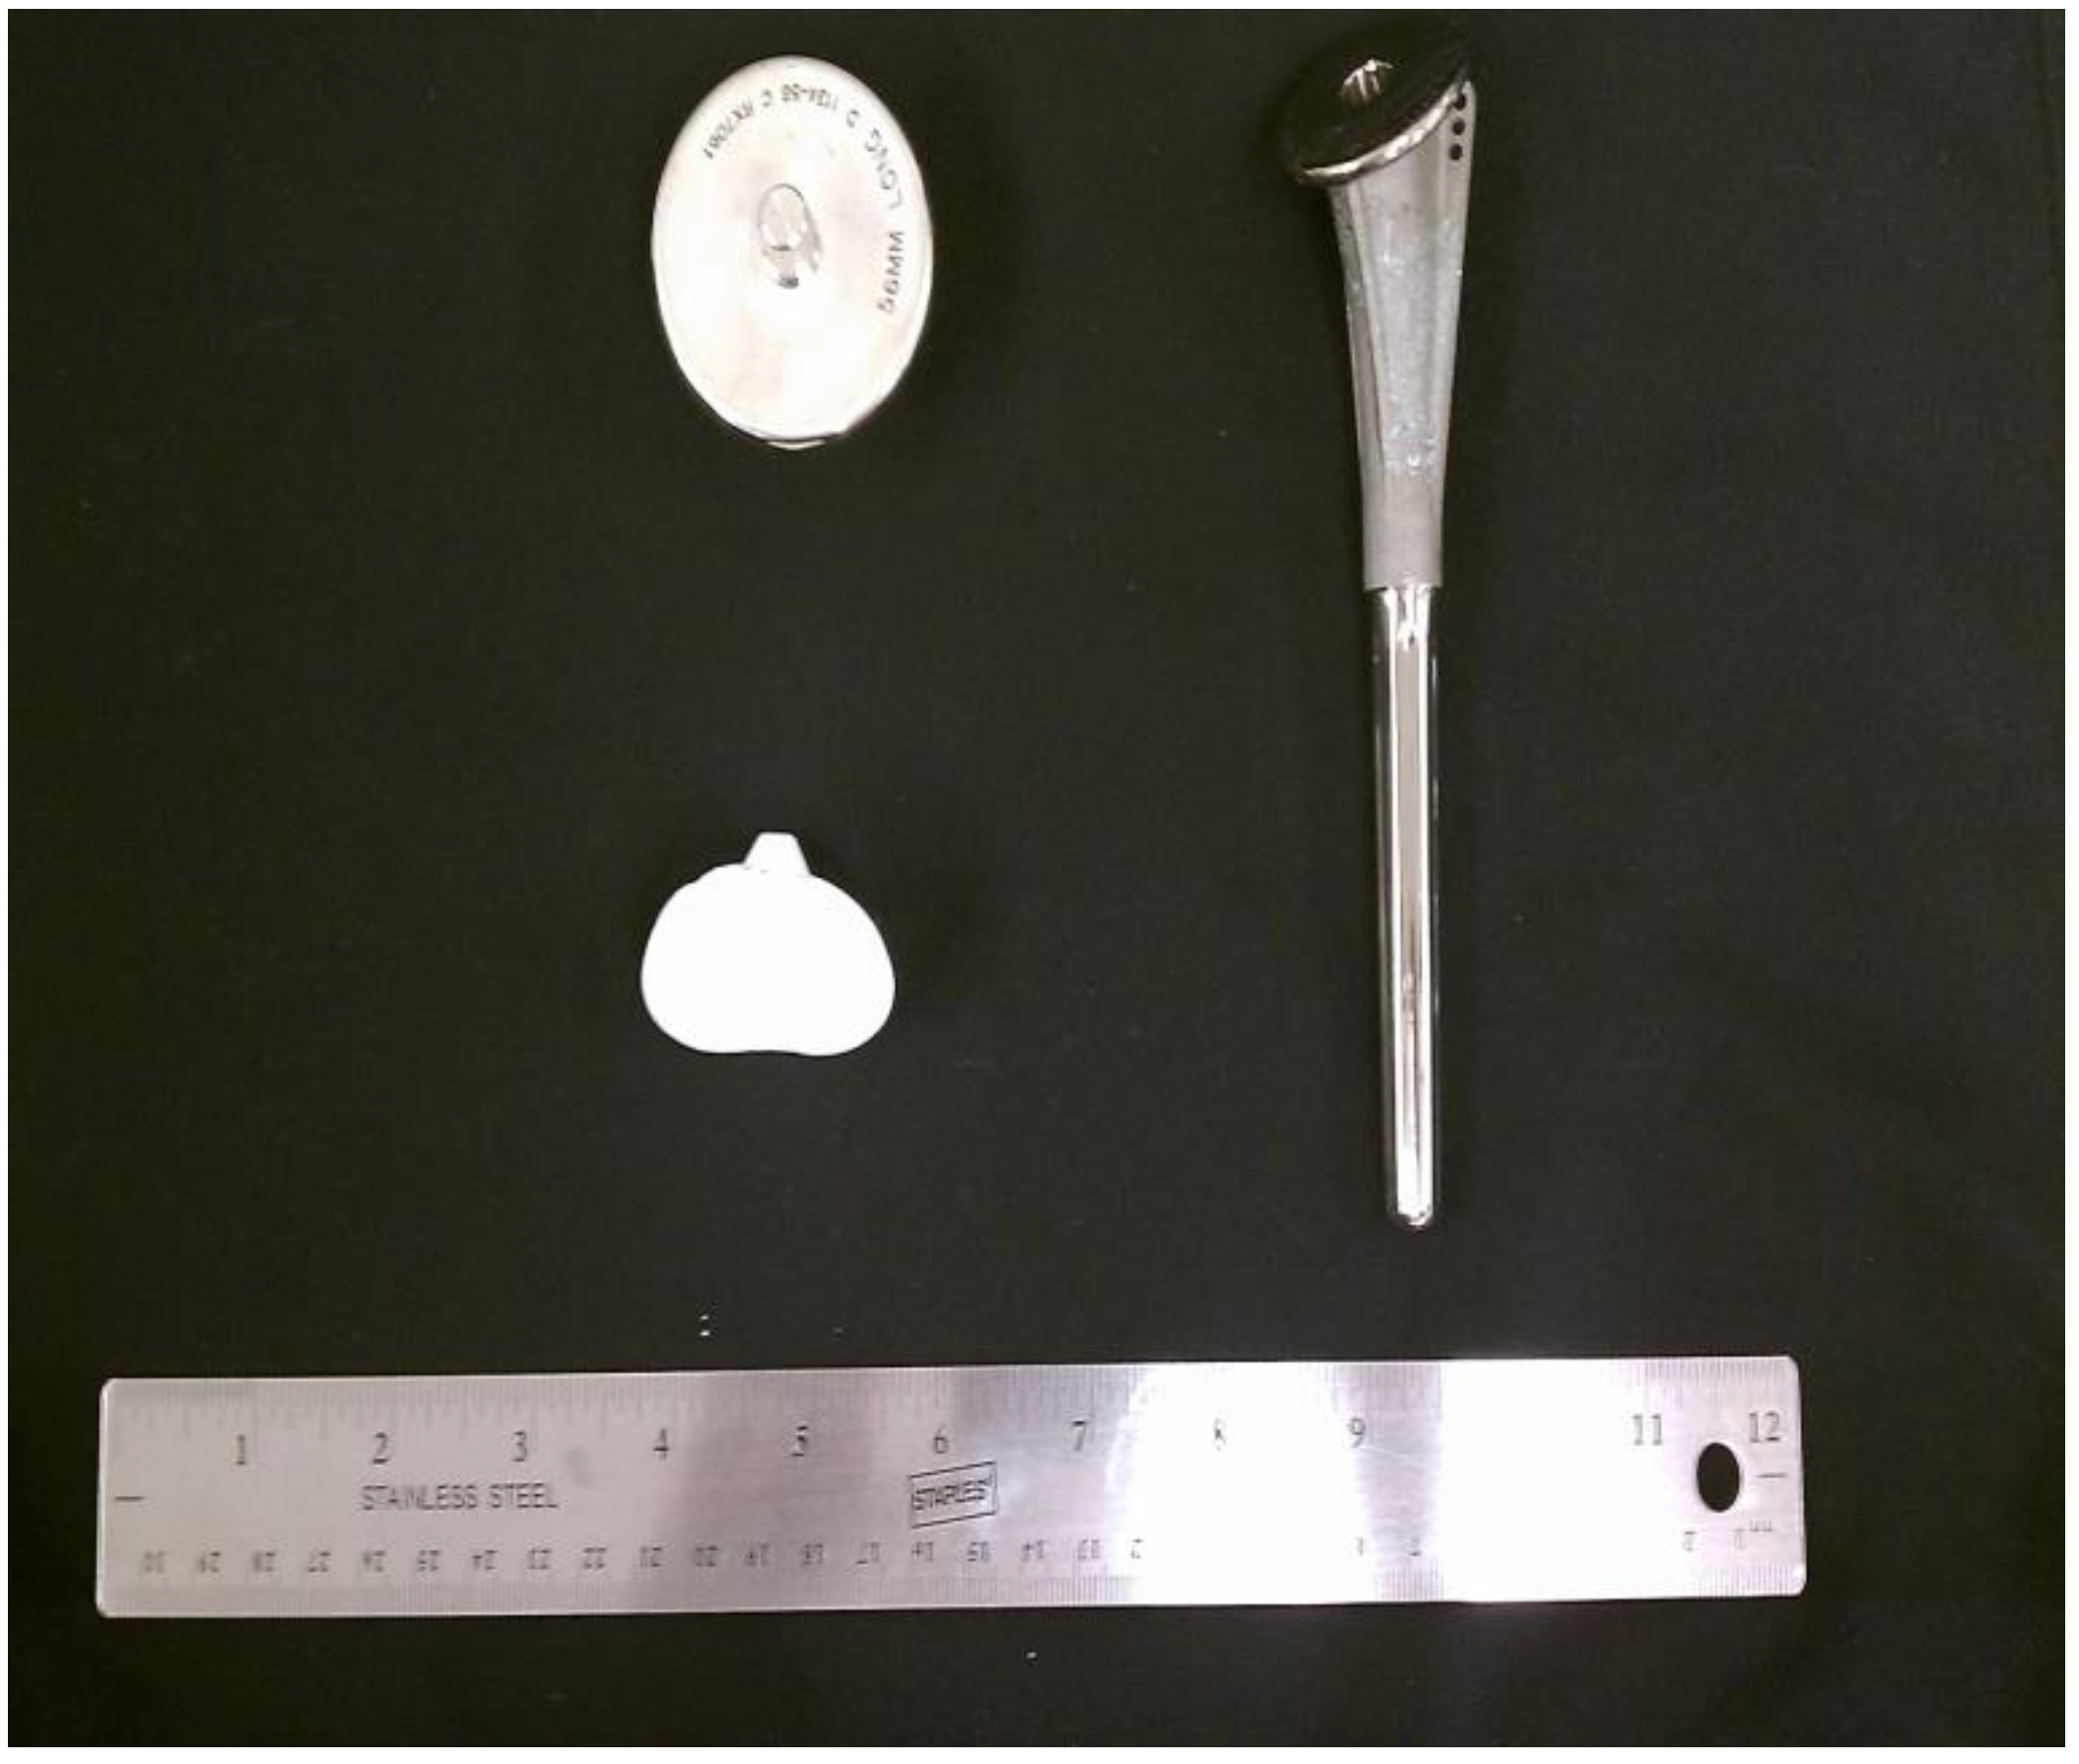
1]. A typical TSA includes three components: stem, head, and glenoid liner (see
Figure 2). There are variations to each component and variations within the overall form of various TSAs. Glenoid liners are typically made of cross-linked, ultra-high-molecular-weight polyethylene while the other components are metallic. The stem is made of titanium alloy while the humeral head is made of a cobalt chromium alloy [
2]. With respect to the failure of implants and TSA revision surgeries, loosening of the glenoid component was recognized as one of the common indicators for revision surgery [
3]. Revision surgery can be complicated because of the multifactorial nature of the problems encountered in failed shoulder arthroplasties [
3]. Although loosening is the most common reason for revision, displacement of the high-density polyethylene insert, implant material failure, and instability were also significantly present [
3]. The presence of eccentric forces on the glenoid component results in a tendency for micro-motion of the glenoid component in the glenoid fossa, which increases the stress at the bone-cement or bone-implant interface [
3]. Rates of revision surgeries are highly varied and are estimated to lie somewhere below 12.5% [
3].
Figure 1.
Graph showing the continual increase in shoulder implant procedures from 1999 to 2010 [
1].
Figure 1.
Graph showing the continual increase in shoulder implant procedures from 1999 to 2010 [
1].
Figure 2.
Stem, head and glenoid components of a shoulder implant.
Figure 2.
Stem, head and glenoid components of a shoulder implant.
Integrating a numerical wear classification system is valuable for making direct comparisons among various implants, and doing so can provide information about common wear patterns [
4,
5,
6,
7,
8]. Currently, there is no standard for numerical wear analysis protocol, although several protocols have been suggested. Several investigators analyzed retrieved implants in various ways [
4,
5,
6,
7,
8]. Most analyses involved qualitative observations with and/or without the use of microscopes [
4,
5,
6,
7,
8]. Investigators based their observations of polyethylene liners on standard indicators of wear: pitting, scratching, delamination, complete wear, embedded debris, abrasion, burnishing, deformation, fracture, and others. Some studies added damage modes and utilized fewer parameters [
4,
5,
6,
7,
8].
Several previous studies have examined retrieved shoulder implants using the protocols developed for knee liners. As with standard implant retrieval analyses, these studies follow ASTM F561-05 standards. Hood
et al. worked with tibial components and identified a single score based on a subjective observation of severity and prevalence informally combined [
4]. All other studies have been modifications of Hood’s initial attempt to quantify damage. Gunther
et al. examined retrieved polyethylene glenoid components and designed a classification system for visual characteristics [
5]. They examined a total of 10 shoulder implants and their classification system is an adaptation of previous models applied to assess hip and knee surface damage [
5]. This system divided the polyethylene glenoid component into four quadrants and incorporated nine modes of damage that were subsequently scored based on severity [
5]. Yeakley conducted Stage I and II analyses on total shoulder joints and did not include shoulder roughness [
6]. Yeakley used the same classification that Gunther
et al. developed [
5,
6]. The nine modes of damage included: delamination, pitting, scratching, abrasion, burnishing, deformation, complete wear-through, embedded debris and complete fractures [
5]. Gunther’s system was based on that of Hood
et al. which sought to quantify damage to knee prostheses. Hood only incorporated seven modes of surface degradation, which excluded complete wear-through and component fracture [
4]. Furthermore, Lombardi
et al. used a quantification system on total knee arthroplasties that added discoloration and fraying of locking mechanisms but excluded complete wear and component fracture [
7]. Wasielewski
et al. advanced the Hood method by measuring severity and prevalence separately [
8]. Brandt
et al. examined 52 polyethylene tibial inserts. Brandt incorporated six damage modes: burnishing, grooving, indentations, pitting, deformation and stippling [
8].
These studies sought to quantify the total wear of an implant by arriving at a total backside damage score (BDS) for each insert. This BDS was the summation of damage feature scores (DFS) in each area of investigation. The DFS was the product of an area score (AS) and a severity score (SS). The SS was a measure of the severity of any one of the damage modes, and the AS indicated the prevalence of the damage mode on a certain percentage of an area. The DFS was then obtained by multiplying the AS and the SS (and the depth score in Lombardi’s case) for each damage mode, and within each quadrant. Scoring methods are shown in
Table 1. These scores were summed to yield an overall damage score.
Very little data was associated with the retrieved shoulder implants given the geometry of the liner is quite complex (hemispherical). Demographic information including gender and age and revision dates is presented in
Appendix I. An effort was made to identify the manufacturer and model of the implants. The preoperative diagnosis and indications for the primary arthroplasty are not available for this paper. The retrieved liners were examined in the condition that they were received.
2. Methodology
The implants were explanted according to ASTM F561-05, Standard Practice for Retrieval and Analysis of Medical Devices, and Associated Tissue and Fluids details suggested procedures for handling and processing implants with surrounding tissues [
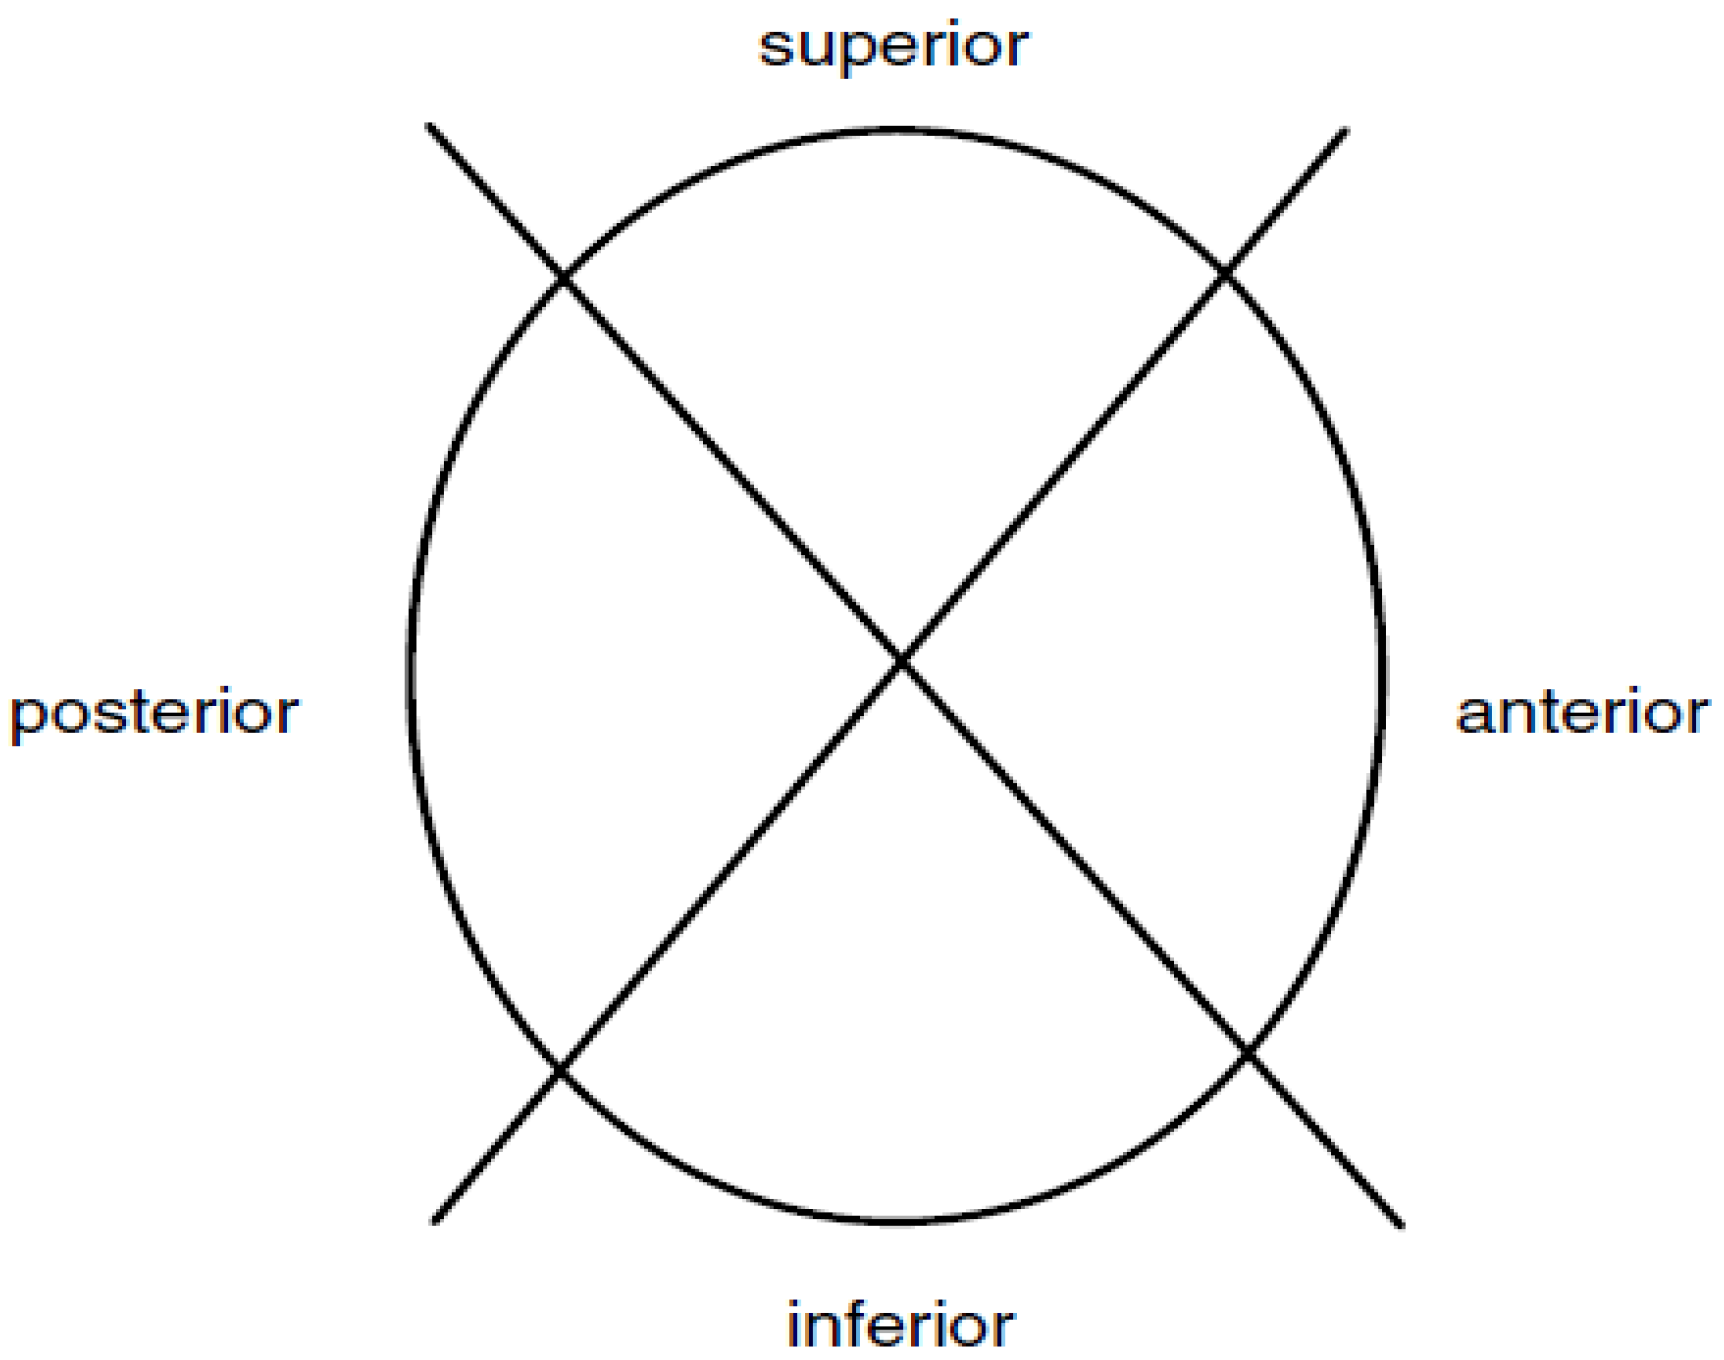
9]. The subsequent analysis included minimal information about the circumstances upon which the implant was explanted. Investigators followed stages I and II of the standard protocol during which the polyethylene inserts were documented photographically. The components were then subject to a visual examination, including observations made with the unaided eye. For the purposes of examination and numerical assessments of the wear regions, the glenoid liners were defined by four quadrants as shown in
Figure 3 [
5,
6]. All components were then evaluated using a stereomicroscope under relatively low magnification.
Table 1.
The scoring details of the four methods.
Table 1.
The scoring details of the four methods.
| | Severity Score (SS) | Area Score (AS) | Depth Score (DS) | Combined Score |
|---|
| Hood Method | N/A | N/A | N/A | 0—No damage, damage on 0% of area
1—mild damage, damage on <10% of area
2—moderate, damage on approximately 10% to 50% of the area
3—severe, damage on >50% of the area |
| Wasielewski Method | 0—No visible damage
0.33—just visible damage
0.66—clearly visible damage
1.0—severe damage visible | 0—damage on 0% of area
1—damage on <10% of area
2—damage on approximately 10% to 50% of the area
3—damage on >50% of the area | N/A | SS × AS |
| Brandt Modified Method | 0—No damage
1—mild damage
2—moderate
3—severe | 0—no area covered
1—up to 10%
2—above 10% and up to 20%
3—above 20% and up to 30%
4—above 30% and up to 40%
5—above 40% and up to 50%
6—above 50% and up to 60%
7—above 60% and up to 70%
8—above 70% and up to 80%
9—above 80% and up to 90%
10—above 90% and up to 100% | N/A | SS × AS |
| Lombardi Method | 0—negligible
1—mild damage
2—moderate
3—severe | 0—negligible
1—less than 10%
2—between 10% and 50%
3—greater than 50% | 1—less than 500 μm
2—between 500 μm and 1mm
3—greater than 1 mm | SS × AS × DS |
Figure 3.
Four quadrants of the glenoid liner.
Figure 3.
Four quadrants of the glenoid liner.
All the liners were examined and scored by four independent observers. Observers received a 30 min training session that covered the damage modes and quantification scales. Proper use of the microscope and scoring was covered during a session that demonstrated these skills. Observers were allowed to ask questions during this training period. Each observer received the same training. Investigators were interested in particular damage modes as described below. Delamination described areas with evidence of subsurface cracking that results in separation of sheets of polyethylene; pitting described small, isolated depressions on the surface; scratching was thin, isolated lines of indentation in the surface; abrasion was areas of roughened texture that appear shredded or tufted; burnishing manifested as highly polished areas; deformation described permanent deformation of the polyethylene on or around the edges of the liner, presumably caused by creep or cold flow; embedded debris included fragments of foreign material; and complete fracture was a separation caused by a progressive crack; stippling was a more extreme type of abrasion that presented as a circumferential wear pattern; grooving was relatively long scratches having a directional orientation and appearance [
5,
8]. The order in which the implants were examined was randomized to prevent an experience bias to accumulate in conjunction with the identification numbers of the devices [
10,
11,
12]. Observers were limited to two hours or three liners each day to prevent fatigue and inferior, rushed work [
10,
11,
12]. The implants were graded for each wear mode based on severity using a 0 to 3 scale. The extents of the standards are as follows: 0 equates to no, or minimal damage; 1 mild damage; 2 moderate damage; 3 severe damage. The prevalence of each wear mode was then assessed based on the percentage of area covered from 0% to 100%. This percentage was assigned an appropriate prevalence score based on the guidelines of each of the Hood, Wasielewski and Brandt methods. These standards are extremely subjective, qualitative and largely depended on an extensive relative knowledge of each damage mode. In order to mitigate the effect of a particular observer on the final damage score, some quantitative standards of scoring would be useful [
12]. For each wear mode, a particular trait was identified. A total, composite damage score was a linear summation of all the damage modes identified presented below and elaborated on in
Appendix II.
where
i = 1 through 4 represents each of the four quadrants of a particular glenoid liner and
j represents a particular wear mode. In this instance,
n = 11.
| j = 1 | delamination |
| j = 2 | pitting |
| j = 3 | abrasion |
| j = 4 | scratching |
| j = 5 | burnishing |
| j = 6 | deformation |
| j = 7 | embedded debris |
| j = 8 | complete fracture |
| j = 9 | complete wear |
| j = 10 | stippling |
| j = 11 | grooving |
This damage summation equation shows that the total damage score was a culmination of the contributions made by each wear mode, and accounting for each quadrant summed linearly. For glenoid liners, the number of quadrants should be four, but the number of wear modes may change. Various methods add or omit various modes of wear. Along with variations in the included wear modes, each method associates a variation in the greatest possible total damage score. Higher wear modes equate to a greater potential damage score and added j values. This equation requires two values for each wear mode, within each quadrant, and is representative of the Wasielewski and Brandt methods of quantitative analysis.
3. Results
Four observers evaluated nine glenoid implant liners on the basis of severity and area percentage of various implant damage modes.
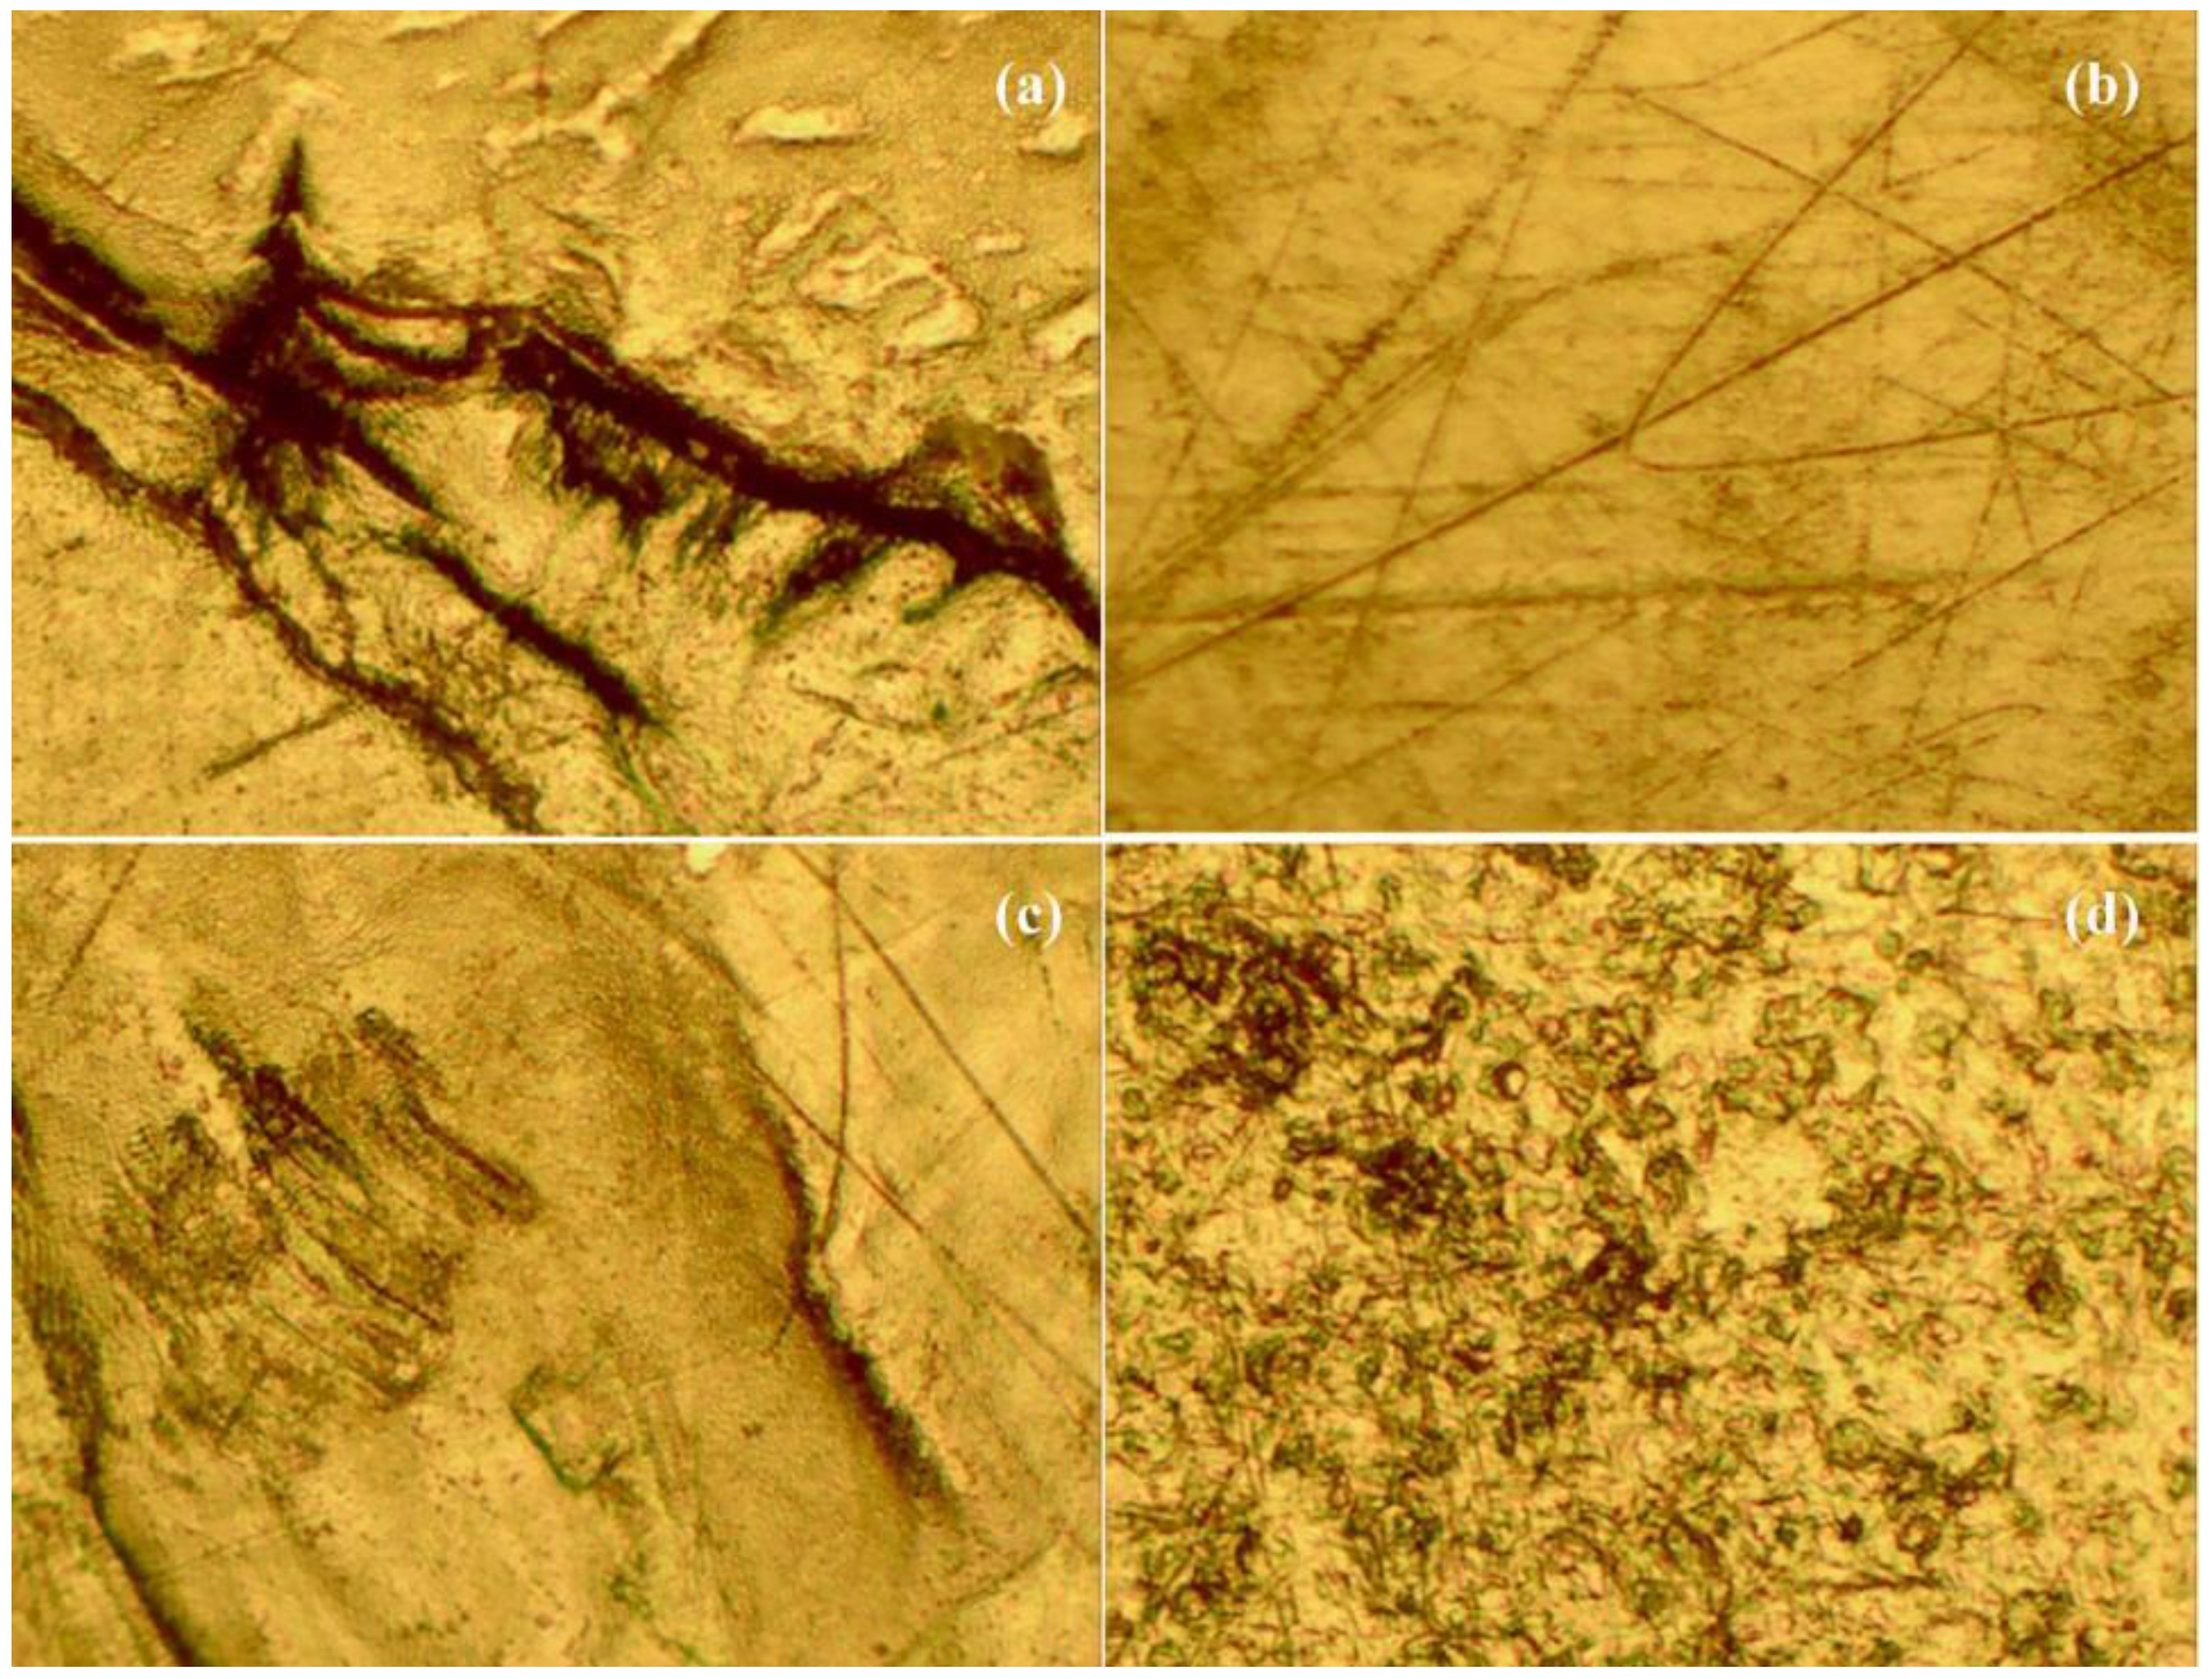
Figure 4 shows some images taken using a stereomicroscope at low magnification.
Figure 4.
(a) Shows severe grooving at 10× magnification; (b) shows burnishing in addition to severe scratching at 10× magnification; (c) shows third-body wear in addition to scratching and burnishing at 10× magnification; (d) shows pitting at 10× magnification.
Figure 4.
(a) Shows severe grooving at 10× magnification; (b) shows burnishing in addition to severe scratching at 10× magnification; (c) shows third-body wear in addition to scratching and burnishing at 10× magnification; (d) shows pitting at 10× magnification.
Brandt stressed the importance of inter-observer reliability, tested using a paired
t-test [
8,
13]. Taking the paired differences enabled the investigator to compare the observer data as converted into total damage scores for each liner, in this case using the Brandt modified method [
13]. If the observer values were statistically similar, then the average difference should be very near zero. The total damage scores for each possible pair of observers were tested for consistency. Among all four observers, the standard deviation reached upwards of 65, indicating extremely low consistency. By performing the paired
t-test, we tested the hypothesis corresponding to no bias between the observers. The results produced by two of the observers were not statistically significant (
p = 0.6394), confirming that there was no evidence of a bias between the observers. In this light, the average scores from these two observers were used in further data analysis. The averaged total backside damage score for each liner is shown in
Table 2.
Table 2.
Average total damage scores of the two similar observers using the Brandt modified method.
Table 2.
Average total damage scores of the two similar observers using the Brandt modified method.
| Implant | Avg ± SD |
|---|
| 1-G | 104 ± 14.1 |
| 2-G | 50 ± 26.9 |
| 3-G | 83.5 ± 12.0 |
| 6-G | 116.5 ± 23.3 |
| 7-G | 107.75 ± 14.5 |
| 8-G | 82.5 ± 13.4 |
| 10-G | 36.5 ± 16.3 |
| 12-G | 74.5 ± 5.0 |
| 14-G | 75 ± 26.9 |
The investigator sought to determine the predominance of the various damage modes. Each pair of damage mode means was compared using the Least-Squared Difference method (LSD). This was conducted for every combination of damage modes and for each method of scoring.
Table 3,
Table 4 and
Table 5 show the relative scoring prevalence of damage scores for each respective method. The mean damage scores are based on a single quadrant, rather than the glenoid liner as a whole. Each table shows a connecting letters report to illustrate which damage modes show a statistically significant difference from the others. Connecting letters reports indicate that levels not connected by the same letter are significantly different. All three methods can illustrate that scratching was the most predominant damage mode among the nine liners included in this analysis.
Table 3.
Average total damage scores of the two similar observers using the Hood Score.
Table 3.
Average total damage scores of the two similar observers using the Hood Score.
| Damage Mode | Mean Hood Score | | | | |
|---|
| Scratching | 2.222 | A | | | |
| Pitting | 2.056 | A | | | |
| Abrasion | 2.028 | A | | | |
| Grooving | 1.417 | | B | | |
| Deformation | 0.833 | | | C | |
| Complete Wear | 0.278 | | | | D |
| Delamination | 0.278 | | | | D |
| Embedded Debris | 0.222 | | | | D |
| Component Fracture | 0.083 | | | | D |
| Stippling | 0.056 | | | | D |
| Burnishing | 0.028 | | | | D |
Table 4.
Average total damage scores of the two similar observers using the Wasielewski score.
Table 4.
Average total damage scores of the two similar observers using the Wasielewski score.
| Damage Mode | Mean Wasielewski Score | | | |
|---|
| Scratching | 0.936 | A | | |
| Abrasion | 0.802 | A | B | |
| Pitting | 0.681 | A | B | |
| Grooving | 0.636 | | B | |
| Complete Wear | 0.194 | | | C |
| Deformation | 0.162 | | | C |
| Delamination | 0.079 | | | C |
| Embedded Debris | 0.042 | | | C |
| Component Fracture | 0.023 | | | C |
| Stippling | 0.019 | | | C |
| Burnishing | 0.005 | | | C |
Table 5.
Average total damage scores of the two similar observers using the Brandt Score.
Table 5.
Average total damage scores of the two similar observers using the Brandt Score.
| Damage Mode | Mean Brandt Score | | | | |
|---|
| Scratching | 5.722 | A | | | |
| Abrasion | 4.306 | A | B | | |
| Pitting | 3.868 | A | B | | |
| Grooving | 2.625 | | B | C | |
| Complete Wear | 1.042 | | | C | D |
| Deformation | 0.528 | | | | D |
| Delamination | 0.306 | | | | D |
| Embedded Debris | 0.125 | | | | D |
| Stippling | 0.083 | | | | D |
| Component Fracture | 0.069 | | | | D |
| Burnishing | 0.014 | | | | D |
4. Discussion
Brandt
et al. used two observers to directly score the damaged implants based on the respective methods [
8]. In this investigation four observers were graduate students, two from biomedical engineering, and the other two came from the psychology department. The level of technical skills needed to perform this task was more suitable and reproducible with the engineers used in this paper. Observers were asked to score the implants in two ways: a severity score (SS) from 1 to 3, and a prevalence percentage (PP) from 0% to 100% based on the area covered. This was done to prevent bias and to streamline the scoring process. The prevalence percentages were later categorized into appropriate scores based on the various methods. Assigning a percentage instead of directly assigning a score may prevent bias around the qualitative scoring boundaries. This investigation used the total damage scores derived from the Brand modified method to evaluate inter-observer reliability. This method was chosen because the scoring method most closely reflected the raw scoring. The investigation into inter-observer reliability ensures that the assigned scores are a true reflection of the damage present. In this investigation, the four observers’ assessments were statistically different. This inconsistency is, perhaps, an indication of inconsistent training or scoring instruction. To ensure reliability, investigators utilized the two sets of scores with the most consistency.
Various methods used in this research included specific damage modes. This investigation, however, standardized the modes in question and evaluated the implants on the basis of all 11 damage modes mentioned in the four methods [
4,
7,
8]. This set of implants did not yield significant scores for embedded debris, delamination, burnishing, component fracture, and stippling within all of the methods. When comparing various methods to evaluate wear damage, the most noticeable differences were within the prevalence or area scoring. In that, the Brandt method lent the most accurate scores which provided a full representative range of damage severity and prevalence. However, the standards for the severity score and area score are slightly different between the Wasielewski and Brandt methods. The area score, in particular, will be considerably different between the two methods. Therefore, the potential total damage scores will also be different depending on the method of scoring used.
5. Conclusions
This study lent valuable insight into the importance of observer consistency, situational information, and preferred method of quantification. This investigation illustrated the inconsistency of observer evaluations and reaffirmed the need for multiple observers to ensure an accurate quantitative assessment. It is therefore recommended that at least two independent evaluators be incorporated into a study such as this.
It would be useful to compile additional information such as the demographic details of implantation time, surgical and device details, along with post-surgery radiological reports and other clinical data. This information could be useful for more practical conclusions about various damage modes and a total, composite damage score.
This study also exposed issues related to the human condition. Observer fatigue could play an extremely significant role in the accuracy of scoring. It is therefore recommended that the viewing time be limited and the order of observation be randomized. With respect to the most accurate method of quantifying wear, the Brandt method seems to hold promise. The Hood method is very subjective and does not allow for a mismatch in severity and prevalence. In addition, the Brandt method allows for the most accurate numerical representation of the prevalence without lumping any prevalence exceeding 50% into a single category as with the Wasielewski, Hood, and Lombardi methods.


