Article

Hydraulic Electromechanical Regenerative Damper in Vehicle–Track Dynamics: Power Regeneration and Wheel Wear for High-Speed Train

1
School of Mechanical Engineering, Shijiazhuang Tiedao University, Shijiazhuang 050043, China
2
School of Mechanical Engineering, Xihua University, Chengdu 610039, China
*
Author to whom correspondence should be addressed.
Lubricants 2025, 13(9), 424; https://doi.org/10.3390/lubricants13090424
Submission received: 31 August 2025 / Revised: 17 September 2025 / Accepted: 19 September 2025 / Published: 22 September 2025
(This article belongs to the Special Issue Tribological Challenges in Wheel-Rail Contact)

Abstract

A physics-based vehicle–track coupled dynamic model embedding a hydraulic electromechanical regenerative damper (HERD) is developed to quantify electrical power recovery and wear depth in high-speed service. The HERD subsystem resolves compressible hydraulics, hydraulic rectification, line losses, a hydraulic motor with a permanent-magnet generator, an accumulator, and a controllable; co-simulation links SIMPACK with MATLAB/Simulink. Wheel–rail contact is computed with Hertz theory and FASTSIM, and wear depth is advanced with the Archard law using a pressure–velocity coefficient map. Both HERD power regeneration and wear depth predictions have been validated against independent measurements of regenerated power and wear degradation in previous studies. Parametric studies over speed, curve radius, mileage and braking show that increasing speed raises input and output power while recovery efficiency remains 49–50%, with instantaneous electrical peaks up to 425 W and weak sensitivity to curvature and mileage. Under braking from 350 to 150 km/h, force transients are bounded and do not change the lateral wear pattern. Installing HERD lowers peak wear in the wheel tread region; combining HERD with flexible wheelsets further reduces wear depth and slows down degradation relative to rigid wheelsets and matches measured wear more closely. The HERD electrical load provides a physically grounded tuning parameter that sets hydraulic back pressure and effective damping, which improves model accuracy and supports calibration and updating of digital twins for maintenance planning.

1. Introduction

1.1. Regenerative Damper

Driven by requirements for safety, ride comfort, and efficiency, high-speed rail has expanded rapidly, accompanied by increases in operating speed and accumulated mileage. The resulting dynamic loads within the wheel–rail system have intensified, raising contact stresses and transmitted excitation. Sustained high-intensity wheel–rail interaction amplifies vehicle dynamic responses and accelerates wear, undermining running stability and safety. Regenerative dampers that combine vibration control with power regeneration have emerged as a candidate solution. By reducing carbody vibration, such devices lower wheel–rail contact-force variability, improve contact conditions, and mitigate non-uniform wear depth.
Regenerative dampers are commonly categorised by their energy-conversion mechanism into piezoelectric and electromagnetic types. Piezoelectric devices offer a compact form factor, low mass, and minimal susceptibility to electromagnetic interference. Alhumaid [1,2] introduced a non-contact magneto-piezoelectric energy harvester and reported that larger track irregularities, higher train speed, and appropriate magnet–piezoelectric geometry significantly increased root-mean-square power output. A magnetically coupled piezoelectric vibration energy harvester (MPVEH) was subsequently developed for power regeneration within the suspension system.
Electromagnetic regenerative dampers convert vibration energy dissipated by conventional dampers into electrical power via electromagnetic induction. Typical architectures include direct-drive linear generators and rotary machines driven through mechanical motion rectification (e.g., rack–pinion or screw–nut transmissions). The electromagnetic back-EMF provides velocity-proportional damping that can be tuned by adjusting the electrical load through power electronics, allowing for impedance matching and power conditioning. Recovered energy can be applied to onboard storage and supplied to auxiliary loads, lowering net energy demand at the vehicle level. Shi [3] developed a self-powered, dual-function active electromagnetic damper that integrates closed-loop force control with energy harvesting, thereby achieving vibration suppression while extracting usable electrical power. Xie [4] developed switchable energy-regenerative suspension (SERS) for electromagnetic dampers that toggles between regeneration and high-damping modes to reconcile power regeneration with ride and handling requirements. Dong et al. [5,6] developed an energy-regenerative shock absorber (ERSA) that converts reciprocating motion into unidirectional rotation using a screw–nut transmission and a one-way clutch to drive a generator; experiments indicated a peak conversion efficiency of 87% and an optimised average power output of 63 W. Kpylov [7] developed an electromagnetic tuned mass damper (ETMD) with harvesting capability, using resonance to amplify relative motion and balance vibration mitigation with power generation. Pan [8] proposed a mechanical-motion-rectification electromagnetic harvester employing a sealed lubricated gearbox and a dual-rail guidance structure to improve device reliability and power output in long-duration service.
Hydraulic–electromechanical regenerative dampers (HERDs) utilise fluid flow generated in a cylinder to drive a hydraulic motor coupled to an electrical generator, recovering energy that can be conditioned, buffered onboard, and supplied to auxiliary systems. Typical approaches include full-bridge and half-bridge hydraulic rectification circuits assembled with check valves; accumulators are frequently introduced to stabilise pressure and broaden effective bandwidth. Compared with purely electromagnetic harvesters, HERDs offer high force density and flexible hydraulic tuning via orifices, bypass paths, and motor displacement control while contending with throttling losses, leakage, cavitation risk, friction, and thermal management under railway duty cycles. Zhang [9] proposed a mechanical–electrical–hydraulic regenerative suspension (MEH-RSS) centred on a hydraulic motor–generator (HMG), aiming to reduce motion-rectification losses and increase conversion efficiency. Liu [10] designed a hybrid electromagnetic–hydraulically interconnected actuator suspension (EHIAS) that combines hydraulic interconnected suspension with linear electromagnetic machines to improve force authority while harvesting power. Zhang et al. [11] developed regenerative hydraulic–electric shock absorbers (RHSA) and carried out a three-stage modelling programme, progressing from an ideal representation to an integrated model that includes accumulators and distributed losses, thereby demonstrating concurrent damping and power generation. Renato [12] proposed a hydraulic–electric transmission regenerative damper that converts linear mechanical input to rotary motion for generation. Guo [13] developed a full-bridge electro-hydraulic regenerative damper; under 3 Hz excitation with 7 mm amplitude, a single cylinder produced ~220 W average recovered power with efficiency near 30%, and high damping suitable for heavy-duty vehicles. Zhang [14] proposed a half-bridge electro-hydraulic regenerative damper that uses two check valves to form a rectification loop, returning oil during compression and driving the hydraulic motor during extension; the architecture remains mechanically simple and shows improved recovery and adaptability. Xu et al. [15] presented a full-bridge hydro-electromechanical damper employing a rectifying circuit and accumulators to deliver stable bus voltage and higher recovery under variable inputs. Mustafa [16] proposed a hybrid regenerative device that combines hydraulic and electromagnetic mechanisms to obtain power generation with robust damping and favourable packaging flexibility. Cai [17] developed an adaptive regenerative damper integrating electromagnetic damping with an energy-storage circuit; adjustable damping allows adaptive vibration control while storing harvested energy.
Although regenerative dampers offer clear prospects for onboard power regeneration, they function as controllable dissipation elements and the resulting influence on vehicle dynamic responses and wear depth under high-speed operation remains insufficiently quantified. Deubel [18] designed a controllable-friction device to examine how damper friction modifies effective stiffness and inter-subsystem coupling, showing marked effects on low-frequency vibrations and energy-transmission paths. Wang [19] proposed power-regenerating dampers (PRDs) with a hydraulic–electromagnetic hybrid architecture that recover energy while maintaining ride comfort and operational safety. For lateral suspensions of high-speed trains. Hua [20] developed a semi-active electromagnetic damper–energy harvester (SEMDEH) with Linear–Quadratic–Gaussian (LQG) force tracking; experiments reported 34–55% reductions in lateral, yaw, and roll accelerations. Gioele et al. [21] proposed a servo-valve-controlled bypass in a twin-tube hydraulic damper to realise semi-active operation, reducing vertical ride-comfort indices and substantially lowering carbody vertical acceleration. Zhang [22] proposed a half-bridge pneumatic inflatable hydraulic–electric regenerative suspension (IHERS) and analysed the effects of hydraulic-motor displacement, key hydraulic/pneumatic parameters, cylinder dimensions, load resistance, and excitation frequency on energy-recovery performance.

1.2. Wear Depth

In terms of wear depth, Sang [23,24] conducted a systematic investigation of wheelset wear during braking and acceleration in high-speed service, showing peak wear rates under emergency braking and low-adhesion conditions and underscoring the influence of traction control and lateral dampers. Song [25] formulated and validated a braking-condition wheel–rail wear prediction model, elucidating the roles of braking torque, friction coefficient, and operating speed, and examined how wear evolution feeds back into vehicle dynamic responses. Liu [26] evaluated rolling-contact wear prediction accuracy while treating the wear coefficient as an uncertain parameter and compared alternative contact-mechanic formulations and coefficient identification strategies. Zhu [27] quantified the effect of train passing at different speeds, confirming that substantial wear increases with speed and more severe damage on leading vehicles and front-axle wheels. Luo [28] developed a high-speed wheel-wear model incorporating stochastic variability in track geometry and friction; by coupling the Archard law with FASTSIM, the approach reproduced wear distribution and dynamic evolution over 300,000 km of operation. Wang [29] contrasted two-car and single-car configurations to isolate the effects of inter-car connection units on normal force, lateral force, and wear, finding greater wear on wheels adjacent to the connection units under an Archard-based assessment. Andrzej [30] proposed an energy-dissipation-based wear prediction method consistent with the Archard wear model, verifying proportionality between frictional dissipation power and wear depth and showing that plastic deformation diminishes peak contact stress while extending the wear-affected region. Apezetxea [31] proposed a high-speed wear model using quasi-static simulation with characteristic-point simplification, achieving favourable computational efficiency and predictive accuracy when compared with measurements from two metro lines. Hao [32] analysed wear evolution in C80 heavy-haul freight cars using UM multibody dynamics coupled with an Archard model, validating predictions against measured data and providing guidance for early lubrication and periodic maintenance planning. Wheel defects such as polygonal wear and flats markedly elevate vertical wheel–rail forces and vibration acceleration; higher speed, larger polygonal order, and longer flat length intensify vehicle vibration and accelerate wear depth, which in turn exacerbates defect growth, establishing a detrimental feedback loop [33,34,35,36].
This study develops and integrates a hydraulic electromechanical regenerative damper (HERD) into a vehicle–track coupled dynamics system to quantify energy conversion and wheel–rail wear in high-speed service, which is defined as operations at speeds around 350 km/h and a typical axle load of about 17 t. The co-simulation links multibody vehicle dynamics with MATLAB/Simulink, includes rigid and flexible wheelsets, and adopts Hertz–FASTSIM contact with Archard wear; wear predictions are validated against independent profile and peak-depth measurements. Parametric campaigns over speed, curve radius, mileage, track excitation, and braking show near-constant recovery efficiency (~49%), weak sensitivity to curvature, bounded braking transients, and right-hand-curve left–right patterns. Installing HERD lowers peak wear depth and restrains defect-driven removal, while flexible wheelsets further reduce wear peak depth and slow degradation relative to rigid wheelsets. A central innovation is the use of HERD’s electrical load as a physically grounded tuning variable: setting the load fixes hydraulic back-pressure and effective damping, which aligns simulated axlebox forces, creepages, and wear with measurements, improves model accuracy, and strengthens digital-twin updating for design, operation, and maintenance.

2. Modelling Systems

2.1. Modelling of the Hydraulic Electromechanical Regenerative Damper (HERD)

Figure 1 shows a regenerative damper architecture comprising a hydraulic cylinder, a check valve rectification circuit, an accumulator, a hydraulic motor, hydraulic lines, an electrical generator, and an oil reservoir. The unit replaces a conventional primary vertical damper and preserves the hydraulic flows while introducing an energy conversion branch. Piston motion displaces fluid between cylinder chambers; the check valve arrangement rectifies bidirectional flow so that the flow delivered to the hydraulic motor remains unidirectional, independent of stroke direction. The accumulator, pre-charged with gas, attenuates flow pulsation, stabilises supply pressure, limits cavitation risk, and reduces torque ripple at the motor shaft. The hydraulic motor converts rectified hydraulic power into continuous shaft torque, which drives the generator to produce electrical power; the connected electrical load or DC link conditions the output and, in turn, sets the effective damping perceived at the damper.
A lumped parameter representation is adopted for component dynamics, including valve cracking and closing, orifice and line losses, internal leakage, and mechanical and electromagnetic conversion losses. This level of description enables realistic accounting of energy pathways—from mechanical input to harvested electrical output—and supports evaluation of operating envelopes in which vibration control and power regeneration can be jointly achieved under railway duty cycles.
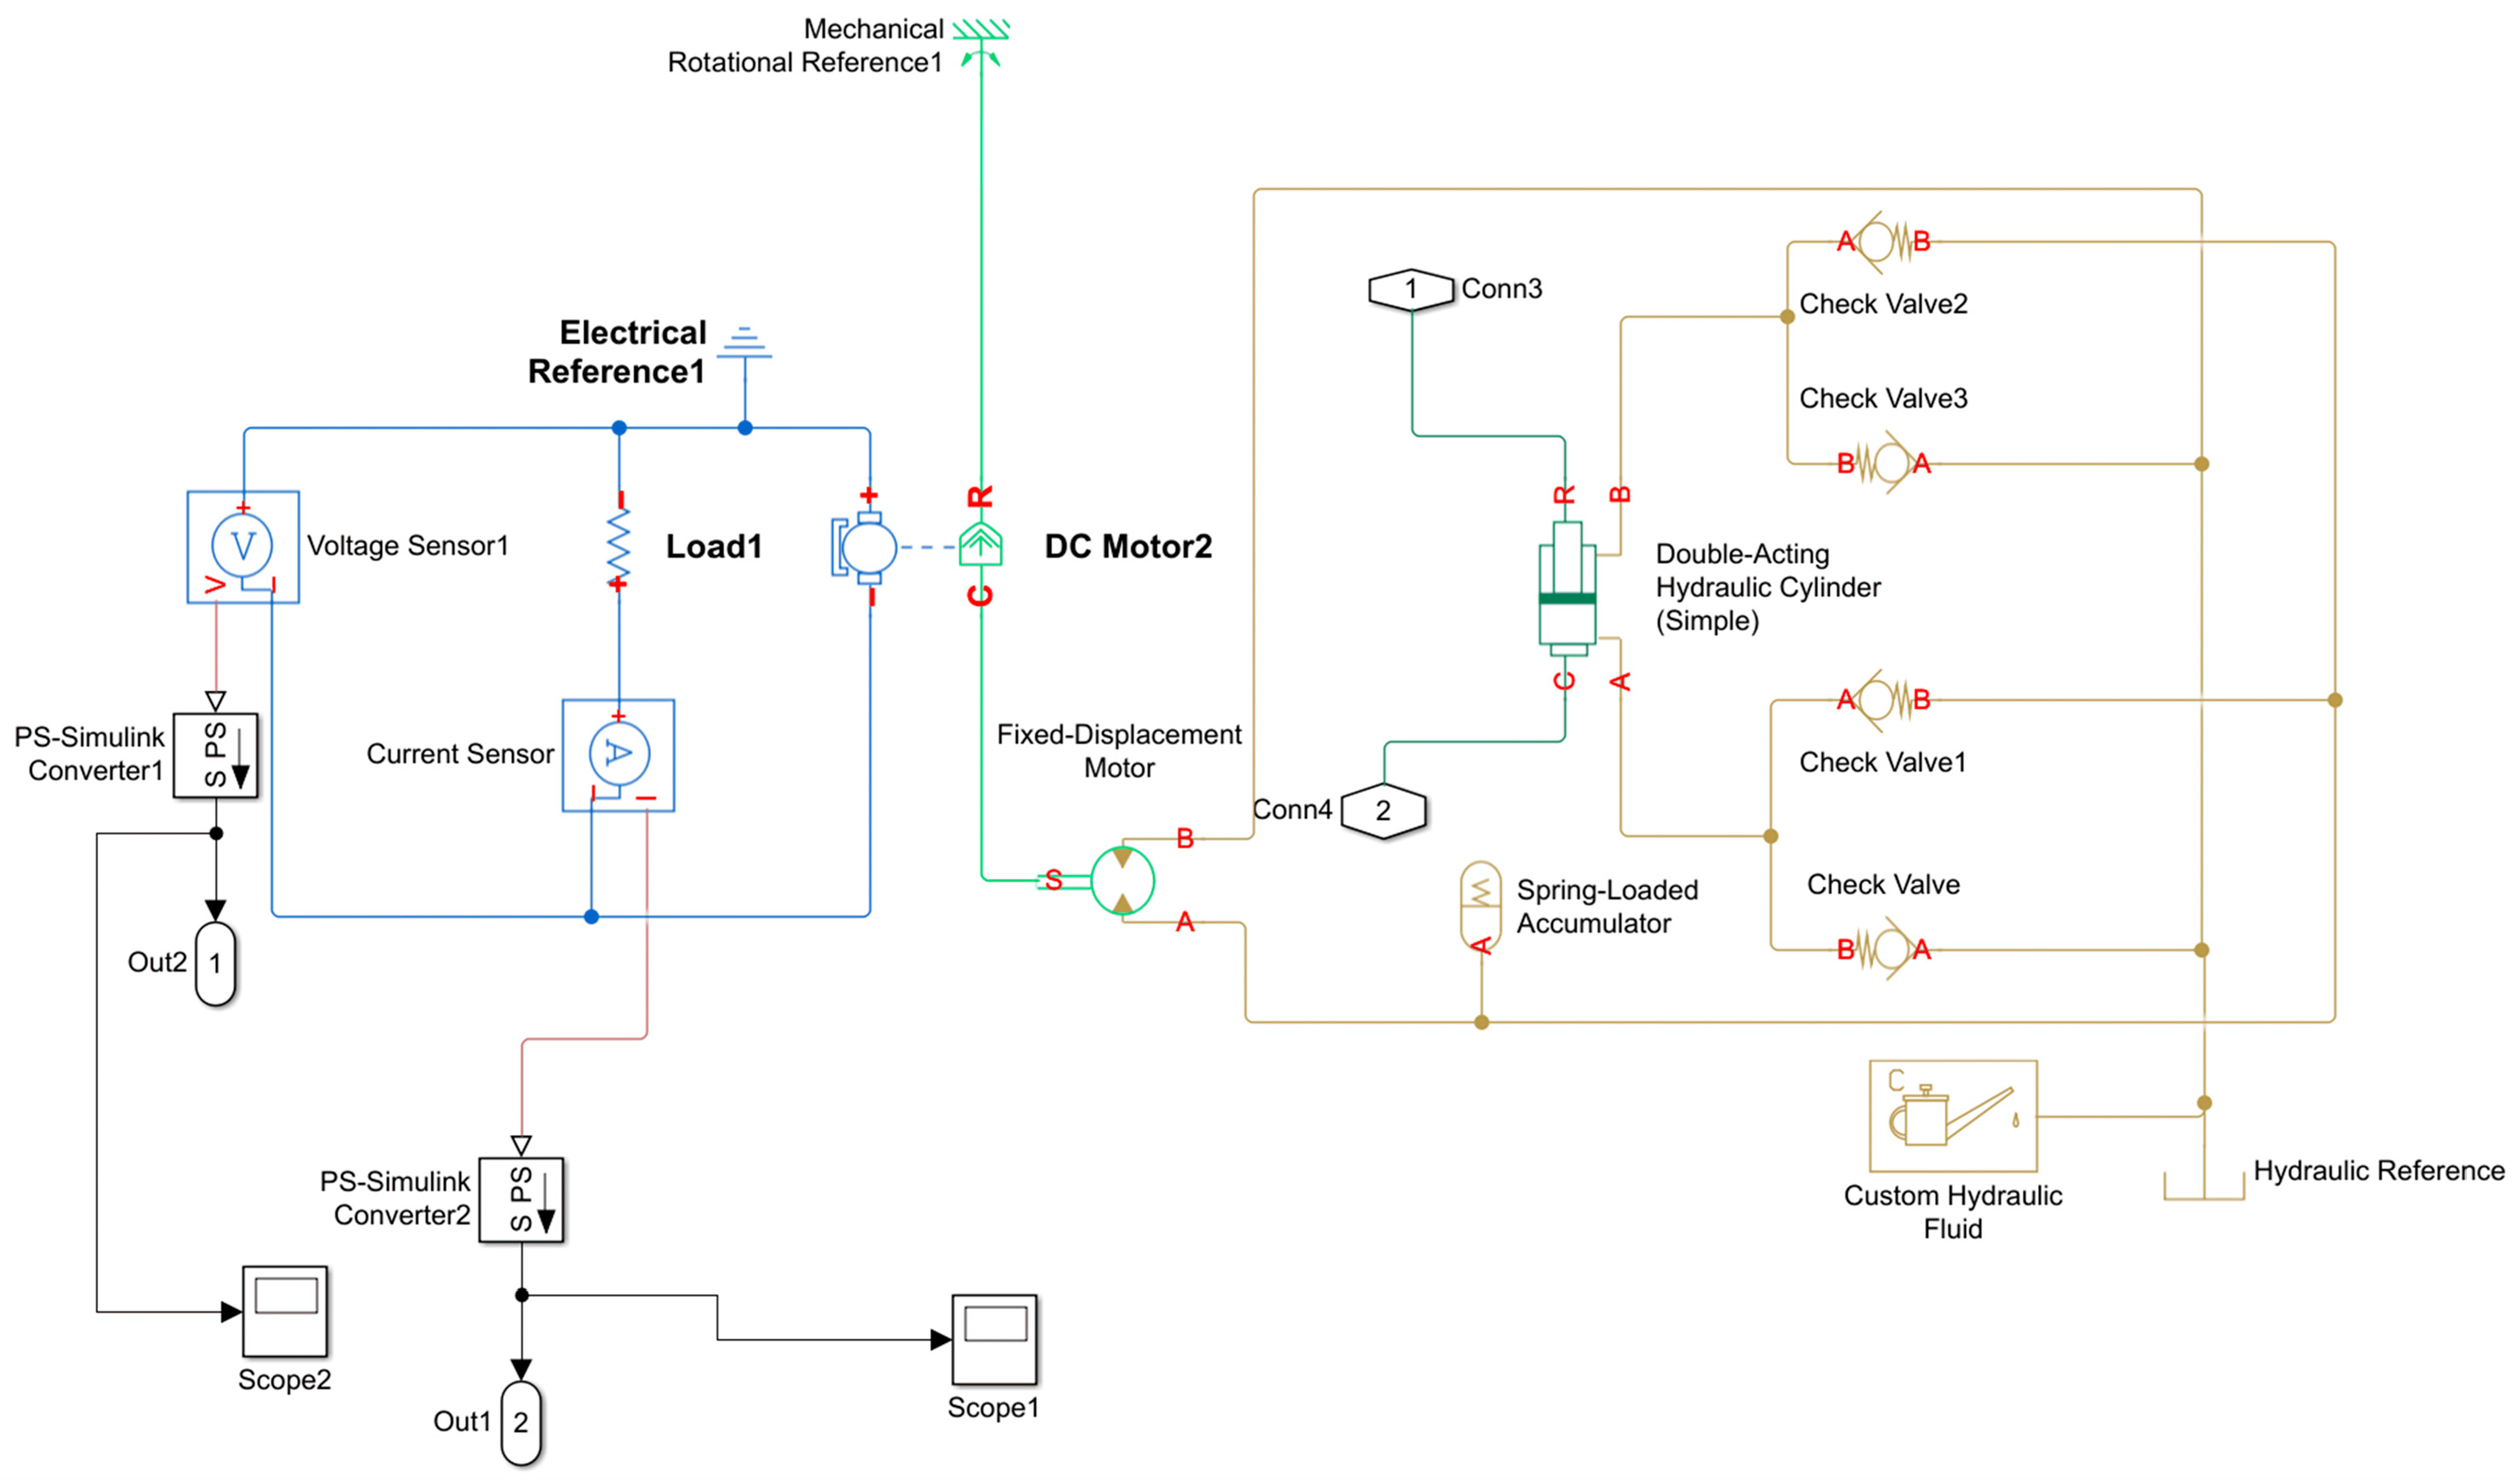
The simulation is implemented in MATLAB Simulink. As shown in Figure 2, the block diagram comprises a hydraulic cylinder, a gas charged accumulator, a hydraulic motor, a permanent magnet DC generator, and a configurable load interface, interconnected through pipelines and a check valve rectification circuit. The assembly replaces a conventional suspension damper and introduces an energy conversion branch while preserving the primary force path. The principal parameters and rating data used for the component models are summarised in Table 1.
The hydraulic system is represented with compressible flow and line dynamics, including orifice equations for throttling losses, pressure dependent internal leakage, and check valve opening and closing dynamics; cavitation is limited by enforcing a minimum absolute pressure relative to fluid vapour pressure. Accumulator behaviour follows a polytropic gas law with a specified pre-charge to smooth pulsation and stabilise motor inlet pressure. Motor torque is obtained from the pressure differential and motor displacement with mechanical efficiency and Coulomb and viscous friction, and it drives the permanent magnet generator. The generator is described by a back EMF constant, winding resistance, and electromagnetic torque coupling; the electrical side connects to a tuneable electrical load that represents power electronics, enabling adjustment of the effective damping through load control and allowing harvested power to be buffered for onboard use. A power and energy balance is evaluated online to distinguish harvested electrical power from hydraulic input and to quantify losses in throttling elements, mechanical transmission, and copper resistance. Numerical settings employ a variable step solver with error control suitable for stiff coupled systems, and time step and parameter sensitivity checks are used to ensure that predicted pressures, torques, and electrical power are within numerical tolerance across the operating conditions considered.
The input from track excitation to the damper can be represented using a sinusoidal excitation function:
X ( t ) = A 1 sin ( ω 1 t + ϕ 1 ) + A 2 sin ( ω 2 t + ϕ 2 ) + + A n sin ( ω n t + ϕ n )
X ( t ) is the superposition of multiple sine waves with different frequencies, A denotes the amplitude of the sinusoidal excitation, ω represents the angular frequency, and ϕ is the phase angle.
  • Dynamics of hydraulic rectifier
The check valve rectification circuit converts the bidirectional piston flow into a unidirectional supply to the hydraulic motor. Its behaviour is evaluated using the Bernoulli energy balance for incompressible flow, together with standard orifice relations for valve opening [37]. Reverse flow is blocked except for small leakage, which is represented by an equivalent clearance flow.
2.
Hydraulic cylinder flow and pressure Loss
The hydraulic cylinder comprises two chambers separated by a single rod piston. Because the cap end area exceeds the rod end area, extension and retraction are asymmetric: the required volumetric flow and the resulting pressure evolution differ between strokes.
In the model, chamber pressures follow continuity with an effective bulk modulus to capture weak compressibility, while chamber volumes are updated from piston kinematics. Internal leakage across seals is included as pressure dependent bypass flow, and port throttling together with line losses represents the primary pressure drops. Seal friction is treated with Coulomb and viscous components to reflect low speed behaviour. The corresponding expressions for the chamber flow rates and the end-to-end pressure difference in the cylinder are given by the equations below:
Q p = A p v p P i s t o n   s i d e Q r = A r v r r o d   s i d e
Δ P = P h i g h P l o w
A p and A r represent the cross-sectional areas on the rod side and piston side, respectively. v p and v r are the piston velocities. p h i g h is the high-pressure side (piston side), and p l o w is the low-pressure side (rod side).
3.
Pressure loss characteristics of the check valve
The check valve in the rectification circuit enforces unidirectional flow and introduces a characteristic pressure drop. Its behaviour is represented using a standard thin-orifice model (Figure 3) with an effective flow area and discharge coefficient, and the valve opens once the differential pressure exceeds the cracking threshold. Reverse flow is blocked except for a small leakage branch that accounts for clearances. The resulting pressure–flow relation follows the conventional orifice equation, and hysteresis between opening and reseating is included to reflect realistic valve dynamics.
4.
Pressure drops in pipelines
Pressure losses along the hydraulic pipelines are evaluated using the Darcy-Weisbach equation, with the friction factor determined from Reynolds number and relative roughness, and minor losses accounted for by standard coefficients [38]. The resulting pressure drop is incorporated into the hydraulic motor inlet conditions to assess its contribution to system damping.
5.
Operating pressure difference in hydraulic motor
The effective operating pressure is defined as the net difference between the pressure at the motor inlet and the pressure at the motor outlet after subtracting losses in the supply and return pipelines and internal losses within the motor. In the model, the inlet pressure is taken at the node immediately downstream of the rectifier and accumulator, and the outlet pressure is taken at the node immediately upstream of the oil tank. Line losses are evaluated using the Darcy-Weisbach approach together with standard minor loss coefficients for fittings and valves. Internal losses include port throttling, volumetric leakage, and mechanical friction, which are converted to an equivalent pressure drop using motor displacement and efficiency data. The accumulator reduces short period pressure ripple, so the instantaneous differential is used for torque prediction, while a moving average is used for energy accounting. Temperature dependent viscosity and relief valve limits are included to ensure the calculated operating pressure remains within component ratings.
This well-established principle is applied specifically to the HERD configuration, where the fluctuating cylinder pressure directly determines the instantaneous motor torque and hence the regenerative damping effect. By linking the conventional pressure–torque relation with the energy recovery pathway, the analysis highlights how the operating pressure difference governs both the damping force provided to the vehicle suspension and the electrical power generation performance of the system.
6.
Hydraulic motor power, generated voltage, and current
Hydraulic input power to the motor is evaluated from the effective pressure difference across the motor and the volumetric flow. Mechanical losses due to viscous drag, Coulomb friction, and volumetric leakage are represented via a mechanical efficiency to obtain shaft power. The shaft drives a permanent magnet DC generator; the generated voltage is proportional to rotational speed through the back electromotive force (EMF) constant, and the output current is determined by the generator internal resistance together with the connected load or DC link. The equation is provided below:
P h m = T m ω m = T m Q m V d = Q m P m η m 2 π
where ω m is the motor’s angular velocity, and Q m is the hydraulic motor’s flow rate.
According to Kirchhoff’s voltage law [39], assuming constant magnetic flux, the circuit current is given by:
I = K E ω g R i n + R e x + L G d t
where L G is the generator’s internal inductance, R i n is the internal resistance of the generator, and R e x is the external load resistance. The electrical output power is then computed from the resulting current and used to evaluate the system’s power regeneration efficiency.
7.
Model of the accumulator
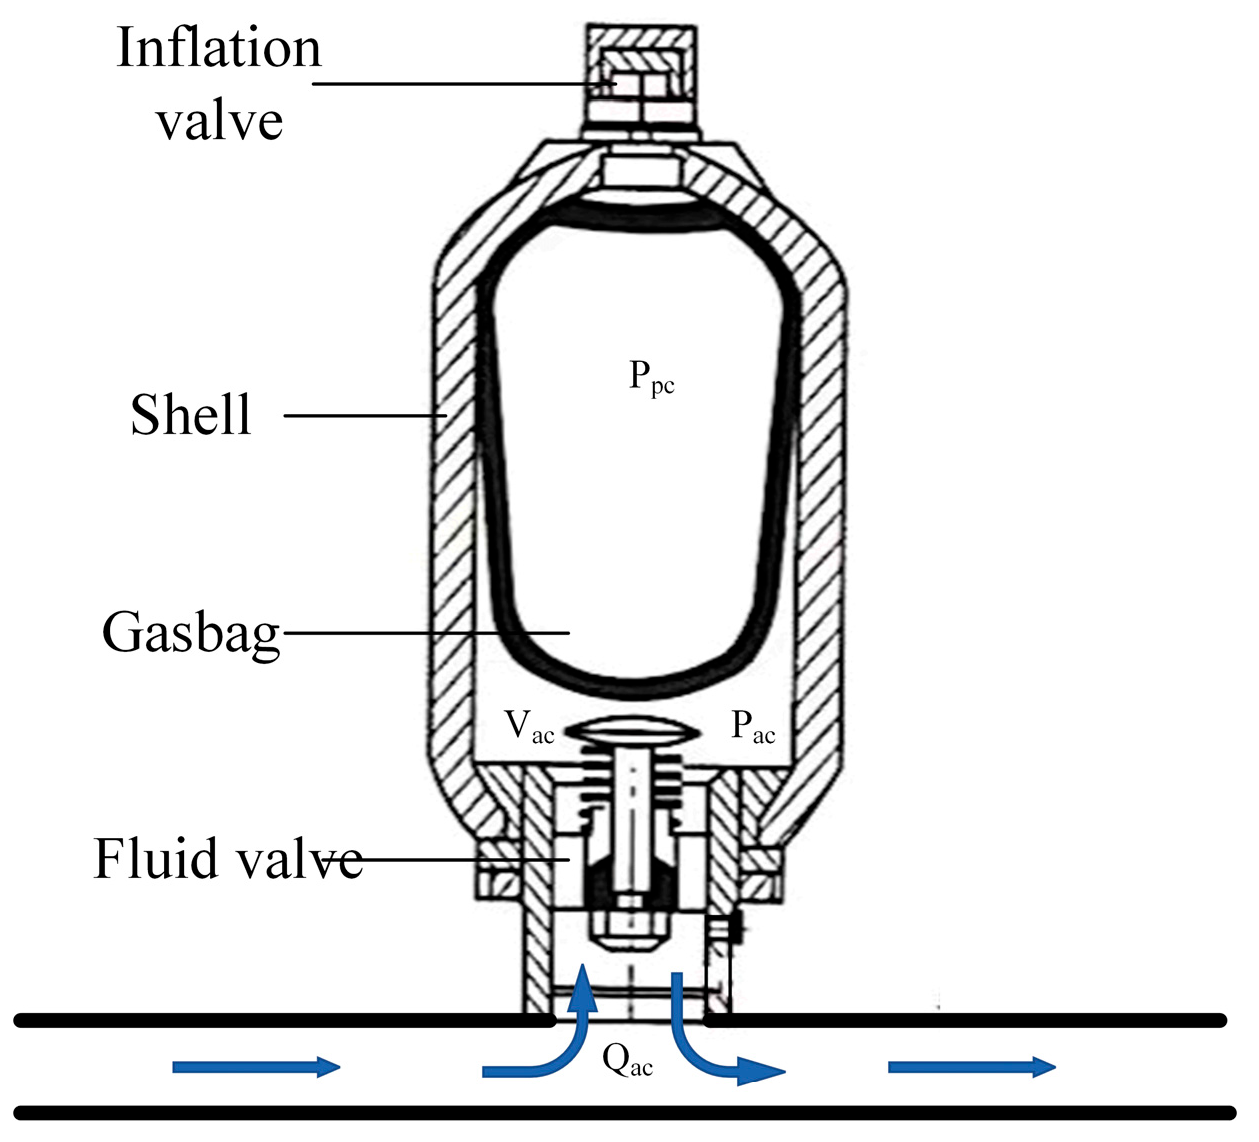
An accumulator is used to stabilise pressure by storing and releasing hydraulic oil against a pre-charge gas chamber (see Figure 4). The diaphragm separates the fluid from the gas, attenuates flow pulsation, maintains the inlet pressure of the hydraulic motor, and limits transient pressure spikes within the rectification. For the theoretical model, heat exchange, diaphragm hysteresis, and seal friction are neglected, and the device is represented by an equivalent compliance about the specified pre-charge. Usable volume limits and a minimum absolute pressure margin relative to vapour pressure are enforced to avoid cavitation and overpressure. Under these assumptions, the volume variation in the accumulator with pressure is expressed as:
V a c f 0 ,   p a c p p c V a c 0 1 p p c p a c 1 / k a c ,   p a c > p p c
where V a c f represents the volume of the accumulator, p a c is the pre-charging pressure, K a c is the gas specific heat ratio of the inflated accumulator, p p c are used to describe the system. They relate according to the following expression:
P a c = k a c P a c Q a c V a c
8.
Damping force of the hydraulic cylinder
As shown in Figure 5, the axial damping forces generated by the cylinder during compression and extension arise from hydraulic resistance to relative motion within the component. Denoting the forces by F c (compression) and F e (extension), the dominant contributors are throttling across ports and check valves, distributed and local line losses, and seal friction.
During the compression stroke, the piston moves downward, the cap chamber pressure increases, and fluid is driven through the check valve network toward the hydraulic motor. Contractions, expansions, and valve throttling convert flow resistance into a force that opposes piston motion, producing the damping effect F c .
F c = F A + F w f + F s f F B F e x
During the extension stroke, the piston moves upward and high-pressure fluid from the rod side passes through the corresponding check valve path. The resulting pressure drops and associated losses generate a resistive force F e that likewise opposes piston motion. Because the effective areas on the cap and rod sides differ, F c and F e are not equal for the same piston velocity and fluid state, reflecting the inherent asymmetry of the single rod cylinder.
F e = F A F w f F s f F B + F e x
where F A is the force on the piston generated by the pressure in the cap end (rodless) chamber, and F B is the force generated by the pressure in the rod end chamber. F e x denotes the external excitation applied to the piston rod. F s f is the friction between the piston rod and the cylinder body during both extension and retraction, and F w f is the friction between the piston head and the cylinder bore. All friction components act opposite to the instantaneous piston displacement (or velocity) direction.
Considering pressure losses at each stage of the hydraulic circuit, the damping force of the electrohydraulic power regenerative damper arises from the combined action of series connected components and the viscous shear of the working fluid. The formulation includes contributions from the hydraulic cylinder, check valves, hydraulic motor, and pipelines, encompassing port throttling, internal leakage, and both distributed and local line losses. By fully accounting for these effects, the model reflects the damping characteristics under representative operating conditions.
The damping force is expressed as follows:
F D = F c y l i n d e r F c h e c k   v a l v e + F m o t o r F l o s s
F D = P h i g h A p P l o w A r ( C c v P c v ) + ( T m R m ) P h m P p l

2.2. Vehicle Dynamics Coupled Model

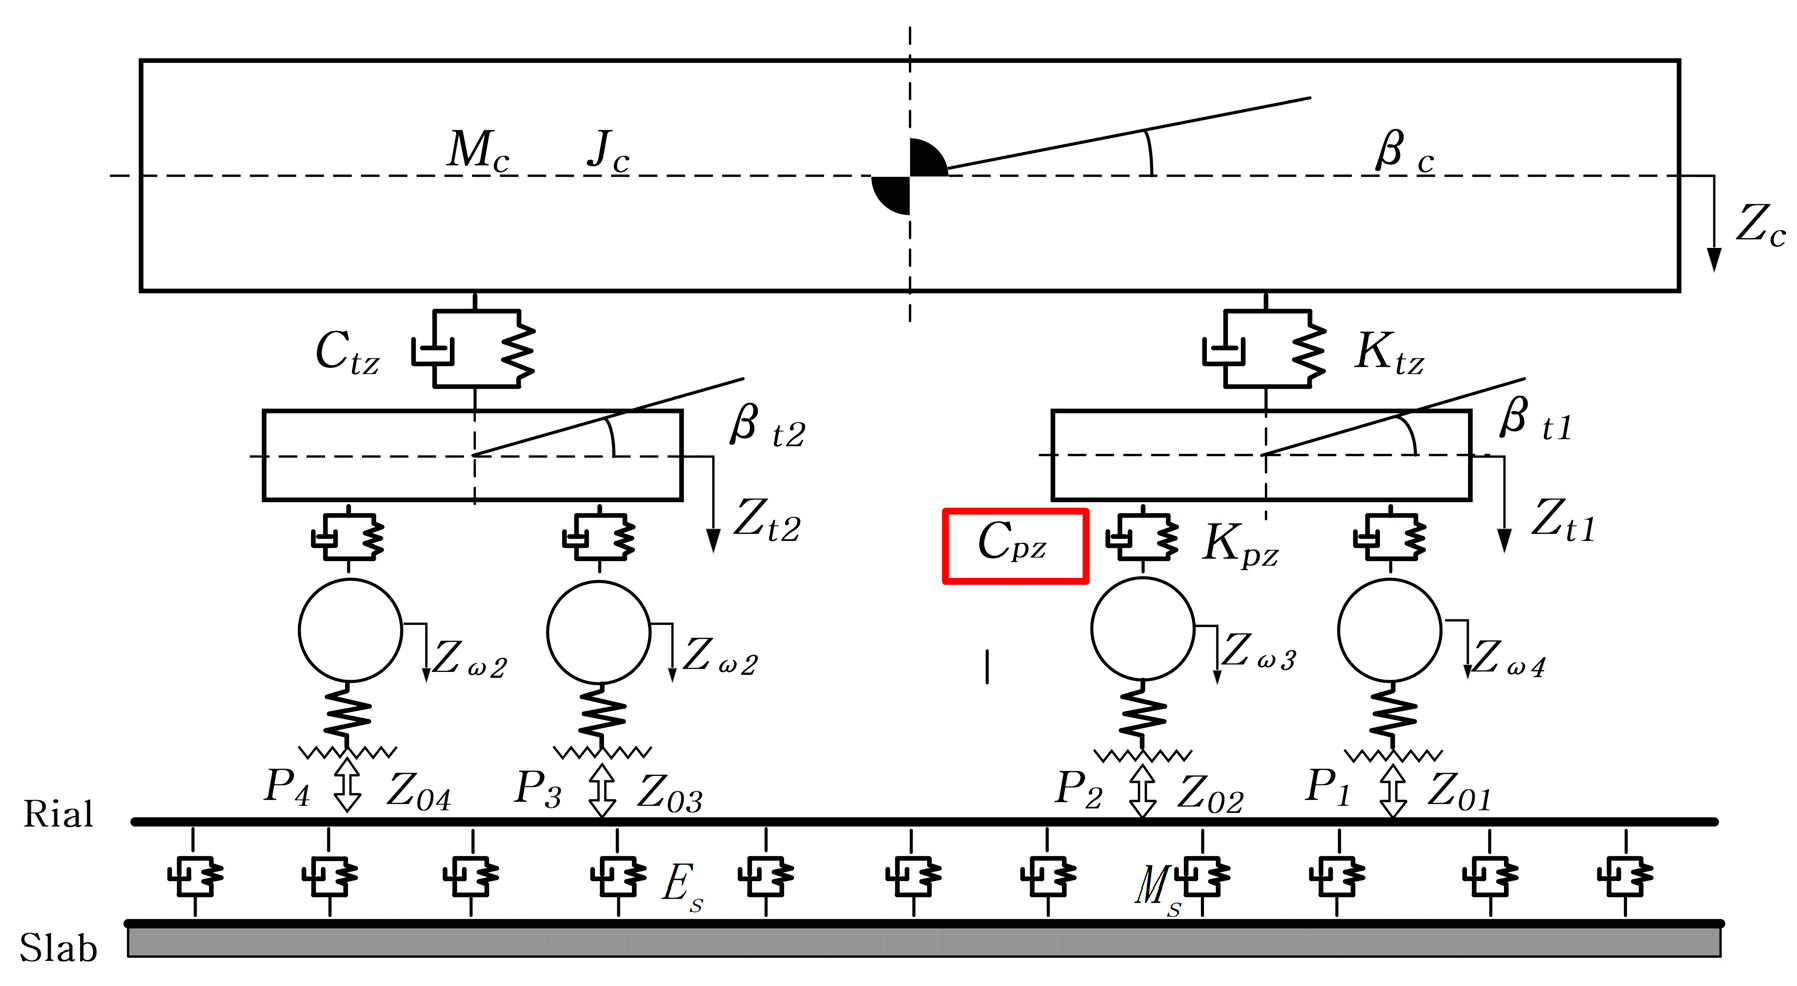
The vehicle is represented by a carbody, two bogie frames, and four wheelsets interconnected through primary and secondary suspensions, as shown in Figure 6 Wheelsets connect to the bogie via springs and primary vertical dampers; the secondary stage between bogie and carbody comprises air springs, secondary vertical dampers, secondary lateral dampers, and anti-hunting dampers. Springs and dampers are idealised as massless force elements, while rigid bodies retain mass and inertia with degrees of freedom sufficient for vertical, lateral, and yaw motions under high-speed operation. Air spring characteristics are taken from static stiffness and effective damping near the operating point. Wheel rail normal contact is evaluated from profile geometry with a nonlinear normal law, and tangential forces follow a creepage based formulation consistent with the wear model. Track inputs include measured or synthesised irregularities and steady curving defined by radius, cant, and cant deficiency. The HERD replaces selected primary vertical dampers at the axlebox–bogie interface, providing coupled simulation of suspension forces, wheel rail contact, and power regeneration within a whole system.
When the primary vertical dampers of a high-speed train are replaced by HERD, the vehicle equations of motion must extend the conventional mass–spring–damper formulation to include the internal dynamics of the harvesting units. The derivation proceeds from a force balance of the primary suspension at the axlebox–bogie interface, establishes consistent sign conventions for all relevant degrees of freedom, and then assembles the coupled carbody–bogie–wheelset model with the HERD represented by a state-dependent dissipative force linked to its hydraulic and electrical operating conditions.
F x f ( L , R ) i = C p x H t w β ˙ t n ± d w ψ ˙ t n d w ψ ˙ w i ( 1 ) i 1 d w d d t l t R t n + K p x H t w β t n ± d w ψ t n d w ψ w i ( 1 ) i 1 d w l t R t n
F y f ( L , R ) i = C py Y ˙ w i Y ˙ t n + H t w φ ˙ t n + ( 1 ) i l t ψ ˙ t n + l t 2 2 d d t 1 R w i + K p y Y w i Y t n + H t w φ t n + ( 1 ) i l t ψ t n + l t 2 2 R t n
F z f ( L , R ) i = C p z Z ˙ t n Z ˙ w i + ( 1 ) i l t β ˙ t n ± d w φ ˙ w i d w φ ˙ t n + K p z Z t n Z w i + ( 1 ) i l t β t n ± d w φ w i d w φ t n

2.3. Co-Simulation Approach

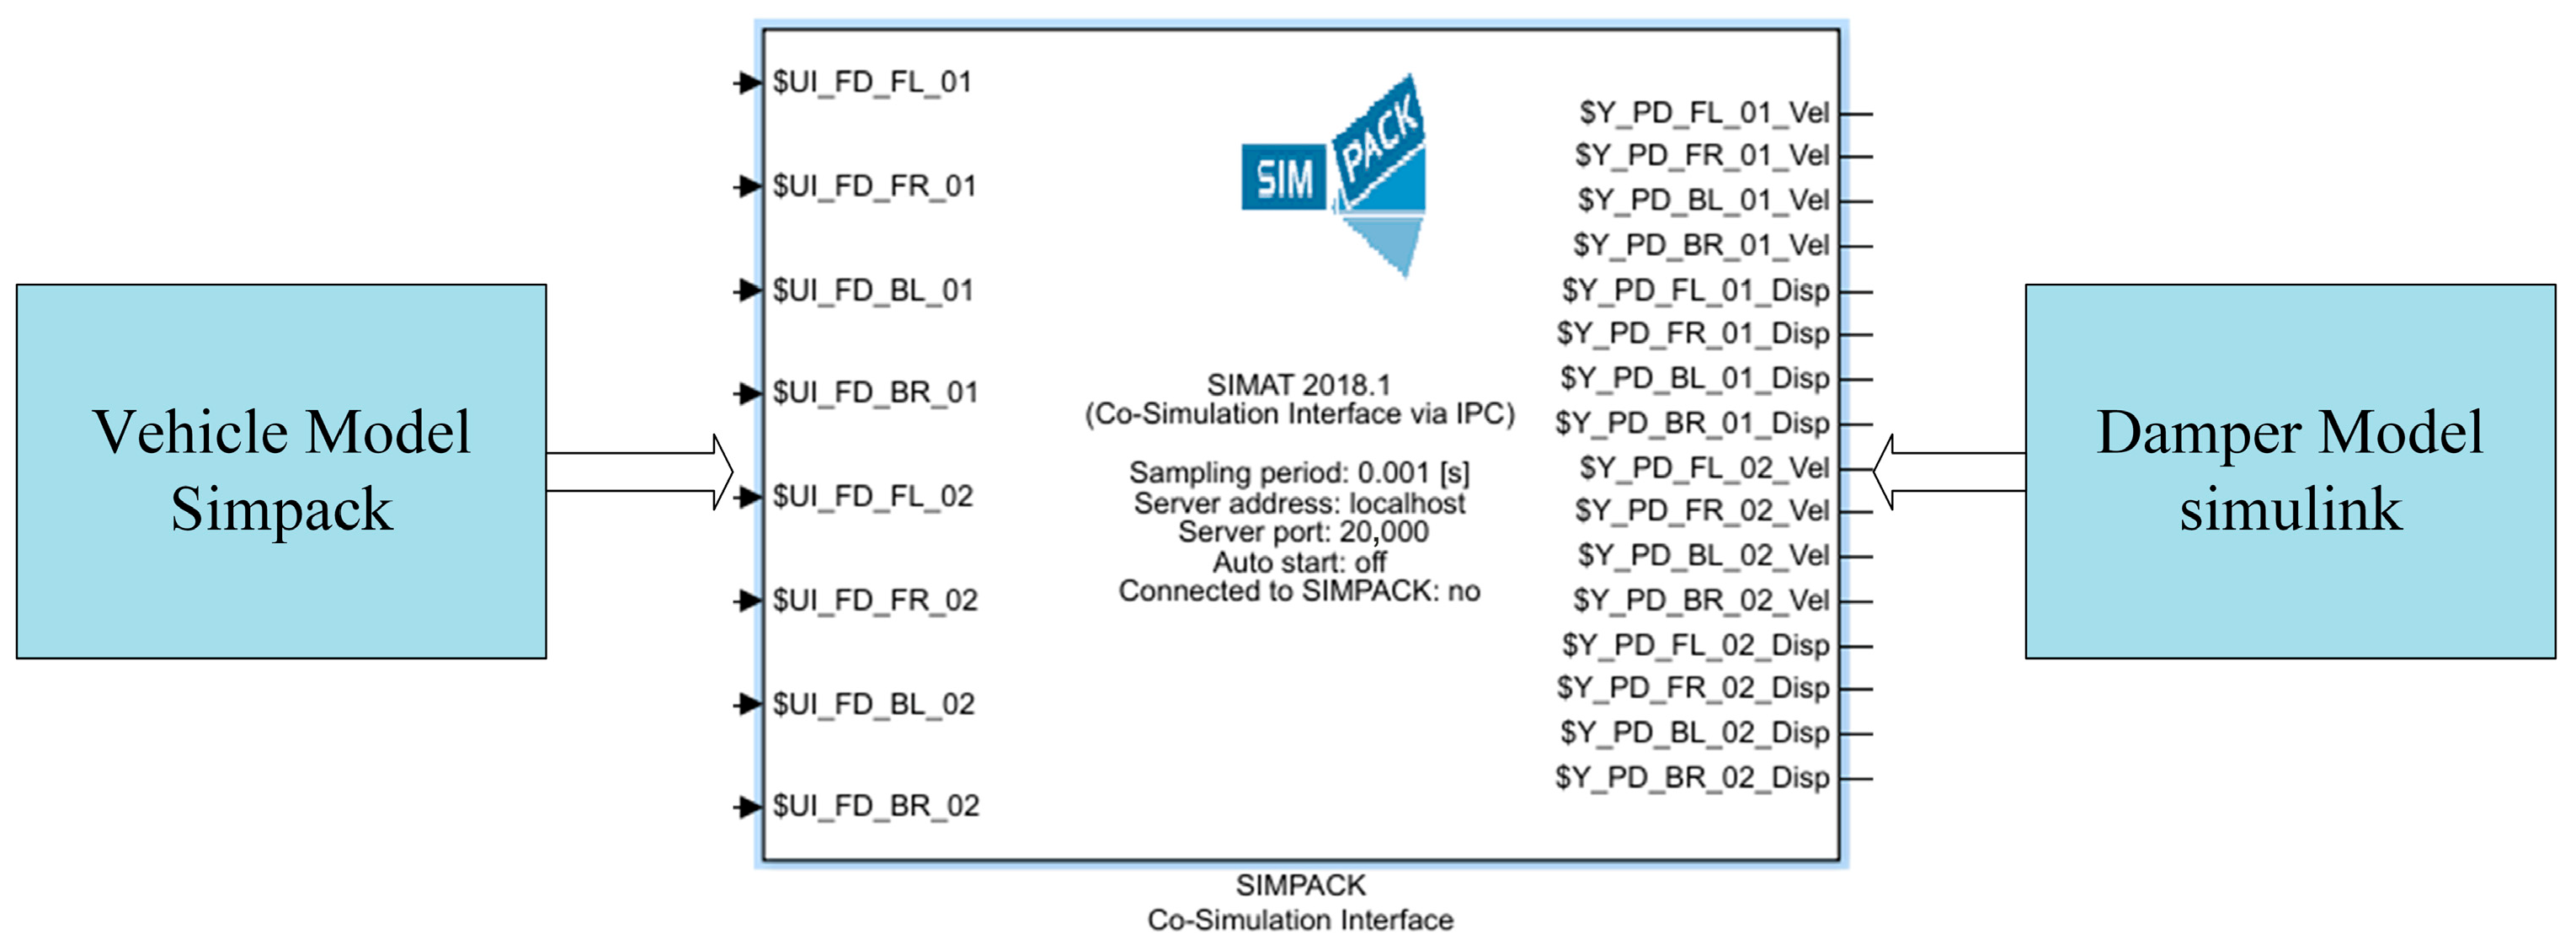
A representative high-speed vehicle was analysed using a co-simulation system that couples SIMPACK multibody dynamics with the hydraulic electromechanical damper model in MATLAB/Simulink. In SIMPACK, the vehicle is assembled in a modular manner: carbody, two bogie frames, and four wheelsets are defined as independent substructures with their interaction forces and constraints represented by primary and secondary suspensions. Each rigid body is parameterised by mass, centre of mass, and principal moments of inertia; joints, bushings, and contact elements define the kinematic topology. Wheel–rail interaction is computed with a nonlinear contact model consistent with the wear formulation.
Signal exchange between the solvers follows a standard co-simulation interface. At each synchronisation step, SIMPACK supplies the relative displacement and velocity at the damper attachment points, while the Simulink subsystem returns the corresponding damper force evaluated from the hydraulic and electrical states, together with diagnostic variables for energy accounting. Time integration uses a common communication step selected to resolve the fastest dynamics of the hydraulic circuit; SIMPACK employs its native integrator for the multibody system, and Simulink advances the damper states over the same interval with error control. Initial conditions are obtained from static equilibrium, including accumulator pre-charge and steady operating pressures, to ensure consistent start-up.
In the co-simulation of SIMPACK and MATLAB/Simulink, a communication step corresponding to a frequency of 10,000 Hz is adopted, the solver used is SODASRT2 with a tolerance of 1 × 10⁻⁸, and the wheel-rail contact model settings employ Hertz theory for normal contact calculation, FASTSIM algorithm for tangential force and slip state solution, and a friction law based on a pressure-velocity coefficient map to determine the wear coefficient during wheel-rail wear prediction.
The resulting coupled model preserves the standard vehicle topology while embedding the detailed damper dynamics, offering assessment of suspension forces, wheel–rail contact responses, and recoverable electrical power under the same operating scenarios. The vehicle dynamics model and the principal parameters of the car body are shown in Figure 6 and Table 2.
Co-simulation with MATLAB/Simulink was implemented via the SIMAT interface. The integrated model architecture is shown in Figure 7. The track conditions are shown in Table 3.
As shown in Table 4, the key parameters of the hydraulic–electromechanical regenerative damper (HERD) and the vehicle model adopted in this study are summarised, providing a concise reference for the core inputs used in the modelling and simulations.

2.4. Track Irregularity

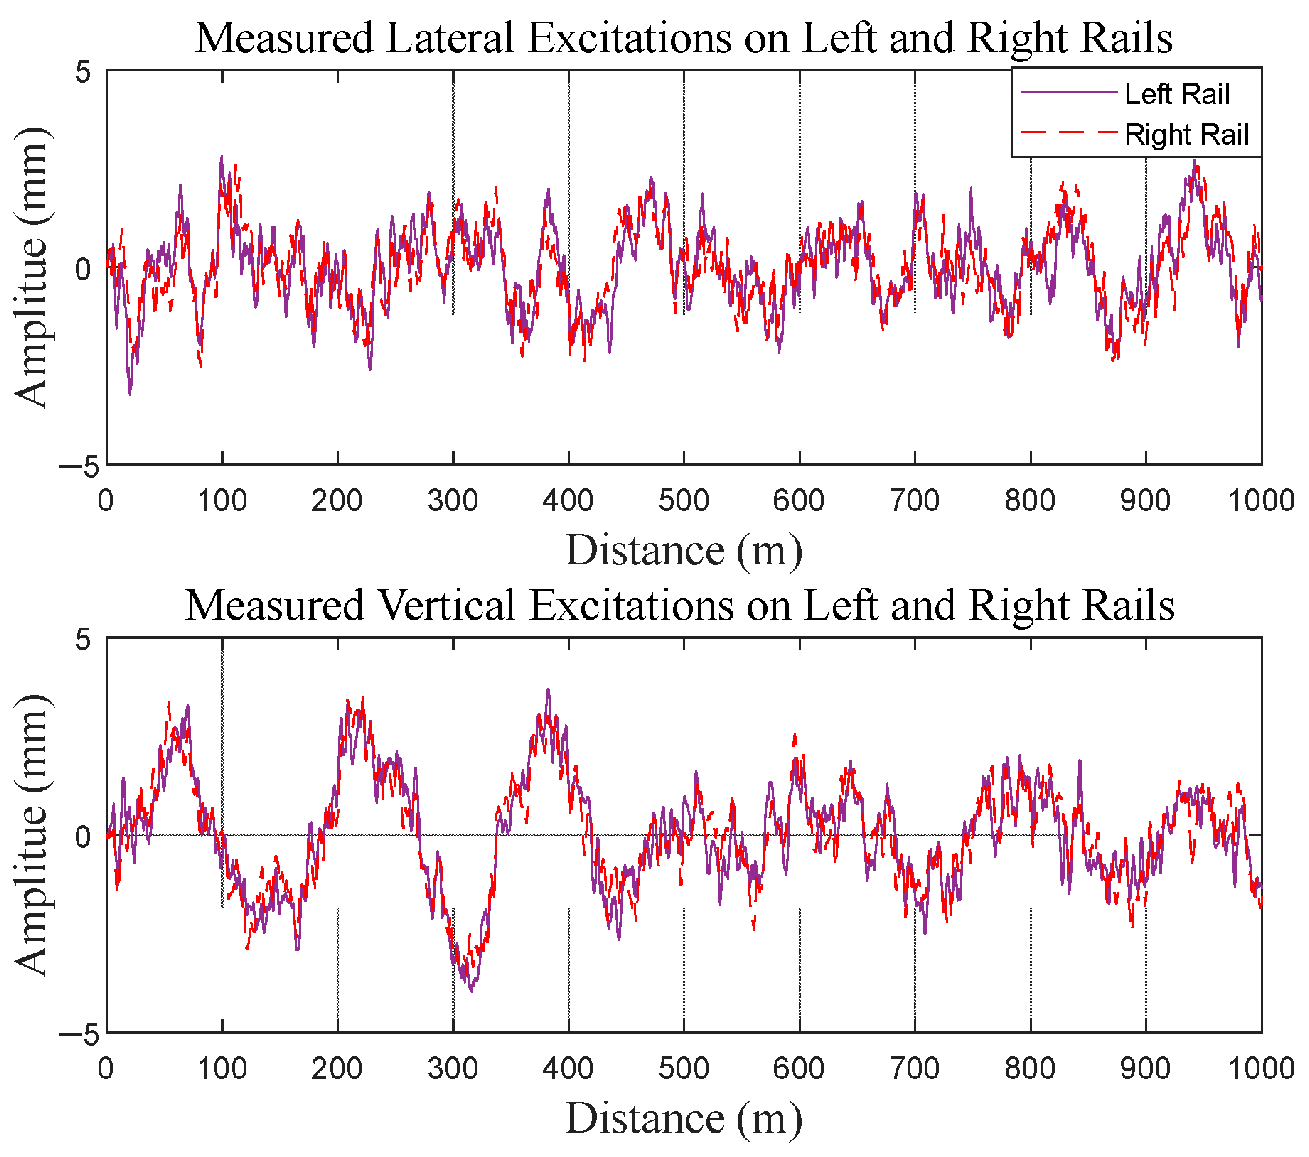
Track irregularity is the primary excitation for the damper. Variations in the excitation spectrum materially influence vibration attenuation and power regeneration. In the model, vertical and lateral irregularities are applied as base motions at the damper attachment points. A stationary random input is generated to match the measured power spectral density of the Wuhan Guangzhou high-speed line (Figure 8), with spatial spectra mapped to the time domain through the operating speed. The synthesis preserves amplitude, wavelength content, and phase statistics over the relevant bands, and the same realisation is used for comparative cases to ensure consistent evaluation of damping and power generation performance.

3. Simulation and Analysis

3.1. Damping Characteristics of the Damper

Figure 9 shows the force–displacement loops (a) and force–velocity curves (b) of the HERD for load resistances of 15 Ω, 20 Ω, 25 Ω, and 30 Ω under steady sinusoidal base excitation with identical kinematics. The loops in Figure 9a shows how much mechanical work is converted in each cycle. As the load resistance decreases, the shape in the graph changes from a thin, narrow ellipse to a fuller, more rounded loop with a larger area. It shows that the system’s damping becomes more effective, and more useful work is produced per cycle. The force–velocity characteristics in Figure 9b shows the same trend: curves shift upward across the velocity range as load resistance decreases, confirming that electrical loading strongly governs the damping level. The spikes in the loops and the right-angle features near zero velocity originate from switching of the hydraulic rectifier when the piston reverses direction. The check valves have finite cracking and reseat thresholds; once these thresholds are crossed, the effective flow path and flow area change abruptly. Together with line inertia and the finite compliance of the diaphragm accumulator, this produces short transients in motor inlet pressure that appear as spikes in Figure 9a. In Figure 9b, the piecewise behaviour around zero velocity reflects the same topology change: before cracking, the effective damping is low; after cracking, it steps to the level set by the generator load, giving a corner in the force–velocity curve. The co-simulation communication step further contributes to the sharpness of these transitions. Despite these local non-smooth features, the trend is clear and robust: lower load resistance increases damper force and cycle work, improving energy conversion under the same mechanical excitation. Moreover, under sinusoidal base excitation, the predicted pressure trace, generator voltage and current, and regenerated power agree with experimental measurements from our previous studies [40,41], validating the HERD model.
Figure 10 compares the force versus velocity curves of the HERD and a conventional damper under identical excitation. The conventional unit exhibits an almost linear and symmetric relationship about the origin. By contrast, the HERD shows a clear, direction-dependent slope: higher force for positive velocities and a lower slope for negative velocities. This asymmetry arises from the single-rod cylinder geometry (different effective areas on cap and rod sides) together with the rectified hydraulic flow driving the generator, which makes the back pressure and effective flow area depend on motion direction and electrical load. From an application standpoint, the resulting directional tuning is advantageous. During upward wheel motion (risk of unloading), the HERD delivers higher damping to sustain wheel–rail contact. During downward motion, the lower damping allows rapid recovery toward the rail, improving tracking without excessive force. Thus, the HERD provides controllable, direction-sensitive dissipation while retaining the ability to set overall damping level through the electrical load.

3.2. Power Regeneration Potential

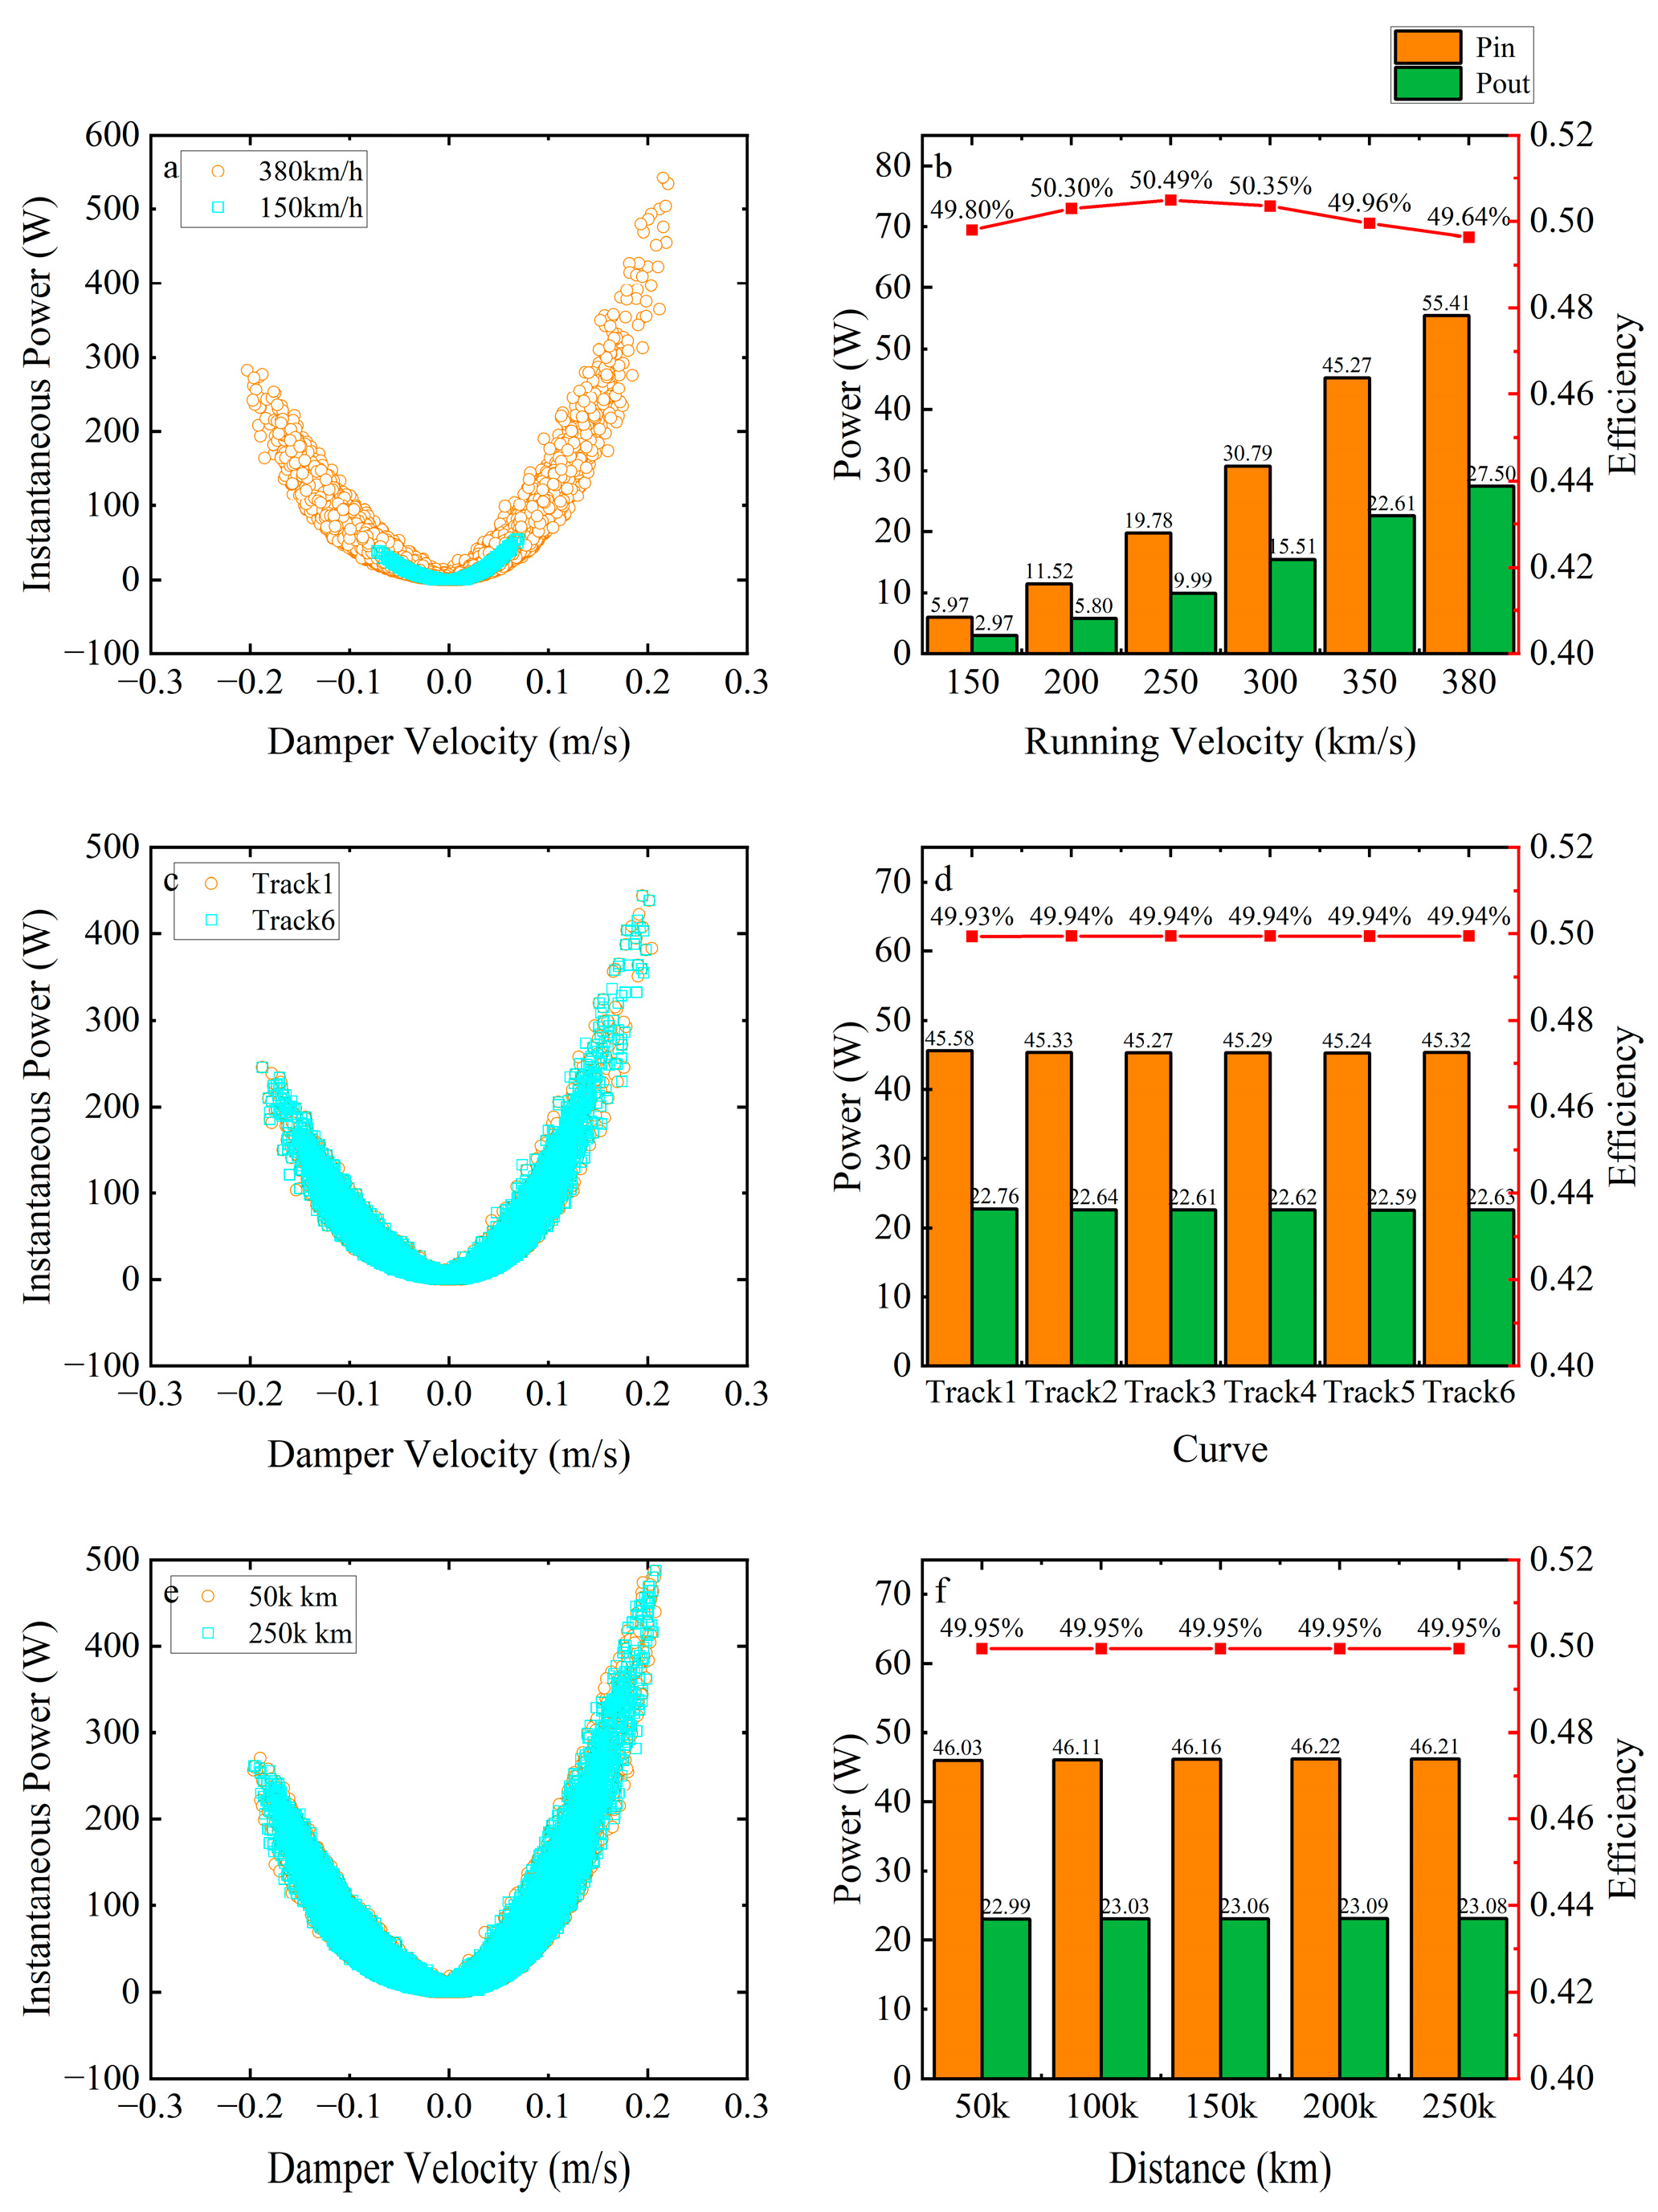
A single HERD in the primary vertical damper was evaluated under real operating conditions over a 5 km section (Table 3) using the co-simulation model in Figure 7. Figure 11 shows the results by running speed Figure 11a,b, curve radius Figure 11c,d, and accumulated mileage Figure 11e,f, examining instantaneous electrical power together with average input/output power. The electrical load is 25 ohms.
Running speed (Figure 11a,b). From 150 to 380 km/h, on the railway with a curve radii of 7000 m, both average hydraulic input power and average electrical output power increase monotonically, consistent with the rise in damper relative velocity at higher speed. Instantaneous electrical power reaches peaks above 425 W at events of large damper acceleration, evidencing strong conversion capability under dynamic excitation. Despite the growth of power levels, the recovery efficiency remains nearly constant at ≈49–50%, indicating that the dominant loss channels scale with excitation amplitude and that speed has limited influence on efficiency.
Curve radius (Figure 11c,d). At a speed of 350 km/h, six alignments (Curve1–Curve6) with radii from 3 km to 12 km yield similar power distributions; the average output power is approximately 22.6 W across all cases. Track curvature therefore has minimal effect on the stability of power output under the studied conditions, with recoverable power governed primarily by irregularity-induced vertical motion.
Running Mileage (Figure 11a–f). Results after 50,000 km and 250,000 km are nearly coincident in both instantaneous and average measures, demonstrating durable behaviour and stable recovery efficiency over the simulated service interval.
Across the three operating groups, energy-recovery efficiency remains approximately 49%, reflecting a stable partition between harvested power and losses dominated by internal leakage in the hydraulic motor and resistance losses in the generator. The observed regularity monotonic power growth with speed, weak sensitivity to curvature, and invariance with mileage, provides a consistent basis for sizing the electrical load and planning energy-management strategies.
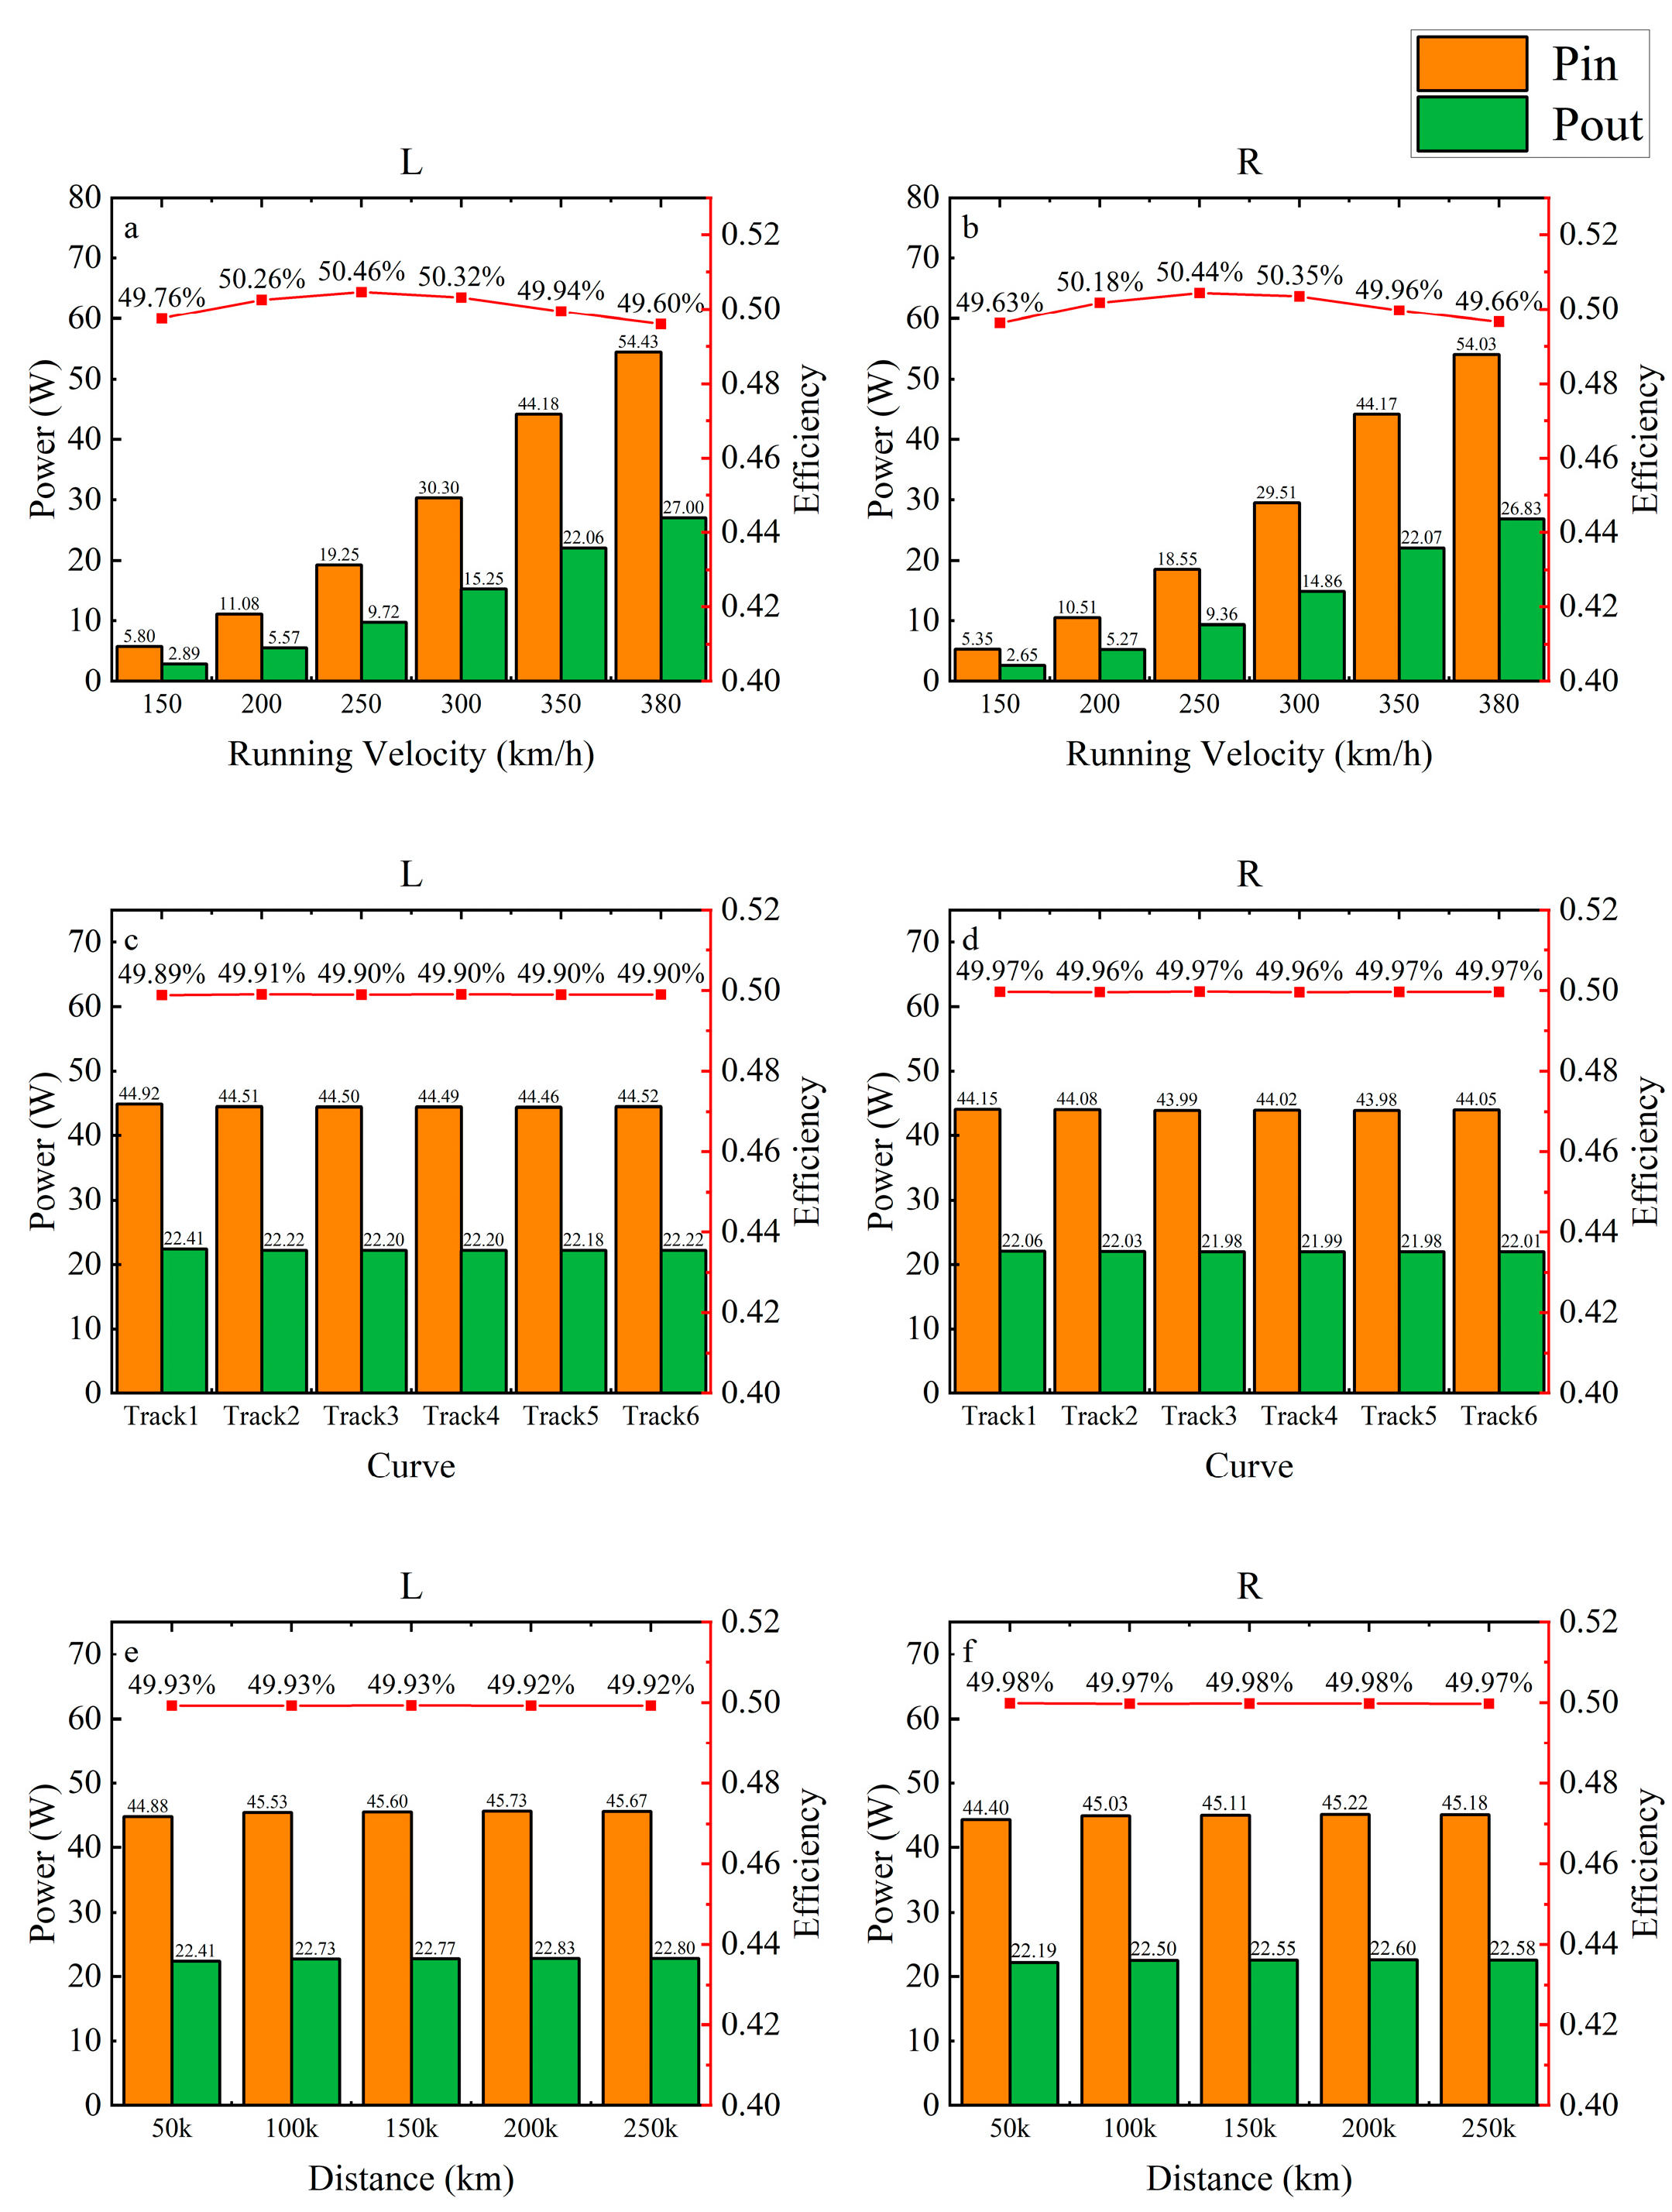
Figure 12 compares the left (L) and right (R) wheelsets under three operating groups. The left wheel consistently shows higher input and output power, attributable to asymmetric loading and vibration, while its recovery efficiency is slightly lower.
Running Speed Figure 12a,b. As speed increases from 150 to 380 km/h, average input power rises from 5.50 W to 41.15 W and average output power from 2.00 W to 27.00 W. Efficiency is broadly constant and exhibits a shallow maximum at 300–350 km/h: 50.32–50.36% (L) and 50.34–50.35% (R), The near invariance of efficiency indicates proportional scaling of the dominant loss channels (motor leakage and generator resistance) with excitation level under the fixed electrical load.
Curve radius Figure 12c,d. Smaller radii yield higher input power, with maxima at 3000 m (≈44.9 W left, ≈44.2 W right). Average output power and efficiency vary only marginally across 3–12 km, showing that, for the studied conditions, recoverable power is governed primarily by vertical irregularity rather than steady curving loads.
Running Mileage Figure 12e,f. Power levels increase slightly with distance and stabilise by about 200,000 km, while efficiency remains near 50%. Within the present model scope (no parameter drift imposed), this indicates stable conversion characteristics over the examined service interval.
Left–right asymmetry Figure 12. The left wheelset consistently exhibits higher input and output than the right, with efficiency differing by only a few tenths of a percent. This pattern is attributable to operation on a right-hand curve: the left rail serves as the outer rail, and the combined effects of centrifugal loading and superelevation increase the vertical load and relative motion in the left primary damper. The higher hydraulic throughput on the left therefore raises both input and output power, while efficiency remains nearly constant because the harvested power and the dominant loss mechanisms (motor leakage, generator resistance, and throttling losses) scale in approximately the same proportion under the fixed electrical load. The asymmetry would reverse on a left-hand curve and diminish on tangent track.
Across variations in speed, curve radius, and mileage, HERD output scales with excitation, while efficiency remains approximately between 49 and 50 percent. The small, persistent left–right differences on a right-hand curve reflect higher loading at the outer rail; adjusting the electrical load at each corner can meet damping targets without materially affecting power regeneration performance.

3.3. Prediction of Wear Depth

Under high-speed operation, small differences in vehicle vibration accumulate into predictable differences in wheel material removal. As a controllable dissipation element in the primary damper, the HERD modifies axlebox forces and relative motion and thus the wheel–rail contact conditions that govern wear. Wear is assessed in parallel with damping performance to quantify damper-induced changes in wheel tread evolution. The wear module is driven by time histories from the coupled vehicle–track simulation at each wheelset: normal wheel–rail force, longitudinal/lateral/spin creepages, and rolling speed. Normal contact is computed using nonlinear Hertzian theory with an elliptical contact patch and pressure distribution determined by the instantaneous wheel and rail profiles and the applied normal load. Tangential and slip forces are obtained with FASTSIM (a fast implementation consistent with Kalker’s theory), which returns adhesion/slip states and the local slip-velocity field required for wear calculations.
Wear depth is advanced using the Archard wear model [42]. In differential form, the wear degradation rate at a point in the contact patch is proportional to the product of local contact pressure and slip velocity, scaled by the material hardness; the resulting increment is mapped to the wheel tread and integrated along the rolling path. The wheel circumference is discretised into bands around the wheel tread so that the predicted wear distribution captures circumferential nonuniformity as well as left–right differences. The wear coefficient is selected from established tribological ranges for pearlitic wheel steels and examined via sensitivity analysis rather than external calibration. The wear is computed using the Archard wear model:
V W = k N D H
where V W is the worn volume, D is the sliding distance, N is the normal force, H is the Vickers hardness of the softer material, and k is the dimensionless wear coefficient, [10−5–10−3]. The wear depth within the contact patch is determined by:
Δ Z = 3 N k 2 π a b H 1 x a 2 y b 2 s x 2 + s y 2 Δ x V c
where a and b represent the major and minor semi-axes of the elliptical contact patch, respectively. Δ x is the element length in the forward running direction, V c is the velocity of a general point relative to the contact patch, s x and s y denote the total sliding velocities along the major and minor axes, respectively.
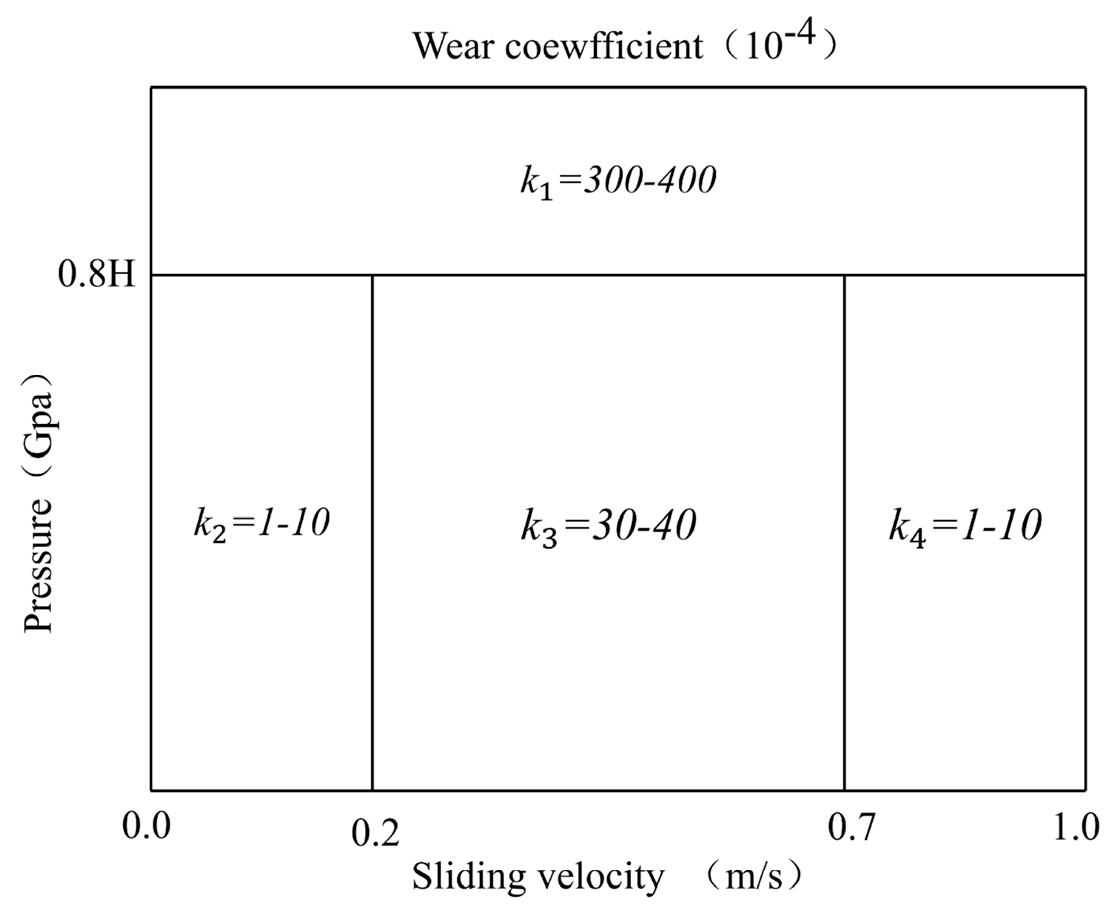
Jendel and Berg [43] examined the wear coefficient in the Archard wear model over ranges of contact pressure and sliding velocity and proposed a four-region map. When the contact pressure exceeds approximately 80% of the material hardness, wear is most severe and the “top” region coefficient is applied. The remaining three regions are distinguished primarily by the relative sliding velocity at the wheel–rail interface. In typical tread rolling contact, the coefficient falls in the lower-left region of the map; under flange contact or other severe contact conditions, the operating point may enter any of the four regions. The coefficients used in Figure 13 are derived from empirical tests and implemented as a piecewise, pressure–velocity-dependent lookup, which offers a practical balance between computational efficiency and fidelity. In engineering applications, the Archard approach with such coefficient mapping is widely used and has demonstrated reliable performance for predicting wear depth and the broader wear behaviour of wheel–rail systems.
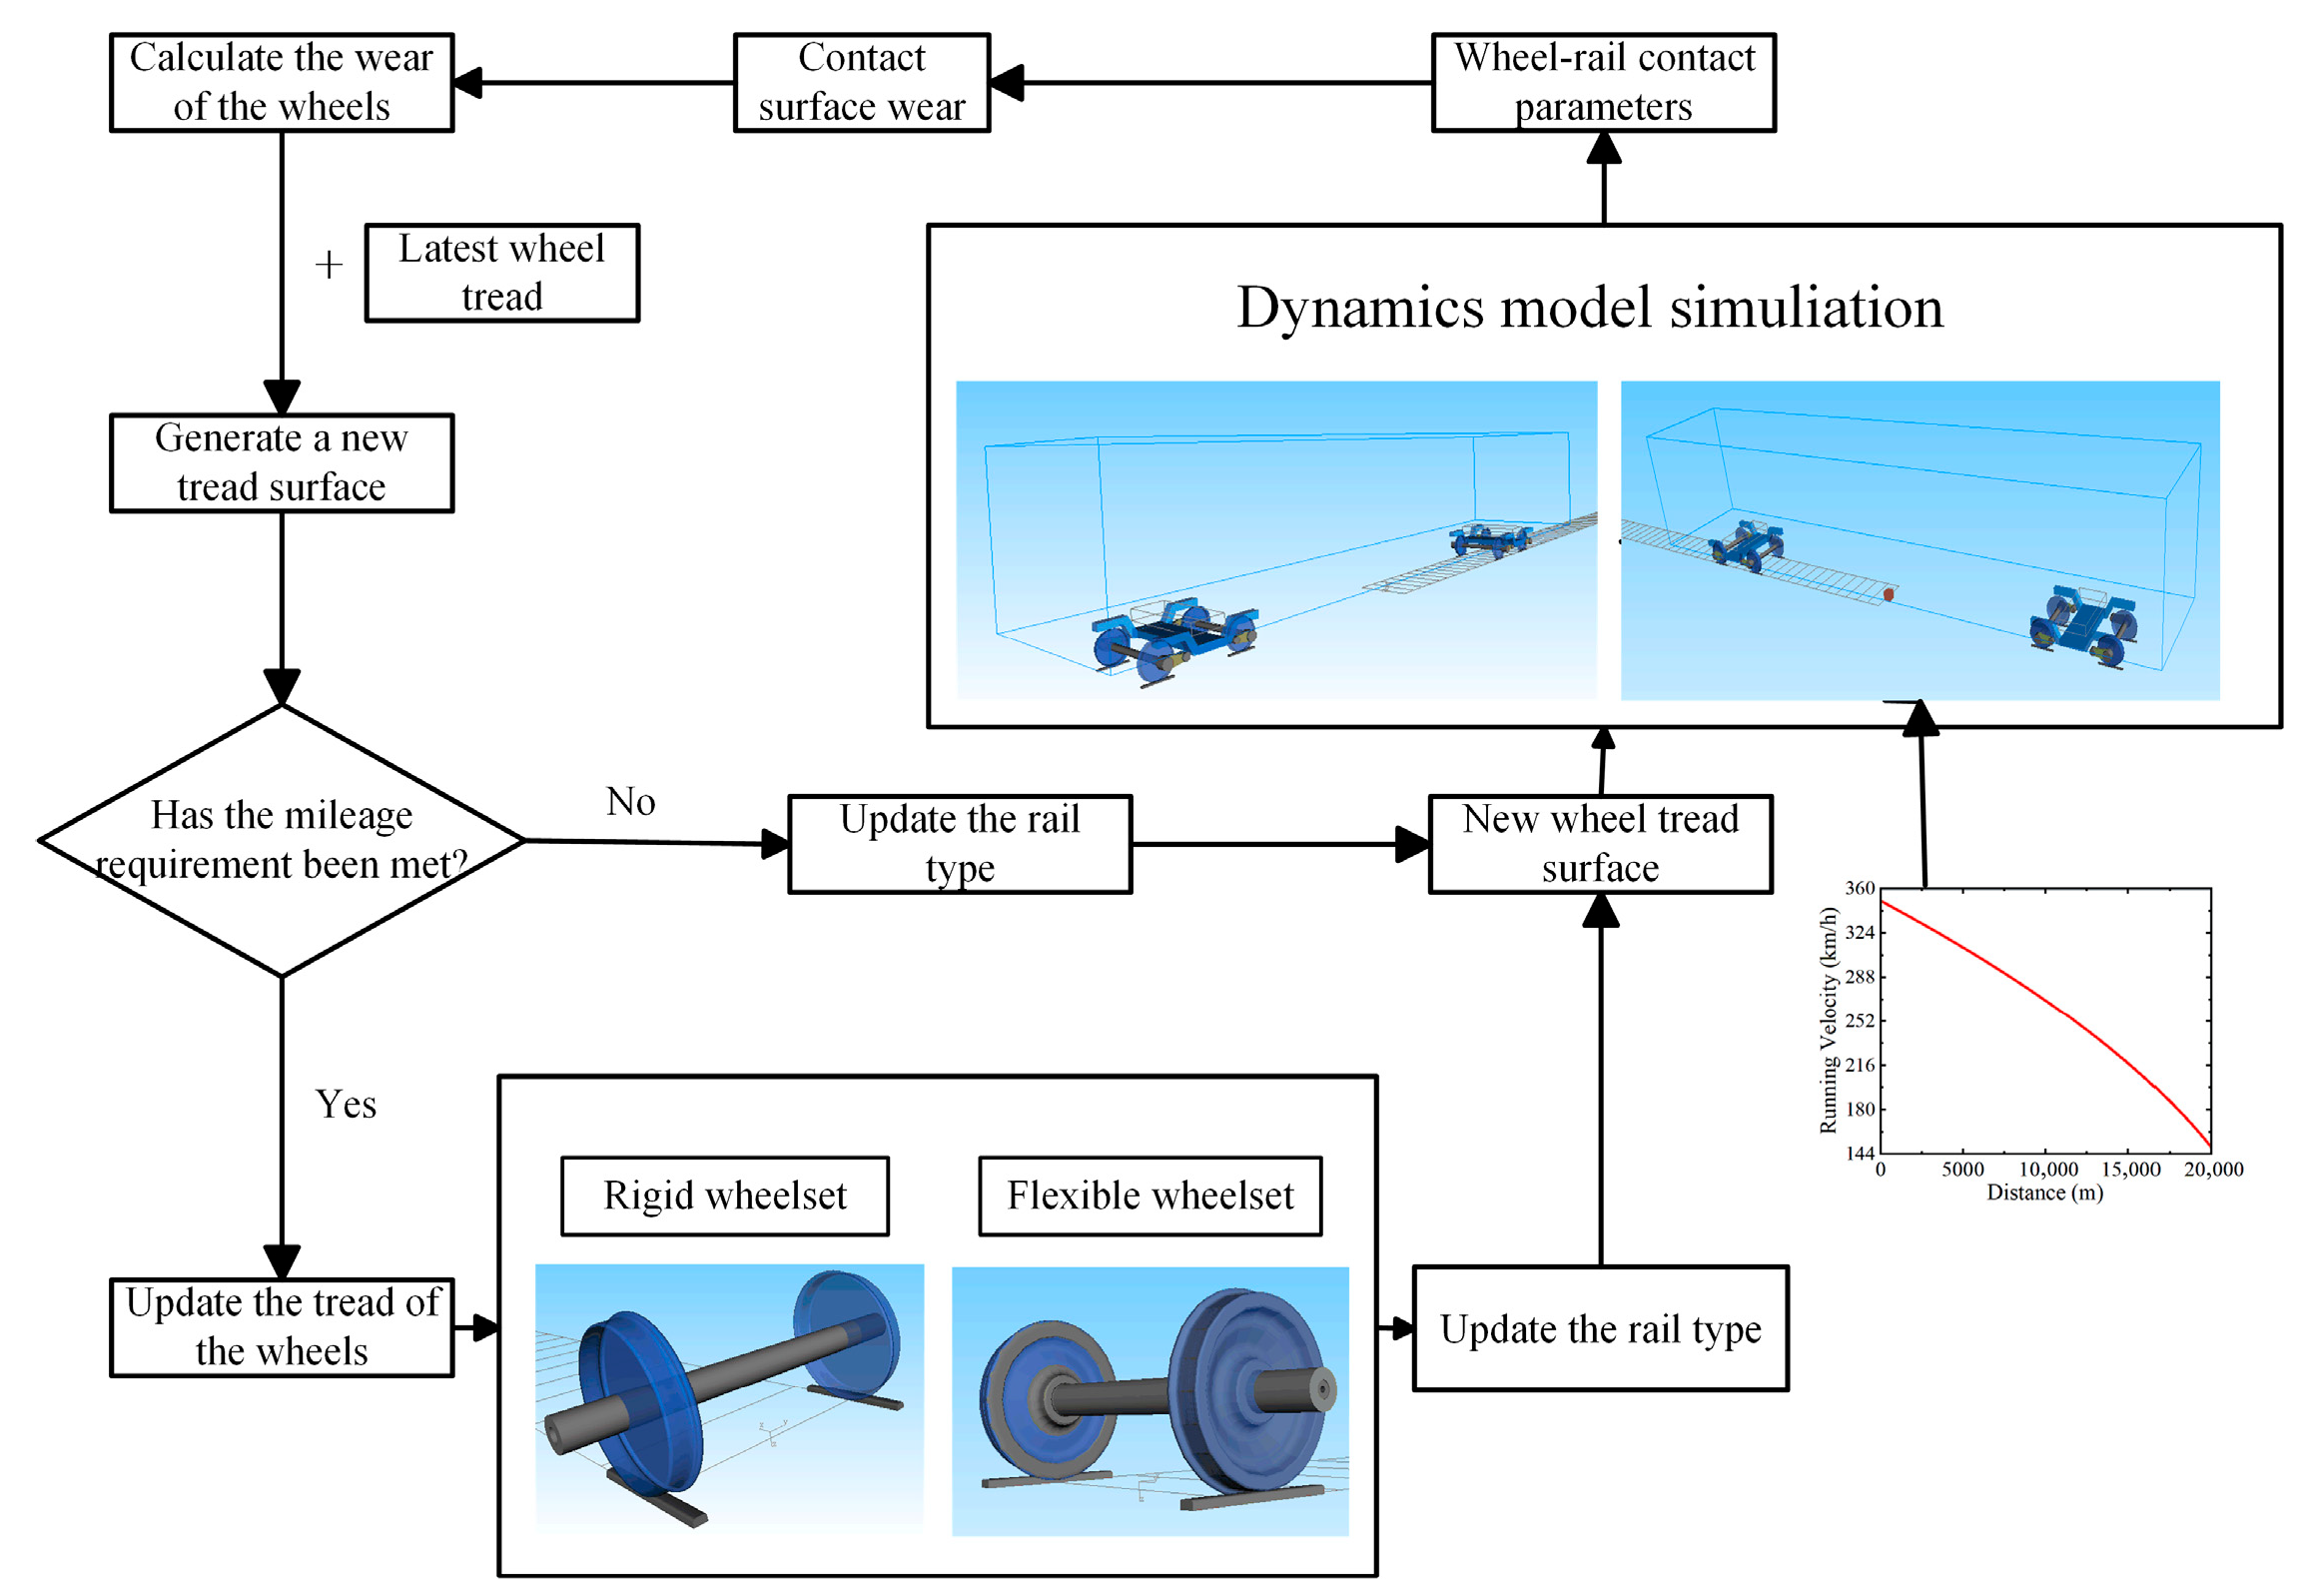
Figure 14 presents an iterative co-simulation procedure that links vehicle dynamics, wheel rail contact, and tread evolution. For each track segment in Table 3, the dynamics model outputs time histories of normal load, creepages, and rolling speed for each wheelset. The wear solver uses the contact parameters to compute local material removal on the current tread and then reconstructs an updated tread surface with continuity and gauge constraints. Profile updating follows practice on the high-speed line: for constant speed cases the wheel tread is replaced every 1500 km of simulated running; for variable speed cases every 1000 km. If the update interval is not reached, the calculation advances to the next rail segment; once reached, the new tread profile replaces the old profile in the dynamics model. The sequence runs through six segments with equal shares of right and left curves, and a round-trip assumption imposes left–right symmetry over a full cycle.
The proposed method supports both rigid and flexible wheelset representations, so the role of structural compliance in contact and long-term wear can be assessed within the same simulation. All quantities for power regeneration of the HERD are computed in the same loop, which keeps damping, contact, and wear on a consistent basis. The iterative update gives a stable route from operating scenario to predicted tread profile and enables controlled comparison across damper settings, speed programmes, and track geometries. In the main simulation, the wheelset is regarded as a rigid body.

3.3.1. Wear Depth Under Complex Excitations

In railway operations, Wheel polygonal wear and flats are major factors that affect vehicle dynamics in service. Excitations introduced at the wheel–rail contact results in high-frequency vibration and impact, increase dynamic loads, reduce ride comfort, and accelerate deterioration of track components. To quantify the influence on wear, three-wheel conditions are considered: a nominal (regular) wheel, a second-order polygonal wheel, and a wheel with a 60 mm flat with the conventional primary vertical damper.
A trailer car operating at 350 km/h on a domestic high-speed line is simulated over 250,000 km with iterative wear updating. The wheel tread profile and wear depth are recorded every 50,000 km for comparison.
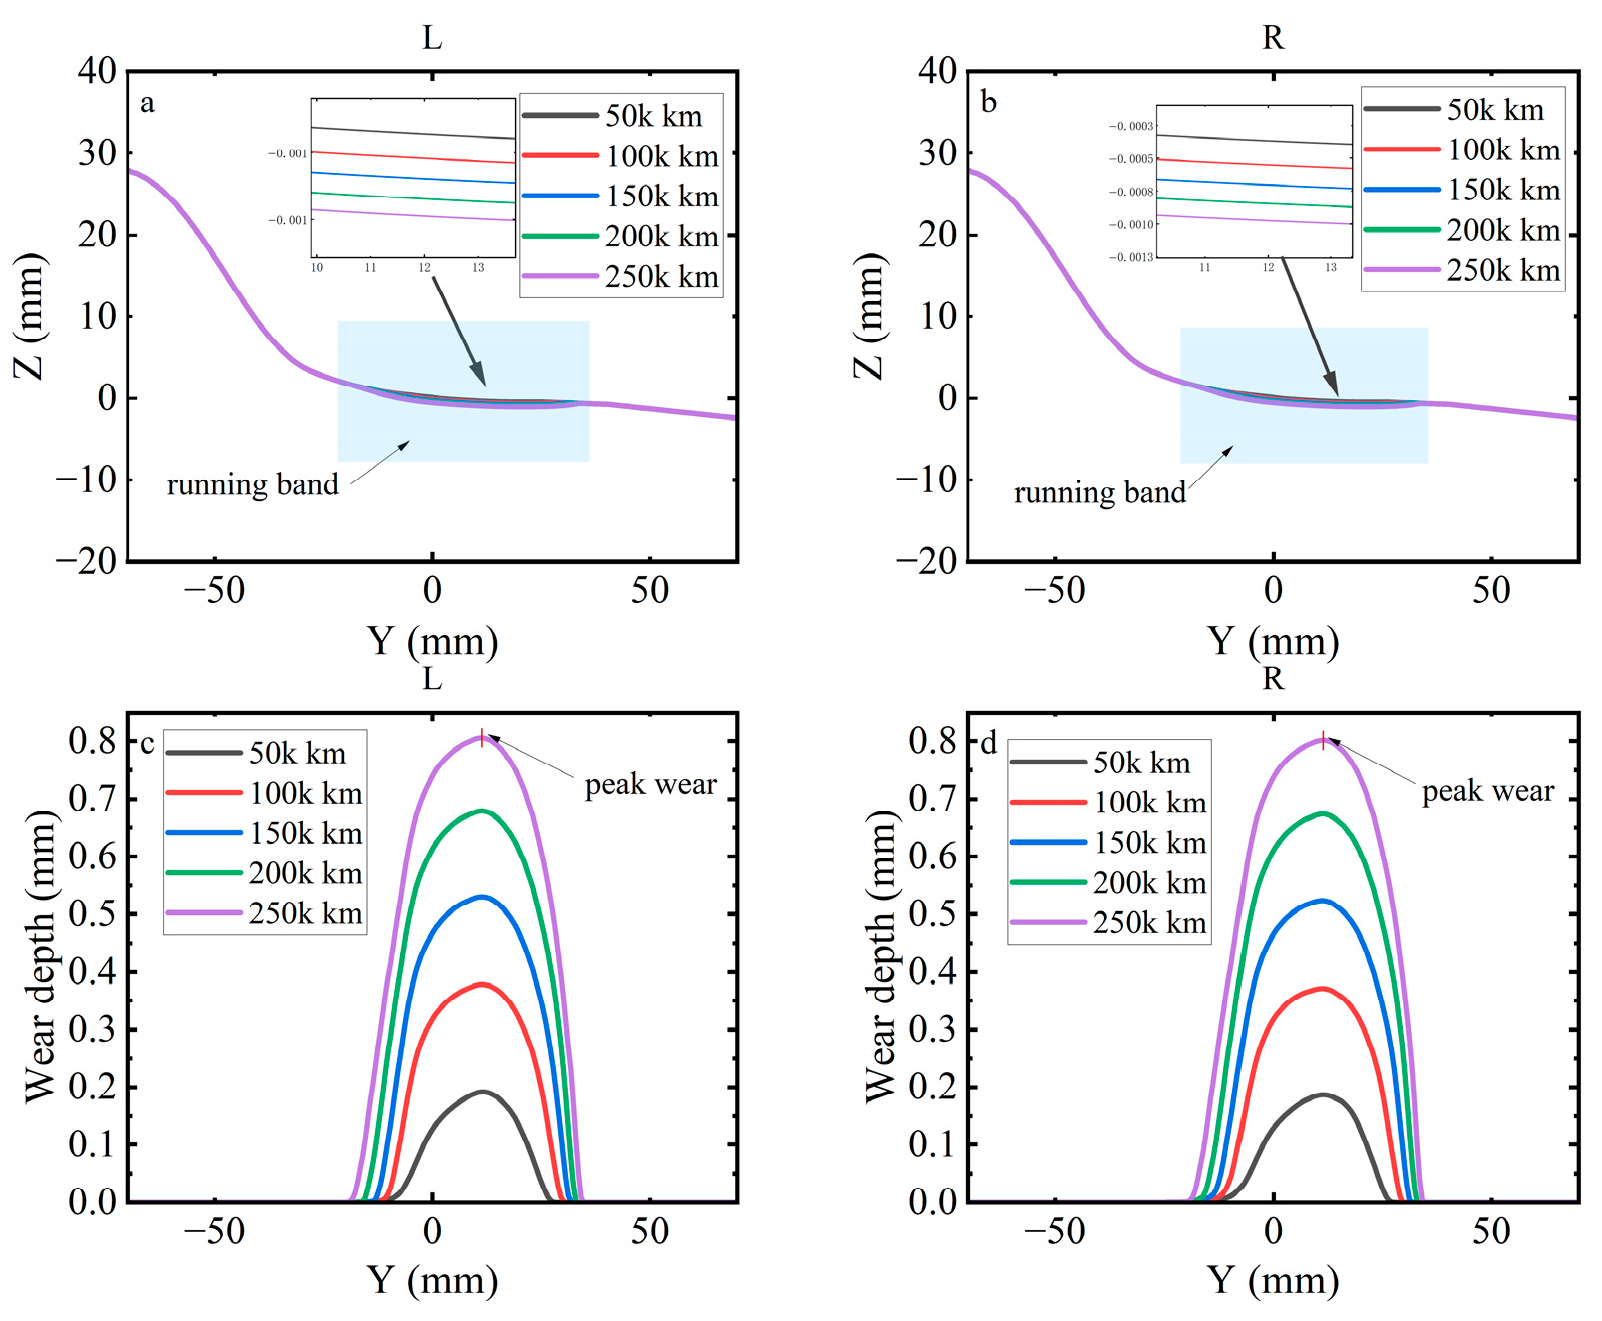
Nominal wheel (Figure 15). For the trailer car at 350 km/h, the wear depth curve shows a single peak centred near the wheel tread that grows with distance in a near linear fashion. Peak wear depth of the left wheel is 0.191 mm at 50,000 km, 0.375 mm at 100,000 km, 0.526 mm at 150,000 km, 0.675 mm at 200,000 km, and 0.802 mm at 250,000 km. The contact zone remains focused near the wheel tread with no lateral migration. The left wheel and the right wheel evolve in almost the same way; the peak difference stays within 0.524%. It indicates a stable contact pressure region and stable creepages, which is consistent with a trailer car where longitudinal creepage is set by kinematics rather than traction torque.
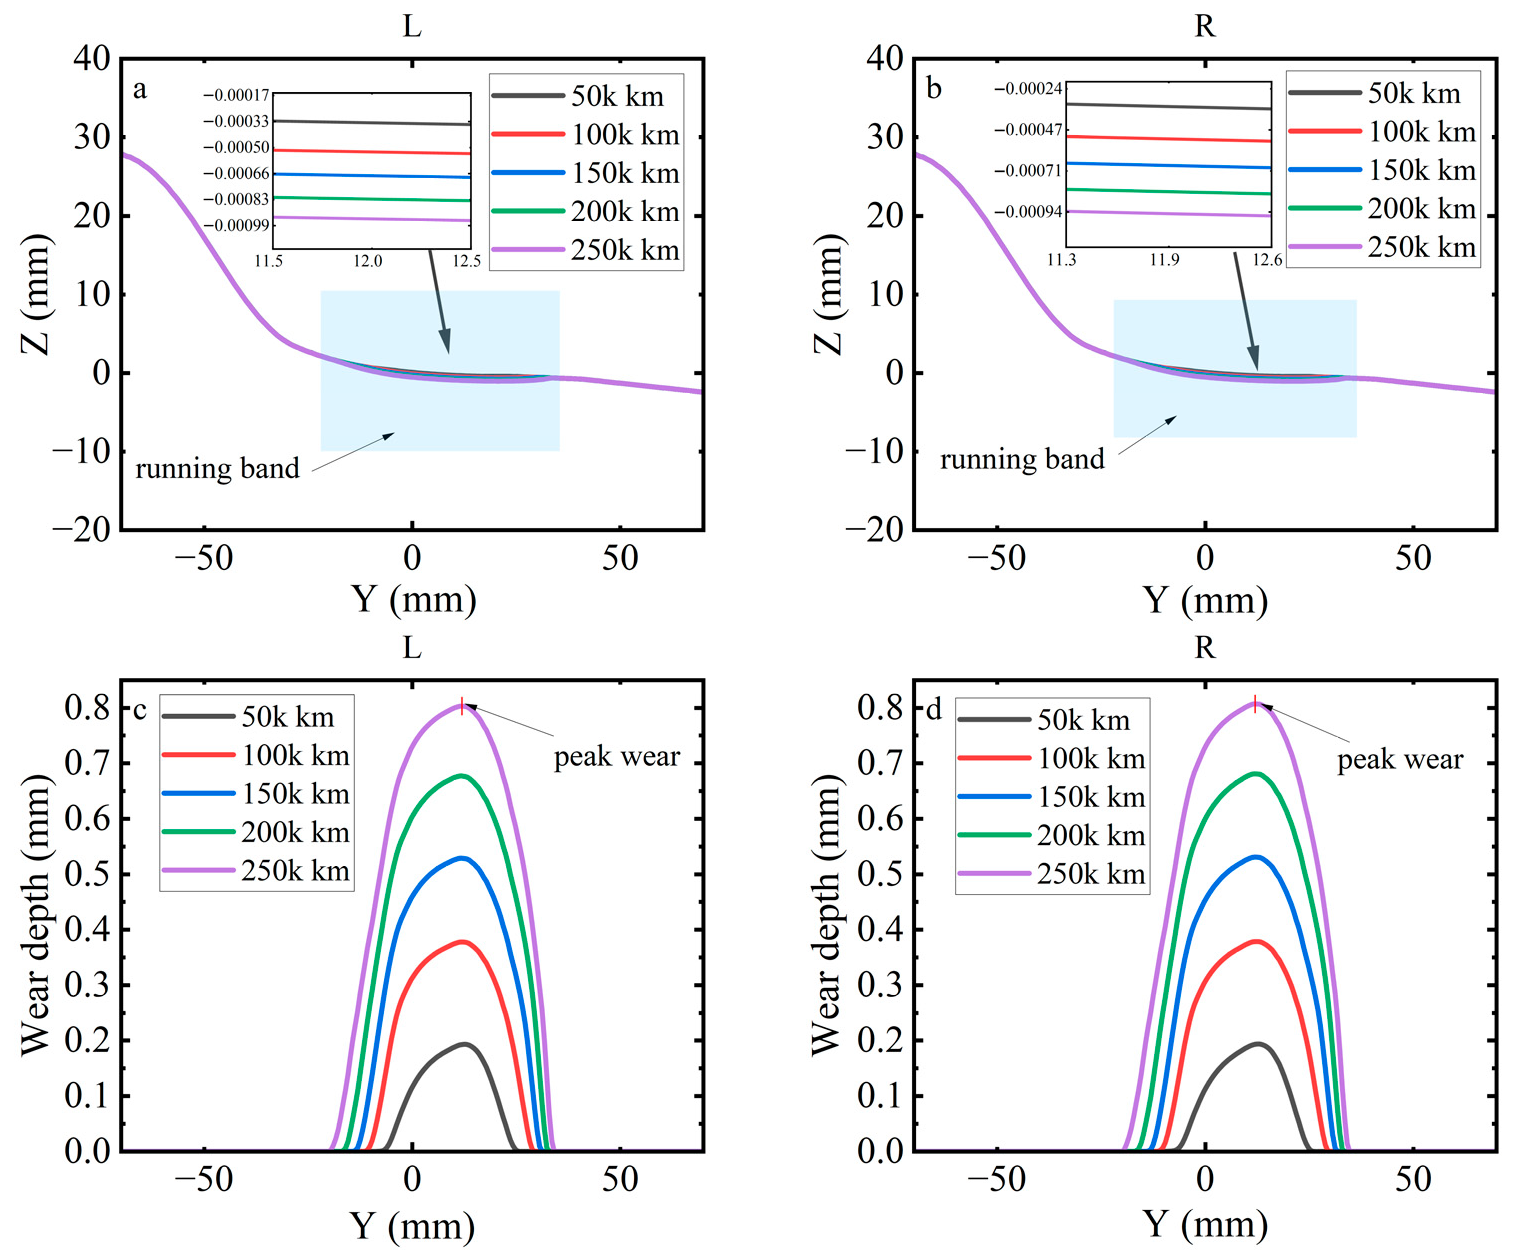
Flat defect, 60 mm (Figure 16). During the first update interval the peak increases and the affected lateral position around the wheel tread expands relative to the regular case. One impact per wheel revolution raises local pressure and slip. Peak wear depth of the left wheel is 0.193 mm at 50,000 km, 0.377 mm at 100,000 km, 0.529 mm at 150,000 km, 0.677 mm at 200,000 km, and 0.803 mm at 250,000 km. Interval degradation rates 0.368, 0.304, 0.296, and 0.252 mm per 100,000 km, which shows a strong early increase followed by a clear reduction as the flat is removed and the local radius recovers. Left wheel and right wheel remain closely matched, which points to vertical load modulation as the main mechanism.
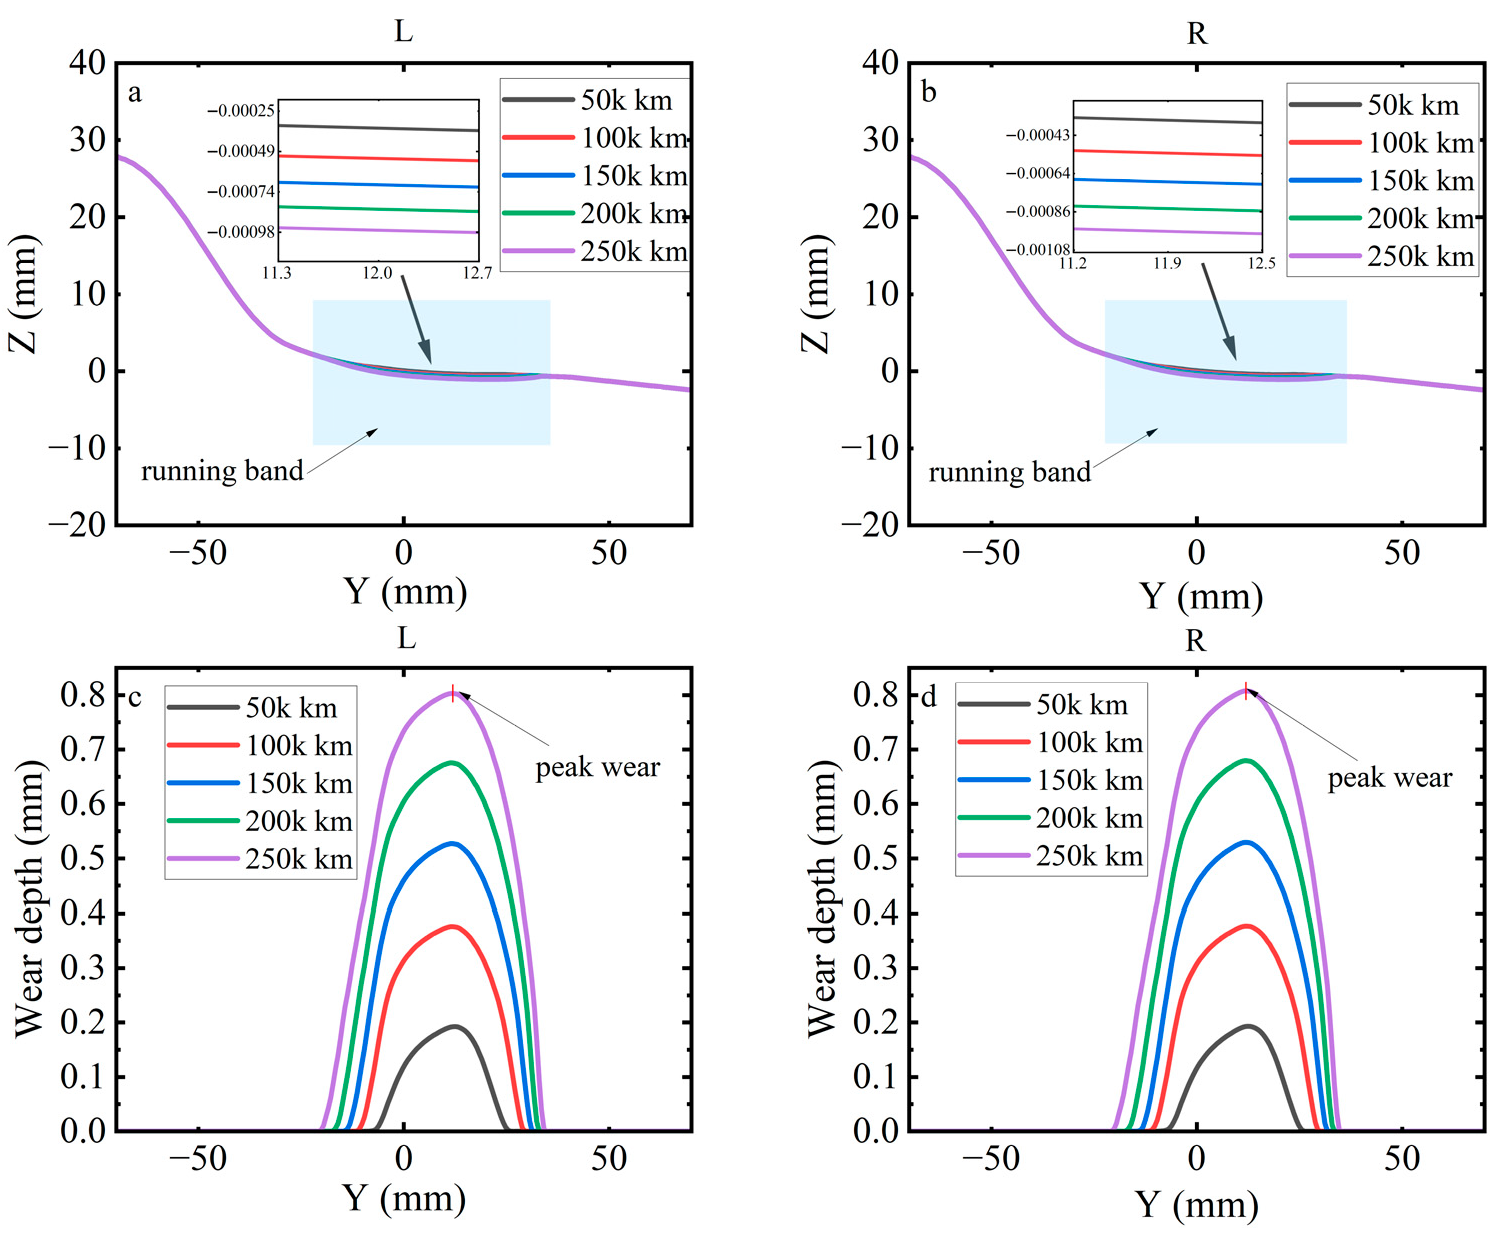
Second order polygonal tread (Figure 17). Peak wear is the highest at every mileage step and degradation persists through the full distance. Peak wear depth of the left wheel is 0.192 mm at 50,000 km, 0.376 mm at 100,000 km, 0.526 mm at 150,000 km, 0.675 mm at 200,000 km, and 0.803 mm at 250,000 km. Interval degradation rates are 0.36, 0.40, 0.32, and 0.24 mm per 100,000 km. A two per revolution geometric modulation maintains variation in normal load and creepages around the circumference, so the contact state does not settle to a smoother condition. Left wheel and right wheel show similar progress; the peak ratio is close to unity.
Across the three conditions, peak wear depth increases nearly linearly with distance and shows a slight reduction in incremental degradation toward the end of the interval. The flat defect produces an early uplift and then converges to the nominal trajectory, while the second-order polygonal tread does not exceed the nominal case at the longest mileage under the present inputs. Wear remains concentrated within the central running band of the wheel tread, and the difference between the left wheel and the right wheel is small (peak difference approximately 0.524 percent). These results indicate that the excitation type governs short-term modulation of the contact region but does not generate a divergent long-term peak in this dataset. For maintenance planning, early removal of flats is warranted to suppress impact-driven transients, and polygonal patterns should be monitored; under the studied conditions, however, the long-range peak wear depth is determined primarily by the underlying contact pressure and creepage distribution rather than by sustained amplification due to defects.
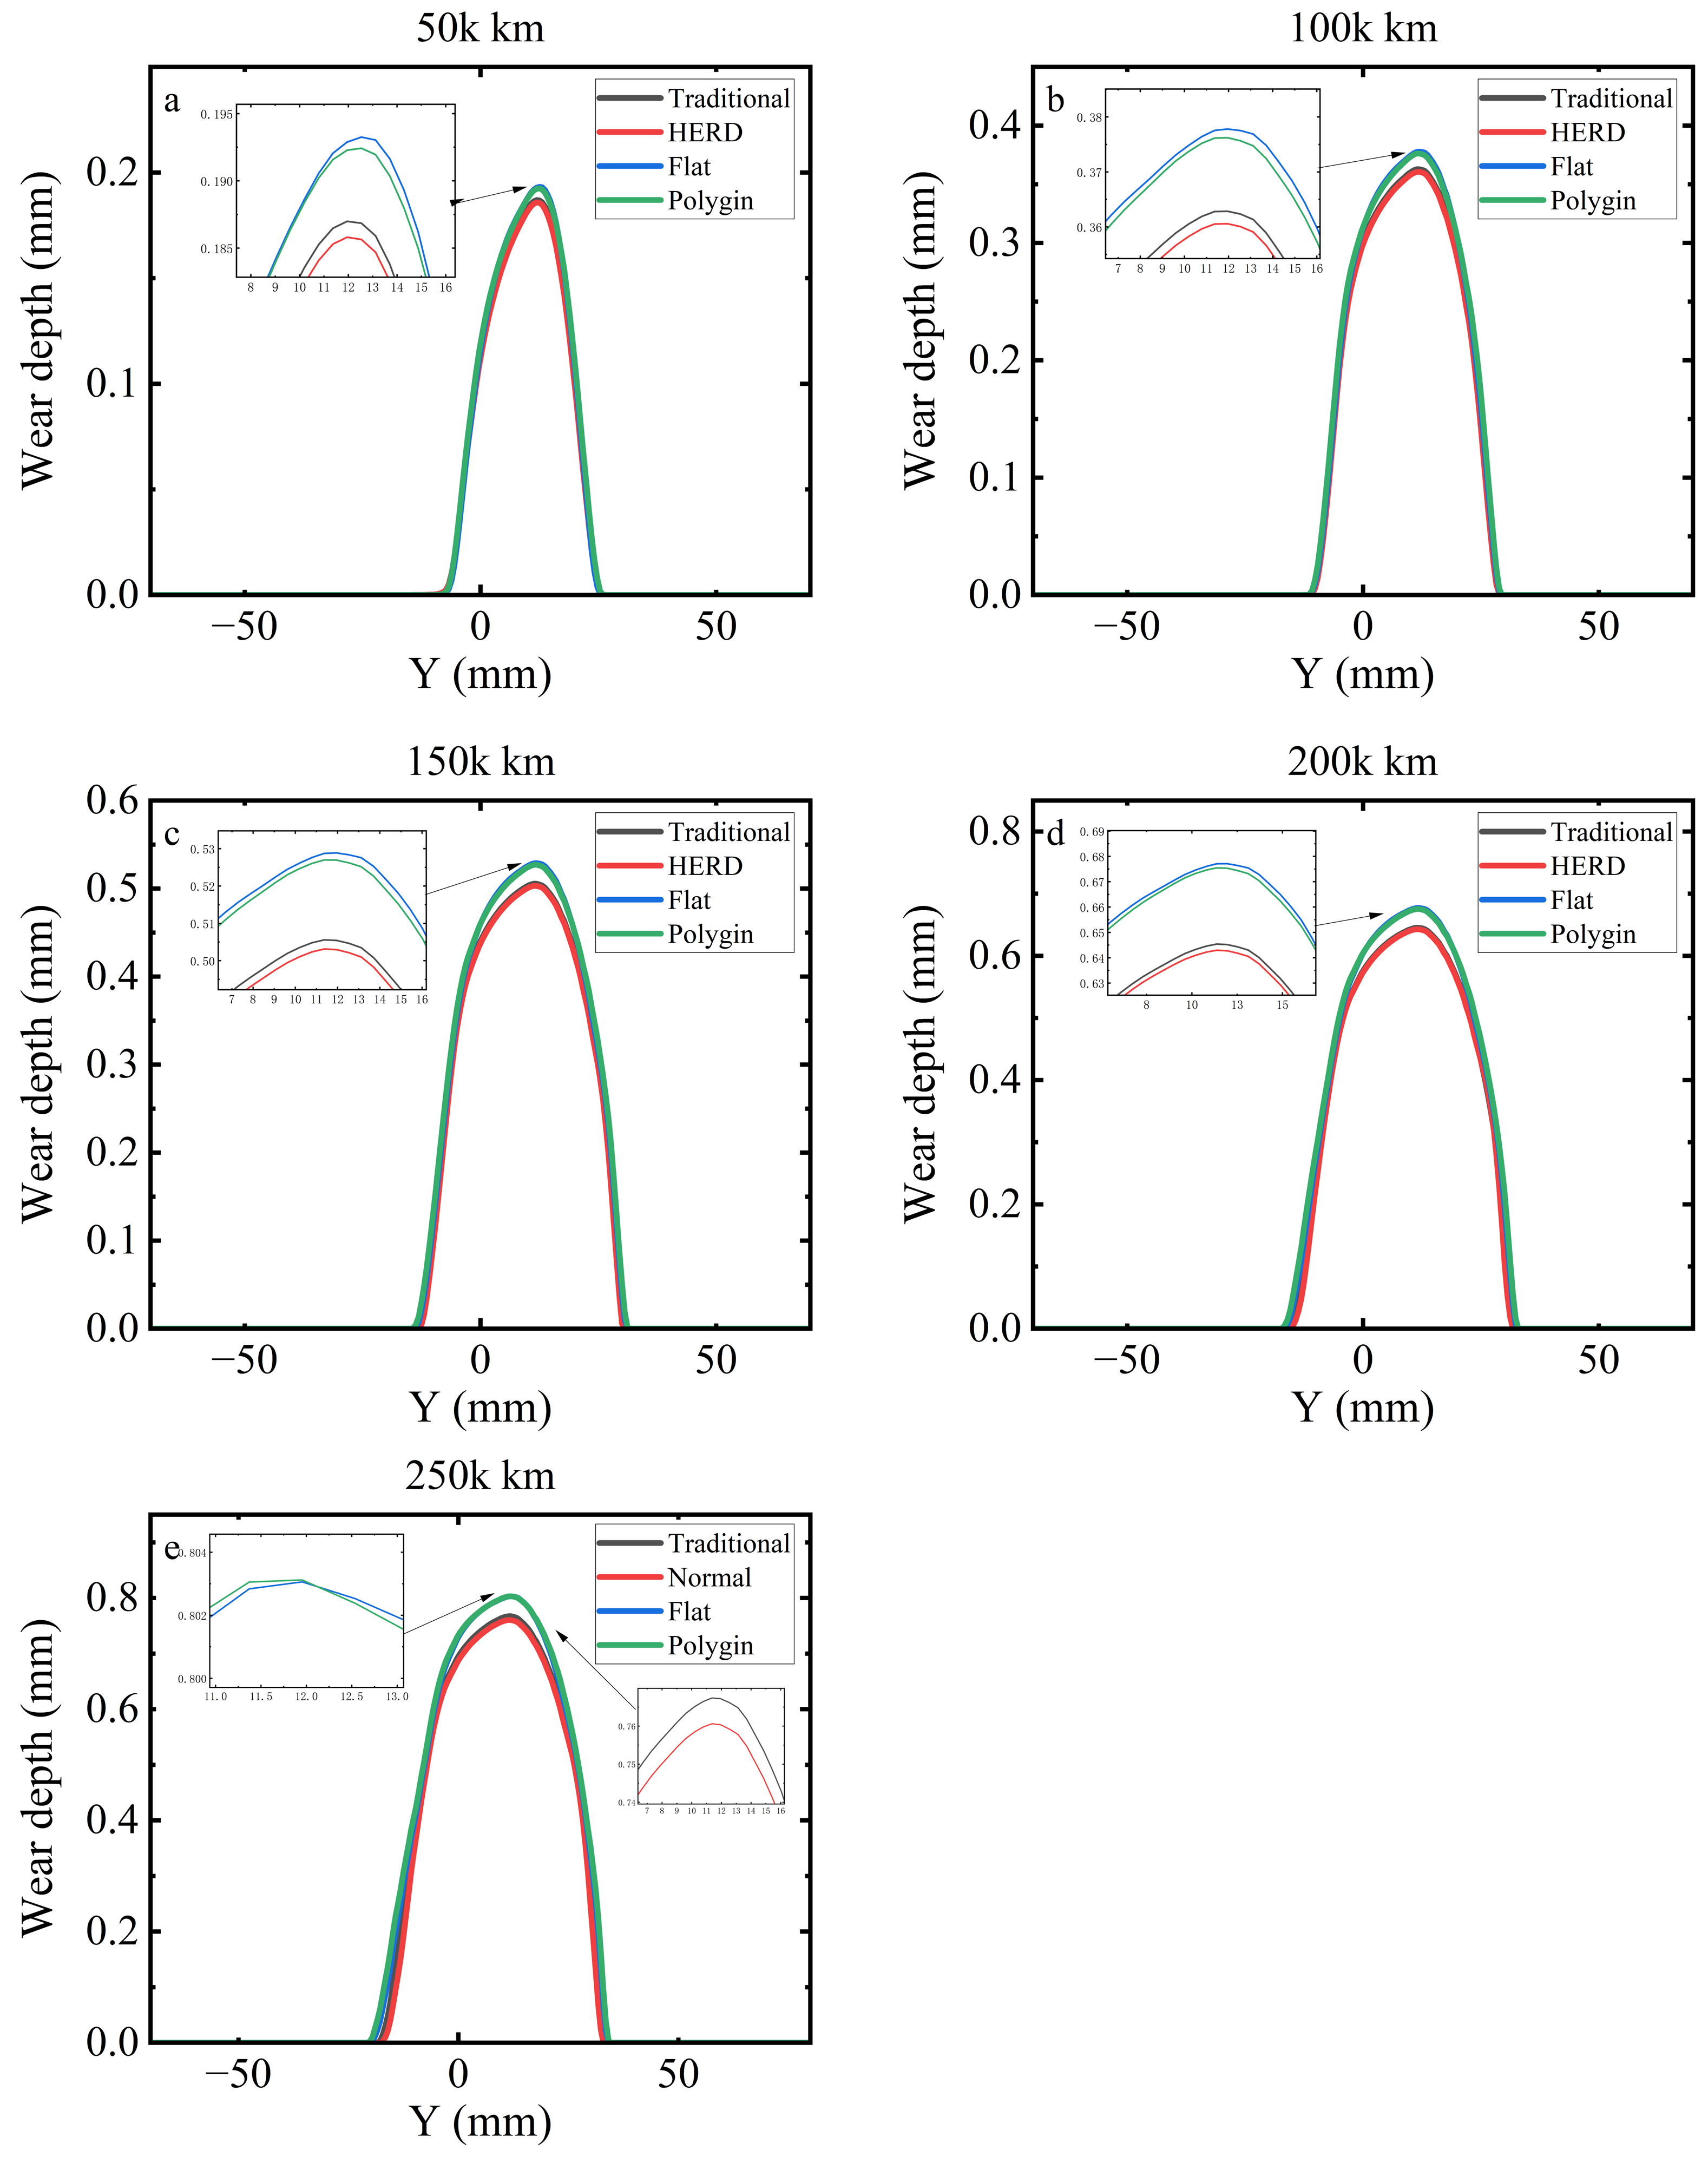
Figure 18 compares lateral distributions of wheel wear depth at 50,000 km intervals (50,000–250,000 km) for a conventional damper and for the HERD under three-wheel conditions: no defect, a 60 mm flat, and a second-order polygonal profile. The wear zone on the wheel tread remains confined to a band of ≈50 mm around the wheel tread with a stable peak near the same lateral coordinate.
For a wheel without defects, HERD obtains a lower peak than the conventional damper at each mileage step; for example, at 200,000 km the wear peak depth is ≈0.64 mm (HERD) versus ≈0.66 mm (conventional), a reduction of ≈3%, and at 250,000 km it is ≈0.75 mm (HERD) versus ≈0.78 mm (conventional), a reduction of ≈4%. Adding defects on a wheel suspended by HERD increases wear: with a 60 mm flat the wear peak depth reaches ≈0.72 mm at 200,000 km and ≈0.84 mm at 250,000 km, which is ≈12% and ≈8% above the conventional, no-defect reference at the same distances; with a second-order polygonal profile the peaks are ≈0.70 mm (200,000 km) and ≈0.82 mm (250,000 km), ≈6% and ≈5% above the conventional, no-defect reference. The early interval (50,000–100,000 km) shows only small separations between the excitation cases on HERD, indicating limited influence on initial accumulation; with distance, the flat produces the largest peak and governs band widening, while the polygonal case ranks second but still erodes part of the HERD advantage.
In summary, HERD improves tread-wear performance for a wheel without defects (few-percent peak reductions against the conventional damper) but defect-driven excitation on a wheel fitted with HERD amplifies wear, with the ranking large-flat > polygonal > no-defect; maintaining HERD’s advantage therefore requires monitoring and timely reprofiling of flats and polygonal degradation in addition to appropriate load tuning.
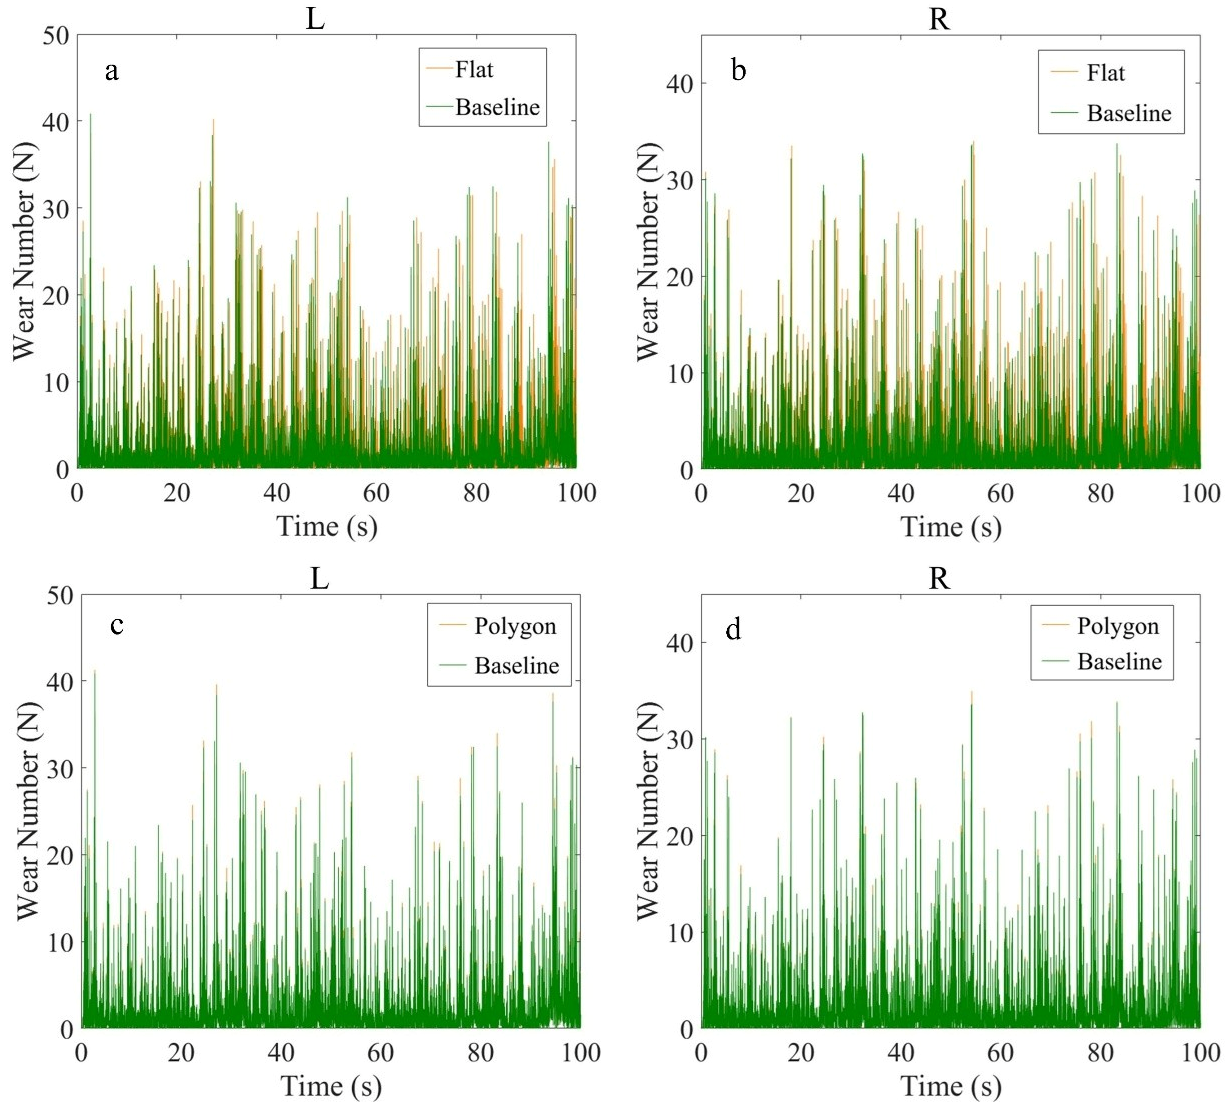
Figure 19 the wear number comparison during 100 s of operation at 350 km/h. In Figure 19a,b, both the flat spot and the polygonal excitations produce significantly higher wear numbers than the baseline HERD condition without defects. As shown in Figure 19a–c, the left wheel exhibits consistently higher wear numbers than the right. Under excitation, peak values reach 42 N for the left wheel, while the right wheel peaks at 30–35 N. The flat defect condition presents more frequent and higher peaks, indicating a more severe intensification of wear. This behaviour arises from the local geometric discontinuity of the flat spot, which generates strong transient impacts during wheel rail contact and produces sudden spikes in the wear number. The wheel polygon causes periodic excitation disturbances; although its peak values are slightly lower, the fluctuations are more continuous in time, reflecting a frequent, moderate-intensity wear process.
Both defects significantly weaken the baseline performance of the HERD and act through different dynamic mechanisms. The flat spot leads to impact-driven transients, whereas the polygon results in sustained periodic modulation. The higher wear number on the left wheel is consistent with greater track-induced excitation on that side under the operating alignment.

3.3.2. Analysis of Wear Depth Under Braking Conditions

To examine speed-related differences in wear depth, a representative deceleration was simulated with the established vehicle–track dynamics model, in which the primary vertical dampers were replaced by HERDs. Wear profiles and their lateral distributions at two speed levels are compared to clarify how speed variation and wheel–rail contact behaviour influence wear, and to assess the wear control effect of the energy-harvesting damper in service.
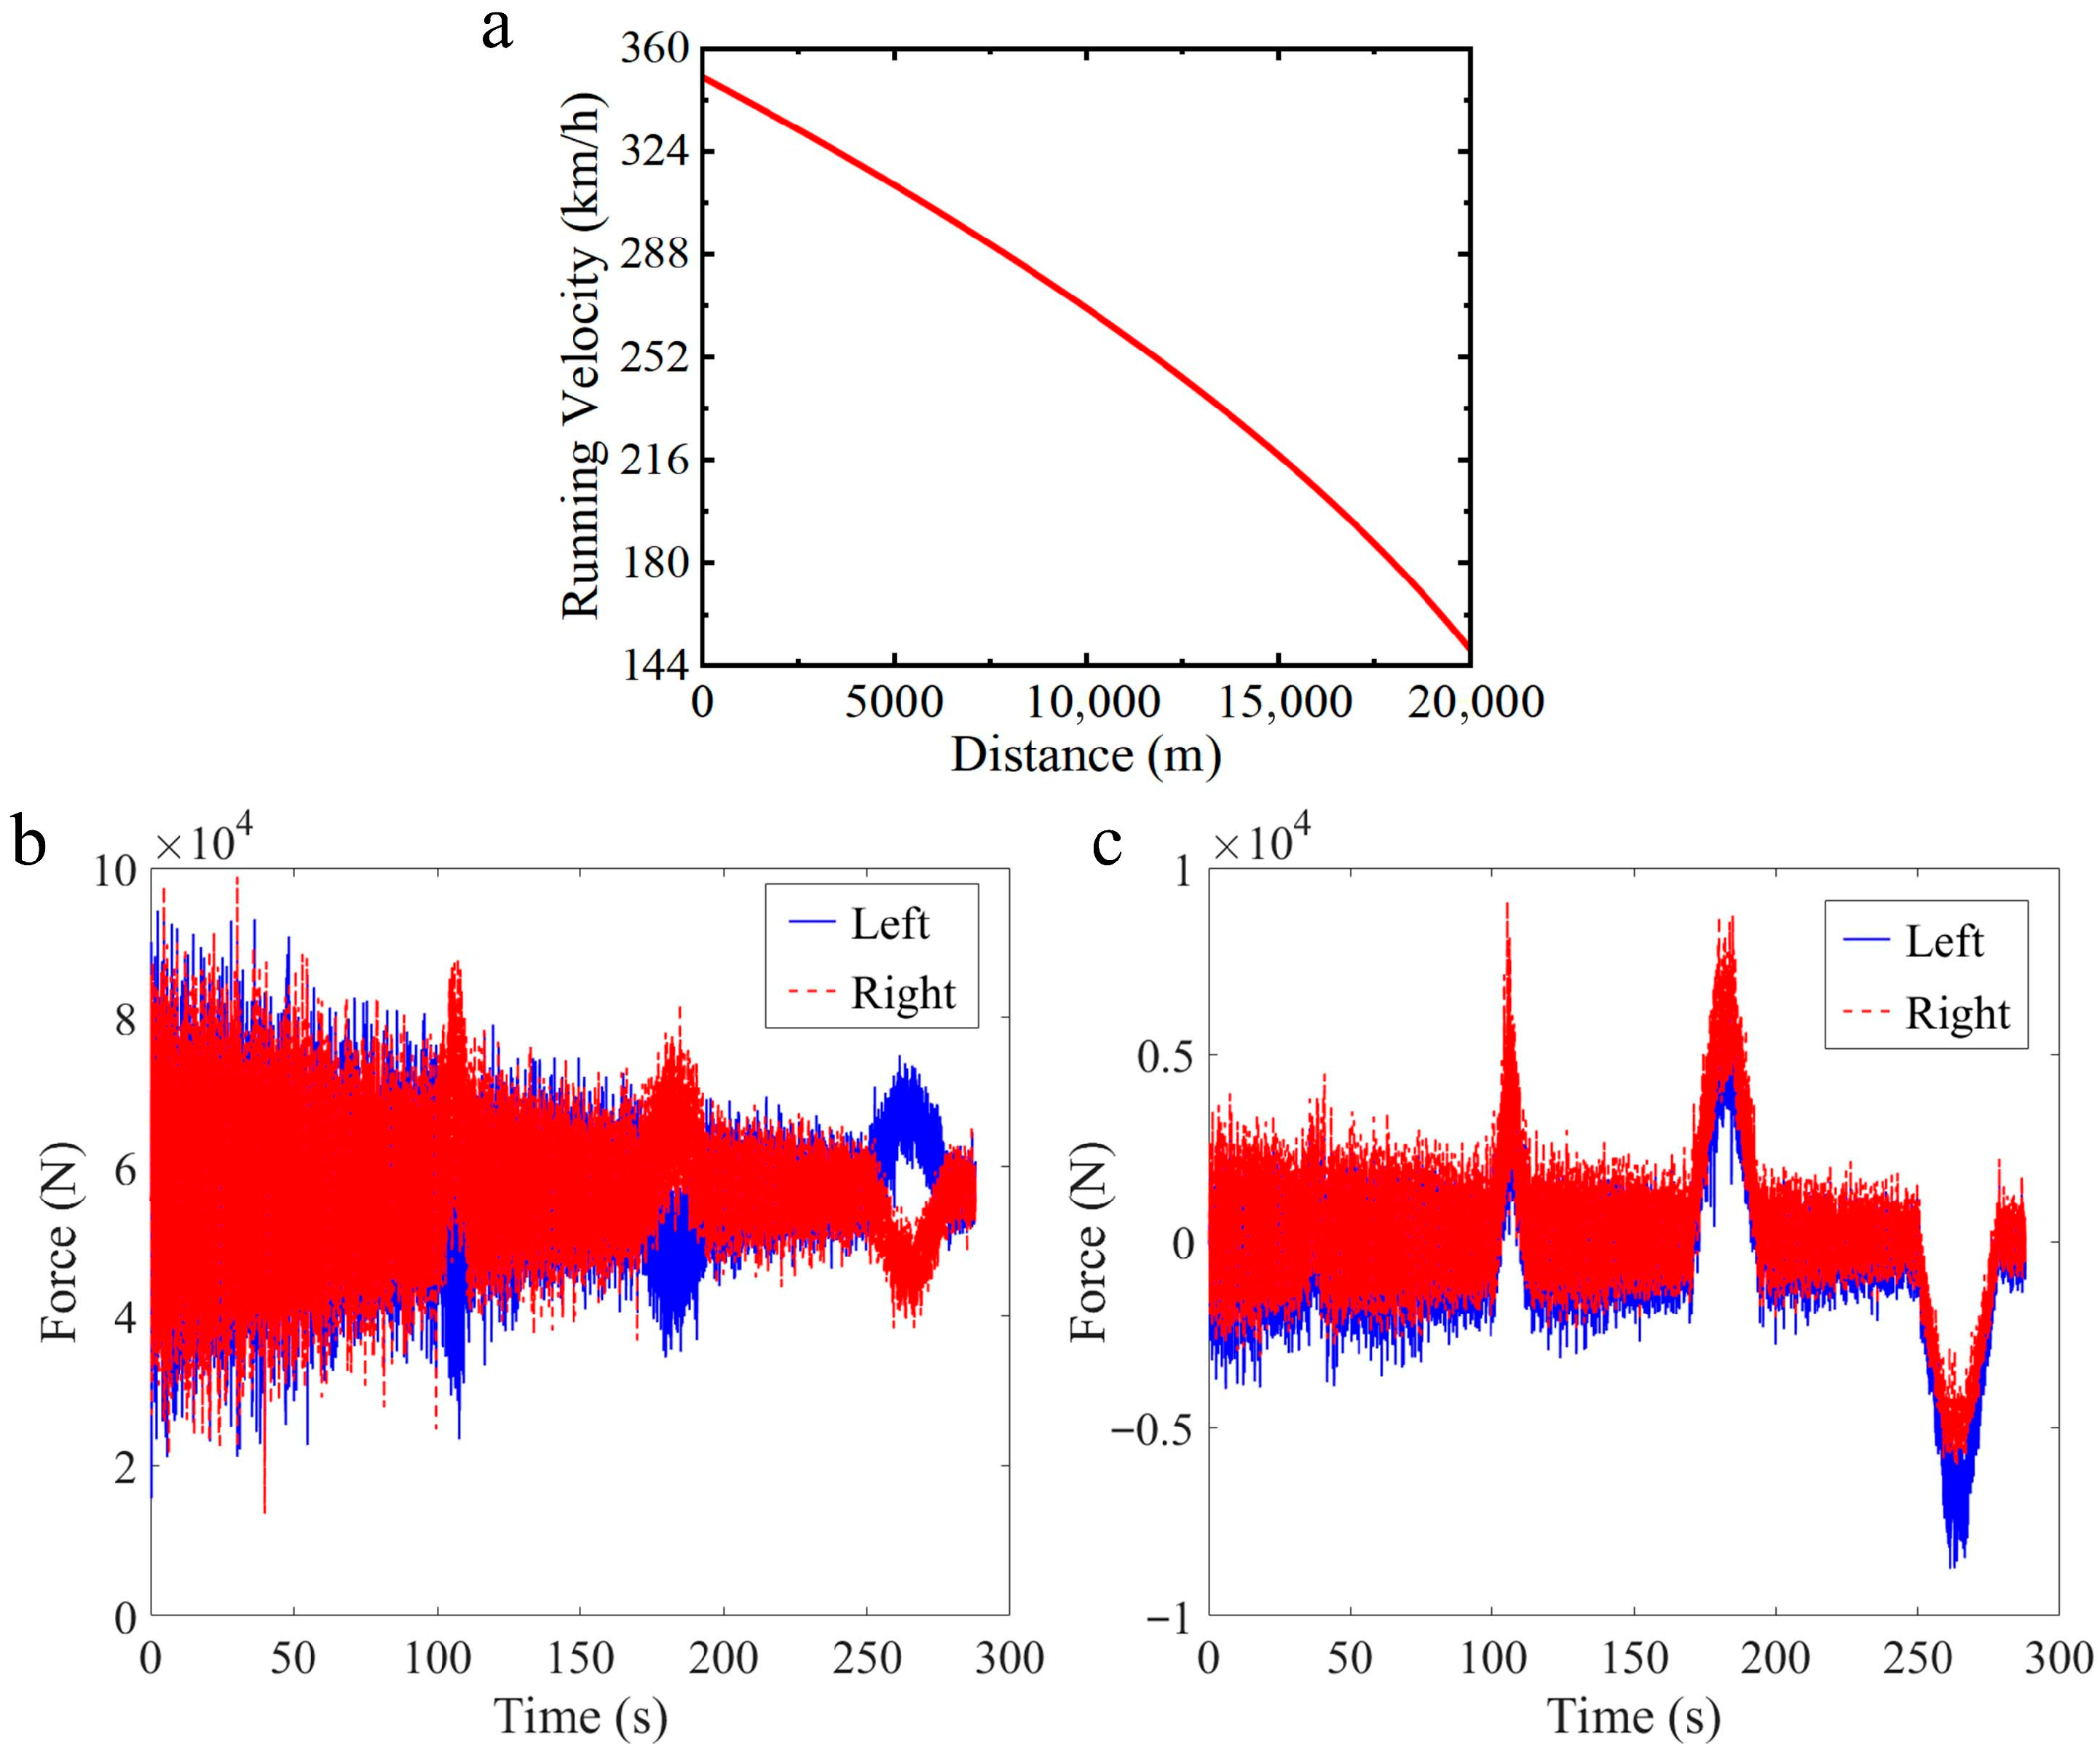
Figure 20 presents the dynamic response during a deceleration from 350 km/h to 150 km/h over 20 km. As speed decreases, both the vertical force and the longitudinal force at the wheel–rail interface decline and remain well balanced between the left and the right sides. The maximum vertical load stays below 150 kN. Three distinct transients appear at 110 s, 180 s, and 260 s, triggered by changes in braking torque that excite a short pitch (“nodding”) motion of the vehicle; the associated fluctuations are bounded and remain within acceptable limits.
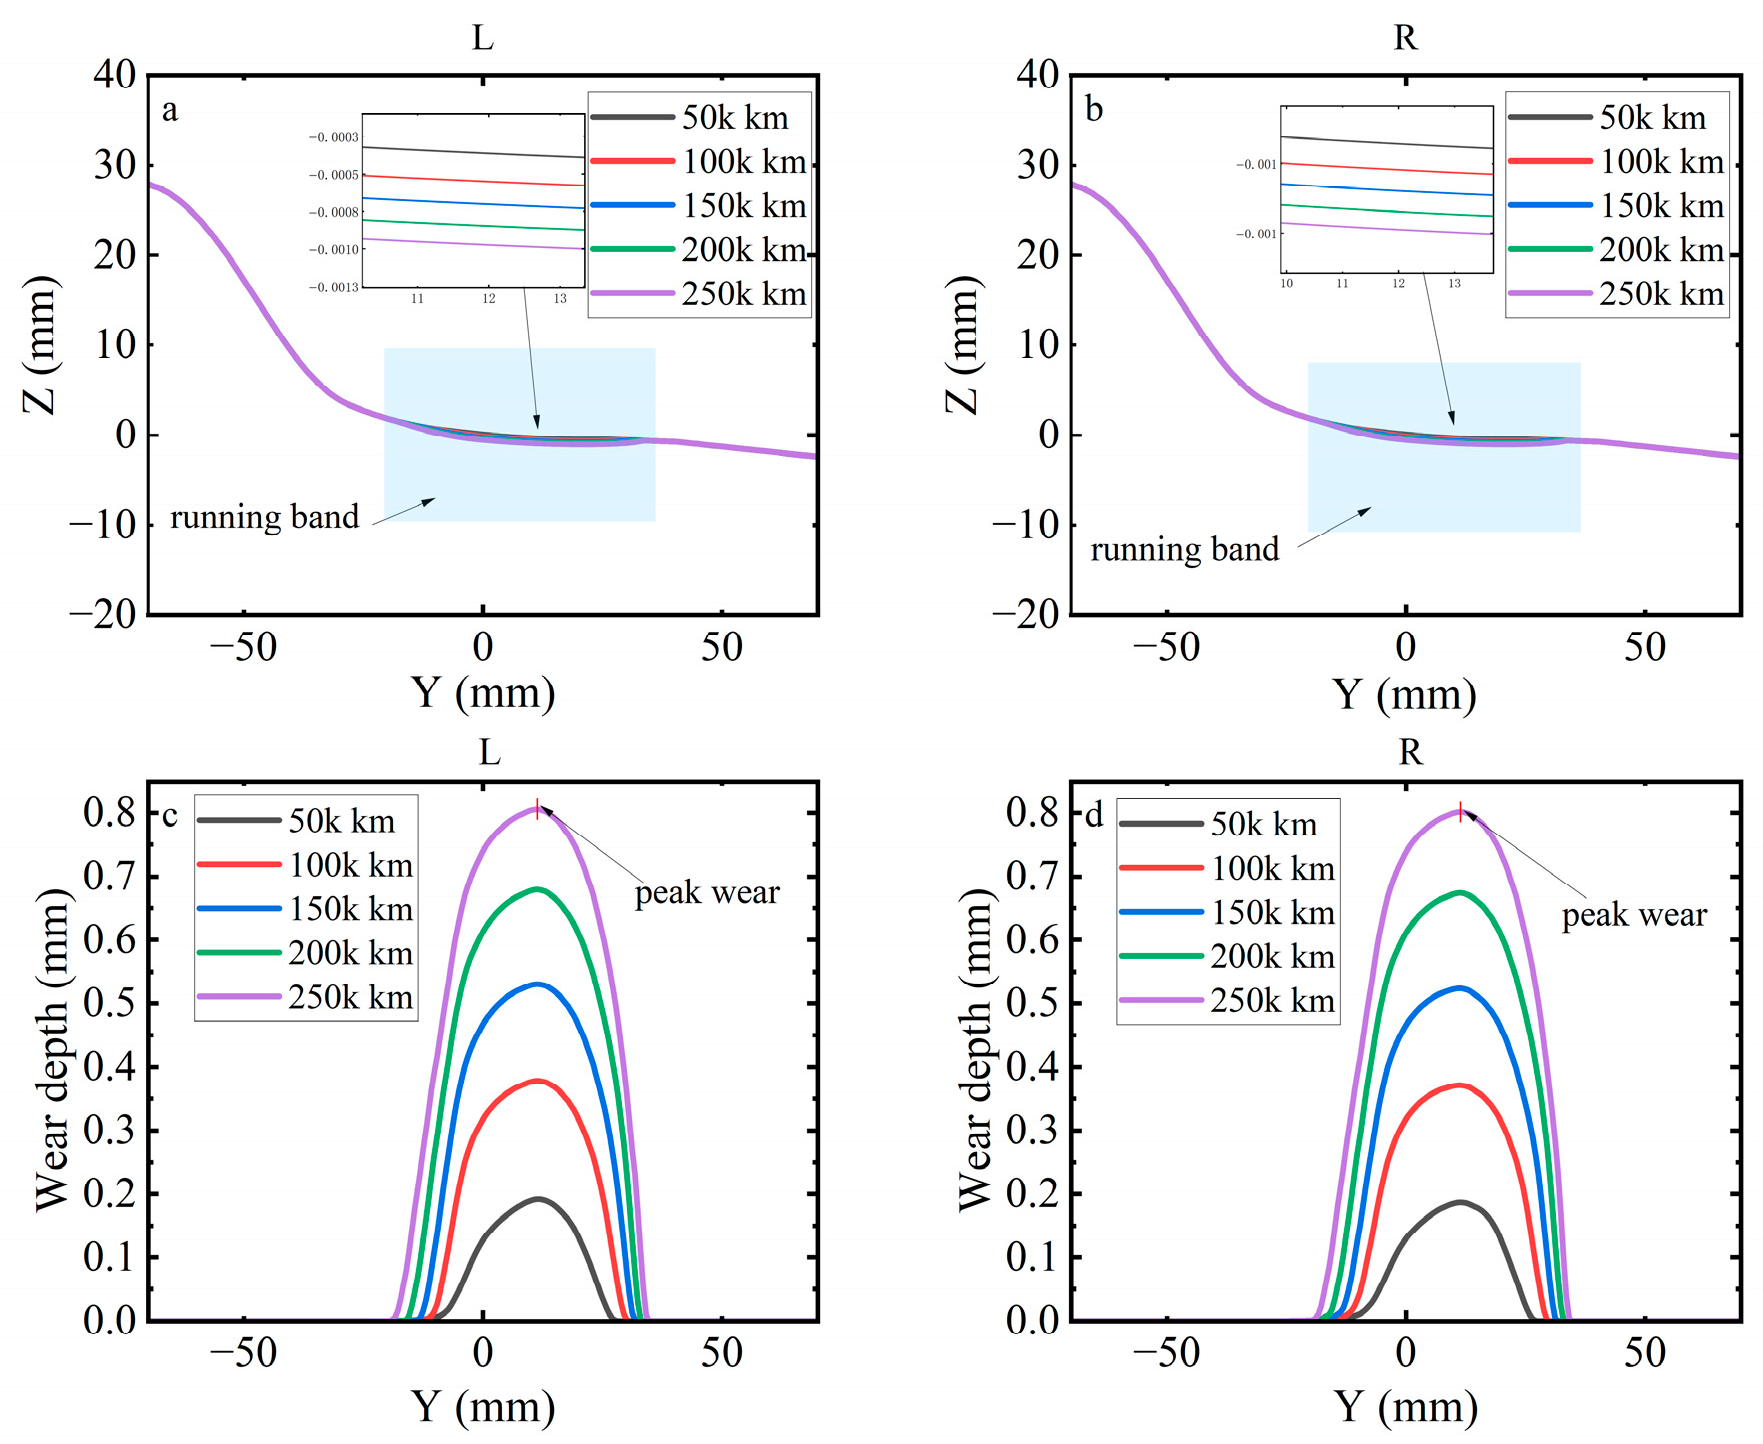
Figure 21 compares the left and right wheel profiles and the corresponding wear depth at 50,000 km intervals over a total distance of 250,000 km under deceleration. Figure 21a,b show progressive material removal on the tread with the recession centred near the rolling circle; the profile evolution is smooth and the left–right curves remain closely aligned, indicating no evident lateral migration of the dominant wear zone. As seen in Figure 21c,d show single-peak wear distributions whose peak magnitude increases monotonically with mileage. The lateral extent of the wear region also expands with distance, while the overall shape of the distribution is preserved. The wheel profiles and wear depth indicate cumulative wear concentrated around the wheel tread with a stable, nearly symmetric evolution between the left and right wheels.
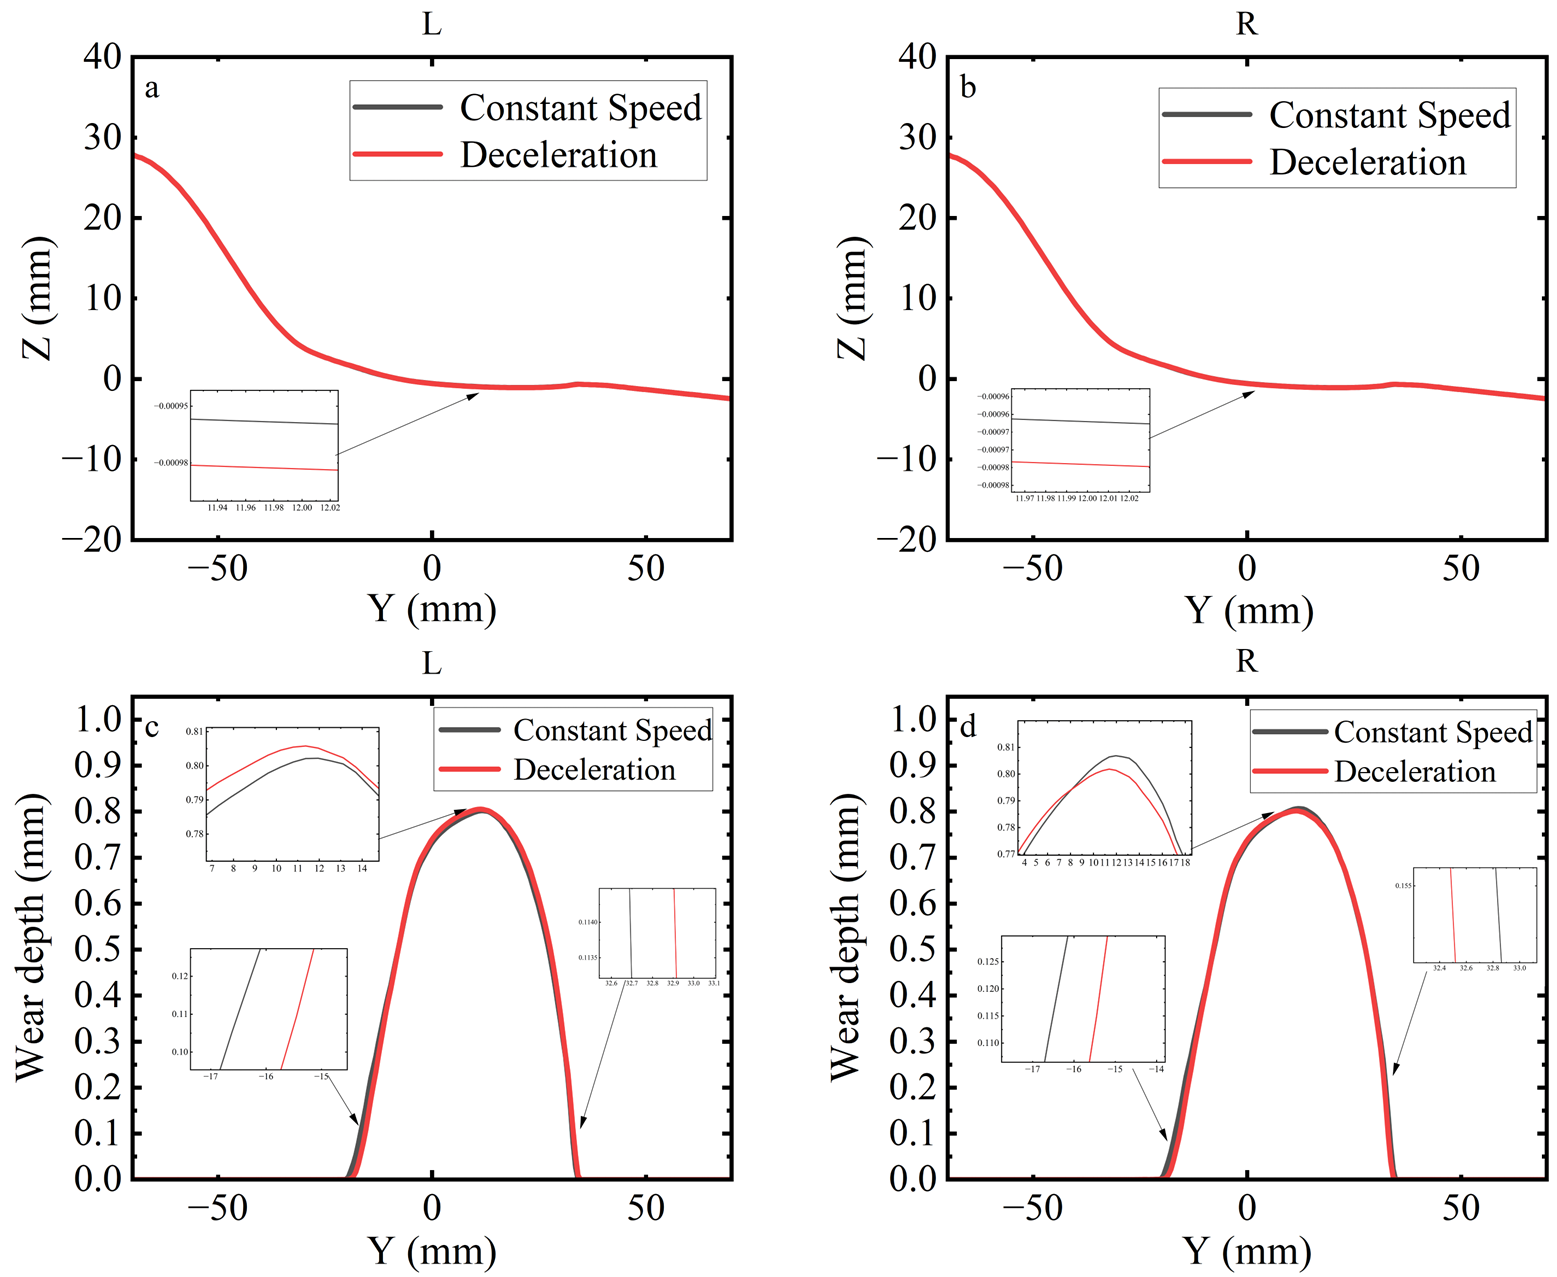
Figure 22 compares wheel profiles and wear depth under constant speed and deceleration. In both cases, the wear peak depth and the lateral extent change only modestly with mileage, and the spatial shape of the wear distribution remains stable within the central running band. Under deceleration, braking forces introduce additional longitudinal creepage at the wheel–rail interface, so the sliding distance exceeds that of near-pure rolling and a slight elevation in peak wear appears early in the run; as speed decreases, normal and longitudinal forces subside, the creepage level falls, and the difference from the constant-speed case narrows while left–right symmetry is maintained. According to the classical Archard wear model:
V = k F N S
Here V is the wear volume, K is the wear coefficient that increases with the slip ratio, F N is the normal load, and S is the slip distance. Even though the wheel–rail forces decrease during deceleration, wear increases naturally due to the higher wear coefficient and longer slip distance. The braking longitudinal force concentrates the wear energy in a main wear zone, resulting in deeper but narrower wear.
The apparent difference between Figure 21b and Figure 22 arises from the wear metric and the spatial sampling. Figure 22 shows the peak wear depth indicator for the constant-speed and deceleration cases and shows a higher peak at constant speed. Figure 21b presents a cross-sectional profile under deceleration where the running band is broader and the recess at the plotted section appears deeper. In other words, constant speed concentrates wear into a narrow band that produces a higher peak value but a smaller cross-sectional hollow, whereas deceleration redistributes wear over a wider band that can look deeper at the show section even though the peak indicator is lower. Minor shifts in the running band and left–right balance during braking further affect the apparent depth at a given lateral position. For a consistent comparison, reveal both the peak wear depth and the integrated wear across the tread, and state the wear width used for each profile update.

3.3.3. Effect of Flexible Wheelsets on Wear Depth

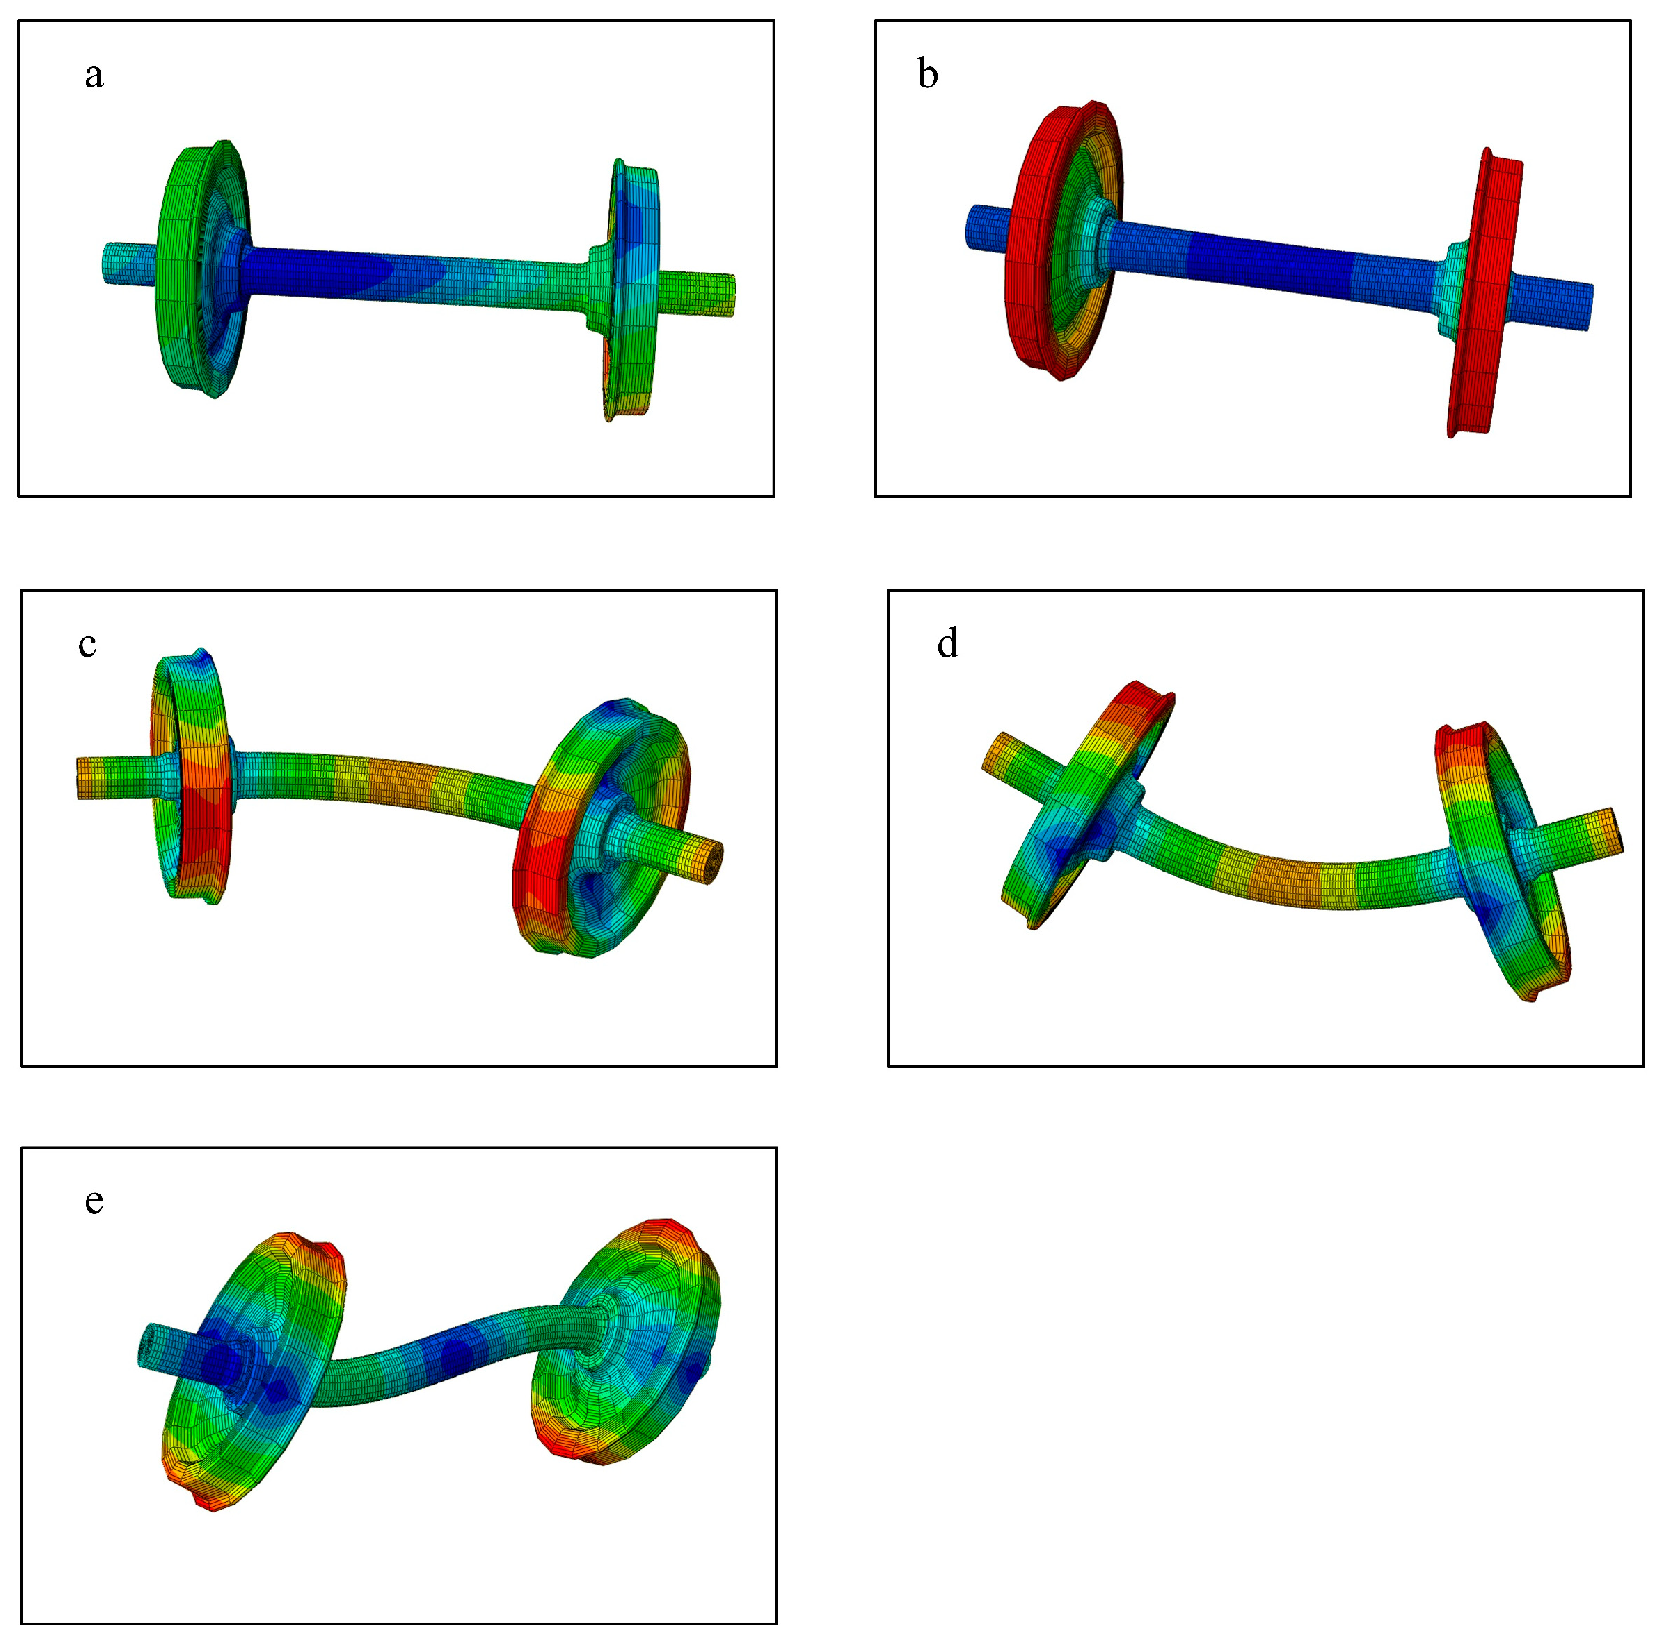
Unless otherwise specified, the wheelset in the main simulations is treated as rigid. In this subsection, a flexible wheelset is adopted for the wear analysis, in which the first six natural modes (including vertical bending, lateral bending, torsional, and axial modes) are incorporated to account for structural elasticity, as illustrated in Figure 23.
The primary vertical damper is replaced by a HERD for the flexible wheelset study. Figure 23 shows that a run of 200,000 km at 350 km/h under the track conditions in Table 3, with wear depth recorded every 50,000 km. The left wheel reaches its maximum wear at a lateral position 11 mm from the tread centre with a depth of 0.610 mm, and the right wheel reaches 0.615 mm. In Figure 24, compared with the rigid wheelset case in Figure 15 at the same distance, where peak wear is 0.675 mm, the flexible design reduces wear peak depth by about 10%.
Figure 24. Wheel profile and wear depth with flexible wheelsets: (a) left wheel profile; (b) right wheel profile; (c) left wheel wear depth; (d) right wheel wear depth.
Lubricants 13 00424 g024
The reduction is consistent with the ability of the flexible wheelset to absorb part of the wheel rail interaction through structural elasticity, which lowers transient contact force and limits tangential slip. With the HERD providing state dependent dissipation in the primary vertical damper, load transfer at excitation events is further suppressed and the contact state remains stable. The combined effect decreases cumulative material removal and extends the interval between reprofiling cycles. Although rigid wheelsets have simpler construction and lower unit cost, and are more prone to deep wear in high-speed long-distance service and therefore require more frequent maintenance.
In our previous work [44], the wheel–rail wear model was validated against field measurements over a full reprofiling cycle: at 90,000 km the measured maximum depths were 0.28 mm (trailer) vs. simulated 0.28 mm (trailer); at 210,000 km the measured values were 0.61 mm (trailer) vs. simulated 0.67 mm (trailer), with deviations within 0.06 mm and the mileage trend correctly reproduced. Using the same validated model here with the primary vertical damper replaced by a HERD, Figure 25 shows wear depth after 50,000, 100,000, 150,000, and 200,000 km, with the primary vertical damper replaced by a HERD (HERD) in both configurations. At each mileage step the flexible wheelset shows a lower peak than the rigid wheelset: 0.180 vs. 0.191 mm at 50,000 km (reduction 0.011 mm, 5.8%), 0.351 vs. 0.375 mm at 100,000 km (reduction 0.024 mm, 6.4%), 0.481 vs. 0.526 mm at 150,000 km (reduction 0.045 mm, 8.6%), and 0.615 vs. 0.675 mm at 200,000 km (reduction 0.060 mm, 8.9%). The interval degradation of the peak wear depth is also lower for the flexible wheel (0.171, 0.130, 0.134 mm per 50,000 km; average 0.145 mm per 50,000 km) than for the rigid design (0.184, 0.151, 0.149 mm; average 0.161 mm per 50,000 km).
Consistent with the previous validation in [44], the present predictions show good agreement with measurement: converting peak depth to a rate gives 3.51 × 10⁻⁶ mm/km at 100,000 km and 3.08 × 10⁻⁶ mm/km at 200,000 km, compared with 3.11 × 10⁻⁶ mm/km at 90,000 km and 2.91 × 10⁻⁶ mm/km at 210,000 km reported from experimental data, with deviations of +12.9% and +5.8%. The rates lie within the measured envelope and follow the same near linear mileage trend. The proposed HERD in this study is significant because the electrical load sets hydraulic back pressure and the effective damping, which improves representation of suspension dynamics and contact creepages; the resulting wear degradation rates align closely with measurement, strengthening model accuracy and increasing confidence in digital twin calibration and engineering assessments for wear control.
Overall, the HERD introduces a controllable dissipation parameter through the electrical load that sets hydraulic back pressure and the effective force–velocity characteristic. Adjusting this parameter aligns simulated axlebox forces, creepages, and peak wear with measurement, improving model accuracy and providing a practical calibration handle for rigid wheelset models. In a digital twin or on train model updating setting, the same control variable includes routine data assimilation and inverse identification of wear coefficients and contact parameters, which increases predictive credibility and improves forecasts for reprofiling intervals and maintenance windows. From an operational standpoint, pairing HERD with a flexible wheelset produces a measurable reduction in peak wear and slows its progression with distance, supporting longer intervals between reprofiling. A rigid wheelset remains viable for simplicity and cost, but it requires tighter HERD load setting and more frequent tread restoration to keep contact stresses and wear within target limits.
The wear predictions in this study are based on the Archard formulation with a pressure–velocity dependent coefficient map. While this approach is widely adopted, the results are inherently sensitive to tribological parameters such as the wear coefficient, material hardness, and environmental conditions. The dimensionless wear coefficient k reported for pearlitic wheel steels spans approximately 10−5–10−3 depending on lubrication state, surface contamination, and environmental humidity. Since wear depth scales linearly with k , this variability could alter the absolute predictions by one to two orders of magnitude. The hardness H of wheel steel typically ranges between 200 and 400 HV, and Archard’s law implies an inverse relationship between hardness and wear rate; a 20% increase in hardness from work hardening would directly reduce wear depth by a similar fraction, while thermal softening would have the opposite effect. Environmental factors further modify the effective wear rate: water or oil contamination lowers the friction coefficient and may shift operating points into lower-wear regions of the coefficient map, whereas sand or metallic debris can increase abrasive action and elevate the effective k .
Although the absolute wear magnitude is sensitive to these uncertainties, the comparative results between the HERD and the conventional damper remain robust. Both systems are affected in proportion to the assumed tribological parameters, so the relative reduction in peak wear depth with HERD is preserved across plausible ranges. Therefore, the present modelling framework provides reliable trends for evaluating the influence of suspension design on long-term wheel degradation, even though precise field calibration of wear coefficients and hardness evolution would further improve quantitative accuracy.

4. Conclusions

A physics-based vehicle–track coupled dynamics model configured with a hydraulic electromechanical regenerative damper (HERD) was developed to quantify power regeneration and wear depth under service-representative inputs. In the simulation experiment, the electrical load was 25 ohms, across 150 to 380 km/h, recovery efficiency remained about 49–50 percent with weak sensitivity to curve radius. At different radii ranging from 3 to 12 km and at different distances ranging from 50,000 to 250,000 km, the recovery power was more similar, at 49.93–49.94% and 49.95%, respectively. It showed relatively weak sensitivity to the changes in curve radius and distance. Instantaneous regenerative power exceeded 425 W at high excitation. The wear depth model previously validated against field measurement was used without retuning and reproduced measured magnitudes and trends in wear degradation rate, showing 3.51 × 10⁻⁶ mm/km at 100,000 km and 3.08 × 10⁻⁶ mm/km at 200,000 km, close to measured 3.11 × 10⁻⁶ and 2.91 × 10⁻⁶ mm/km.
As summarised in Table 5, HERD consistently outperforms the conventional damper under identical conditions, achieving higher regeneration efficiency (≈49.9% vs. 45.3%) and slightly reducing cumulative wheel wear. This baseline comparison confirms that HERD enhances both energy recovery and wear resistance in long-term service.
Replacing the primary vertical damper with the HERD reduced wheel tread wear and combining it with flexible wheelsets produced a stronger benefit. Peak wheel wear depths for the flexible case were 0.180, 0.351, 0.481, and 0.615 mm at 50,000, 100,000, 150,000, and 200,000 km, compared with 0.191, 0.375, 0.526, and 0.675 mm for the rigid case, corresponding to reductions of 5.8–8.9% and a lower average wear degradation per 50,000 km (0.145 mm vs. 0.161 mm). Under defect excitations, the wheel flat keeps wear elevated while the defect remains, while a second-order polygon sustained modulation without a divergent long-range peak; during braking, wear remained centred with no lateral migration.
The electrical load of the HERD serves as a physically grounded tuning parameter that sets hydraulic pressure and the effective damping force–velocity characteristic. Adjusting this parameter brings simulated axlebox forces, creepages, and wear depths into good agreement with measurement and improves digital-twin calibration for design and maintenance planning in high-speed service.
It should be noted that the present validation of both HERD power regeneration and wheel–rail wear relies primarily on published experimental data rather than new measurements obtained by the authors. While this approach ensures consistency with well-established benchmarks in the literature, it inevitably limits the independence and completeness of validation. In future work, we plan to conduct subsystem- or component-level experiments, such as bench tests of the hydraulic–electromechanical damper and controlled wear measurements under representative loading conditions. These experiments will provide direct datasets for model calibration and validation, thereby strengthening the reliability of the predictive framework. The scope of this study is limited by several modelling assumptions, such as neglecting thermal effects on friction and long-term roughness evolution, which should be addressed in future work.

Author Contributions

Conceptualization, Z.H. and R.W.; methodology, R.W.; software, Z.H.; validation, Z.H., T.S. and R.W.; formal analysis, Z.H.; investigation, T.S.; resources, H.L.; data curation, Z.H.; writing—original draft preparation, Z.H.; writing—review and editing, R.W.; visualization, Z.Y.; supervision, R.W.; project administration, Z.Y.; funding acquisition, R.W. All authors have read and agreed to the published version of the manuscript.

Funding

This research was funded by Major Technology Research and Development Program of Hebei Provincial Department of Science and Technology (24292201Z), Hebei Province’s Full-time Recruitment of High-level Talent Research Project (2024HBQZYCXY014), Hebei Province Yanzhao Golden Terrace Talent Attraction Program for Outstanding Talents (A2024004) and Hebei Provincial Natural Science Foundation (A2023210026).

Data Availability Statement

Data will be made available on request.

Conflicts of Interest

The authors declare no conflicts of interest.

References

  1. Alhumaid, S.; Hess, D.; Guldiken, R. A Noncontact Magneto–Piezo Harvester-Based Vehicle Regenerative Suspension System: An Experimental Study. Energies 2022, 15, 4476. [Google Scholar] [CrossRef]
  2. Alhumaid, S.; Hess, D.; Guldiken, R. Energy Regeneration from Vehicle Unidirectional Suspension System by a Non-Contact Piezo-Magneto Harvester. Eng. Res. Express 2021, 3, 015033. [Google Scholar] [CrossRef]
  3. Shi, X.; Yu, Q.; Wu, Z.; Li, J.-Y.; Zhu, S. Active Control for Vehicle Suspension Using a Self-Powered Dual-Function Active Electromagnetic Damper. J. Sound Vib. 2024, 569, 117976. [Google Scholar] [CrossRef]
  4. Xie, Y.; Tan, B.; Liu, J.; Li, H.; Tan, X. Research on Switchable Energy-Regenerative Suspension System. In SAE Technical Paper Series; SAE International: Warrendale, PA, USA.
  5. Dong, L.; Yang, F.; He, A.; Guo, Z.; Yu, J.; Zuo, J. Investigation on Energy-Regenerative Shock Absorber with Adjustable Damping and Power for Freight Wagons. Energy Convers. Manag. 2022, 254, 115228. [Google Scholar] [CrossRef]
  6. Dong, L.; Zhang, H.; Yu, J.; Hu, G. Energy Harvesting Potential Assessment and Systematic Design for Energy-Regenerative Shock Absorbers on Railway Freight Wagons. J. Intell. Mater. Syst. Struct. 2024, 35, 270–290. [Google Scholar] [CrossRef]
  7. Kopylov, S.; Chen, Z.; Abdelkareem, M.A.A. Implementation of an Electromagnetic Regenerative Tuned Mass Damper in a Vehicle Suspension System. IEEE Access 2020, 8, 110153–110163. [Google Scholar] [CrossRef]
  8. Pan, Y.; Liu, F.; Jiang, R.; Tu, Z.; Zuo, L. Modeling and Onboard Test of an Electromagnetic Energy Harvester for Railway Cars. Appl. Energy 2019, 250, 568–581. [Google Scholar] [CrossRef]
  9. Zhang, W.; Wang, G.; Guo, Y. Research on Damping and Energy Recovery Characteristics of a Novel Mechanical-Electrical-Hydraulic Regenerative Suspension System. Energy 2023, 271, 127022. [Google Scholar] [CrossRef]
  10. Liu, P.; Kou, F.; Chen, Y.; Wang, G.; Lv, W.; Xing, L. A Novel Hybrid Electromagnetic-Hydraulically Interconnected Actuator Suspension: Dynamic Modeling, Bench Test and Ride Analysis. Mech. Syst. Signal Process. 2025, 236, 113028. [Google Scholar] [CrossRef]
  11. Zhang, M.; Hu, C.; Gao, J.; Zheng, P. Modelling, Validation and Parameter Sensitivity of Regenerative Hydraulic-Electric Shock Absorber. Eng. Comput. 2022, 39, 1348–1373. [Google Scholar] [CrossRef]
  12. Galluzzi, R.; Tonoli, A.; Amati, N.; Curcuruto, G.; Conti, P.; Greco, G.; Nepote, A. Regenerative Shock Absorbers and the Role of the Motion Rectifier. In Proceedings of the SAE 2016 World Congress and Exhibition, Detroit, MI, USA, 12–14 April 2016. [Google Scholar]
  13. Guo, S.; Xu, L.; Liu, Y.; Guo, X.; Zuo, L. Modeling and Experiments of a Hydraulic Electromagnetic Energy-Harvesting Shock Absorber. IEEE ASME Trans. Mechatron. 2017, 22, 2684–2694. [Google Scholar] [CrossRef]
  14. Zhang, Y.; Zhang, X.; Zhan, M.; Guo, K.; Zhao, F.; Liu, Z. Study on a Novel Hydraulic Pumping Regenerative Suspension for Vehicles. J. Frankl. Inst. 2015, 352, 485–499. [Google Scholar] [CrossRef]
  15. Du, L.; Chen, X. Design of a Novel Electro-Hydraulic Energy-Recovery Shock Absorber for Vehicles. J. Machinery 2018, 56, 647. [Google Scholar]
  16. Demetgul, M.; Guney, I. Design of the Hybrid Regenerative Shock Absorber and Energy Harvesting from Linear Movement. J. Clean Energy Technol. 2017, 5, 81–84. [Google Scholar] [CrossRef]
  17. Cai, Q.; Hua, Y.; Zhu, S. Energy-Harvesting Adaptive Vibration Damping in High-Speed Train Suspension Using Electromagnetic Dampers. Int. J. Struct. Stab. Dyn. 2021, 21, 2140002. [Google Scholar] [CrossRef]
  18. Deubel, C.; Schneider, S.J.; Prokop, G. Effect of Shock Absorber Friction on Vehicle Vertical Dynamics. SAE Int. J. Veh. Dyn. Stab. NVH 2024, 8, 155–177. [Google Scholar] [CrossRef]
  19. Wang, R.; Wang, Z. Evaluation of Power Regeneration in Primary Suspension for a Railway Vehicle. Front. Mech. Eng. 2020, 15, 265–278. [Google Scholar] [CrossRef]
  20. Hua, Y.; Cai, Q.; Zhu, S. Energy-Regenerative Semiactive Lateral Suspension Control in High-Speed Trains Using Electromagnetic. IEEE Trans. Veh. Technol. 2022, 71, 4801–4812. [Google Scholar] [CrossRef]
  21. Isacchi, G.; Ripamonti, F. A Robust and Fail-Safe Semi-Active Vertical Damper to Improve Ride Comfort. Veh. Syst. Dyn. 2024, 1–23. [Google Scholar] [CrossRef]
  22. Zhang, B.; Luo, M.; Tan, C.A. Ride Comfort and Energy Harvesting of Inflatable Hydraulic-Electric Regenerative Suspension System for Heavy-Duty Vehicles. J. Mech. Sci. Technol. 2024, 38, 2277–2289. [Google Scholar] [CrossRef]
  23. Sang, H.; Zeng, J.; Wang, Q.; Huang, C.; Mu, J.; Qi, Y.; Kang, W.; Liang, Y. Theoretical Study on Wheel Wear Mechanism of High-Speed Train under Different Braking Modes. Wear 2024, 540–541, 205262. [Google Scholar] [CrossRef]
  24. Sang, H.; Zeng, J.; Qi, Y.; Mu, J.; Gan, F. Study on Wheel Wear Mechanism of High-Speed Train in Accelerating Conditions. Wear 2023, 516–517, 204597. [Google Scholar] [CrossRef]
  25. Song, R.; Lu, C.; Sun, L.; Zhang, Z.; Chen, D.; Shen, G. Analysis of Wheel Wear and Wheel-Rail Dynamic Characteristics of High-Speed Trains under Braking Conditions. Shock Vib. 2024, 2024, 9618500. [Google Scholar] [CrossRef]
  26. Liu, B.; Bruni, S.; Lewis, R. Numerical Calculation of Wear in Rolling Contact Based on the Archard Equation: Effect of Contact Parameters and Consideration of Uncertainties. Wear 2022, 490–491, 204188. [Google Scholar] [CrossRef]
  27. Zhu, A.; Zhu, A.; Ma, C.; Yang, J.; Hou, X.; Li, H.; Sun, P. The Effect of High-Speed Train Meet on Wheel Wear at Different Speeds. Ind. Lubr. Tribol. 2021, 73, 1019–1027. [Google Scholar] [CrossRef]
  28. Luo, R.; Shi, H.; Teng, W.; Song, C. Prediction of Wheel Profile Wear and Vehicle Dynamics Evolution Considering Stochastic Parameters for High-Speed Train. Wear 2017, 392–393, 126–138. [Google Scholar] [CrossRef]
  29. Wang, S.; Guo, H.; Zhang, S.; Barton, D.; Brooks, P. Analysis and Prediction of Double-Carriage Train Wheel Wear Based on SIMPACK and Neural Networks. Adv. Mech. Eng. 2022, 14, 16878132221078491. [Google Scholar] [CrossRef]
  30. Myśliński, A.; Chudzikiewicz, A. Power Dissipation and Wear Modeling in Wheel–Rail Contact. Appl. Sci. 2023, 14, 165. [Google Scholar] [CrossRef]
  31. Apezetxea, I.S.; Perez, X.; Alonso, A. Experimental Validation of a Fast Wheel Wear Prediction Model. Wear 2021, 486–487, 204090. [Google Scholar] [CrossRef]
  32. Hao, K.; Yang, W.; Zhang, D.; Pei, X.; Wang, C.; Xi, Y. Research on Wheel Wear Simulation and Wheel-Rail Contact Relationship of Heavy-Haul Freight Wagon. Int. J. Mechatron. Appl. Mech. 2024, 18, 33–43. [Google Scholar] [CrossRef]
  33. Liu, X.; Song, Y. Research on the Influence of Wheel Polygons on Vehicle Dynamics Performance. In Proceedings of the Seventh International Conference on Traffic Engineering and Transportation System (ICTETS 2023), Chongqing, China, 22–24 September 2023; SPIE: Dalian, China, 2024; p. 187. [Google Scholar]
  34. Fang, S.; Feng, J. Research on the Prediction of Polygonal Wear of Metro Wheels. In Proceedings of the Eighth International Conference on Traffic Engineering and Transportation System (ICTETS 2024), Dalian, China, 20–22 September 2024; SPIE: Dalian, China, 2024; p. 174. [Google Scholar]
  35. Xu, Z.; Li, X.; He, X.; Wang, Z.; Ma, J.; Fan, H. Impact of Wheel Polygonization on Vehicle Vibration and Wheel-Rail Interaction Forces. Noise Vib. Worldw. 2025, 09574565251359155. [Google Scholar] [CrossRef]
  36. Shi, J. Study on the Influence of Wheel Flat Scar on the Dynamic Performance of Metro Vehicles. Smart Rail Transit. 2024, 64. [Google Scholar] [CrossRef]
  37. Castro-Orgaz, O.; Chanson, H. Bernoulli Theorem, Minimum Specific Energy, and Water Wave Celerity in Open-Channel Flow. J. Irrig. Drain. Eng. 2009, 135, 773–778. [Google Scholar] [CrossRef]
  38. Henry Darcy and the Making of a Law—Brown—2002—Water Resources Research—Wiley Online Library. Available online: https://agupubs.onlinelibrary.wiley.com/doi/10.1029/2001WR000727 (accessed on 16 September 2025).
  39. Li, W.; An, G. Application of Kirchhoff’s Voltage Law in Circuit Analysis. J. Electron. Sci. Technol. 2013, 26, 136–138. [Google Scholar] [CrossRef]
  40. Wang, R.; Gu, F.; Cattley, R.; Ball, A.D. Modelling, Testing and Analysis of a Regenerative Hydraulic Damper System. Energies 2016, 9, 386. [Google Scholar] [CrossRef]
  41. Wang, H.; Zhang, X.; Wang, R.; Feng, G. A Simulation Approach for Analysis of the Regenerative Potential of High-Speed Train Suspensions. Energies 2024, 17, 3496. [Google Scholar] [CrossRef]
  42. Enblom, R. Deterioration Mechanisms in the Wheel–Rail Interface with Focus on Wear Prediction: A Literature Review. Veh. Syst. Dyn. 2009, 47, 661–700. [Google Scholar] [CrossRef]
  43. Krause, H.; Poll, G. Wear of Wheel-Rail Surfaces. Wear 1986, 113, 103–122. [Google Scholar] [CrossRef]
  44. Wang, Z.; Wang, R.; Crosbee, D.; Allen, P.; Ye, Y.; Zhang, W. Wheel wear analysis of motor and unpowered car of a high-speed train. Wear 2020, 444–445, 203126. [Google Scholar]
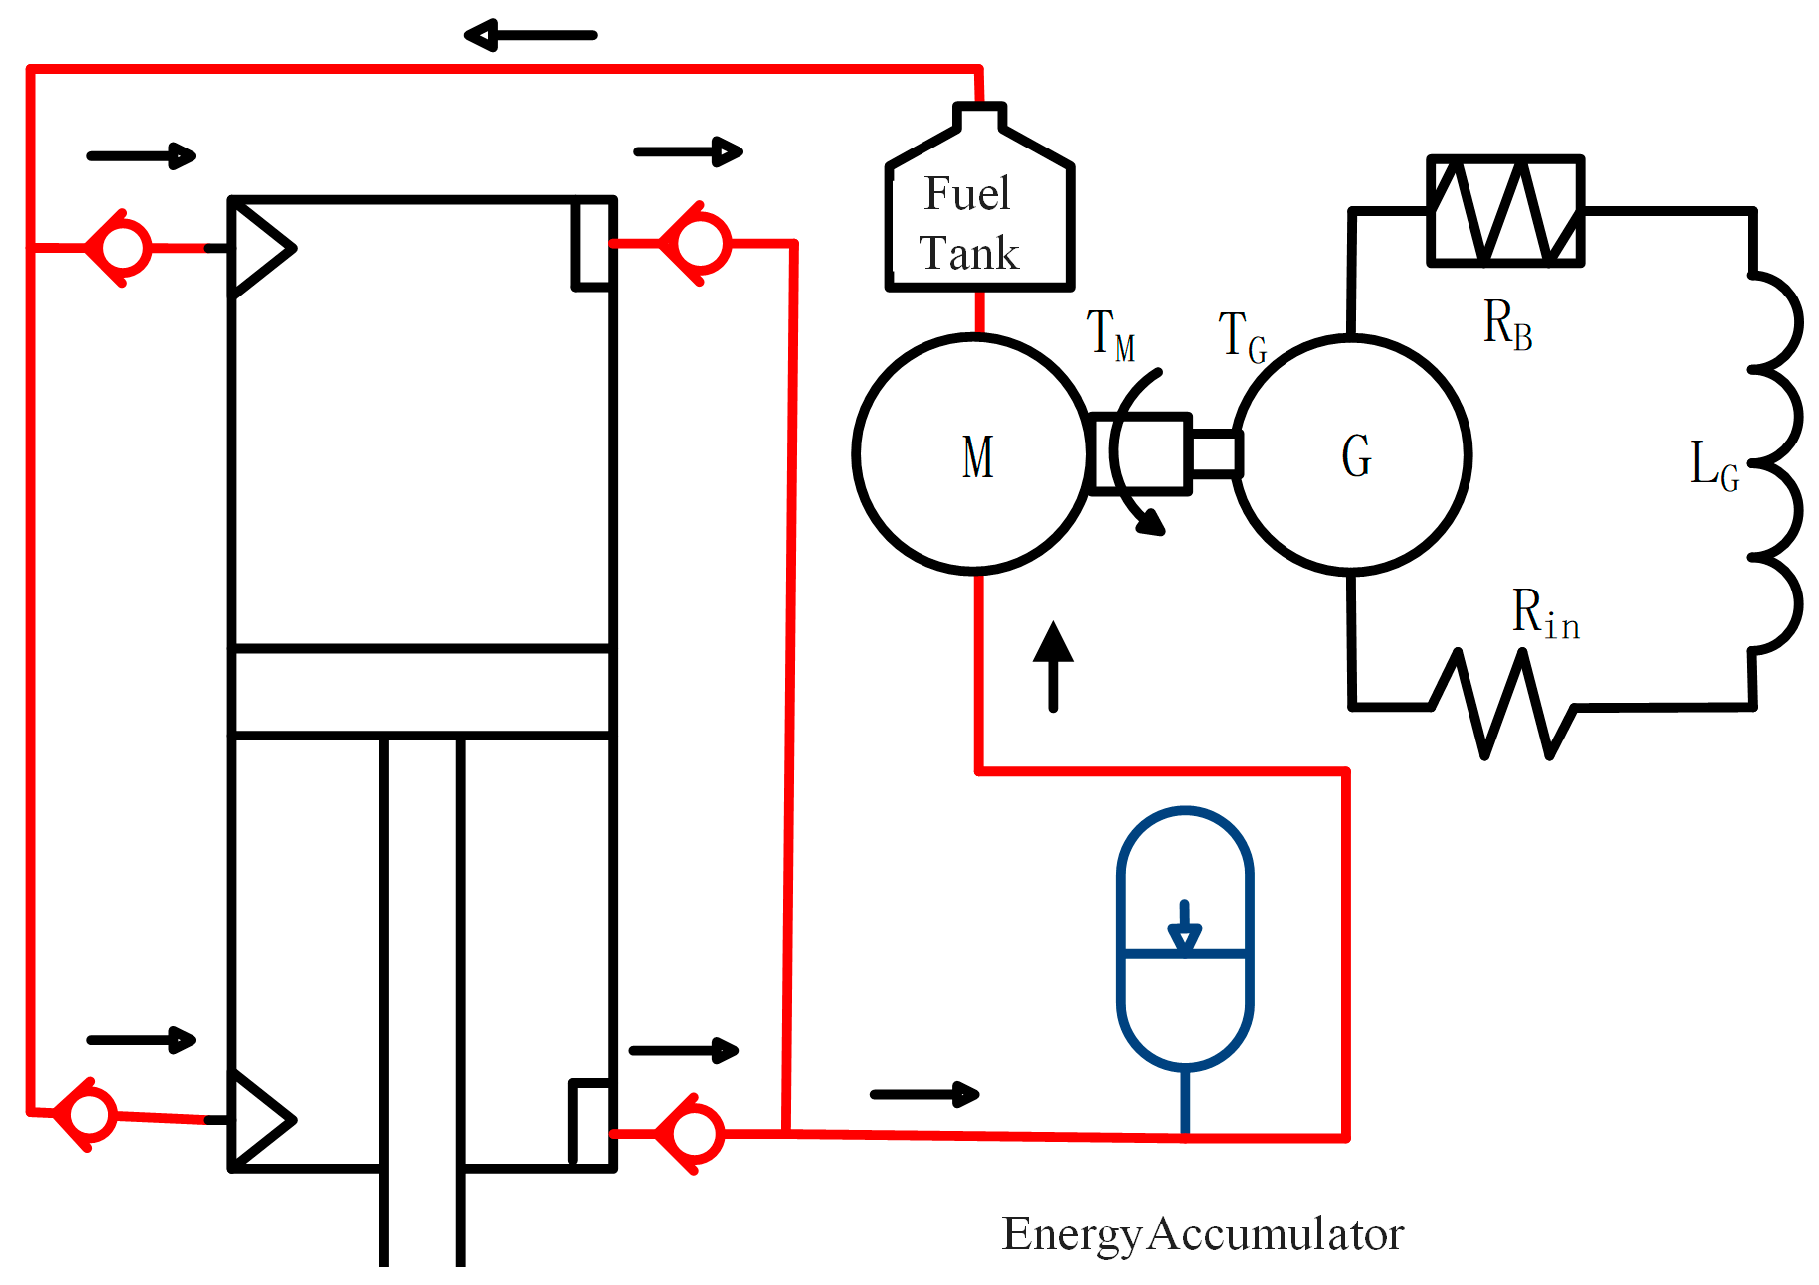
Figure 1. The schematic diagram of HERD.
Lubricants 13 00424 g001
Figure 2. MATLAB/Simscape model of the hydraulic electromechanical regenerative damper (HERD).
Lubricants 13 00424 g002
Figure 3. Schematic of flow through a thin-walled orifice.
Lubricants 13 00424 g003
Figure 4. The structural diagram of an energy accumulator.
Lubricants 13 00424 g004
Figure 5. Force diagram of the hydraulic cylinder showing damping forces on the piston.
Lubricants 13 00424 g005
Figure 6. Topology of the vehicle coupling and power transmission damping system.
Lubricants 13 00424 g006
Figure 7. Co-simulation model overview.
Lubricants 13 00424 g007
Figure 8. Representative track irregularity (Wuhan–Guangzhou line).
Lubricants 13 00424 g008
Figure 9. Effect of load resistance on HERD characteristics: (a) Force–displacement loops; (b) Force-Velocity curves.
Lubricants 13 00424 g009
Figure 10. Comparative force–velocity curves of the HERD and a conventional damper.
Lubricants 13 00424 g010
Figure 11. Instantaneous output power and average input and output power with efficiency for the HERD: (a,b) different speeds; (c,d) curve radius; (e,f) running mileage.
Lubricants 13 00424 g011
Figure 12. Average hydraulic input power, average electrical output power, and recovery efficiency per wheelset: (a) left wheel versus speed; (b) right wheel versus speed; (c) left wheel versus curve radius; (d) right wheel versus curve radius; (e) left wheel versus running mileage; (f) right wheel versus running mileage.
Lubricants 13 00424 g012
Figure 13. Wear coefficient map for the Archard model as a function of contact pressure and relative sliding velocity.
Lubricants 13 00424 g013
Figure 14. Schematic of the wear depth prediction procedure.
Lubricants 13 00424 g014
Figure 15. Wheel profiles and wear depth under nominal (regular) operating conditions: (a) left wheel profile; (b) right wheel profile; (c) left wheel wear depth; (d) right wheel wear depth.
Lubricants 13 00424 g015
Figure 16. Wheel profiles and wear depth with a 60 mm flat: (a) left wheel profile; (b) right wheel profile; (c) left wheel wear depth; (d) right wheel wear depth.
Lubricants 13 00424 g016
Figure 17. Wheel profiles and wear depth with a second order polygonal tread: (a) left wheel profile; (b) right wheel profile; (c) left wheel wear depth; (d) right wheel wear depth.
Lubricants 13 00424 g017
Figure 18. Wear depth at 50,000 km intervals under different excitations for the regenerative damper and the conventional damper: (a) 50,000 km; (b) 100,000 km; (c) 150,000 km; (d) 200,000 km; (e) 250,000 km.
Lubricants 13 00424 g018
Figure 19. Wear number over a 100 s run at 350 km/h: (a) nominal left wheel versus scarred left wheel; (b) nominal right wheel versus scarred right wheel; (c) nominal left wheel versus polygonal left wheel; (d) nominal right wheel versus polygonal right wheel.
Lubricants 13 00424 g019
Figure 20. The dynamic performance during deceleration from 350 km/h to 150 km/h over 20 km: (a) Velocity-displacement curve; (b) Vertical wheel-rail force; (c) Longitudinal wheel-rail force.
Lubricants 13 00424 g020
Figure 21. Wheel profile and wear depth under deceleration: (a) left wheel tread profile at 50,000 km intervals up to 250,000 km; (b) right wheel tread profile at 50,000 km intervals up to 250,000 km; (c) left wheel wear depth across the tread; (d) right wheel wear depth across the tread.
Lubricants 13 00424 g021
Figure 22. Wheel profile and wear depth under constant speed and deceleration: (a) left wheel profile; (b) right wheel profile; (c) left wheel wear depth; (d) right wheel wear depth.
Lubricants 13 00424 g022
Figure 23. Modal shapes of the flexible wheelset for modes 0–4: (a) 0th mode, (b) 1st mode, (c) 2nd mode, (d) 3rd mode, and (e) 4th mode. Colour contours indicate the magnitude of deformation or stress distribution.
Lubricants 13 00424 g023
Figure 25. The wear depth every 50,000 km under different excitations for the flexible wheelset and rigid wheelset: (a) 50,000 km; (b) 100,000 km; (c) 150,000 km; (d) 200,000 km.
Lubricants 13 00424 g025
Table 1. Key parameters of the shock absorber system.
Key ComponentParameterSymbolValueUnits
Hydraulic CylinderPiston area A p 0.005 m 2
Piston ring area A r 0.0041 m 2
Hydraulic MotorMotor displacement V d 30 m 3 / rev
Mechanical efficiency η m 0.95-
GeneratorTorque coefficient K T 0.93 Nm / A
Internal inductance L G 0.03 H
Internal inductance R i n 20 Ω
Internal resistance R e x 20 Ω
Spring-loaded AccumulatorAccumulator port area A a c 0.0038-
Specific heat ratio of charged gas β 0.78-
Table 2. Main parameters of the vehicle body.
Major ParameterValueUnitTitle 1Title 2Title 3
Carboy mass34.934 × 103kgentry 1datadata
Bogie mass3.12 × 103kgentry 2datadata
Wheel mass1.7518 × 103kg   
Primary vertical stiffness1176 × 103N/m   
Primary vertical damping19.6 × 103N·s /m   
Table 3. Specification of high-speed railway curve conditions.
Percentage (%)Superelevation (mm)Transition (m)
30002.0150380
70006.7150540
80005.3135500
90007.5125490
10,0004.3115430
12,0002.3100370
Table 4. Key HERD and Vehicle parameters used in simulation.
CategoryParameterValueUnit
HERDPiston area0.005 m 2
Motor displacement30 cm 3 / rev
Generator torque coefficient0.93 Nm / A
VehicleCarbody mass34.934 × 103 kg
Bogie mass3.12 × 103 kg
Wheel mass1.7518 × 103 kg
Primary vertical stiffness1176 × 103 N / m
Primary vertical damping19.6 × 103 N s / m
Table 5. Baseline comparison of regenerated power and wear between HERD and a conventional damper under identical conditions.
Regeneration Efficiency (%)Distance (km)Wheel Wear (mm)
Conventional damper45.27~45.28200,0000.66
250,0000.78
HERD49.93~49.94200,0000.64
250,0000.75
Disclaimer/Publisher’s Note: The statements, opinions and data contained in all publications are solely those of the individual author(s) and contributor(s) and not of MDPI and/or the editor(s). MDPI and/or the editor(s) disclaim responsibility for any injury to people or property resulting from any ideas, methods, instructions or products referred to in the content.