Article

Mechanistic Interpretation of Fretting Wear in Z10C13 Steel Under Displacement–Load Coupling

School of Mechanical Engineering, Hangzhou Dianzi University, No. 1158, 2nd Street, Jianggan District, Hangzhou 310000, China
*
Authors to whom correspondence should be addressed.
Lubricants 2025, 13(9), 421; https://doi.org/10.3390/lubricants13090421
Submission received: 23 July 2025 / Revised: 17 September 2025 / Accepted: 17 September 2025 / Published: 19 September 2025

Abstract

Considering that the ferritic stainless steel Z10C13 support plate material in nuclear power equipment tends to undergo fretting wear during service, this paper systematically investigates the effect of varying normal loads (10–50 N) and displacement amplitudes (15–75 μm) on its fretting response and wear mechanisms. Through ball-on-flat fretting wear experiments, together with macro- and micro-scale observations of wear scars, it is revealed that normal load primarily controls the contact intensity and the extent of adhesion, whereas displacement amplitude mainly affects the slip amplitude and features of fatigue damage. The results show that the fretting system’s dissipated energy increases nonlinearly with both load and amplitude, and their coupled effect significantly exacerbates interfacial damage. The wear scar morphology evolves from a shallow bowl shape to a structure characterized by multiple spalling pits and propagating fatigue cracks. An equivalent hardness-corrected Archard model is proposed based on the experimental data. The model captures the nonlinear dependence of equivalent material hardness on both load and amplitude. As a result, it accurately predicts wear volume ( R 2 = 0.9838 ), demonstrating its physical consistency and modeling reliability. Overall, this study elucidates the multi-scale damage evolution mechanism of Z10C13 under fretting conditions and provides a theoretical foundation and methodological support for wear-resistant design, life prediction, and safety evaluation of nuclear power support structures.

1. Introduction

The nuclear steam generator is a critical component of pressurized water reactor (PWR) nuclear power plants, and its safe and reliable operation directly dictates the reactor’s overall efficiency and safety. Among various material options, Z10C13 ferritic stainless steel (DIN X10CrAl13, GB OCr13A1), owing to its excellent stress corrosion resistance and high-temperature strength, has been widely used in steam generator support plate structures [1]. To clearly illustrate the system under consideration, Figure 1 provides an overview of the steam generator, including the supporting plate, the heat transfer tubes, and their contact interface, which represents the critical research subject in this work. As shown in Figure 1b, flow-induced vibrations (FIV) during operation inevitably cause repeated micromotion at the support plate–tube interface [2,3]. Such micromotion leads to severe fretting wear manifested by material loss, wear debris generation, and debris accumulation at the contact interface [4,5]. Representative examples of plate wear and tube wear are also displayed in Figure 1b, visually demonstrating the extent of damage that can occur in service. This wear debris not only accumulates between the support plate hole walls and the tube outer surfaces, leading to localized blockage that impedes fluid flow and reduces heat transfer efficiency [6], but also alters the load path and structural stiffness, thereby amplifying vibration amplitude and contact impacts in a self-reinforcing deterioration loop. According to a survey conducted by Dow, approximately 60 pressurized water reactors (PWRs) units reported steam generator (SG) heat exchange tube leakage caused by fretting wear during 1992–1993 [7,8], highlighting the significance and urgency of research in this area.
In light of the severe damage caused by fretting wear, extensive research has been conducted over the past decades on the fretting behavior at the contact interface between support plates and heat transfer tubes in steam generators [9,10]. Most of these studies have focused on qualitative descriptions of wear behavior under specific conditions, such as comparisons between water and air environments, high-temperature and room-temperature conditions, as well as different normal loads and displacement amplitudes [11,12,13,14]. For example, studies have confirmed that fretting wear in ambient air is typically more severe than under high-temperature service conditions [11,12,15], and that air presents a harsher environment compared with water [15,16,17], thereby underscoring the relevance of fretting wear investigations conducted in air [18]. Moreover, researchers have systematically examined the influence of fretting regimes on the evolution of material damage. Specifically, a linear hysteresis loop corresponds to the partial slip regime (PSR), an elliptical loop corresponds to the mixed fretting regime (MFR), and a parallelogram-shaped loop corresponds to the gross slip regime (GSR) [19,20,21]. These observations demonstrate that wear behavior is strongly governed by two key parameters: the normal load and the displacement amplitude.
However, current research has mainly focused on the fretting wear characteristics of heat transfer tube materials, especially nickel-based alloys like Inconel 690 [14,22,23], with much less attention on the wear behavior of support plate materials such as Z10C13. This oversight of the support plate’s own wear and damage accumulation during service means that key issues such as gross slip fretting damage in actual operation, abrasive wear mechanisms, the morphology of wear debris, and their contributions to damage evolution have not been systematically and quantitatively studied. In addition, significant differences in material hardness can lead to wear location transitions and affect damage evolution, yet these phenomena are not well understood, further limiting the accuracy of current structural design and life prediction models.
To address the aforementioned research insufficiency, the present study investigates a representative material pair used in actual nuclear power service-Z10C13 support plates in contact with Inconel 690 heat transfer tubes. The effects of normal load and displacement amplitude on the fretting wear behavior of Z10C13 are systematically investigated, with the aim of compensating for the limited attention previously given to support plate materials. Specifically, ball-on-flat fretting tests were carried out in room-temperature air to simulate the most severe fretting conditions. Key metrics such as wear scar morphology, the microstructure observed by SEM, fretting loop characteristics, dissipated energy per cycle, wear volume, and wear area were analyzed under various loading conditions, providing an in-depth understanding of the damage evolution and microscopic mechanisms of Z10C13 under fretting.
In contrast to previous studies that primarily emphasized tube-side alloys, the present investigation advances the understanding of fretting wear of support plate materials in three key respects. First, a multi-scale characterization framework is established, enabling direct correlation between macroscopic fretting responses and microscopic damage morphology. Second, a hardness-corrected Archard model is formulated, explicitly incorporating the coupled influences of normal load and displacement amplitude. Third, a critical transition threshold in fretting wear mechanisms is identified at a characteristic load-to-amplitude ratio. Taken together, these advancements provide not only a refined mechanistic interpretation of fretting wear in SG support structures but also a theoretical foundation for structural design optimization and service life prediction.

2. Experimental Methods

2.1. Material Selection and Test Apparatus

Severe fretting wear occurs at the interface between steam generator tube support plates (TSPs) and heat transfer tubes. In this study, the widely used Z10C13 stainless steel was selected as the test material, paired with an Inconel 690 nickel-based alloy counterface; their chemical compositions are listed in Table 1. Hardness measurements determined the hardness of Z10C13 to be approximately HB 190–210, and that of Inconel 690 to range from HRC 30–38 (around HB 285–352). The significant hardness disparity between these materials tends to concentrate fretting wear on the Z10C13 side, reflecting actual service conditions.
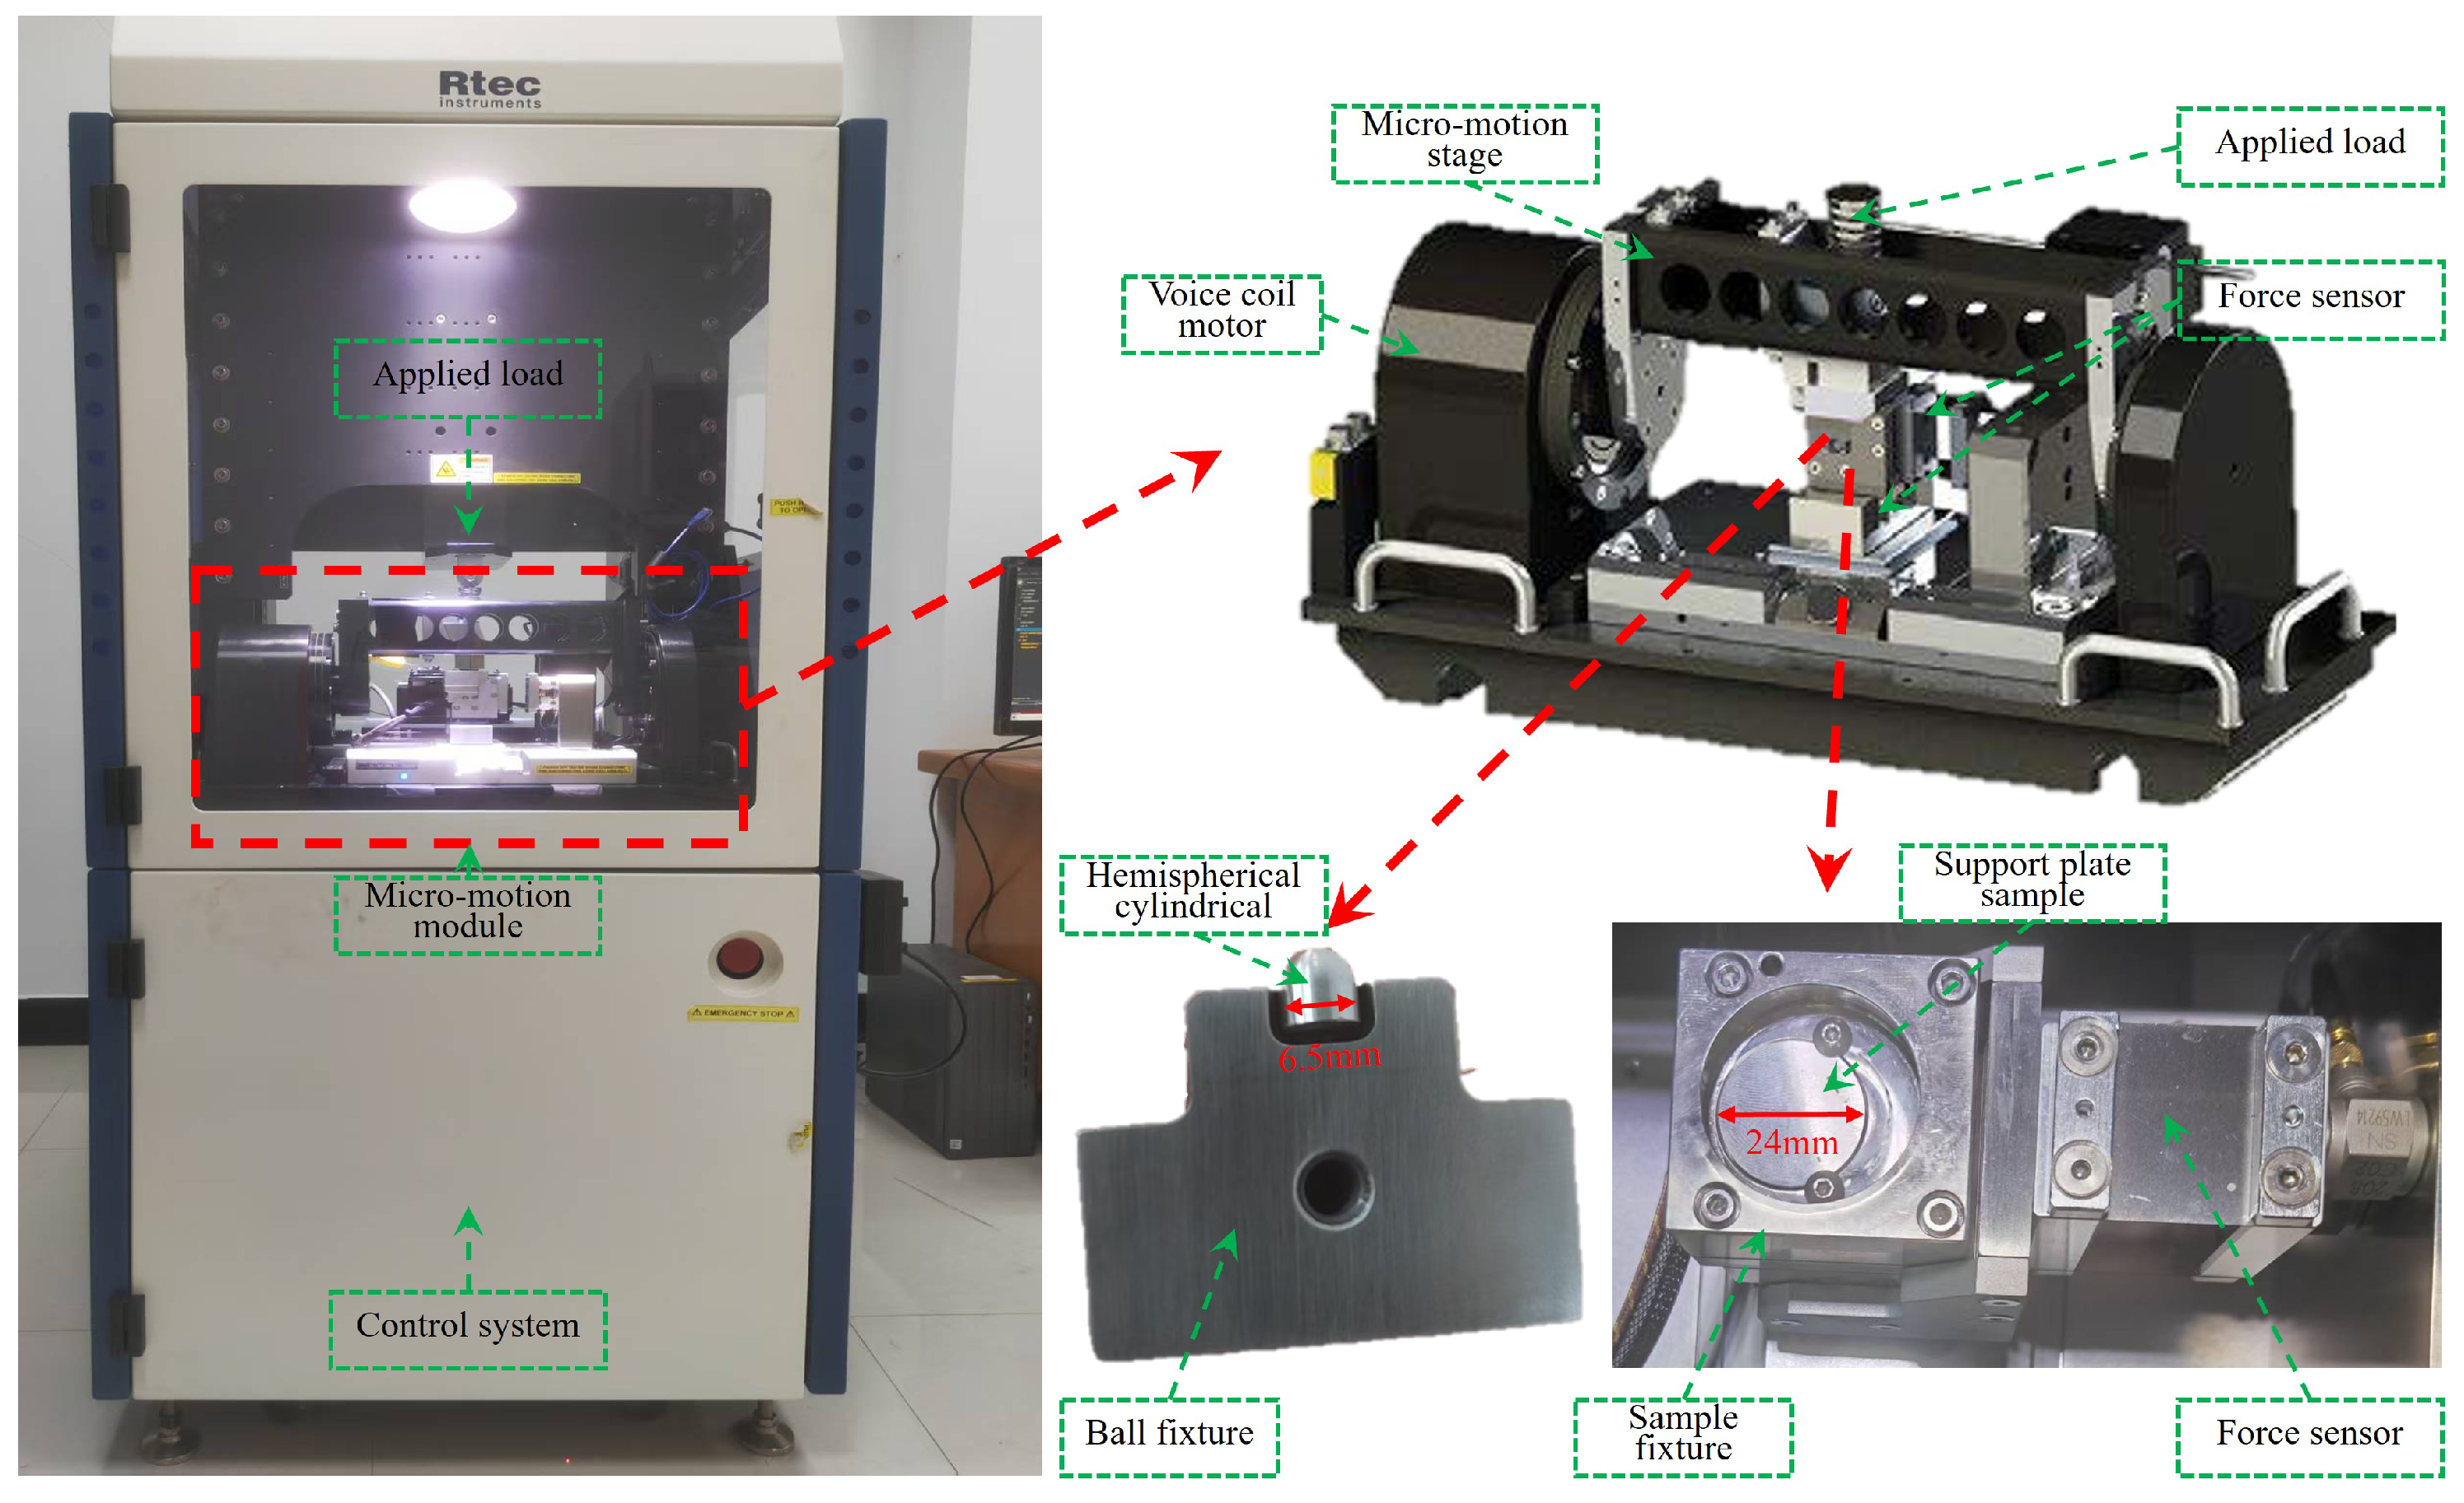
The experiments were conducted on an Rtec MFT-5000 multi-function tribometer (Rtec Instruments, San Jose, CA, USA) comprising a coil driven loading mechanism, a high frequency piezoelectric force sensor, a precision spring loading unit, and a realtime data acquisition system. This setup can achieve high precision fretting loading at frequencies from 0.1 to 200 Hz, with the temperature maintained at 23–25 °C. The experiments were conducted using a classical ball-on-flat contact configuration. The specimen was a disc-shaped Z10C13 sample with a diameter of 24 mm and a thickness of 8 mm. Its surface was subjected to multi-stage metallographic polishing, resulting in a surface roughness of R a < 0.05 μm. An Inconel 690 Hemispheriçal cylindrical specimen was used as the upper component, featuring a spherical front end and a cylindrical rear section with a diameter of 6.5 mm. To ensure test repeatability and to avoid cross-contamination of wear debris, a new ball specimen was employed for each test. This configuration was designed to suppress rolling of the spherical surface under high frequency fretting motion, thereby ensuring stable contact and alignment during testing. The actual device and structure are illustrated in Figure 2.

2.2. Experimental Design and Parameters

To systematically analyze the influence of normal load and fretting amplitude on wear mechanisms and wear volume, an orthogonal experimental design was adopted, with five levels of normal load (10, 20, 30, 40, 50 N) and five levels of displacement amplitude (15, 30, 45, 60, 75 μm), yielding a total of 25 test conditions. The amplitude range was selected based on relevant literature [19] and practical engineering considerations: the actual width of the trilobed hole land on a steam generator support plate is typically greater than 2.54 mm. Considering that fretting displacements in service might approach or slightly exceed the land width, the maximum amplitude was set to be on the same order, and five evenly spaced amplitude levels were defined to cover the PSR across service stages. The normal load range was based on theoretical calculations of a single Inconel 690 tube’s weight distributed over the supports, together with reported two-phase flow impact load ranges [24,25], leading to a selection of 10–50 N.
To ensure result repeatability and reliability, each condition was tested three times. All tests were conducted at a fixed frequency of 30 Hz for a total of 5.4 × 10 4 cycles. The detailed parameters for each test condition are given in Table 2.
Each test specimen was labeled with a consistent naming convention, “MxxNyy,” where M denotes amplitude, N denotes load, and xx and yy represent the specific displacement amplitude and normal load, respectively. Throughout testing, the tribometer continuously recorded normal load, displacement amplitude, and friction force data, ensuring each condition’s parameters were accurately and stably controlled for subsequent analysis of fretting behavior and mechanisms.

2.3. Specimen Preparation and Characterization

To investigate how load and amplitude influence fretting behavior, a white-light interferometer (S Neox 2, Sensofar, Barcelona, Spain) was employed to characterize the surface topography, wear scar profiles, and surface roughness of the specimens. The lowest percentage of valid measurement points was 95.43% (M75N10), while in all other cases the effective data coverage exceeded 97.57%. In addition, post-test analyses were performed to measure the wear scar width, depth, and morphological features of the worn surfaces. The worn surface of each specimen was examined for wear scar width, depth, and morphology. In addition, a field-emission scanning electron microscope (FE-SEM, GeminiSEM 500, Zeiss, Oberkochen, Germany) equipped with an integrated energy-dispersive X-ray spectroscopy (EDS) system was used to observe the surface microstructure and analyze the elemental composition and distribution of the worn areas. The surface hardness of the specimens was measured using a digital microhardness tester (Nanguang DHV-1000-CCD, Shantou, China).
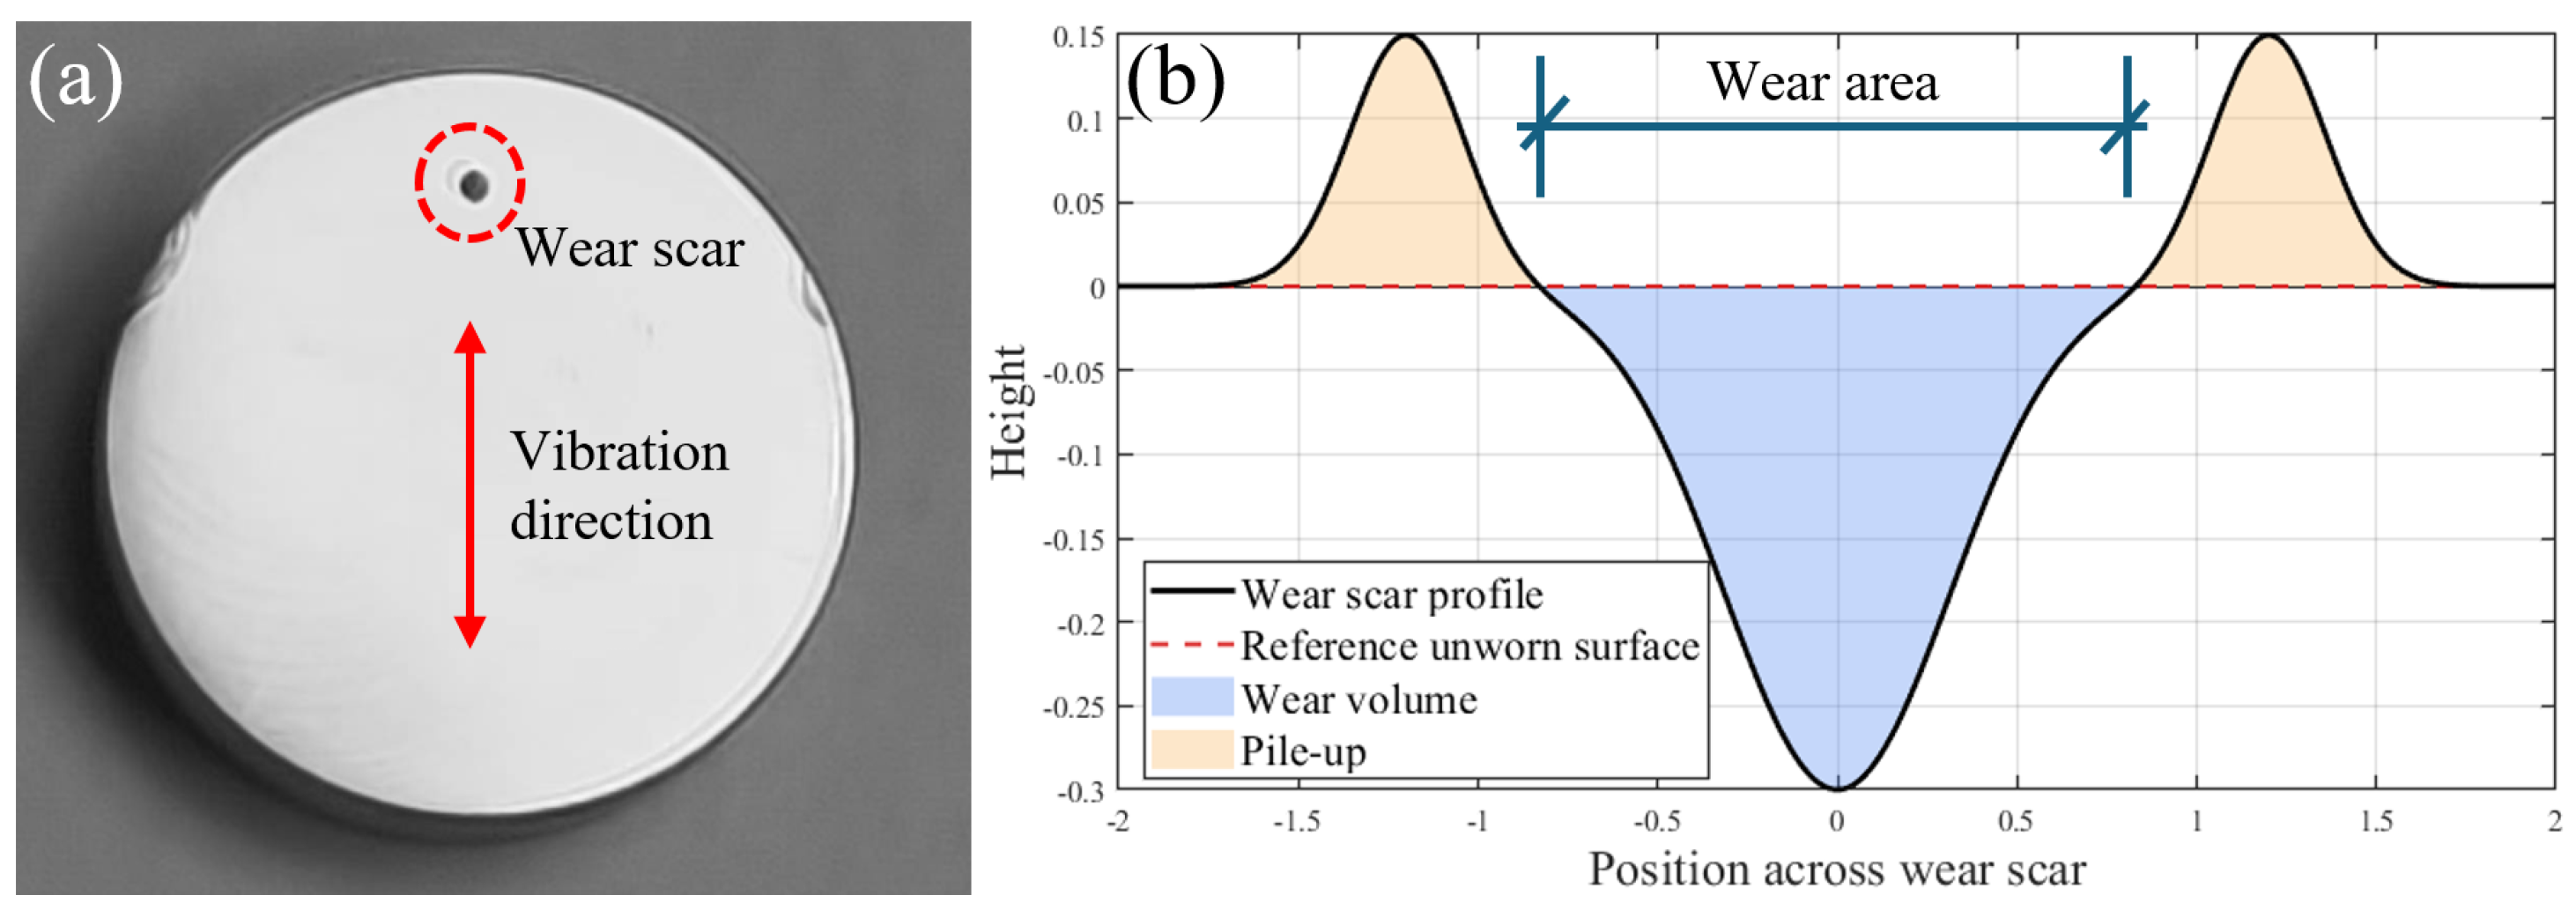
To illustrate the procedure, a schematic diagram (Figure 3) was added. The cross-sectional profile was extracted along the vibration direction passing through the center of the wear scar, ensuring that both the depression and the pile up regions were captured for subsequent evaluation.

3. Effects of Load and Amplitude on Fretting Behavior

3.1. Wear Scar Morphology Analysis

3.1.1. Macro-Scale Wear Scar Morphology

As shown in Figure 4, the selected representative cases highlight the systematic evolution of fretting damage with increasing load and amplitude. At the low-load/low-amplitude condition as Figure 4a, the wear scar remains shallow and relatively smooth, with regular edges and limited material removal. At the intermediate condition as Figure 4b, the scar enlarges and deepens, exhibiting a bowl-shaped profile with pronounced edge perturbations, reflecting the onset of fatigue-assisted wear mechanisms. At the high-load/high-amplitude condition as Figure 4c, the scar develops into a severely damaged region characterized by extensive central collapse, multi-scale spalling pits, and ridge-like pile-up at the periphery, indicating a substantial increase in both wear depth and surface roughness. Together, these representative cases illustrate the progressive transition from mild adhesive wear to severe fatigue spalling as the loading severity increases.
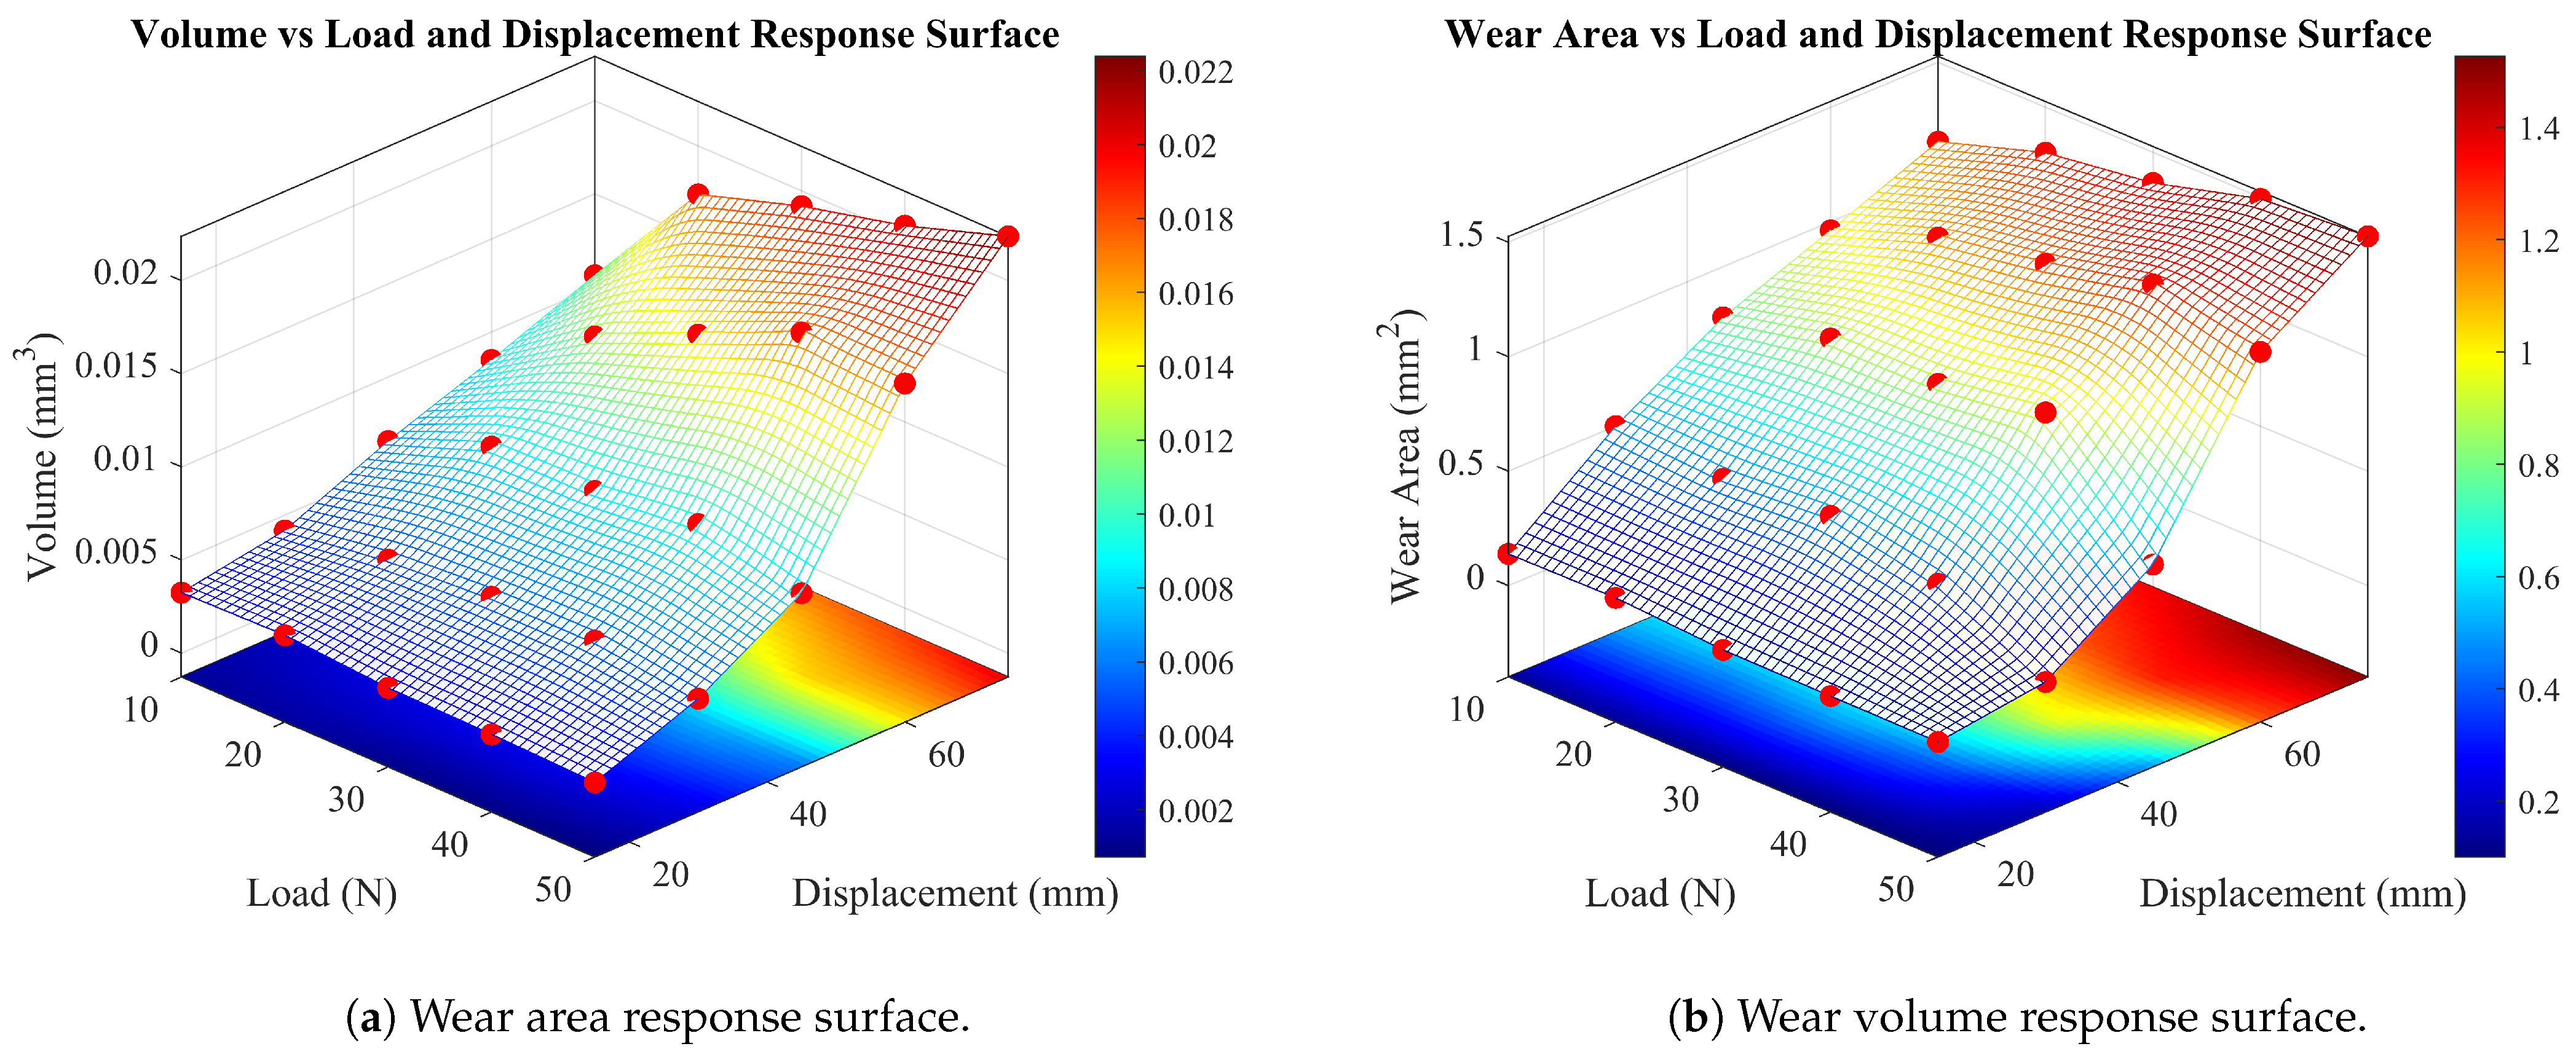
Figure 5 further presents the response surfaces of wear area and wear volume as functions of normal load and displacement amplitude, and Table 3 lists the corresponding values. The results demonstrate that wear volume and area are mainly governed by displacement amplitude, showing a nonlinearly increasing trend with amplitude. When amplitude is in the range of 15–45 μ m, the wear volume grows relatively slowly, whereas once amplitude exceeds a critical value of approximately 45 μ m, the volume exhibits a rapid exponential, like increase, indicating significantly greater material removal. By contrast, the effect of normal load on wear volume is primarily a modulation: at a given amplitude, increasing the load produces a non-monotonic effect on wear volume, which first rises and then falls with load. Specifically, increasing load from 10 N to 30 N promotes higher contact stress and thus increases wear volume, but further increasing load to 40–50 N actually reduces the wear volume. The magnitude of this load modulation is much smaller than the dominant effect of amplitude; load influences wear volume mainly by changing the contact stress distribution and real contact area, thereby amplifying the wear severity induced by changes in amplitude.
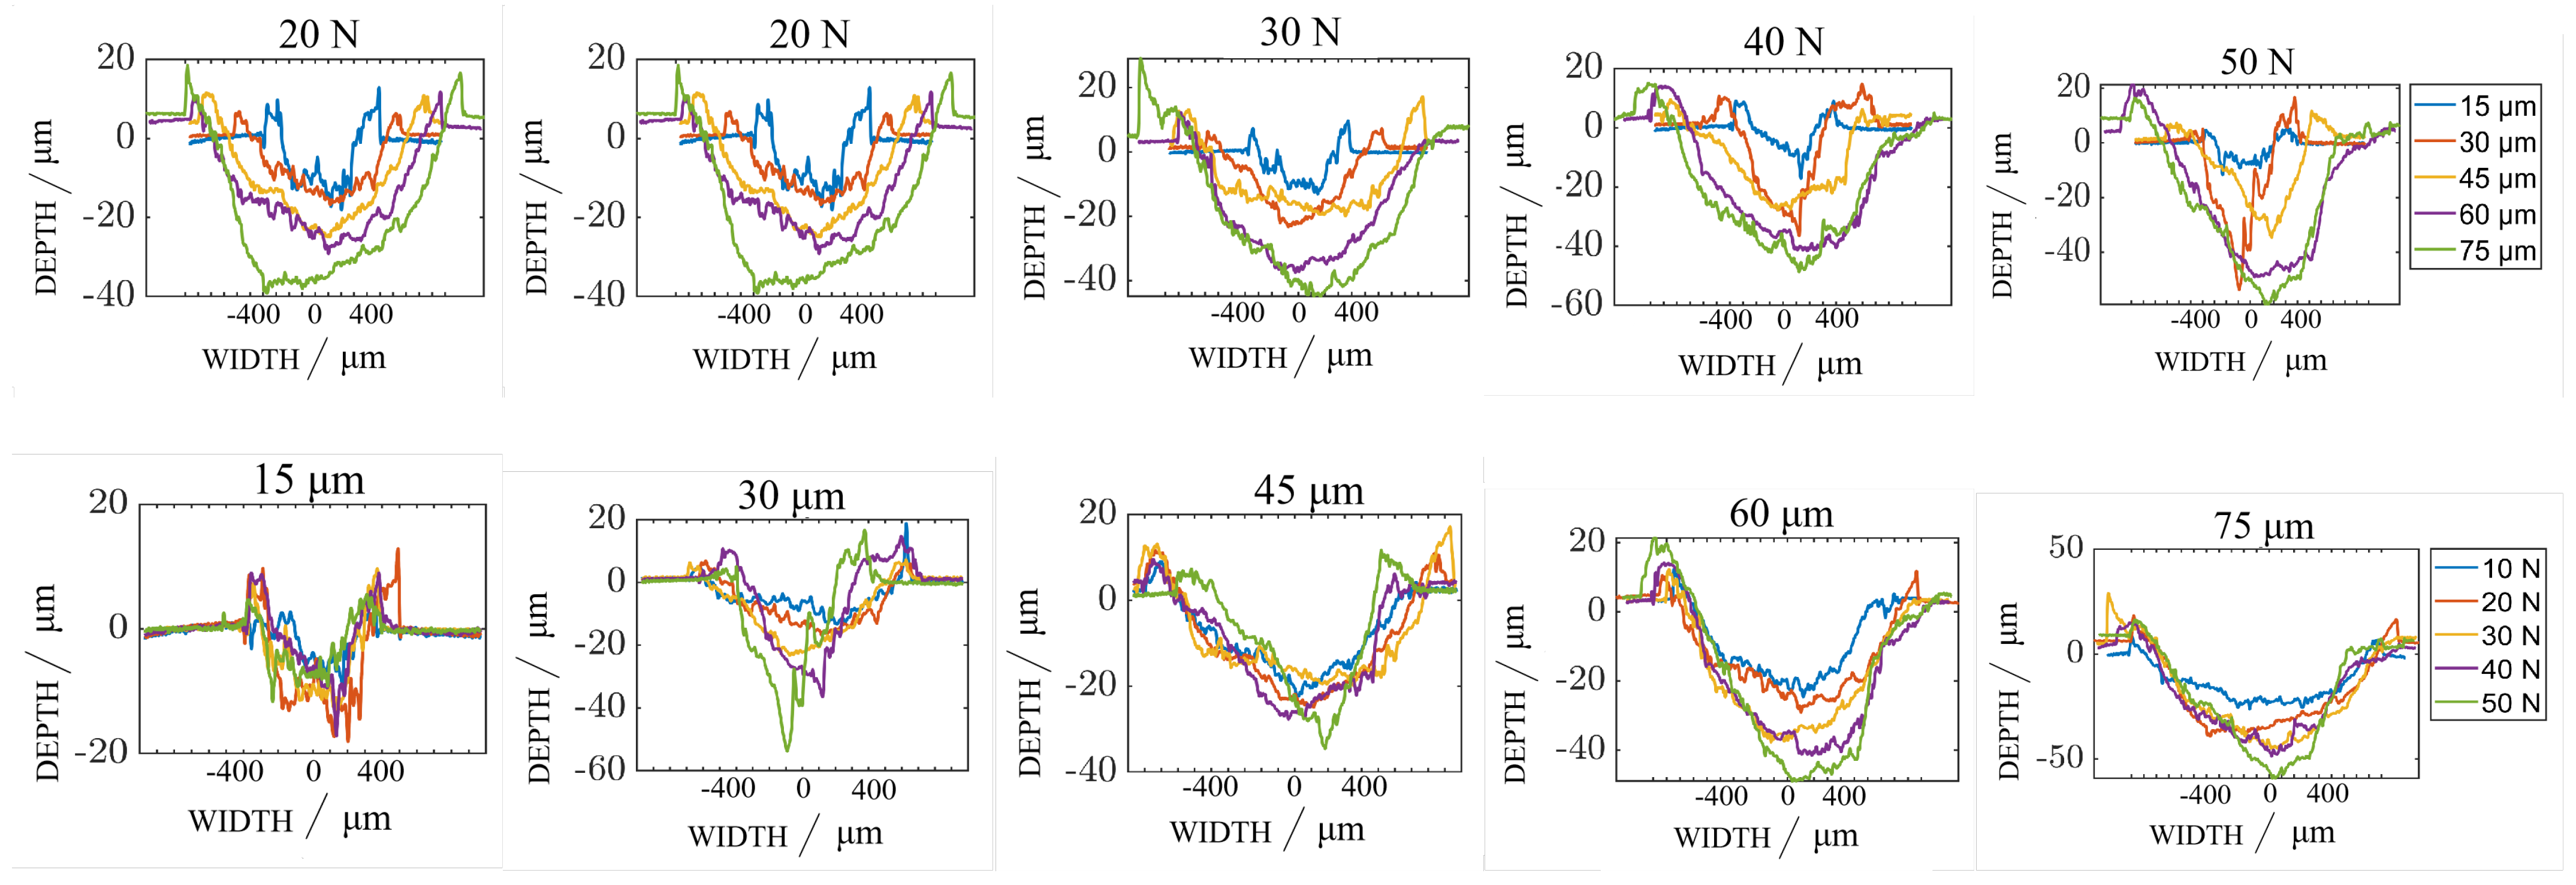
Figure 6 plots the cross sectional profiles of the wear scars under varying single factor conditions. From Figure 6(top), which compare profiles at the same load but different amplitudes, a pronounced asymmetry in height between the two sides of each profile is observed, one side of the scar exhibits a significant ridge. This indicates that material plastic flow and removal became directional, leading to asymmetric plastic deformation. In contrast, Figure 6(bottom), which compare profiles at the same amplitude under different loads, show that the influence of load on the wear scar depth is smaller than that of amplitude, and the overall profile shapes remain similar. With increasing load, the maximum depth increase is mainly concentrated at the center of the scar, and the tilt angle of the profile remains nearly the same. This suggests that the effect of load on material removal is concentrated in the central contact region, while its influence on the uniformity of the profile across the scar sides is relatively small.
For the asymmetric wear scar profiles, the underlying mechanisms can be attributed to several factors: First, crystallographic anisotropy of the material leads to different plastic responses in different regions under frictional loading, causing non-uniform removal rates. Second, slight misalignments in the loading path and nanoscale asymmetries of the counterbody surface can induce an eccentric distribution of the contact stress field, causing slight shifts in the location of material removal during cyclic loading [26]. Additionally, the relatively low hardness of the test material (HB 221) compared with the counterface (HB 349) exacerbates the asymmetry in shear flow during contact. As the number of cycles increases, these misalignments accumulate, resulting in increasingly asymmetric wear scar profiles.
In summary, displacement amplitude is the key control parameter determining the scale of material removal: under high amplitudes, wear volume increases dramatically, and especially at high loads the scar morphology changes become even more pronounced. In contrast, normal load acts in a modulating and amplifying capacity: under moderate loads, wear volume rises quickly, but at high loads the increase in wear volume slows down, reflecting the counteracting influences of surface plastic deformation and work hardening. Under the highest combined load and amplitude conditions, these factors produce a synergistic effect that drives the wear volume to its peak value.

3.1.2. Localized Material Failure Modes

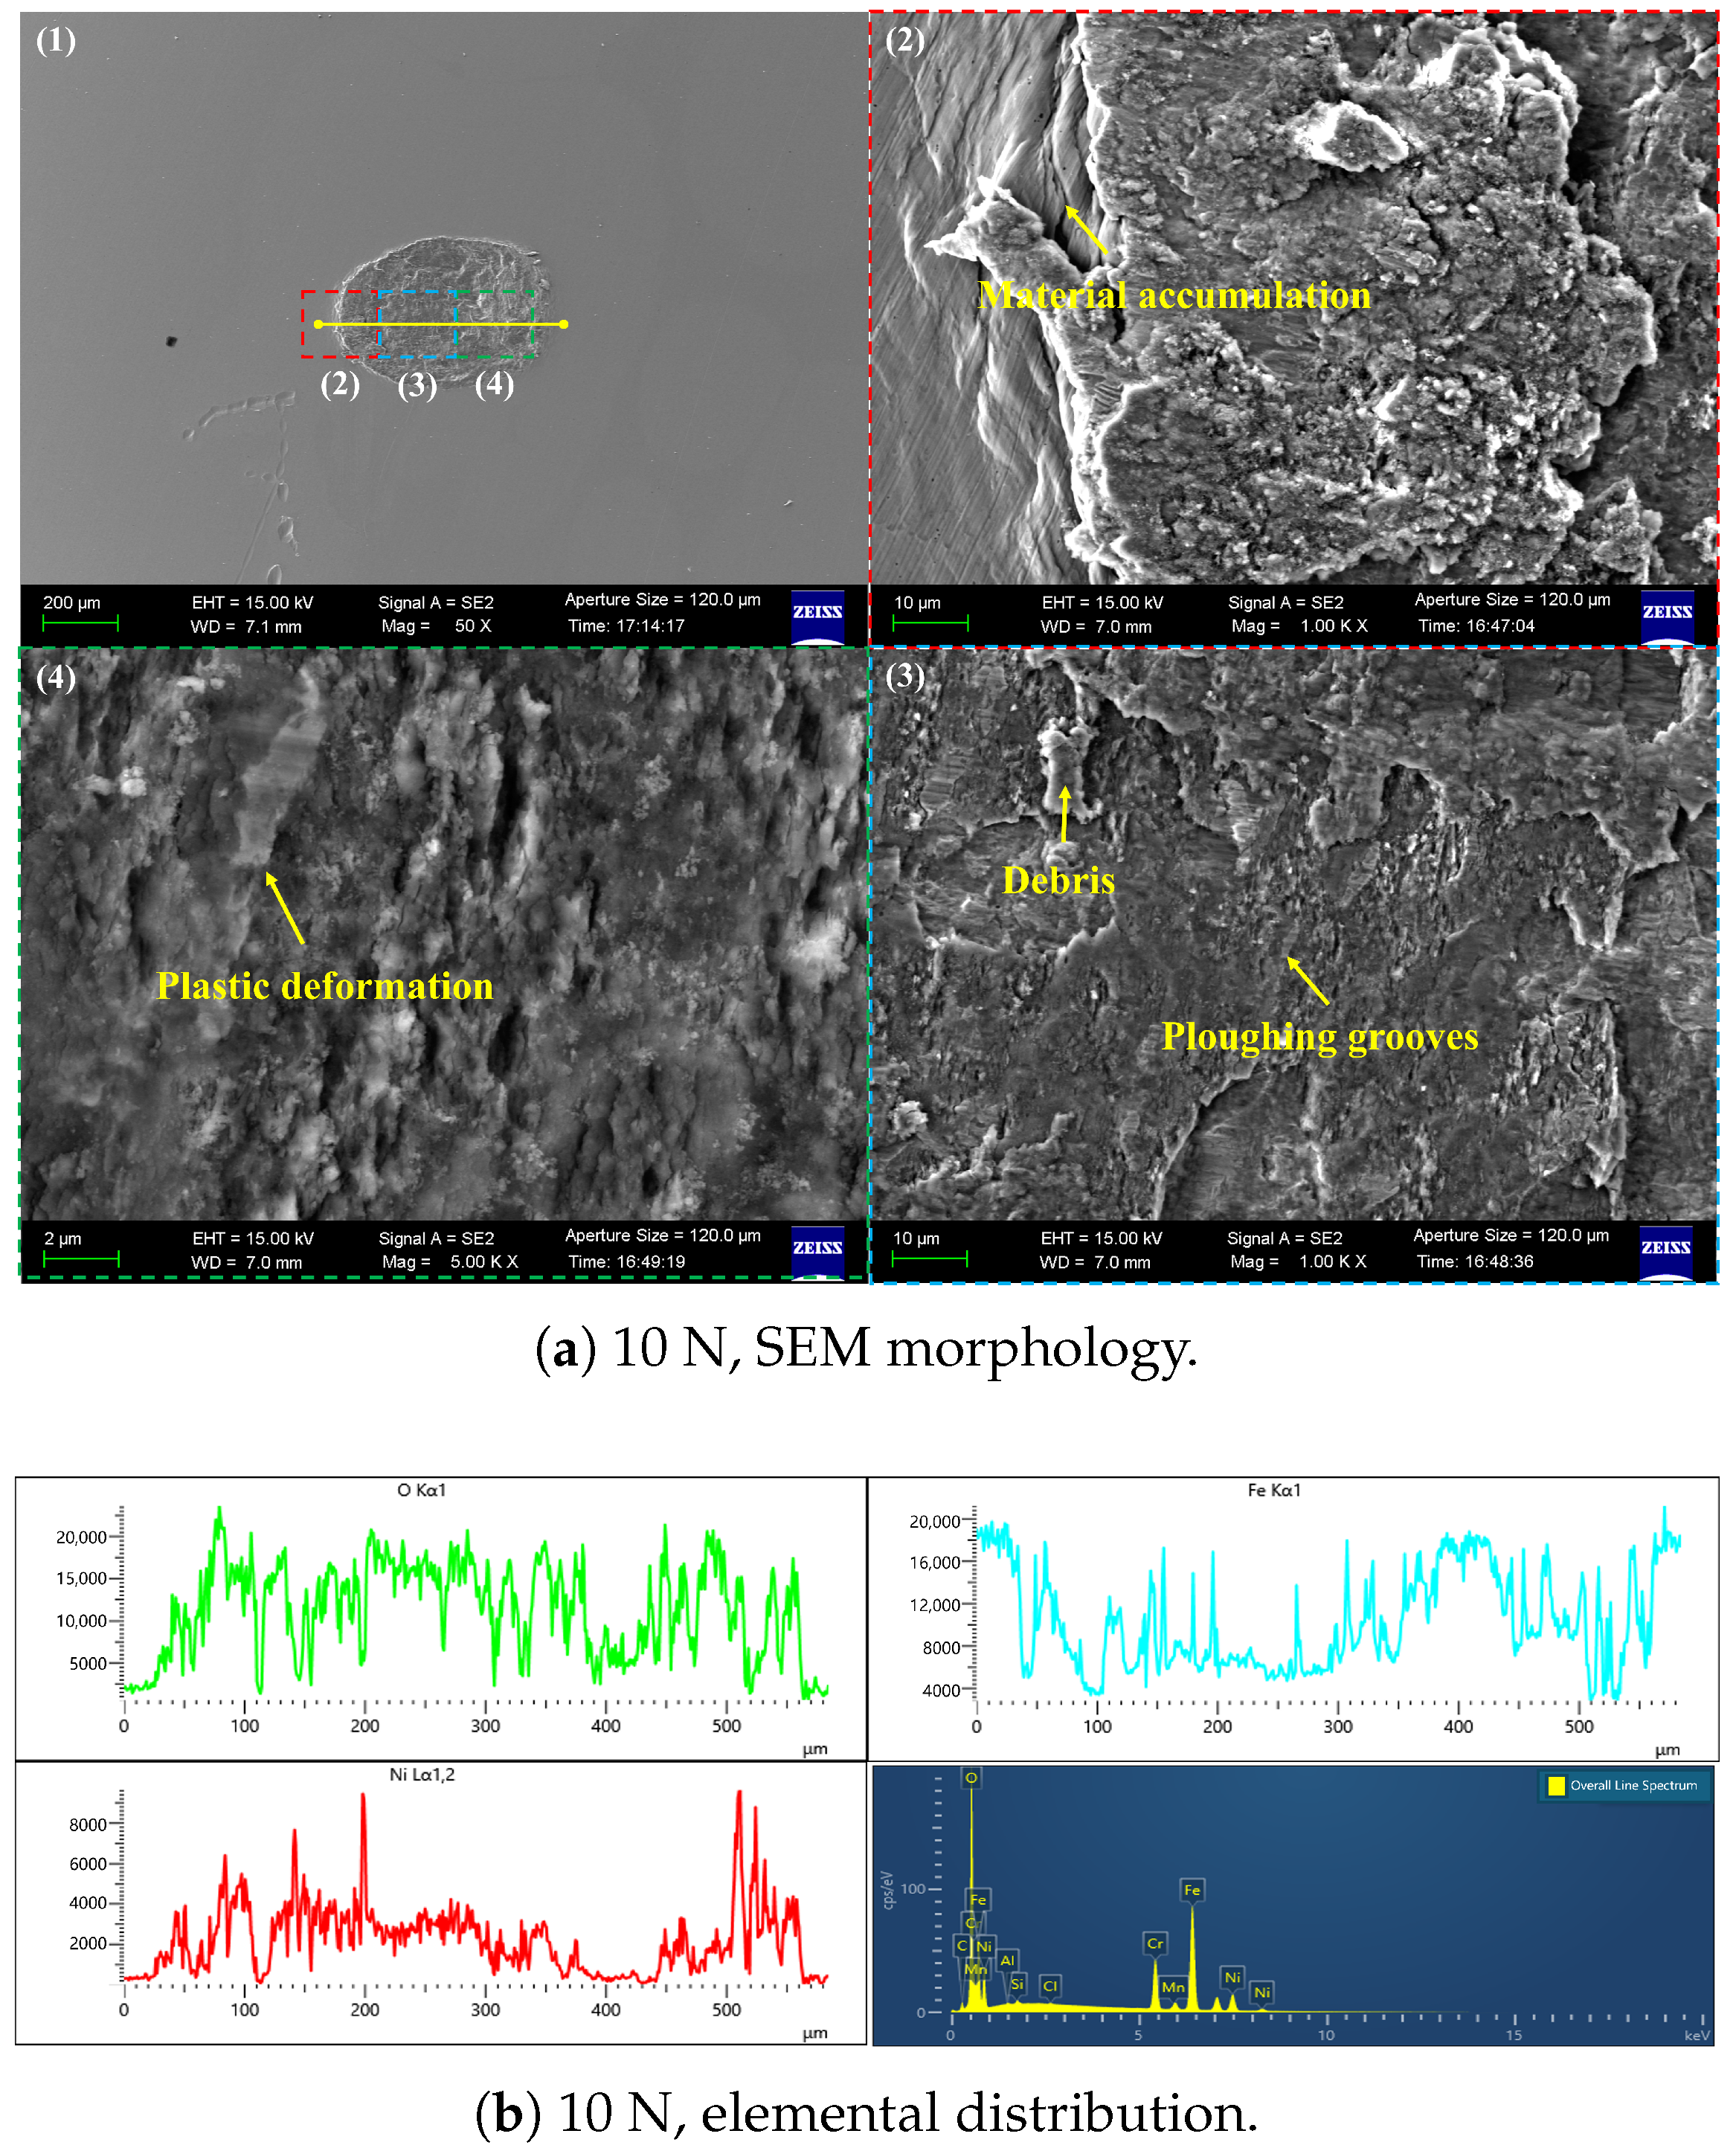
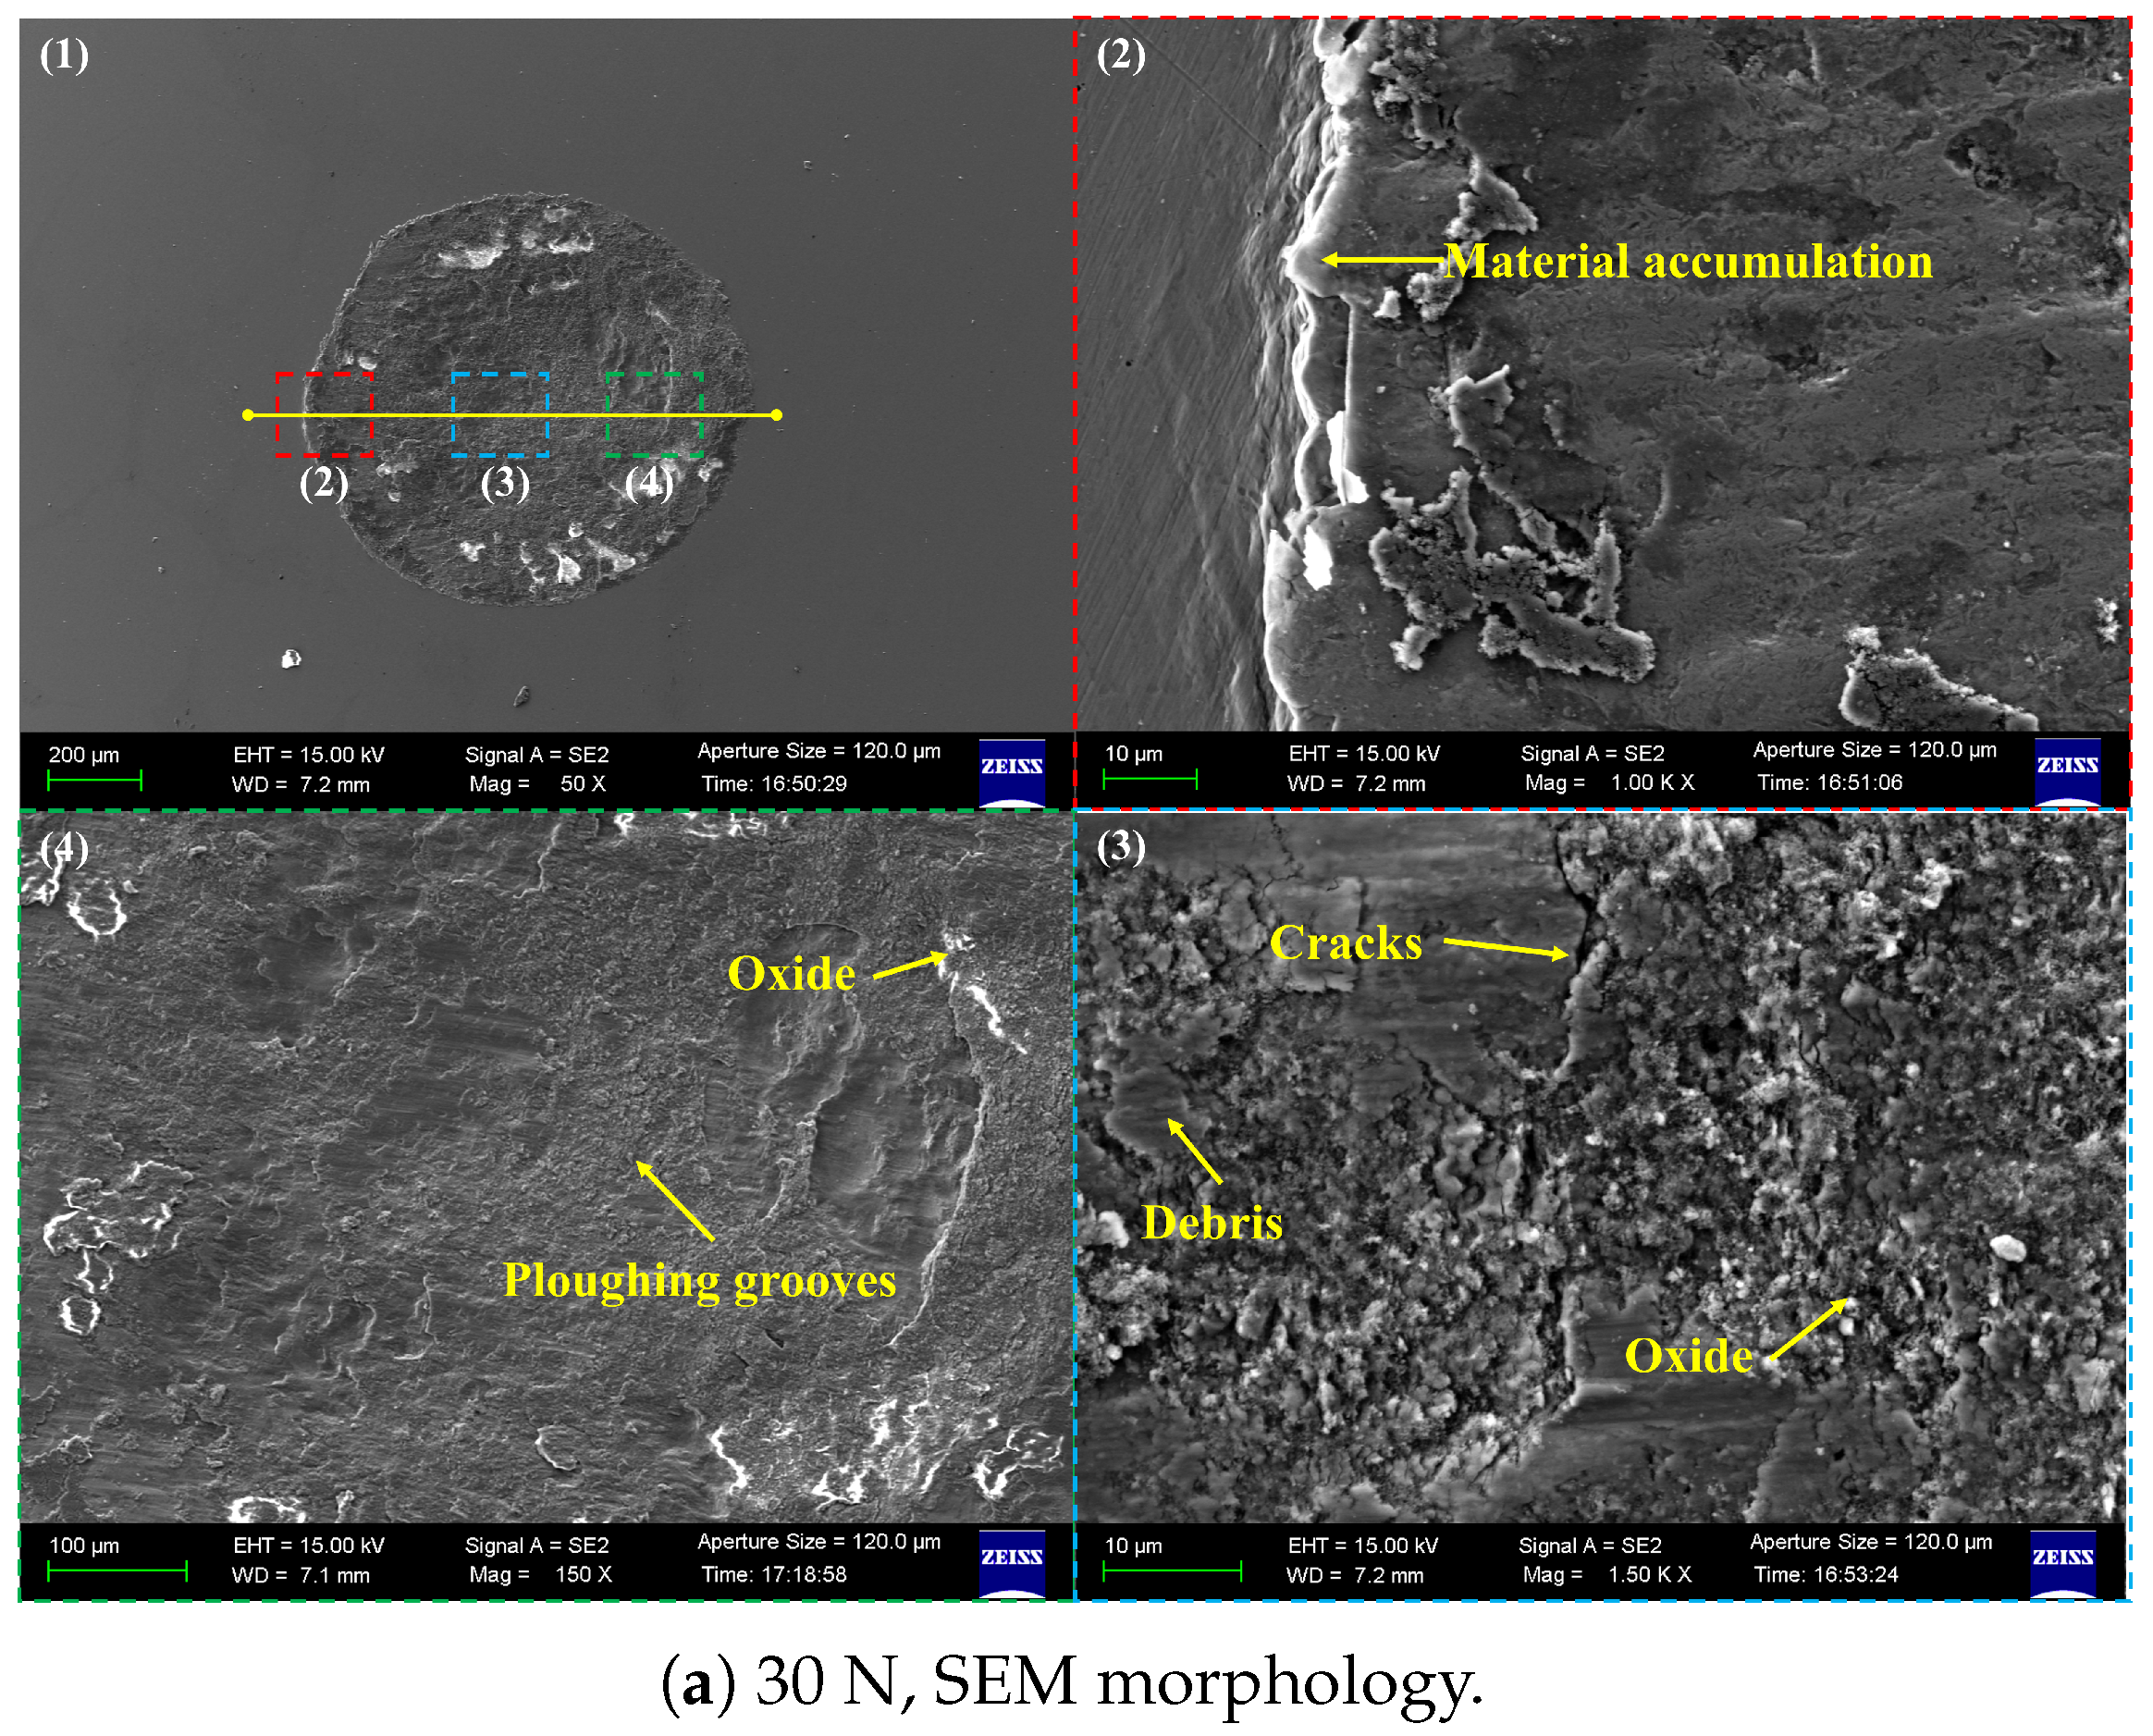
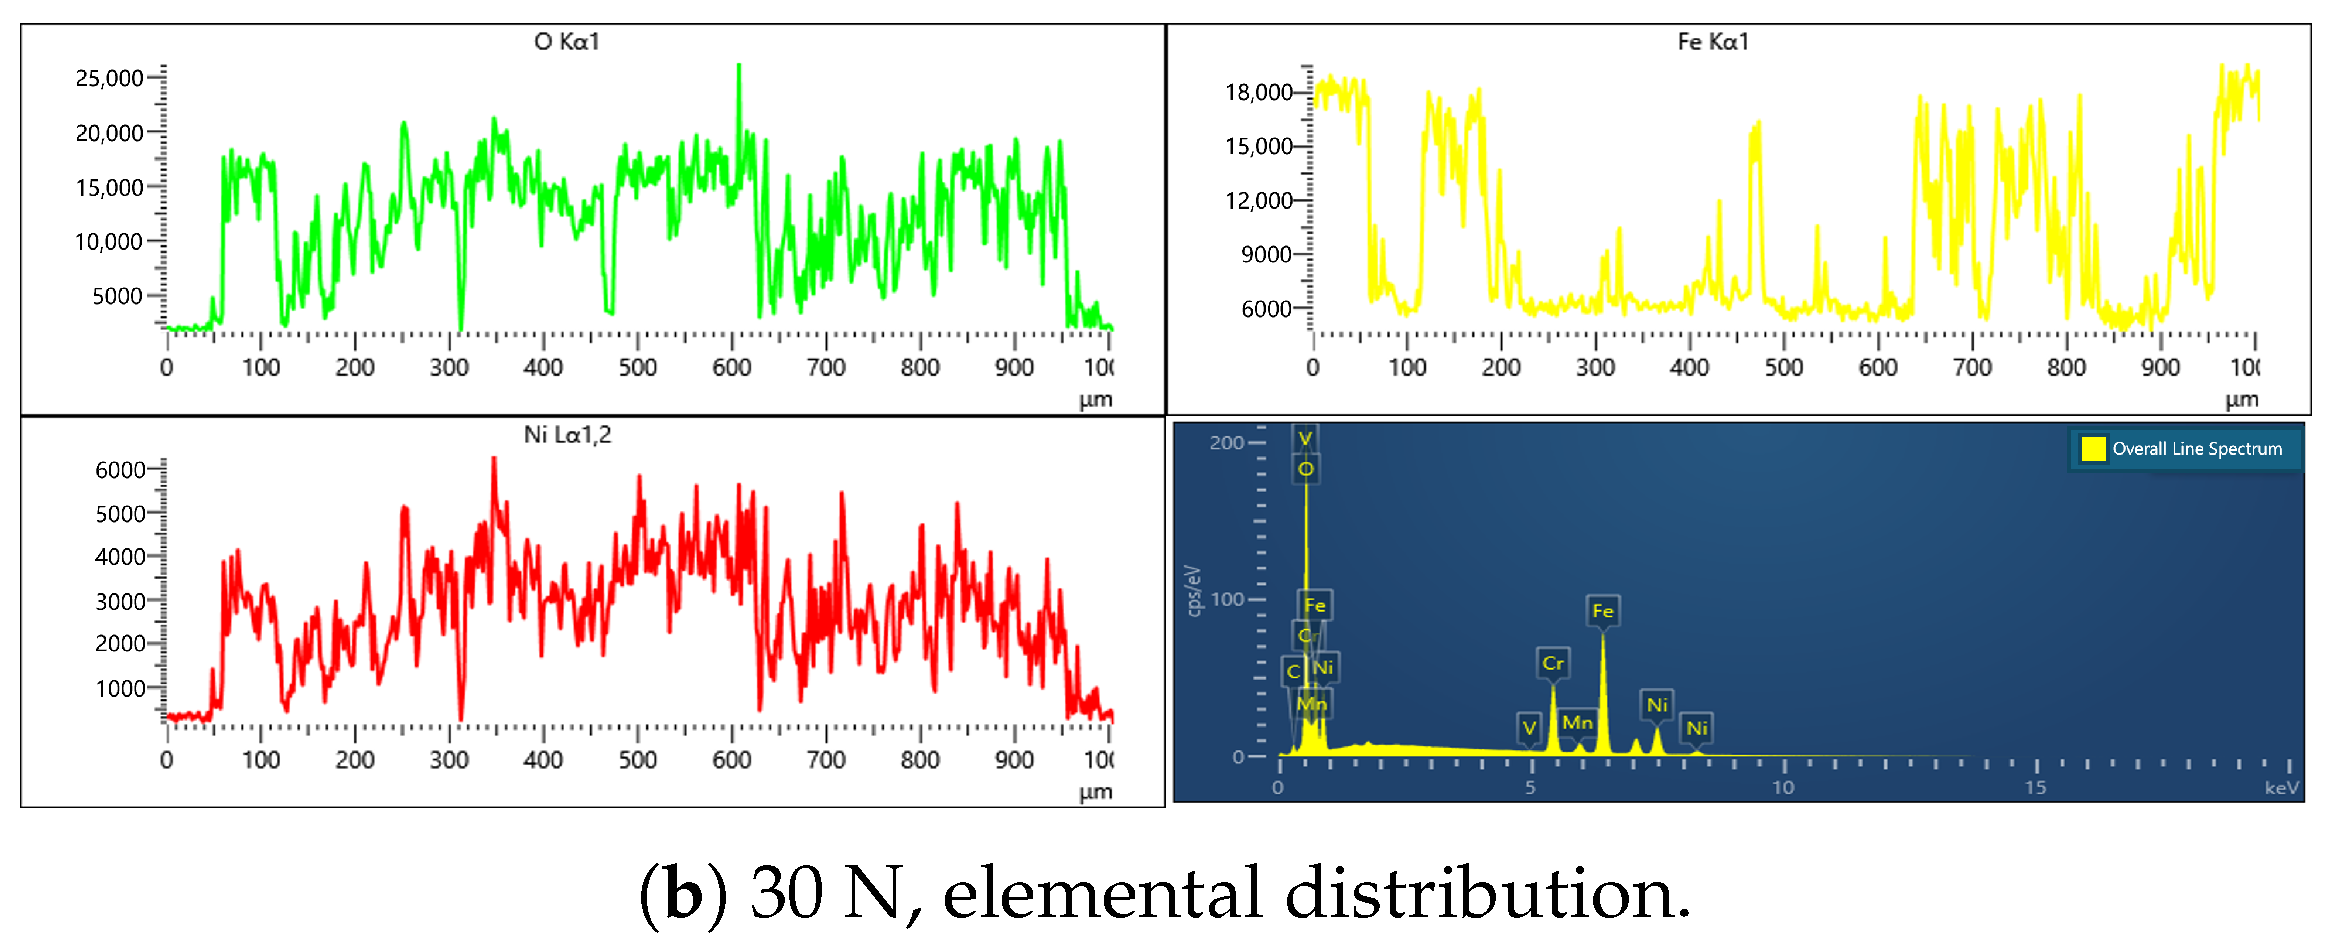
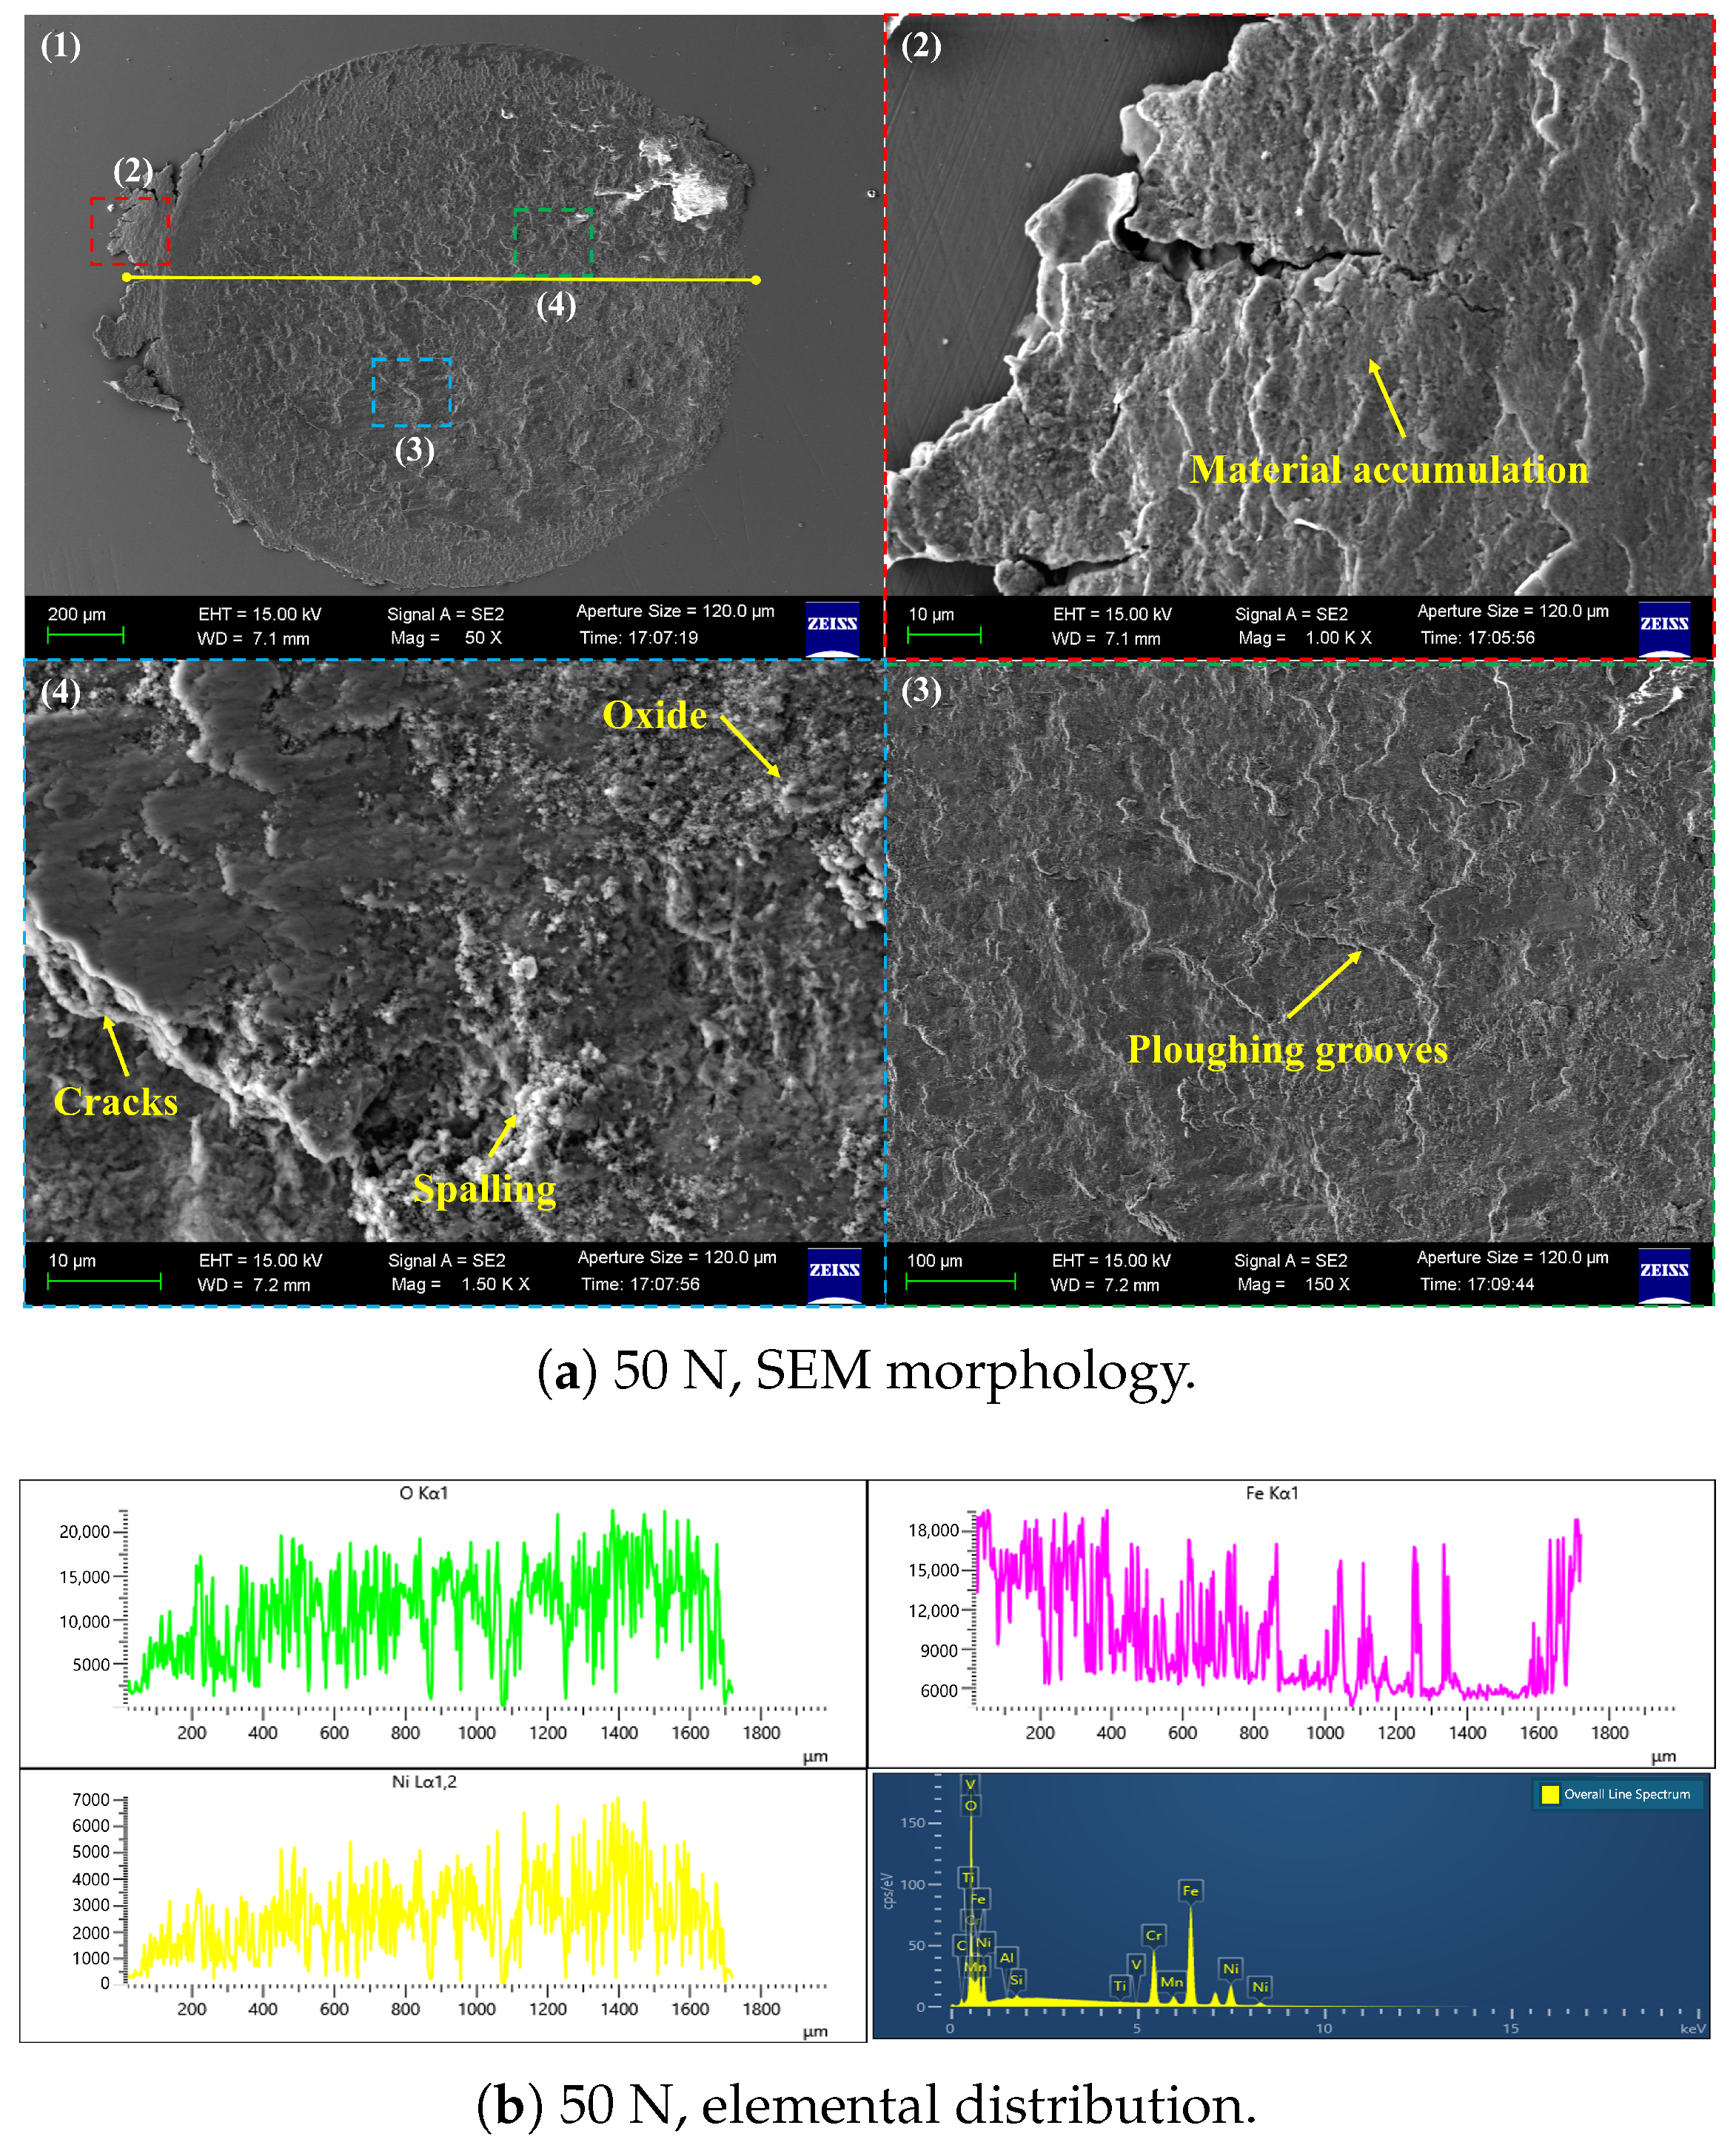
Figure 7, Figure 8 and Figure 9 show SEM micrographs and corresponding element distributions (EDS line scans for O, Fe, Ni) of wear scars at a fixed amplitude of 45 μ m under different normal loads. As load increases from 10 N to 30 N and then to 50 N, the dominant wear mechanism on the surface undergoes a significant transition from adhesive wear to fatigue spalling. Three magnified regions (left, middle, right) are indicated for each sample to display the spatial differences in material removal, and the right side presents line-scan distributions of O, Fe, and Ni along the yellow line in the SEM images.
At 10 N (Figure 7), the left-side region of the scar is relatively flat with shallow shear-flow traces, evidencing localized adhesive junctions and small-scale material transfer at the early stage of fretting. By contrast, the middle region contains dense adherent debris, and the EDS line scan reveals elevated oxygen with concomitant changes in metallic elements, indicating the development of a stable oxide layer. This oxide layer progressively dominated the interfacial response, acting as a barrier that mitigated metal-to-metal contact and markedly suppressed further material removal. The right-side region is relatively smooth with shallow shear marks and minimal material removal. Overall, the depth profile is shallow and symmetric. At 30 N (Figure 8), the left region shows obvious spalling and tearing marks. The middle region’s surface structure is loose, oxygen content remains high but its distribution fluctuates more, indicating reduced stability of the oxide film with some broken regions, and the wear mechanism shifting from purely adhesive sliding to a combined adhesive fatigue spalling mechanism. The right region’s surface roughness increases and shear grooves deepen, indicating more accumulated plastic deformation in the contact area and local yielding of material. The depth profile reveals a deeper wear scar with asymmetry between the two sides. At 50 N (Figure 9), the left region shows extensive spalling and plowing; the middle region’s oxygen peak is overall lower, and Fe and Ni distributions become uniform and steady, indicating the protective oxide film has been completely destroyed and the substrate is directly exposed to the counterface, resulting in severe shear removal and fatigue crack propagation. The wear mechanism has evolved to be dominated by fatigue spalling, leading to a sharp increase in material removal, the macroscopic wear volume reaching its peak, and more fatigue cracks, spalling pits, and micro-fragments appearing on the surface. The depth profile shows a much deeper scar with significantly increased asymmetry between the two sides.
The comparative results show that increasing load concentrates contact stress and shear strain, promoting the surface plastic deformation to gradually evolve into fatigue crack initiation and spalling, while increasing amplitude expands the contact interface area and accelerates the breakdown of the oxide film. This evolution of microscopic mechanisms is highly consistent with the observed macroscopic wear volume trends, indicating that the rise in material removal corresponds directly to the transition from predominantly adhesive sliding wear to fatigue spalling. In addition, the transition of the scar depth profile from a shallow symmetric shape to a deep asymmetric one with increasing load shows that higher loads not only elevate the contact stress but also change the mode of energy dissipation and wear mechanism at the interface. These wear scar observations demonstrate that with increasing load, the wear mechanism shifts from adhesion-dominated to fatigue-dominated; this may be related to changes in frictional behavior, which will be further analyzed using fretting loops in the next section.

3.2. Characterization of Fretting Hysteresis Loops and Energy Dissipation

3.2.1. Analysis of Fretting Loop Evolution

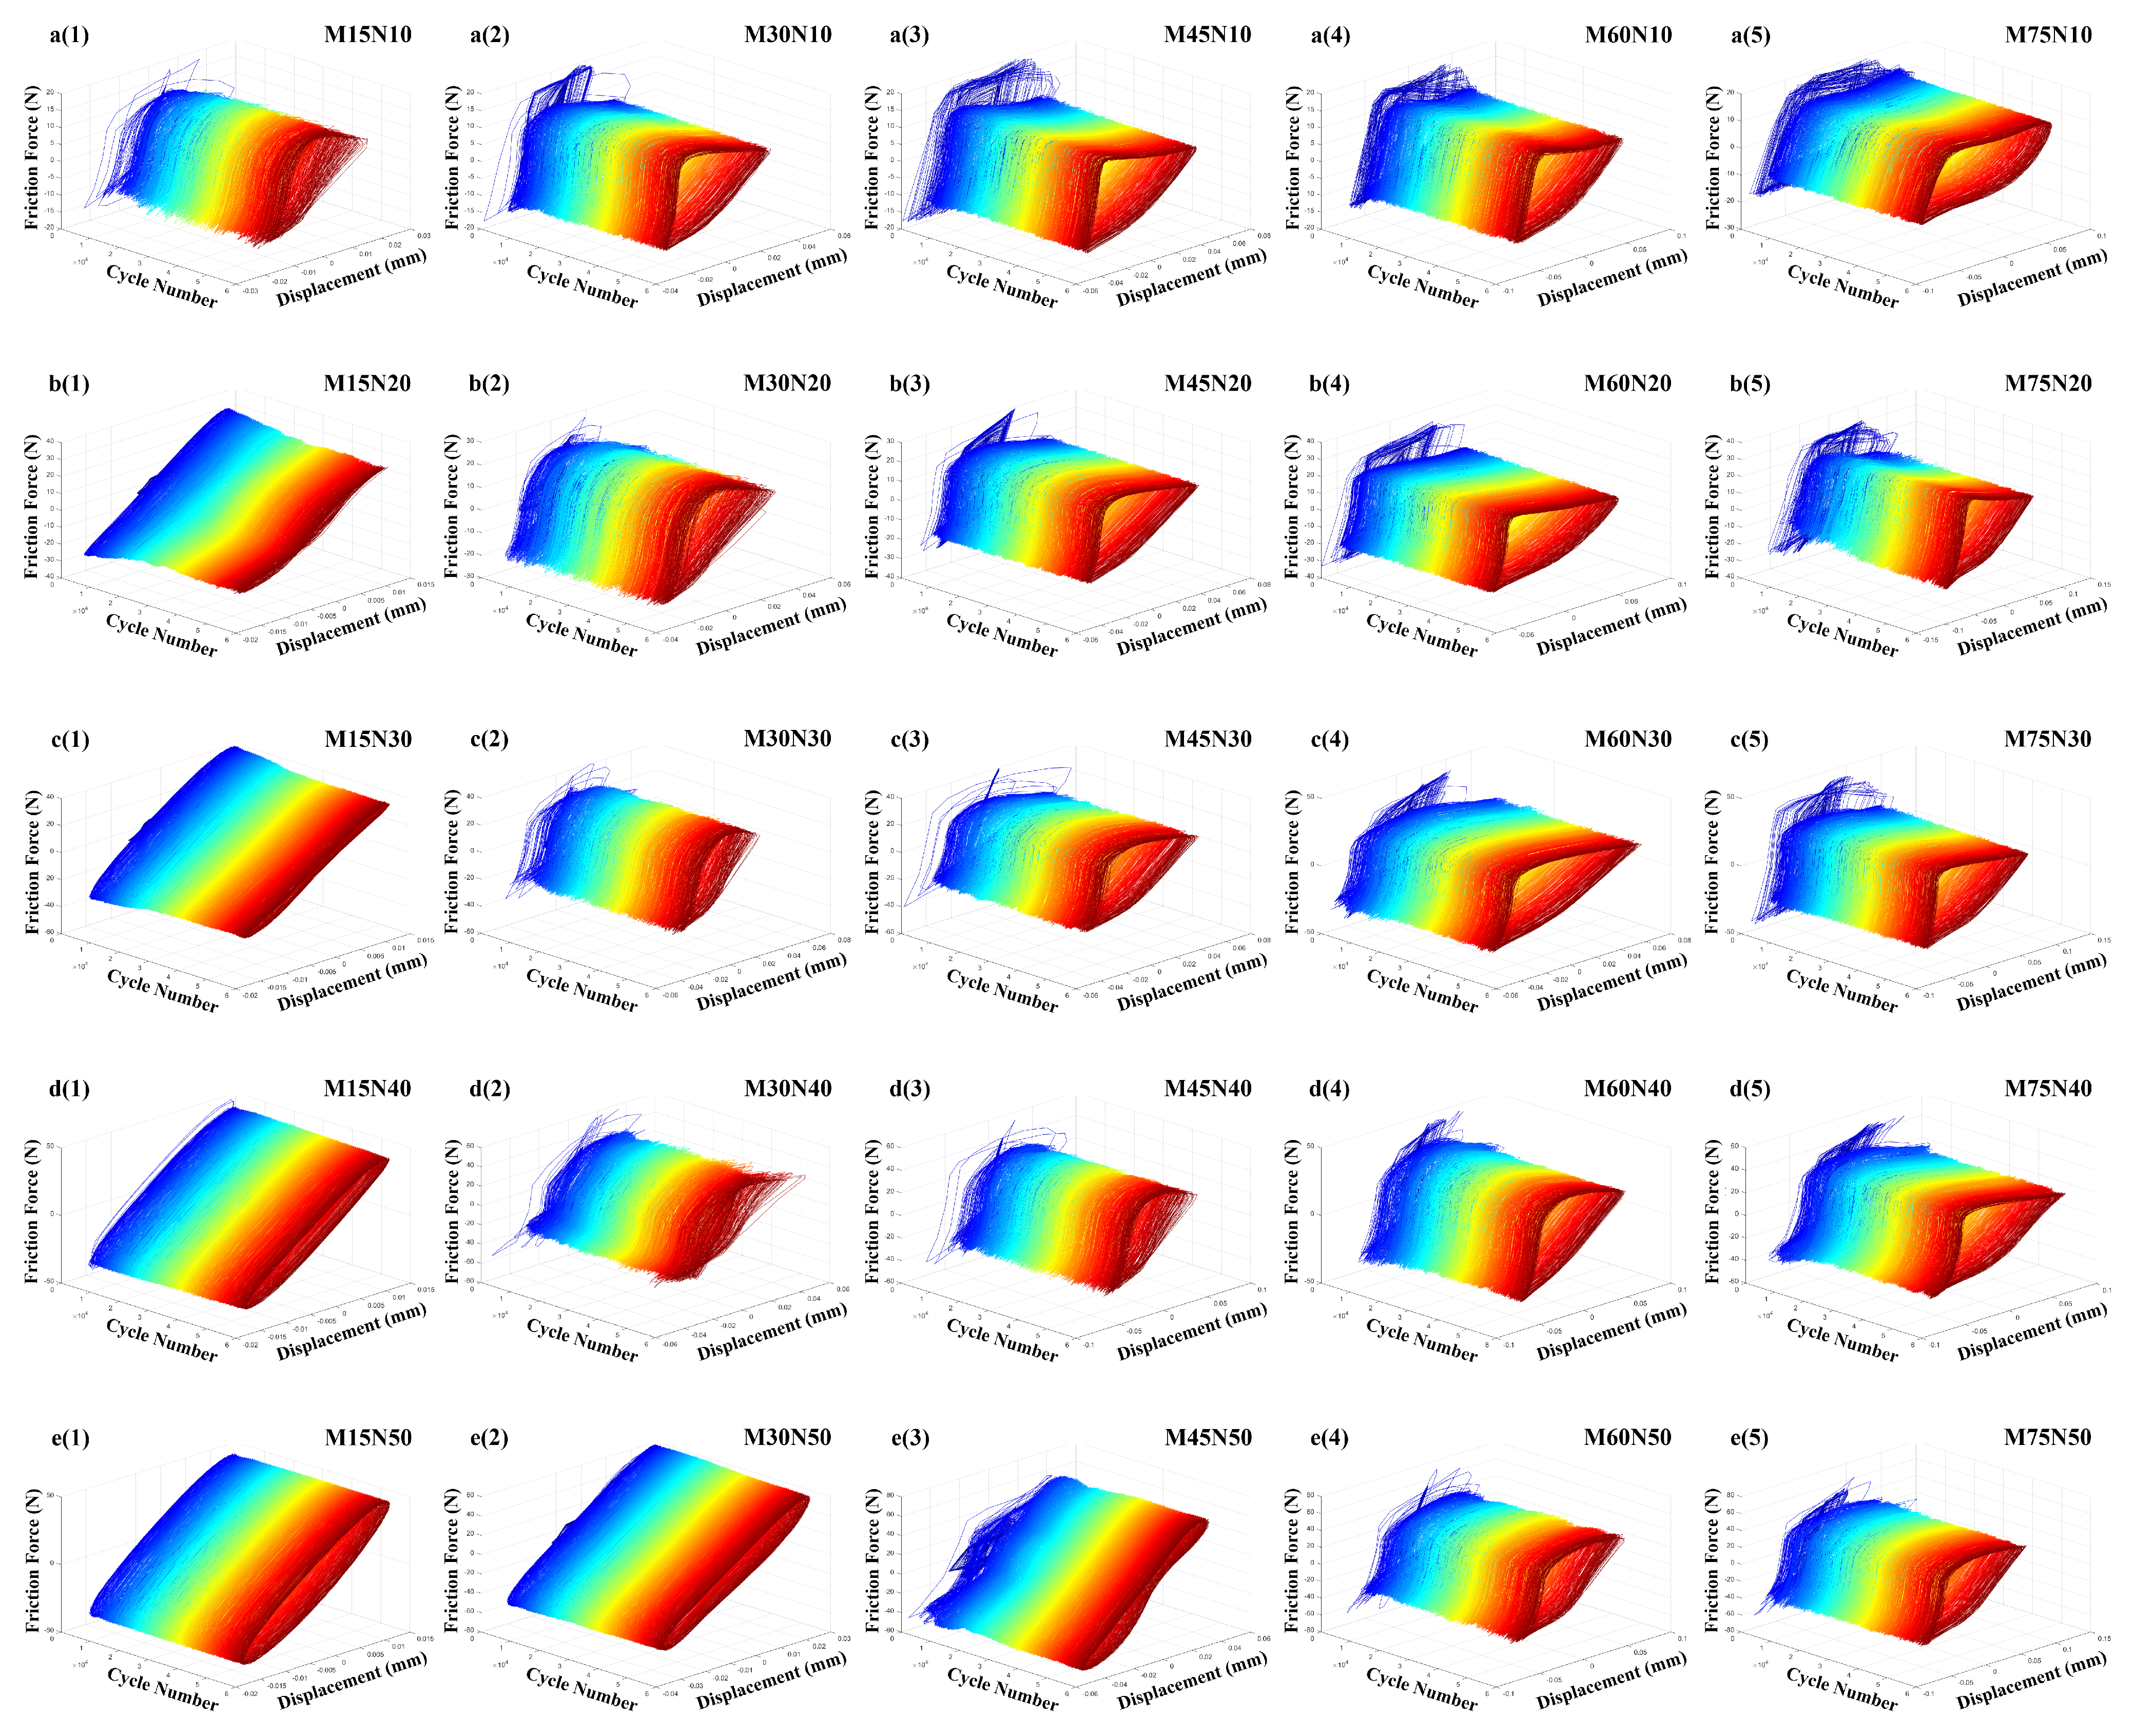
As shown in Figure 10, at a displacement amplitude of 15 μ m, the hysteresis loop is narrow and symmetric, forming an ellipse; the loading and unloading branches overlap uniformly, indicating that the interface is in a load-dominated partial slip stable contact behavior. At 30 μ m and 45 μ m, the loop progressively transitions from an ellipse to a shape with an increasing tilt angle, reflecting a change in contact condition from partial slip toward gross slip, as reported in [27]. At 60 μ m and 75 μ m, the hysteresis loop develops into a typical steep-rise–steep-drop triangular shape, indicating that the interface has entered an amplitude-dominated gross slip state: the constraint of normal load on the contact behavior is greatly reduced, and shear slip completely dominates the material removal process.
Additionally, with increasing number of cycles, the shape of the hysteresis loop undergoes a progression from a near line to an ellipse, then to a parallelogram, and finally to a triangle, reflecting a shift in the controlling mechanism from a mixed stick-slip state to a fully gross slip state. According to previous studies, such triangular hysteresis loops primarily occur when the imposed displacement amplitude far exceeds the partial slip threshold and the interface enters gross slip, combined with a rapid establishment of friction force during loading and an almost instantaneous disappearance of friction during unloading due to a very weak restoring force [28,29,30]. This leads to the characteristic behavior of a linear increase in friction during loading, followed by a vertical drop during unloading.
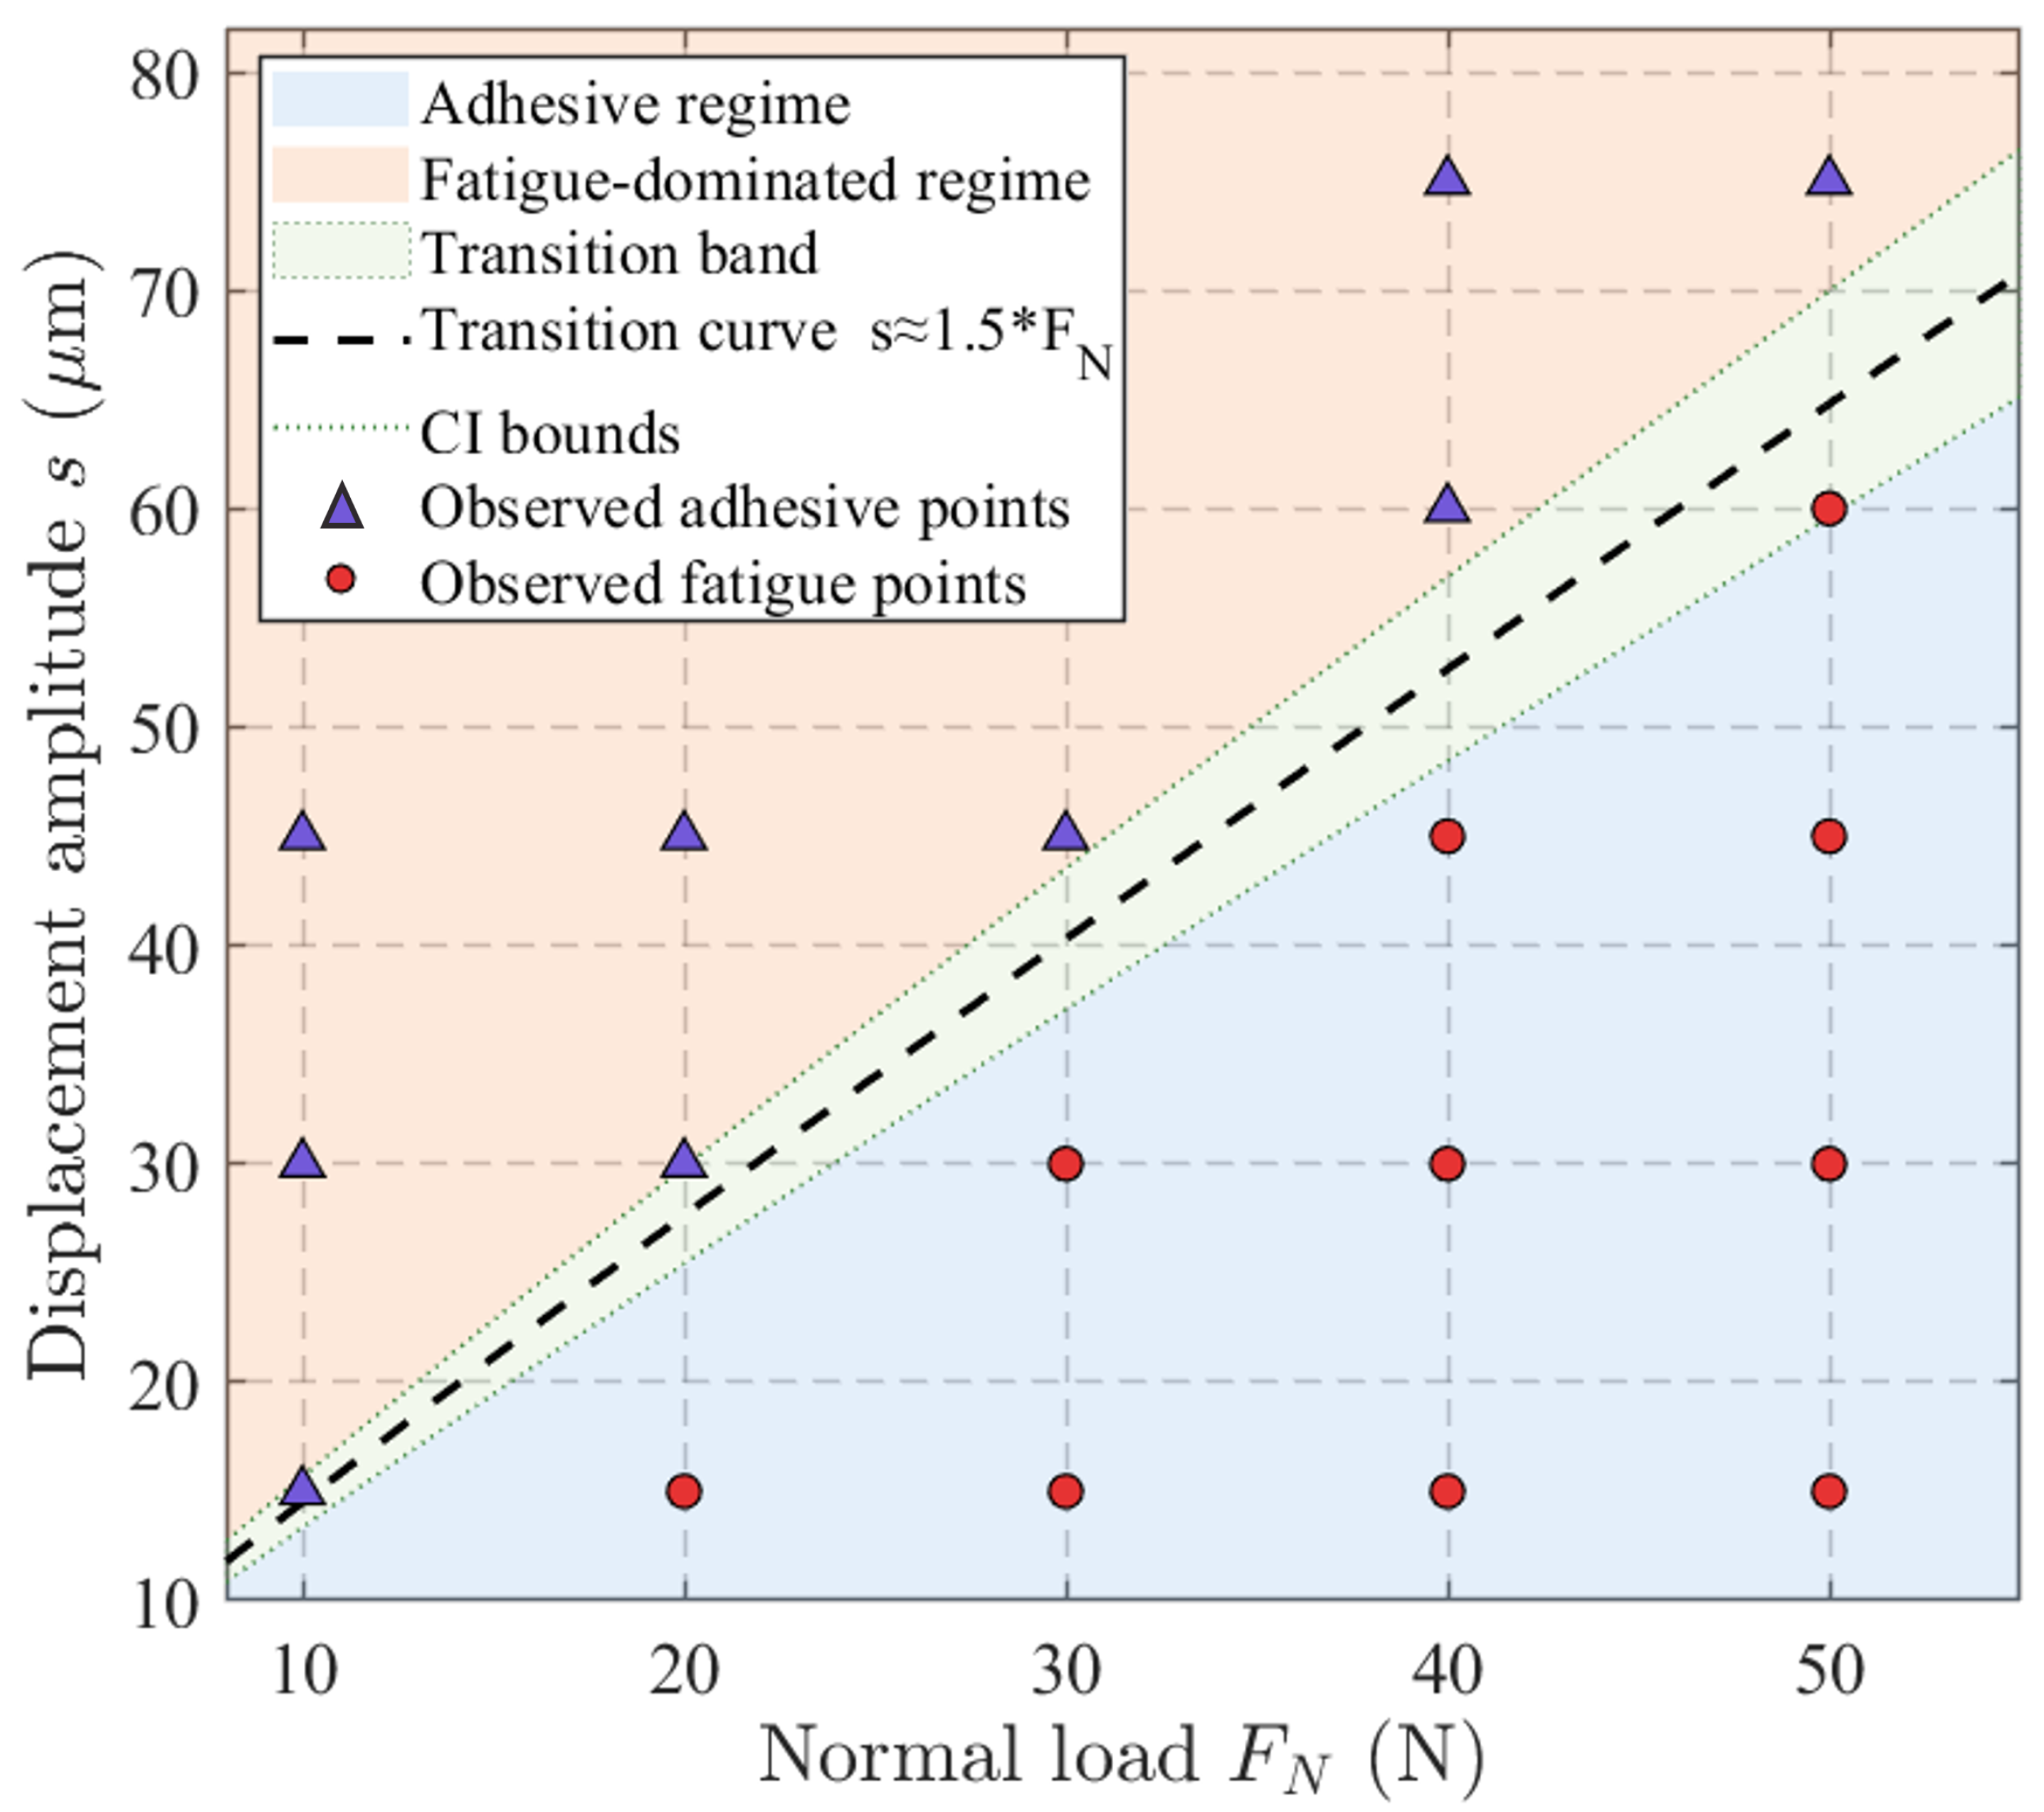
Notably, across the matrix of load and amplitude parameters, there is an approximate balance threshold along a diagonal where the load-to-amplitude ratio is around 1:1.5. For parameter combinations below this threshold line, the hysteresis loops remain symmetric ellipses, and the wear scar profiles are regular, symmetric bowl shapes, indicating small, uniformly distributed material removal. Once beyond this threshold, the hysteresis loop abruptly switches to a triangular shape, and the wear scar profile concurrently develops a pronounced asymmetry, one side raised, the other side more gradually sloped, indicating that the distribution of the contact shear force field has shifted. The interface transitions from a load-dominated partial slip to an amplitude-dominated gross slip condition, and material removal becomes directional and offset.
In summary, the transformation of the hysteresis loop from a symmetric ellipse to a triangle coincides with the change of the wear scar profile from symmetric to asymmetric, and both jointly reveal a fundamental shift in the interface control mechanism. In conjunction with Figure 4 and Figure 5, it can be seen that under high amplitude and high load conditions, wear volume and area increase significantly. This further confirms that the change in loop shape, the loss of scar profile symmetry, and the material removal mechanism are closely interrelated, and their distribution trends in the load–amplitude matrix are highly consistent.

3.2.2. Dissipated Energy Response Analysis

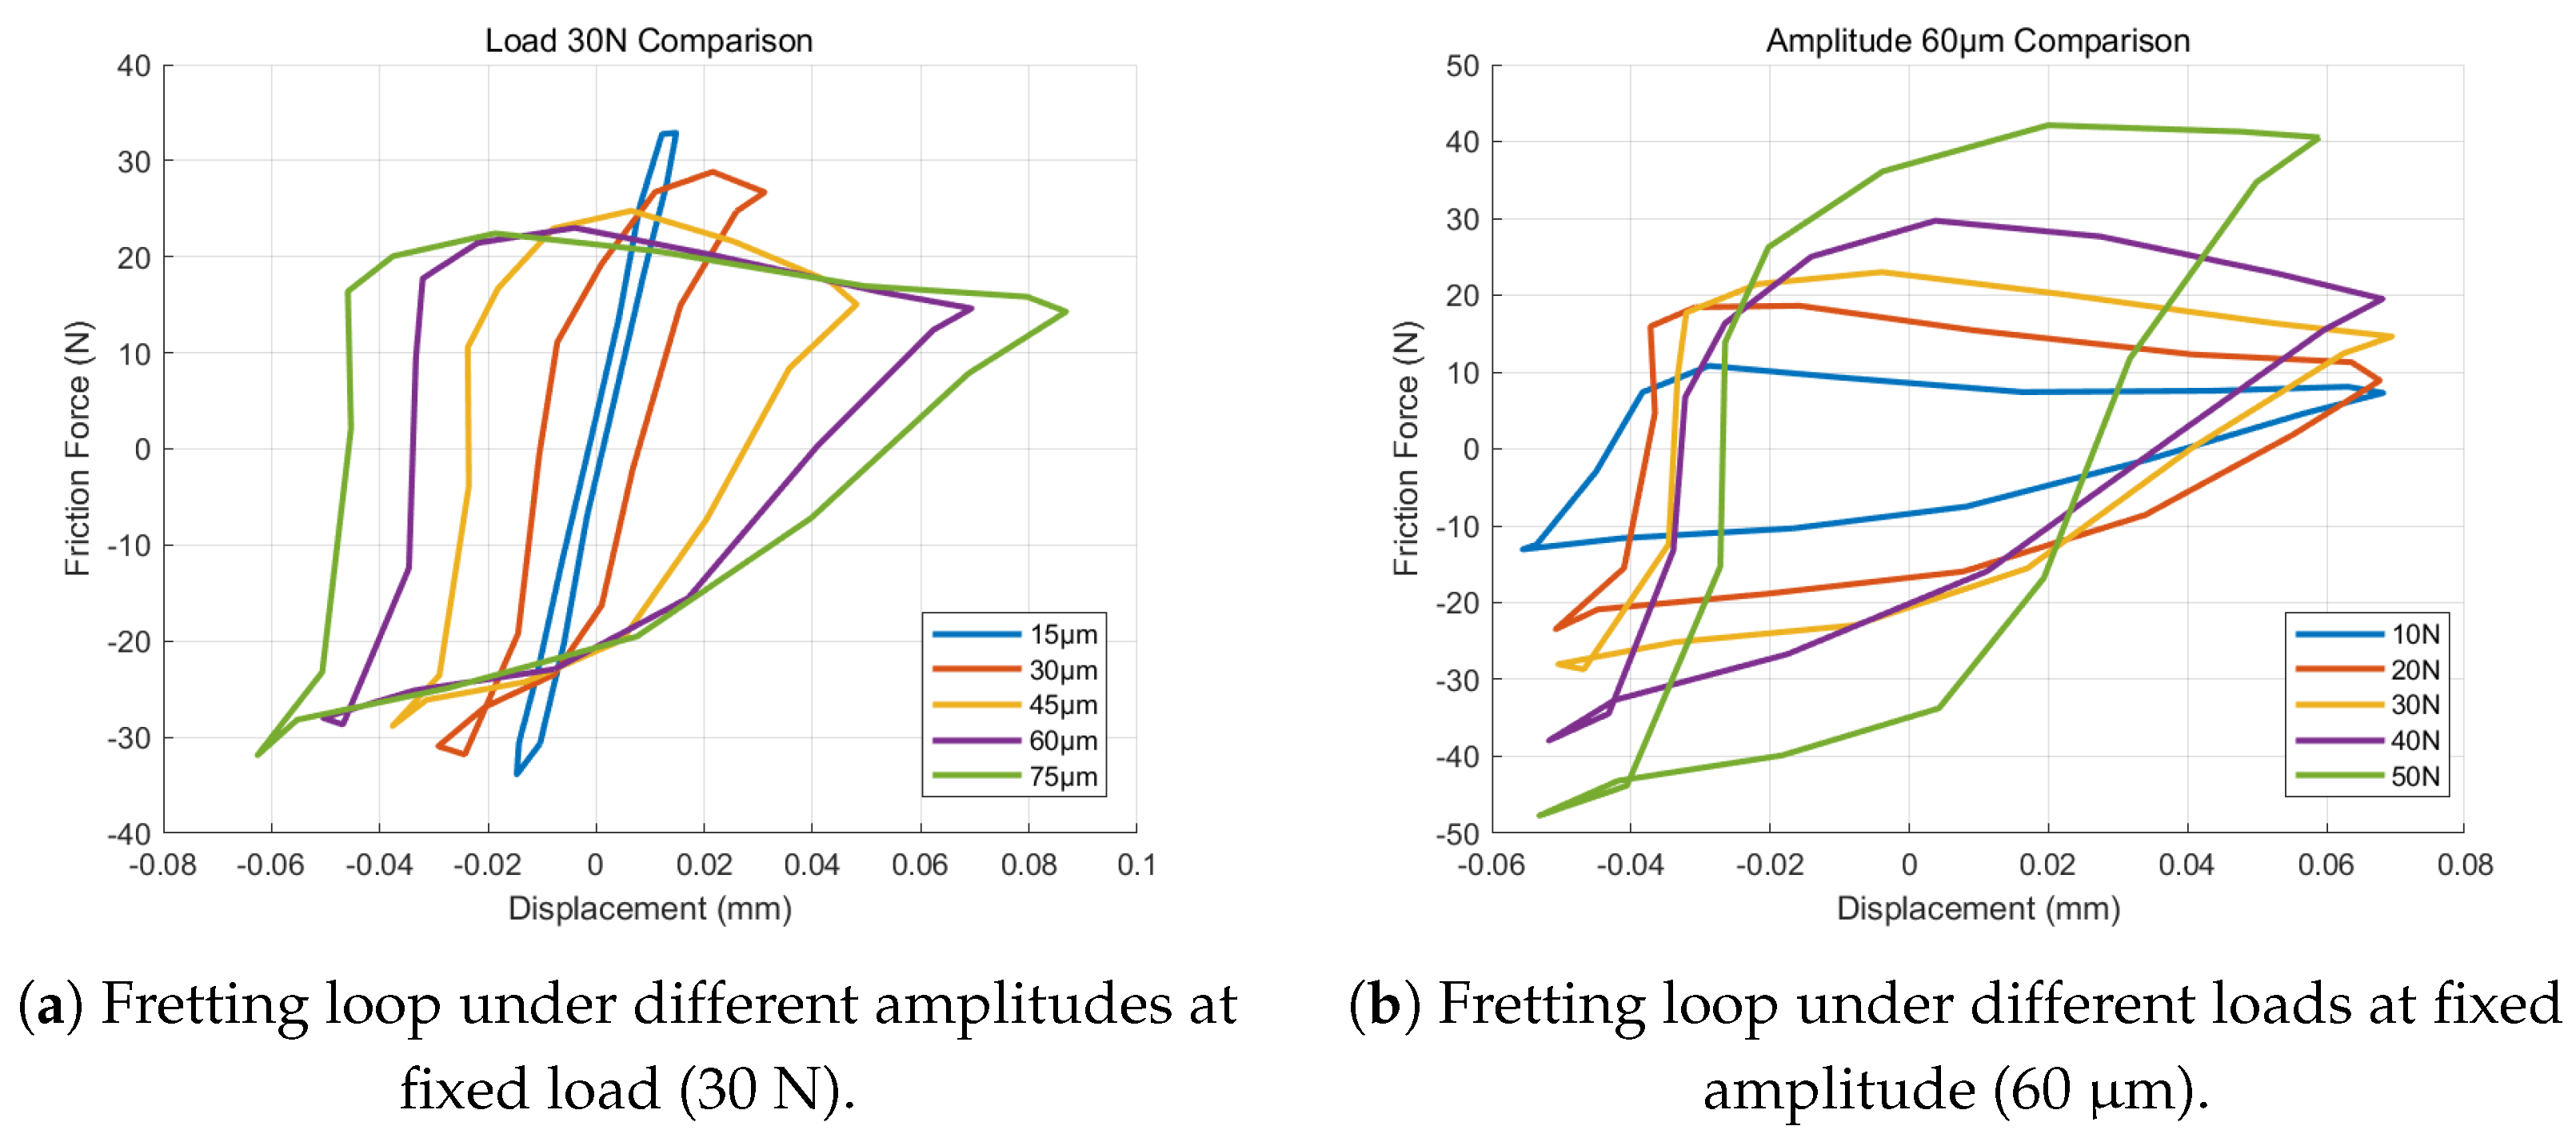
Because the trends of loop evolution under different load–amplitude combinations are highly consistent and a single loop is representative of the contact behavior, only two sets of results are selected here for analysis. Figure 11a shows the hysteresis loops at 60 μ m amplitude under varying load (10 N, 30 N, 50 N), and Figure 11b shows the loops at 30 N load under varying amplitude (15 μ m, 45 μ m, 75 μ m), to illustrate the evolution of slip behavior at the contact interface. In the 60 μ m amplitude condition (Figure 11a), as the normal load increases from 10 N to 50 N, the hysteresis loop shape changes significantly. At 10 N, the loop is narrow and nearly triangular: the loading branch is steep and linear, and the unloading branch drops almost straight down, giving an elongated shape. This suggests that friction force builds up almost instantaneously during loading and vanishes rapidly upon unloading. At 30 N, the top of the loop becomes flatter and the overall shape transitions toward a parallelogram, with increased loop width. This indicates that the friction force builds up more gradually, and the changes in force during loading and unloading become more balanced. By 50 N, the loop broadens further, approaching an obtuse parallelogram shape with nearly equal slopes for loading and unloading, suggesting that the contact stiffness and frictional response have stabilized and the friction force evolution is now characterized by gentle rise and gentle fall.
Under the 30 N load condition (Figure 11b), as the amplitude increases from 15 μ m to 75 μ m, the hysteresis loop shape evolves from a closed ellipse into a steep triangle. At 15 μ m, the loop is a typical slender ellipse with uniform slopes on the loading and unloading branches, indicating that friction force increases and decreases smoothly with displacement. By 45 μ m, the loop top tends to flatten and the shape becomes wider and flatter; the loading branch slope increases and the unloading drop becomes quicker, signifying a faster accumulation of friction. At 60 μ m and 75 μ m, the loop finally evolves into a characteristic triangle: the loading branch is nearly vertical and the unloading branch drops almost straight to zero, yielding a very steep loop. This indicates that the friction force is established almost instantaneously during loading and vanishes abruptly on unloading, marking a transition of the contact behavior from stable to transient.
In summary, raising the normal load mainly adjusts the width and flatness of the hysteresis loop, which indicates a stabilization of the frictional response and an increase in contact stiffness. In contrast, increasing the amplitude primarily affects the steepness and height of the loop, reflecting faster friction force buildup and a more abrupt onset of gross slip.
In fretting wear studies, the dissipated energy per cycle is commonly quantified by the area enclosed within the friction force–displacement (Fs) hysteresis loop, which represents the work performed by friction. The dissipation energy ( E d ) for a given number of cycles can be calculated as
E d = 2 s 0 s f d s s 0 s f d s ,
where f is the instantaneous friction force, s 0 is the fretting displacement radius, s denotes the applied displacement amplitude, and d s represents the incremental sliding distance. This formulation effectively evaluates the net work dissipated in a complete fretting cycle.
Figure 12a illustrates the determination of E d from a representative Fs loop. By applying this method to the experimental data, the cycle-dependent dissipated energy under various loading conditions was obtained. As shown in Figure 12b, E d increases nonlinearly with displacement amplitude, highlighting the dominant role of amplitude in controlling slip distance and interfacial energy input. In contrast, the effect of the normal load F N is primarily regulatory: higher F N enhances the contact stress and frictional resistance, leading to a moderate increase in E d .
It is further observed in Figure 12b that the dissipated energy does not follow a strictly monotonic trend with normal load. The curves corresponding to 30 N and 40 N nearly overlap, while at 50 N the dissipated energy decreases. This indicates that the system enters a critical slip regime, where additional load promotes surface hardening or increases interfacial stiffness. Consequently, part of the input energy is dissipated through plastic deformation rather than contributing to material removal, resulting in a temporary reduction in E d . Beyond this state, the dissipated energy resumes a monotonic increase.
With respect to amplitude, Figure 12b shows that E d exhibits a nonlinear growth. When the amplitude exceeds approximately 45 μ m, the increase shifts from gradual to steep, resembling an exponential trend, which coincides with the sharp escalation of wear volume. This transition reflects a fundamental change in the prevailing wear mechanism.
Overall, the evolution of dissipated energy per cycle closely parallels that of wear volume. Both increase with amplitude and load, and after the transition into the gross slip regime (GSR), where shear slip fully dominates the contact response, the relationship between energy input and material removal becomes stabilized, indicating the establishment of a consistent removal mechanism under gross slip conditions.
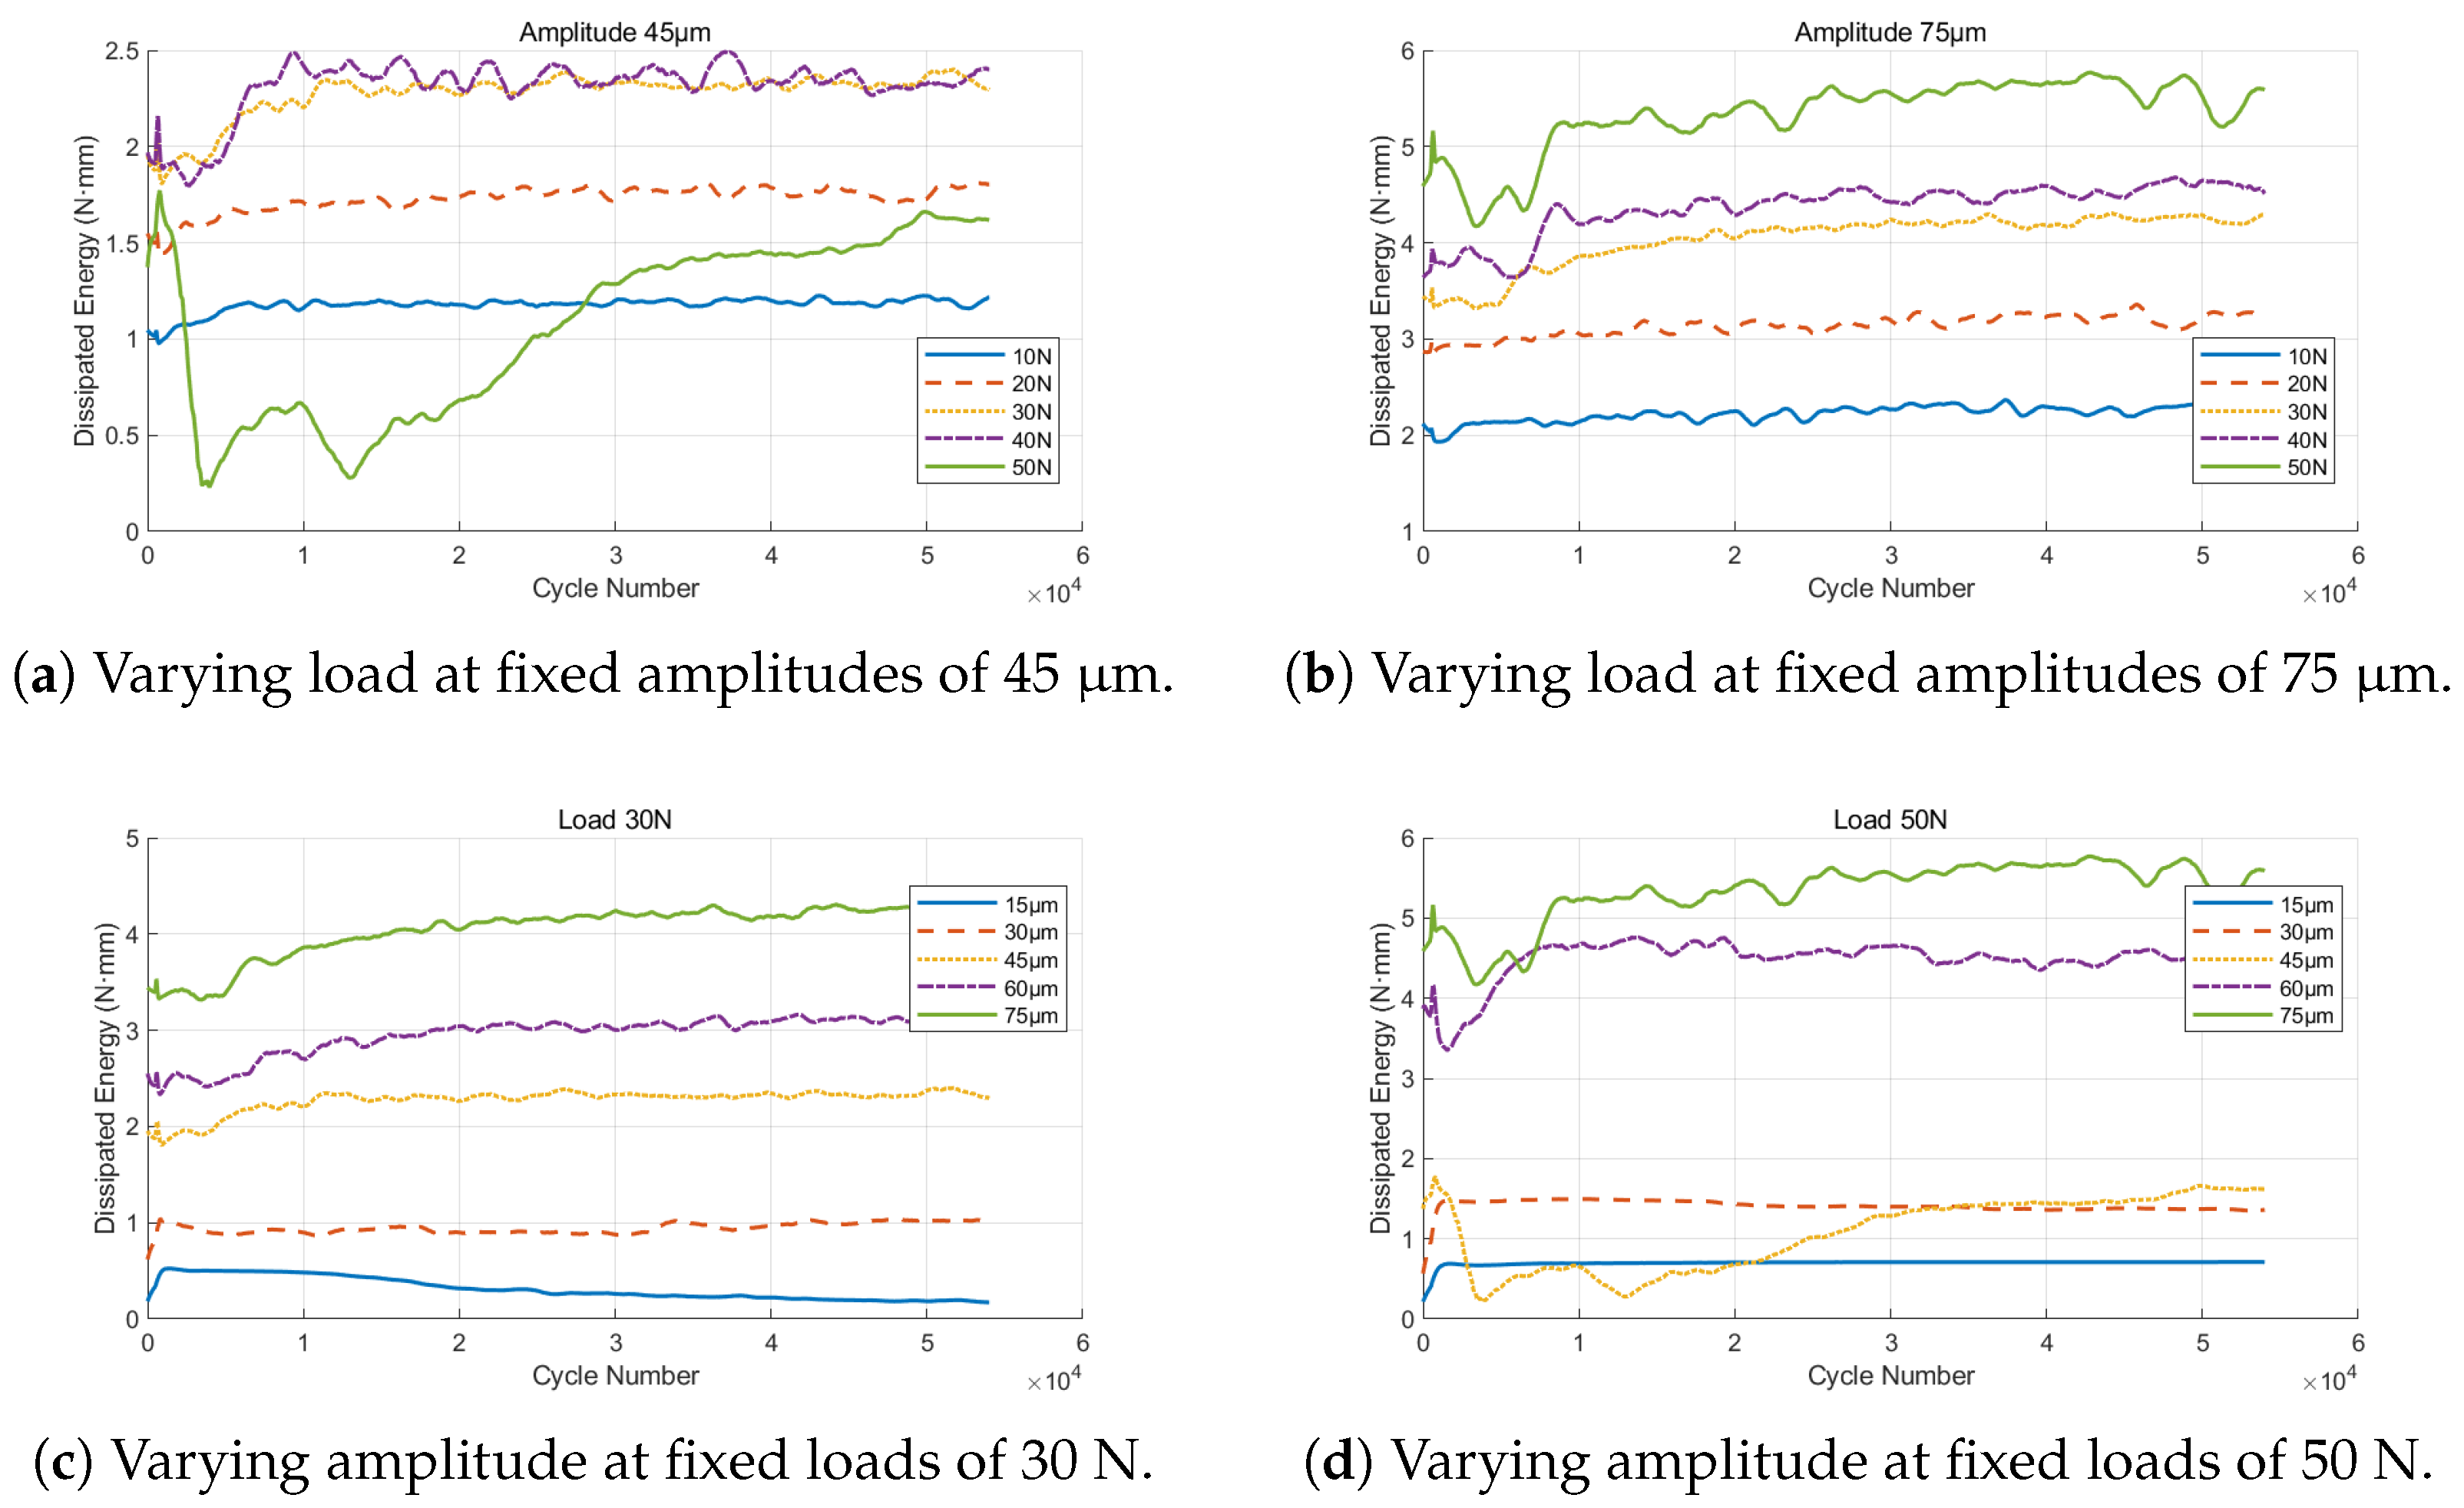
From Figure 13c,d, under constant load with varying amplitude, the times at which the dissipated energy reaches a stable region are roughly the same, indicating that amplitude has little influence on the time to dissipated energy stabilization. This trend coincides with the timing of the loop shape transition from parallelogram to triangle, implying that the onset of gross slip is governed mainly by material surface hardening and accumulation of cyclic damage, and is relatively insensitive to the amplitude level.
From Figure 13c, one can see that for amplitudes of 45, 60, and 75 μ m, the dissipated energy per cycle experiences an abrupt drop at around 3000 cycles. This corresponds exactly to the point where the hysteresis loop transitions from a parallelogram shape to an alternating triangle or line shape. This indicates that the interface slip state underwent a sudden change during this cycle interval. For instance, in the M45N50 condition, after a brief period of fluctuation, the system gradually enters a stable gross slip state as the number of cycles increases. This suggests that under high load–high amplitude combinations, interface hardening and damage accumulation accelerate the establishment of gross slip conditions, and the system eventually converges to a stable shear-dominated removal mode.
From Figure 13a,b, under fixed amplitude with varying load, the number of cycles required to reach a stable dissipated energy level is clearly extended with higher loads. In other words, under higher load conditions, the system requires a longer time to achieve steady-state energy dissipation. Specifically, in Figure 13b, the cycles needed to reach stability are about 200, 250, 4900, 6500, and 7200 for the successive load conditions. Moreover, the steady-state value of the dissipated energy per cycle increases with increasing load, indicating that higher loads enhance interfacial shear stress and prolong the transition period from partial slip to gross slip, thereby impeding the rapid establishment of the material removal process.
Overall, the evolution of the fretting hysteresis loops and the changes in dissipated energy per cycle exhibit a high degree of consistency. During the phase of rapidly increasing dissipated energy, the hysteresis loop appears as an ellipse, indicating that the interface response is dominated by elastic deformation and partial slip. As the dissipated energy begins to decrease, the hysteresis loop transforms into a parallelogram, signaling that the interface has entered the slip phase with an increasing efficiency of material removal. Ultimately, when the dissipated energy levels off, the hysteresis loop takes on a triangular form, indicating that the system has reached a gross slip state.
It is worth noting that the ratio of load to amplitude (approximately 1:1.5) not only determines the threshold for gross slip initiation but also affects the development of a stable interfacial state. As illustrated in Figure 14, this ratio defines the transition boundary between adhesive and fatigue-dominated regimes: data points located below the curve remain in the adhesive region, whereas those above it converge to a fatigue-dominated state. The transition band surrounding the boundary further highlights the gradual nature of this shift, indicating that the 1:1.5 ratio provides a quantitative criterion for predicting interfacial stability under different displacement–load combinations.

4. Mechanism Analysis with Equivalent Hardness-Corrected Archard Model

4.1. Motivation

Through the above systematic analysis of the effects of load and amplitude on fretting wear behavior, it is clear that displacement amplitude is the primary control parameter determining the magnitude of material removal, whereas normal load serves a modulating role. Under high amplitude and high load conditions, the surface wear mechanism shifts from adhesive wear to fatigue spalling, accompanied by surface work hardening and localized fatigue softening. This suggests that the surface hardness of the material varies under different loading conditions, as a result of the combined effects of work hardening induced by load and fatigue softening induced by amplitude, both of which influence the material’s wear resistance. In recent fretting wear studies, material properties have increasingly been incorporated into explaining wear behavior.
The traditional Archard model [31] assumes a constant material hardness and considers only a linear relationship between normal load and sliding distance, which cannot fully explain the exponential growth of wear volume with increasing amplitude nor the observed increase and then decrease trend of material removal under different loads. To accurately capture the material response in the fretting wear process, the Archard model needs to be modified to incorporate the influence of load and amplitude on material hardness, thereby establishing a predictive model that can reflect the experimental trends.
During the transition from PSR to MFR, metallic–oxide composite debris is continuously detached from the contact interface. With increasing normal load and number of cycles, these debris particles undergo repeated compaction and adhesion at the interface, gradually forming a dense third body layer (TBL). Beneath this layer, the underlying plastic deformation layer (PDL) exhibits a moderate increase in hardness by accommodating and relieving residual stresses [15]. To characterize the influence of such interfacial structural evolution on contact stiffness, an equivalent hardness correction model is introduced in this study to quantitatively represent the macroscopic enhancement induced by these effects.

4.2. Theoretical Model Development and Derivation

In the classic Archard model [31], wear volume is assumed to be proportional to the real contact area and sliding distance. It is commonly expressed as [32,33]:
V w = k · F N · s H ,
where V w is the wear volume, F N is the normal load, s is the total sliding distance, H is the material hardness, and k is a dimensionless wear coefficient.
The Archard model highlights a linear relationship between wear and both load and amplitude, but it implicitly assumes a constant material hardness H. Under the fretting conditions of the present Z10C13 system, the contact state undergoes nonlinear evolution with changes in load and amplitude, and the surface hardness as well as the real contact area no longer remain constant. Work hardening can raise the apparent hardness, reducing the volume of material removed per unit shear [11,23]; conversely, fatigue softening and cyclic damage diminish the material’s resistance, increasing the wear rate. These complexities mean that Archard’s simple linear assumptions fail to encompass the observed wear mechanisms. It is therefore necessary to modify the traditional model by introducing the influence of load and amplitude on hardness.
In this work, a physics-inspired “equivalent hardness-corrected Archard model” is proposed, in which a hardness function is introduced to capture the nonlinear influence of load and amplitude. The hardness is assumed to follow a second-order polynomial form with respect to the normal load ( F N ) and amplitude (s):
H ( F N , s ) = H 0 + α 1 F N + α 2 s + α 3 F N s + α 4 F N 2 + α 5 s 2 ,
where H 0 is the baseline hardness and α 1 , α 2 , α 3 , α 4 , α 5 are fitting coefficients reflecting the sensitivity of hardness to load, amplitude, and their interaction. The resulting hardness-corrected Archard model is expressed as:
V w = k · F N · s H 0 + α 1 F N + α 2 s + α 3 F N s + α 4 F N 2 + α 5 s 2 .
This model retains the simple structure of the Archard model but introduces the nonlinear coupling effects of load and amplitude through the hardness term in the denominator. When the load or amplitude approaches zero (so that H H 0 ), the model degenerates to the classical Archard form, preserving its validity for low stress or small amplitude cases; as the load and amplitude increase, H changes dynamically, thereby adjusting the wear increment and capturing the nonlinear effects.

4.3. Model Fitting and Validation

Based on the experimentally obtained steady-state wear volume data, nonlinear least squares fitting was performed using MATLAB 2024b. To avoid being trapped in local optima, robust weighting was employed during the fitting process. The initial parameter values were set as follows:
k = 10 6 ; α 1 , α 2 = 0.1 , α 3 = 0.01 , α 4 , α 5 = 0.001
The maximum number of iterations was set to 1000 to ensure convergence. The final fitting results were
k = 5.8482 × 10 4 ,                  α 1 = 3.5254 ,                  α 2 = 6.1076 , α 3 = 0.0368 , α 4 = 0.0109 , α 5 = 0.0497 ,
The coefficient k represents the ratio of material removal volume per unit contact stress and sliding distance. A positive coefficient for the normal load term α 1 and α 4 confirms that the normal load contributes positively by compacting interfacial wear debris, thereby equivalently increasing the contact hardness, whereas the increased amplitude term α 2 reduces interfacial support, resulting in effective softening. The load–amplitude interaction term α 3 has a negative coefficient of small magnitude, suggesting that the combined effect of load and amplitude slightly reduces hardness, and a positive coefficient for the quadratic amplitude term α 5 suggests a hardness increase at very high amplitudes.
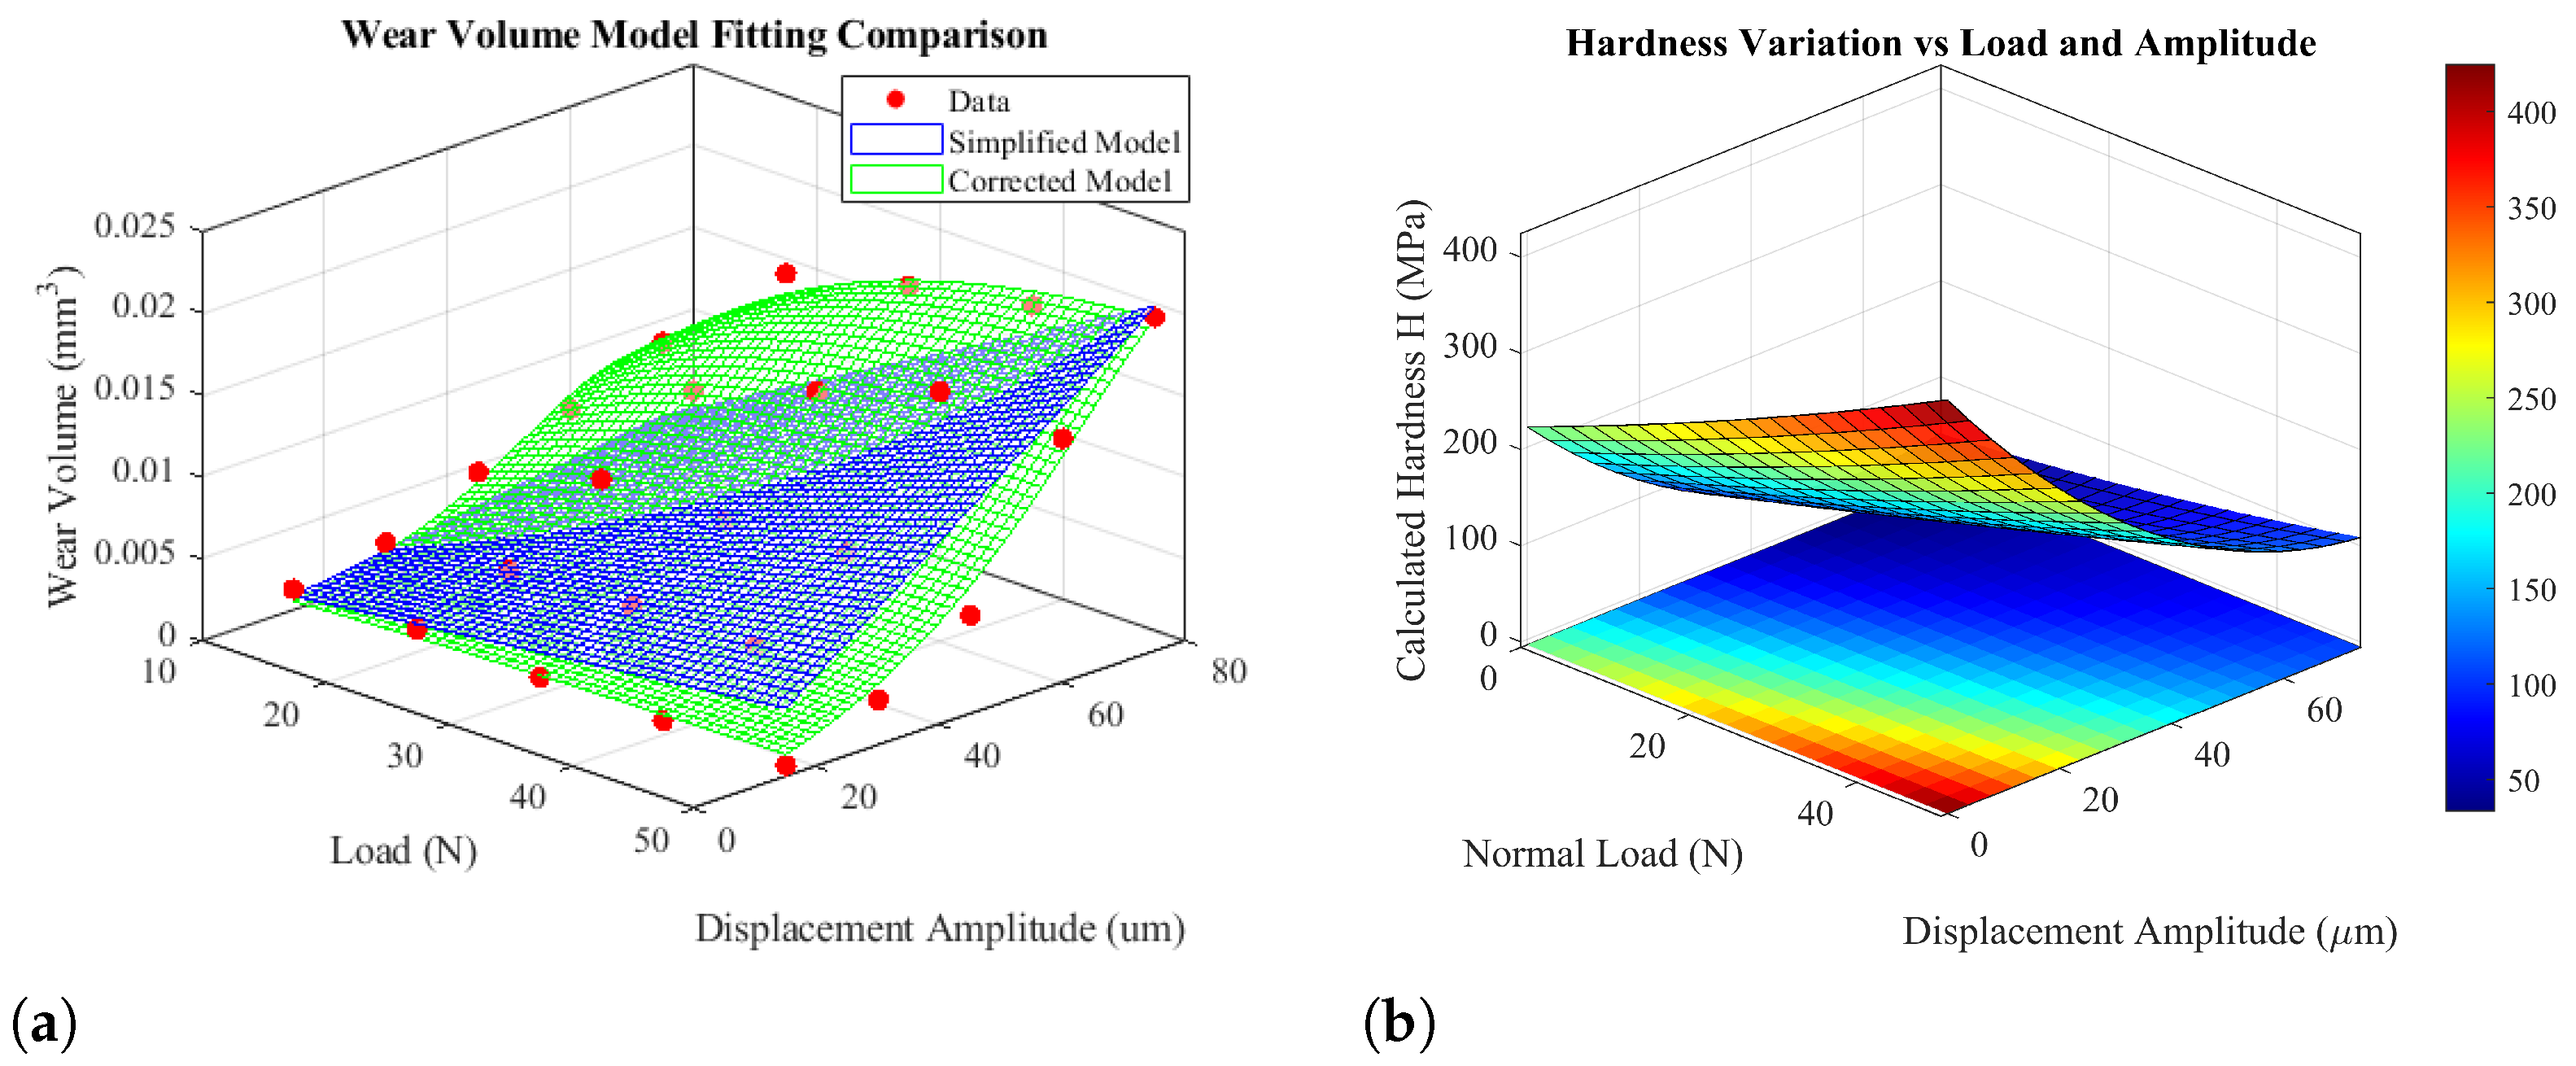
As shown in Table 4, the residual sum of squares (RSS) for the modified model is nearly zero, indicating an almost negligible fitting error; the coefficient of determination R2 is improved from 72.58% to 98.38%; and the AIC/BIC values, which take into account both fit quality and model complexity, are significantly lower. This confirms that the modified model is superior to the simple Archard model.
A three-dimensional response surface analysis of the model’s predictions was performed for varying loading conditions. As shown in Figure 15, the surface plot of equivalent hardness versus normal load (0–50 N) and amplitude (0–75 μ m) provides a visual depiction of the coupled evolution of hardness with these two factors. Along the direction of increasing normal load, the hardness generally increases. As the load rises from 10 N to 50 N, the material exhibits a clear work hardening effect, with a significant increase in surface hardness. In the high load region, the rate of increase tapers off slightly, suggesting that the contact surface is approaching a saturated hardening state. Along the direction of increasing amplitude, the surface hardness gradually decreases. This indicates that greater amplitudes lead to hardness reduction, mainly because at large displacement amplitudes the surface undergoes more severe slip cycles, accumulating fatigue damage and thermal softening, which lowers the surface strength and wear resistance. Overall, the trend of hardness variation is asymmetric: it increases with higher load and decreases with higher amplitude. Under high load conditions, even as amplitude grows, the drop in hardness is somewhat suppressed—implying that under high normal pressure, contact surface work hardening counteracts some of the softening caused by large amplitude. In contrast, under low load conditions, the softening effect of amplitude is more pronounced, indicating that the material is more sensitive to fatigue softening when the normal pressure is low. This trend reveals that under fretting conditions the material hardness is subject to the combined effects of mechanical loading and kinematic loading: normal load predominantly drives work hardening in the contact zone, whereas amplitude predominantly dictates the extent of fatigue induced damage.
Because the counterface used in this study is Inconel 690, which is much harder than Z10C13, the spherical counterface experienced virtually no wear, meaning all wear was concentrated on the support plate surface. Under this condition of hardness mismatch, the distribution of contact stiffness is extremely non-uniform: the Z10C13 surface undergoes stable, gross sliding, with friction force rising linearly and rapidly during loading and dropping almost instantly to zero during unloading due to the interface’s very low restoring force. As a result, the hysteresis loops in Figure 10 exhibit the characteristic “steep ascent–steep descent” triangular shape. This observation, together with the wear volume and morphology results in Figure 5, indicates that the evolution of the fretting loop into a triangular form is closely related to the hardness disparity between the two materials and the resultant gross slip mechanism. This finding is also consistent with the wear mechanism analysis in Section 3, confirming that the proposed model effectively captures the influence of interface hardness on the fretting wear behavior.
The fitting parameters reported here are characteristic of the Z10C13–Inconel 690 pair and should be re-evaluated when applied to other material combinations, although the model framework itself retains general applicability.

5. Conclusions

In this study, the fretting response characteristics and wear mechanisms of Z10C13 under various normal loads and displacement amplitudes were systematically investigated, establishing a multi-scale analytical framework from macroscopic response to microscopic damage morphology. The main conclusions are as follows:
  • The energy dissipation and damage behavior of the fretting system are governed by the nonlinear coupling of normal load and displacement amplitude. Higher normal loads increase contact stress and promote adhesion, while larger amplitudes extend the slip path and stress cycles. Together, these factors synergistically enhance interfacial damage and result in greater wear volume.
  • Systematic analysis shows that when the load-to-amplitude ratio exceeds approximately 1:1.5, the wear mechanism rapidly shifts from adhesive sliding to fatigue spalling. This transition is accompanied by a dramatic increase in the asymmetry of the wear scar depth profile, indicating a critical change in the interfacial damage mode and confirming the nonlinear transition of material removal mechanisms.
  • The hardness-corrected Archard model proposed in this work effectively captures the nonlinear influence of load and amplitude on wear volume. Its prediction accuracy ( R 2 = 0.9838 ) is significantly higher than that of the traditional Archard model ( R 2 = 0.7258 ), making it a useful tool for rapid prediction of fretting wear and service life assessment.
In future work, comparative tests between room-temperature air and high-temperature air, as well as between room-temperature air and aqueous media, will be conducted using our current testing system to further evaluate the applicability of the present findings to practical service environments. Overall, this work not only reveals the damage evolution of Z10C13 under fretting service conditions, but also provides a theoretical foundation and methodological guidance for developing future fretting wear prediction models and designing wear resistant structures.

Supplementary Materials

The following supporting information can be downloaded at: https://www.mdpi.com/article/10.3390/lubricants13090421/s1, Figure S1. Surface morphologies of Inconel 690 ball specimens after fretting tests under different load and amplitude conditions; Figure S2. Micrographs of wear scars under various amplitudes and loads conditions.

Author Contributions

Conceptualization, J.N., Y.W., Z.M., and R.L.; methodology, Y.W. and Z.M.; investigation, R.L.; resources, J.N.; data curation, R.L.; writing—original draft preparation, R.L.; writing—review and editing, B.S. and H.Z.; visualization, R.L. and B.S.; supervision, Z.M. and J.N.; project administration, Z.M. and J.N.; validation, Z.M.; funding acquisition, J.N. All authors have read and agreed to the published version of the manuscript.

Funding

This work was supported in part by the Aero Science Foundation of China (Grant No. 2024M0440T5002 and 2024Z0450T5002), the National Key R&D Program of China (Grant No. 2022YFB3401900) and the Zhejiang Provincial Natural Science Foundation of China (Grant No. LQ24A020014). The APC was funded by No. 2022YFB3401900.

Data Availability Statement

Dataset available on request from the authors, the raw data supporting the conclusions of this article will be made available by the authors on request.

Conflicts of Interest

The authors declare no conflicts of interest.

Abbreviations

The following abbreviations are used in this manuscript:
PWRpressurized water reactor
FIVflow induced vibrations
PSRpartial slip regime
MFRmixed fretting regime
GSRgross slip regime
TBLthird body layer
PDLplastic deformation layer
TSPstube support plates

References

  1. Kang, K.S.; Kupca, L. Assessment and Management of Ageing of Major Nuclear Power Plant Components Important to Safety: Steam Generators (2011 Update); International Atomic Energy Agency: Vienna, Austria, 2011. [Google Scholar]
  2. Bian, W.W.; Liu, X.; Wang, F.; Xiao, J.; Zhang, X.F.; Han, Y.Q.; Cheng, Z.Y.; Shoji, T. Insights into the fretting corrosion behavior and damage mechanism of Inconel 690TT in water and steam environments containing different dissolved oxygen levels. Corros. Sci. 2025, 253, 113018. [Google Scholar] [CrossRef]
  3. Yun, J.Y.; Shin, G.S.; Kim, D.I.; Lee, H.S.; Kang, W.S.; Kim, S.J. Effect of carbide size and spacing on the fretting wear behavior of Inconel 690 SG tube mated with SUS 409. Wear 2015, 338–339, 252–257. [Google Scholar] [CrossRef]
  4. Cai, Z.B.; Li, Z.Y.; Yin, M.G.; Zhu, M.H.; Zhou, Z.R. A review of fretting study on nuclear power equipment. Tribol. Int. 2020, 144, 106095. [Google Scholar] [CrossRef]
  5. Gru, O. Technical Specifications Task Force; EXCEL Services Corporation: Rockville, MD, USA, 2005. [Google Scholar]
  6. Sollier, T.; Le Calvar, M.; Balestreri, F.; Mermaz, F. Recent safety issues concerning steam generators in France and their analysis by IRSN. In Proceedings of the 6th CNS International Steam Generator Conference, Toronto, ON, Canada, 8–11 November 2009. [Google Scholar]
  7. Dow, B.L., Jr. Steam Generator Progress Report: Revision 12; Technical Report EPRI TR-106365; Electric Power Research Institute (EPRI): Palo Alto, CA, USA, 1996. [Google Scholar]
  8. Xie, W.; Ding, S.; Rong, B.; Wang, X.; Xu, L.; Peng, J. Study on the Effect of Normal Loads on the Fretting Wear Performance of Zr-4 Alloy Tubes Under Three Fretting Modes. Tribol. Lett. 2025, 73, 34. [Google Scholar] [CrossRef]
  9. Li, Y.; Xie, G.; Sun, X.; Jingcao, C.; Wu, X.; Zhang, Y.; Yu, C.; Du, P. A review on fretting wear/fatigue behavior, protective measures, and application examples of typical alloy materials. Proc. Inst. Mech. Eng. Part J J. Eng. Tribol. 2025, 239, 1261–1290. [Google Scholar] [CrossRef]
  10. Chen, H.; Mei, G.; Wang, G.; Tan, W.; Zhu, G. Fretting wear and corrosion in liquid lead-bismuth eutectic: A review of current state and prospect. Eng. Sci. 2025, 35, 1594. [Google Scholar] [CrossRef]
  11. Xin, L.; Huang, Q.; Han, Y.; Lu, Y.; Zhang, W.; Shoji, T. The damage mechanism of Alloy 690TT against Alloy 600 caused by fretting wear in room temperature pure water. Mater. Charact. 2020, 161, 110176. [Google Scholar] [CrossRef]
  12. Wang, J.; Li, H.; Li, Z.; Lei, Y.; Ren, Q.; Jiao, Y.; Cai, Z. Fretting wear characteristics of nuclear fuel cladding in high-temperature pressurized water. Chin. J. Mech. Eng. 2023, 36, 101. [Google Scholar] [CrossRef]
  13. Ding, H.; Cao, Y.; Hua, K.; Tong, Y.; Li, N.; Sun, L.; Li, X.; Wu, H.; Wang, H. Fretting wear resistance at ambient and elevated temperatures of 316 stainless steel improved by laser cladding with Co-based alloy/WC/CaF2 composite coating. Opt. Laser Technol. 2023, 163, 109428. [Google Scholar] [CrossRef]
  14. Xu, Z.; Li, D.; Lu, Z.; Lv, X.; Liu, Y.; Liu, J.; He, C. Study on the fretting wear behavior over a wide temperature range of an Inconel 718 superalloy deposited by laser cladding. Eng. Fail. Anal. 2023, 143, 106864. [Google Scholar] [CrossRef]
  15. Zhang, Y.; Wu, B.; Ming, H.; Wang, J.; Wang, J.; Han, E.H. Effects of displacement amplitude and normal force on fretting wear behavior of zirconium alloy tube in simulated primary water of PWR. Wear 2024, 542–543, 205271. [Google Scholar] [CrossRef]
  16. Winter, T.; Neu, R.W.; Singh, P.M.; Kolaya, L.E.; Vizoso, D.; Deo, C.S. Coefficient of friction evolution with temperature under fretting wear for FeCrAl fuel cladding candidate. J. Nucl. Mater. 2019, 520, 140–151. [Google Scholar] [CrossRef]
  17. Wang, Z.; Xu, J.; Li, J.; Xin, L.; Lu, Y.; Shoji, T.; Takeda, Y.; Otsuka, Y.; Mutoh, Y. The synergy of corrosion and fretting wear process on Inconel 690 in the high temperature high pressure water environment. J. Nucl. Mater. 2018, 502, 255–262. [Google Scholar] [CrossRef]
  18. Xie, L.; Guan, Y.; Lu, J.; Zhu, P.; Chen, R.; Lin, H. Fretting wear behavior test and numerical simulation of Inconel 690 alloy. J. Nucl. Sci. Technol. 2023, 60, 1100–1115. [Google Scholar] [CrossRef]
  19. Mace, A.O.; Kurtz, M.A.; Gilbert, J.L. Fretting and fretting corrosion behavior of additively manufactured Ti-6Al-4V and Ti-Nb-Zr alloys in air and physiological solutions. J. Funct. Biomater. 2024, 15, 38. [Google Scholar] [CrossRef]
  20. He, J.; Peng, J.; Ren, Y.; Cai, Z.; Liu, J.; Zhu, M. Study on improving fretting wear properties of AISI 4135 steel via diverse surface modifications under grease lubrication. Wear 2022, 490, 204210. [Google Scholar] [CrossRef]
  21. Zhang, Y.; Wang, S.; Ming, H.; Wang, J.; Han, E.H. Study of fretting wear behavior of 690TT heat exchanger tube under three fretting regimes in high temperature pressurized water. J. Nucl. Mater. 2025, 605, 155559. [Google Scholar] [CrossRef]
  22. Bian, W.W.; Hong, C.; Xin, L.; Kang, L.Z.; Han, Y.M.; Liu, H.; Shoji, T.; Lu, Y.H. Effect of the cycle number on fretting wear behavior of alloy 690TT tube in high-temperature pressurized water. J. Nucl. Mater. 2022, 567, 153828. [Google Scholar] [CrossRef]
  23. Lai, P.; Gao, X.; Tang, L.; Guo, X.; Zhang, L. Effect of temperature on fretting wear behavior and mechanism of alloy 690 in water. Nucl. Eng. Des. 2018, 327, 51–60. [Google Scholar] [CrossRef]
  24. Tassone, A.; Meeusen, J.; Serafini, A.; Caruso, G. Numerical study of liquid metal turbulent heat transfer in cross-flow tube banks. Energies 2023, 16, 387. [Google Scholar] [CrossRef]
  25. Xie, X.; Ma, A.; Zhao, H.; Li, X.; Wu, X. Experimental investigation and analysis on the cross flow characteristics over inline tube bundles with S/D = 1.875. Int. J. Heat Mass Transf. 2023, 203, 1006. [Google Scholar] [CrossRef]
  26. Fessler, G.; Sadeghi, A.; Glatzel, T.; Goedecker, S.; Meyer, E. Atomic friction: Anisotropy and asymmetry effects. Tribol. Lett. 2019, 67, 2. [Google Scholar] [CrossRef]
  27. Fantetti, A.; Tamatam, L.R.; Volvert, M.; Lawal, I.; Liu, L.; Salles, L.; Brake, M.R.; Schwingshackl, C.W.; Nowell, D. The impact of fretting wear on structural dynamics: Experiment and simulation. Tribol. Int. 2019, 138, 111–124. [Google Scholar] [CrossRef]
  28. Rustamov, I.; Guo, F.; Wang, Z. Experimental investigations into fretting wear and damage mechanisms of Inconel X-750 alloy. J. Mech. Sci. Technol. 2019, 33, 4701–4713. [Google Scholar] [CrossRef]
  29. Souilliart, T.; Rigaud, E.; Le Bot, A.; Phalippou, C. Energy-based wear law for oblique impacts in dry environment. Tribol. Int. 2017, 105, 241–249. [Google Scholar] [CrossRef]
  30. Attia, M.H.; Magel, E. Experimental investigation of long-term fretting wear of multi-span steam generator tubes with U-bend sections. Wear 1999, 225–229, 563–574. [Google Scholar] [CrossRef]
  31. Lin, X.; Xu, Y. An equivalent damage model to fretting fatigue initiation life considering wear. Int. J. Fatigue 2022, 163, 107048. [Google Scholar] [CrossRef]
  32. Blau, P.J. Friction Science and Technology, 2nd ed.; CRC Press: Boca Raton, FL, USA, 2008. [Google Scholar]
  33. Archard, J.F. Contact and rubbing of flat surfaces. J. Appl. Phys. 1953, 24, 981–988. [Google Scholar] [CrossRef]
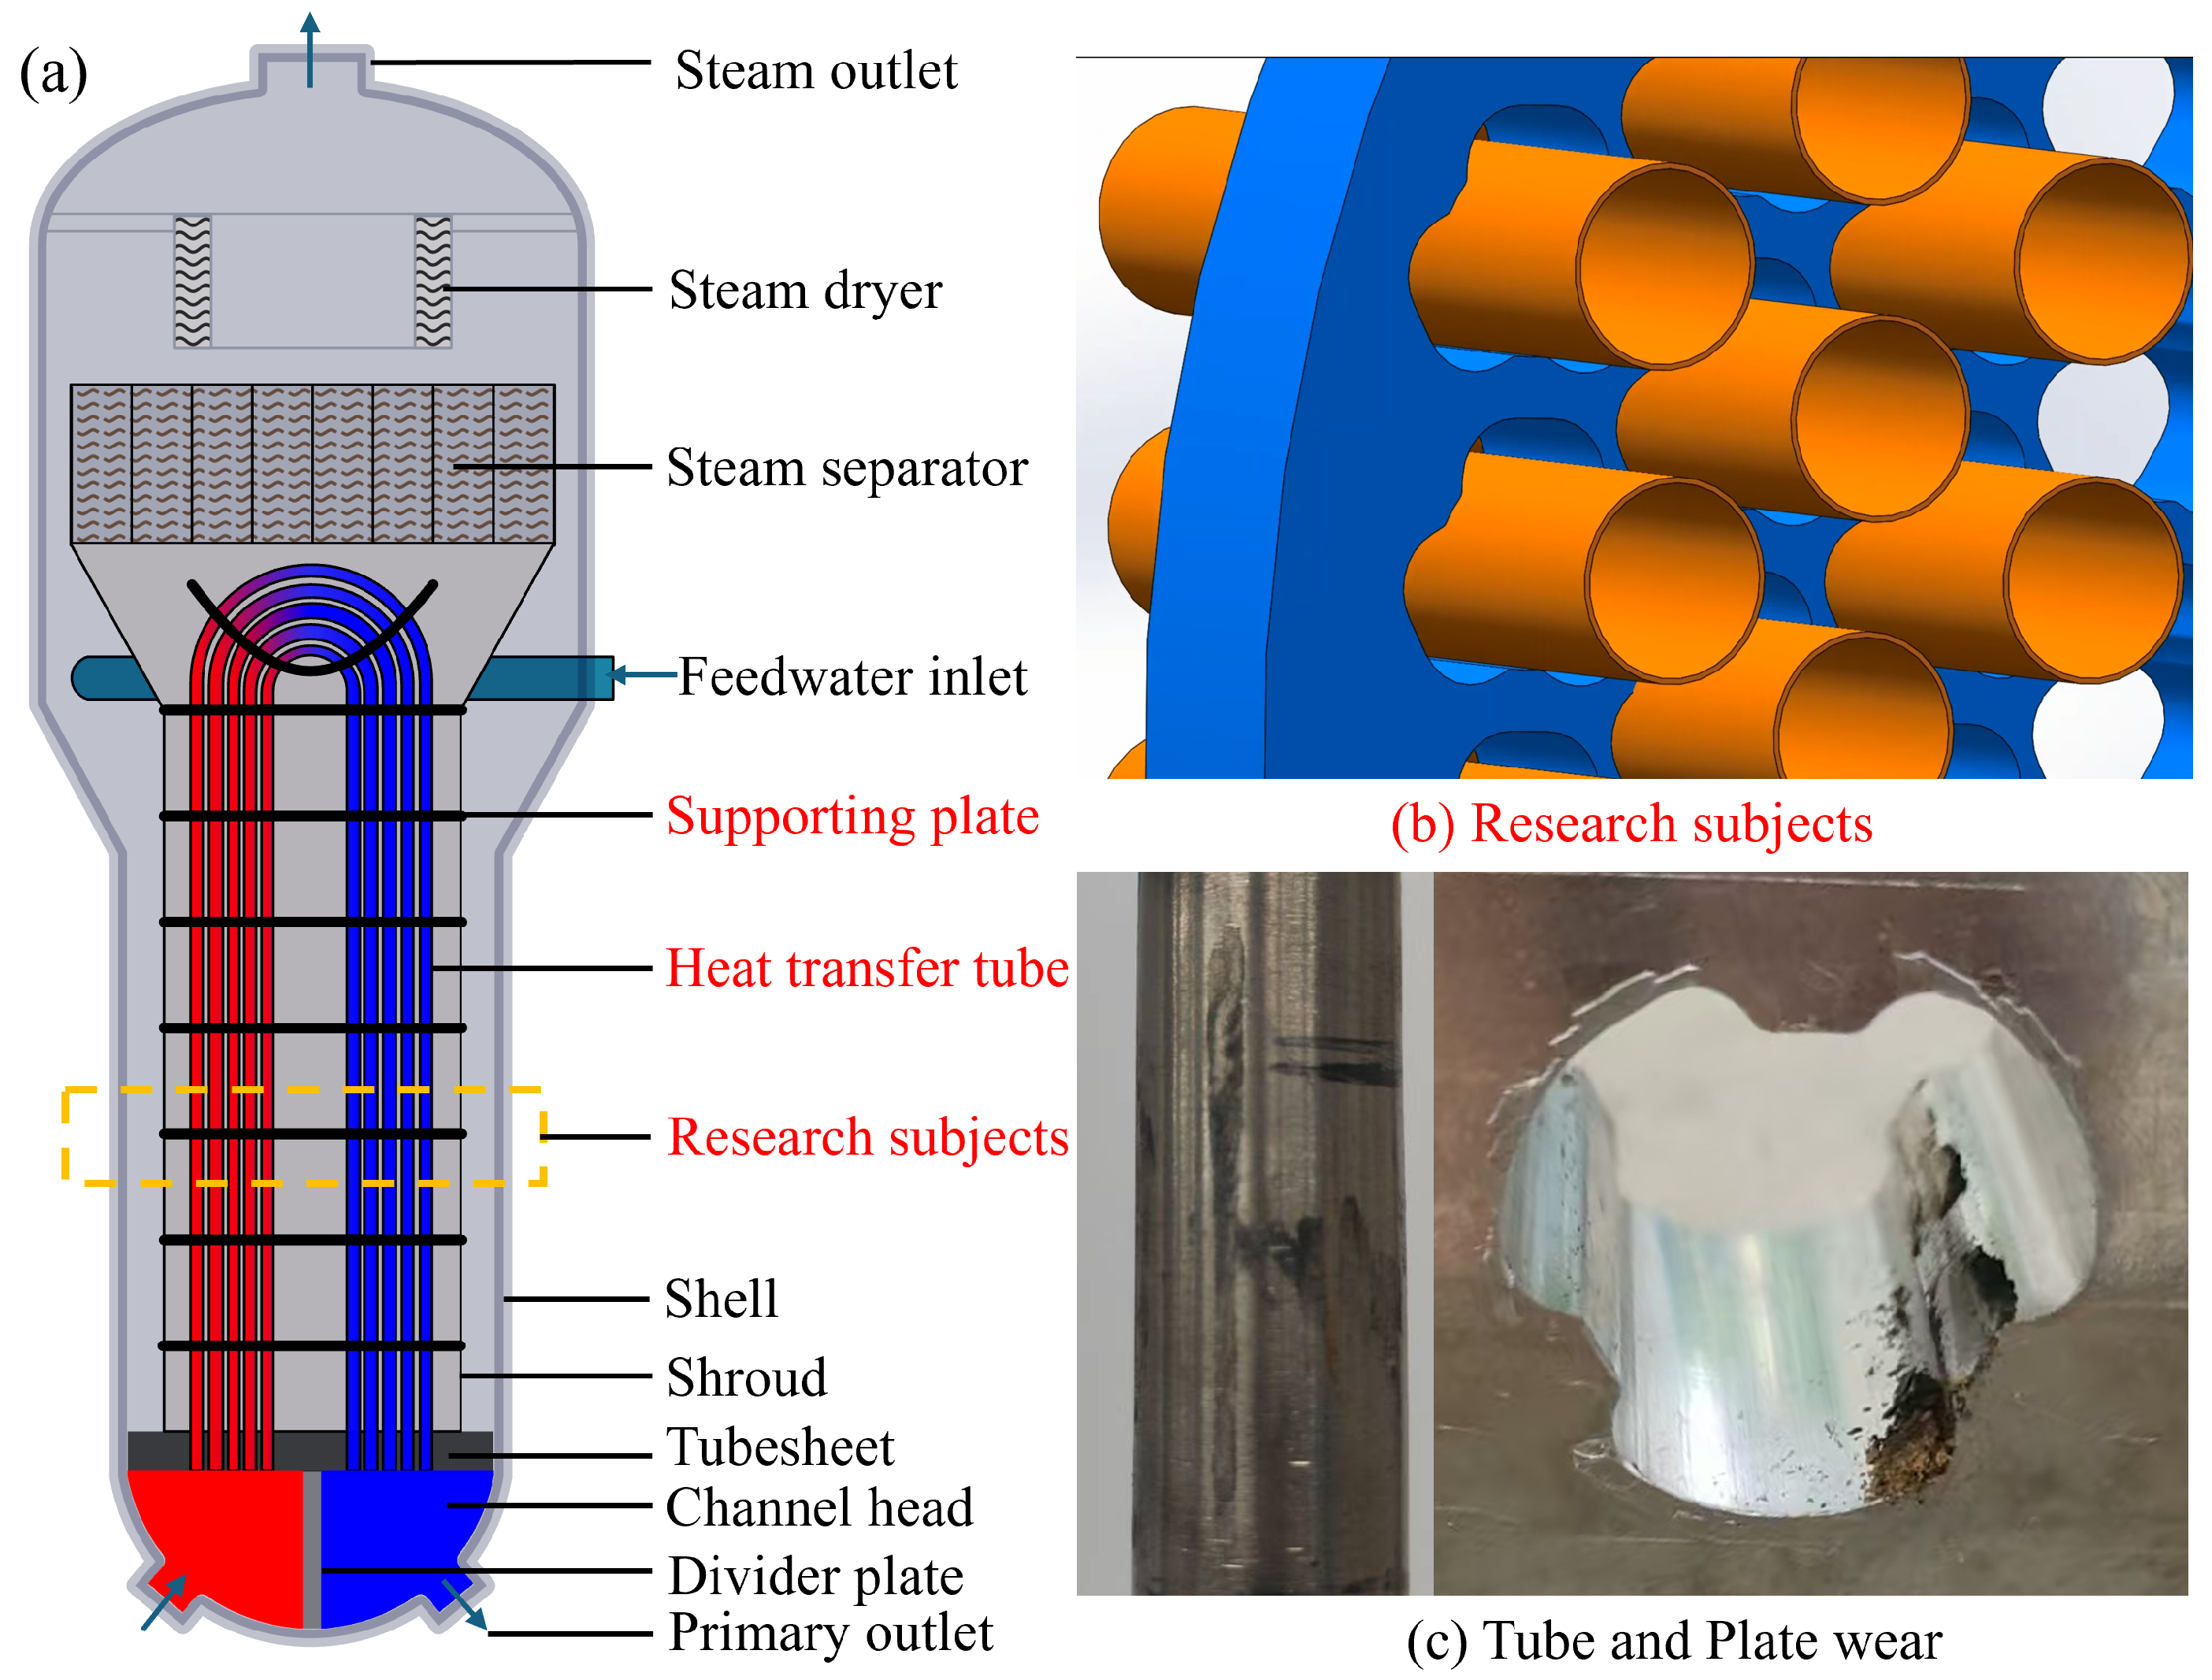
Figure 1. Overview of the steam generator system and fretting wear at the support plate–tube interface. (a) Structural schematic of a nuclear steam generator (b) Local view of tube–support plate contact region (research subjects) (c) Representative wear damage on heat transfer tube and support plate.
Lubricants 13 00421 g001
Figure 2. Rtec MFT-5000 fretting wear test machine.
Lubricants 13 00421 g002
Figure 3. Schematic of wear surface determination. (a) Location of the wear scar and vibration direction on the specimen surface. (b) Representative wear profile taken along the vibration direction through the center of the scar. The black curve denotes the measured wear profile, the red dashed line indicates the reference unworn surface, the blue area corresponds to the depression (wear volume), and the orange area corresponds to the pile up.
Lubricants 13 00421 g003
Figure 4. Micrographs of wear scars under representative amplitudes and loads conditions. (a) 3D wear scar morphology under 15 µm amplitude and 10 N load (M15N10) (b) 3D wear scar morphology under 45 µm amplitude and 30 N load (M45N30) (c) 3D wear scar morphology under 75 µm amplitude and 50 N load (M75N50). The wear scars on the counterface ball are provided in Supplementary Figure S1, and all the three-dimensional plots are provided in Supplementary Figure S2.
Lubricants 13 00421 g004
Figure 5. Response surfaces of wear area and wear volume as functions of normal load and displacement amplitude.
Lubricants 13 00421 g005
Figure 6. Profiles of wear scar cross sections under different (top) normal loads and (bottom) displacement amplitudes.
Lubricants 13 00421 g006
Figure 7. SEM morphology (a) and corresponding elemental distribution (b) of worn surface at 45 μ m amplitude under 10 N load.
Lubricants 13 00421 g007
Figure 8. SEM morphology (a) and corresponding elemental distribution (b) of worn surface at 45 μ m amplitude under 30 N load.
Lubricants 13 00421 g008aLubricants 13 00421 g008b
Figure 9. SEM morphology (a) and corresponding elemental distribution (b) of worn surface at 45 μ m amplitude under 50 N load.
Lubricants 13 00421 g009
Figure 10. Micrographs of wear scars under various amplitude and load conditions. (a1a5) Amplitude 15 μ m with loads of 10, 20, 30, 40, and 50 N, respectively; (b1b5) Amplitude 30 μ m with loads of 10, 20, 30, 40, and 50 N, respectively; (c1c5) Amplitude 45 μ m with loads of 10, 20, 30, 40, and 50 N, respectively; (d1d5) Amplitude 60 μ m with loads of 10, 20, 30, 40, and 50 N, respectively; (e1e5) Amplitude 75 μ m with loads of 10, 20, 30, 40, and 50 N, respectively.
Lubricants 13 00421 g010
Figure 11. Representative hysteresis loops illustrating the evolution of slip behavior.
Lubricants 13 00421 g011
Figure 12. Determination and dependence of dissipated energy in fretting wear.
Lubricants 13 00421 g012
Figure 13. Dissipated energy per cycle under typical loading conditions.
Lubricants 13 00421 g013
Figure 14. Fretting wear regime map of Z10C13 steel under displacement–load coupling. The dashed line ( s 1.5 F N ) marks the transition curve, with the green band indicating the confidence interval. Blue triangles denote adhesive wear points and red circles represent fatigue wear points, showing the nonlinear regime shift governed by load–amplitude coupling.
Lubricants 13 00421 g014
Figure 15. (a) Comparison of model fitting results with experimental data; (b) Surface plot of equivalent hardness as a function of normal load and displacement amplitude.
Lubricants 13 00421 g015
Table 1. Chemical composition (wt.%) of Z10C13 SGTs and Inconel 690 pads.
MaterialCSiMnPSCrAlCuNiFe
Z10C130.120.51.00.040.0312NanNan0.60Bal.
Inconel 6900.0230.300.230.0080.00230.30.250.50Bal.9.6
Table 2. Experimental operating condition parameters.
ParameterUnitValue
Flat sample
   MaterialZ10C13 ferritic stainless steel
   Dimensionmm⌀24 × 8
   DesignationM15N10–M75N50
Hemispherical cylindrical
   MaterialInconel 690
   Dimensionmm⌀6.5
   DesignationM15N10–M75N50
Displacement amplitude μ m15, 30, 45, 60, 75
Applied normal loadN10, 20, 30, 40, 50
FrequencyHz30
Ambient temperature°C25
Table 3. Wear area and volume under different load and amplitude combinations.
SpecimenLoad (N)Amplitude ( μ m)Wear Area (mm2)Wear Volume (mm3)
M15N1010150.1370.00125
M30N1010300.4980.00217
M45N1010450.7770.00456
M60N1010600.9610.00650
M75N1010751.1510.00863
M15N2020150.1410.00138
M30N2020300.4650.00302
M45N2020450.8810.00668
M60N2020601.1260.01017
M75N2020751.3000.01539
M15N3030150.1100.00097
M30N3030300.4990.00344
M45N3030450.8790.00671
M60N3030601.2070.01268
M75N3030751.3640.01717
M15N4040150.1050.00089
M30N4040300.3990.00350
M45N4040450.9510.00734
M60N4040601.3140.01521
M75N4040751.4910.01854
M15N5050150.1010.00072
M30N5050300.1670.00280
M45N5050450.4830.00605
M60N5050601.2160.01490
M75N5050751.5240.02039
Note: The lateral resolution of the optical profiler (bright-field 10× EPI objective) is 0.37 μ m and the vertical resolution is 3 nm. Based on error propagation, the uncertainty of wear area is estimated to be within ±0.001 mm2, and that of wear volume is approximately ±0.00001 mm3. Accordingly, wear area values are reported to three decimal places and wear volume values to five decimal places.
Table 4. Goodness of fit metrics for model comparison.
ModelRSSR2AICBIC
Archard0.00030.7258285.65−284.43
Hardness-corrected0.00000.9838−346.40−339.08
Disclaimer/Publisher’s Note: The statements, opinions and data contained in all publications are solely those of the individual author(s) and contributor(s) and not of MDPI and/or the editor(s). MDPI and/or the editor(s) disclaim responsibility for any injury to people or property resulting from any ideas, methods, instructions or products referred to in the content.