Article

Research and Optimization of Flow Characteristics in a Two-Stage Centrifugal Oil Supply Structure for Wet Clutches

1
College of Mechanical and Electrical Engineering, Central South University, Changsha 410083, China
2
Hunan Aviation Powerplant Research Institute, Aero Engine Corporation of China, Zhuzhou 412002, China
*
Authors to whom correspondence should be addressed.
Lubricants 2025, 13(9), 415; https://doi.org/10.3390/lubricants13090415
Submission received: 19 August 2025 / Revised: 12 September 2025 / Accepted: 15 September 2025 / Published: 16 September 2025
(This article belongs to the Special Issue Advances in Hydrodynamic Friction in Combustion Engines)

Abstract

In the tail rotor transmission system of a high-speed helicopter, the timely supply of lubricating oil to the wet friction clutch during frequent starts and stops has a significant impact on the performance of the transmission system. The oil flow requirements of clutches vary across different operational stages, posing a challenge for traditional centrifugal oil supply methods to meet the demand for flow regulation under such dynamic conditions. This paper proposes a novel two-stage centrifugal oil supply structure capable of achieving superior flow control during various clutch operating phases. An experimentally validated two-phase oil–gas CFD model was established to analyze the effects of operational parameters, such as rotational speed and oil supply pressure difference, as well as structural parameters, on oil supply performance. To enhance oil supply flow rate and efficiency under high-speed conditions (rated speed of 4800 rpm and 85% speed) at a common supply pressure (0.45 MPa), while reducing the pressure at the input shaft interface, key structural parameters were determined and optimized using a combined approach of Taguchi orthogonal experiments and response surface methodology. The results demonstrate that the optimized structure achieves a 142.8% increase in the weighted oil supply flow rate, an 11.1% improvement in oil supply efficiency, and a 7.5% reduction in pressure at the input shaft interface.

1. Introduction

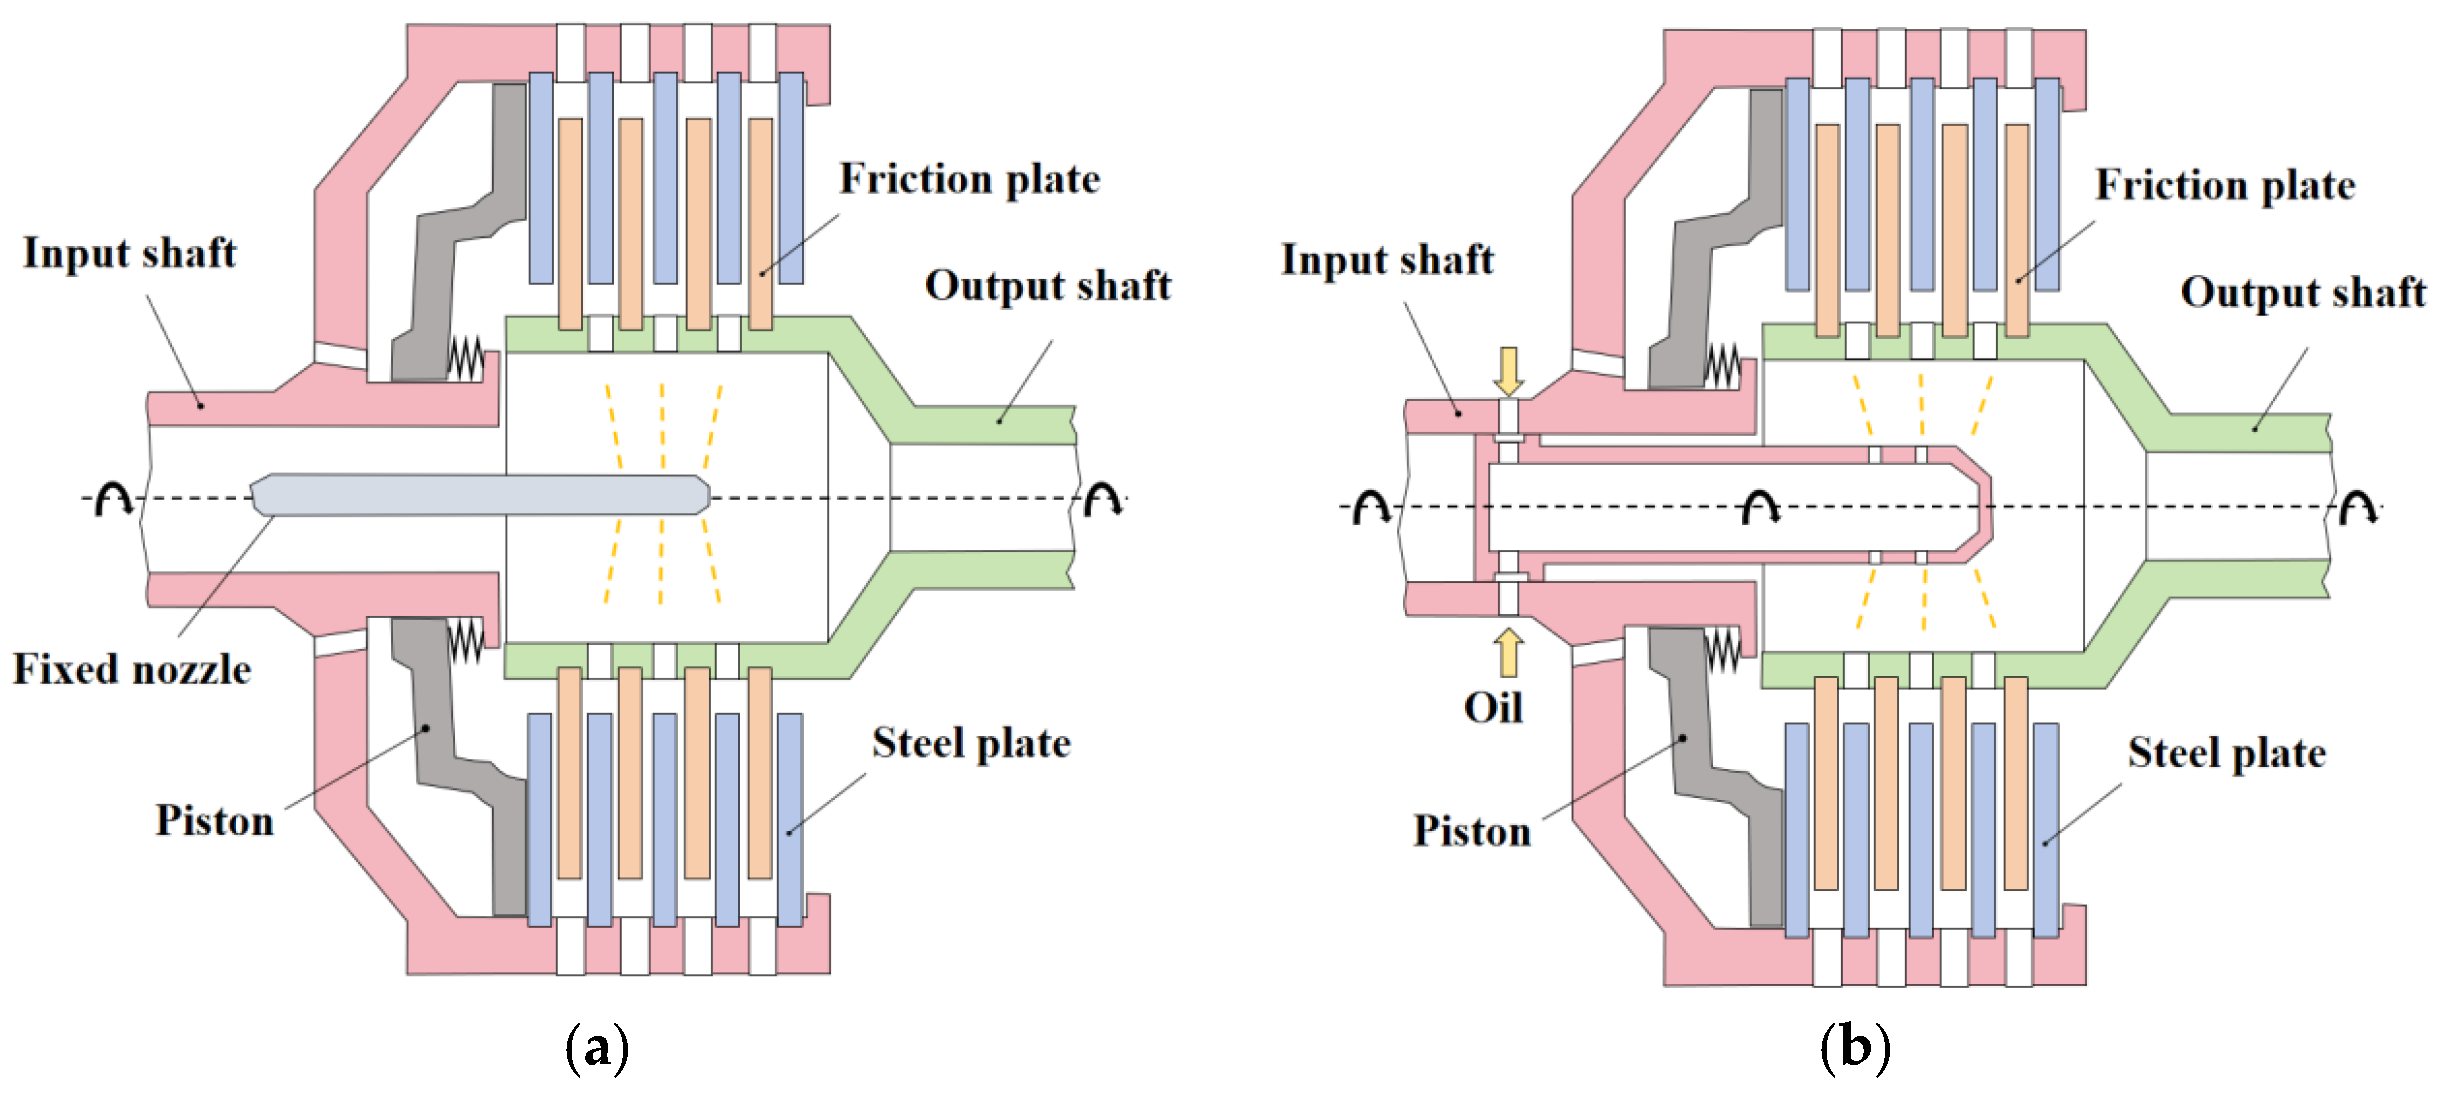
In high-speed helicopter tail rotor transmission systems, wet clutches serve as critical drivetrain components [1]. Due to operational requirements of the tail rotor, wet clutches undergo frequent engagement and disengagement cycles. During engagement, intense frictional heating necessitates sufficient oil supply for convective heat transfer [2]. Simultaneously, during disengagement, oil within the friction pair interface generates drag torque through shear stress, which is typically converted into heat energy [3,4,5,6,7]. Consequently, reducing oil supply during disengagement is essential to minimize shear-induced heating. Common oil supply methods include pressure-circulated lubrication and centrifugal splash lubrication. The former uses external pressure to force oil into the interface; the latter relies on centrifugal force. Centrifugal supply is widely used in aviation, typically employing fixed nozzles to deliver oil to the friction pair wall. However, this method requires real-time pressure control for flow regulation, which is challenging in systems with frequent start-stop cycles. This paper proposes a two-stage centrifugal oil supply configuration that replaces fixed nozzles with rotating nozzles. These utilize centrifugal force to project oil onto a wall, after which the output shaft rotation delivers it to the friction pair (Figure 1). In this design, the rotating nozzles co-spin with the input shaft.
During the engagement stage, the piston pushes the steel plates into contact with the friction plates, transmitting torque to rotate the output shaft. The increased centrifugal action enables oil on the inner wall of the output shaft to enter the friction pair.
Upon complete engagement, there is no relative sliding between the steel and friction plates, and the output shaft rotates at the same speed as the input shaft. At this point, a substantial amount of oil can enter the friction pair to carry away the heat accumulated from frictional engagement.
During the disengagement stage, torque is no longer transmitted to the output shaft, causing its speed to decrease rapidly. The reduced centrifugal effect leads to a swift decrease in the flow rate entering the friction pair, thereby lowering the shear-induced heating during disengagement.
Compared to traditional methods, this configuration uses centrifugal force to automatically regulate oil supply to the friction pair, reducing heat generation and simplifying control. However, research on such two-stage centrifugal systems is limited, and their application in tail rotor transmissions is immature. Based on a helicopter tail rotor clutch structure, this study investigates the flow characteristics of this configuration and optimizes its structural parameters to enhance high-speed oil supply performance.
Numerous scholars have investigated centrifugal oil-slinging lubrication techniques. Previous work can be broadly categorized based on its primary application and focus:
Motor Cooling Applications: A significant body of research focuses on using centrifugal force for internal cooling of electric motors. Studies by Wang et al. [8], Yang et al. [9], Gai et al. [10], and Di Lorenzo et al. [11] developed and optimized hollow-shaft oil-jet structures, demonstrating their efficacy in reducing motor temperatures. Zhang et al. [12] further analyzed thermal management in high-speed motors. While these studies adeptly utilize centrifugal force for heat exchange, their primary objective remains thermal control rather than the precise regulation of oil flow to a specific target under highly dynamic conditions.
Bearing Under-Race Lubrication: Another major application is in lubricating aircraft engine bearings. Here, research centers on the performance of oil delivery components. Jiang et al. [13,14] analyzed the oil capture of axial scoops and the flow characteristics of inlet nozzles. Prabhakar et al. [15] and Ardashkin et al. [16] used CFD and experiments, respectively, to study the collection efficiency of scoop structures, highlighting the importance of oil jet trajectory. Zhu et al. [17] developed advanced CFD models to capture transient oil supply dynamics. These studies provide invaluable insights into the efficiency of individual centrifugal supply elements; however, they are typically conducted on simpler subsystems (e.g., a single bearing) or under more stable operational environments.
Fundamental Flow Mechanics: Research also exists on the underlying physics relevant to centrifugal oil systems. Campana et al. [18] investigated liquid bridge dynamics in rotating cavities, a configuration analogous to part of our two-stage system. Lin et al. [19] and Nouri-Borujerdi et al. [20] studied complex fluid dynamics in rotating annular spaces. These works contribute critical theoretical models and fundamental understanding but are not directly applied to the integrated system we examine.
Centrifugal Clearance Flow and Lubrication in Rotating Systems: Research on flow in narrow rotor–stator gaps under centrifugal forces provides crucial insights for our study. Su et al. [21] and Zhou et al. [22] demonstrated how geometric optimization of labyrinth seals manages flow to control leakage and improve stability, offering relevant analysis for flow resistance in our system’s chambers. Pointner-Gabriel et al. [23] directly captured the two-phase flow transition in the friction pair gap of disengaged wet clutches, where centrifugal force displaces oil, affecting drag and cooling. Furthermore, Liang et al. [24] revealed the dual role of centrifugal force in controlling oil availability through fundamental research on lubricant replenishment. Collectively, these studies provide critical theoretical and experimental foundations for flow in confined rotating spaces, though they typically focus on isolated components or fundamental processes.
The existing literature provides a strong foundation in component-level performance, fundamental flow mechanisms, and the physics of centrifugal clearance flows. However, a clear research gap exists concerning the integrated flow characteristics and optimization of a two-stage centrifugal supply structure specifically for wet clutches in demanding aviation transmission systems. Unlike studies focused on singular aspects, this paper investigates a complete system where active flow regulation is the primary objective.

2. Experimental Setup

2.1. Test Rig

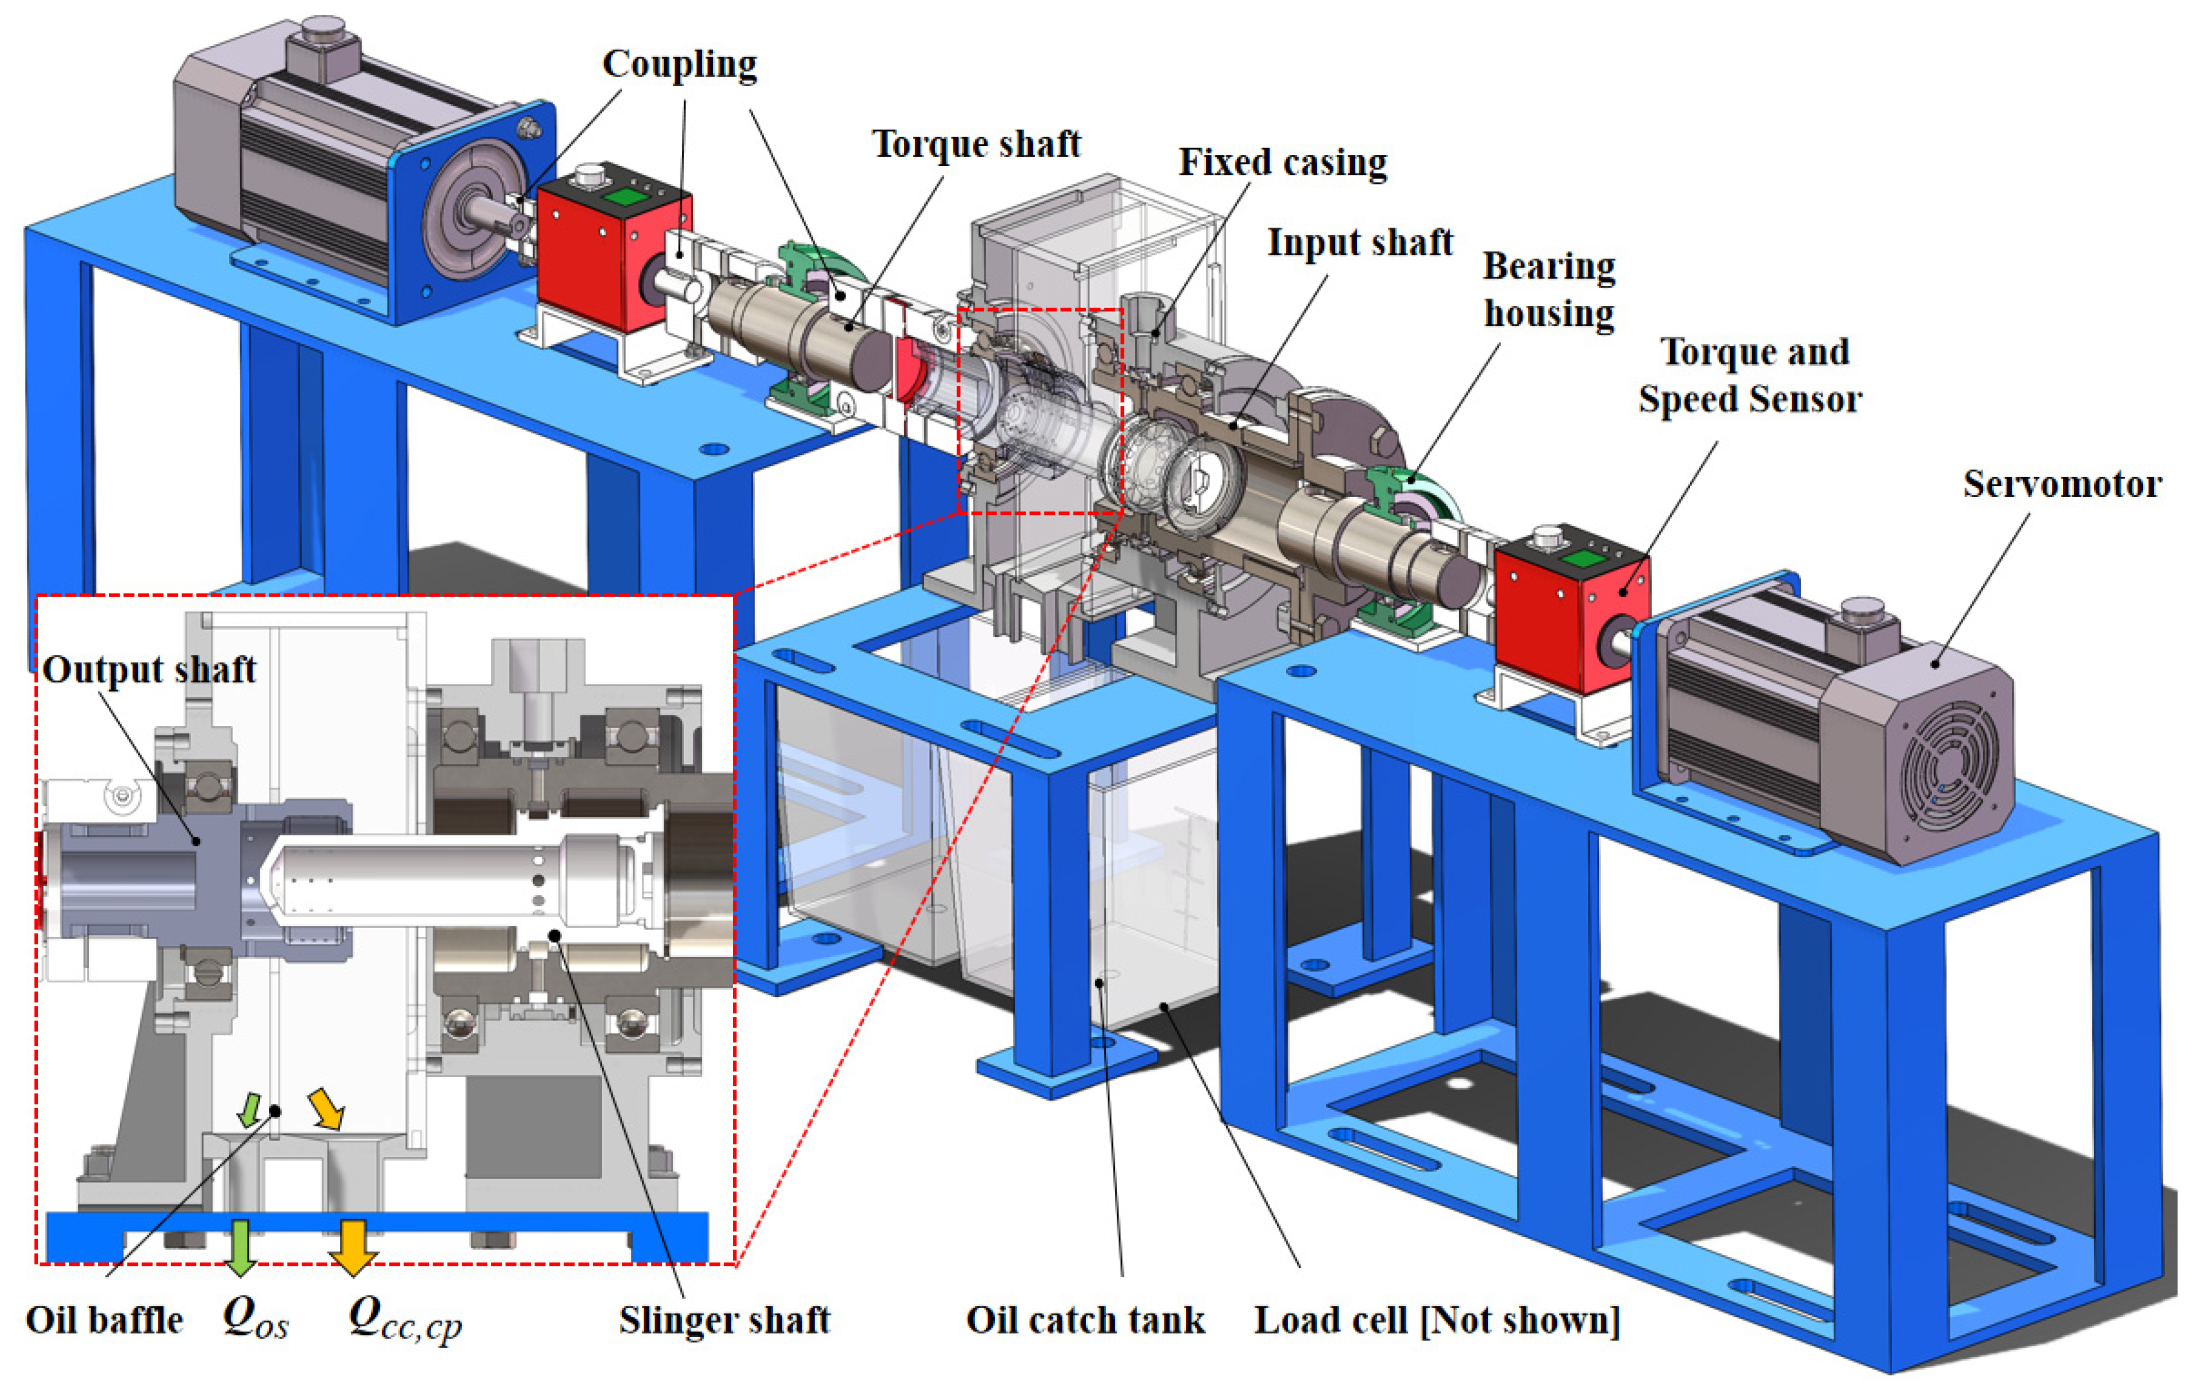
To investigate the flow characteristics of the two-stage centrifugal oil supply structure in a wet friction clutch, an experimental apparatus was designed as shown in Figure 2. The setup employs two servo motors (DEE-TE130H370, Foshan Deli Motor, China) independently driving the input shaft and output shaft. The inner side of the input shaft integrates an oil-slinging nozzle synchronized with the output shaft’s rotational speed, while the outer side of the output shaft houses the friction plate carrier. The motors operate at a maximum speed of 6000 rpm (rated torque: 3.7 N·m). Testing speeds ranged from 500 rpm to 4500 rpm in 500 rpm increments, with additional evaluation at the rated speed of 4800 rpm. Oil inlet pressure and flow rate were measured using a pressure transmitter (HL-131, Dongguan Heli Hydraulic, China, ±0.2% FS accuracy) and a turbine flowmeter (HL-LWGB-15-G, Dongguan Heli Hydraulic, China, ±0.5% FS accuracy) connected in series within the oil delivery pipeline.
The lubricant collection assembly, positioned at the center of the test rig, comprises the oil-slinging nozzle, output shaft, and collection chamber. The output shaft features two distinct outlets: one supplying the friction pair and another for the output shaft oil passage. These outlets are partitioned by a separator plate to prevent cross-flow mixing. To ensure operational safety, the system continuously monitors vibration states of both shafts, oil tank level, and oil temperature. Automatic alarms and shutdown are triggered when predefined thresholds are exceeded.

2.2. Measurement Methods

The primary focus of this experimental study is the oil delivery performance of the front-end supply structure in transporting lubricant to the friction pair of the wet clutch. This performance metric, denoted as oil delivery efficiency ( η a v e [%]), is characterized by the ratio of the outlet flow rate from the friction pair oil supply orifice ( Q c c , c p [L/min]) collected in the collection chamber to the total flow rate entering the input unit ( Q i n [L/min]). The calculation formula is defined as follows:
η a v e = Q c c , c p Q i n × 100 %
Given that the collection chamber relies on gravity-driven oil return and operates under sub-atmospheric pressure conditions, direct flowmeter measurement of the outlet flow rate from the friction pair supply orifice is unsuitable. Under steady-state flow conditions, the rapid drainage rate of lubricant from the collection chamber renders volumetric measurements using graduated cylinders and stopwatches inaccurate. Consequently, a load cell(DYX-306B, Bengbu Dayang Sensing, China) was employed to perform real-time mass monitoring of the collection vessel. The volumetric flow rate ( Q c c , c p ) was calculated indirectly by determining the average mass flow rate ( m ˙ c c , c p [kg/s]) and dividing by the lubricant density ( ρ o i l [kg/m3]), as defined in Equation (2):
Q c c , c p = m ˙ c c , c p ρ o i l × 60000
To mitigate measurement errors, oleophobic coatings were applied to the inner surfaces of the collection chamber, separator plates, oil-guide tubing, and graduated cylinders to minimize adhesive oil loss during fluid transfer and meniscus reading. When the oil-slinging nozzle and output shaft configurations remain invariant, the uncertainty in oil delivery performance stems from the measurement uncertainties of both the friction pair supply orifice flow rate ( Q c c , c p ) and the inlet flow rate ( Q i n ). Specifically, the uncertainty u ( Q c c , c p ) originates from mass flow rate measurement error ( u m ˙ [kg/s]) and lubricant density error ( u ρ [kg/m3]), while relative uncertainty u r ( Q i n ) arises from turbine flowmeter calibration accuracy ( u r f l o w [%]), viscosity correction residuals ( u r ν [%]), and installation-induced flow disturbances ( u d [L/min]). The standard uncertainty equations are defined as follows:
u ( Q c c , c p ) = 60000 × 1 ρ u ( m ˙ ) 2 + m ˙ ρ 2 u ( ρ ) 2
u r ( Q i n ) = u r 2 f l o w + u r 2 v + u d Q i n 2
where u m ˙ derives from the standard deviation of regression residuals ( u r s b [%]) and the accuracy specification of the load cell ( u r m [%]), while u ρ originates from temperature measurement error ( u T [°C]) and model error of the density-temperature correlation ( u ρ , m o d e l [kg/m3]). The expressions for u m ˙ and u ρ are defined as follows:
u m ˙ = u r 2 s b + u r 2 m m ˙
u ρ = ρ T u T 2 + u 2 ρ , m o d e l
To reduce measurement errors, the oil temperature was maintained within a constant-temperature bath (±2 °C) with five repeated trials conducted at each operating point. Based on the combined relative uncertainty calculated via Equation (7), the experimental results exhibited a combined relative uncertainty below 3.4%, indicating minor stochastic errors in the measurement system.
u r η a v e = ( u ( Q c c , c p ) Q c c , c p ) 2 + u r 2 Q i n

2.3. Experimental Parameter Ranges

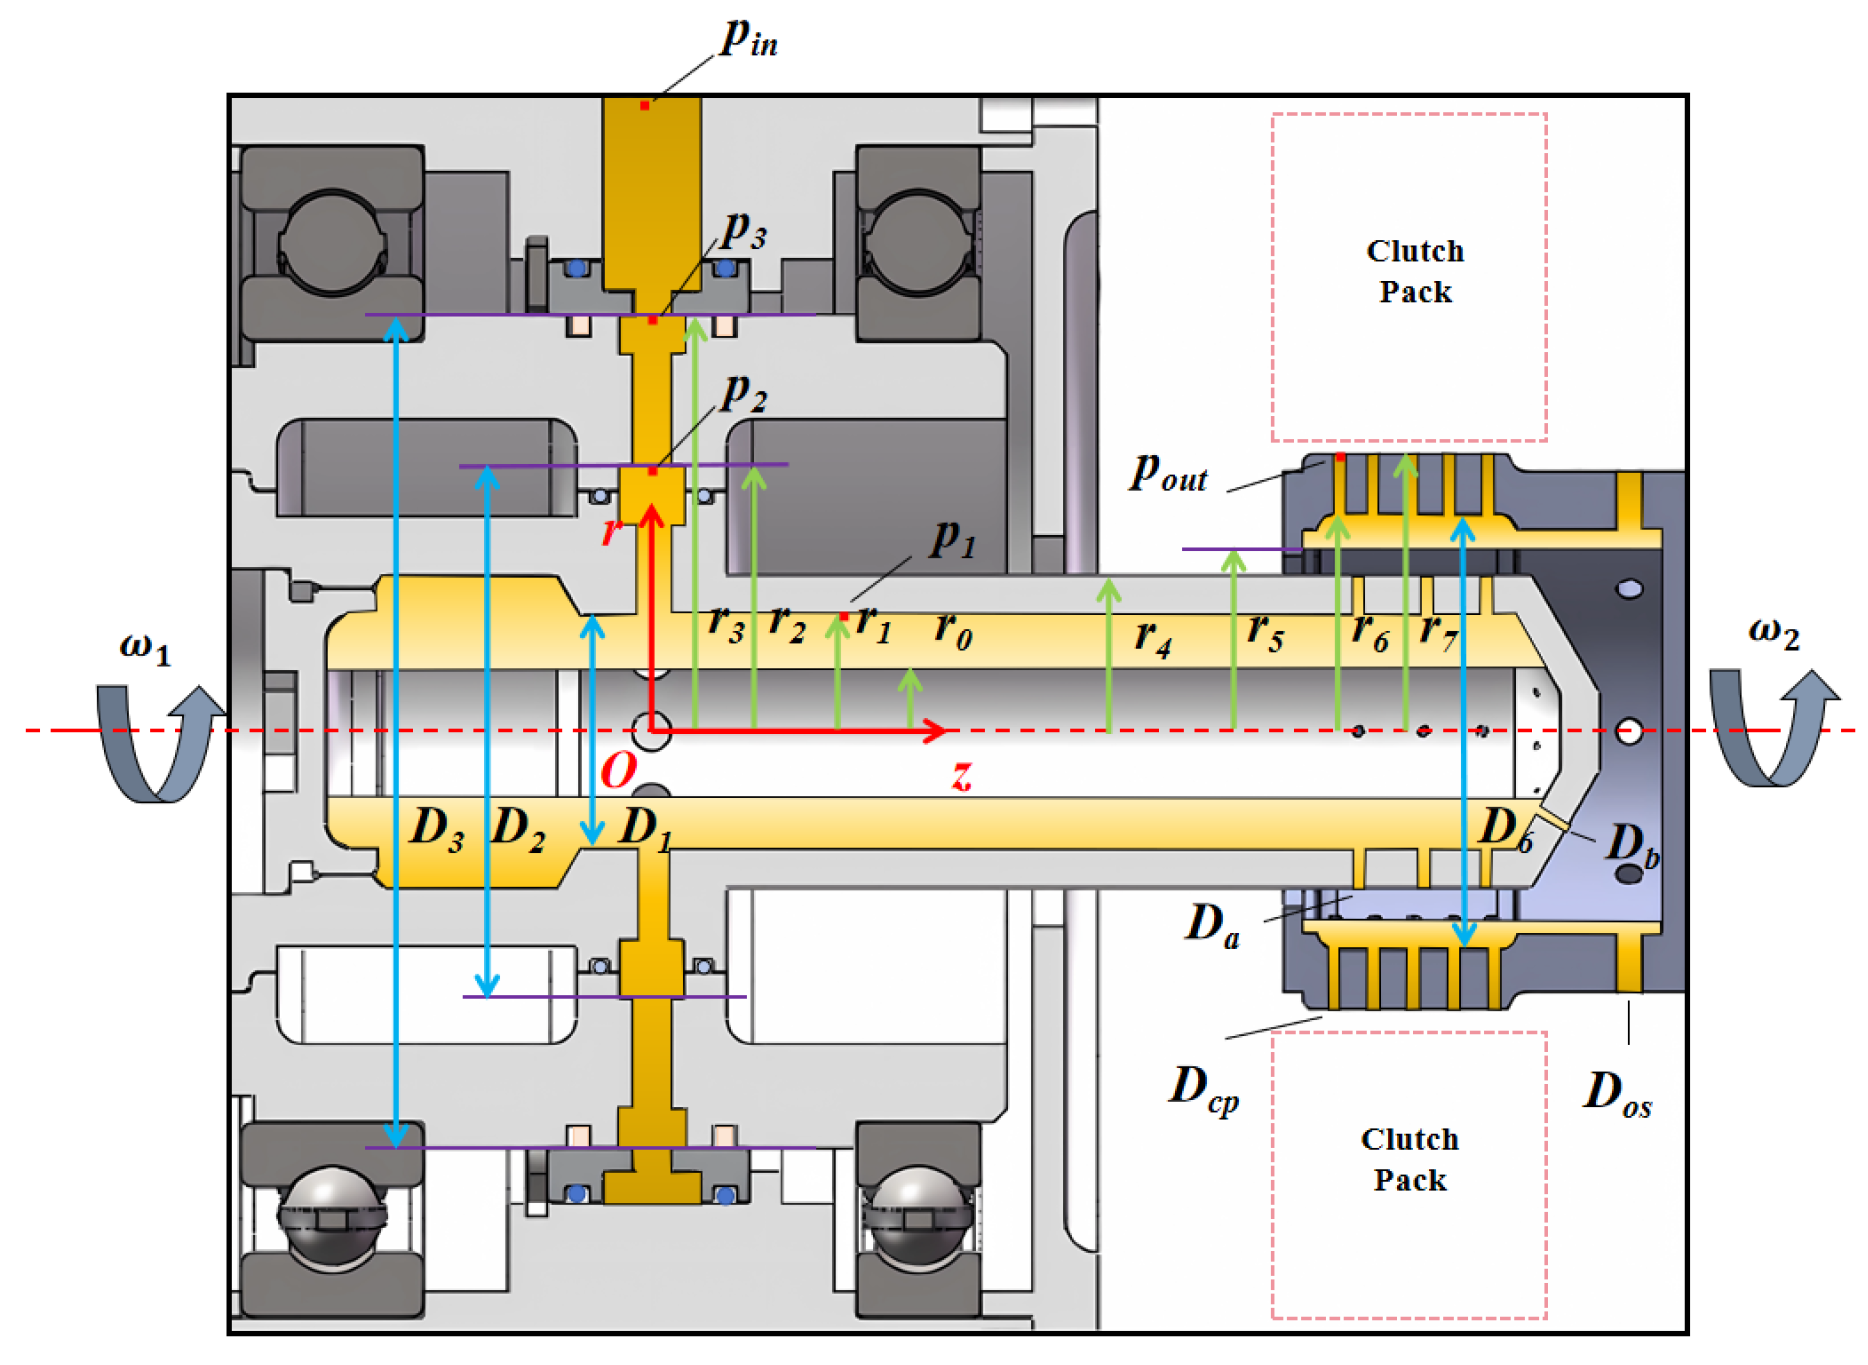
The test parameters of this rig were designed based on a clutch from a helicopter tail rotor transmission system. It is capable of operating at speeds ( n ) up to 5000 r/min with an oil supply pressure differential ( Δ p ) adjustable from 0.1 MPa to 1 MPa, thereby covering typical lubrication scenarios for aviation wet clutches. Structural parameters are illustrated in Figure 3: the oil-slinging nozzle incorporates 18 radial orifices of diameter D a and 9 axial orifices of diameter D b , which direct lubricant to the friction pair supply orifice of diameter D c p and output shaft supply orifice of diameter D o s , respectively. The key geometric parameter ranges are provided in Table 1. All tests were conducted under ambient conditions: 25 °C and 100.7 kPa.

3. Numerical Simulation

Although experiments captured oil flow images within the transparent output shaft and oil-slinging nozzle, they could not characterize global flow characteristics. Computational fluid dynamics (CFD) methodology, implemented using ANSYS Fluent (v. 2023 R1, ANSYS Inc.) enables comprehensive acquisition of flow-field data across the computational domain, particularly facilitating measurements in experimentally inaccessible regions (e.g., rotor–stator interface pressure between input shaft and casing). This approach efficiently analyzes the effects of varying operating conditions and structural parameters on the flow behavior of the oil supply unit while revealing internal oil–air flow mechanisms, thus proving instrumental in enhancing oil delivery efficiency.

3.1. Geometric Model and Mesh

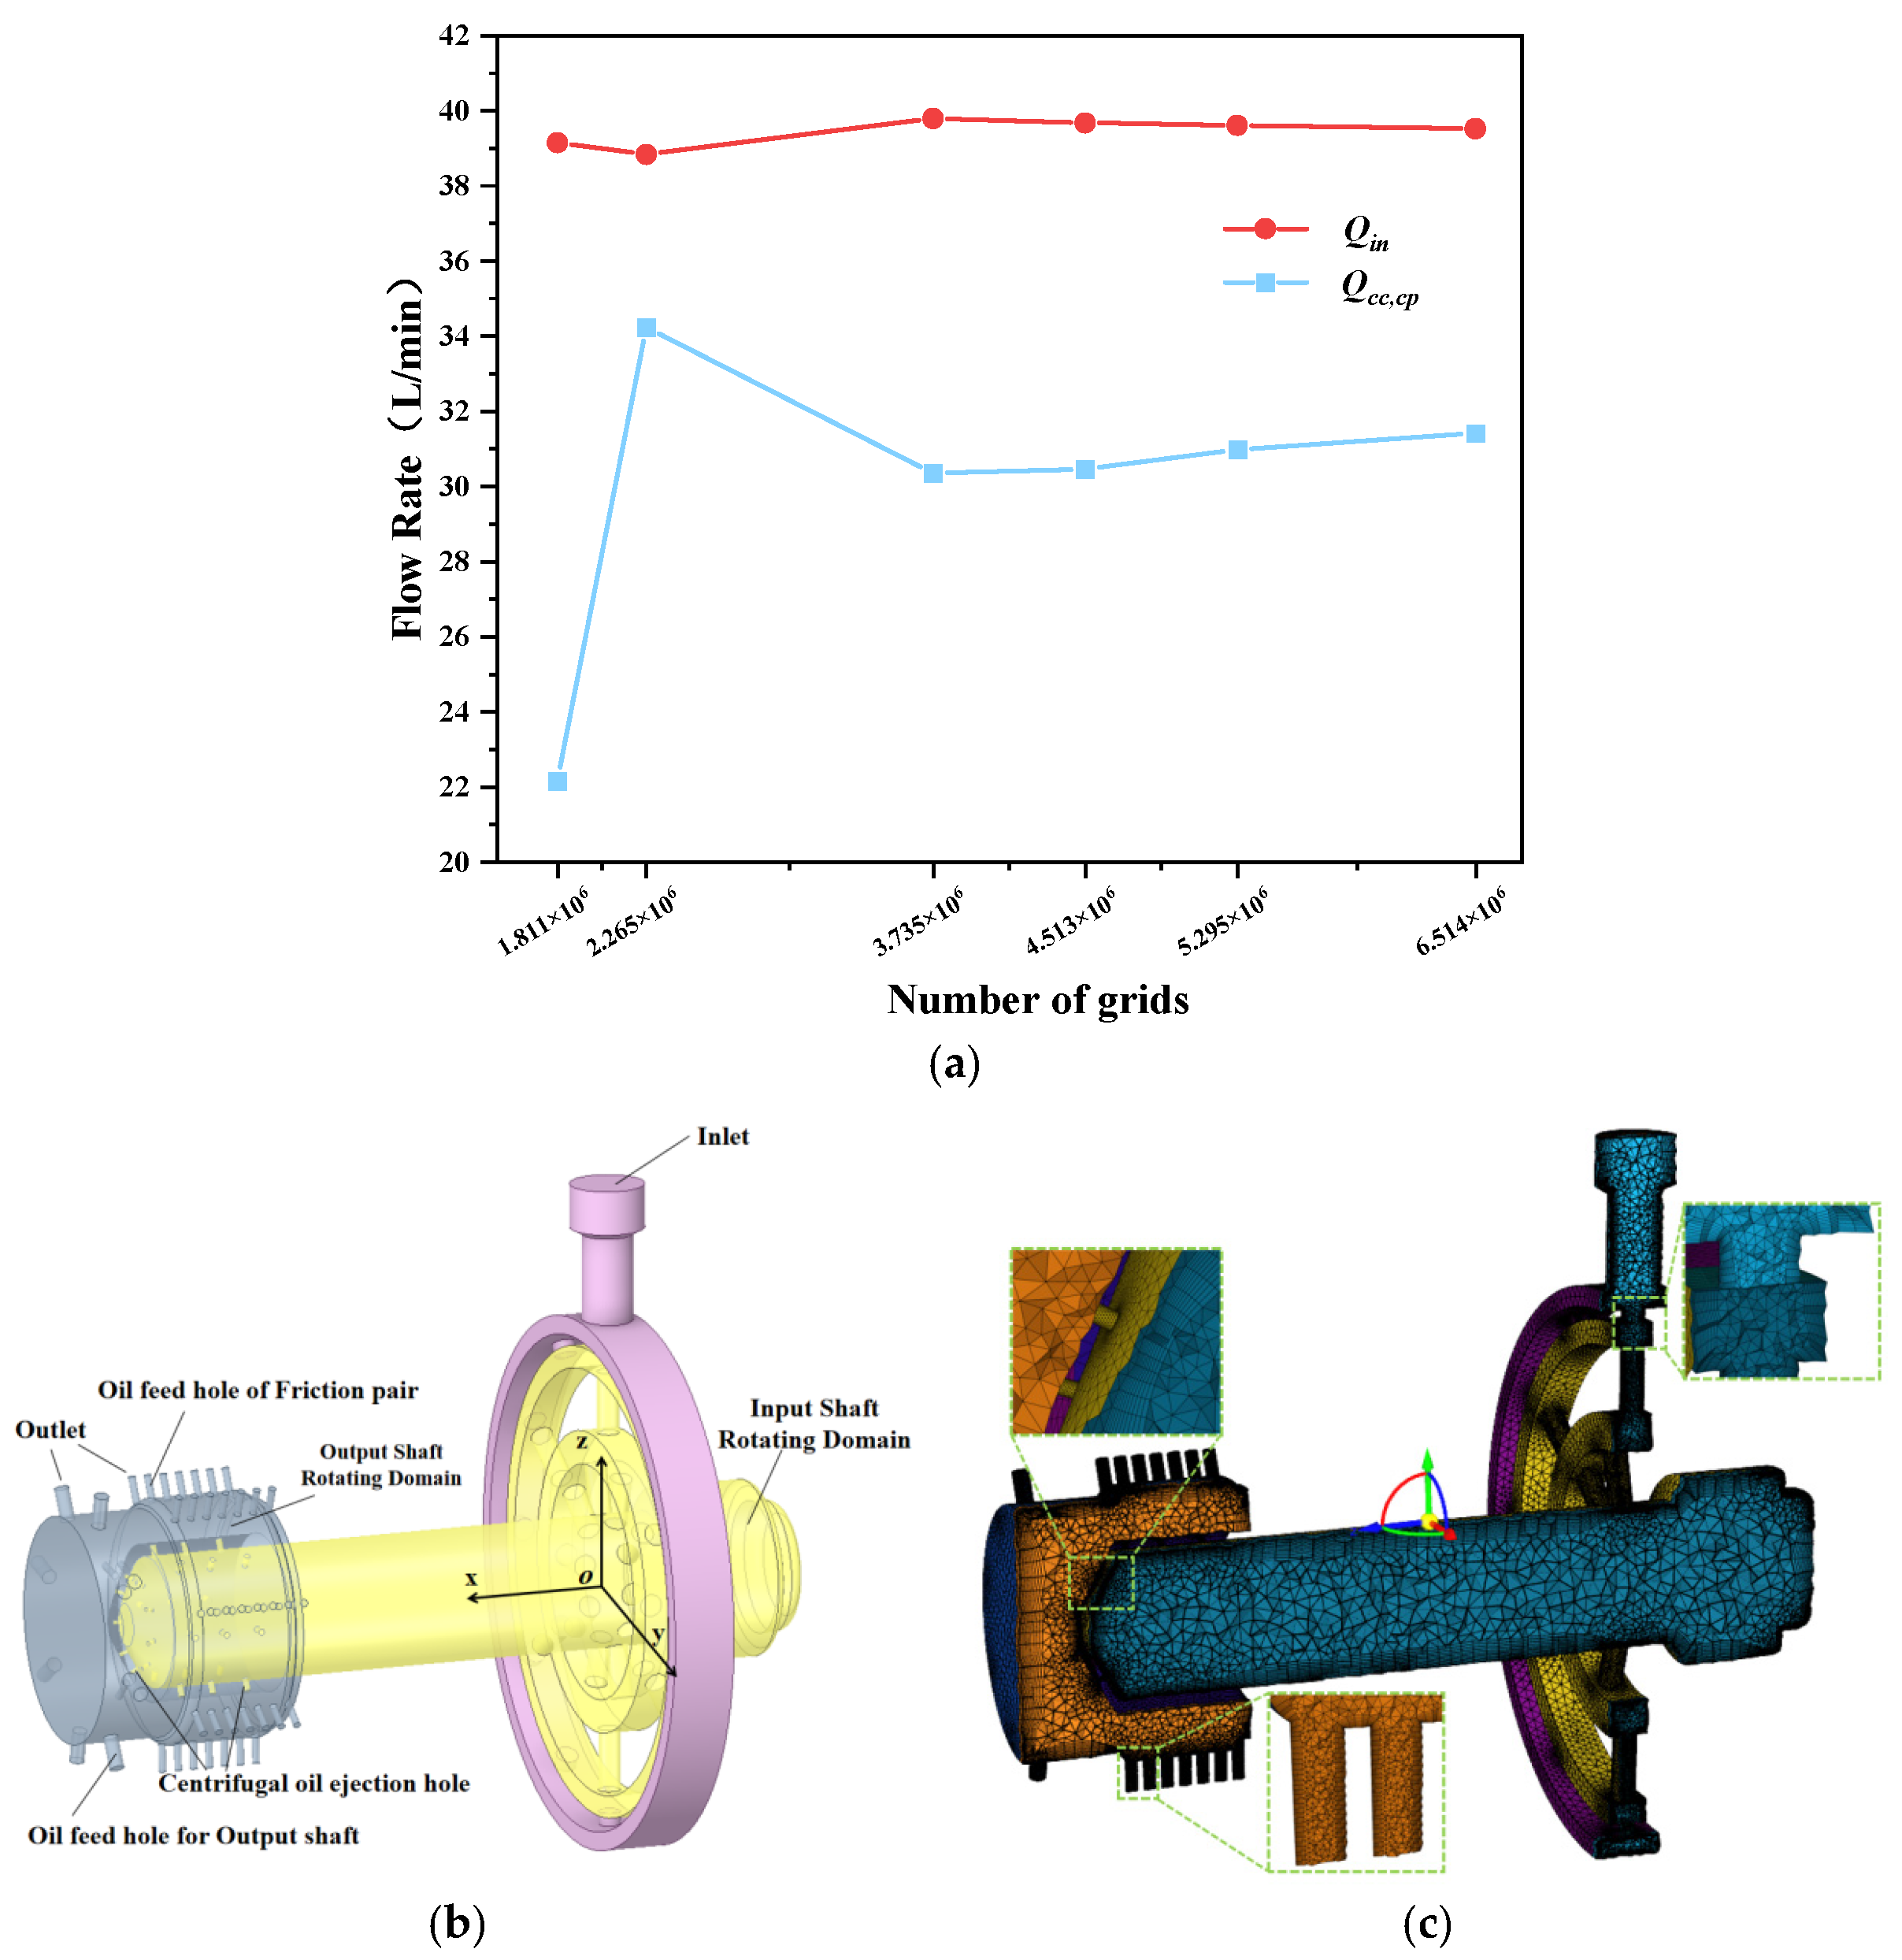
The computational fluid domain of the input unit is illustrated in Figure 4b, comprising three distinct zones: stationary casing domain (purple), rotating oil-slinging nozzle domain (yellow), and rotating output shaft domain (blue). Lubricant enters from the top of the stationary domain, is projected by the oil-slinging nozzle onto the inner wall of the output shaft, and ultimately exits through the friction pair supply orifice and output shaft supply orifice. To address the coexistence of static and dynamic flow fields, a sliding mesh method was implemented for data transfer at the yellow–purple and yellow–blue interfaces. Given the geometrically complex nature of the computational domain, an adaptive tetrahedral mesh scheme was employed throughout, providing enhanced resolution for intricate structural features.
To ensure computational accuracy, a mesh independence study was conducted by calculating Q i n and Q c c , c p at 0.45 MPa and 3000 rpm. The results are shown in Figure 4a. Compared to the 6.51-million mesh solution, the 3.73 million mesh yielded errors of 0.693% for Q i n and 4.15% for Q c c , c p . At 3.73 million elements, results became mesh-insensitive; therefore, this resolution was selected to balance computational accuracy and efficiency. To resolve near-wall flow characteristics, the y+ value was maintained at ≈1 by implementing 10 boundary layers with a growth rate of 1.1. The first-layer height at the oil-slinging nozzle wall was set to 0.0976 mm, achieving a minimum orthogonality of 0.12, as depicted in Figure 4c.

3.2. Two-Phase Flow and Turbulence Model

Given the centrifugal oil-slinging process in the nozzle and output shaft generating a representative lubricant-air two-phase flow, appropriate modeling is required to describe interphase interactions and capture free interface distributions. The Volume of Fluid (VOF) model with surface tension [25] was adopted, implementing phase interface interpolation via the geometric reconstruction scheme [26]. Within the VOF framework, the volume fraction parameter α defines phase distribution: α o i l = 1 indicates pure oil phase, α o i l = 0 represents pure air phase, and 0 < α o i l < 1 denotes an interfacial cell. The model solves a unified momentum equation (Equation (8)) to obtain a shared velocity field for both phases, achieving direct interfacial velocity coupling:
t ( ρ m i x t u r e u ) + ( ρ m i x t u r e u u ) = p + μ m i x t u r e u + u T + ρ m i x t u r e g + F
where u denotes velocity, p represents pressure, g signifies gravitational acceleration, and F corresponds to the surface tension force. ρ m i x t u r e and μ m i x t u r e designate the density and dynamic viscosity of the mixture, respectively. These mixture properties are calculated as:
ρ m i x t u r e = ( 1 α a i r ) ρ o i l + α a i r ρ a i r
μ m i x t u r e = ( 1 α a i r ) μ o i l + α a i r μ a i r
where ρ o i l and μ o i l denote the density and dynamic viscosity of the lubricant, respectively, while ρ a i r and μ a i r represent the density and dynamic viscosity of air. The continuity equation is subsequently defined as:
t ( α o i l ρ o i l ) + ( α o i l ρ o i l u ) = 0
For the turbulent flow characterized by high-strain-rate and strong curvature within the oil-slinging nozzle and output shaft, this study employs the R N G k - ε model [27] for numerical simulation. The transport equations for turbulent kinetic energy ( k ) and dissipation rate ( ε ) are given by:
t ( ρ k ) + x i ( ρ k u i ) = x j α k μ e f f k x j + G k ρ ε
t ( ρ ε ) + x i ( ρ ε u i ) = x j α ε μ e f f ε x j + C 1 ε G k ε k C 2 ε ρ ε 2 k
In these equations, G k represents the production term, C 1 ε and C 2 ε are empirical constants, while α k and α ε denote the reciprocals of the effective Prandtl numbers for k and respectively.
The RNG k-ε model was selected for its proven accuracy in simulating high-strain-rate flows within rotating systems, as demonstrated in prior studies of centrifugal oil flows [13,20,28]. While LES was considered, its computational demand was prohibitive for our parametric study. The SST k-ω model, though effective for certain boundary layer applications, is less suited for the strong curvature and centrifugal effects dominant in this configuration.

3.3. Boundary Conditions

3.3.1. Inlet Boundary Condition

Boundary conditions for simulations should align with experimental operating conditions. In this study, the inlet boundary was defined as a pressure inlet. Since the computational domain inlet corresponds to the hydraulic station outlet, whose pressure is regulated by a pressure control valve, hydrodynamic pressure fluctuations at low rotational speeds are negligible. Thus, the inlet pressure can be reasonably approximated as constant. For high-speed conditions, pressure transducer measurements during tests exhibited fluctuations below 4%, justifying the use of a constant-pressure inlet boundary.

3.3.2. Outlet Boundary Condition

The outlet boundary was specified as a pressure outlet. The computational domain outlets correspond to the friction pair supply orifice and output shaft supply orifice on the output shaft, which connect to the collection chamber. This chamber ultimately vents to the atmosphere, justifying the use of a gauge pressure outlet ( 0 P a relative to atmospheric pressure).
The oil-slinging nozzle and output shaft computational domains were set to identical rotational speeds to simulate co-rotating input-output shafts during fully engaged clutch operation. The rotation axis was oriented along the negative x-direction, with speeds ranging from 500 rpm to 4500 rpm in 500 rpm increments, plus the rated design speed of 4800 rpm. The initial oil volume fraction ( α o i l ) was set to 0 throughout the entire domain, indicating air-filled initial conditions.

3.3.3. Temperature Boundary Condition

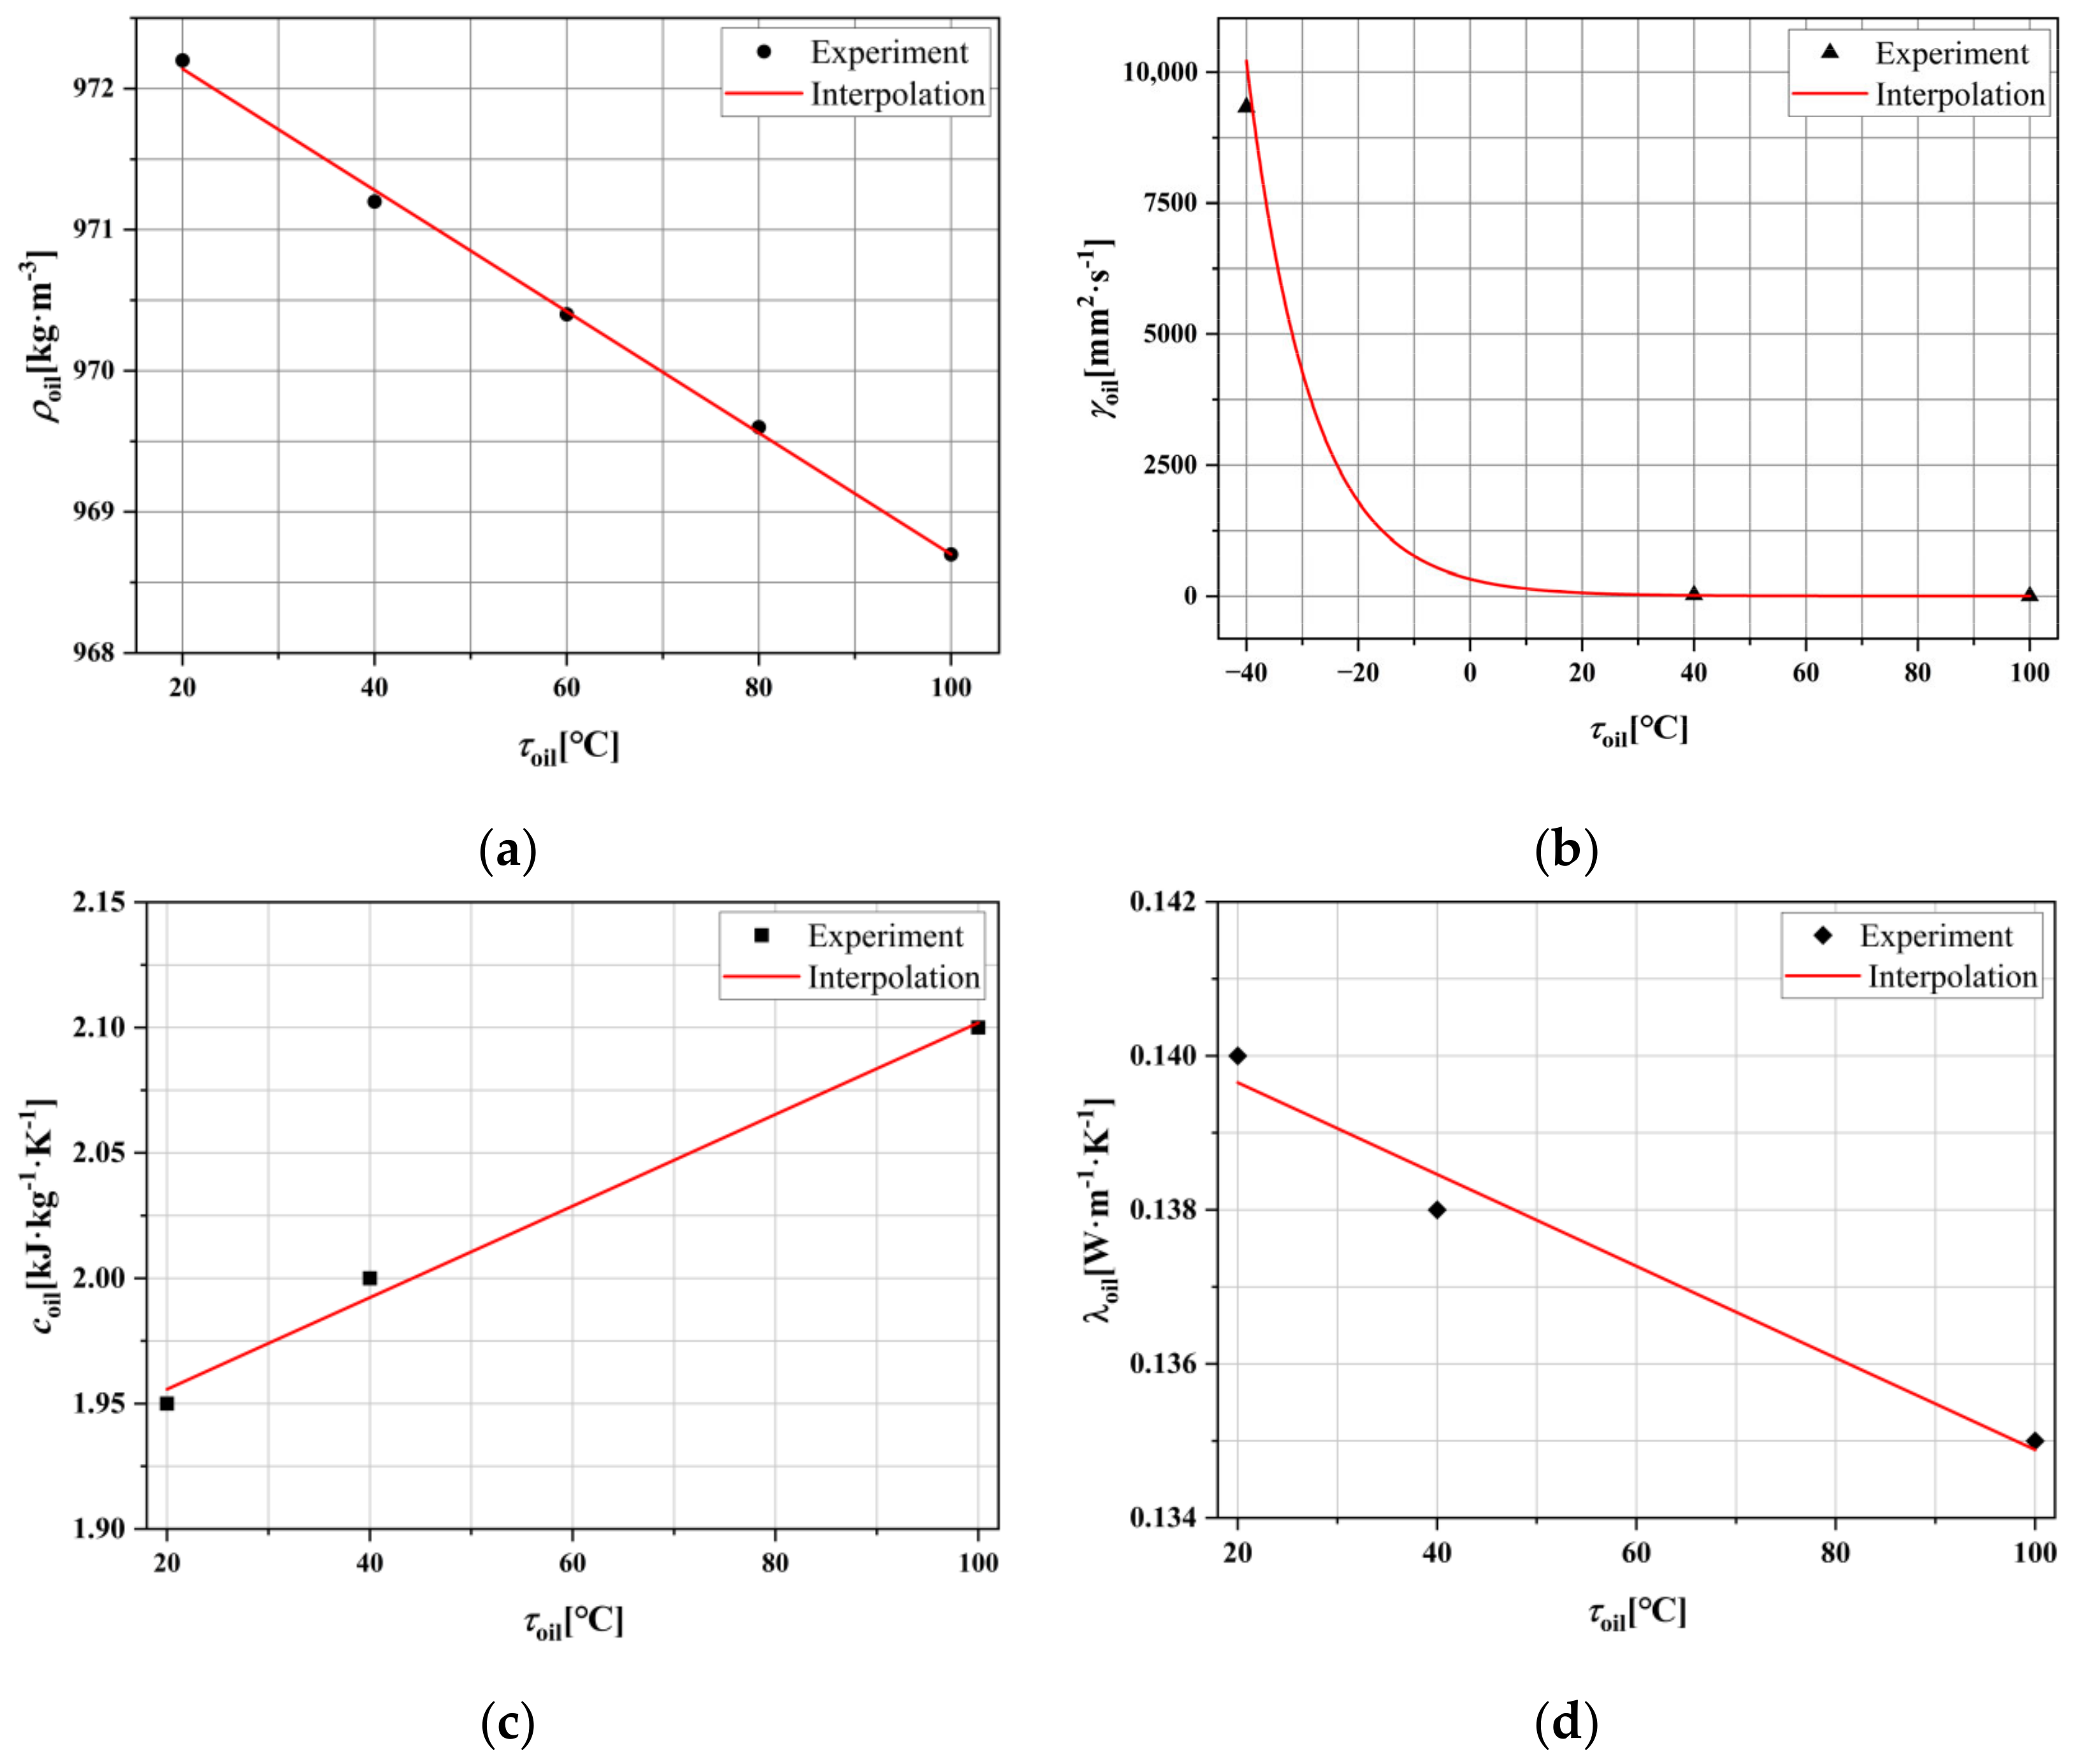
During experiments, shear-driven transport of oil along helical paths within the oil-slinging nozzle induces viscous heating, reducing lubricant viscosity [29]. This phenomenon is modeled via the viscous dissipation term in the energy equation, with generated heat dissipated to the environment through convective heat transfer. In this study, thermal radiation effects are negligible compared to convection and thus omitted. The inlet oil temperature was maintained at ambient level (25 °C). Given that frictional heating at the friction pair significantly exceeds transport-induced heating, the hydraulic station’s cooling capacity suffices to maintain oil at ambient temperature. Rheological characterization of the VG 4050 lubricant yielded temperature-dependent profiles for density, kinematic viscosity, specific heat capacity, and thermal conductivity. Density was fitted with a linear function, while kinematic viscosity—using data sourced from the VG 4050 lubricant specification sheet—was fitted with a dual-exponential decay function (Equation (14)), resulting in a high coefficient of determination (R2 = 0.98664). Measured data and fitted curves are presented in Figure 5.
γ o i l = a 1 e τ o i l b 1 + a 2 e τ o i l b 2 + γ 0
where a 1 = 163.34 [ mm 2 / s ]
a 2 = 163.35 [ mm 2 / s ]
b 1 = 10.74 [ ]
b 2 = 13.13 [ ]
γ 0 = 5.04 [ mm 2 / s ]
Figure 5. Rheological properties of the lubricating oil: (a) Interpolation of density; (b) Interpolation of kinematic viscosity; (c) Interpolation of heat capacity; (d) Interpolation of thermal conductivity.
Lubricants 13 00415 g005
The preceding parameters are summarized in Table 2.

3.4. Numerical Validation

To rigorously evaluate the validity of the simulation model, numerical results at a 0.45 MPa oil supply pressure differential were compared with experimental data. The experimental values presented in Table 3 represent the mean of five independent repeated trials conducted at each rotational speed, demonstrating good repeatability with standard deviations typically below 2.5%.
The agreement between the model and experiment was quantified using comprehensive statistical metrics calculated from all 50 experimental data points. The root mean square error (RMSE) was found to be 5.21%, the mean absolute error (MAE) was 4.24%, and the coefficient of determination (R2) was 0.912. A small mean bias of +1.65% indicates a slight tendency of the model to overpredict the efficiency. While the maximum relative error for any single mean value reached 10.4%, the overall statistical analysis confirms a strong predictive capability.
The observed discrepancies can be attributed to several factors: (1) inherent experimental variability in capturing complex two-phase flow phenomena; (2) modeling approximations, particularly in turbulence modeling and interface sharpening within the VOF framework; (3) minor fluctuations in the experimental inlet pressure boundary condition, which was modeled as a constant. Notwithstanding these minor deviations, the numerical model developed in this study reliably predicts the oil–air flow characteristics and oil collection performance of the two-stage centrifugal oil-slinging structure for parametric analysis and optimization purposes.

4. Results and Discussion

4.1. Influence of Parameters on Oil Supply Performance

4.1.1. Rotational Speed

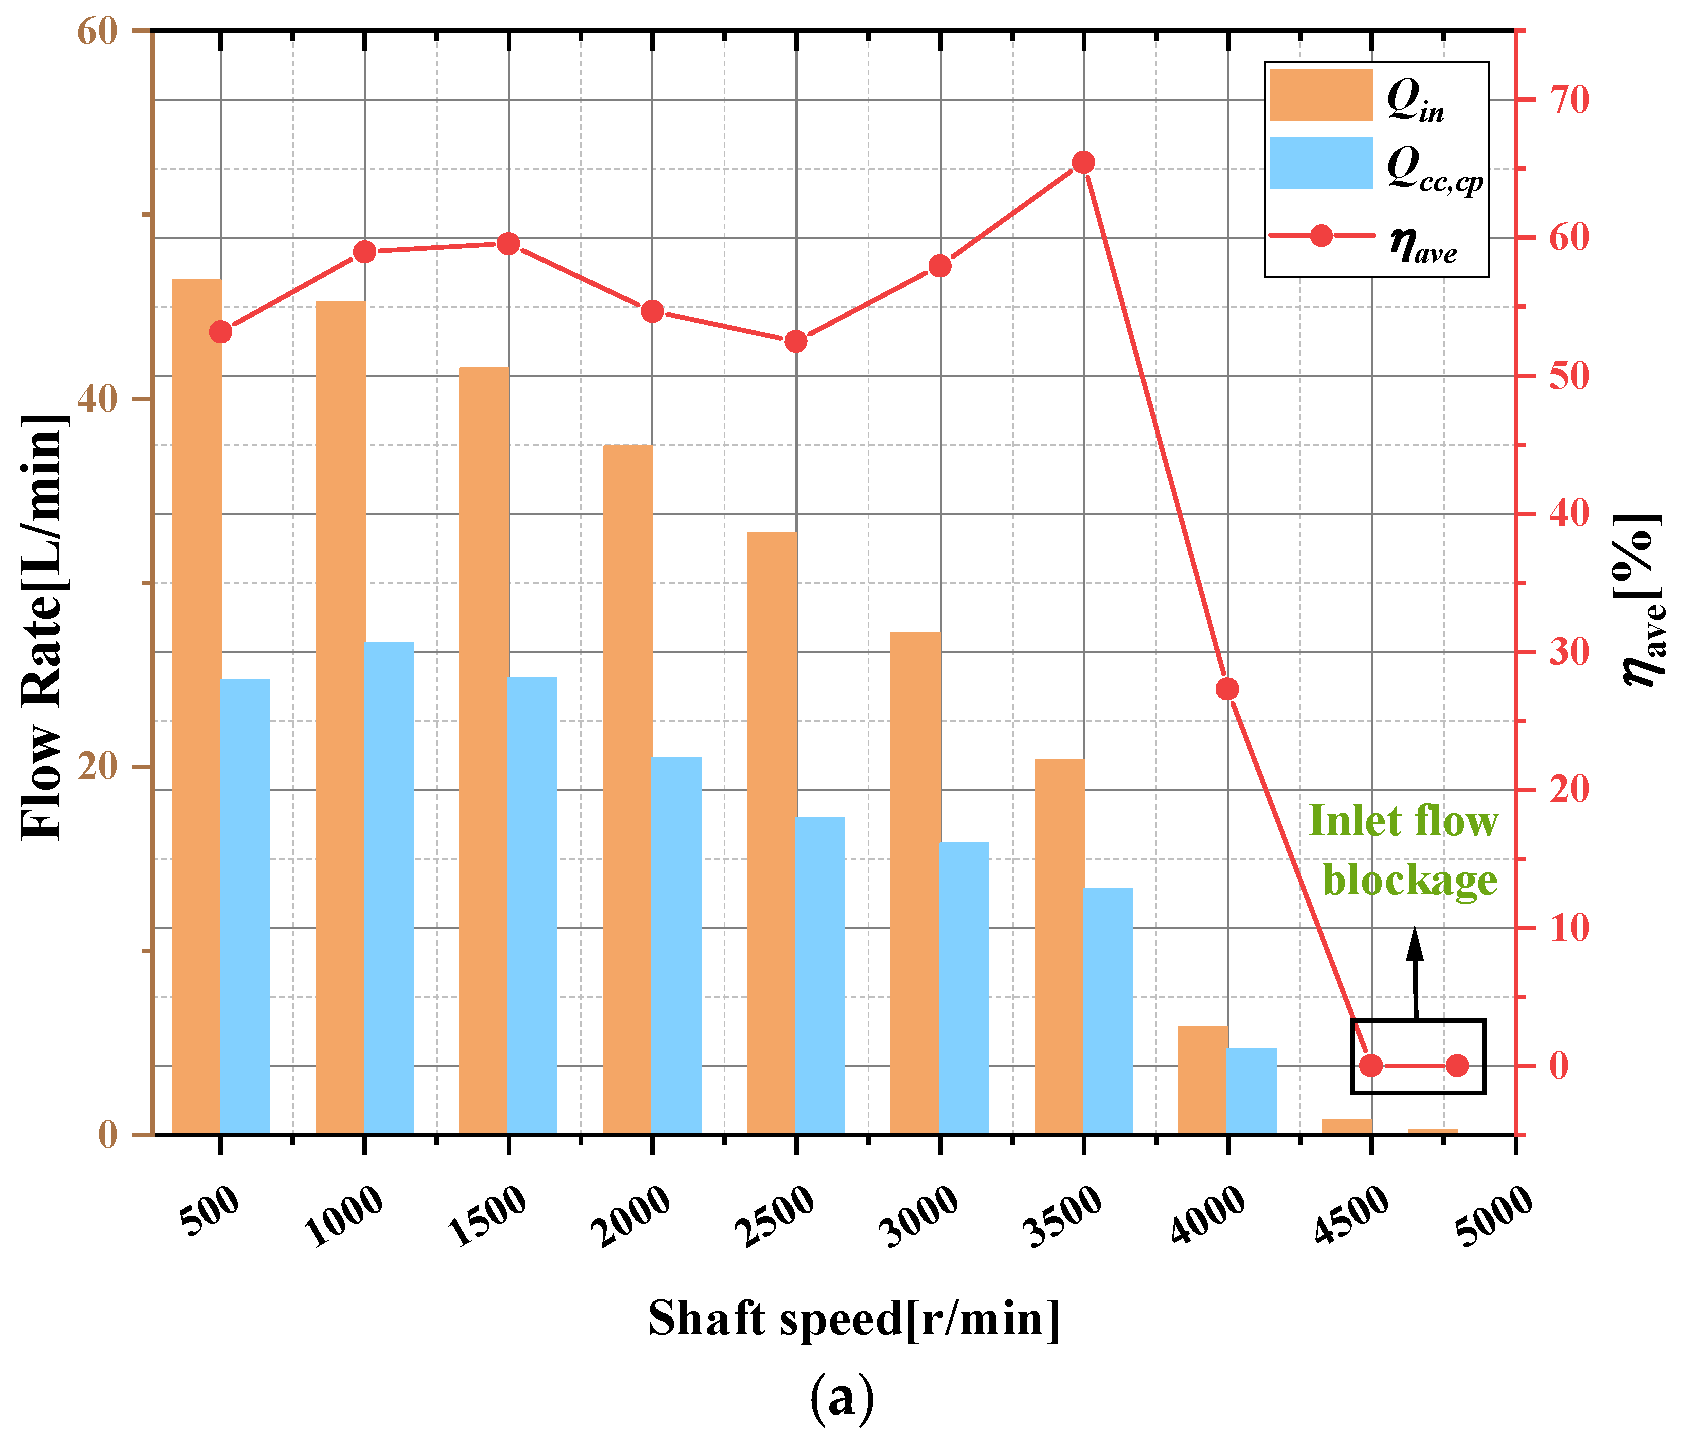
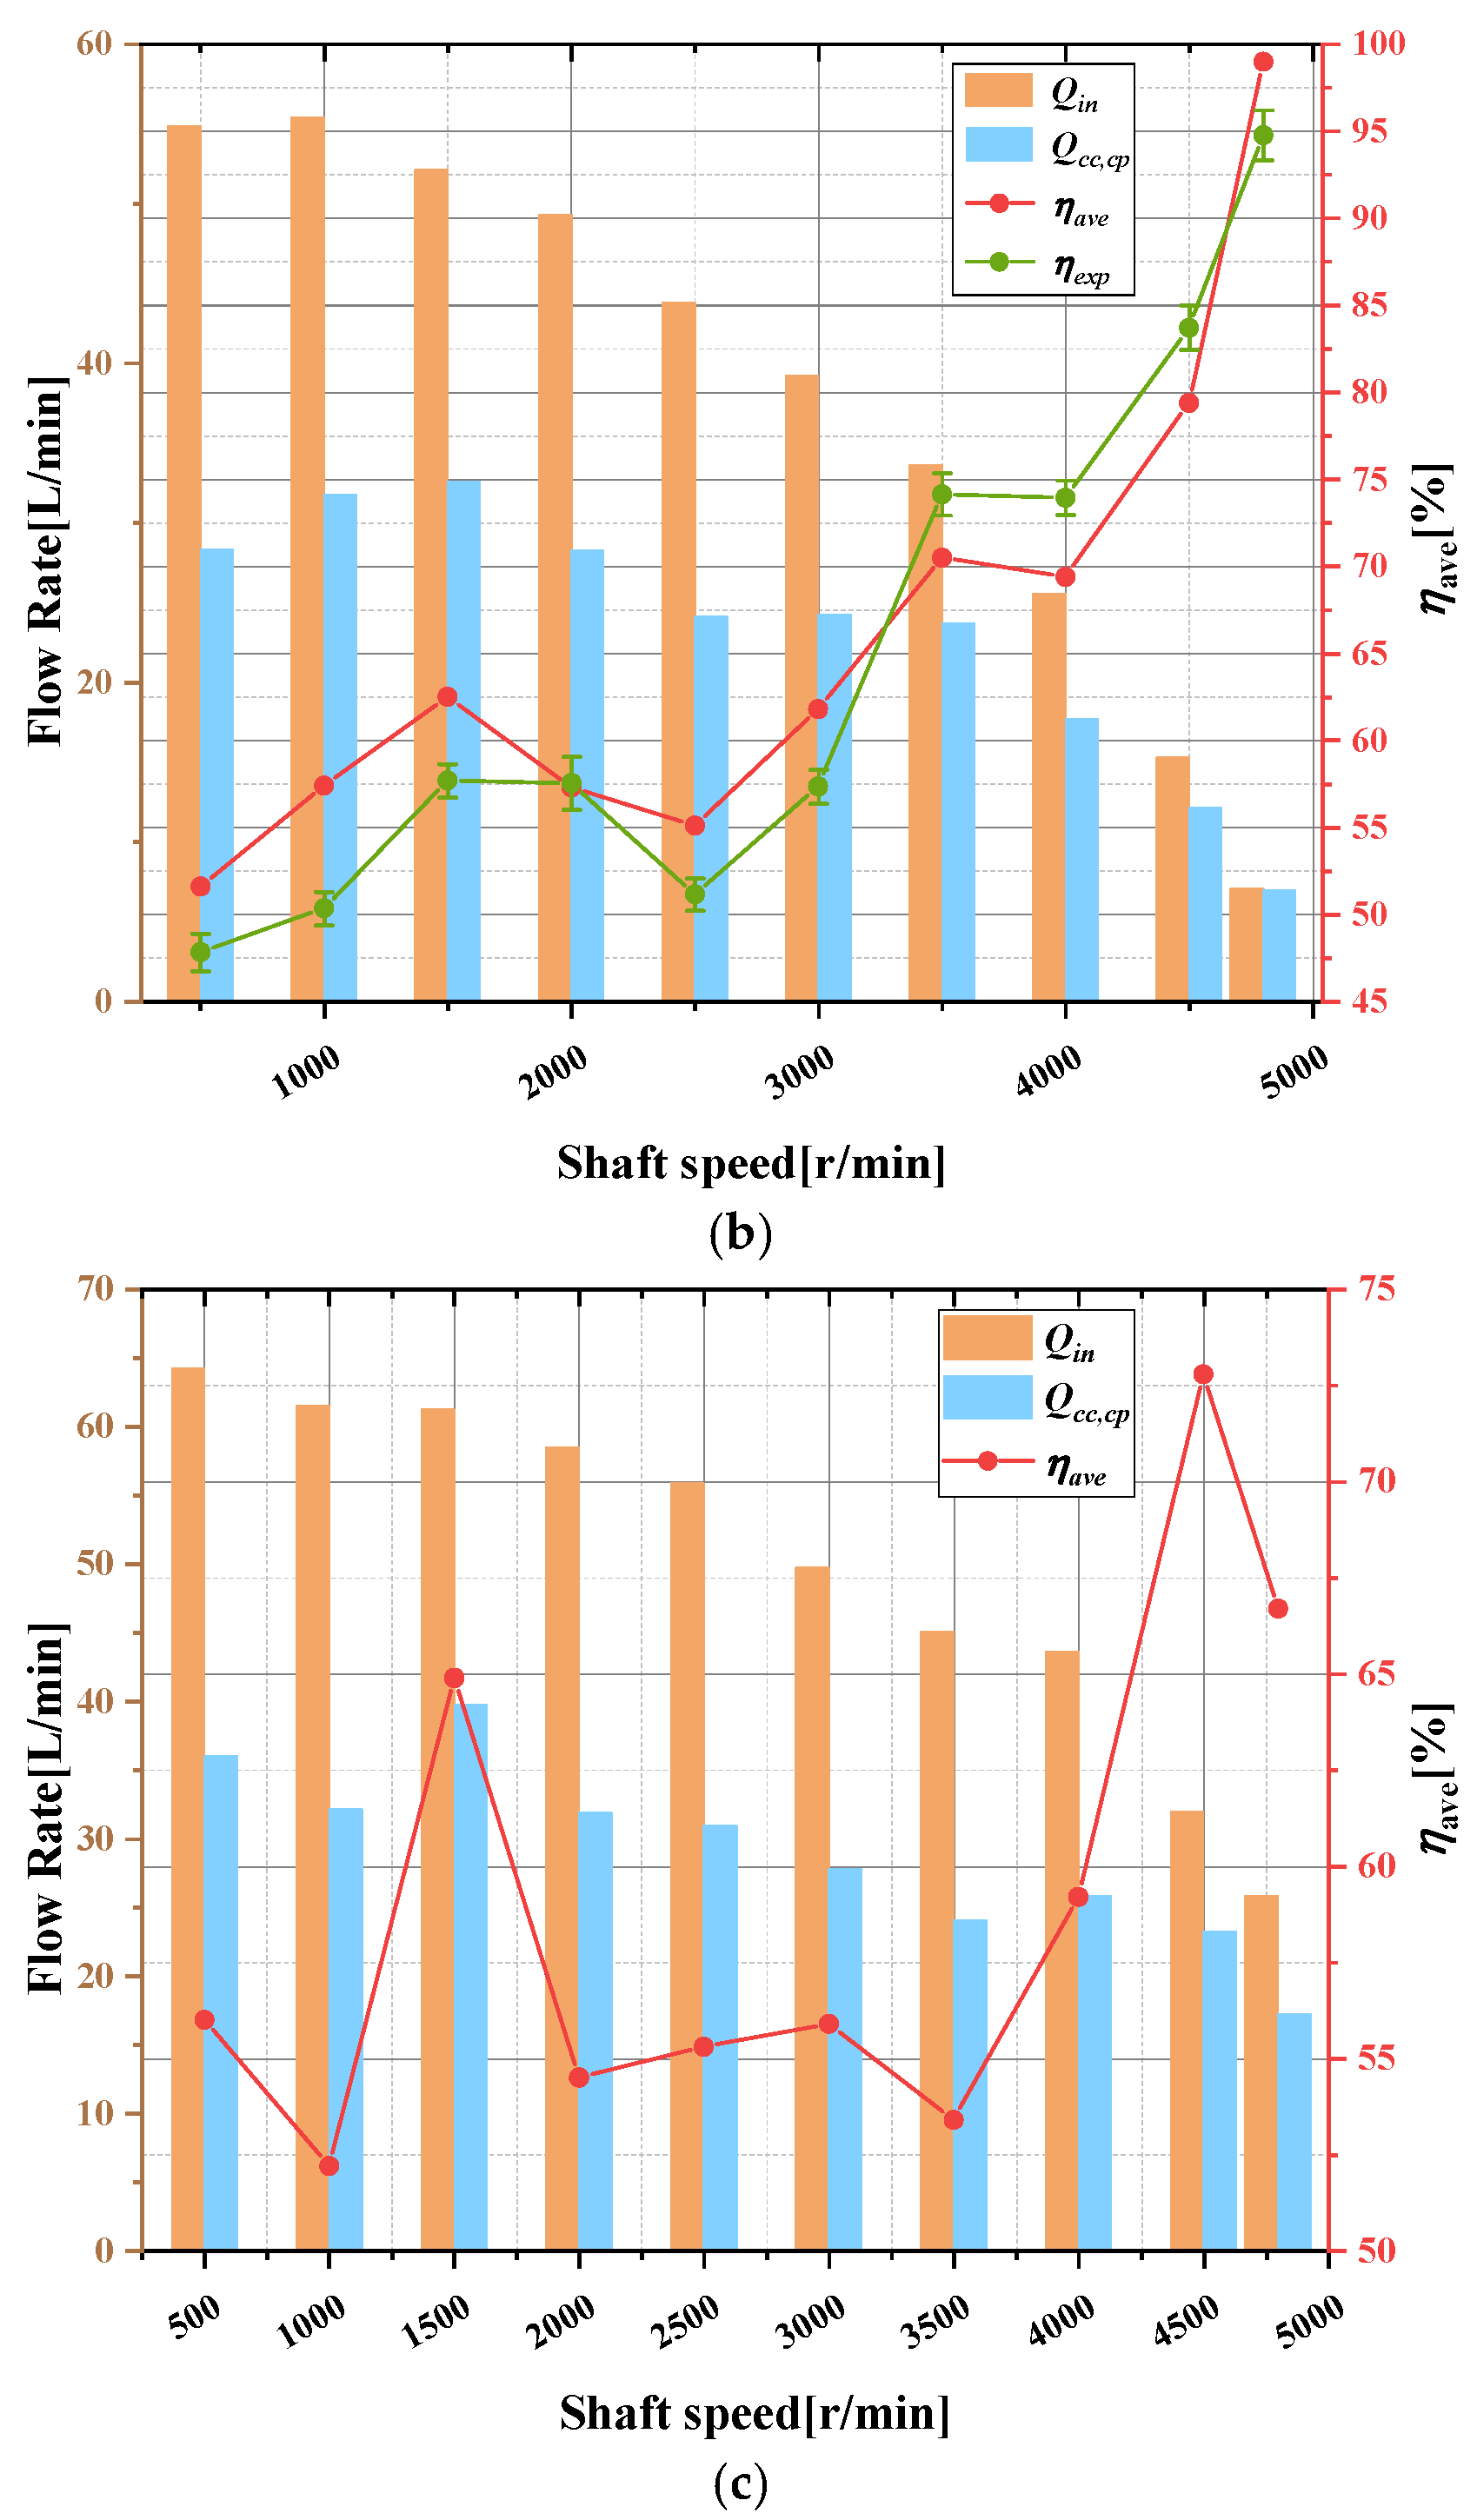
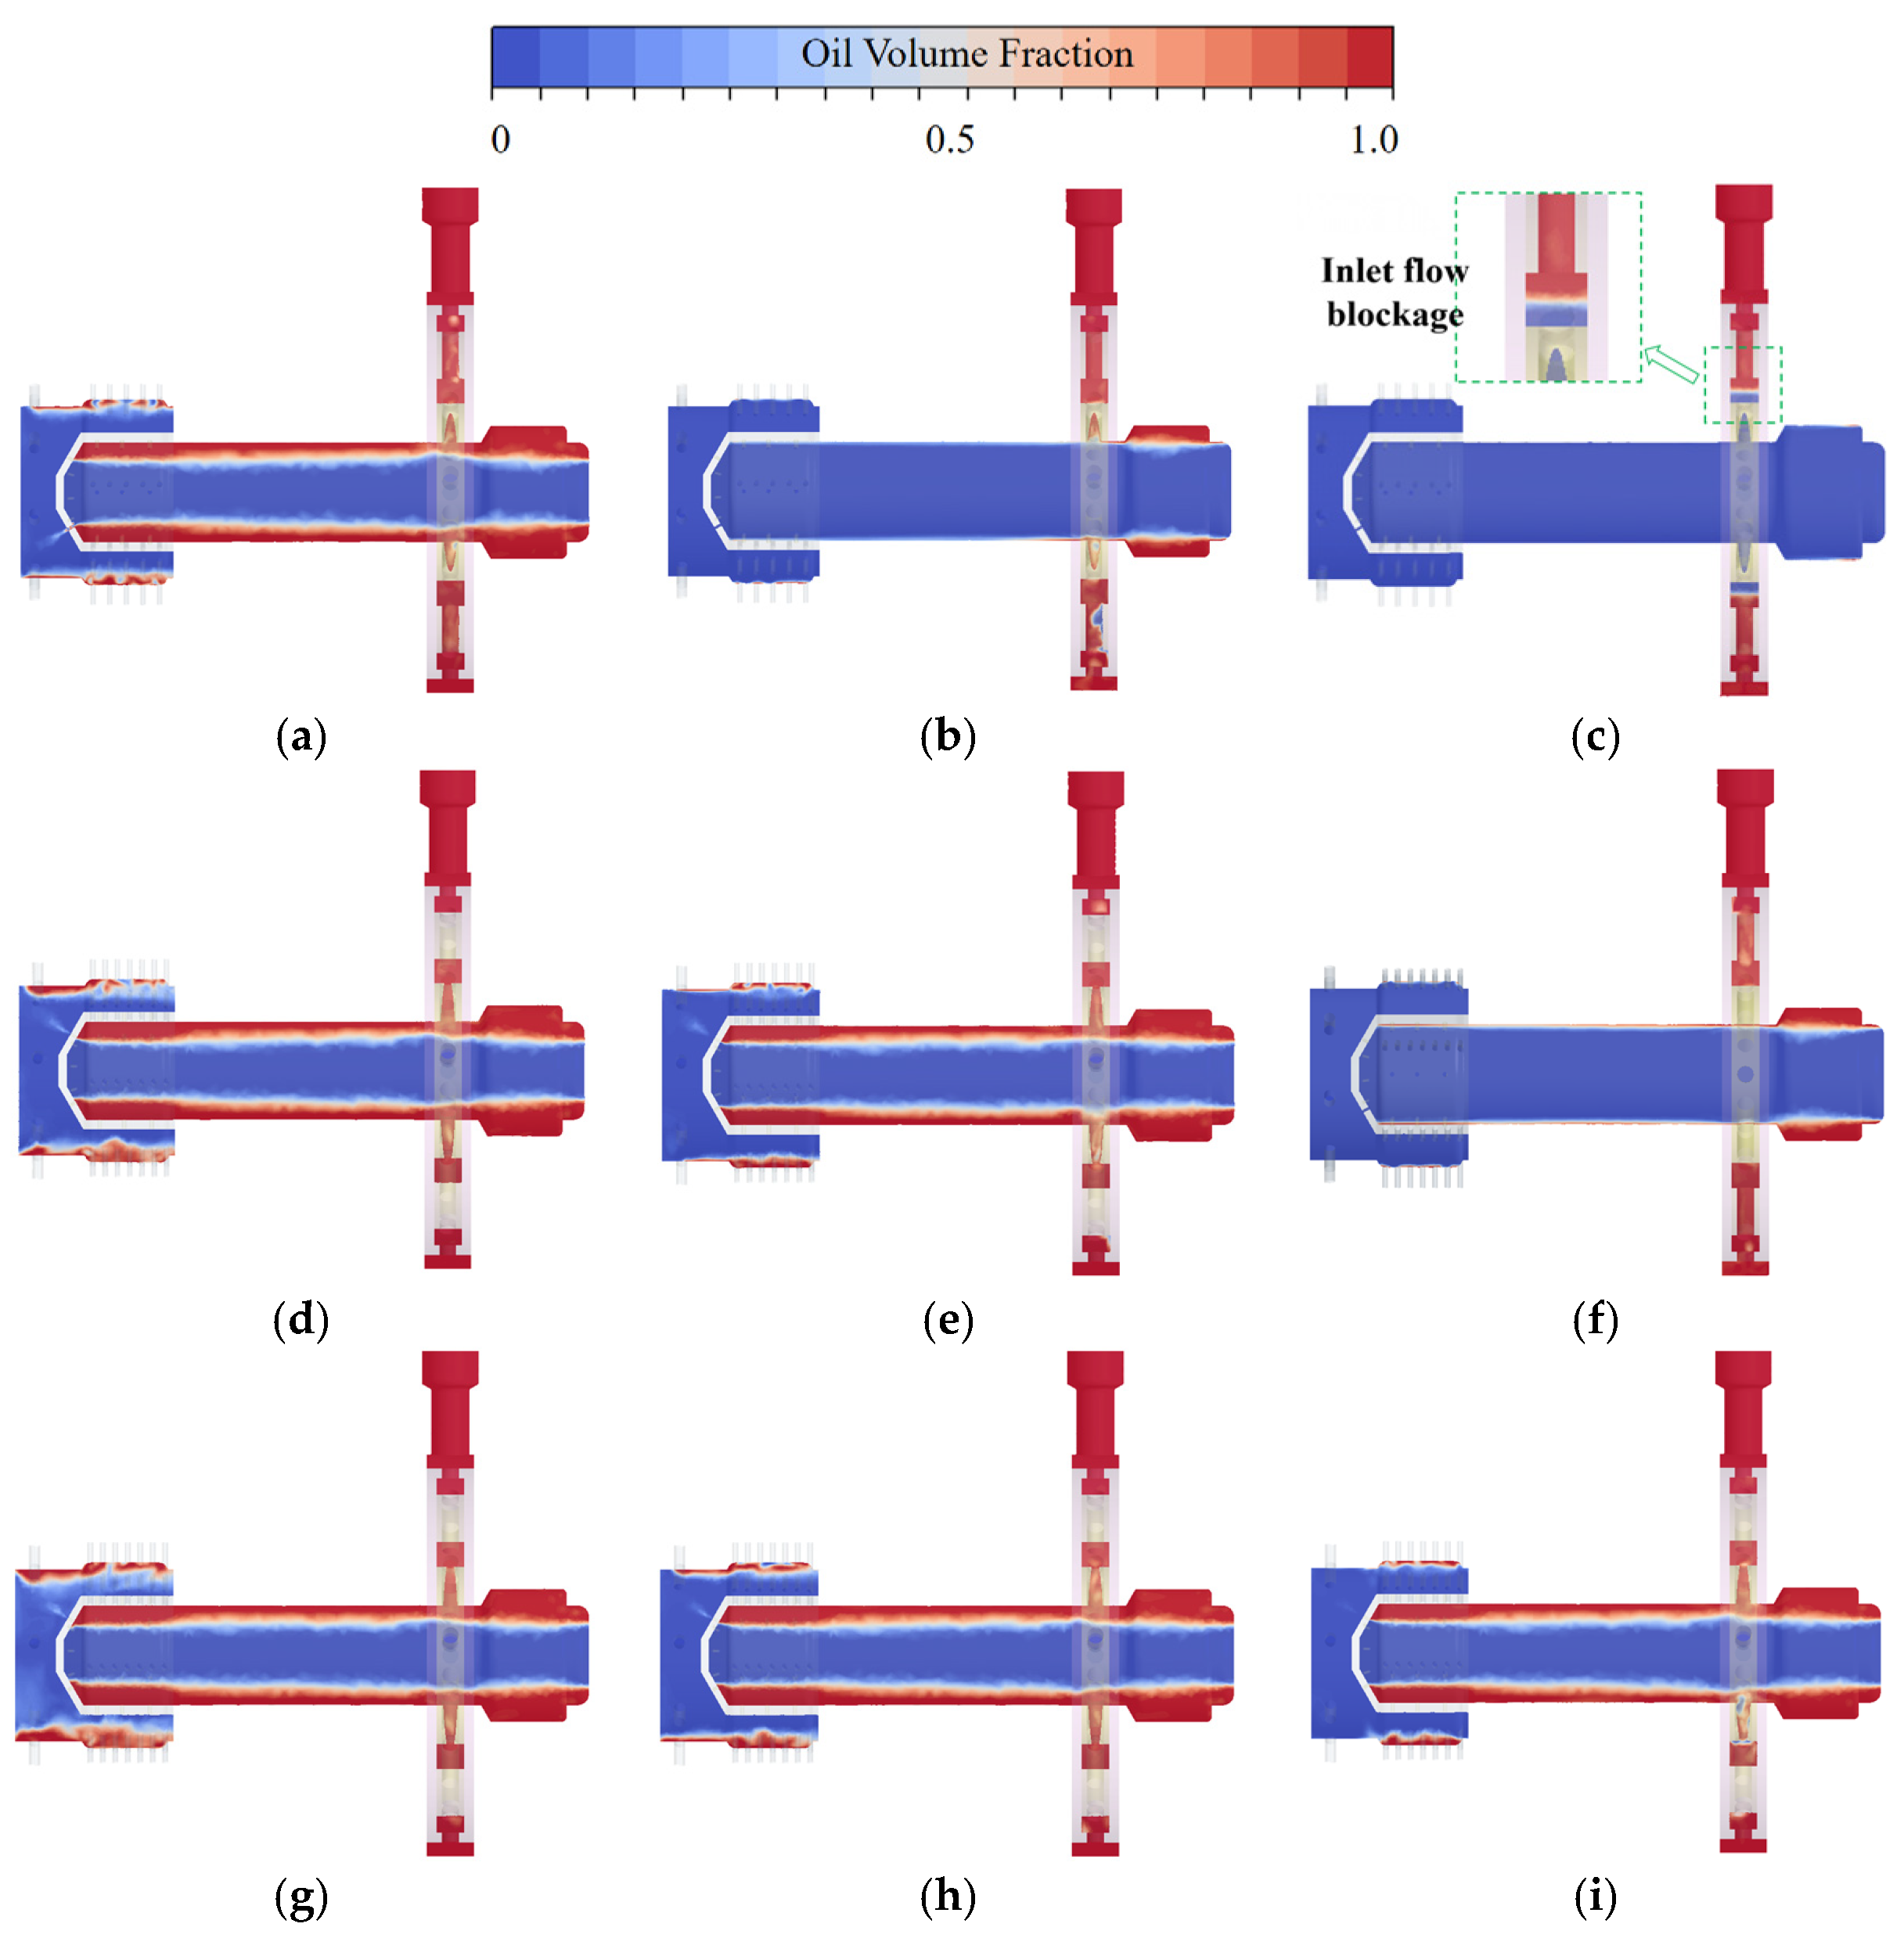
Variations in rotational speed alter centrifugal forces, thereby impacting oil delivery efficiency and flow rates. Figure 6 displays inlet flow rate ( Q i n ), friction pair oil supply flow rate ( Q c c , c p ), and oil delivery efficiency ( η a v e ) curves under oil pressure differentials ( Δ p ) of 0.3, 0.45, and 0.6 MPa. As speed increases, Q i n progressively decreases across all pressure conditions. Conversely, Q c c , c p initially rises to a peak near 1500 rpm before declining at higher speeds. Under low Δ p (0.3 MPa) and high speeds (≥4500 rpm), Q c c , c p drops to zero due to the oil–air interface migrating into the annular chamber between the input shaft and oil-slinging nozzle (Figure 7), preventing oil entry. This flow cessation results from high centrifugal resistance in the annular chamber exceeding the inlet pressure differential, thus blocking lubricant transport into the nozzle.
The influence of rotational speed on oil delivery efficiency exhibits zone-dependent characteristics. Below 3500 rpm, speed increases marginally affect friction pair supply efficiency, with all curves showing an initial rise followed by a decline, peaking near 1500 rpm. Above 3500 rpm, centrifugal resistance intensifies significantly. At the rated speed of 4800 rpm, the abrupt flow reduction causes the liquid level within the oil-slinging nozzle to drop below the output shaft orifice height (Figure 7), enabling complete capture of centrifugally ejected oil by the output shaft’s oil baffle structure, thereby achieving higher supply efficiency.
Regarding oil–air distribution in the input unit, the oil volume fraction decreases with increasing speed. Centrifugal forces expand the oil–air interface radius within both the nozzle ( r 0 ) and output shaft cavity ( r 5 ) as speed rises, a trend independent of pressure differential.

4.1.2. Oil Supply Pressure Differential

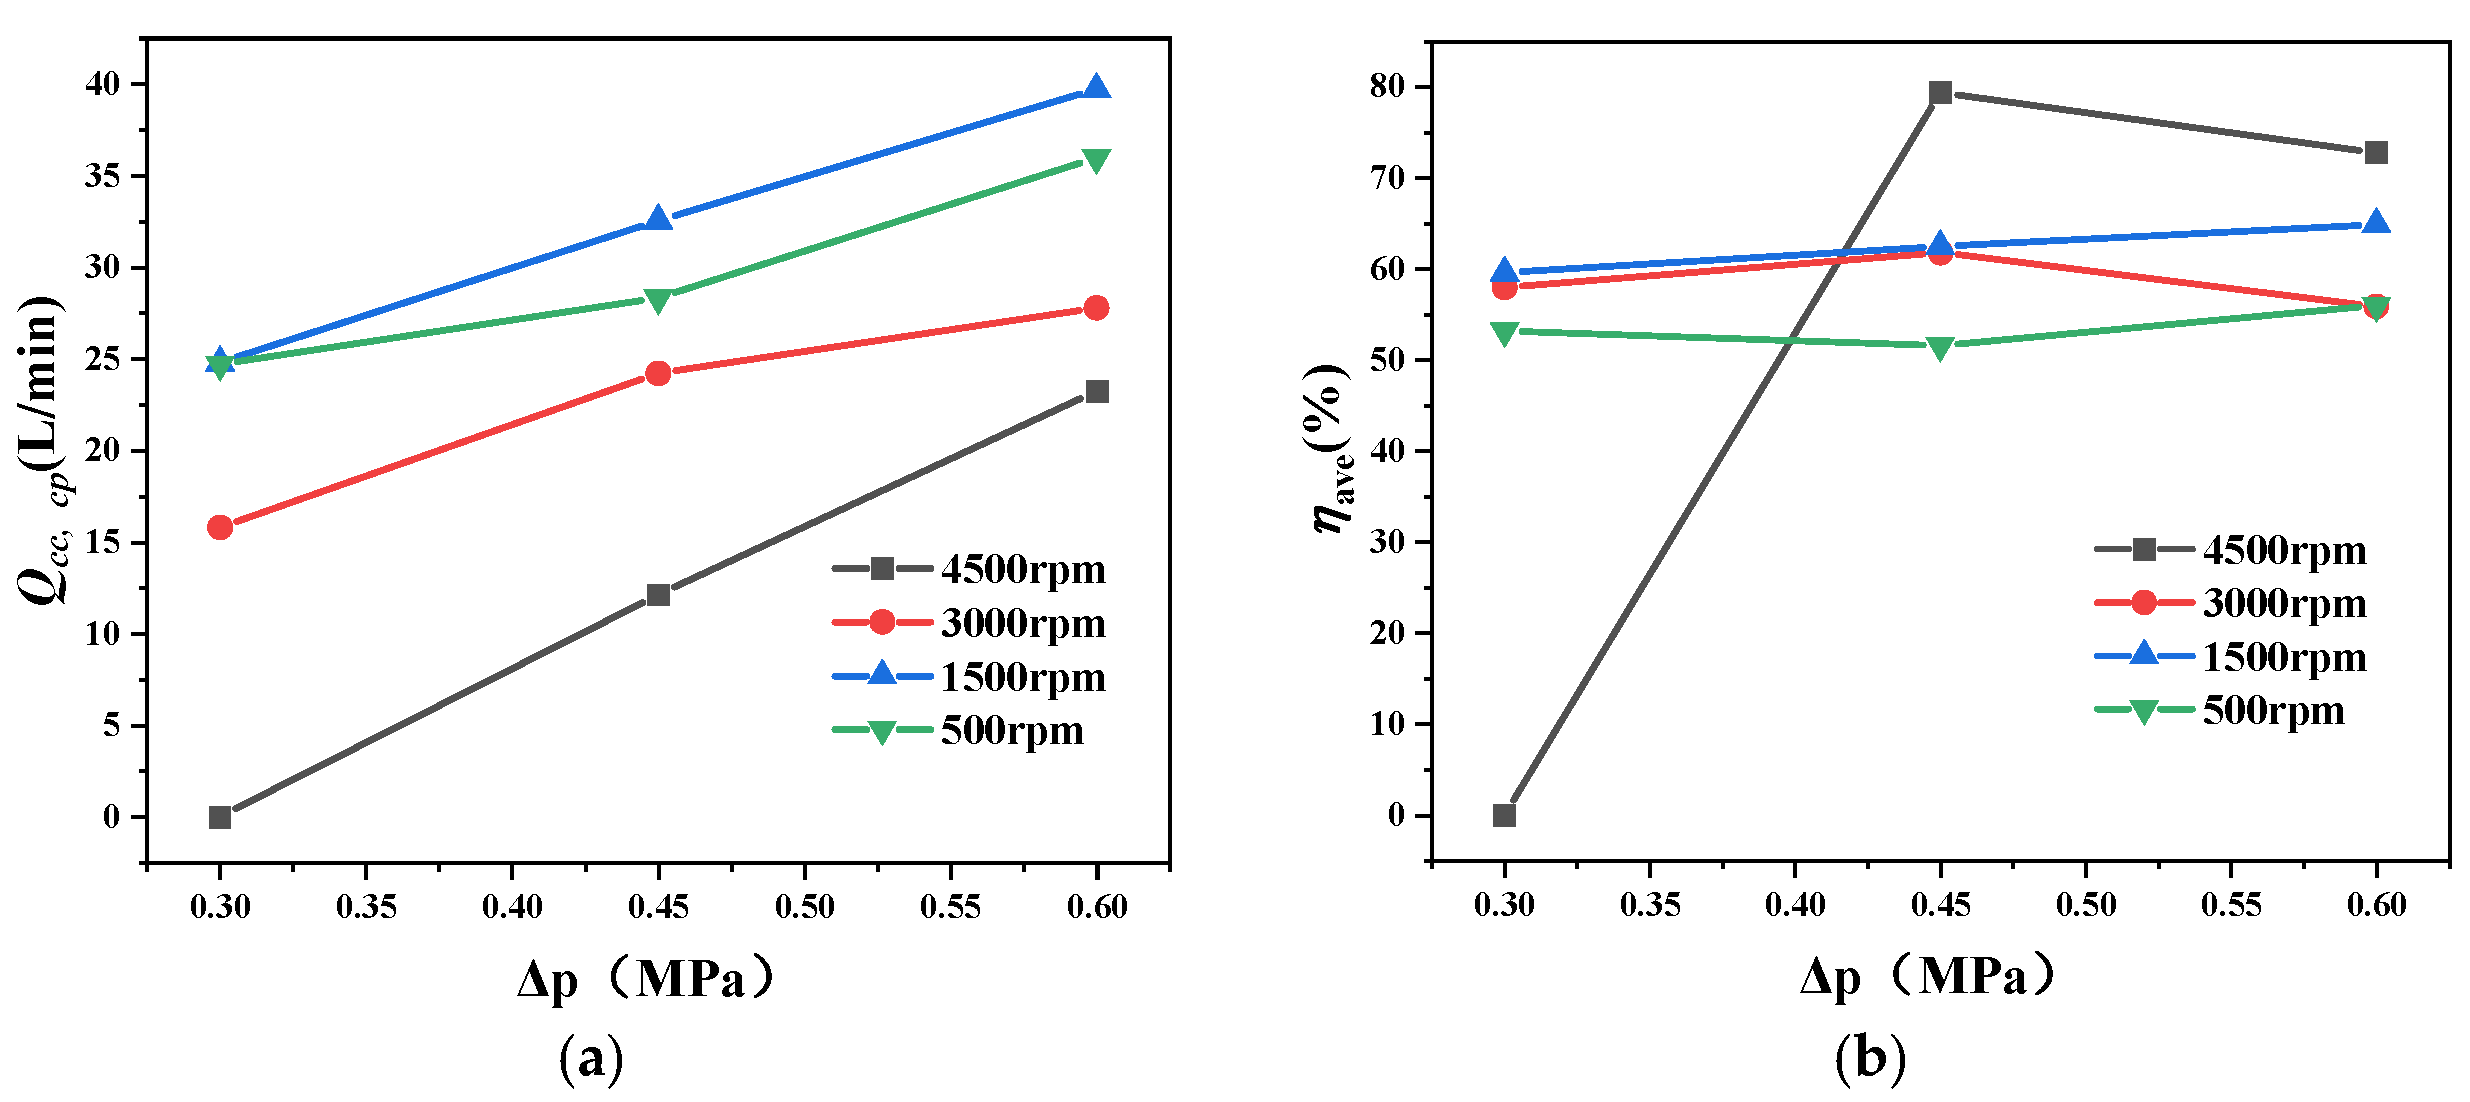
Figure 8 illustrates the impact of oil supply pressure differential ( Δ p ) on friction pair oil collection flow rate ( Q c c , c p ) and oil delivery efficiency ( η a v e ) at 500, 1500, 3000, and 4500 rpm with baseline structural dimensions. Q c c , c p universally increases with Δ p regardless of rotational speed, whereas η a v e exhibits speed-dependent characteristics: at high speeds (n ≥ 4500 rpm), low Δ p causes near-zero oil supply to the friction pair orifice, reducing η a v e to ≈0%; at low speeds (n < 3000 rpm), increasing Δ p marginally improves η a v e (≤5% per 0.1 MPa); however, at speeds ≥ 3000 rpm, elevated pressure increases total nozzle discharge, allowing lubricant to overflow the output shaft’s oil baffle and enter its supply orifice, thereby reducing η a v e .

4.1.3. Nozzle Orifice Diameters

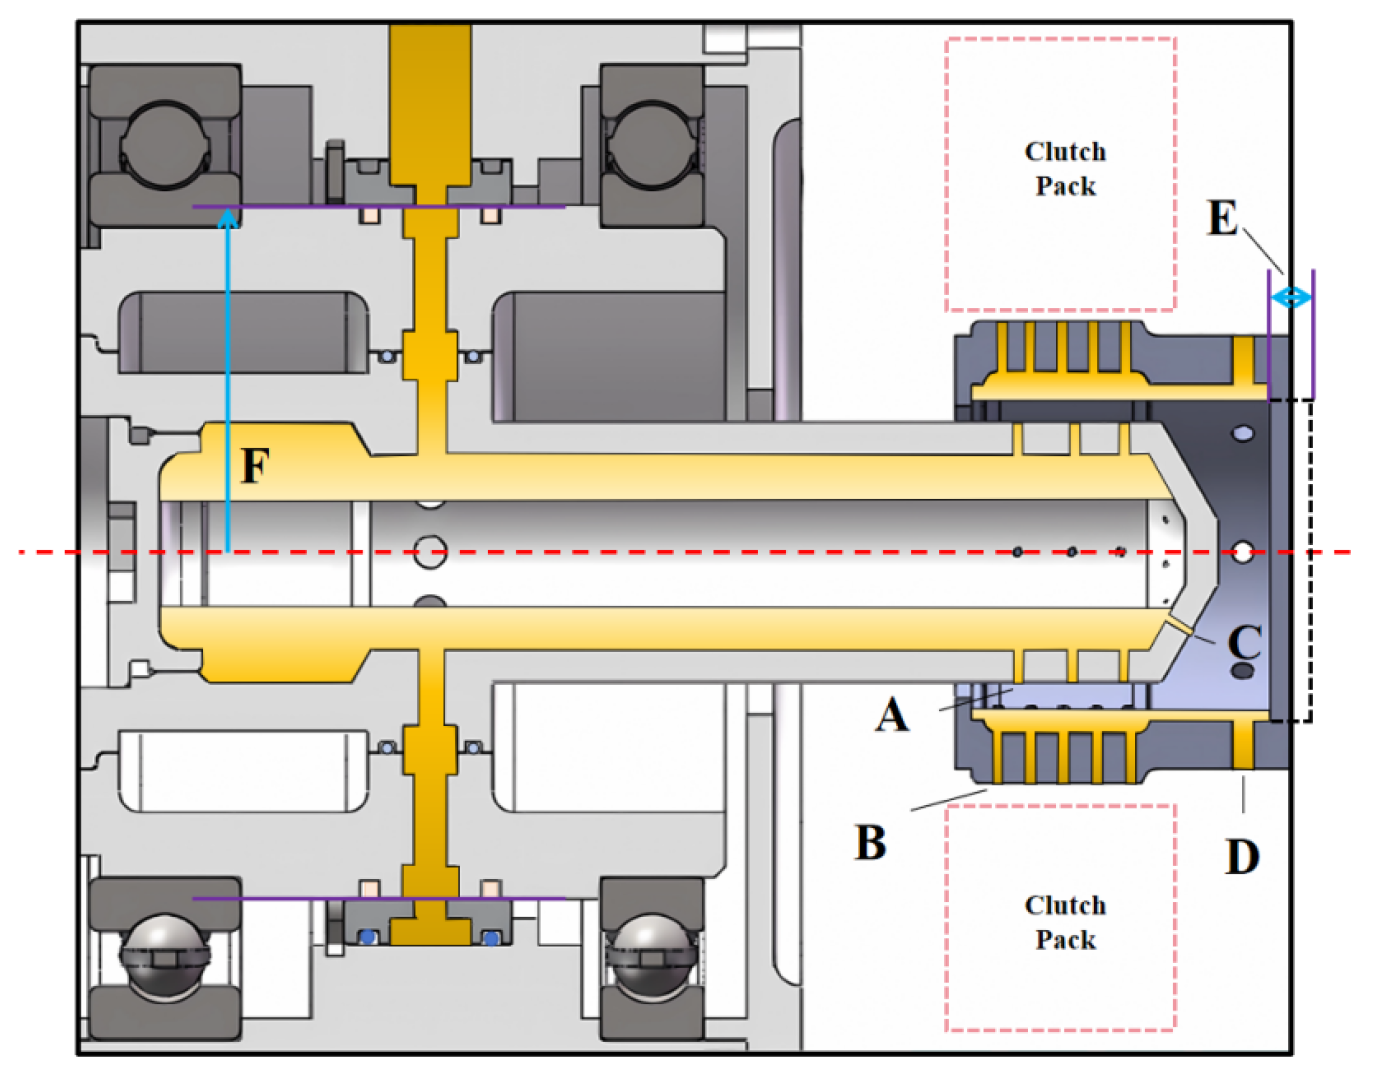
Four structural orifices were modified: Orifice A on the oil-slinging nozzle supplying the friction pair orifice (B); Orifice C on the oil-slinging nozzle supplying the output shaft orifice (D). The distribution of Orifices A–D is shown in Figure 9.
Orifice A Diameter
Figure 10 demonstrates the effects of Orifice A diameter variation on friction pair collection flow rate ( Q c c , c p ), Orifice A discharge flow rate ( Q A ), and oil delivery efficiency ( η a v e ) at 500, 1500, 3000, and 4500 rpm with Δ p = 0.45 MPa. Orifice A diameters tested were 1.6, 2.0, and 2.5 mm while other parameters remained constant. Figure 10a shows Q c c , c p increasing with Orifice A diameter, particularly at low speeds. Figure 10b confirms that larger Orifice A diameters enhance local discharge capacity; however, at high speeds, centrifugal resistance at the rotor–stator interface increases pressure losses. Consequently, larger orifices fail to achieve sufficient pressure differentials for significant flow gains at high speeds, resulting in flatter Q c c , c p curves. Similarly, friction pair flow rates show minimal increase at high speeds. Figure 10c reveals a nonlinear efficiency response: as Orifice A expands from 1.6 to 2.5 mm, η a v e initially decreases. Although larger orifices increase flow from Orifice A, the fixed oil transport capacity of the output shaft causes liquid levels to exceed the oil baffle’s retention capacity, diverting lubricant to the output shaft outlet and reducing η a v e .
Orifice B Diameter
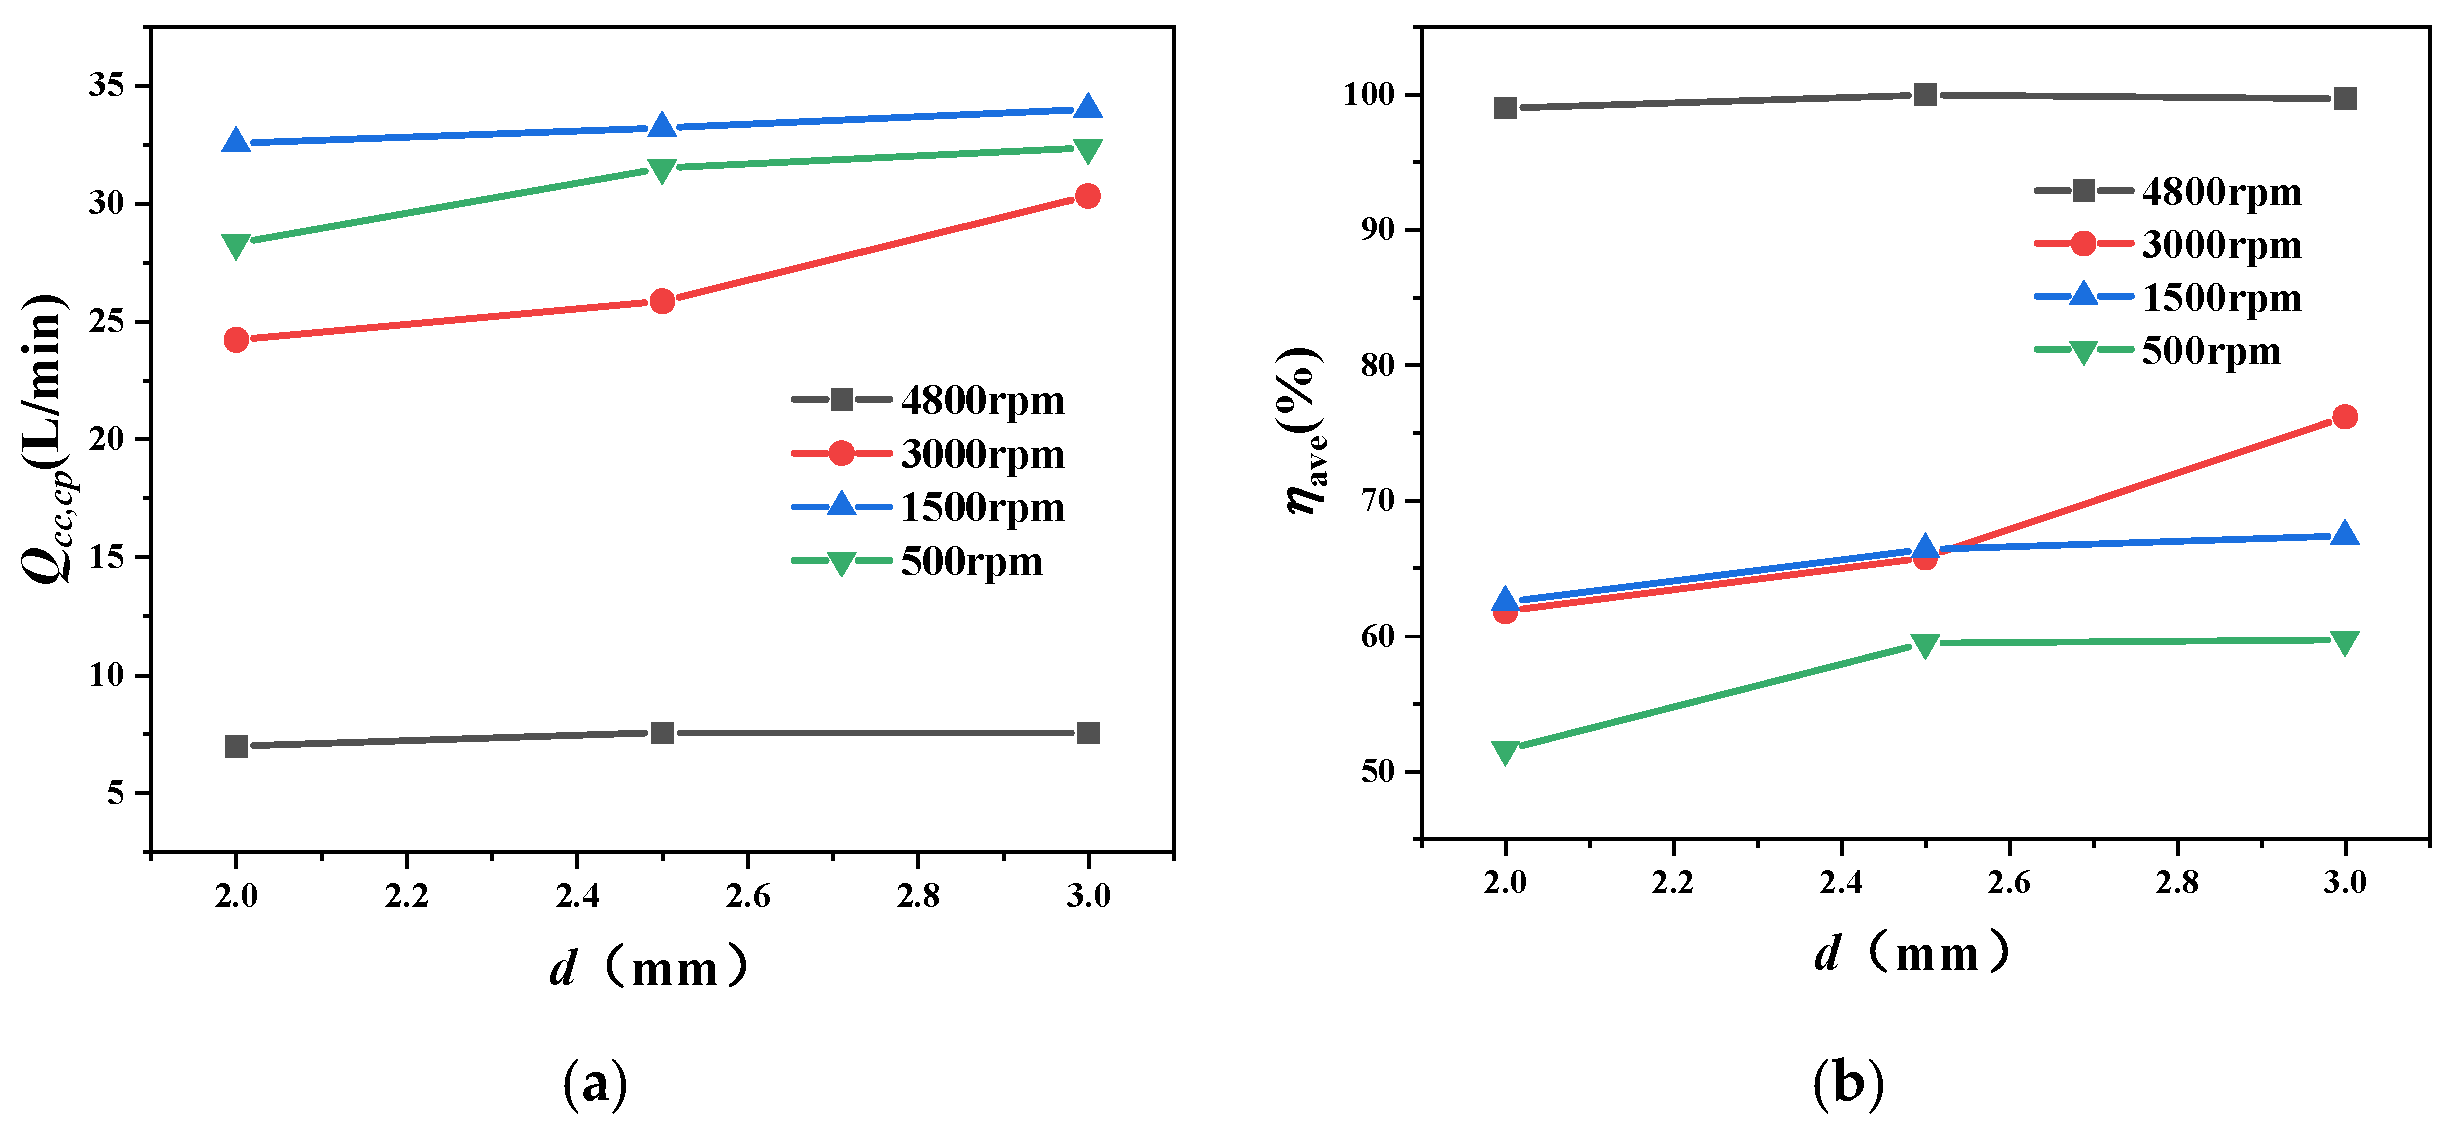
Figure 11 illustrates the effects of Orifice B diameter variation on friction pair oil collection flow rate ( Q c c , c p ) and oil delivery efficiency ( η a v e ). Tests were conducted at 500, 1500, 3000, and 4800 rpm with a supply pressure differential ( Δ p ) of 0.45 MPa. Orifice B diameters tested were 2.0, 2.5, and 3.0 mm, while other parameters remained constant.
As shown in Figure 11a, Q c c , c p increases moderately with larger Orifice B diameters, but this effect is only significant at lower speeds (≤3000 rpm). At the rated speed of 4800 rpm, enlarging Orifice B has negligible impact on Q c c , c p . This occurs because the flow rate entering the input shaft cavity remains unchanged (dictated by the primary oil-slinging structure) and is below the maximum flow capacity of Orifice B even at 2.0 mm diameter. Thus, increasing its diameter cannot enhance flow under this condition. Figure 11b indicates that oil delivery efficiency η a v e improves with larger Orifice B diameters, though only noticeably at low speeds. At low rotational speeds, smaller Orifice B diameters exhibit insufficient flow capacity, causing oil accumulation. Enlarging the orifice alleviates this accumulation and thereby improves efficiency.
Orifice C Diameter
Figure 12 demonstrates the effects of Orifice C diameter variation on Q c c , c p , Orifice C discharge flow rate ( Q C ), and η a v e . Tests were performed at 500, 1500, 3000, and 4500 rpm with Δ p = 0.45 MPa. Orifice C diameters tested were 1.0, 1.5, 2.0, and 2.5 mm, while other parameters were unchanged.
Figure 12a shows that Q c c , c p gradually increases with larger Orifice C diameters. Figure 12b reveals that Q C rises significantly with diameter enlargement at low speeds but remains relatively flat at 4500 rpm. Since the oil transport capacity of the output shaft orifice is fixed, increased flow from Orifice C cannot be fully discharged. Splashed lubricant impacts the output shaft wall and flows toward the oil ring where the friction pair supply orifice is located, indirectly increasing Q c c , c p . At 4500 rpm, the limited oil level in the oil-slinging nozzle restricts flow, diminishing the impact of larger diameters.
Figure 12c displays non-monotonic efficiency trends: at speeds ≤3000 rpm, η a v e first decreases then increases with larger Orifice C diameters; at 4500 rpm, it decreases monotonically. At low speeds, initial diameter enlargement rapidly increases Q C , raising flow through the output shaft orifice. However, further enlargement exceeds the output shaft’s transport capacity, diverting excess flow to the friction pair orifice and improving efficiency. At 4500 rpm, larger diameters reduce the oil level required for lubricant ejection from Orifice C, allowing partial oil to bypass the output shaft orifice and reducing η a v e (Figure 13).
Orifice D Diameter
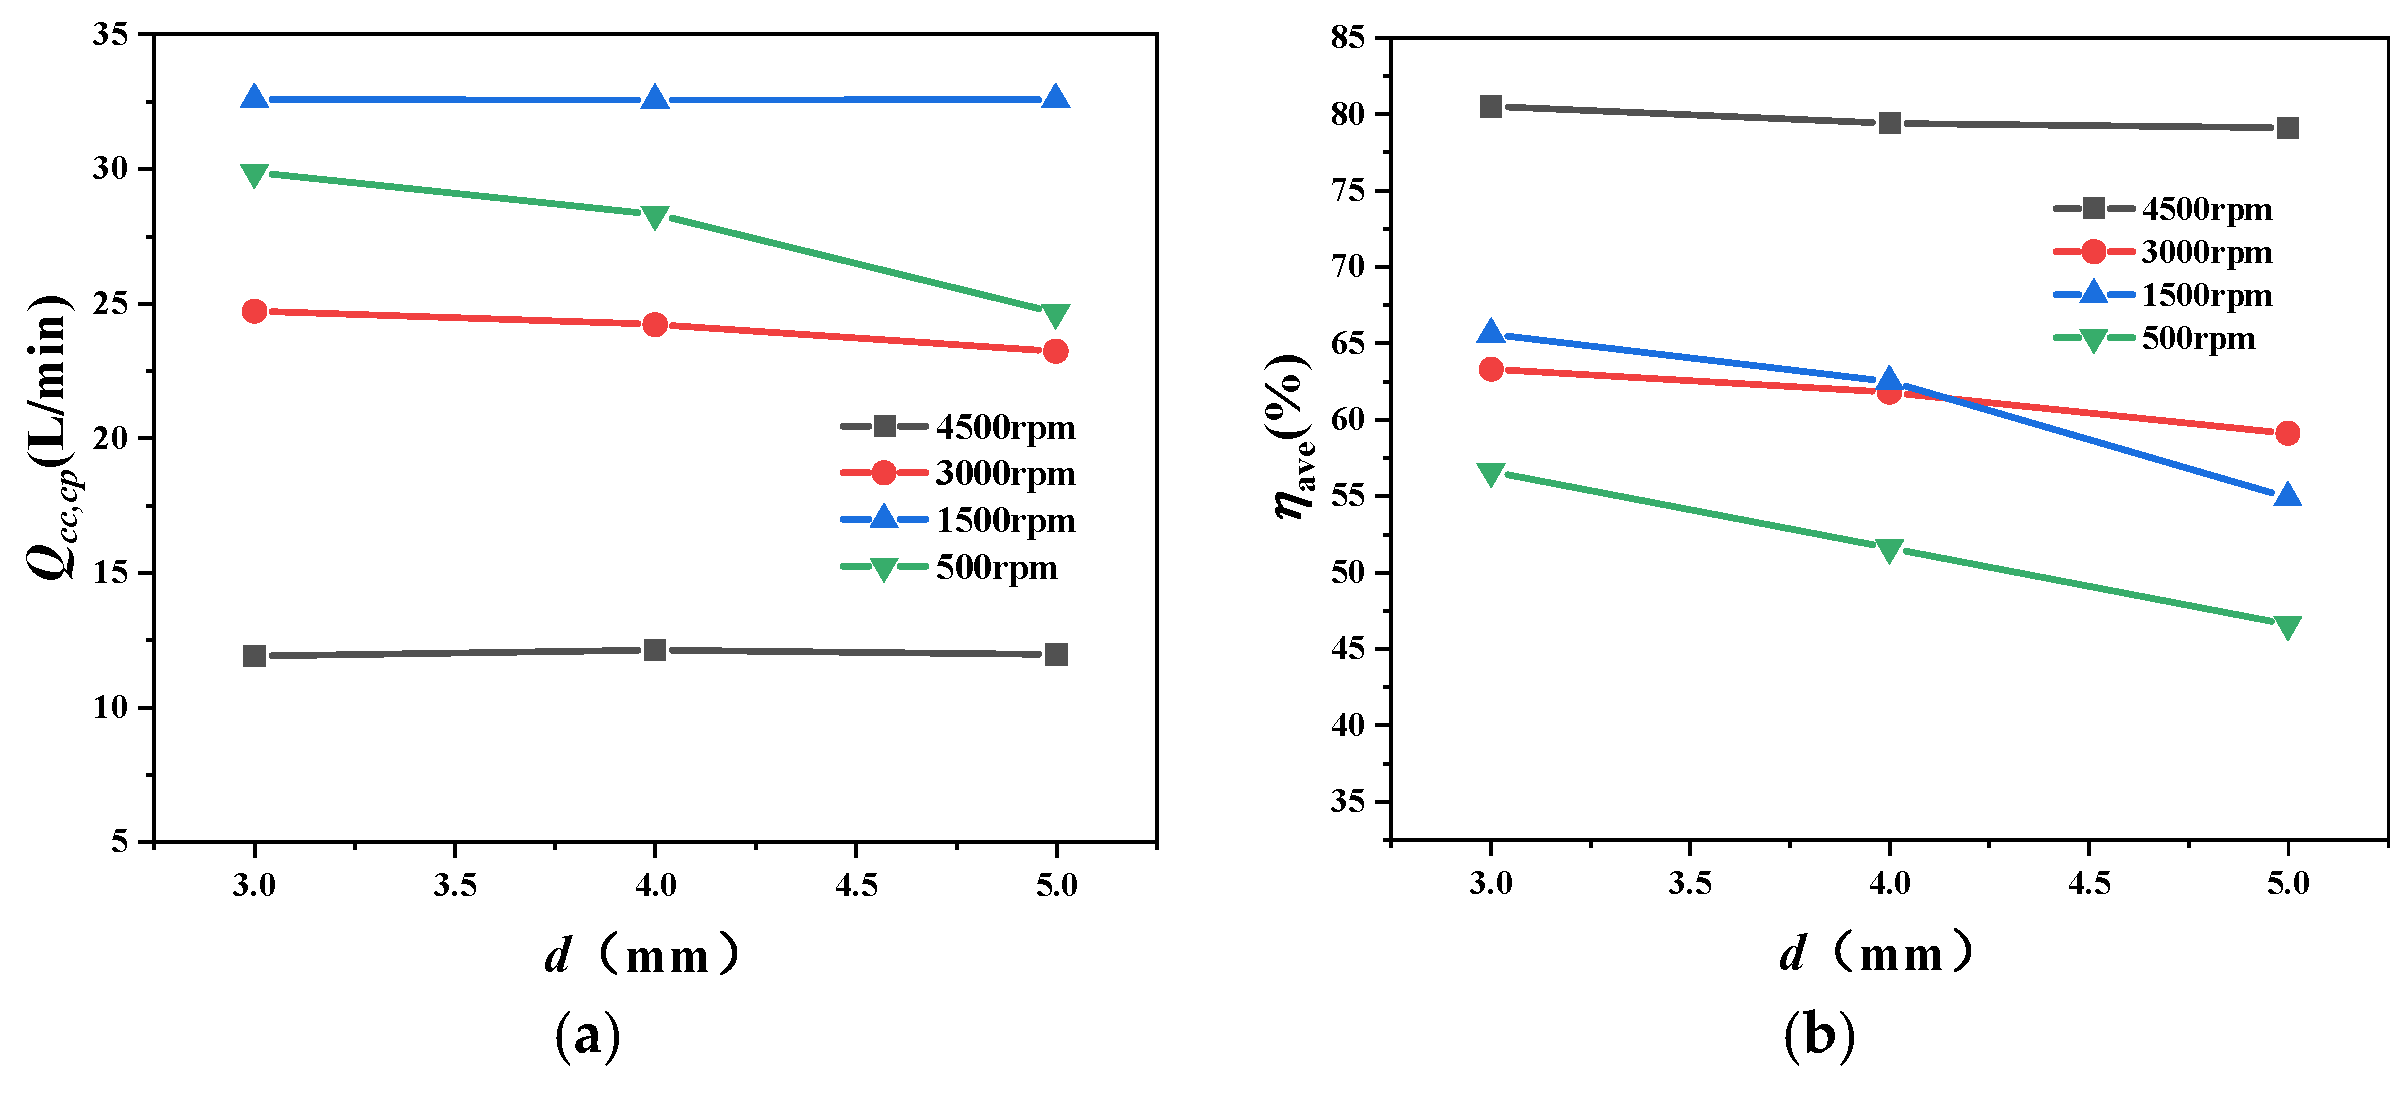
Figure 14 illustrates the effects of output shaft Orifice D diameter variation on Q c c , c p and η a v e . Tests were conducted at 500, 1500, 3000, and 4500 rpm with Δ p = 0.45 MPa. Orifice D diameters tested were 3.0, 4.0, and 5.0 mm. Figure 14a shows that enlarging Orifice D has negligible impact on Q c c , c p except at 500 rpm, where it significantly reduces flow. At low speeds, the output shaft’s limited oil transport capacity causes cavity flooding (single-phase oil flow). Larger Orifice D diameters enhance flow diversion, reducing Q c c , c p and η a v e . At high speeds (Figure 14b), enlarging Orifice D minimally affects η a v e because reduced oil entry into the output shaft is almost entirely captured by the friction pair orifice.

4.1.4. Input Shaft Radius (F)

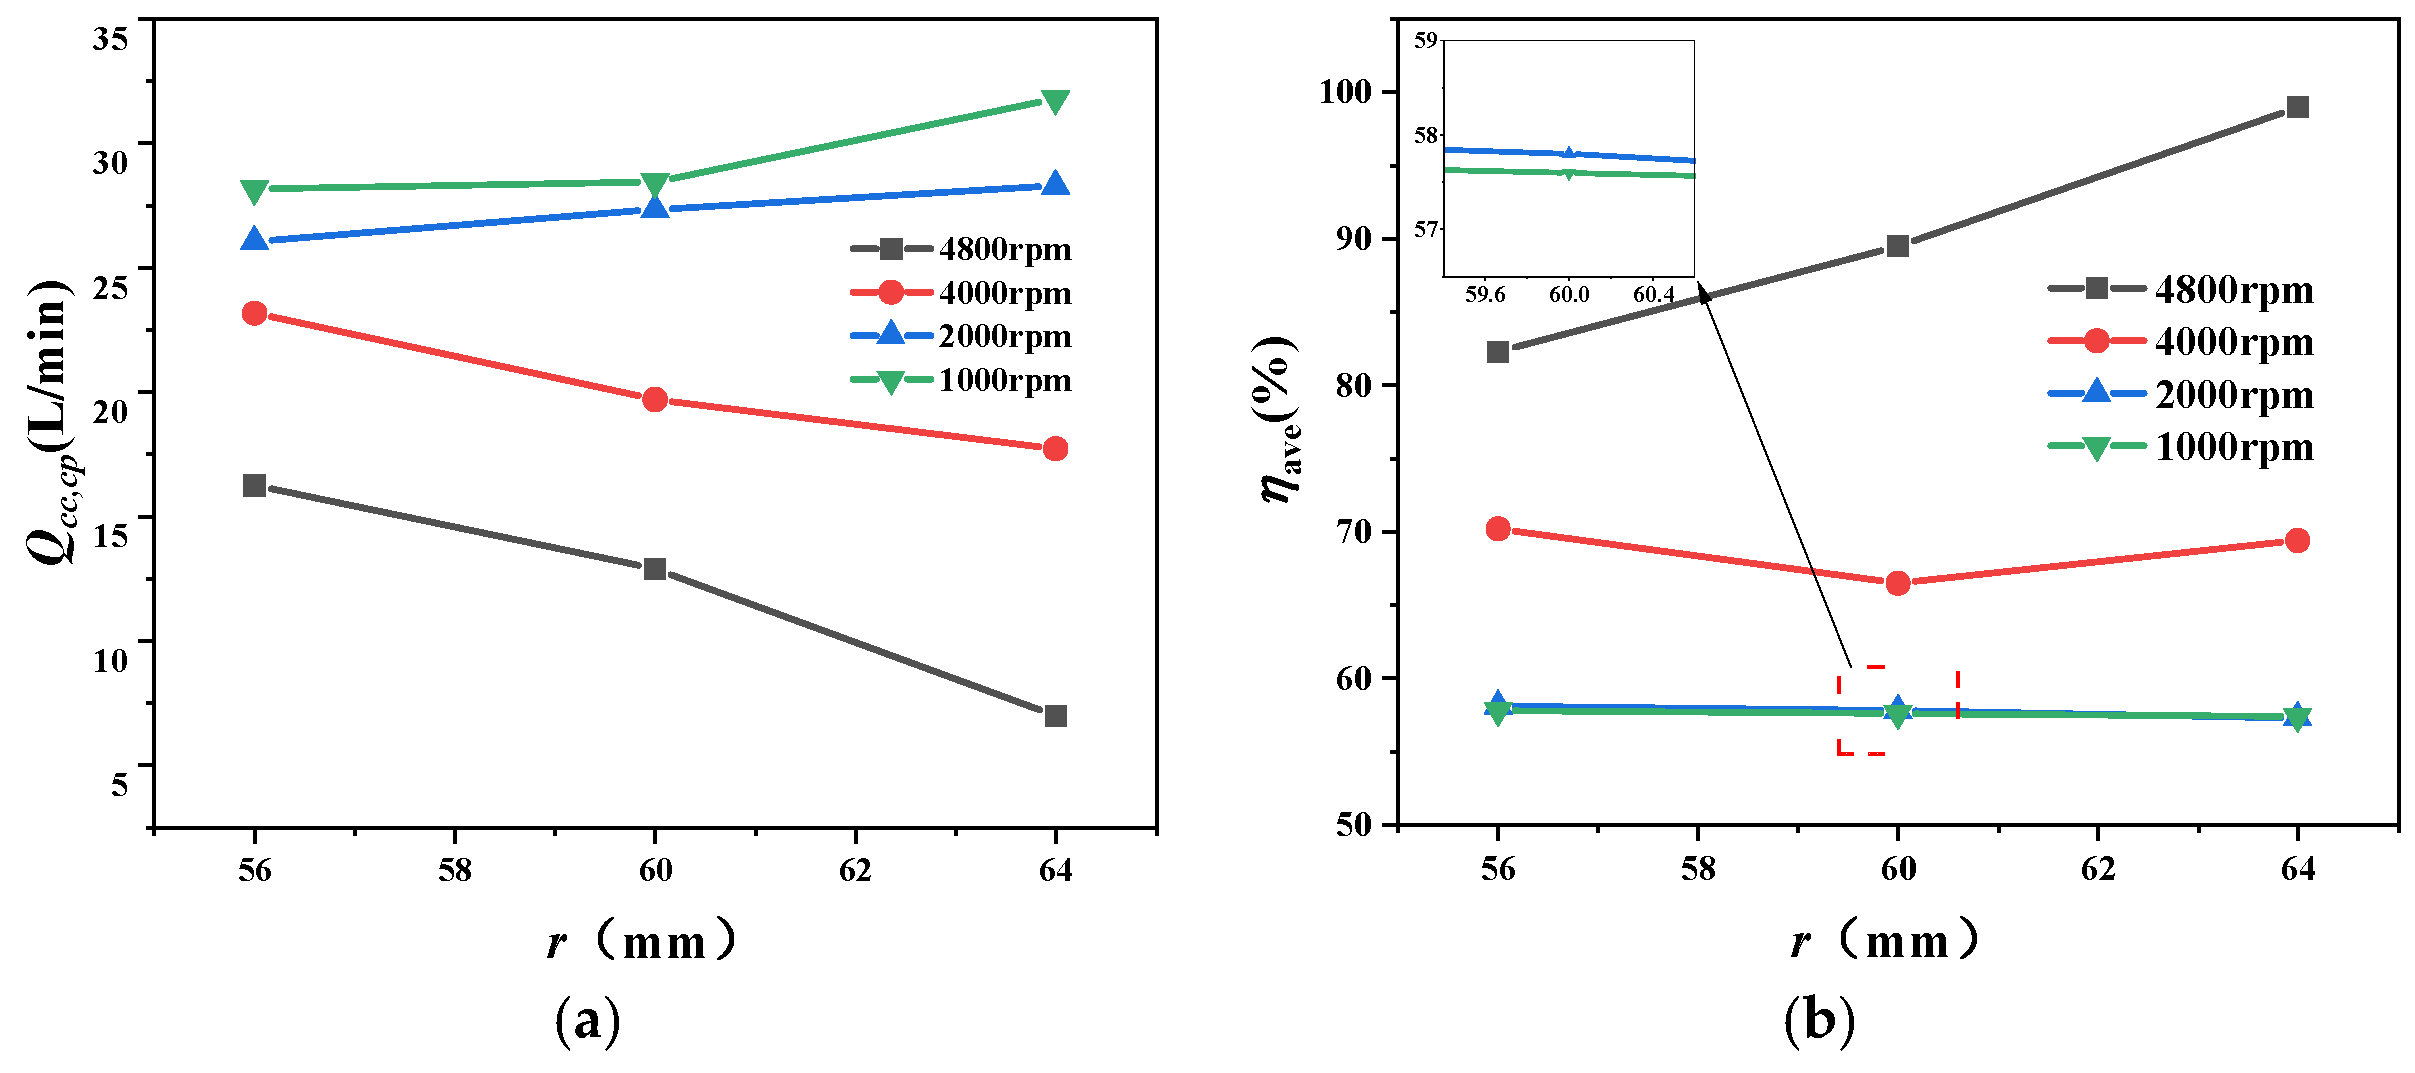
Figure 15 shows the effects of input shaft radius variation on Q c c , c p and η a v e . Tests were performed at 1000, 2000, 4000, and 4800 rpm with Δ p = 0.45 MPa. Input shaft radii tested were 56, 60, and 64 mm. Figure 15a indicates speed-dependent trends: at low speeds (≤2000 rpm), Q c c , c p increases mildly with larger radii; at high speeds (≥4000 rpm), it decreases sharply, with greater sensitivity at higher speeds. Figure 15b illustrates the effect of input shaft radius variations on η a v e . At rotational speeds of 4000 r/min and below, the input shaft radius exhibits negligible influence on η a v e . However, at the rated speed of 4800 r/min, η a v e increases with larger radii. This occurs because the rapid decline in flow rate enables the oil baffle weir to completely capture the oil discharged from the oil-slinging nozzle.

4.1.5. Physical Mechanism of Centrifugal Blocking and Flow Limitation

The fundamental obstacle to oil entry is the centrifugal pressure barrier established at the rotor–stator interface. The radial pressure distribution within a fluid undergoing solid-body rotation is derived from the balance between the centrifugal force and the radial pressure gradient. For a fluid element, this force balance yields the governing equation:
ρ r = ρ ω 2 r
Integrating this equation from the inner radius ( r i ) to the outer radius ( r o ) of the rotating annulus gives the centrifugal pressure difference:
Δ p = p o p i = 1 2 ρ ω 2 r o 2 r i 2
Referring to Figure 3, integrating from the free liquid surface r 0 to the input shaft radius r 3 yields the pressure p 3 . where p 0 denotes the pressure at the free liquid surface r 0 .
p 3 = 1 2 ρ ω 2 r 3 2 r 0 2 + p 0
Neglecting the change in static pressure over a short distance, the criterion for oil to gain access to the oil-slinging nozzle is:
p i n p 3 , r 0 r 1
Equations (15)–(18) explain why higher rotational speeds and larger input shaft radii result in a lower flow rate: this occurs because the driving pressure remaining after overcoming the flow resistance p 3 is reduced, or may even become insufficient to overcome the resistance at low oil supply pressures, ultimately leading to flow blockage.
After the oil successfully gains access, the maximum theoretical flow rate through the radial orifices can be calculated using the formula from reference [14]:
m ˙ max = N C d C ¯ n A n 2 ρ Δ P
where N represents the number of radial orifices, C d denotes the discharge coefficient, A n indicates the cross-sectional area, and C ¯ n refers to the mean rotational coefficient, which is defined as the ratio of the experimentally determined discharge coefficient to the discharge coefficient calculated from the empirical formula.
Equation (19) can explain why enlarging the orifice diameter increases the flow rate ejected from that orifice—due to the expansion of the cross-sectional area A n . However, the magnitude of the flow rate is also influenced by both the pressure differential and rotational effects, meaning that simply increasing the orifice diameter does not invariably result in a higher flow rate.
Equations (15)–(17) is derived under idealized assumptions of inviscid flow and solid-body rotation. However, actual flow in the oil-slinging nozzle involves complex viscous and shear effects absent in the theoretical model:
(1) Viscous Effects: Wall shear stress and viscous dissipation reduce energy, making actual centrifugal pressure buildup less efficient than theoretically predicted.
(2) Non-Uniform Rotation: Incoming oil enters with near-zero tangential velocity, requiring acceleration by rotating walls. This results in velocity slip and shear that are unaccounted for in the theory.
(3) Two-Phase Flow: Air–foil interfaces and entrained air alter density distributions and centrifugal forces, deviating from single-phase assumptions.
These limitations render the analytical solution an idealized estimate. Conversely, CFD approach solves the full Navier–Stokes equations with turbulence and two-phase modeling, inherently capturing these effects and providing high-fidelity insights unattainable analytically.

4.2. Oil Supply Structure Optimization

Section 4.1 analyzed the influence of individual structural parameters on oil supply characteristics. However, parameter interactions exhibit nonlinear coupling effects, necessitating structural optimization to enhance oil delivery efficiency ( η a v e ) and friction pair oil collection flow rate ( Q c c , c p ) at high speeds. The Taguchi orthogonal method identified key parameters, followed by response surface methodology (RSM) to determine optimal combinations.

4.2.1. Taguchi Orthogonal Method

The parameters influencing the flow characteristics of the input unit are optimized as follows: A (Oil-slinging nozzle 1 diameter), B (Friction pair supply orifice diameter), C (Oil-slinging nozzle 2 diameter), D (Output shaft supply orifice diameter), E (Injection distance), and F (Input shaft radius), as illustrated in Figure 9. The flow characteristics of a free liquid jet impacting a rotating disk are distance-dependent [30,31,32]; hence, the oil injection distance E is introduced as an additional parameter. Considering structural mechanical strength requirements, the level values of the optimization parameters are specified in Table 4.
To ensure sufficient oil supply capacity of the input unit structure, the following variables were designated as optimization objectives: friction pair oil collection flow rate ( Q c c , c p ), oil delivery efficiency ( η a v e ), and input shaft interface pressure ( p ). Minimizing p is prioritized, as lower pressure indicates reduced flow resistance and facilitates dynamic pressure sealing.
Operational conditions for Taguchi orthogonal experiments were standardized at identical rotational speeds and oil pressure differentials. The design rated speed of 4800 rpm is critically important due to its minimum oil supply condition, while 85% of rated speed (4080 rpm) represents a frequently used operational point requiring focused attention. Weighted processing of results from both speeds was implemented according to operational significance, calculated as follows:
Q w e i g h t s = α Q 4800 + ( 1 α ) Q 4000
η w e i g h t s = β η 4800 + ( 1 β ) η 4000
p w e i g h t s = γ p 4800 + ( 1 γ ) p 4000
where α , β , and γ denote the weighting coefficients for the friction pair oil collection flow rate, efficiency, and pressure at 4800 rpm, respectively. The values were chosen to reflect operational criticality, with α = 0.65 (prioritizing flow at rated speed), β = 0.40 (emphasizing efficiency at a key operational point), and γ = 0.25 (constraining pressure).
Following Taguchi’s orthogonal array design principles, an L27(36) matrix (6 factors, 3 levels) was implemented. Twenty-seven sets of simulations were conducted at both 4819 rpm and 4080 rpm. Finite element analysis computed the three optimization variables, with results statistically weighted and averaged as summarized in Table 5.
To compute the mean value m of an optimization objective under Level 1 of Parameter A, Equation (23) is applied. The mean values of each optimization objective across all parameter levels are illustrated in Figure 16.
m A 1 ( Q w e i g h t s ) = 1 9 i = 1 9 Q w e i g h t s , A 1 ( i )
where Q w e i g h t s , A 1 ( i ) denotes the weighted friction pair oil collection flow rate in the i t h simulation at Level 1 of Parameter A. Figure 15 identifies the parameter combinations maximizing each objective: A (3), B (3), C (3), D (1), E (1), F (1) for Q w e i g h t ; A (1), B (3), C (2), D (1), E (1), F (2) for η w e i g h t s ; and A (1), B (1), C (1), D (2), E (2), F (3) for p w e i g h t s . Analysis of variance (ANOVA) and multiple linear regression evaluated parameter significance. Using Parameter A’s adjusted sum of squares (Adj SS), adjusted mean square (Adj MS), and F-value as examples (Equations (24)–(28)), the proportional influence of each parameter on optimization objectives was calculated, with results detailed in Table 6 and Table 7 (showing Adj SS, DF, and p-value).
Adj   S S A = i = 1 k T i 2 n i Q w e i g h t s 2 N
Adj   M S A = Adj   S S A D F A
F = Adj   M S A Adj   M S e r r o r
Adj   M S error = Total   S S Adj   S S A D F error
Total   S S = j = 1 N Q w e i g h t s , j 2 Q w e i g h t s 2 N
where k denotes the number of levels for Factor A (here k = 3 )
T i represents the sum of all Q w e i g h t s values at the i t h level of Factor A
n i indicates the occurrence count of Factor A at level i (here n i = 9 , i = 1 , 2 , 3 )
Q w e i g h t s is the grand sum of all Q w e i g h t s values
N signifies the total number of experiments (N = 27).
The degrees of freedom for Factor A ( D F A ) equal k − 1 (i.e., D F A = 2 ).
The adjusted mean square error ( Adj   M S e r r o r ) is calculated via Equation (22),
The total sum of squares (Total SS) is computed using Equation (23), where Q w e i g h t s denotes the j t h weighted flow rate value.
For Parameter E, one-way ANOVA performed on each optimization objective yielded p-values exceeding 0.05 in all three cases, indicating statistically insignificant influence on the objectives. Consequently, this parameter was excluded from the multiple linear regression model and fixed at Level 1 (0 mm), which maximizes flow rate and efficiency.
The impact proportion of each parameter is analyzed through ANOVA calculations. A larger Adjusted Sum of Squares (Adj SS) indicates that the parameter contributes more significantly to the variation in the optimization objective, implying a greater degree of influence. A p-value < 0.05 indicates that the parameter’s effect on the optimization objective is statistically significant; otherwise, there is insufficient evidence to conclude significance.
For the weighted friction pair oil collection flow rate ( Q w e i g h t ), parameters C and D have p-values greater than 0.05, indicating their influence is not significant, and the ranking of parameter influence magnitude is F > A > B > (C, D). For the weighted oil delivery efficiency ( η w e i g h t s ), the influence of parameter C is not significant, and the ranking is B > D > F > A > (C). For the weighted input shaft interface pressure ( p w e i g h t s ), the influence of parameters B and D is not significant, and the ranking is F > A > C > (B, D). It is evident that for each optimization objective, parameters F, A, and B exhibit significantly higher influence magnitudes than C and D. Therefore, parameters F, A, and B will be the focus for further optimization. Since parameter D has a relatively significant influence on the optimization target (particularly efficiency), it is fixed at Level 1 (3 mm), the value yielding the highest efficiency based on average calculation results. Simultaneously, as parameter C significantly impacts the interface pressure, it is fixed at Level 3 (2 mm), the value resulting in the lowest interface pressure.

4.2.2. Response Surface Methodology

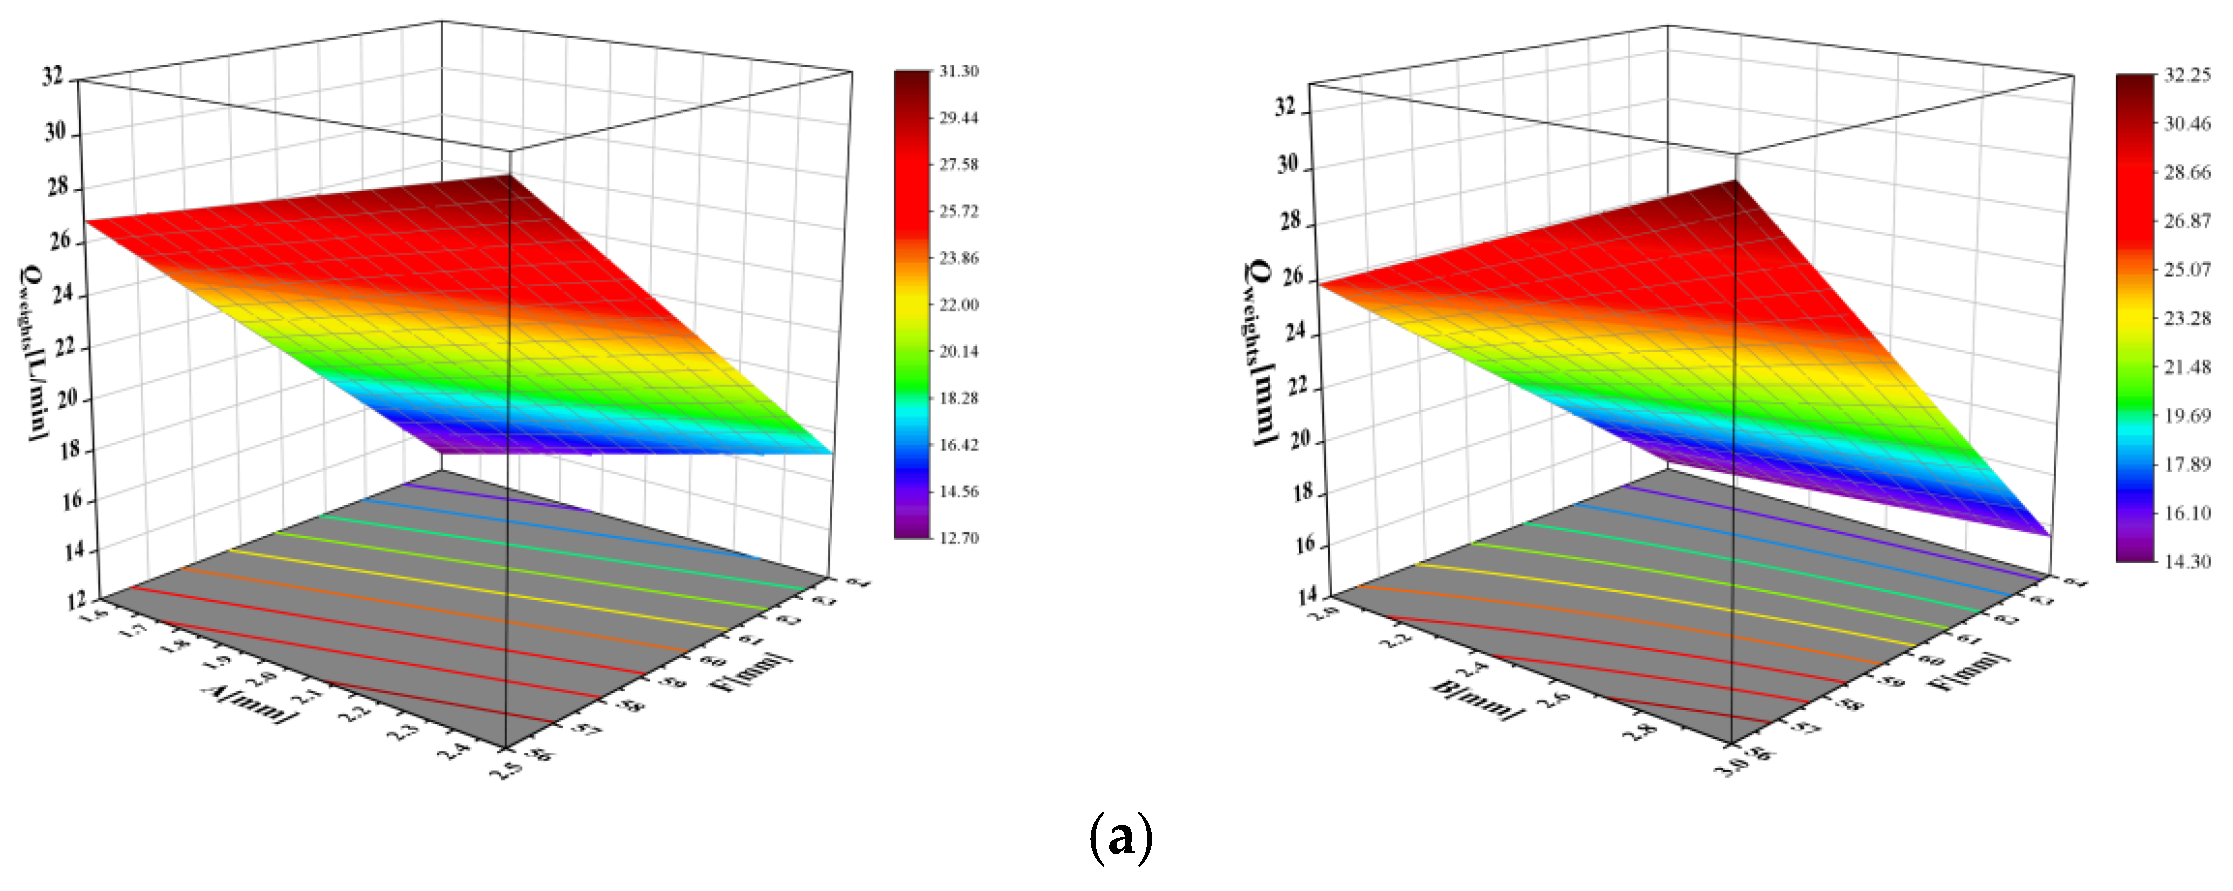
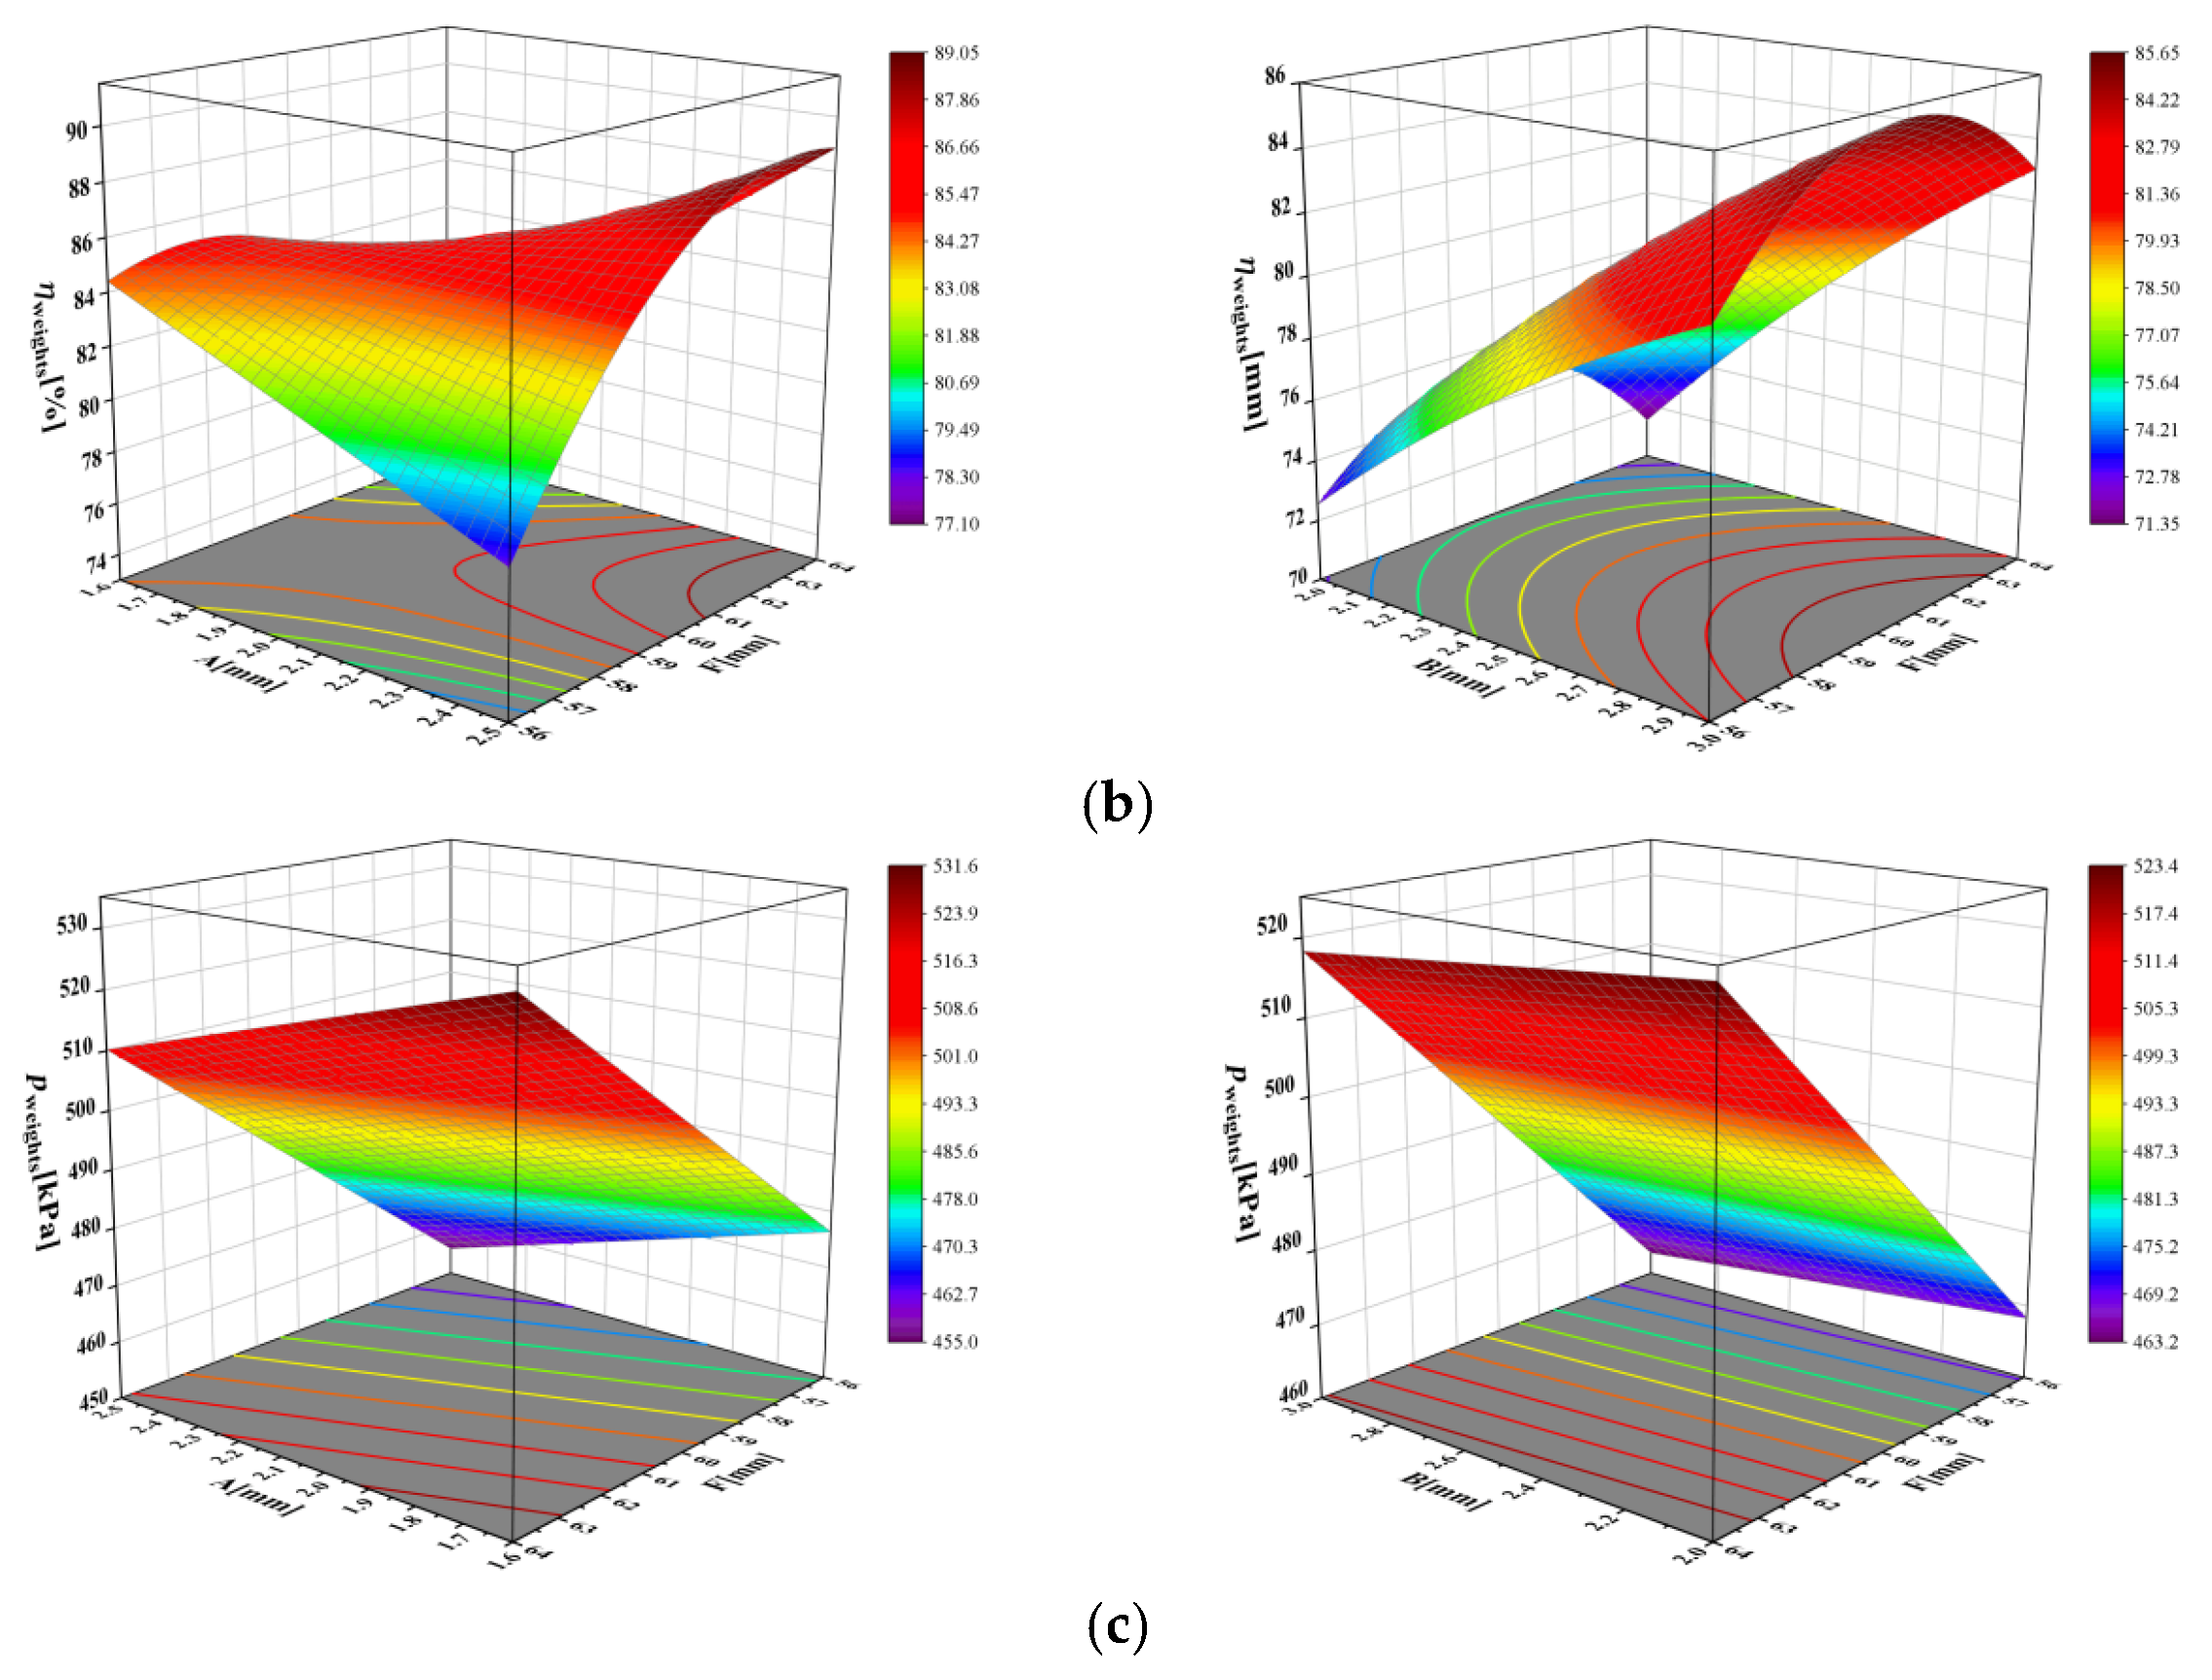
Response Surface Methodology (RSM) was employed to intuitively visualize the influence trends of the optimized parameters (F, A, B) on the objectives, enabling further refinement to obtain the optimal parameter combination. RSM primarily includes Central Composite Design (CCD) and Box–Behnken Design (BBD) methods. Considering the number of parameters and their levels, the BBD method was utilized. The level values for each optimization parameter are shown in the corresponding table. Each parameter’s three level values were coded as −1, 0, and 1 from low to high, where −1 and 1 represent the lower and higher-level values, respectively; the correspondence between codes and actual values is detailed in Table 8. Accounting for differences across rotational speeds, 17 speed values were designed for both 4000 rpm and 4800 rpm. The results for the three optimization objectives ( Q w e i g h t , η w e i g h t s , p w e i g h t s ) were obtained through weighted averaging. The response surface simulation results are presented in Figure 17.
Figure 17 indicates that orifice diameter B and shaft radius F significantly influence the oil collection flow rate, showing positive and negative correlations, respectively. Effects on efficiency are nonlinear: parabolic with F, synergistic with simultaneous increases in F and A, and positive with B. Interface pressure negatively correlates with A and positively with F. To maximize flow rate and efficiency while minimizing pressure, the optimized parameters are: F = 60 mm (balanced value), A = 2.5 mm (maximized), B = 3 mm (maximized), as specified in Table 9. This combination reflects design trade-offs among competing objectives. These optimized values translate directly into practical design guidelines: maximize critical orifice diameters (A, B) to enhance flow capacity, select an intermediate shaft radius (F) to balance centrifugal effects, and fix secondary parameters (C, D) at values that prioritize key performance metrics. This approach provides a validated framework for designing high-performance centrifugal oil supply systems.
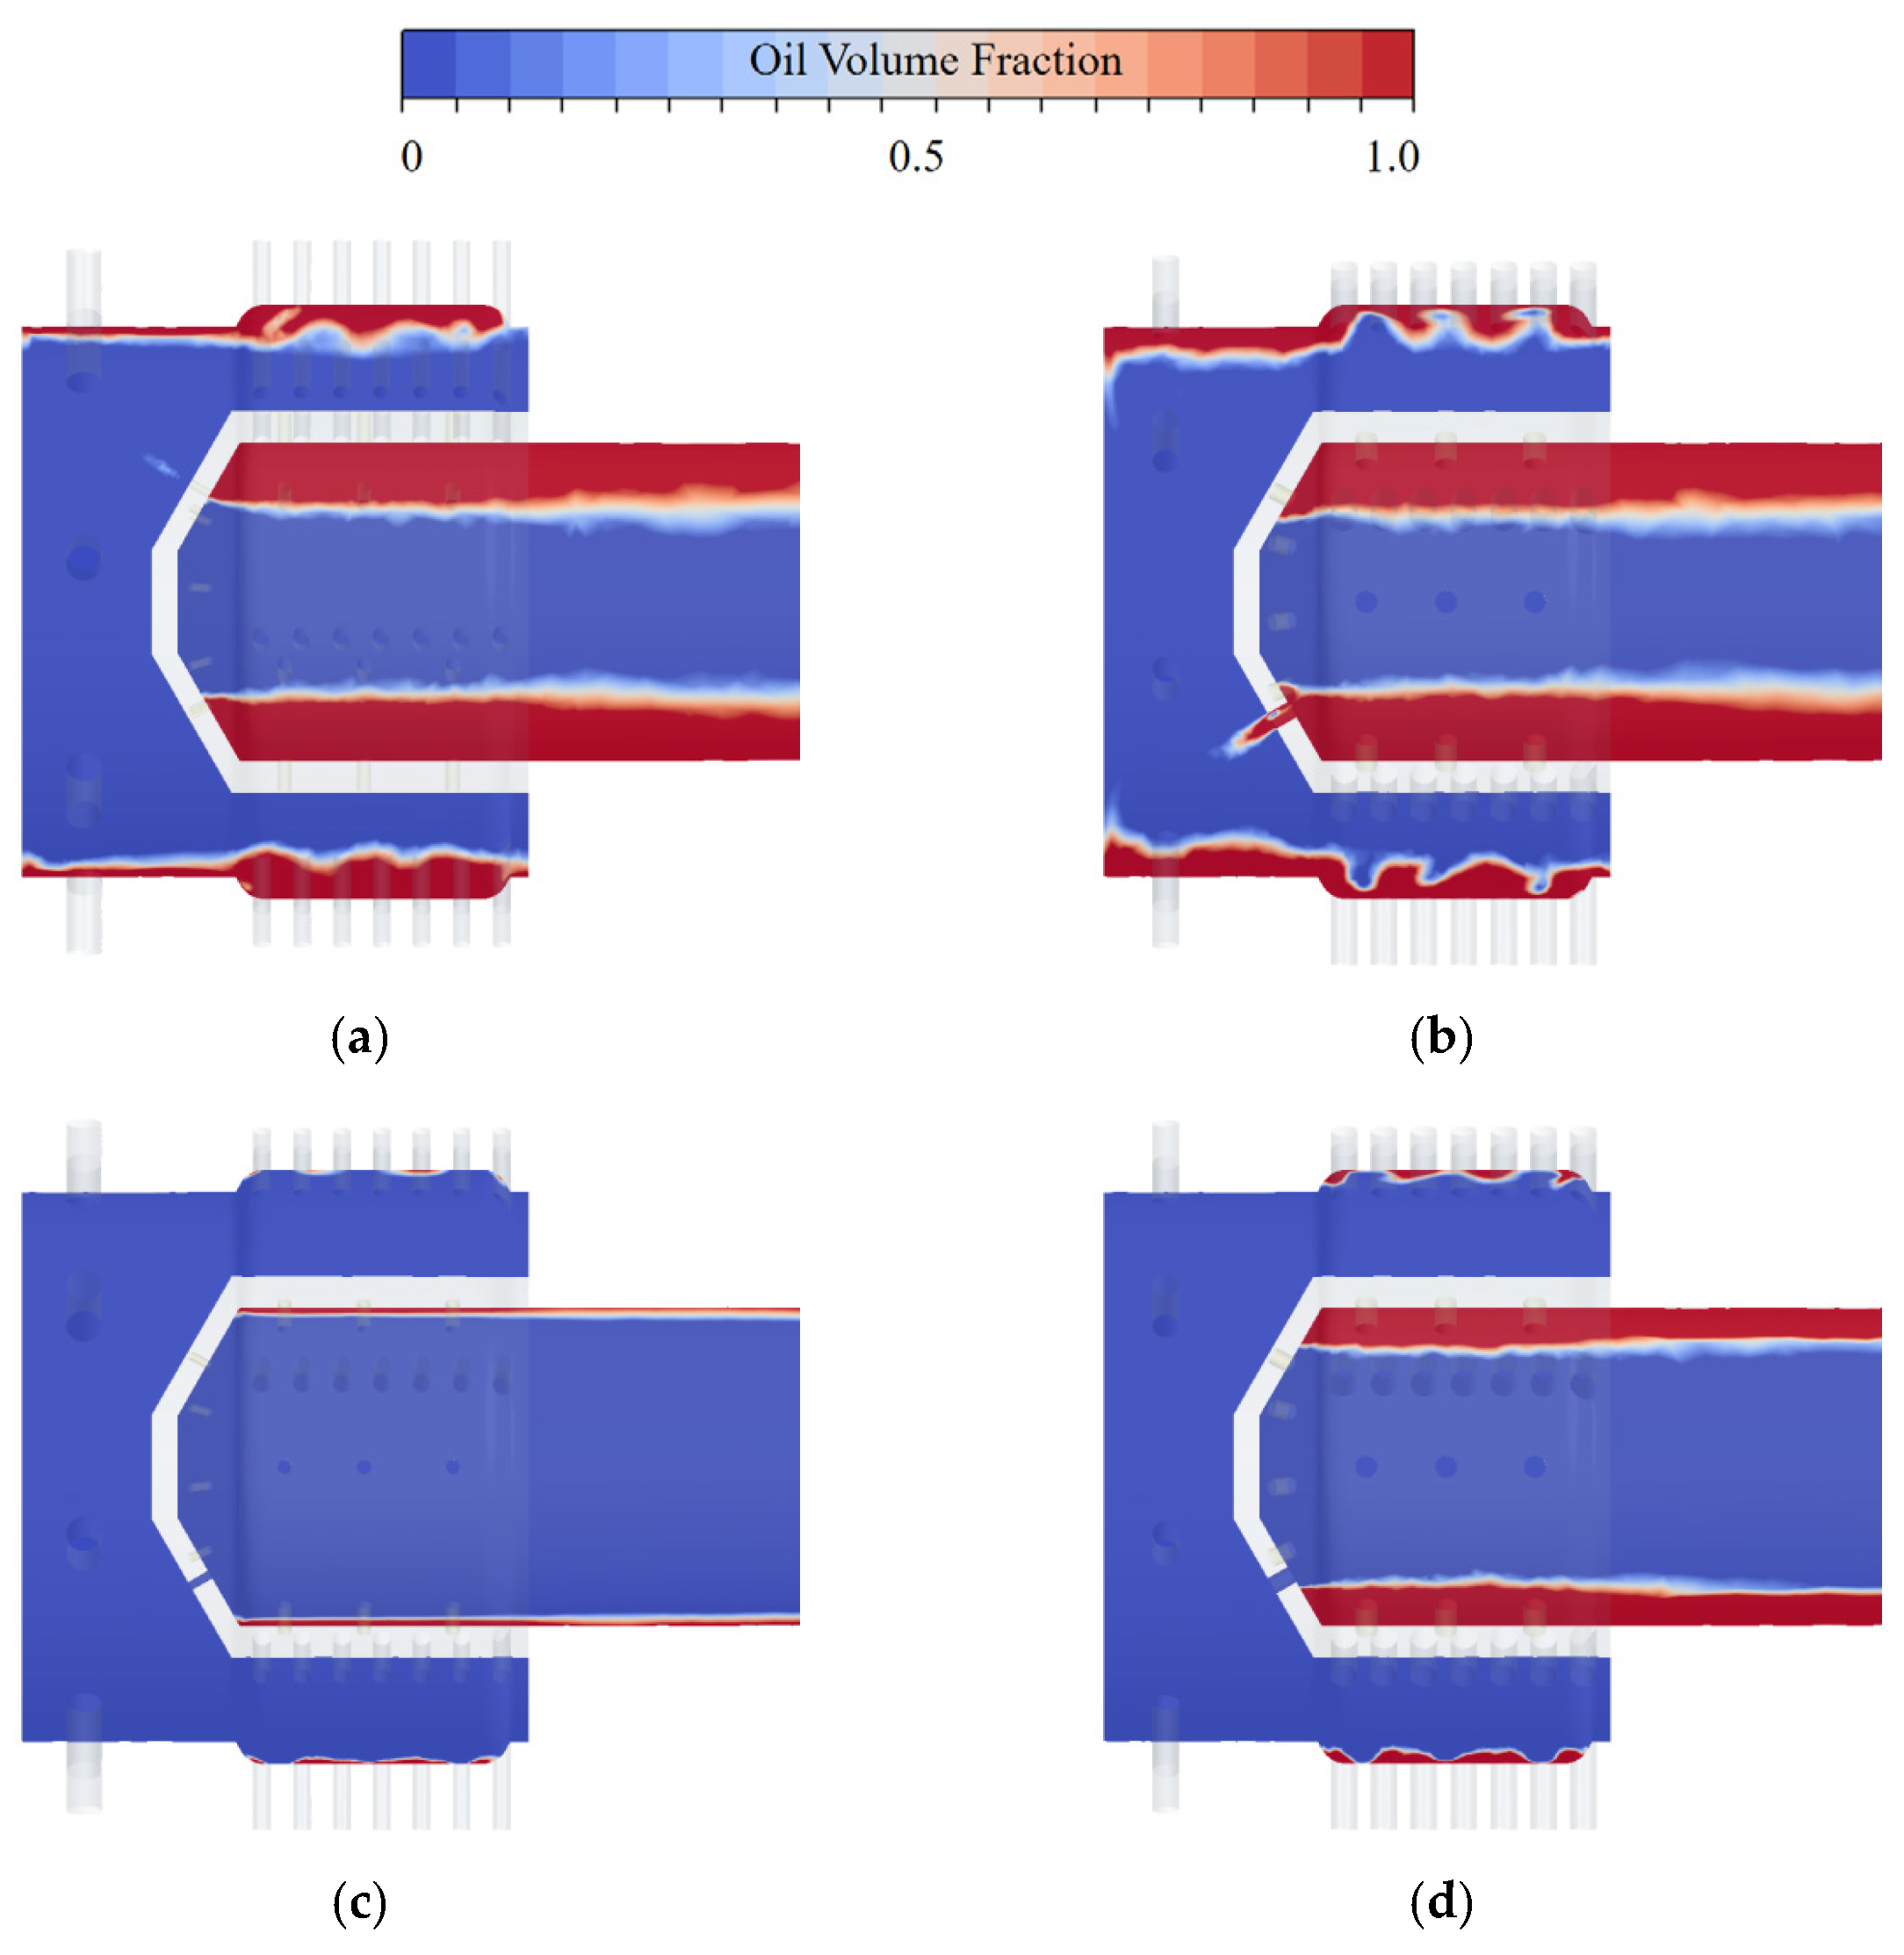
Optimized oil–air distribution is shown in Figure 18. At both critical speeds of 4800 rpm and 4080 rpm, the optimized structure significantly increases the liquid level height within the oil-slinging nozzle and enhances the oil flow capacity of the friction pair supply orifice. Concurrently, it reduces the maximum total pressure at the rotor–stator interface, thereby lowering the difficulty of maintaining dynamic pressure sealing. Specific values are detailed in Table 10.
5. Conclusions

This study proposes a novel two-stage centrifugal oil supply structure for wet clutches. Utilizing an experimentally validated gas–liquid two-phase CFD model and systematic optimization methodology, it significantly enhances oil delivery performance. The principal conclusions are:
  • Modeling Accuracy and Flow Mechanisms: The numerical model accurately predicts system flow characteristics (overall RMSE = 5.21%, R2 = 0.912). Parametric analysis demonstrates that under low oil supply pressure (0.3 MPa), increasing rotational speed from 500 to 4000 rpm reduces friction pair oil collection flow rate ( Q c c , c p ) by up to 81.3%, primarily due to centrifugal blocking effects at rotor–stator interfaces.
  • Optimization Effectiveness and Method Generalizability: The Taguchi-RSM coupled optimization yields an optimal parameter combination. Under rated speed (4800 rpm) and 85% speed (4080 rpm) conditions, this achieves a 142.8% increase in weighted oil supply flow rate, 11.1% improvement in oil delivery efficiency, and 7.5% reduction in input shaft interface pressure. This optimization framework exhibits transferability for parameter customization across systems of varying scales and operating ranges.
  • Engineering Design Guidance: Critical geometric parameters are optimized to establish design boundaries for high-performance centrifugal oil supply systems. Appropriately reducing input shaft radius lowers centrifugal resistance while maintaining structural integrity. The study further recommends increasing oil pressure during high-speed engagement to ensure lubrication adequacy, and decreasing pressure during disengagement phases to minimize drag torque.
  • Limitations and Future Research Directions: Thermally induced structural deformations remain unaddressed. Subsequent work should implement fluid-thermal-structural interaction analysis to enhance predictive accuracy. Current validation is limited to small-scale test benches; full-scale clutch assembly testing under real flight cycle conditions is essential to advance technology readiness for industrial deployment.

Author Contributions

Conceptualization, Y.D. and Y.Z.; methodology, G.Y., X.Y. and H.W.; software, Y.D. and G.Y.; validation, G.Y. and X.Y.; formal analysis, H.W. and Y.Z.; investigation, G.Y., Y.D., X.Y. and X.Z.; resources, Y.D.; data curation, G.Y., X.Y. and H.W.; writing—original draft preparation, G.Y. and Y.D.; writing—review and editing, H.W., Y.Z. and X.Z.; visualization, Y.Z.; supervision, X.Z. and Y.D.; project administration, Y.D.; funding acquisition, Y.D. All authors have read and agreed to the published version of the manuscript.

Funding

This work was supported by the Science and Technology Innovation Program of Hunan Province (Grant number 2024RC1001).

Institutional Review Board Statement

Not applicable.

Data Availability Statement

The original contributions presented in the study are included in the article; further inquiries can be directed to the corresponding author.

Conflicts of Interest

Author Hongmei Wu was employed by the company Aero Engine Corporation of China. Author Xinyuan Yang was employed by the company Aero Engine Corporation of China. The remaining authors declare that the research was conducted in the absence of any commercial or financial relationships that could be construed as a potential conflict of interest.

References

  1. Newman, J.; Forster, W.; Gatley, C.; Pinney, T.; Kinlan, J.; Saha, A. SB > 1 defiant joint multi-role technology demonstrator: The way forward for rotorcraft manufacturing. In Proceedings of the Vertical Flight Society’s 73th Annual Forum & Technology Display, Fort Worth, TX, USA, 8 May 2017. [Google Scholar]
  2. Jang, S. Manipulating Frictional Performance of Wet Clutch Engagement through Material Properties and Operating Conditions. Lubricants 2022, 10, 225. [Google Scholar] [CrossRef]
  3. Neupert, T.; Bartel, D. High-resolution 3D CFD multiphase simulation of the flow and the drag torque of wet clutch discs considering free surfaces. Tribol. Int. 2019, 129, 283–296. [Google Scholar] [CrossRef]
  4. Leister, R.; Najafi, A.; Gatti, D.; Kriegseis, J.; Frohnapfel, B. Non-dimensional characteristics of open wet clutches for advanced drag torque and aeration predictions. Tribol. Int. 2020, 152, 106442. [Google Scholar] [CrossRef]
  5. Xu, C.; Xie, F.; Guo, X.; Agarwal, R.K.; Liu, X.; He, K.; Li, Z. Theoretical and experimental study on drag torque of wet clutch considering surface tension and shrinkage of oil film. Proc. Inst. Mech. Eng. Part D J. Automob. Eng. 2024, 238, 1219–1233. [Google Scholar] [CrossRef]
  6. Zhang, L.; Zhang, Y.; Wei, C.; Yan, Y. Optimization Design of Oil Groove Shape on the Surface of Friction Plate in High-Speed Wet Clutch Aimed at Minimizing Drag Torque. J. Tribol. 2024, 146, 034601. [Google Scholar] [CrossRef]
  7. Yuan, S.; Guo, K.; Hu, J.; Peng, Z. Study on Aeration for Disengaged Wet Clutches Using a Two-Phase Flow Model. J. Fluids Eng. 2010, 132, 111304. [Google Scholar] [CrossRef]
  8. Wang, H.; Liu, X.; Kang, M.; Guo, L.; Li, X. Oil Injection Cooling Design for the IPMSM Applied in Electric Vehicles. IEEE Trans. Transp. Electrif. 2022, 8, 3427–3440. [Google Scholar] [CrossRef]
  9. Yang, C.; Cai, W.; Shao, B. Optimization of rotational oil-spray-cooling structure and temperature field analysis of PMSM in vehicle. Therm. Sci. 2025, 29, 187–198. [Google Scholar] [CrossRef]
  10. Gai, Y.; Widmer, J.D.; Steven, A.; Chong, Y.C.; Kimiabeigi, M.; Goss, J.; Popescu, M. Numerical and Experimental Calculation of CHTC in an Oil-Based Shaft Cooling System for a High-Speed High-Power PMSM. IEE Trans. Ind. Electron. 2020, 67, 4371–4380. [Google Scholar] [CrossRef]
  11. Di Lorenzo, G.; Romano, D.G.; Carozza, A.; Pagano, A. Centrifugal Pumping Force in Oil Injection-Based TMS to Cool High-Power Aircraft Electric Motors. Energies 2025, 18, 3390. [Google Scholar] [CrossRef]
  12. Zhang, Y.; McLoone, S.; Cao, W.; Qiu, F.; Gerada, C. Power loss and thermal analysis of a MW high-speed permanent magnet synchronous machine. IEEE Trans. Energy Convers. 2017, 32, 1468–1478. [Google Scholar] [CrossRef]
  13. Jiang, L.; Lyu, Y.; Liu, Z. Investigation on two-phase flow characteristics and oil capture performance of axial oil scoop in aero-engine. Case Stud. Therm. Eng. 2023, 49, 103259. [Google Scholar] [CrossRef]
  14. Jiang, L.; Liu, Z.; Lyu, Y. Internal flow and discharge coefficient characteristics of oil jet nozzles with different orifice angles under non-cavitating conditions. Aerosp. Sci. Technol. 2021, 110, 106473. [Google Scholar] [CrossRef]
  15. Prabhakar, A.; Abakr, Y.A.; Simmons, K. Effect of vortex shedding on the performance of scoop based lubrication devices. In Proceedings of the Turbo Expo: Power for Land, Sea, and Air, Charlotte, NC, USA, 26–30 June 2017; p. 07. [Google Scholar]
  16. Ardashkin, I.; Borisov, E. Investigation of the influence of the speed and direction of the oil jet on the efficiency of the oil scoop operation in the oil supply system to the bearings of the gas turbine engine. Aerosp. Eng. 2017, 4, 16–25. [Google Scholar] [CrossRef]
  17. Zhu, D.; Chen, G.; Li, Y.; Zhang, C.; Wang, L. A 3D CFD simulation of oil spray-collection and delivery process in an aeroengine inter-shaft bearing. Chin. J. Aeronaut. 2022, 35, 366–378. [Google Scholar] [CrossRef]
  18. Campana, D.M.; Carvalho, M.S. Liquid transfer from single cavities to rotating rolls. J. Fluid Mech. 2014, 747, 545–571. [Google Scholar] [CrossRef]
  19. Lin, Y.; Noir, J.; Jackson, A. Experimental study of fluid flows in a precessing cylindrical annulus. Phys. Fluids 2014, 26, 046604. [Google Scholar] [CrossRef]
  20. Nouri-Borujerdi, A.; Nakhchi, M. Prediction of local shear stress and heat transfer between internal rotating cylinder and longitudinal cavities on stationary cylinder with various shapes. Int. J. Therm. Sci. 2019, 138, 512–520. [Google Scholar] [CrossRef]
  21. Su, H.; Shi, J.; Zhou, W. Study on leakage performance and rotordynamic characteristics of a novel semi-y type labyrinth seal. Lubricants 2022, 10, 234. [Google Scholar] [CrossRef]
  22. Zhou, W.; Su, H.; Liu, H.; Zhang, Y.; Qiu, N.; Gao, B. Leakage and rotordynamic performance of a semi-Y labyrinth seal structure for centrifugal pump based on multi-frequency whirl method. J. Eng. Gas Turbines Power 2025, 147, 1–38. [Google Scholar] [CrossRef]
  23. Pointner-Gabriel, L.; Schermer, E.; Schneider, T.; Stahl, K. Experimental analysis of oil flow and drag torque generation in disengaged wet clutches. Sci. Rep. 2023, 13, 17193. [Google Scholar] [CrossRef] [PubMed]
  24. Liang, H.; Guo, D.; Ma, L.; Luo, J. Experimental investigation of centrifugal effects on lubricant replenishment in the starved regime at high speeds. Tribol. Lett. 2015, 59, 3. [Google Scholar] [CrossRef]
  25. Hirt, C.W.; Nichols, B.D. Volume of fluid (VOF) method for the dynamics of free boundaries. J. Comput. Phys. 1981, 39, 201–225. [Google Scholar] [CrossRef]
  26. Youngs, D.L. Time-dependent multi-material flow with large fluid distortion. In Numerical Methods for Fluid Dynamics; Academic Press: Cambridge, MA, USA, 1982. [Google Scholar]
  27. Yakhot, V.; Orszag, S.A. Renormalization group analysis of turbulence. I. Basic theory. J. Sci. Comput. 1986, 1, 3–51. [Google Scholar] [CrossRef]
  28. Prabhakar, A. Numerical Simulations to Assess the Performance of Scoop Based Lubrication Devices for Use in Aero-Engines. Ph.D. Thesis, University of Nottingham, Nottingham, UK, 2019. [Google Scholar]
  29. Yang, S.; Li, C.; Jiang, M.; Pei, S. A study of inlet temperature models of a large size tilting thrust bearing comparison between theory and experiment. Tribol. Int. 2019, 140, 105881. [Google Scholar] [CrossRef]
  30. Ozar, B.; Cetegen, B.; Faghri, A. Experiments on heat transfer in a thin liquid film flowing over a rotating disk. J. Heat Transf. 2004, 126, 184–192. [Google Scholar] [CrossRef]
  31. Mahdavi, M.; Sharifpur, M.; Meyer, J.P.; Chen, L. Thermal analysis of a nanofluid free jet impingement on a rotating disk using volume of fluid in combination with discrete modelling. Int. J. Therm. Sci. 2020, 158, 106532. [Google Scholar] [CrossRef]
  32. Jiang, L.; Lyu, Y.; Zhu, P.; Gao, W.; Liu, Z. Numerical investigation of conjugate heat transfer on a rotating disk under round liquid jet impingement. Int. J. Therm. Sci. 2021, 170, 107097. [Google Scholar] [CrossRef]
Figure 1. Wet clutch lubrication method: (a) Centrifugal oil supply; (b) Two-stage centrifugal oil supply.
Lubricants 13 00415 g001
Figure 2. Schematic diagram of the mechanical part of the test bench.
Lubricants 13 00415 g002
Figure 3. Two-stage centrifugal oil separation structure parameters and oil distribution diagram.
Lubricants 13 00415 g003
Figure 4. Computational domain and mesh: (a) Verification of grid independence; (b) Computational domain; (c) Computational mesh.
Lubricants 13 00415 g004
Figure 6. Influence of rotational speed on flow rates and efficiency under different oil supply pressures: (a) 0.3 MPa; (b) 0.45 MPa; (c) 0.6 MPa.
Lubricants 13 00415 g006aLubricants 13 00415 g006b
Figure 7. Oil–air volume fraction distribution on the midplane cross-section: (a) 0.3 MPa, 3000 rpm; (b) 0.3 MPa, 4000 rpm; (c) 0.3 MPa, 4800 rpm; (d) 0.45 MPa, 3000 rpm; (e) 0.45 MPa, 4000 rpm; (f) 0.45 MPa, 4800 rpm; (g) 0.6 MPa, 3000 rpm; (h) 0.6 MPa, 4000 rpm; (i) 0.6 MPa, 4800 rpm.
Lubricants 13 00415 g007
Figure 8. Influence of pressure on oil collection flow rate and efficiency: (a)friction pair collection flow rate; (b) oil delivery efficiency.
Lubricants 13 00415 g008
Figure 9. Schematic of optimization parameters.
Lubricants 13 00415 g009
Figure 10. Influence of Orifice A diameter on oil collection flow rate and efficiency: (a) friction pair collection flow rate; (b) orifice A discharge flow rate; (c) oil delivery efficiency.
Lubricants 13 00415 g010
Figure 11. Influence of Orifice B diameter on oil collection flow rate and efficiency: (a) friction pair collection flow rate; (b) oil delivery efficiency.
Lubricants 13 00415 g011
Figure 12. Influence of Orifice C diameter on oil collection flow rate and efficiency: (a) friction pair collection flow rate; (b) orifice C discharge flow rate; (c) oil delivery efficiency.
Lubricants 13 00415 g012
Figure 13. Oil–air distribution under varying Orifice C diameters at 4500 rpm: (a) d = 1 mm; (b) d = 1.5 mm; (c) d = 2.5 mm.
Lubricants 13 00415 g013
Figure 14. Influence of Orifice D diameter on oil collection flow rate and efficiency: (a) friction pair collection flow rate; (b) oil delivery efficiency.
Lubricants 13 00415 g014
Figure 15. Influence of input shaft radius (F) on oil collection flow rate and efficiency: (a) friction pair collection flow rate; (b) oil delivery efficiency.
Lubricants 13 00415 g015
Figure 16. Mean values of optimization objectives at each factor level: (a) weighted friction pair oil collection flow rate; (b) weighted oil delivery efficiency; (c) weighted interface pressure.(Factors A--D represent the diameters of orifices A--D defined in, respectively. The abscissa values 1, 2, and 3 correspond to Level 1, Level 2, and Level 3 of each factor, as specified in Table 4.)
Lubricants 13 00415 g016
Figure 17. Response surface results: (a) Q w e i g h t ; (b) η w e i g h t s ; (c) p w e i g h t s .
Lubricants 13 00415 g017aLubricants 13 00415 g017b
Figure 18. Oil–air distribution after optimization: (a) 4080 rpm, initial model; (b) 4080 rpm, optimization model; (c) 4800 rpm, initial model; (d) 4800 rpm, optimization model.
Lubricants 13 00415 g018
Table 1. Key geometric parameters of the two-stage centrifugal oil supply structure.
ParametersValue Range [mm]Description
D a 1.6–2.5diameter of radial orifices
D b 1–2.5diameter of axial orifices
D c p 1.5–2.5diameter of friction pair supply orifice
D o s 3–5diameter of output shaft supply orifice
D 3 112–128diameter of input shaft
Table 2. Functional expressions for the rheological properties of oil.
ParametersUnitExpression
ρ o i l kg·m−3 0.043 τ o i l + 973.09
γ o i l mm2·s−1 163.34 e τ o i l 10.74 + 163.35 e τ o i l 13.13 + 5.04
c o i l kJ·kg−1·K−1 1.83 10 3 τ o i l + 1.91923
λ o i l W·m−1·K−1 5.962 10 5 τ o i l + 0.14085
Table 3. Comparison of experimental and numerical simulation results.
Shaft Speed [r/min] Experiment   [ % ]   ( Mean   ± SD)Simulation [%]Relative Error [%]
500 47.82   ±   1.07 51.617.93 
1000 50.34   ±   0.96 54.708.66 
1500 57.69   ±   0.96 63.6410.31 
2000 57.54   ±   1.52 61.056.10 
2500 51.15   ±   0.92 55.147.80 
3000 57.35   ±   0.97 61.767.69 
3500 74.14   ±   1.21 70.544.86 
4000 73.94   ±   0.98 69.416.13 
4500 83.71   ±   1.27 79.375.18 
4800 94.77   ±   1.42 99.034.50 
Table 4. Level values of optimization parameters.
ParametersLevel 1Level 2Level 3
A [mm]1.62.02.5
B [mm]2.02.53.0
C [mm]1.01.52.0
D [mm]3.04.05.0
E [mm]0510
F [mm]566064
Table 5. Taguchi Orthogonal Array (L27(36)).
NumberOptimization ParametersSimulation Results
 ABCDEF Q w e i g h t s [L/min] η w e i g h t s [%] p w e i g h t s [kPa]
111111119.99976.6502.833
211122214.85175.5527.080
311133310.26475.4565.657
412211217.76188.6521.987
512222312.26287.6557.187
612233122.16273.3489.925
713311314.30185.2533.609
813322127.50582.4477.975
913333220.09187.3505.513
1021211125.68776.6473.358
1121222218.94477.6501.405
1221233313.40672.5525.464
1322311220.35884.7502.709
1422322313.13280.9450.000
1522333125.19671.5468.770
1623111314.70783.4541.130
1723122126.13080.4479.601
1823133219.84182.5503.418
1931311129.02673.5461.029
2031322220.02270.5485.633
2131333312.96067.1515.671
2232111224.19685.6491.109
2332122314.14779.9522.856
2432133124.60862.9465.004
2533211316.01582.8517.101
2633222130.81276.2461.248
2733233223.17779.8484.337
Table 6. ANOVA results for Factor E.
  Q w e i g h t s η w e i g h t s p w e i g h t s
 Adj SSAdj MSp-valueAdj SSAdj MSp-valueAdj SSAdj MSp-value
E6.0093.0050.918235.547117.7740.054401.603200.8010.812
Table 7. ANOVA results.
  Q w e i g h t s η w e i g h t s p w e i g h t s
 Adj SSp-valueAdj SSp-valueAdj SSp-value
A71.0790.000161.4610.0044983.9800.002
B43.6570.002321.3030.0004433.2110.432
C12.1930.09611.3430.5732250.0080.028
D6.0090.290235.5470.001401.6030.466
F672.0830.000202.1830.00111,223.3530.000
Error35.872-157.159-4012.083-
Total840.893-1088.996-23,314.238-
Table 8. Level Values for Response Surface Methodology Parameters.
ParametersLevels
 −101
A [mm]1.62.052.5
B [mm]22.53
C [mm]566064
Table 9. Optimized parameter combination.
A [mm]B [mm]C [mm]D [mm]E [mm]F [mm]
Optimization
Values
2.5323060
Table 10. Variation in flow rate, efficiency, and interface pressure before and after optimization.
ParameterInitial ValueOptimized Value
Q w e i g h t 10.736 [L/min]26.064 [L/min]
η w e i g h t s 80.2 [%]89.1 [%]
p w e i g h t s 486.5 [kPa]450.2 [kPa]
Disclaimer/Publisher’s Note: The statements, opinions and data contained in all publications are solely those of the individual author(s) and contributor(s) and not of MDPI and/or the editor(s). MDPI and/or the editor(s) disclaim responsibility for any injury to people or property resulting from any ideas, methods, instructions or products referred to in the content.