Article

The Mechanism of a High Fluid Pressure Differential on the Sealing Performance of Rotary Lip Seals

1
State Key Laboratory of Solid Lubrication, Lanzhou Institute of Chemical Physics, Chinese Academy of Sciences, Lanzhou 730000, China
2
Scientific Data Center, Lanzhou Institute of Chemical Physics, Chinese Academy of Sciences, Lanzhou 730000, China
3
China Energy Materials Company Limited Inner Mongolia Company, Hohhot 010000, China
4
School of Mechano Electronic Engineering, Xidian University, Xi’an 710071, China
5
Center of Materials Science and Optoelectronics Engineering, University of Chinese Academy of Sciences, Beijing 100049, China
*
Authors to whom correspondence should be addressed.
Lubricants 2025, 13(9), 413; https://doi.org/10.3390/lubricants13090413
Submission received: 16 July 2025 / Revised: 2 September 2025 / Accepted: 9 September 2025 / Published: 15 September 2025

Abstract

Rotary lip seals serve as critical sealing components in industrial equipment, traditionally relying on the reverse pumping theory for their sealing mechanism. However, increasing operational demands characterized by high fluid pressure differentials, elevated speeds, and multi-physics coupling environments have revealed limitations in the applicability of the classical theory. This study aims to develop a comprehensive model to quantitatively characterize rotary lip seal performance, specifically frictional torque and reverse pumping rate, and to elucidate underlying mechanisms beyond classical theory. We developed a Mixed Thermo-Hydrodynamic Lubrication (MTHL) model that explicitly integrates fluid–solid–thermal coupling effects to simulate seal behavior under complex operating parameters. The simulations reveal that reverse pumping rate increases near-linearly with rotational speed from −8.54 mm3/s (0 m/s) to 122.82 mm3/s (3 m/s) and 220.27 mm3/s (6 m/s), validating classical theory, while under elevated fluid pressure differentials, a distinct non-monotonic trend emerges: rates evolve from 122.82 mm3/s (0.10 MPa) to 172.93 mm3/s (0.12 MPa), then decline to 52.67 mm3/s (0.18 MPa), and recover to 69.87 mm3/s (0.22 MPa), a phenomenon that cannot be explained by classical sealing mechanisms. Mechanistic analysis indicates that this anomaly stems from a competitive interaction between pressure-driven and shear-driven flow. This discovery not only enhances the reverse pumping theoretical system but also provides a theoretical foundation for optimizing sealing performance under diverse operational conditions.

1. Introduction

Rotary lip seals possess functions such as reducing friction, blocking external contaminants, and minimizing lubricant leakage. Although these functions have led to their widespread application in various industrial fields, including automotives, mining machinery equipment, aerospace engineering, and marine renewable energy equipment [1], these functions may face severe challenges under harsh operating conditions. For example, rotary lip seals are exposed to erosion from various media, such as clay, sand, rock, muddy water, and silt. Meanwhile, a high fluid pressure differential can significantly increase the radial force at the sealing lip, leading to thinning or even rupture of the lubrication film, thereby increasing the risk of leakage. Furthermore, under the action of a high fluid pressure differential, multiple media may intrude through micro-gaps at the sealing interface, causing accelerated wear of the sealing lip, degraded lubrication performance, and ultimately leading to seal failure. The main drive seal of a shield tunneling machine (Figure 1) is a typical rotary lip seal, and its operating environment exemplifies the harsh conditions of multiple media effects and a high fluid pressure differential. Once external impurities invade the main bearing and cause the main drive seal to fail, this will not only severely reduce the tunneling efficiency of the shield machine but may also impact the project schedule, resulting in substantial economic losses. Since traditional seal performance evaluation methods struggle to accurately reflect seal behavior under harsh conditions, the development of high-precision prediction models is crucial for ensuring seal reliability and stable equipment operation.
Investigations into rotary lip seals have been conducted for many years. As early as 1957, Jagger [2] used friction measurement techniques to detect the formation of a lubricating layer in the sealing region. Using a conductive rubber compound and capacitance measurement, he estimated the layer thickness to be approximately 2.5 μm. Subsequently, Hirano et al. [3] verified this phenomenon through a series of sealing experiments. However, our understanding of rotary lip seal behavior remains incomplete. In 1969, Kuzma [4] pioneered the hypothesis that surface asperities and their deformation are critical in the sealing process of rotary lip seals. According to this hypothesis, the viscous pumping effect arising from asperity deformation could induce reverse fluid flow from the air towards the liquid side. Following this, Kawahara et al. [5,6] combined hollow glass shafts with optical techniques to confirm a direct link between the performance characteristics of the lip seals and the distribution of asperities on their surface. Between 1984 and 1986, Qian [7] and KM et al. [8] provided further insights into the mechanism of reverse pumping. They noted that the pumping effect improves as peak shear deformation shifts nearer to the interface with the liquid. Afterwards, Sponagel [9] and Stakenborg [10] constructed an analytical model for circular asperities and micro-undulations, respectively, with their predicted shear deformation aligning closely with experimental results.
However, rotary lip seals involve intercoupled interactions among multiple physical fields, including fluid mechanics, solid mechanics, contact mechanics, deformation analysis, and thermodynamic analysis. It is difficult to describe this coupling mechanism using an analytical model. With the advancement of computer technology, in 1992, Salant [11] established the first numerical lubrication model considering micro-undulations. Subsequently, Salant and Flaherty [12] further incorporated the elastic deformation of the lip seals to develop a numerical elastohydrodynamic lubrication model with micro-undulations. Building upon this foundation, they [13] also established an EHL model for circular or elliptical asperities and found that, compared to micro-undulations, circular or elliptical asperities exhibited lower reverse pumping rates. In 2006, Salant Hajjam [14] considered the impact of temperature and established a thermal elastohydrodynamic lubrication model. Given the complexity and computational intensity of deterministic models, Guo [15] introduced an advanced elastohydrodynamic lubrication model that integrates asperity contact and extends Patir’s statistical models [16,17,18], significantly enhancing computational efficiency. Subsequently, Liu [19] and Yan [20] also considered the influence of temperature on lubricant viscosity and established a mixed thermal–elastohydrodynamic lubrication model. Considering that temperature increases at extremely high speeds can also affect the properties of sealing materials, thereby altering contact pressure distribution, radial forces, and friction, Chen et al. [21] proposed an improved mixed lubrication model. Additionally, Uddin and Zhang [22,23,24] revealed the functional differentiation of shaft surface texture shapes (square textures enhanced oil film thickness, triangular textures improved back-pumping rate), while their subsequent study innovatively relocated the textures to the sealing lip surface [25]. Guo [26], Liu [19], and Huang et al. [27], among others, investigated the effects of wear on the sealing capabilities of lip seals.
Most numerical lubrication models rely on the reverse pumping mechanism [7,8] to explain their sealing principle. Specifically, the reverse pumping effect intensifies as the point of peak shear deformation in the lip seal draws nearer to the lubricant interface. However, under high-fluid-pressure-differential conditions, the sealing lip extends its contact length significantly, leading to a substantial rise in radial force. In such scenarios, the reverse pumping mechanism is insufficient to fully describe the sealing principle. Research by Chen et al. [21,28] has also demonstrated that the reverse pumping mechanism fails under high-fluid-pressure-differential conditions. Here, hydrodynamic analysis employs the statistically averaged Reynolds equation to characterize the oil film’s flow behavior, while deformation analysis utilizes the elastic half-space method to solve for normal and tangential deformations at the sealing interface. Meanwhile, we consider the coupling effects among multiple physical fields, including solid mechanics, contact mechanics, and thermodynamic analysis. Building on these foundations, we develop a numerical simulation model for MTHL. This model facilitates an in-depth investigation into the operational characteristics of rotary lip seals during service conditions, with a particular emphasis on the impact of a high fluid pressure differential on sealing performance. The results reveal the competitive interaction between pressure-driven flow and shear-driven flow, thereby supplementing the classical reverse pumping mechanism.

2. Modeling of MTHL

Figure 2a,c illustrate the structural schematic of the rotary lip seal used in the main drive of a shield tunneling machine, along with its sealing contact zone. The seal primarily comprises a single-lip design and a rotating shaft, where x represents the circumferential orientation and y signifies the axial direction. As depicted in Figure 2b, the rotary lip seal initially experiences interference fitting during operation. It is subsequently pressed against the lubricant and mud sand sides to replicate complex service conditions. To enable finite element simulation and numerical analysis, several simplifications and assumptions are introduced, as follows:
(1)
The lubricant is modeled as an incompressible Newtonian fluid, exhibiting laminar flow characteristics in the sealing region.
(2)
The rotary lip seal functions consistently at a uniform velocity.
(3)
The thickness of the lubricant film has no influence on the overall deformation of the single-lip seal.
(4)
The rotary shaft is entirely smooth, and the single-lip seal’s surface asperity exhibits a Gaussian distribution along the axial direction, with a periodic arrangement in the circumferential orientation.
(5)
The effects of viscoelasticity on the single-lip seal, fluid inertia, gravity, and the lubricant film’s curvature are ignored.
(6)
Considering the axial symmetry of both the geometry and loads, the rotary lip seal is modeled as a two-dimensional (2D) axisymmetric finite element system.

2.1. Service Conditions

Table 1 presents an overview of the service conditions, material characteristics, and design parameters associated with the main drive seal utilized in shield tunneling equipment.

2.2. Process of MTHL Model

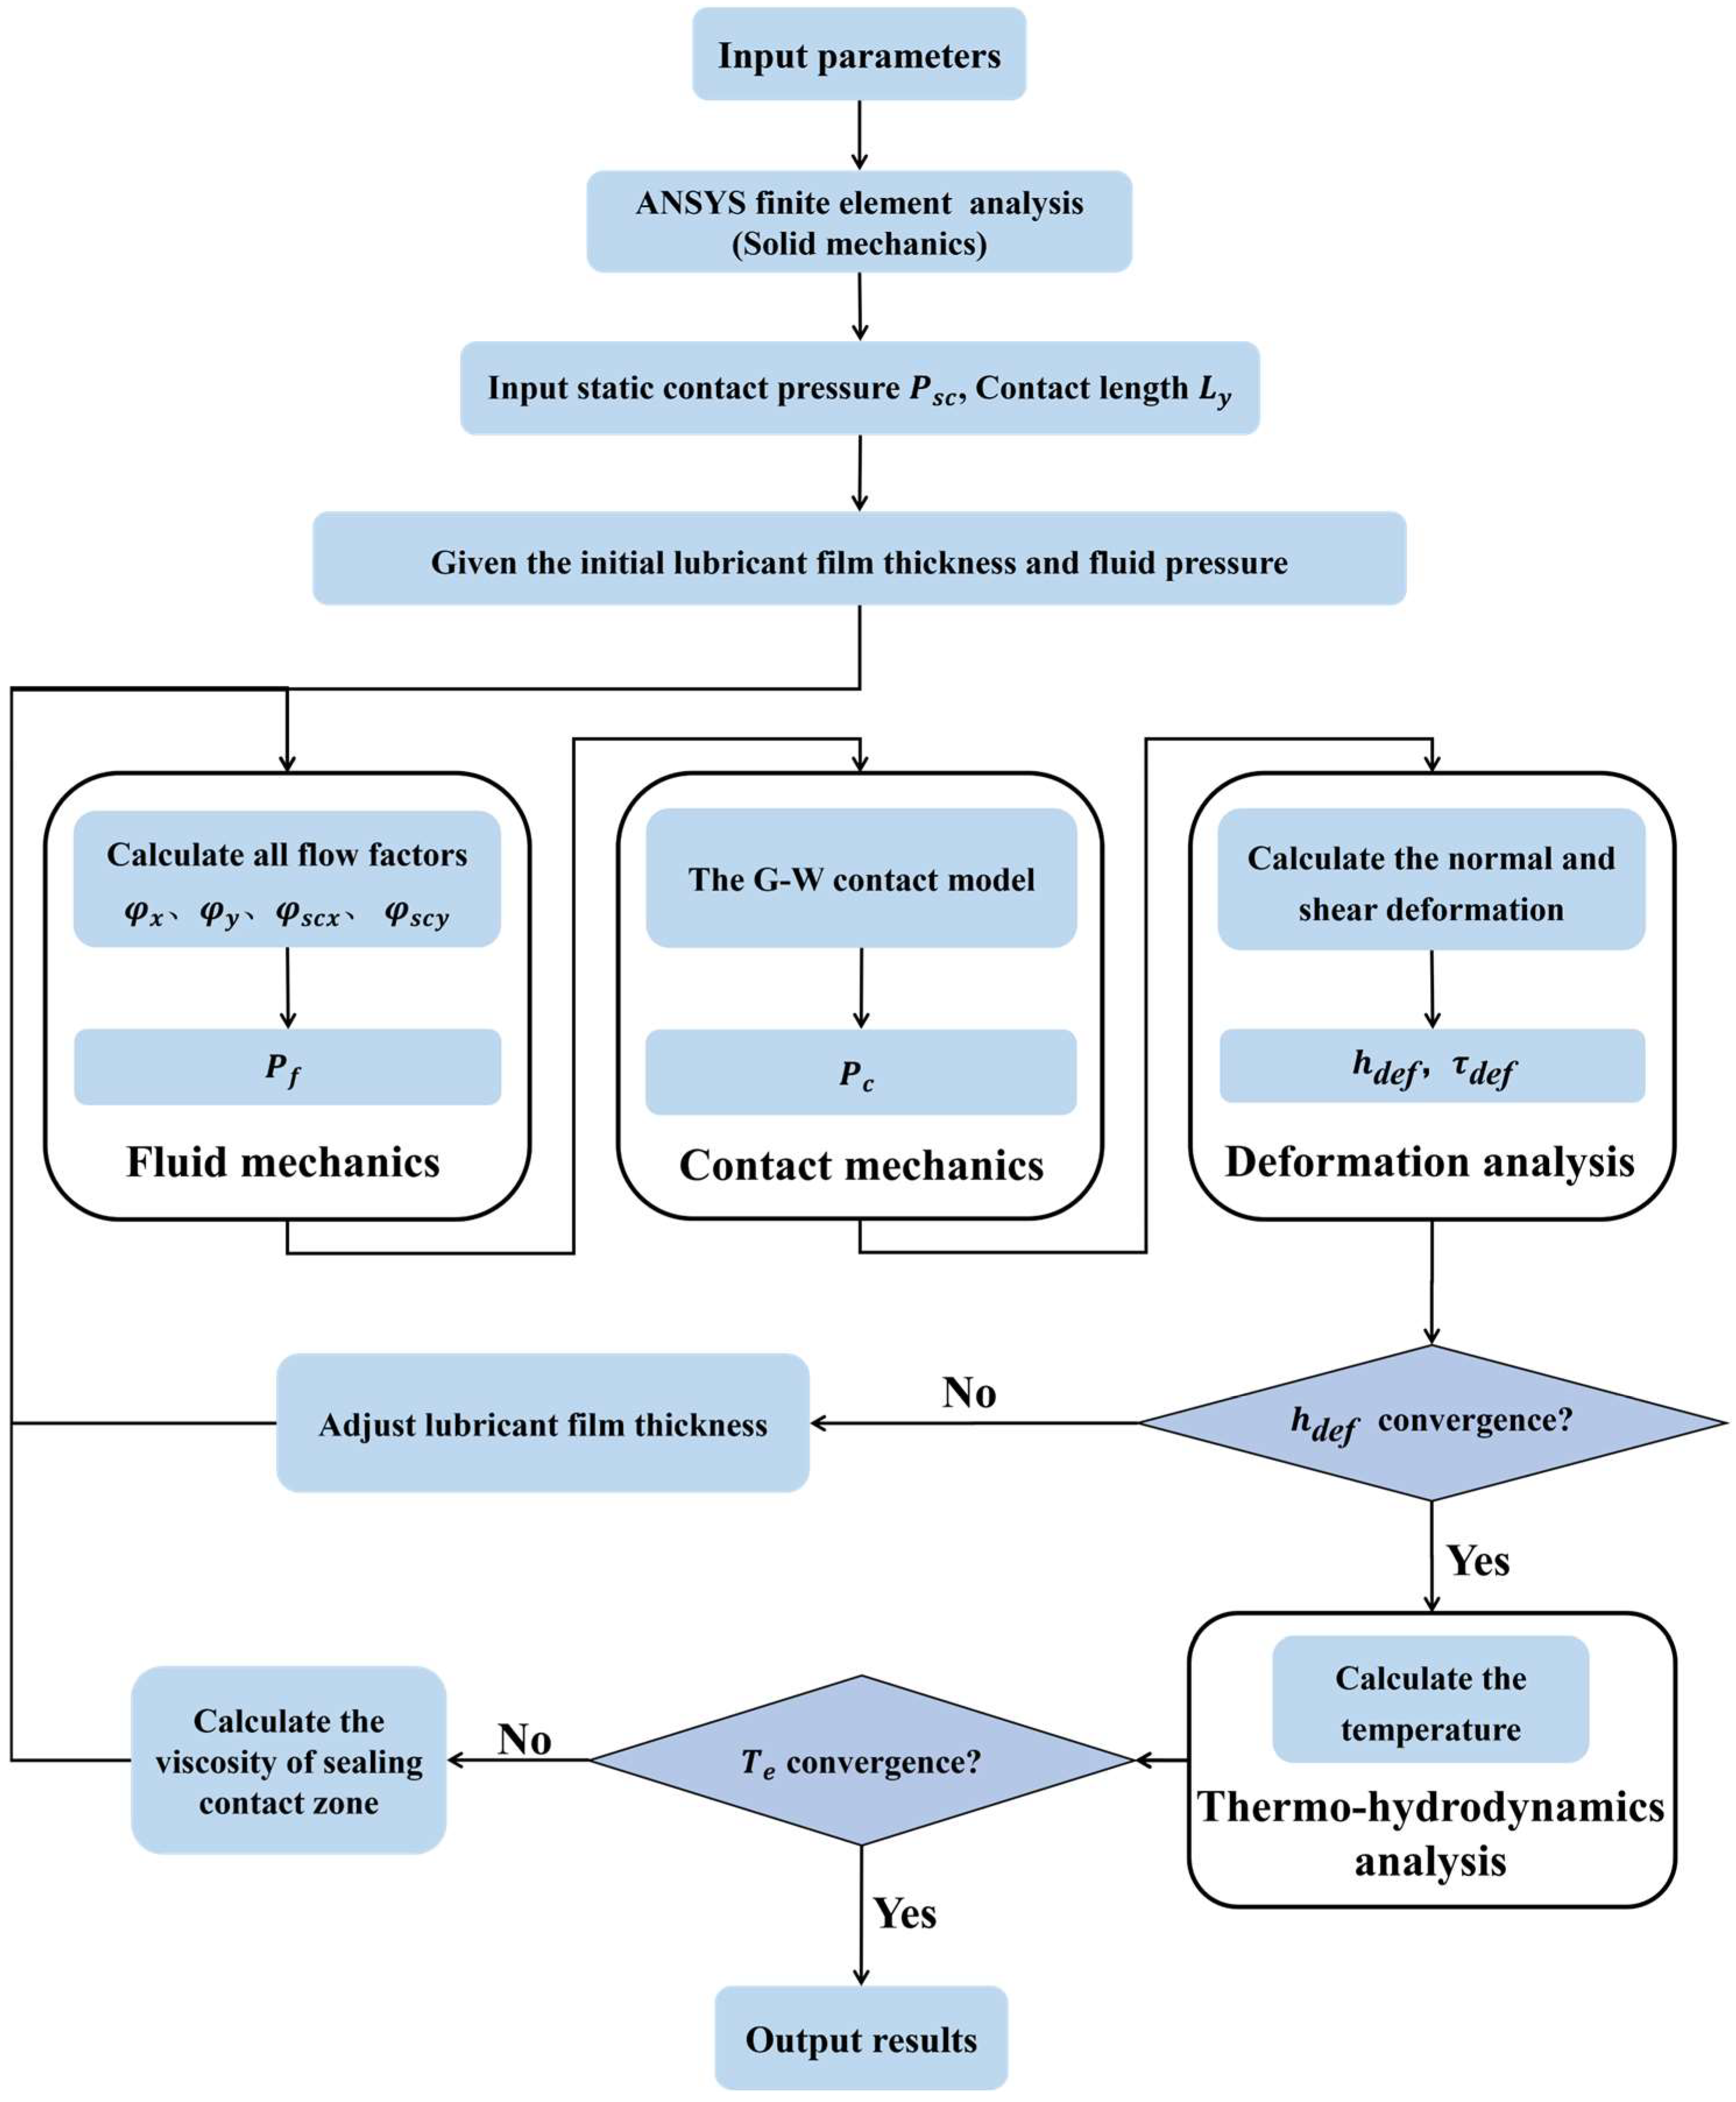
The MTHL model couples interactions among multiple physical domains, including solid mechanics, fluid mechanics, contact mechanics, and thermodynamics. In a rotary lip seal under stable operating conditions, three key forces govern the system’s seal behavior: static contact pressure ( P s c ) generated by macro-deformation, lubricant film pressure ( P f ), and asperity contact pressure ( P c ), arising from micro-scale asperity deformation. The application of these forces results in the seal lip undergoing normal deformation, altering the thickness of the lubricant film ( h ) and consequently affecting both P f and P c . Additionally, the friction induced by viscous fluid shear and asperity interactions elevates temperatures in the contact zone. This thermal effect alters the lubricant’s viscosity, thus affecting sealing performance. When these three forces reach equilibrium, the fluid–solid–thermal coupling process is completed. The calculation procedure is depicted in Figure 3.
(1)
The operational data is input and ANSYS 2022 is utilized to determine the contact length and static contact pressure, P s c .
(2)
The initial lubricant film and fluid pressures are set; then the hydrodynamic fluid pressure P f and asperity contact pressure P c are determined through calculations in fluid mechanics analysis and contact mechanics analysis, respectively.
(3)
The normal deformation magnitude ( h d e f ) is determined via deformation analysis, and the lubricant film thickness is iteratively adjusted until the convergence criterion of 0.01 mm for h d e f is satisfied.
(4)
Through calculations involving viscous friction and asperity contact friction, the temperature within the sealing zone is ascertained, and subsequently, the lubricant viscosity corresponding to this temperature is derived. This process is repeated iteratively until the temperature error ( T e ) fulfills the convergence criteria (1 °C), signifying the end of the computational process.
(5)
The essential sealing performance metrics are presented: the torque due to friction and the rate of reverse pumping.

2.3. Solid Mechanics

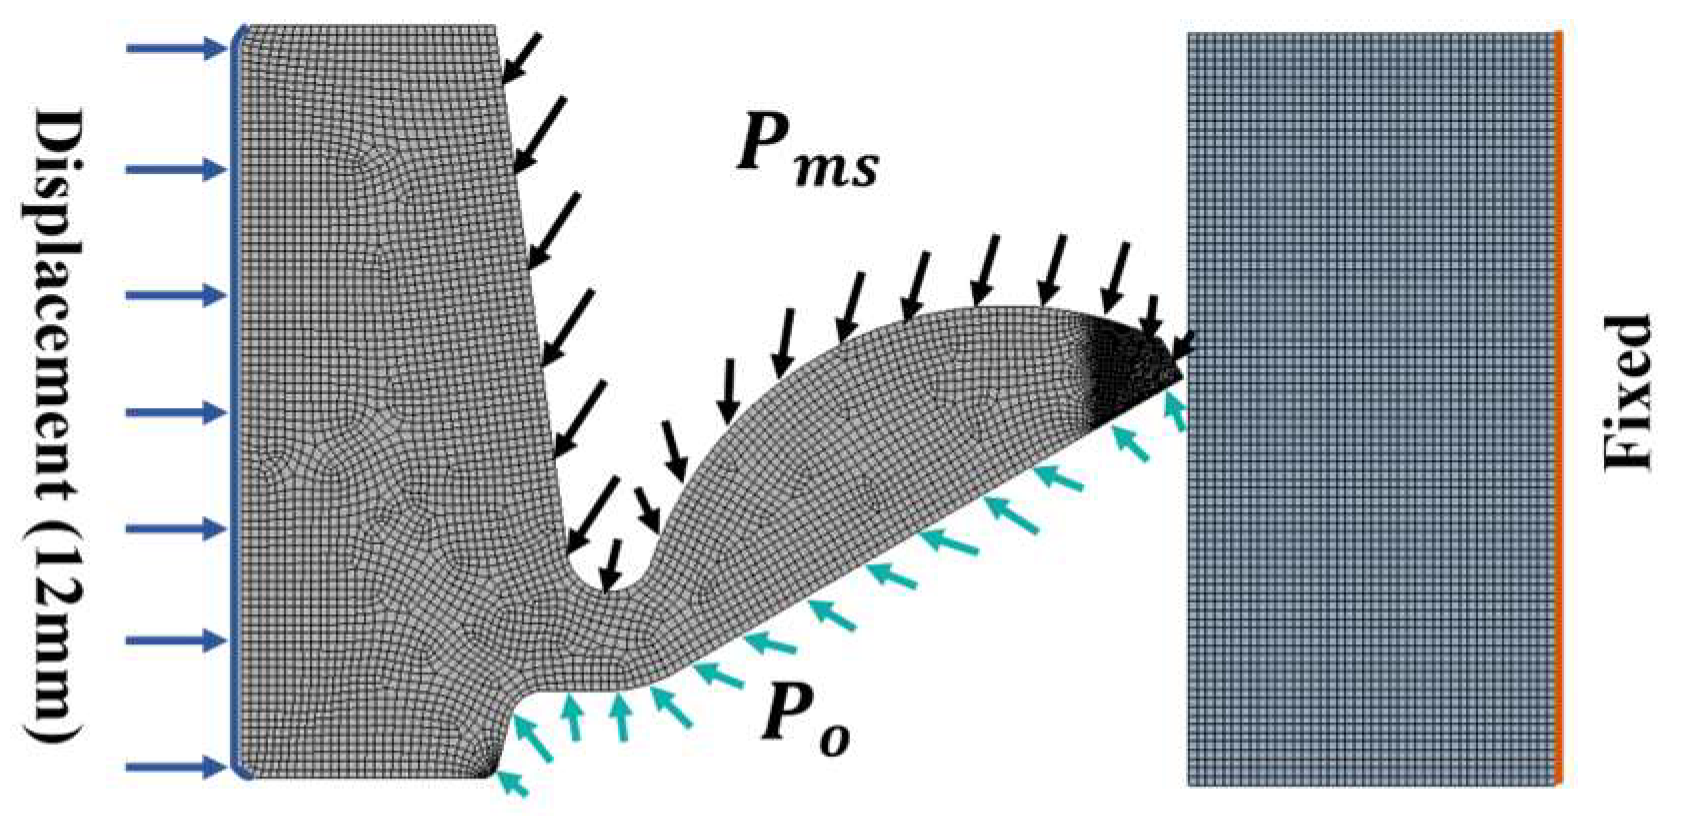
As shown in Figure 4, a 2D axisymmetric finite element model was developed using ANSYS 2022 software. The rotary lip seal assembly was loaded with an interference fit. Pressure was applied to both the lubricant and mud sand sides. A multi-region meshing method was employed to balance computational efficiency and accuracy. Through finite element analysis, the static contact pressure P s c and contact length L y were determined.
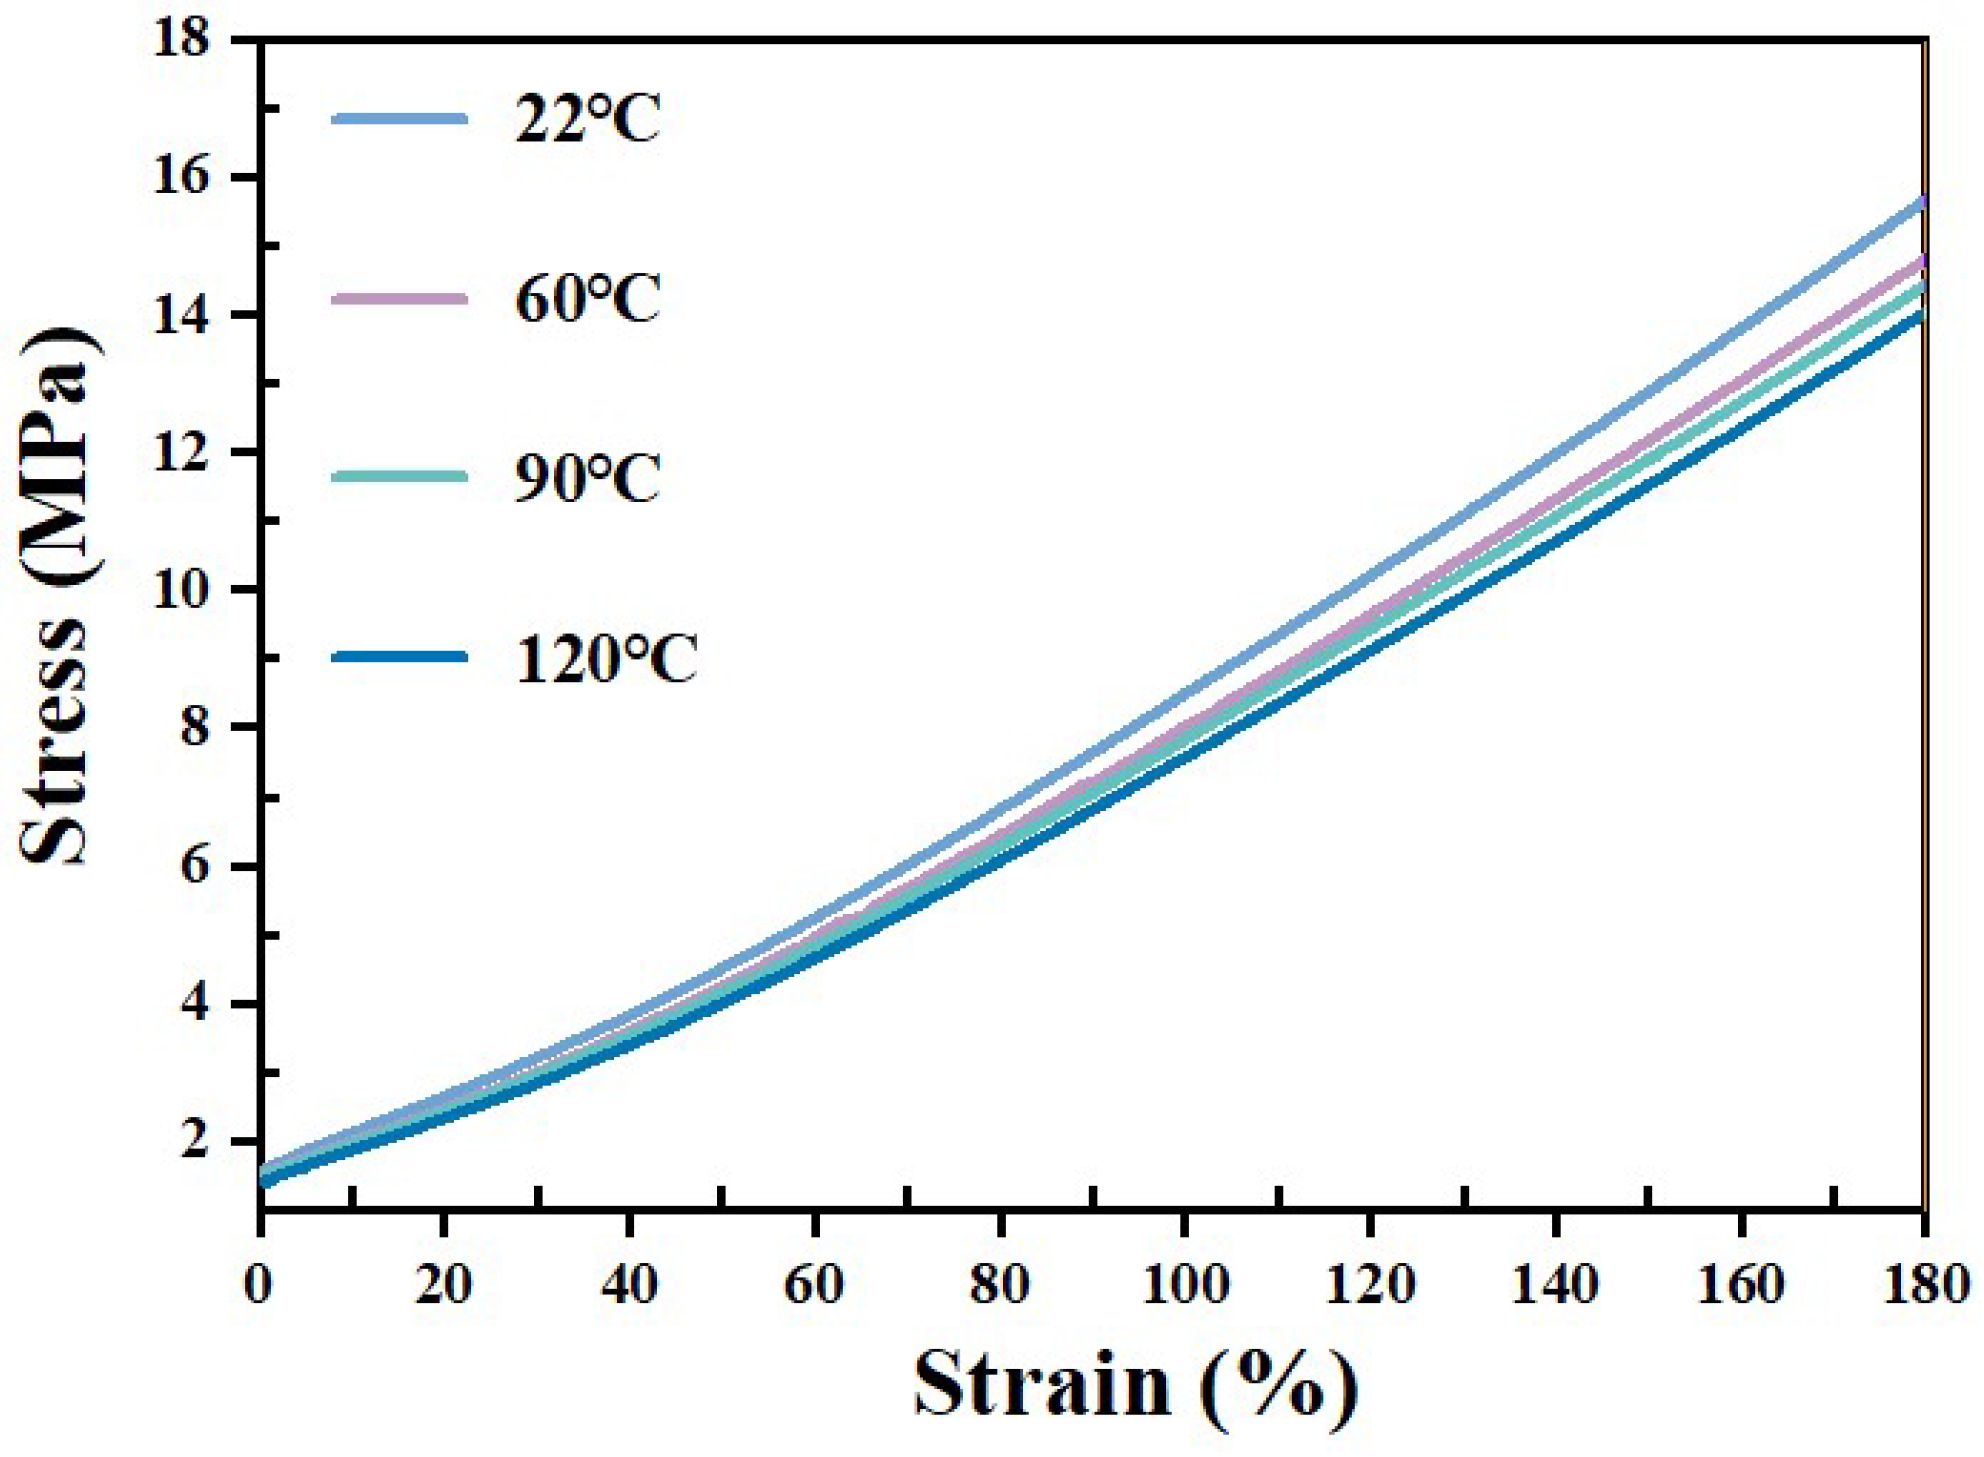
The rotary shaft is constructed from structural steel, while the single-lip seal is fabricated from nitrile rubber. Drawing upon the material performance indicators of imported single-lip seals, this paper introduces a newly developed nitrile rubber material. According to GB/T 528-2009 [29], “Testing of Tensile Stress-Strain Properties of Vulcanized or Thermoplastic Rubbers,” Type 1 specimens were used to conduct uniaxial tensile tests on the nitrile rubber material using a universal testing machine. The influence of temperature on its material properties was also studied, as shown in Figure 5. Under stable operating conditions of the shield tunneling machine’s main drive seal, the frictional heat generated at the shaft–seal interface typically stabilizes at around 60 °C. Even when temperatures rise to 60–90 °C due to increased rotational velocity or various other influences, the material’s mechanical properties exhibit negligible sensitivity to such thermal variations. Therefore, this study focuses exclusively on analyzing temperature-dependent changes in lubricant viscosity, omitting thermal effects on the nitrile rubber material.
Figure 6a,b showcase the stress contour map and the static contact pressure curve, respectively, obtained through solid mechanics analysis under typical service conditions for the rotary lip seal.
Detailed analyses related to fluid mechanics, contact mechanics, deformation, and thermodynamics for the seal can be found in the Supplementary Material, with supporting references [30,31,32,33,34,35,36].

3. Results and Discussion

3.1. Model Validation

This study employs the mixed lubrication model (MLM) described in [15] to validate the newly proposed MTHL model. Notably, although [15] lacks an explicit thermal model, it incorporates the effect of velocity on viscosity in the numerical calculations. In this way, it indirectly accounts for how temperature affects lubricant viscosity. The comparative results of the reverse pumping rate predicted by both models are plotted in Figure 7. The reverse pumping rate calculated by both models increases almost linearly with rotary shaft speed and exhibits strong consistency. These results confirm the accuracy of the newly developed MTHL model.
To further assess the validity of the MTHL model under various pressure differential conditions, a systematic review of the relevant literature was conducted. Refs. [15,20] primarily focus on lubrication studies under a zero pressure differential; this condition was validated in the present study against the data from [15]. Although Reference [37] provides data under pressure differential conditions, it does not include the static contact pressure distribution parameter necessary for calculating the reverse pumping rate in our model, making it unsuitable for direct comparison. While Reference [21] offers relevant data at a pressure differential of 0.4 MPa, including a detailed static contact pressure distribution, its numerical model is based on the classical Reynolds equation, which is fundamentally different from the averaged Reynolds equation employed in our work. Consequently, none of the identified references could be directly used to validate the MTHL model under varying pressure differential conditions.

3.2. Effect of Velocity

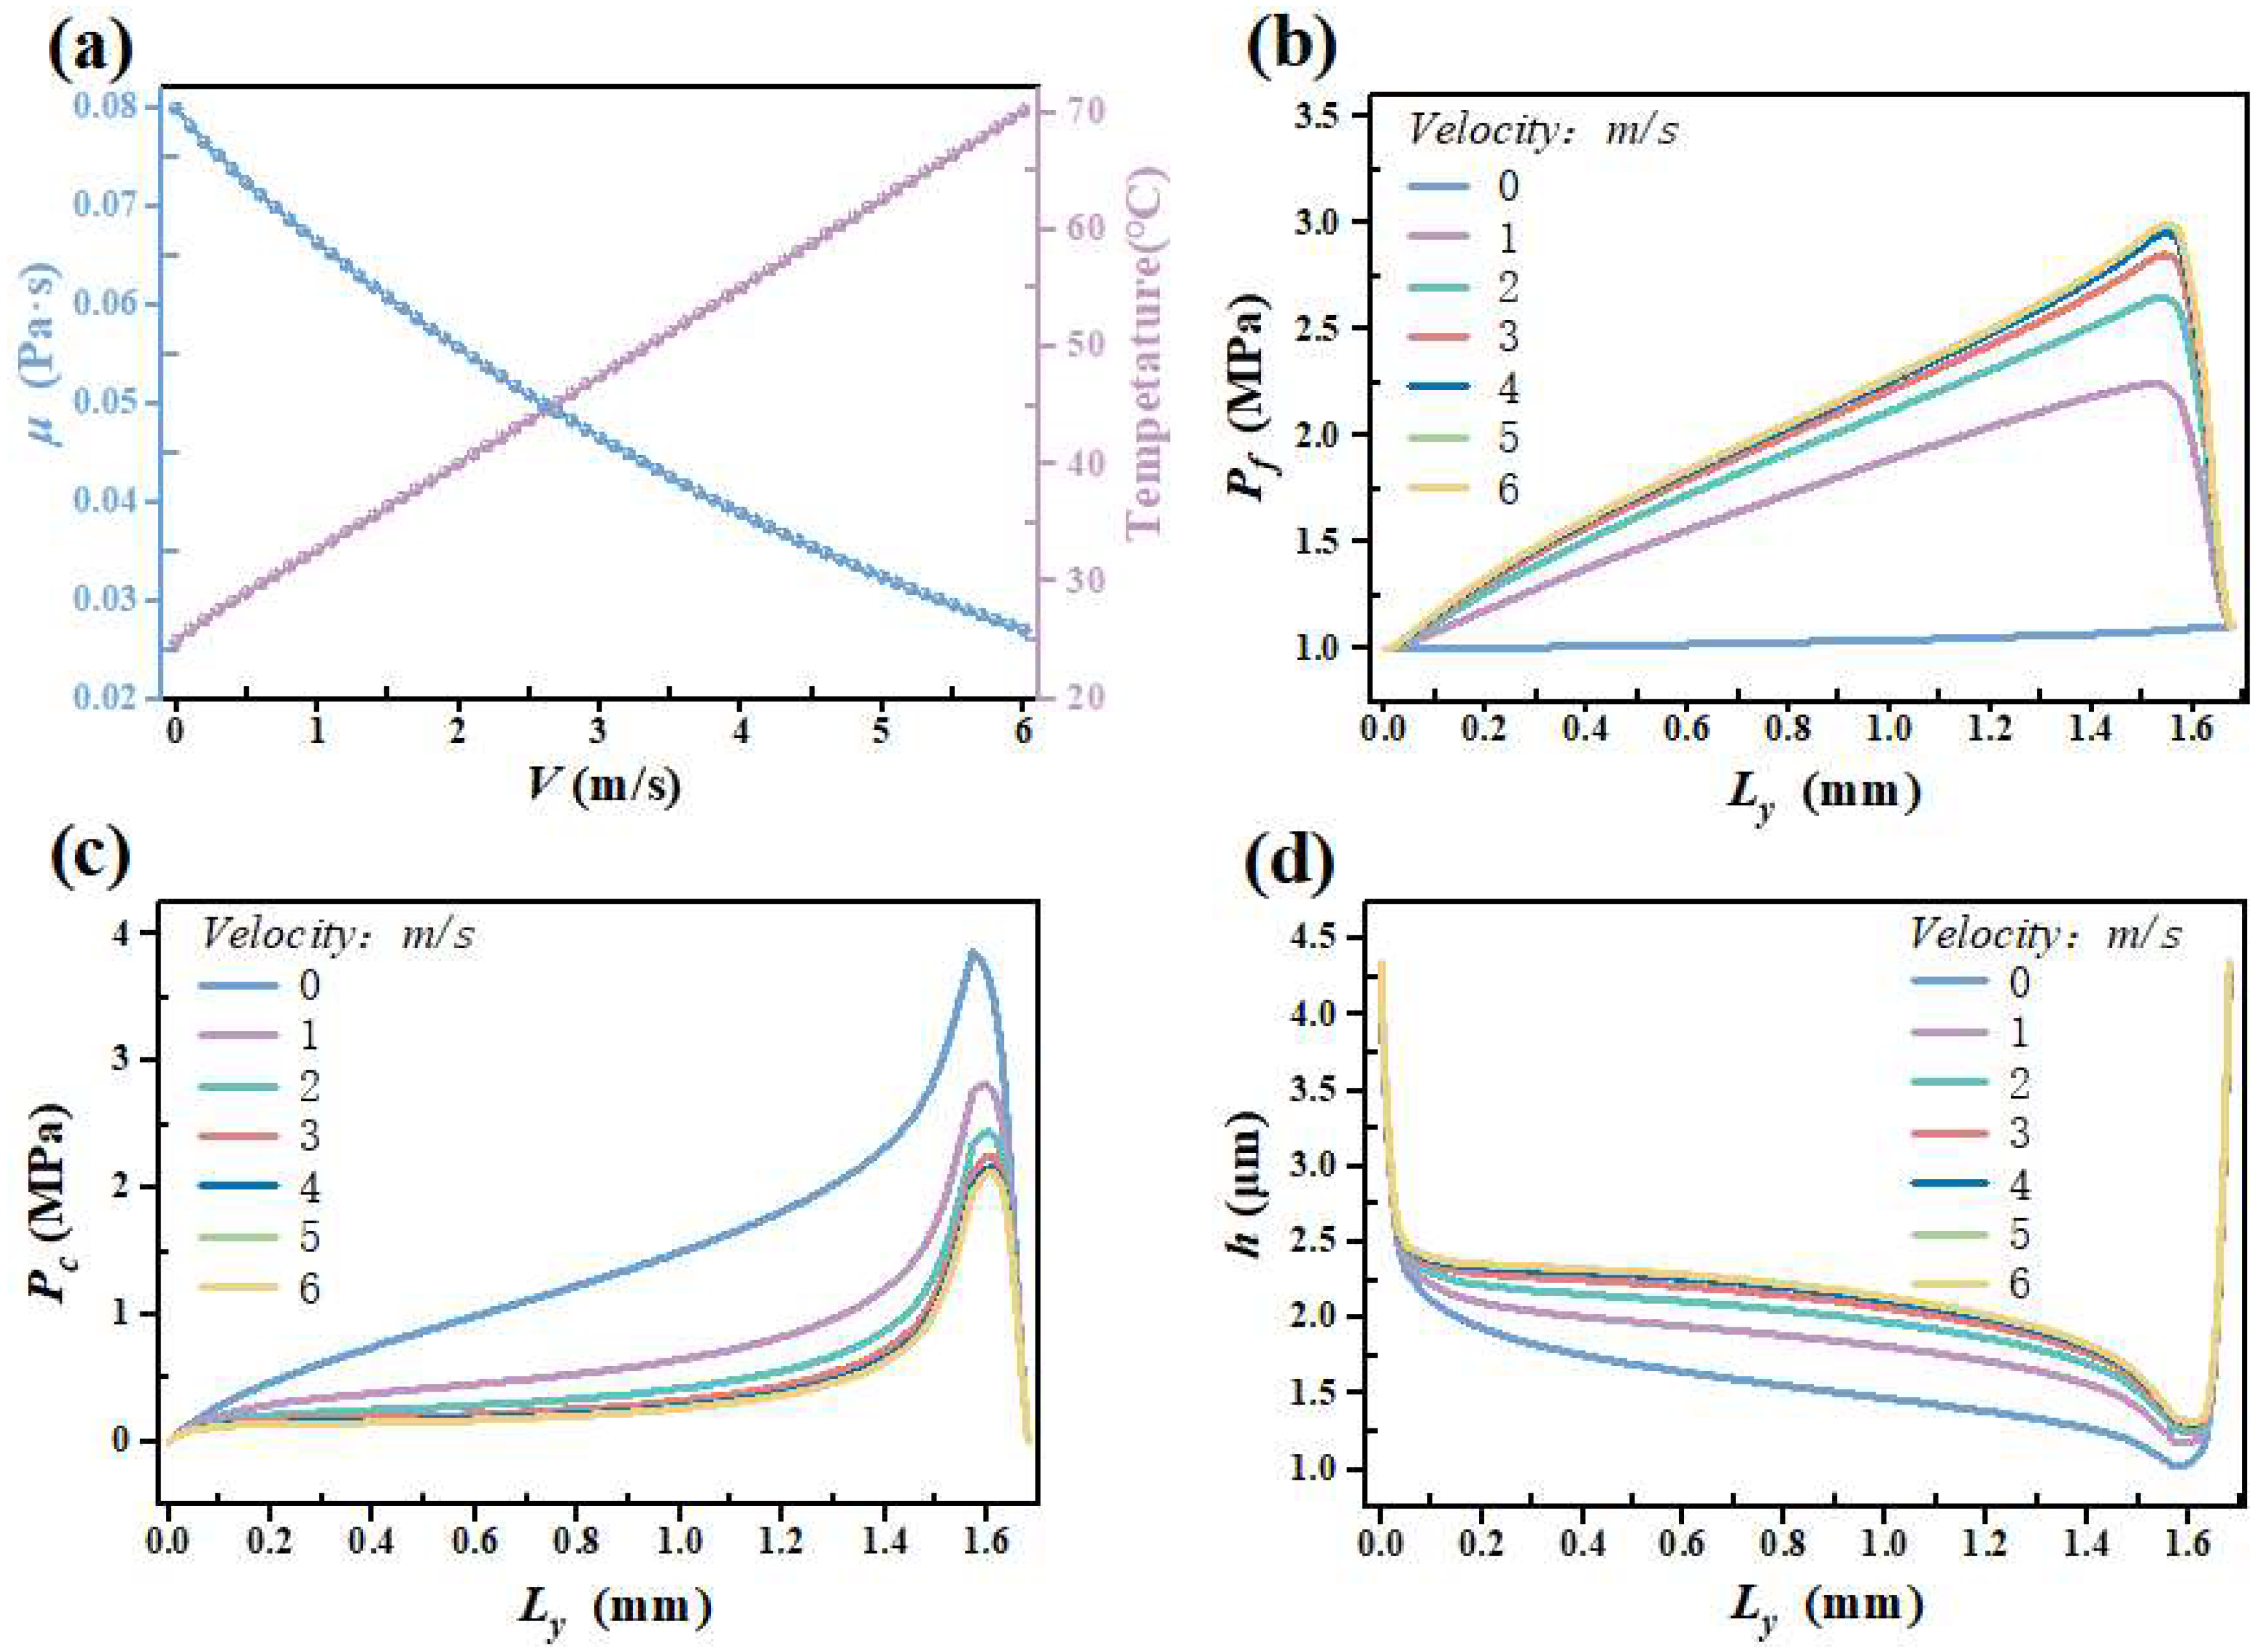
Figure 8a demonstrates the effect of velocity variation on the sealing contact zone temperature and lubricant viscosity. As velocity increases, the sealing contact zone temperature exhibits an almost linear growth trend, with a temperature rise of 7.67 °C for every 1 m/s increase in velocity. Simultaneously, the lubricant viscosity displays a nonlinear decrease, dropping significantly from 0.08 Pa·s to 0.025 Pa·s. Figure 8b–d illustrate the influence patterns of velocity changes in the axial sealing contact zone on P f , P c , and h . With increasing velocity, both fluid pressure and lubricant film thickness gradually increase, leading to a gradual decrease in asperity contact pressure. However, it is noteworthy that the overall trends of these three parameters gradually flatten out. This phenomenon is primarily attributed to the thermal-induced reduction in lubricant viscosity, which partially diminishes the hydrodynamic pressure effect. In summary, while an increase in velocity enhances the hydrodynamic pressure within the lubricating film, this enhancement is constrained by the viscosity loss resulting from elevated temperatures.
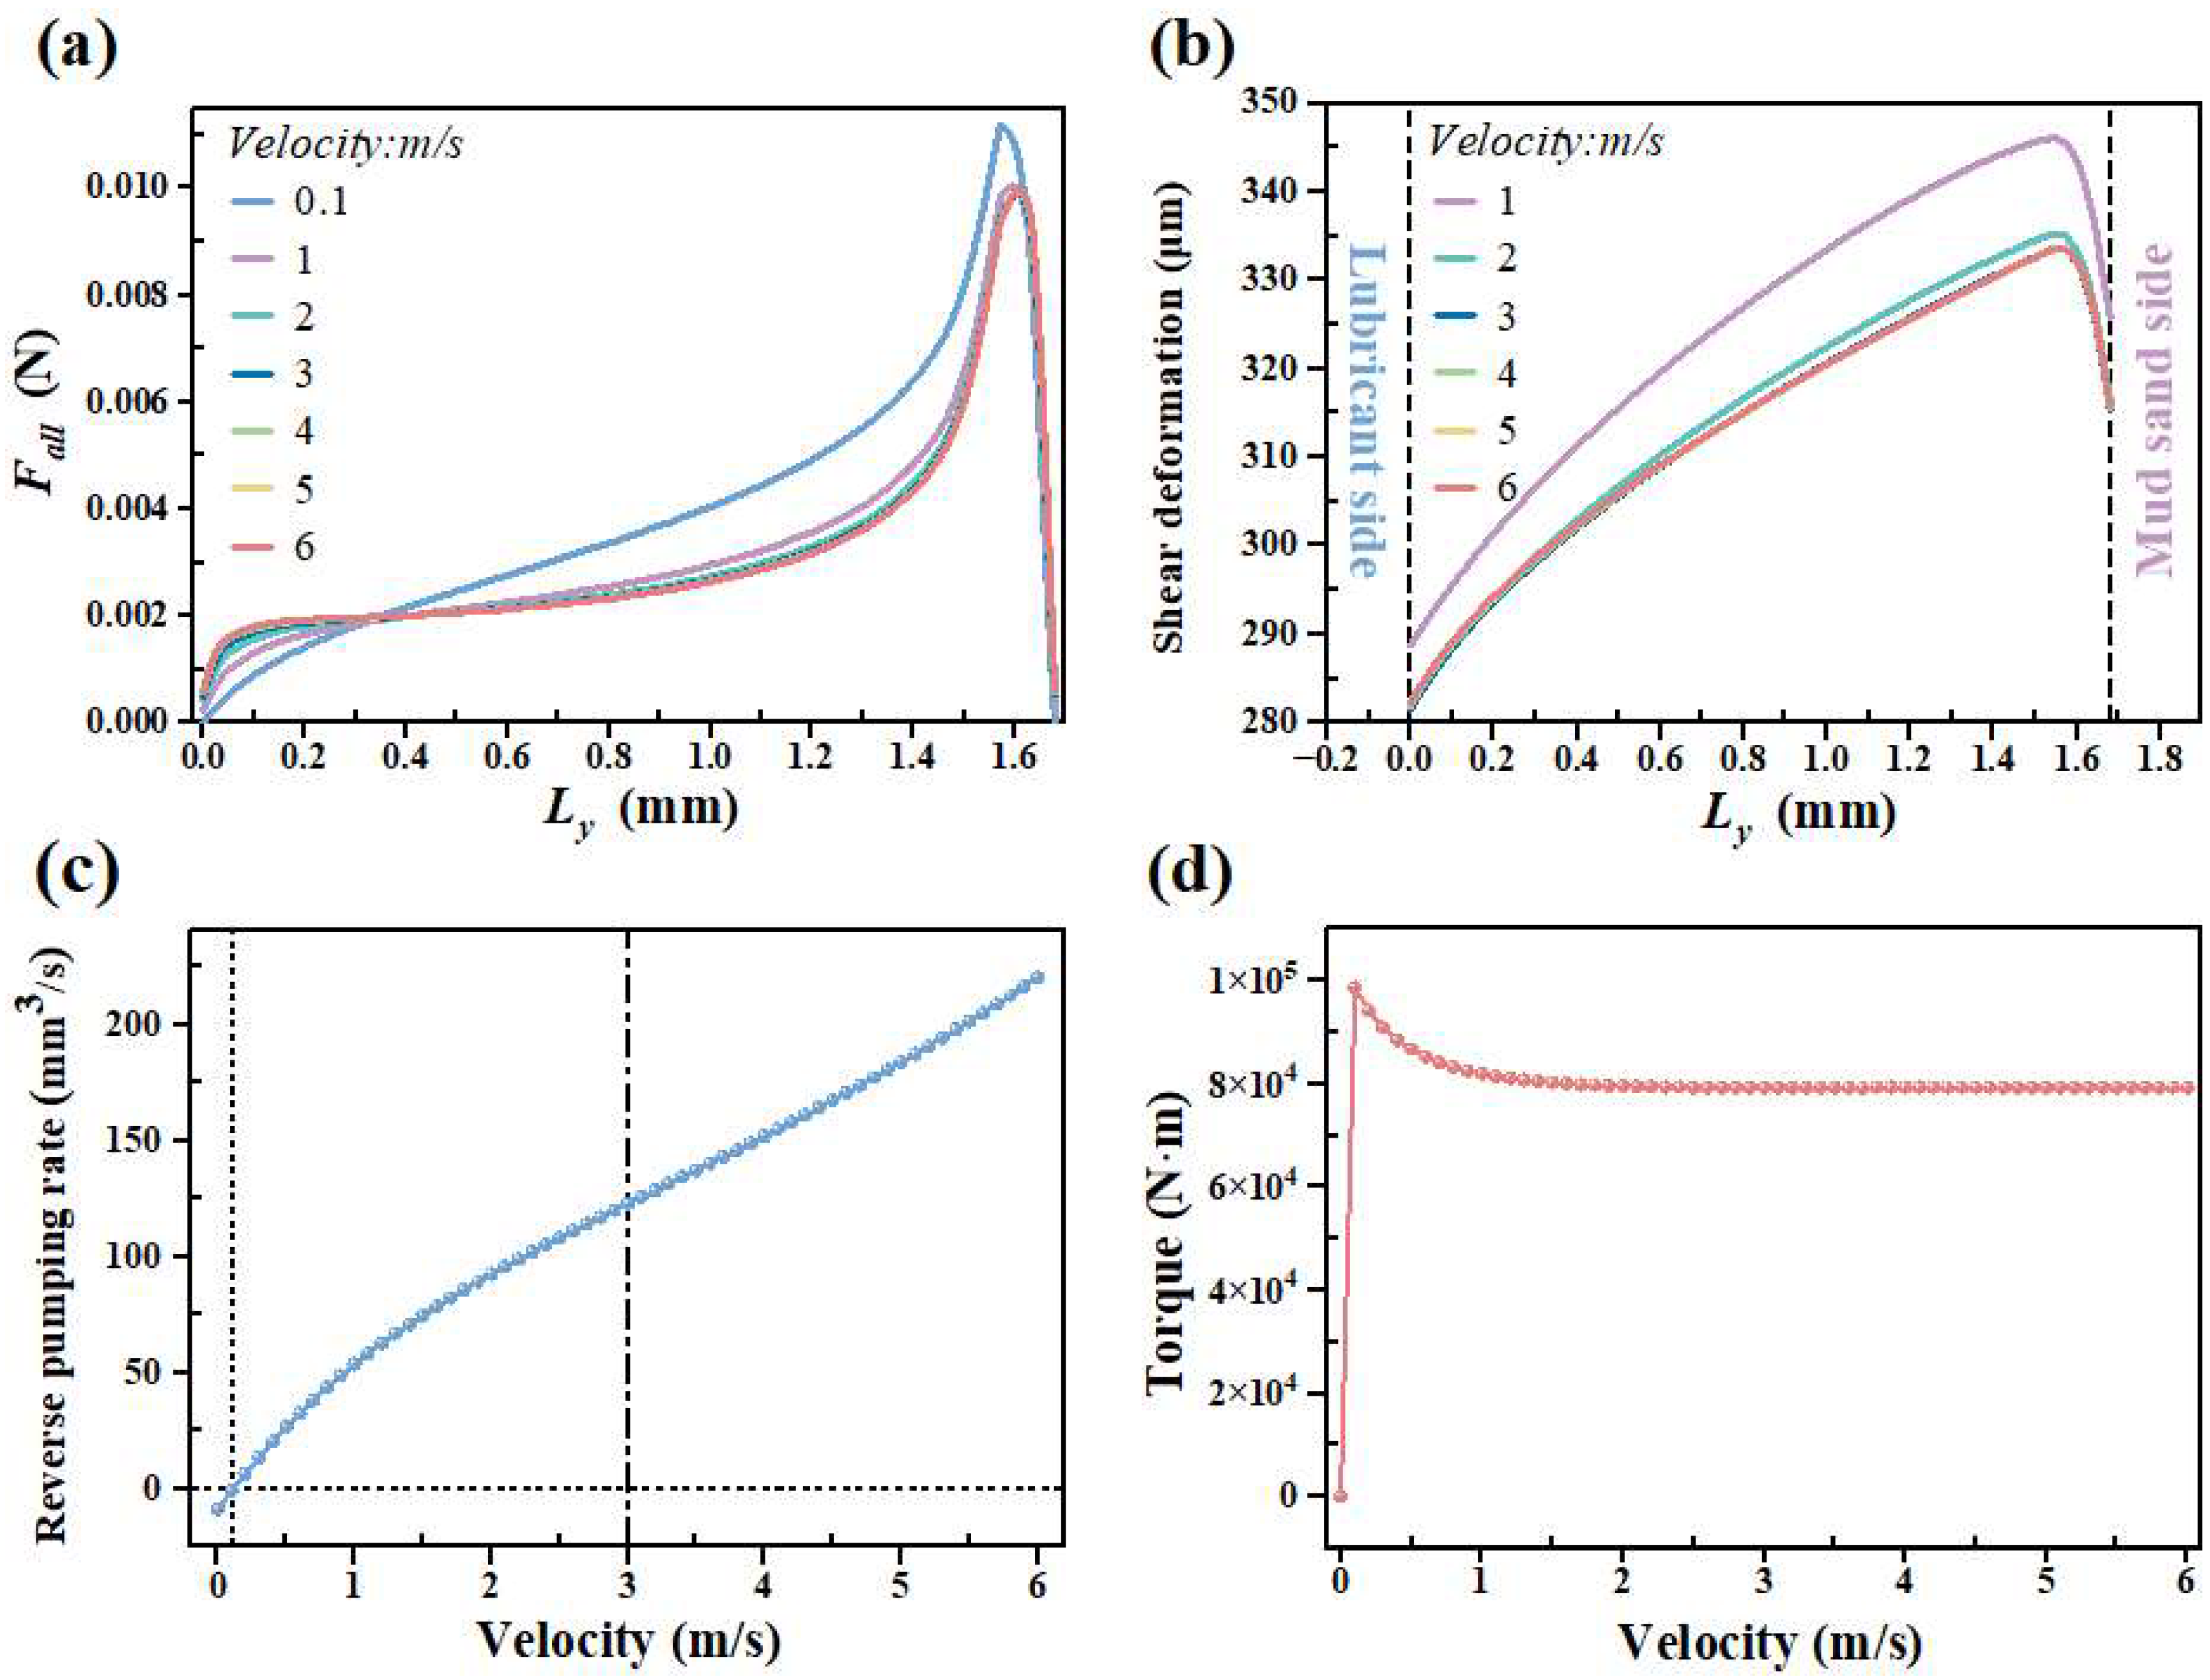
Figure 9a demonstrates the influence of velocity variations on the total friction within the axial sealing contact zone. As velocity increases, the total friction force first sharply increases (0–0.1 m/s), then sharply decreases (0.1–1 m/s), and finally stabilizes (1–6 m/s), due to the combined effects of viscous stress and asperity contact stress. As shown in Figure 9b, shear deformation in the axial sealing contact zone gradually decreases with increasing velocity. This reduction is primarily attributed to the enhanced hydrodynamic effect (Figure 8b–d), whereby higher speeds result in increased fluid pressure and lubricant film thickness, reducing asperity contact pressure. The intensified dynamic pressure effect also diminishes total friction, thereby further mitigating shear deformation. Additionally, it can be observed that as velocity increases, the peak shear deformation rapidly approaches the mud sand side within the range of 1–3 m/s and remains unchanged within the range of 3–6 m/s. Figure 9c describes the effect of velocity changes on the reverse pumping rate. When the main drive seal of the shield machine is in a static state, the reverse pumping rate is negative (−8.5 mm3/s), allowing mud sand to enter the lubricant side. As velocity increases, the reverse pumping effect of the lubricant film gradually intensifies. When velocity reaches 0.12 m/s, the reverse pumping rate becomes zero, and mud sand no longer enters the lubricant side. As velocity continues to increase, the reverse pumping rate first exhibits a nonlinear increasing trend within the range of 1–3 m/s and then increases almost linearly. This variation trend aligns with the reverse pumping mechanism [10,11,12], where the closer proximity of the peak shear deformation to the mud sand side results in a stronger suction effect. At a velocity of 3 m/s, the reverse pumping rate is 122.82 mm3/s. Figure 9d shows the impact of velocity changes on friction torque. As velocity increases, friction torque experiences a sharp increase within the initial span of 0–0.1 m/s, followed by a sharp decrease in the subsequent span of 0.1–1 m/s, and remains essentially constant within the range of 1–6 m/s. This trend closely matches the trend of total friction force. At a velocity of 3 m/s, the friction torque is 79,304 N·m.

3.3. Effect of Fluid Pressure Differential

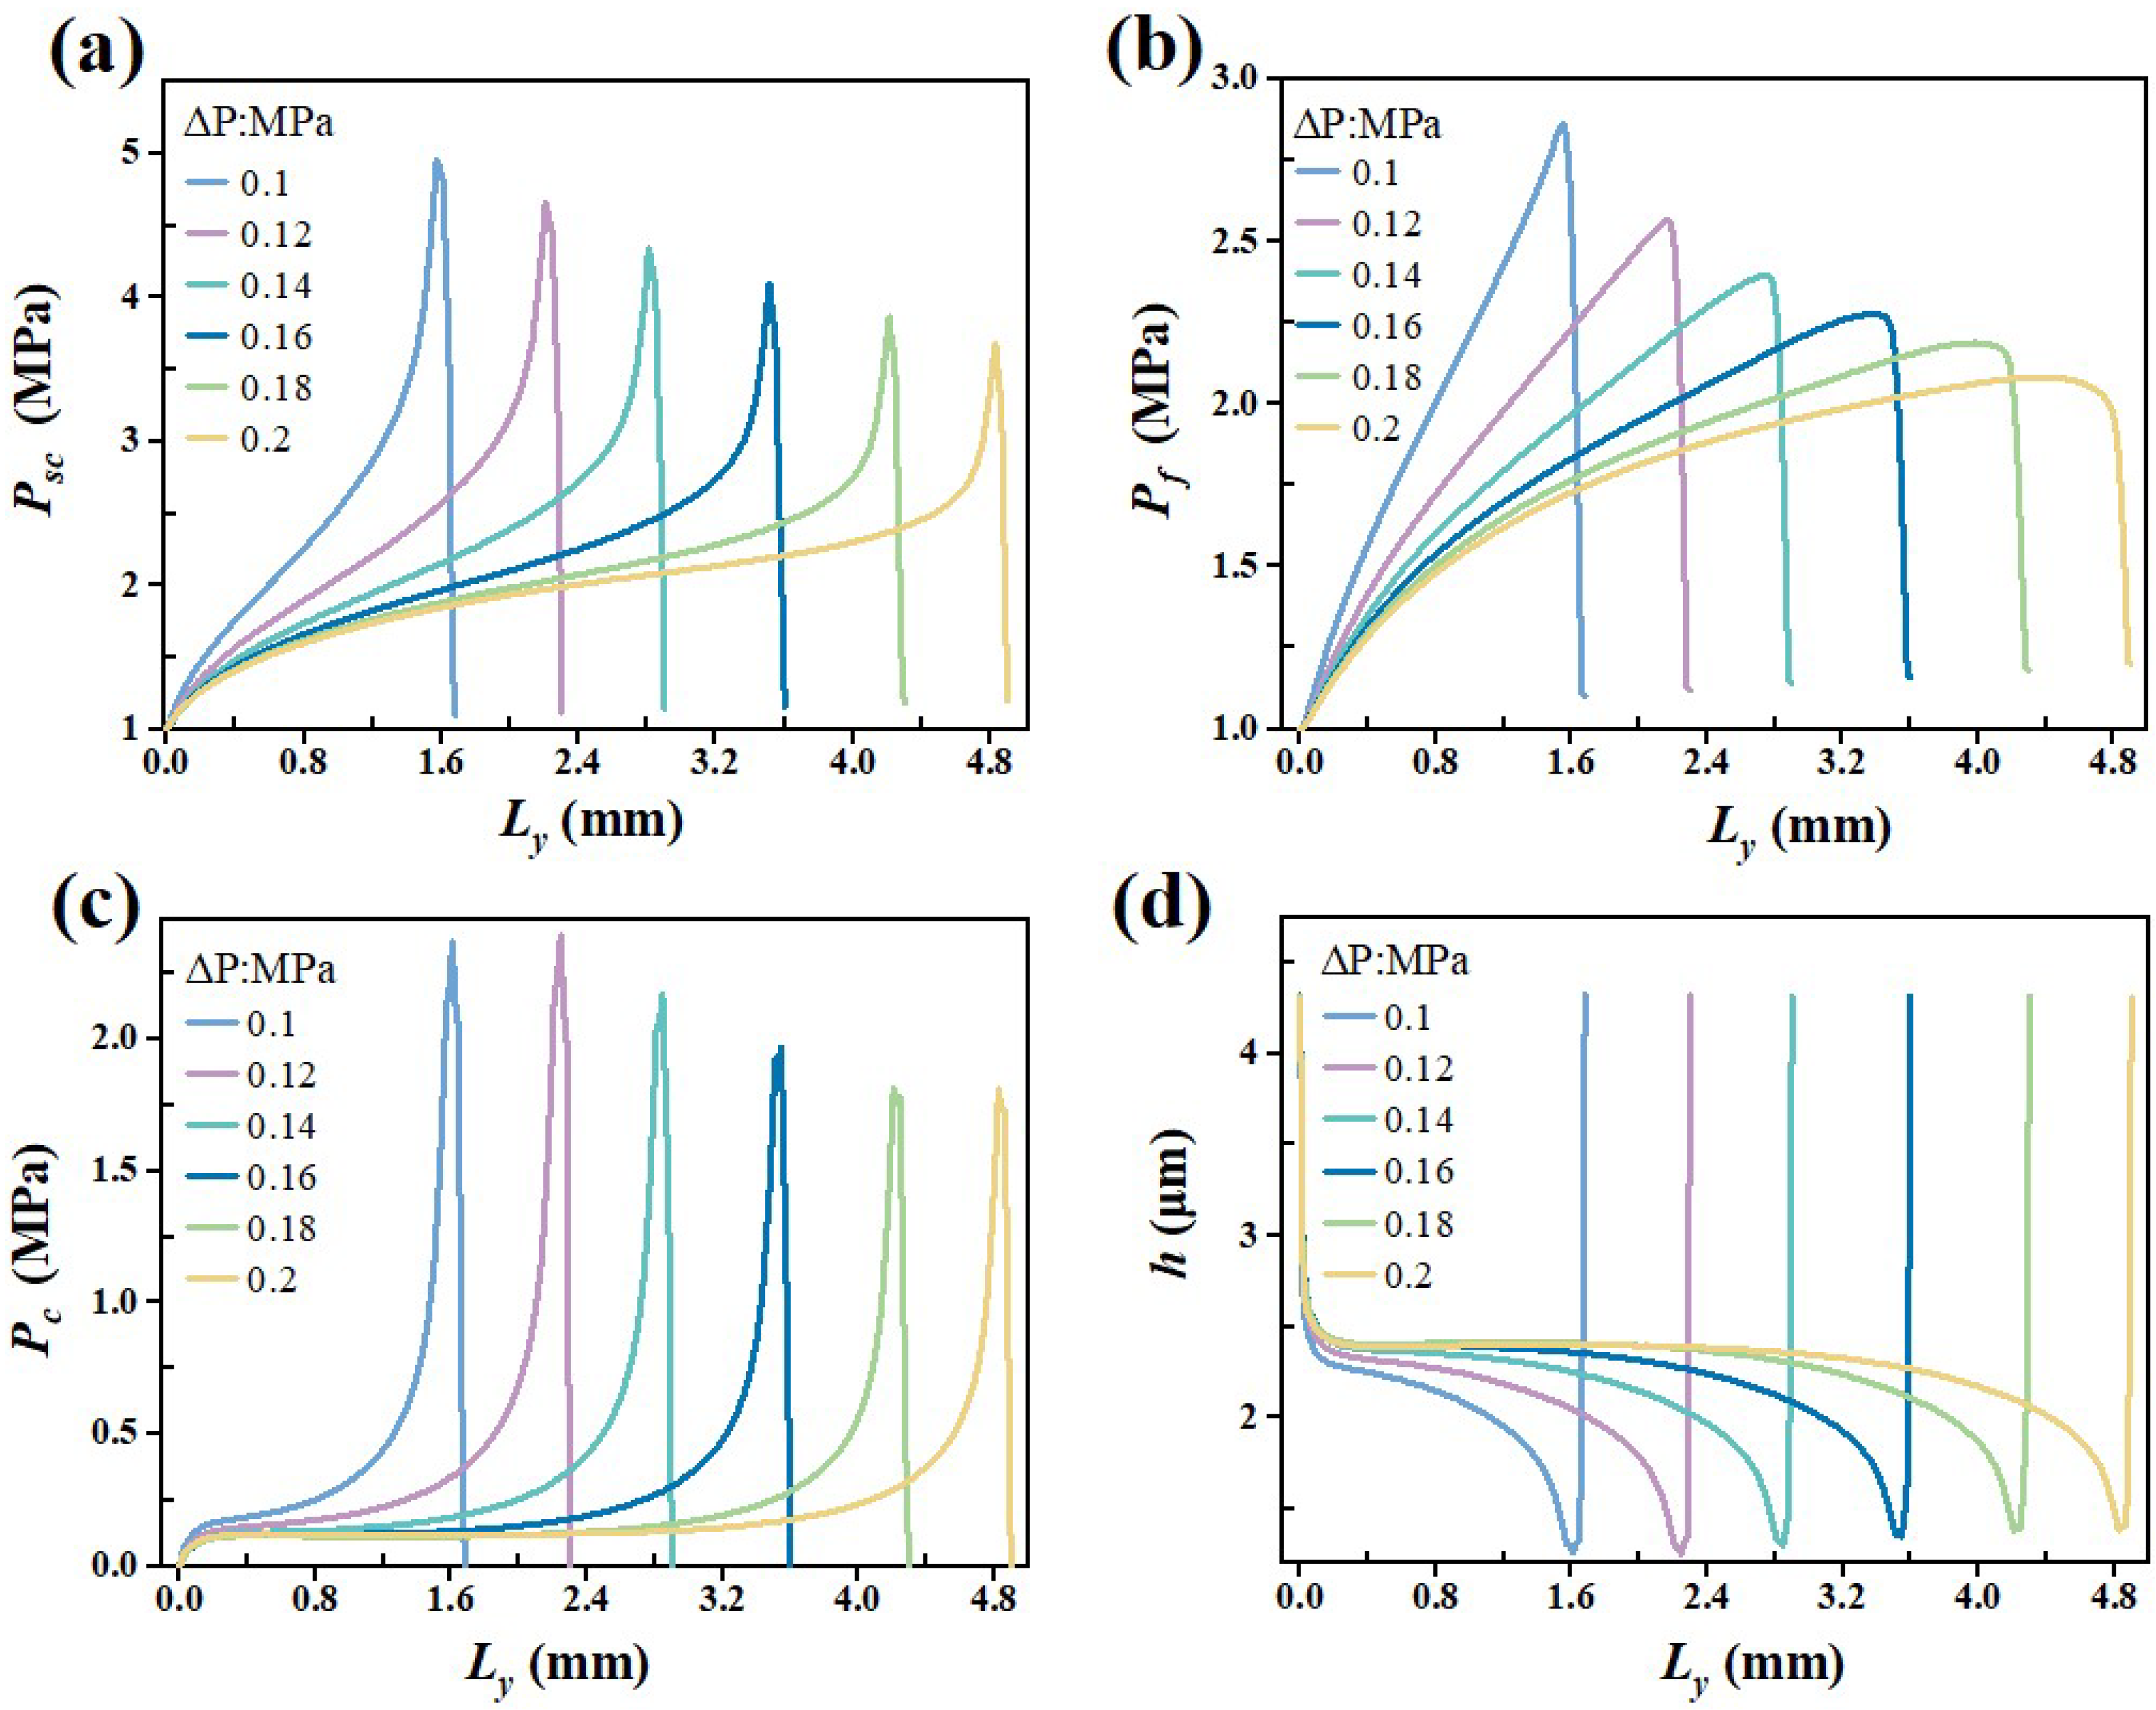
Figure 10a–d depict the variations in static contact pressure, fluid pressure, asperity contact pressure, and lubricant film thickness, respectively, under varying fluid pressure differentials. Figure 10a shows the results of a finite element simulation, indicating that as the fluid pressure differential increases, both the radial force and axial contact length increase significantly. This change leads to a more uniform distribution of static contact pressure, thereby reducing the magnitude of the static contact pressure. Meanwhile, in Figure 10b–d, the numerical simulation results indicate that as the fluid pressure differential increases, the magnitude of fluid pressure gradually decreases, primarily due to the notable decline in the magnitude of the static contact pressure. Furthermore, the peak of the asperity contact pressure exhibits a trend of initially increasing, then decreasing, and finally decreasing again. Correspondingly, the peak of the lubricant film thickness first decreases, then increases, and ultimately decreases once more.
Figure 11a–d present the effects of varying the fluid pressure differential ( P ) on viscous friction ( F l ), asperity contact friction ( F c ), total friction ( F a l l ), sealing contact zone temperature, lubricant viscosity, and friction torque. As shown in Figure 11a,b, an increase in the fluid pressure differential leads to an upward trend in both viscous friction and asperity contact friction, resulting in a higher total friction. Further analysis of Figure 11c,d reveals that the increase in total friction causes an elevation in sealing contact zone temperature, which subsequently results in a decrease in lubricant viscosity. This reduction in viscosity weakens the hydrodynamic pressure effect to some extent. Additionally, the rise in total friction force also leads to a gradual increase in friction torque. Under the conditions of a velocity of 3 m/s and a fluid pressure differential of 0.1 MPa, the friction torque is 79,304 N·m. When the fluid pressure differential is elevated to 0.2 MPa, the friction torque significantly increases to 124,307 N·m.
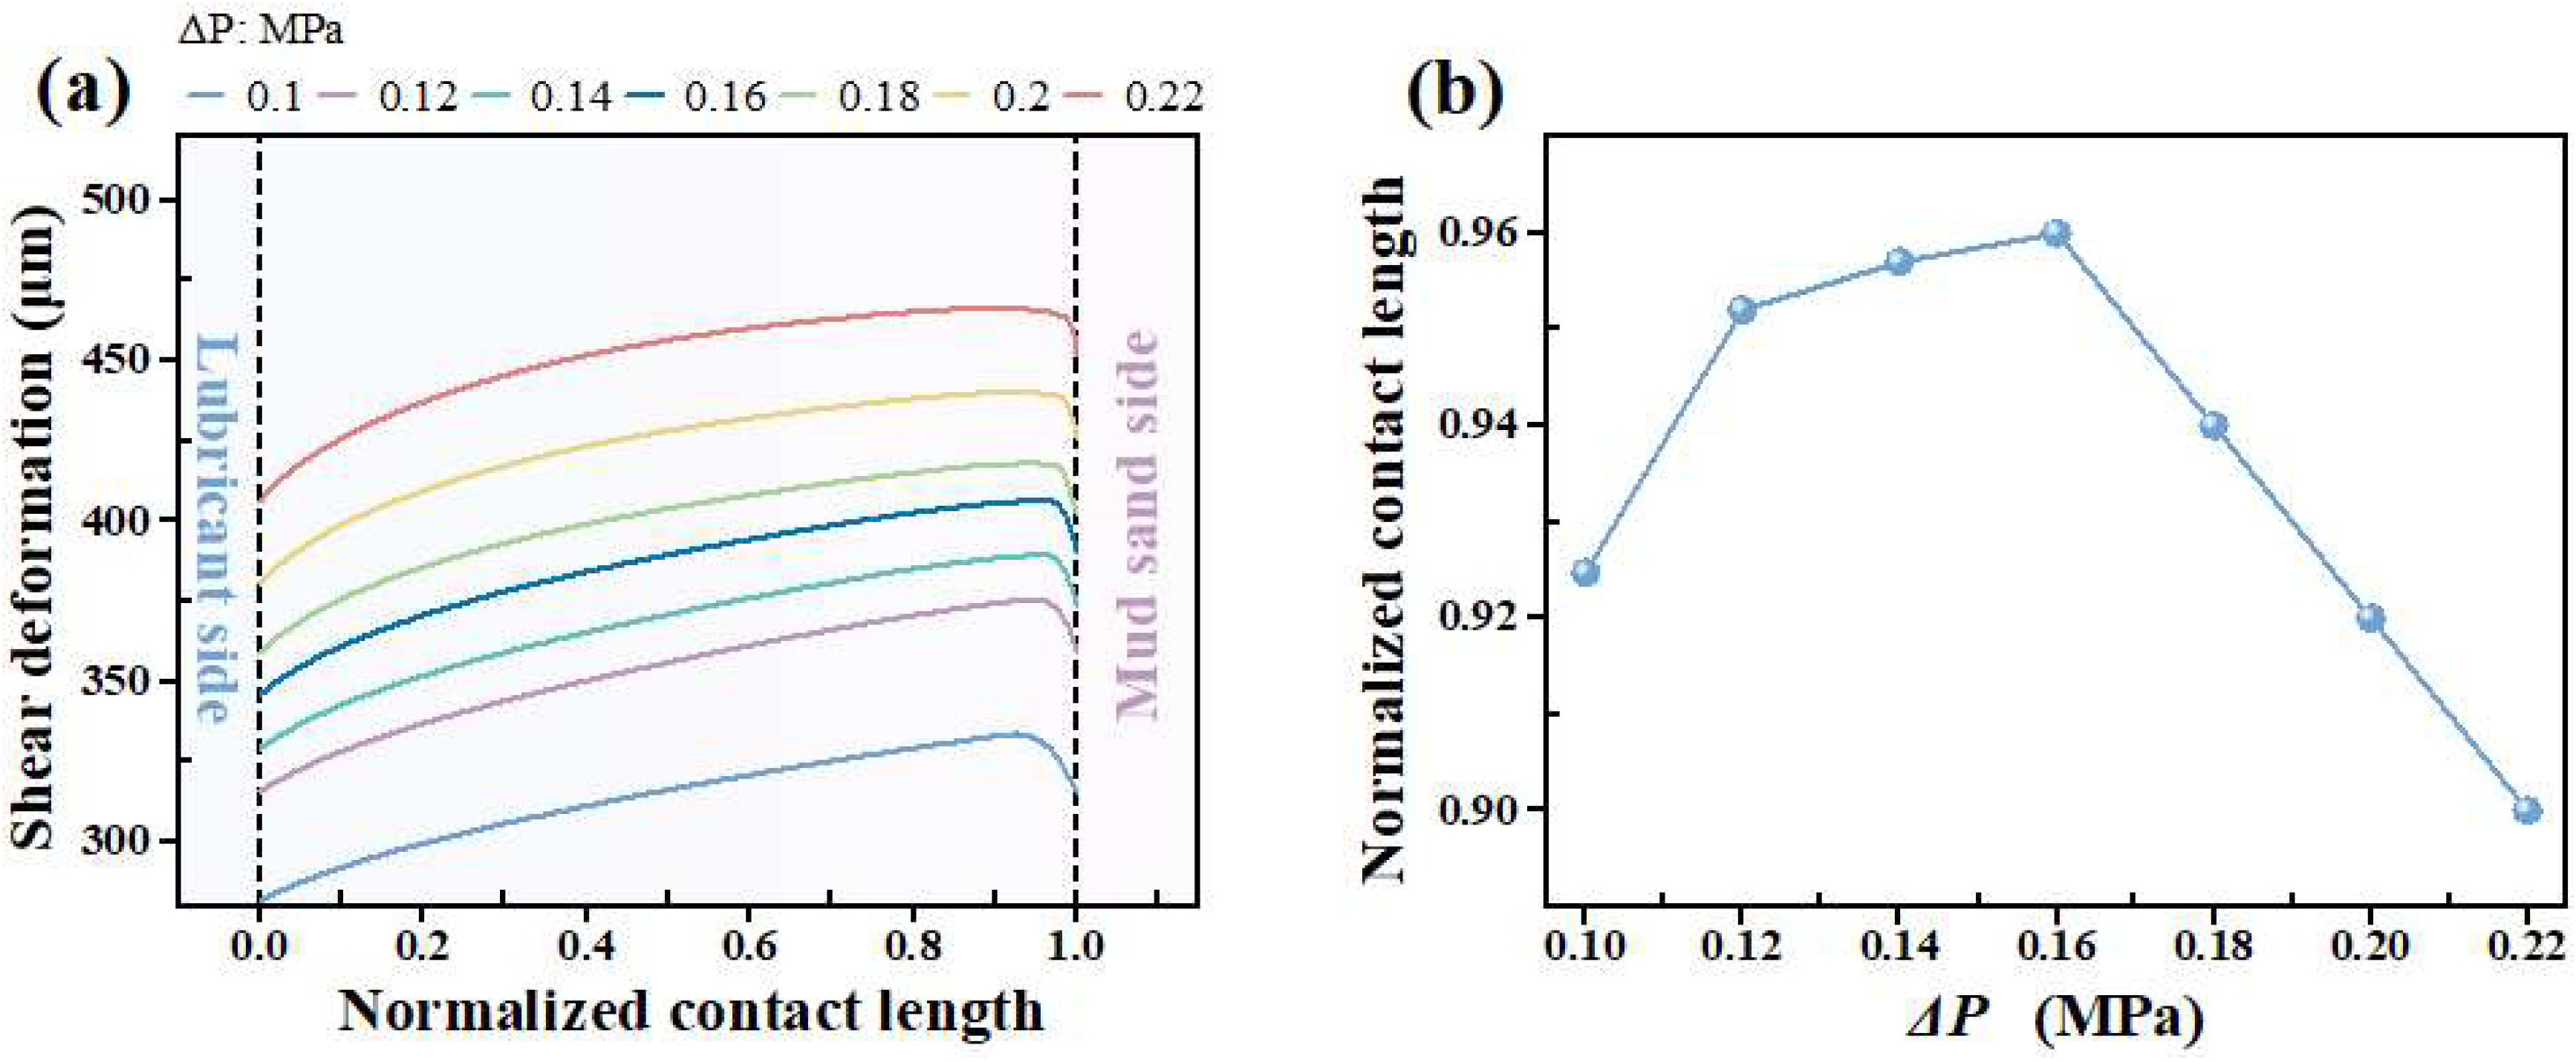
Figure 12 illustrates the reverse pumping rate with different fluid pressure differentials. As the fluid pressure differential increases, the reverse pumping rate initially rises (0.1–0.12 MPa, 122.64–172.76 mm3/s), then decreases (0.12–0.18 MPa, 172.76–52.63 mm3/s), and subsequently increases again (0.18–0.22 MPa, 52.63–69.55 mm3/s). Figure 13a,b demonstrate the impact of the fluid pressure differential on shear deformation and the point of peak shear deformation relative to the lubricant side. It can be observed that as the fluid pressure differential increases, the shear deformation continues to increase. The point of peak shear deformation first moves away from the lubricant side (0.1–0.16 MPa) and then moves closer to the lubricant side (0.16–0.22 MPa); i.e., it first approaches the mud sand side and then moves away from it. The classical reverse pumping mechanism is no longer applicable in this scenario.
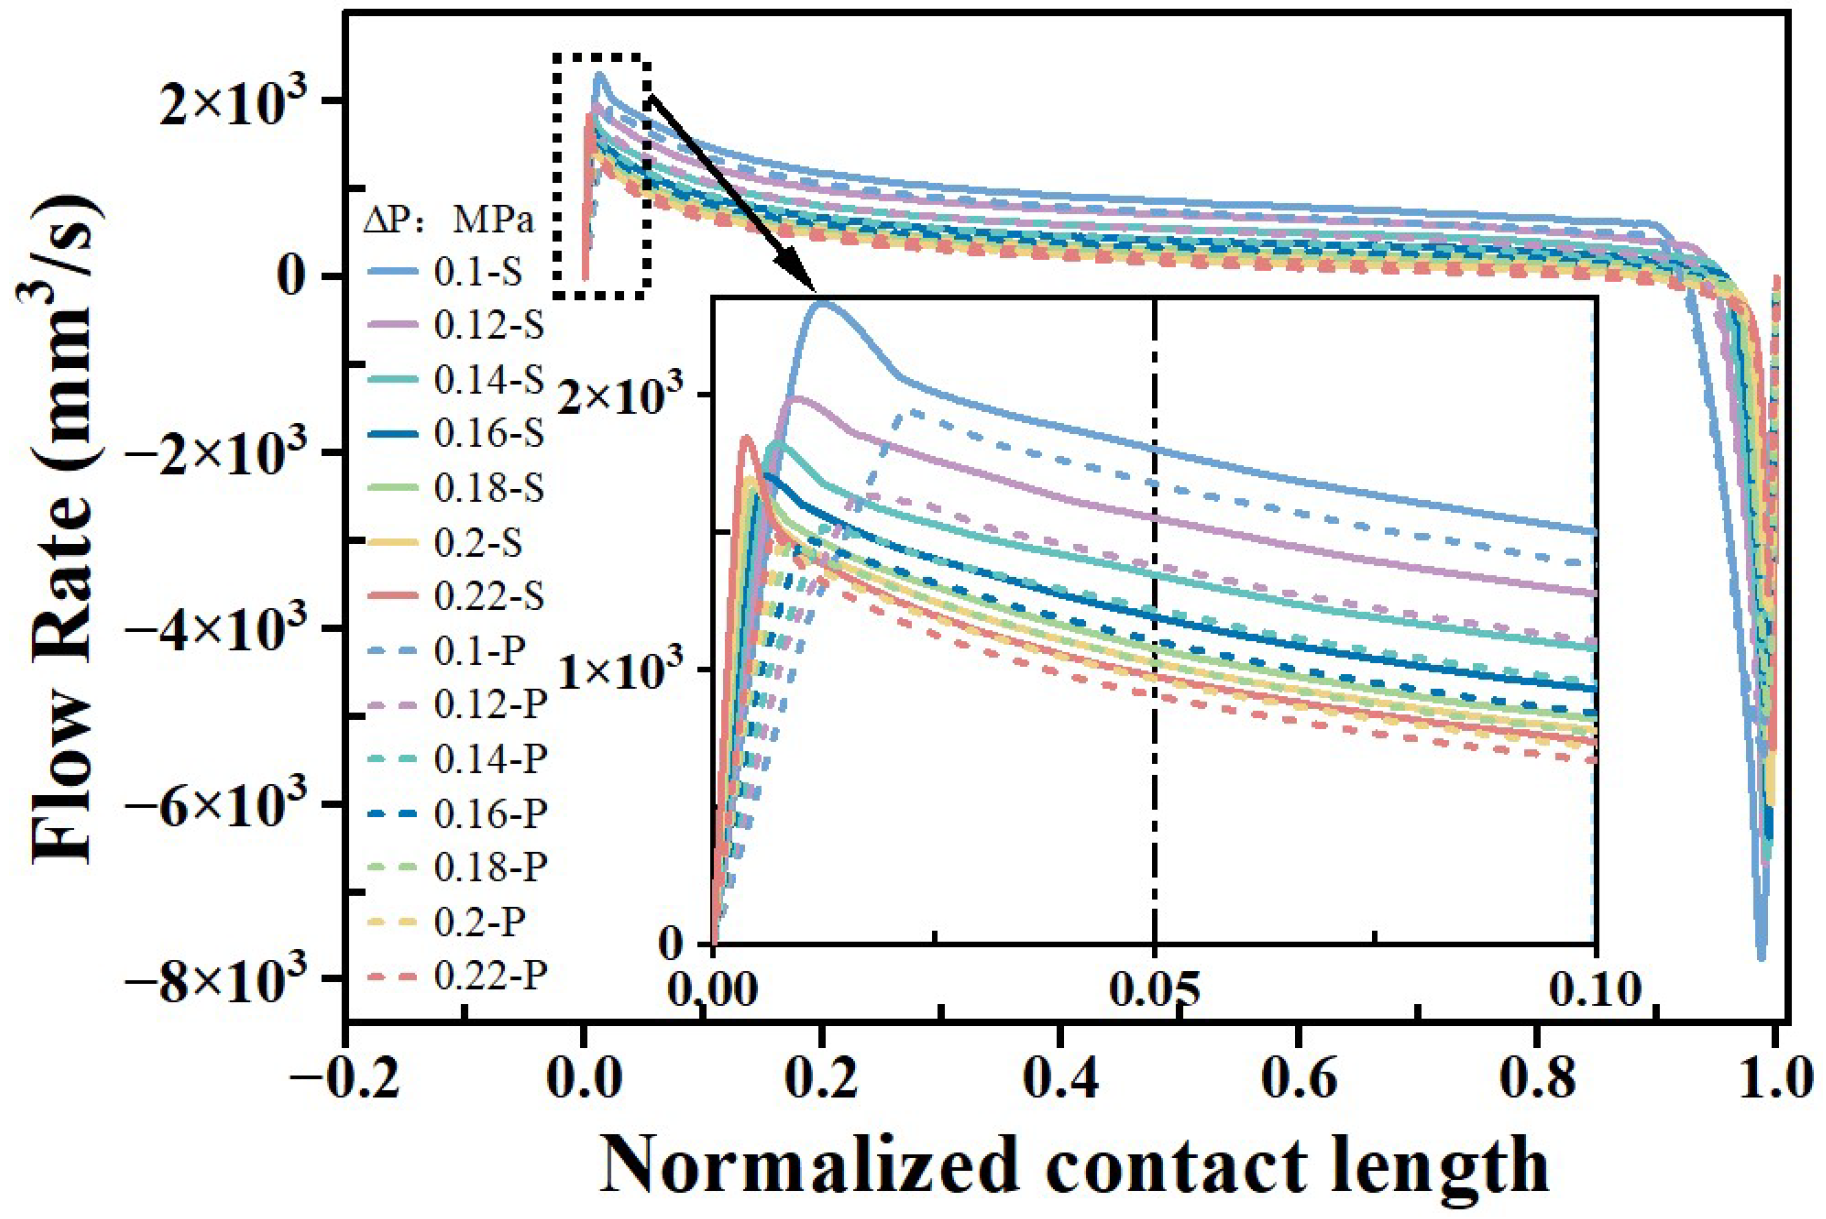
The sealing mechanism of rotary lip seals under a high fluid pressure differential is as shown in Figure 14. The flow rates generated by shear flow and pressure flow along the axial sealing contact region under various fluid pressure differentials were further calculated using Equation (S2) in the Supplementary Materials. For direct comparison of flow rates induced by pressure-driven versus shear-driven mechanisms, an inverse operation was applied to the pressure-driven component. The flow generated by shear-driven flow moves from both sides toward the position of maximum shear deformation, whereas the flow generated by pressure flow moves in the opposite direction. Considering that the flow rate calculation error on the right side of the peak shear deformation is relatively large, only the flow rate on the left side of the peak shear deformation is analyzed. The solid line represents the flow rate generated by shear flow, and the dashed curve signifies the flow rate generated by pressure-driven flow. It is evident that the flow rate generated by shear flow consistently exceeds that generated by pressure flow, indicating that the system is in a reverse pumping state. When the normalized contact length is 0.05, as the fluid pressure differential increases (0.1–0.22 MPa), the relative flow rates generated by shear flow and pressure flow exhibit a trend of first increasing, then decreasing, and subsequently increasing again, which precisely explains the variation trend of the reverse pumping rate.

4. Conclusions

In this study, an MTHL model was established, with torque due to friction and the rate of reverse pumping as key metrics to evaluate sealing performance. The accuracy of this numerical model has been validated against MLM in the literature [19]. The main findings are as follows:
  • As speed increases, the peak shear deformation shifts nearer to the mud sand side and the rate of reverse pumping increases markedly, which aligns with the classical reverse pumping mechanism. Meanwhile, the torque due to friction first rises sharply, then decreases, and finally stabilizes.
  • As the fluid pressure differential increases, the friction torque exhibits a gradual increasing trend. The reverse pumping rate demonstrates a pattern of an initial increase, followed by a decrease, and then a subsequent increase. Meanwhile, the axial position of the maximum shear deformation of the rotary lip seal first moves closer to the mud sand side (0.1–0.16 MPa) and then moves away from the mud sand side (0.16–0.22 MPa). This phenomenon cannot be explained by the classical reverse pumping mechanism.
  • The MTHL model established in this paper separately calculates the flow rates generated by shear flow and pressure flow. By comparing the relative magnitude of these two flow rates, it reasonably predicts the sealing performance, thus supplementing the classical reverse pumping mechanism. This also provides critical insights for optimizing seal performance under varying operational conditions.
It should be noted that, as discussed in Section 3.1, the validation of the MTHL model under varying fluid pressure differential conditions remains incomplete. Furthermore, the phenomena described in this study—particularly the non-monotonic behavior of sealing performance with increasing fluid pressure differentials—have yet to be experimentally verified. Future work should therefore include targeted experimental measurements under well-controlled fluid pressure differential conditions to fully validate the model and further investigate the underlying mechanisms.

Supplementary Materials

The following supporting information can be downloaded at https://www.mdpi.com/article/10.3390/lubricants13090413/s1.

Author Contributions

Software, W.H.; Validation, X.L.; Investigation, Z.D.; Data curation, K.Y.; Writing—original draft, B.H.; Supervision, Z.L.; Funding acquisition, Z.L. and Q.W. All authors have read and agreed to the published version of the manuscript.

Funding

This research was funded by the CAS Project for Young Scientists in Basic Research (YSBR-023), the National Natural Science Foundation of China (No. 12302128), the West Light Foundation of The Chinese Academy of Sciences (xbzg-zdsys-202305), the LICP Cooperation Foundation for Young Scholars (HZJJ23-4).

Data Availability Statement

The original contributions presented in this study are included in the article and Supplementary Material. Further inquiries can be directed to the corresponding authors.

Conflicts of Interest

Author Zhiyu Dong was employed by the company of China Energy Materials Company Limited Inner Mongolia Company. The remaining authors declare that the research was conducted in the absence of any commercial or financial relationships that could be construed as a potential conflict of interest.

References

  1. Hand, B.P.; Erdogan, N.; Murray, D.; Cronin Doran, P.J.; Murphy, J. Experimental testing on the influence of shaft rotary lip seal misalignment for a marine hydro-kinetic turbine. Sustain. Energy Technol. Assess. 2022, 50, 101874. [Google Scholar] [CrossRef]
  2. Jagger, E.T. Rotary shaft seals: The sealing mechanism of synthetic rubber seals running at atmospheric pressure. Proc. Inst. Mech. Eng. 1957, 171, 597–616. [Google Scholar] [CrossRef]
  3. Hirano, F.; Ishiwata, H.; Kambayashi, H. Friction and Sealing Characteristics of Oil Seals. Available online: https://cir.nii.ac.jp/crid/1572824499808583168?lang=en (accessed on 16 July 2025).
  4. Kuzma, D.C. Theory of the mechanism of sealing with application to face seals. J. Lubr. Technol. 1969, 91, 704–712. [Google Scholar] [CrossRef]
  5. Kawahara, Y.; Abe, M.; Hirabayashi, H.; Matsushima, A. Effect of Surface Condition of Lip on Sealing Phenomena of Oil Seals; No. 780405; SAE International: Warrendale, PA, USA, 1978. [Google Scholar] [CrossRef]
  6. Kawahara, Y.; Abe, M.; Hirabayashi, H. An analysis of sealing characteristics of oil seals. Tribol. Trans. 1980, 23, 93–102. [Google Scholar] [CrossRef]
  7. Qian, D.S. The sealing mechanism and design factors of radial lip seals for crankshafts. Intern. Combust. Engine Eng. 1984, 5, 10–13. [Google Scholar] [CrossRef]
  8. Kammuller, M. On the Sealing Mechanism of Radial Shaft Seals. Ph.D. Thesis, Technical University of Munich, München, Germany, 1986. Available online: https://puma.ub.uni-stuttgart.de/bibtex/36b18ec71004289bcc84a184b349dd61 (accessed on 16 July 2025).
  9. Sponagel, S.; Kilthau, G.; Spies, K.H. Sealing mechanisms of lip seals. In Proceedings of the 11th International Conference on Fluid Sealing, Cannes, France, 8–10 April 1987; pp. 748–772. Available online: https://www.abebooks.de/9781851661008/11th-International-Conference-Fluid-Sealing-185166100X/plp (accessed on 16 July 2025).
  10. Stakenborg, M.J.L. On the Sealing and Lubrication Mechanism of Radial Lip Seals. Ph.D. Thesis, Technische Universiteit Eindhoven, Eindhoven, The Netherlands, 1988. [Google Scholar] [CrossRef]
  11. Salant, R.F. Numerical analysis of the flow field within lip seals containing microundulations. J. Tribol. 1992, 114, 485–492. [Google Scholar] [CrossRef]
  12. Salant, R.F.; Flaherty, A.L. Elastohydrodynamics of lip seals. Lubr. Sci. 1995, 8, 15–26. [Google Scholar] [CrossRef]
  13. Salant, R.F. Elastohydrodynamics of the rotary lip seal. Lubr. Sci. 1997, 9, 111–125. [Google Scholar] [CrossRef]
  14. Hajjam, M.; Bonneau, D. Influence of the roughness model on the thermoelastohydrodynamic performances of lip seals. Tribol. Int. 2006, 39, 198–205. [Google Scholar] [CrossRef]
  15. Guo, F.; Jia, X.; Suo, S.; Salant, R.F.; Wang, Y. A mixed lubrication model of a rotary lip seal using flow factors. Tribol. Int. 2013, 57, 195–201. [Google Scholar] [CrossRef]
  16. Patir, N.; Cheng, H.S. An average flow model for determining effects of three-dimensional roughness on partial hydrodynamic lubrication. J. Lubr. Technol. 1978, 100, 12–17. [Google Scholar] [CrossRef]
  17. Elrod, H.G. A cavitation algorithm. J. Lubr. Technol. 1981, 103, 350–354. [Google Scholar] [CrossRef]
  18. Lo, S.W. On the effects of roughness orientation—A mapping and double scale analysis of flow factors. J. Tribol. 1992, 114, 747–754. [Google Scholar] [CrossRef]
  19. Liu, D.; Wang, S.; Shi, J.; Zhang, C.; Tomovic, M. Numerical analysis of rotary lip seal performance deterioration. In Proceedings of the 2016 IEEE 11th Conference on Industrial Electronics and Applications, Hefei, China, 5–7 June 2016; pp. 1078–1083. [Google Scholar] [CrossRef]
  20. Yan, C.X.; Jia, X.H.; Jiang, B.Q.; Gao, L.F.; Guo, F. Influence of oil temperature on the lip seal’s performance. Tribol. Trans. 2019, 62, 739–746. [Google Scholar] [CrossRef]
  21. Chen, S.; Guo, F.; Wang, W.; Wang, Y. An improved mixed lubrication model for revealing the mechanism of high speed and frictional heat on sealing performance. Tribol. Int. 2024, 191, 109147. [Google Scholar] [CrossRef]
  22. Uddin, M.S.; Ibatan, T.; Shankar, S. Influence of surface texture shape, geometry and orientation on hydrodynamic lubrication performance of plane-to-plane slider surfaces. Lubr. Sci. 2017, 29, 153–181. [Google Scholar] [CrossRef]
  23. Lahjouji, I.; El Gadari, M.H.; Radouani, M. Numerical Investigation of Grooved Shaft Effects on the Rotary Lip Seal Performance with Relative Lip Motion. Lubricants 2019, 7, 16. [Google Scholar] [CrossRef]
  24. Zhang, F.; Yang, J.; Shui, H.; Dong, C. Effect of roughness on sealing performance of oil seals with surface texture. Ind. Lubr. Tribol. 2020, 72, 525–532. [Google Scholar] [CrossRef]
  25. Zhang, F.; Zhang, Y. Research on sealing performance of oil seals with micro-dimple texture on lips. Ind. Lubr. Tribol. 2021, 73, 113–119. [Google Scholar] [CrossRef]
  26. Guo, F.; Jia, X.H.; Wang, L.K.; Salant, R.F.; Wang, Y.M. The Effect of Wear on the Performance of a Rotary Lip Seal. J. Tribol. 2014, 136, 041703. [Google Scholar] [CrossRef]
  27. Huang, T.C.; Tsai, J.W.; Liao, K.C. Wear and leakage assessments of canted oil Spring-Energized polytetrafluoroethylene seals under Ultra-High cycle operations. Eng. Fail. Anal. 2022, 135, 106110. [Google Scholar] [CrossRef]
  28. Jiang, B.; Guo, F.; Ma, T.; Jia, X.; Zhao, N.; Wang, Y. A mixed lubrication model for lip seals based on deterministic surface micro-deformation. Tribol. Trans. 2021, 65, 153–163. [Google Scholar] [CrossRef]
  29. GB/T 528-2009; Rubber, Vulcanized or Thermoplastic—Determination of Tensile Stress-Strain Properties. Standardization Administration of China (SAC): Beijing, China, 2009.
  30. Patir, N.; Cheng, H.S. Application of the average flow model to lubrication between rough sliding surfaces. J. Lubr. Technol. 1979, 101, 220–229. [Google Scholar] [CrossRef]
  31. Payva, R.P.; Salant, R.F. A computational method for cavitation in a wavy mechanical seal. J. Tribol. 1992, 114, 199–204. [Google Scholar] [CrossRef]
  32. Rocke, A.H.; Salant, R.F. Elastohydrodynamic Analysis of a Rotary Lip Seal using flow factors. Tribol. Trans. 2005, 48, 308–316. [Google Scholar] [CrossRef]
  33. Liu, D.; Wang, S.; Zhang, C.; Tomovic, M.M. Numerical study of the effects of textured shaft on the wear of rotary lip seals. Tribol. Int. 2019, 138, 215–238. [Google Scholar] [CrossRef]
  34. Johnson, K.L. Contact Mechanics; Cambridge University Press: Cambridge, UK, 1985. [Google Scholar] [CrossRef]
  35. Salant, R.F.; Flaherty, A.L. Elastohydrodynamic analysis of reverse pumping in rotary lip seals with micro-undulations. J. Tribol. 1994, 116, 56–62. [Google Scholar] [CrossRef]
  36. Roelands, C.J.; Vlugter, J.C.; Waterman, H.I. The viscosity-temperature-pressure relationship for lubricating oils and its correlation with the chemical constitution. J. Basic Eng. 1963, 85, 601–610. [Google Scholar] [CrossRef]
  37. Liu, D.; Wang, S.; Shi, J. Mixed elastohydrodynamic lubrication model of rotary lip seal with nonGaussian surfaces: Experimentation verification and numerical analysis on effects of sealed pressure. Sci. Prog. 2021, 104, 00368504211017010. [Google Scholar] [CrossRef]
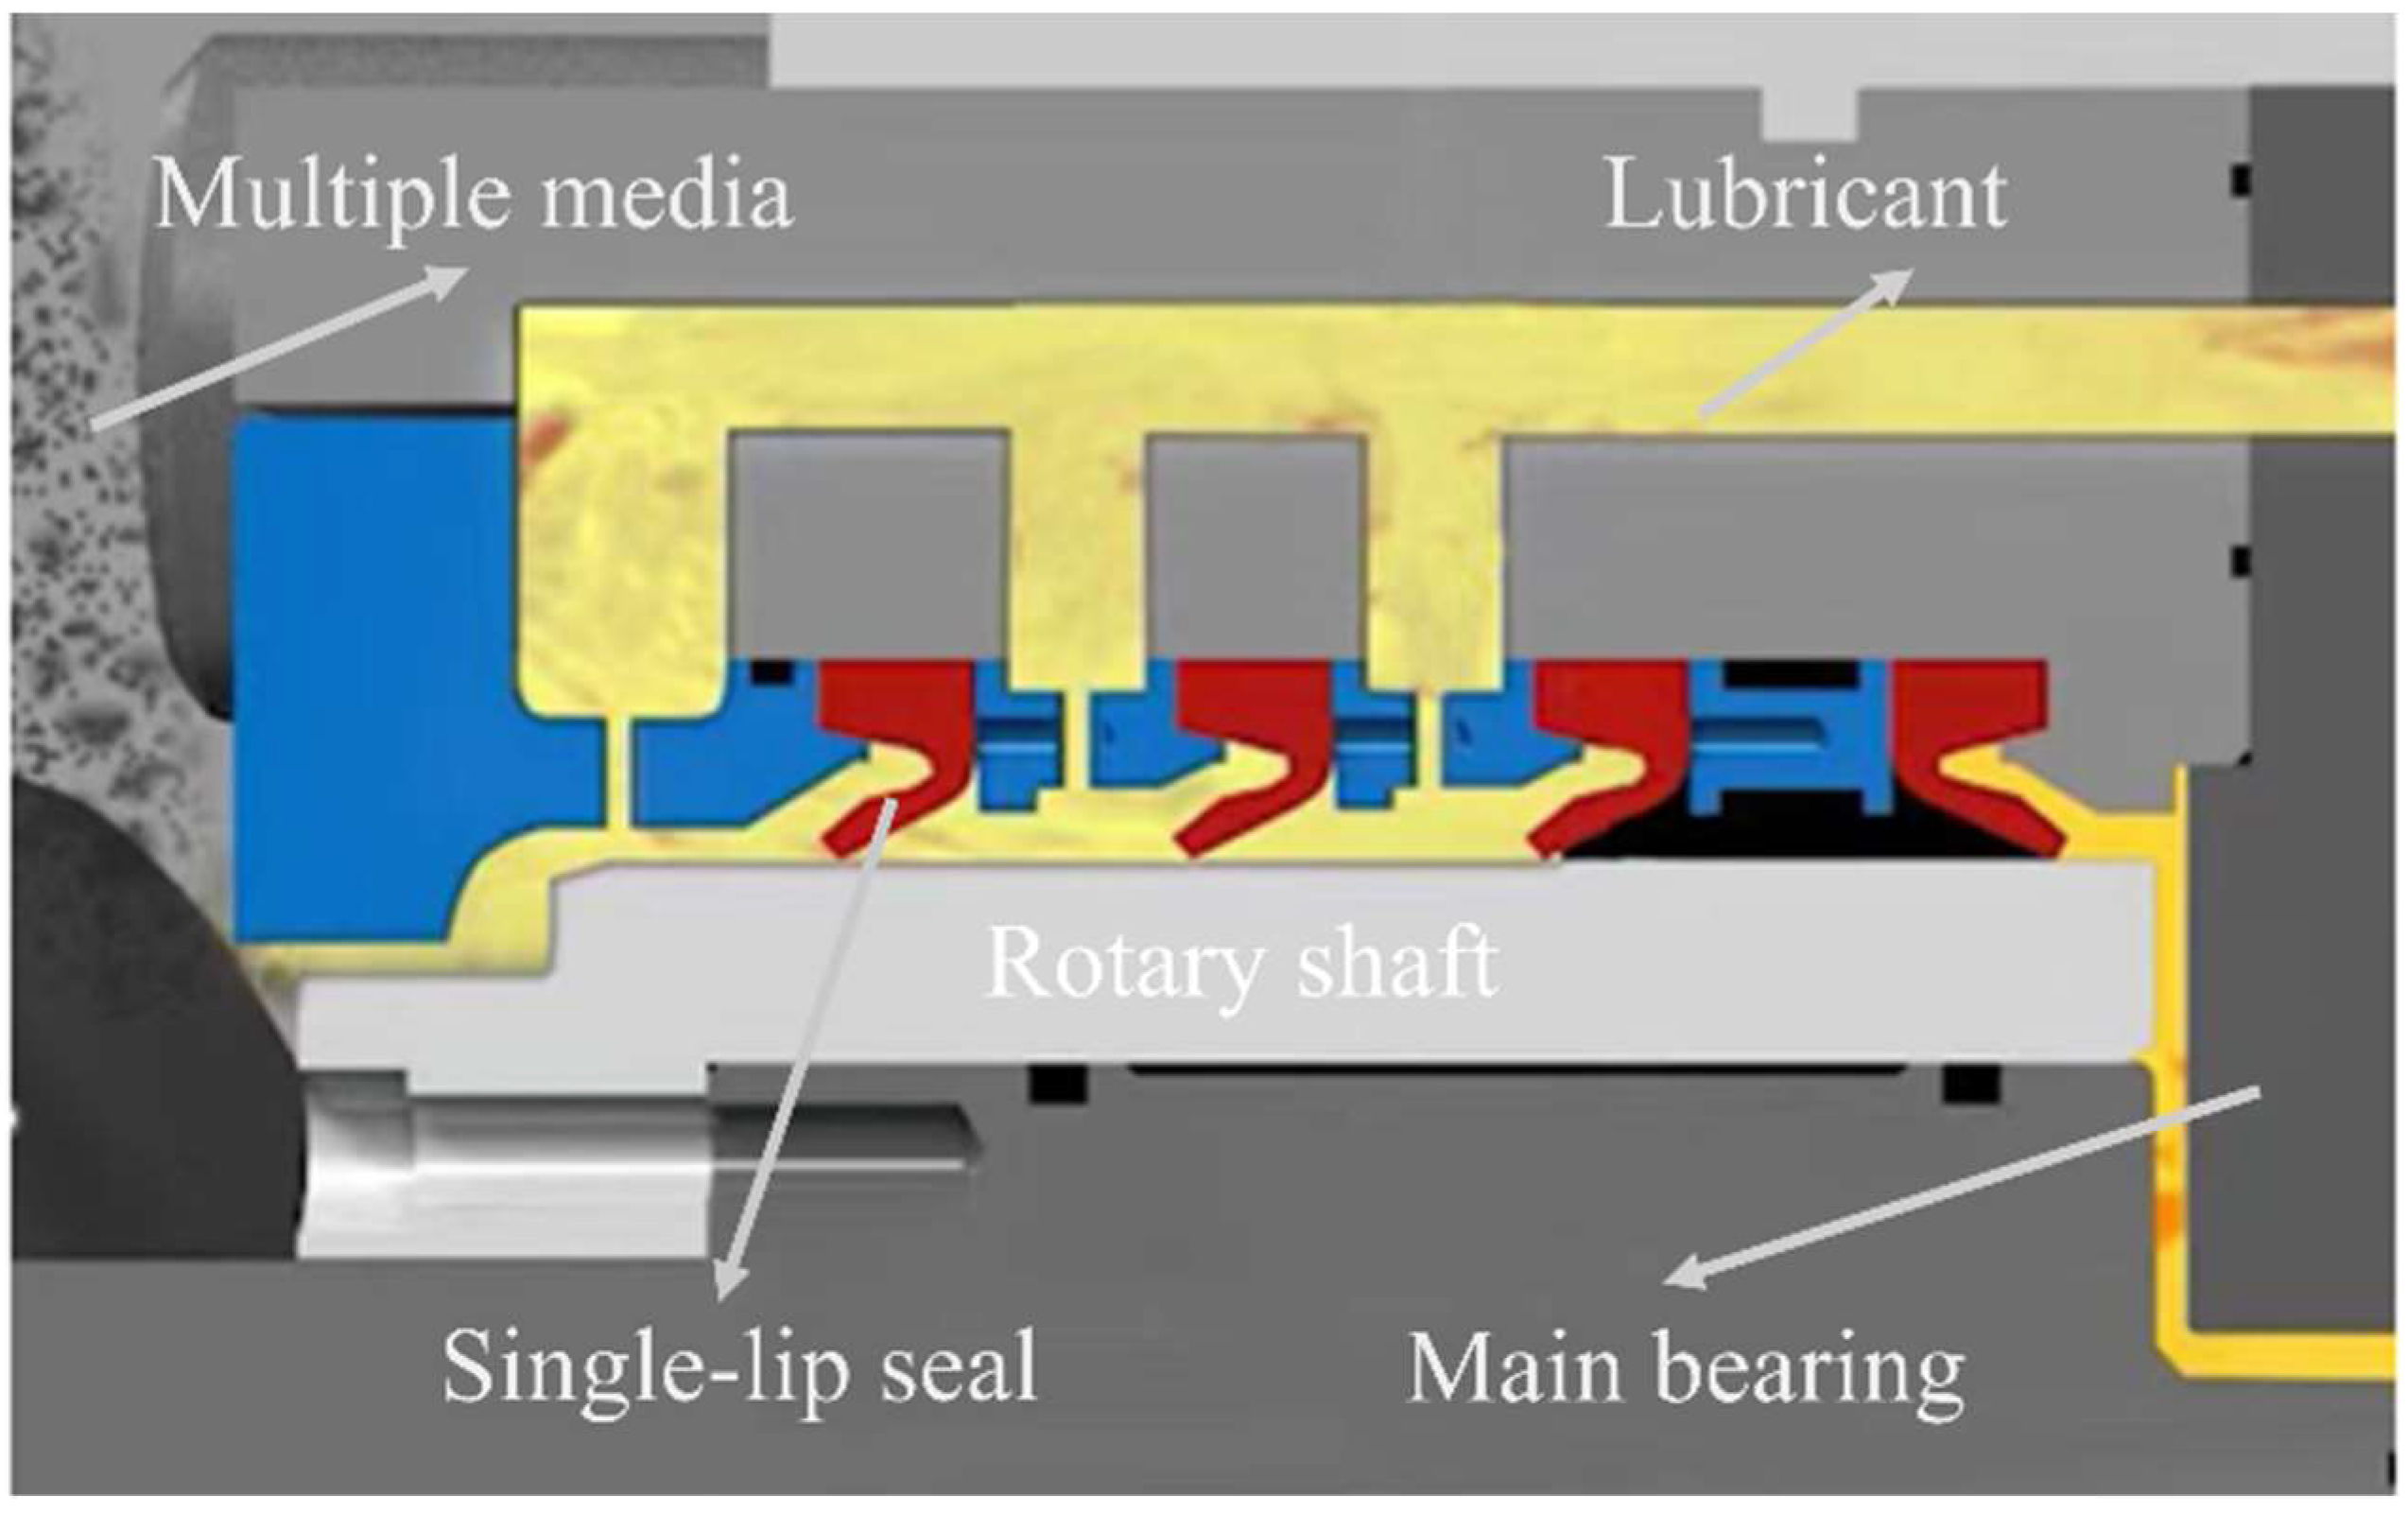
Figure 1. Schematic diagram of the main drive seal in a shield tunneling machine.
Lubricants 13 00413 g001
Figure 2. (a) Structural schematic of the rotary lip seal in the main drive of a shield tunneling machine: (b) assembly and pressure application and (c) contact zone sealing.
Lubricants 13 00413 g002
Figure 3. Sequential computational flow for the MTHL model.
Lubricants 13 00413 g003
Figure 4. Two-dimensional axisymmetric finite element model.
Lubricants 13 00413 g004
Figure 5. Effect of temperature on stress–strain behavior of nitrile rubber.
Lubricants 13 00413 g005
Figure 6. (a) Contour map of static contact pressure and (b) distribution of static contact pressure.
Lubricants 13 00413 g006
Figure 7. Validation of reverse pumping rate with rotary shaft speed, the MLM from Guo et al. (2013) [15].
Lubricants 13 00413 g007
Figure 8. Effect of velocity variation on (a) temperature and lubricant viscosity; (b) the distribution of static contact pressures; (c) the contact pressure at asperities; and (d) the thickness of the lubricant film.
Lubricants 13 00413 g008
Figure 9. Effect of velocity variation on (a) total friction; (b) shear deformation; (c) rate of reverse pumping; and (d) torque due to friction.
Lubricants 13 00413 g009
Figure 10. Influence of fluid pressure differential on (a) the distribution of static contact pressures; (b) the fluid pressure; (c) the contact pressure at asperities; and (d) the thickness of the lubricant film.
Lubricants 13 00413 g010
Figure 11. Influence of fluid pressure differential on (a) fluid viscous friction and asperity contact friction; (b) total friction; (c) sealing contact zone temperature and lubricant viscosity; and (d) friction torque.
Lubricants 13 00413 g011
Figure 12. Reverse pumping rate with different fluid pressure differentials.
Lubricants 13 00413 g012
Figure 13. The influence of the fluid pressure differential on (a) shear deformation and (b) the point of peak shear deformation relative to the lubricant side.
Lubricants 13 00413 g013
Figure 14. Flow rates generated by shear flow and pressure flow within the axial sealing contact zone with different fluid pressure differentials.
Lubricants 13 00413 g014
Table 1. Seal configuration details.
VariablesMeaningValueUnit
P o Lubricant side pressure1.0MPa
P m s Mud sand side pressure1.1MPa
P r e f Reference pressure1.0MPa
P c a v Cavitation pressure0.0MPa
V Shaft speed3m/s
f Friction coefficient0.2
E 1 Elastic modulus of the rotary shaft210GPa
v 1 Poisson’s ratio for the rotating shaft0.29
E 2 The elastic modulus for the sealing lip6.93MPa
v 2 Poisson’s ratio for the sealing lip0.499
R Radius of the rotary shaft6m
μ Lubricant viscosity0.08Pa·s
ρ Lubricant density0.89g/cm3
γ Surface topography parameters of the lip seal1/3
λ y Axial correlation length of the lip seal5μm
λ x Circumferential correlation length of the lip seal1.667μm
σ 2 The lip seal’s RMS roughness1μm
σ 1 The rotary shaft’s RMS roughness0μm
T r e f Reference temperature25°C
h c Heat transfer coefficient for the lubricant200W/(m2·K)
C o i l Specific heat capacity for the lubricant2000J/(kg·K)
α Viscosity–temperature coefficient0.024K−1
Disclaimer/Publisher’s Note: The statements, opinions and data contained in all publications are solely those of the individual author(s) and contributor(s) and not of MDPI and/or the editor(s). MDPI and/or the editor(s) disclaim responsibility for any injury to people or property resulting from any ideas, methods, instructions or products referred to in the content.