Abstract
An extensive statistical study was conducted on a 10-year dataset (2014–2023) containing the lubrication condition monitoring results from wind turbine gearboxes in the Iberian Peninsula. The dataset includes two mineral and two synthetic lubricants; all four were sampled and analyzed regularly in accordance with the ISO 14830-1 standard. This dataset comprises over 25,000 records across 24 distinct parameters, as defined by the standard maintenance procedure of lubricants in wind turbine gearboxes. To reduce dimensionality, the analysis begins with principal component analysis, followed by discussion of Spearman correlations and finishing with comparation of trends. Performance differences, correlations and typical trends will be evaluated and compared for mineral and synthetic lubricants. This data-driven study presents a significant contribution to supporting maintenance decision-making processes in wind farms. Despite the differences, P, Pb and K have been identified as having a major influence on the variance in the dataset for all the lubricants, although no significant correlations with these elements have been found. Mineral lubricants showed very few correlations between elements and lubricant parameters, with Fe as the major element to be considered. Meanwhile, synthetic lubricants showed several correlations between elements (Fe, Mn, Cu, Ba) and lubricant parameters denoting complex tribochemical reactions.
1. Introduction
The tribology of renewable energy systems represents a growing domain within the broader field of Green Tribology. Unlike other subfields that primarily focus on biomimetic approaches or environmentally eco lubricants, this area emphasizes the direct application of tribological principles to systems involved in the generation of green energy. This perspective underscores the critical role of tribological performance in enhancing the efficiency and sustainability of renewable energy technologies [1].
Wind farms represent a new, prominent form of renewable power generation and have become a common feature in present-day landscapes. According to WindEurope Association, in 2023, wind provided 19% of the net electricity generation in the EU, largely doubling their global contribution over the past decade [2].
This emergent renewable technology introduces a unique set of tribological challenges, particularly as these systems are still in the early stages of development and are subject to evolving performance requirements and specifications. Specifically, wind turbine tribology has become a well-established area of research, focusing on, e.g., mainshaft wear, gearbox bearings, erosion of blades or specifications on lubricants, amongst others [2].
In the field of machinery, condition monitoring refers to a maintenance strategy that utilizes the data obtained from the continuous monitoring of physical and chemical parameters to optimize equipment performance [3]. In the area of tribology and lubricants, this methodology is known as lubrication condition monitoring (LCM) and serves as a critical tool in predictive maintenance and early identification of equipment failure. The implementation of LCM can be categorized into three functions: detection, diagnosis and prognosis [4]. Prognosis focuses on predicting future equipment performance and the determination of the remaining functional life using historical data. In summary, LCM provides a tool for the early detection of deviations in the lubricant parameters. This facilitates timely maintenance interventions and improvements in the condition of the components [5].
The use of international standards in monitoring techniques [6] provides guidelines for industry and general requirements. However, in the case of gearboxes in wind turbines, with rotating elements in continuous contact, LCM plays a crucial role and has become a significant topic of interest [7].
Lubrication condition monitoring involves several steps based on the standard ISO 14830-1 [8] for industrial gearboxes, consisting in the collection of samples of the used oil, analysis of the lubricant parameters, interpretation of results and decision-making for the technicians involved in maintenance and diagnosis. In a review study, Wakiru et al. found that significantly 50% of research on LCM focused only on wear or elemental particles, whilst other parameters related to lubricant degradation, such as nitration or oxidation, were rarely considered [3]. The study also highlights that using hybrid analytical methods would hold great potential for the condition of the lubricant.
ISO 14830-1 outlines two approaches for conducting lubricant analysis: on-site and off-site, depending on the resources available. Off-site testing must be carried out by a specialized laboratory, with a recommended sampling interval of three months for industrial gearbox lubricants. However, due to the practical challenges of sampling in wind turbine gearboxes, it is common industry practice to extend this interval to six months. The LCM procedure includes the following categories of analysis [3]:
- Every 3 months:
- Physical and chemical lubricant properties: Viscosity at 40 °C, acid number, oxidation level by color analysis, oxidation resistance by FTIR.
- Additive analysis (Ba, B, Ca, Mg, Mo, P, Zn).
- Contamination of the lubricant: Particles count with sizes larger than 4, 6 and 14 μm, water content (by FTIR and Karl Fischer) and environment contaminant content (K, Si, Na).
- Wear of machine elements: Ferrous debris content (by PQ Index) and content of wear metal elements (Ag, Al, Cd, Cr, Cu, Fe, Mn, Ni, Pb, Sn, Ti, V).
- Exceptionally:
- Physical and chemical lubricant properties: Viscosity at 100 °C, viscosity index and aeration resistance by foam stability.
- Contamination of the lubricant: Water content by co-distillation.
- Wear of machine elements: Wear debris by filtergram and ferrous debris by ferrography and/or ferrogram.
These parameters have been investigated in detail by several authors, who analyzed a wide range of lubricant samples and discussed the relationship between the condition of the lubricants and the machinery components but usually using bench testing [9,10,11,12,13,14,15,16]. Based on the viscosity data of the oils, some authors concluded that changes in viscosity, mainly caused by contamination with other fluids, especially fuel or water, negatively affected both friction performance and component wear [13,15]. On the other hand, the quantification and elemental analysis of particles in the oils provided valuable information about the operating environment and its interaction with lubricated components. Additionally, acidity analysis data supplied details relating to the stability and efficacy of the additives present in the oils [11,17].
A key objective of ISO 14830-1 is to establish alarm thresholds that are critical for monitoring the condition and optimal performance of machinery components. These standard criteria define acceptable upper and lower limits, enabling timely corrective actions. Manufacturer recommendations and experience should be considered when setting these limits, along with the guidelines provided by the standards. In practice, two kinds of alarm level are usually defined as warning or severe.
The use of LCM for the design of robust decision-support systems has gained interest in both academia and in industry, particularly focusing on tribology, decision-making, or machinery design. Decision support in LCM-based maintenance includes statistical, machine learning, model-based and hybrid approaches. In the case of statistical models, the interpretation is based on the relationship between variables using techniques such as cluster analysis, multivariate analysis of variance (MANOVA), factor analysis and regression [18]. Statistical analysis in LCM integrates a trend analysis identifying changes over time [19,20,21,22,23,24], and correlation analysis reveals changes that occur by linking variables [25,26,27,28].
Trend analysis is mainly used to show the evolution of lubricant properties with time between consecutive samples, allowing for early detection of any deviation that can indicate incipient wear, contamination or initial degradation. However, the evolution of only one parameter is usually analyzed, with the corresponding limitation for diagnosis and the loss of information. To overcome these limitations, several properties can be plotted together and analyzed with imposed thresholds.
One of the main limitations in LCM is that the interpretation of results relies mainly on the effects of single parameters and their deviation from nominal values, while the interactions between others are not usually considered. This is where correlation analysis becomes valuable, revealing predictive relationships that enhance diagnostic accuracy, and it assists in covering the relationships between parameters helping to reveal predictive association [3]. Pearson and Spearman methods are used for normally and non-normally distributed data, respectively, despite assuming linear relationships there is a lack of multivariate analysis in depth. Pearson correlation has been used to estimate the useful lifetime of oils for diesel engines considering wear, metals content and pollutants, but interactions with other lubricants parameters are not studied [29]. To enhance diagnostic capability, some prospective studies have combined correlation with trend analysis or regression, creating hybrid approaches [29,30].
In practice, lubricant replacement is often based on service intervals or manufacturer guidelines, typically with a conservative bias. Replacing it too early wastes resources and raises costs [31], whilst delaying it increases wear and the risk of equipment failure [32]. Lubrication condition monitoring helps determine the optimal replacement timing, extending equipment life and improving efficiency. Accurate interpretation of oil analysis indicators using a new approach is essential for better informed maintenance decisions.
Typical wind turbine gearbox configurations include at least three gearing stages [1] combining planetary or epicyclic gears with parallel transmission. The resulting gear ratio is designed to transform low input rotor speeds, with typical values of 20 rpm, into the high output speeds required by the electrical generator, around 1500 rpm. Among all the wind turbine components, gearbox failures are the most expensive to repair [33], along with the generator system, which involves extended downtimes and the use of specialized cranes and equipment.
The design of wind turbine gearboxes is regulated by IEC 61400-4 standard [34], which establishes a minimum requirement of 20 years of useful lifespan. In the case of wind turbines, it has been determined that most of the gearbox failures do not start from the gears but from the bearings. More than two-thirds of failures are directly attributed to bearings, generally due to issues related to lubrication, sealing, or improper mounting [33,35]. In the case of gears, although wear and micropitting are commonly identified as failure modes, debris from steel bearings is considered the primary cause of gear damage in wind turbine gearboxes. In this context, the main surface failures identified in gearbox bearings are as follows:
- Formation of small pits or micropitting, a common failure also observed in the gears. Micropitting serves as the origin for further development of surface cracks, as a result of tangential shear stress generated by the sliding contact [36].
- Scuffing by insufficient amount of lubrication. The addition of extreme pressure additives or surface coatings are recommended for avoiding this mode of failure.
- Formation of white etching cracks. This is one of the most characteristics modes of failure in wind turbines bearings. Although it is not fully understood, it is attributed to forced damage of the bearing by external forces [37], which subsequently leads to the development of flaking, cracking and micropitting.
Several comprehensive reviews and research studies addressing tribological challenges in wind turbine gearbox lubrication are available in the literature [20,33,35,38] highlighting the multiple factors that influence these systems. Following procedures of other industries, condition monitoring has been implemented in wind turbines gearboxes to enhance reliability. Vibration-based monitoring techniques [20,39], as well as lubricant and wear debris analysis are usually applied. Online condition monitoring based on vibration analysis, with sensors that are permanently providing signal data, has proven to be one of the most effective techniques for bearing diagnosis [33].
While vibration analysis must be conducted on-site, wear debris and lubricant monitoring can be performed either on-site or off-site. Direct measurements from online systems are usually preferred due to their ability to provide real time data. Techniques such as ferrography, FTIR spectroscopy, solid state viscometry, particle counting and water content analysis have been developed for online monitoring of wind turbine gearboxes [40].
When LCM is applied to the analysis of gearbox lubricants, the main objectives are to assess lubricant quality and to detect the presence of metallic wear particles and contaminants. Additives play a critical role as antioxidants, anti-corrosion, anti-wear or extreme pressure agents [41,42]. However, water and particle contamination, additive depletion and oxidation gradually decrease the original performance of the lubricant, reducing the tribological performance of the wind turbine gearbox.
For early failure detection, wear debris from damaged bearings, also identified as a major source of gear damage, should be monitored. Lubricant cleanliness, assessed through particle counting analysis and complemented by online debris monitoring [20], can be used as indicators of the overall trend of wear debris formation. Special attention must be given to the run-in phase of wind turbine gearbox operation, as it presents the highest potential for the generation of large debris, often requiring additional oil filtration. The presence of Fe debris in the lubricant is well related to micropitting, cracks and fatigue spalling.
Water has been identified as a root cause of additive depletion, hydrolysis and oil oxidation in wind turbine lubricants [33], especially in off-shore and near-shore locations, leading to corrosion and adverse reactions with lubricant additives. Online measurements of viscosity, dielectric constant and particle filtering [43] have shown that corrosion, water and contaminants contribute significantly to lubricant degradation. Synthetic base oils and the presence of additives such as Zinc-dialkyl-dithio-phosphate, have been associated with higher water absorption. Nevertheless, synthetic lubricants based on polyalphaolefins, polyalkylene glycols, or esters have demonstrated excellent tribological performance as wind turbine gearbox lubricants in multiple studies [44,45,46,47,48,49,50,51], meeting or exceeding the performance of mineral based lubricants.
To reduce the operational and maintenance costs of wind turbines, several strategies are being explored to extend the intervals between gearbox lubricant replacements. In a recent study [38], six turbine gearboxes operating with three different commercial synthetic lubricants were monitored for up to 16 years in the longest case. The used lubricant samples were characterized both physically and chemically through continuous online measurements of viscosity, total acid number (TAN), particle counting and chemical analysis. The study found that the presence of impurities or the occurrence of corrosion phenomena had a greater impact on wear than additive depletion or viscosity variations. Nevertheless, all the lubricants demonstrated good performance after 10 years of operation.
The comparative laboratory and field aging of several synthetic and mineral lubricants used in wind turbines gearboxes was also investigated after 9 years of service [52]. In this case, continuous online measurements of the dielectric constant did not provide useful correlations with potential lubricant aging, and none of the studied oils met the minimum requirements of standard pitting tests. In off-site laboratory tests, a decrease in TAN values and an increase in Fe content were detected in a polyalphaolefin-based lubricant. Only a 30% depletion of P content was detected after 11 years of operation in a lubricant with low additive content. However, the viscosity at 40 °C of the used lubricants showed no significant changes over time.
There are several scenarios concerning lubrication that can modify the original LCM procedures: refilling with the same oil, complete replacement with a different lubricant designation, temporary installation of offline filters, change in the thermostatic valve, or repositioning of the oil sampling probe. These scenarios were studied using 30 wind turbines located in Spain [53]. Although gearbox technologies varied among turbines, the same lubricant was used in all cases. Under regular operating conditions, a continuous decrease in anti-wear additives elements (Zn, P and S) was observed. When refilling with the same lubricant, in case of leakage or sealing failure, a substantial and expected increase in the concentration of these elements was detected. Regarding the location of the oil sampling probe, it was determined that its relative position to the filter can influence particles count measurements.
This study presents a new multivariable analysis approach of a large-scale dataset from lubrication condition monitoring, based on real-use condition data of mineral and synthetic lubricants from wind turbine gearboxes. This hybrid-method approach combining trend and correlations analysis will demonstrate the potential uses of this approach, providing foundational insights for researchers and practitioners focused on maintenance and monitoring, supporting the assessment of lubricant stability and performance, focusing on the differences between the most used mineral and synthetic lubricants in this field.
2. Materials and Methods
The data used in this study was obtained from the specialized laboratory in off-site LCM that SGS Société Générale de Surveillance SA has in Cartagena (Spain). From January 2014 to December 2023, SGS was in charge of the LCM analysis of over 500 wind farms located in Spain and Portugal. They have kindly provided us with access to this database by extracting more than 48,000 records from 32 different types of lubricants, 55.88% are mineral lubricants and 44.12% are synthetic lubricants. The dataset is in accordance with ISO 14224 [54].
Scheme 1 shows the workflow followed in this study. From the 32 lubricant designations of the dataset, the two most used oils of each type, mineral and synthetic, have been selected, allowing for at least two thousand records for each lubricant. The dataset is thus reduced to 30,448 records.
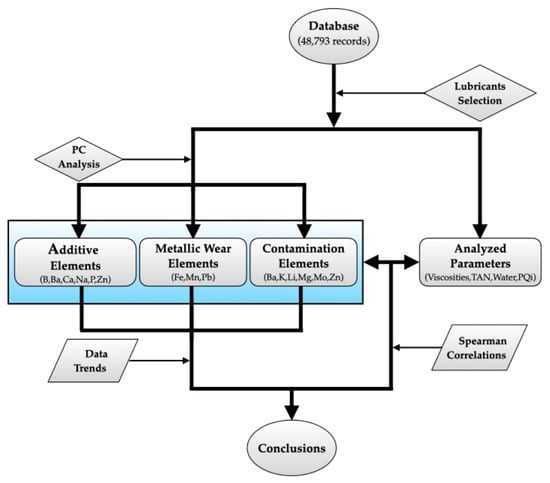
Scheme 1.
Study workflow.
From all the parameters included in a typical test suite of industrial gear oils, the following have been selected for this statistical analysis:
- Viscosity related parameters: Kinematic viscosity at 40 °C (V@40 °C), kinematic viscosity at 100 °C (V@100 °C) and viscosity index (VI).
- Total Acid Number (TAN).
- Element quantification by ICP spectroscopy of Aluminum (Al), Boron (B), Barium (Ba), Calcium (Ca), Copper (Cu), Iron (Fe), Lead (Pb), Lithium (Li), Magnesium (Mg), Manganese (Mn), Molybdenum (Mo), Phosphorus (P), Potassium (K), Sodium (Na), Silicon (Si), Sulfur (S), Tin (Sn) and Zinc (Zn).
- Water concentration by Karl Fischer method (Water).
- Ferrous particle quantification (PQ Index).
All these 24 parameters have been measured according to the specifications of standard ISO 14830-1 [8] and their corresponding specific standards: ASTM D445 [55] for kinematic viscosity, ASTM D2270 [56] for viscosity index, ASTM D664 [57] for TAN, ASTM D5185 [58] for elemental spectroscopy by ICP, ASTM D6304 [59] for water concentration and ASTM D8184 [60] for ferrous particles quantification. This selection of parameters is motivated by the availability of values in the 10-year dataset and their evaluation by numerical quantification.
One of the key points in LCM is setting adequate predefined alarm levels above which remedial actions should be taken. General guidelines are given in ISO 14830-1 that would be considered when analyzing trends in the following sections. The nominal value refers to fresh lubricant, average of data or zero depending on the parameter.
As the first step of this study, preprocessing of the selected records was performed to identify inconsistencies, noncoherent or corrupted records due to mistakes in collection, transport, storage, lubricant mixture, mislabeling, and related issues. This was performed by establishing acceptable limits for common lubricant parameters, as shown in Table 1. Considering that most of the records of the dataset were good samples, the average values (AV) of each parameter were calculated. The lower and upper limits were set based on SGS indications.

Table 1.
Threshold limits used for dataset preprocessing.
After applying these limits, 15% of the records were dismissed, reaching a final dataset of 25,814 records. In this final selection, the percentage of mineral oils samples was three times the percentage of synthetic lubricant samples (Table 2).
Table 2.
General characteristics of selected lubricants, taken from their technical data sheets.
The technical data of the selected lubricants, named as M01, M02, S01 and S02, are shown in Table 2. The general characteristics of the synthetic and mineral oils are different, except for V@40 °C, as it is a requirement to be classified as an ISO VG 320 lubricant, a specification for gearbox oils.
However, when the base oil is mineral, V@100 °C and VI are lower than when it is a polyalphaolefin, while the density is higher.
Following the same procedures as the LCM test suites, fresh samples of the four lubricants have been fully characterized by SGS laboratory. Values of the selected parameters from at least three fresh samples are shown in Table 3 and Table 4.
Table 3.
General characteristics of fresh samples obtained by analysis (mean value ± deviation).
Table 4.
Additive content of fresh samples obtained by analysis (mean value ± deviation).
Analysis of fresh samples confirmed the lower viscosity values of mineral lubricants, (Table 3). All the samples had some presence of water, around 65 ppm, but the TAN values showed large differences. M01 and M02 fresh lubricants had TAN values lower than 0.5, while fresh S01 had a value slightly higher than 1, and it was nearly 6 for fresh S02. TAN above 4 is considered potentially corrosive for metallic surfaces by ISO 14830-1. The high acid number of S02 is attributed to a higher content of additives (Table 4) related to anti-rust and anti-wear characteristics.
As shown in Table 4, besides the typical lubricant additive elements of Ca, Mo, P, S and Zn, other elements have been detected in the fresh samples (Ba, B, Cu, Si and Na) in small quantities. Significant differences can be appreciated in the additive packages:
- Mineral oils are quite similar, with P and S as the main additives as well as small quantities of Ca, Na and Zn. M01 had traces of B, while M02 showed traces of Si.
- Lubricant S01 had P and S as its main additives, with a small quantity of Si and traces of B, similar to M01 and M02.
- Meanwhile, lubricant S02 had significant quantities of Mo, P, S and Zn, as well as small quantities of Ba, Ca, Cu, Si and Na.
Once the nominal values for elemental content and lubricant parameters of fresh samples from the selected lubricants were established (Table 3 and Table 4), the statistical analysis of the field dataset, comprising 25,814 records, was carried out in several phases (Scheme 1). First, we focused on determining possible correlations between the analyzed elements and lubricant parameters (V@40 °C, V@100 °C, VI, TAN, Water and PQ Index).
As the number of elements is very high, principal component analysis (PCA) was used to reduce the number of studied elements, replacing original dimensions with a smaller number of unrelated dimensions. One of our aims was to identify relationships among the studied elements and reveal similarities between lubricants. Applying PCA to each dataset enabled us to analyze the relationships between elements for each lubricant and determine whether they exhibited similar performance patterns [61]. For this purpose, maps of m-dimensional elements are represented as k-dimensional elements (k < m). These “k” unrelated dimensions are called major or principal components (PC), revealing which elements are related to them in the components plots. Comparison of component plots showed the distinctive features of each lubricant and facilitated the identification of patterns in the data, graphically highlighting both similarities and differences [3].
Elements were grouped into the same categories used in ISO 14830-1 (additive, metallic wear and contamination elements), while also accounting for the particularities of each lubricant. PCA was applied to each category, determining the elements (or variables) with a greater influence in the variance of each lubricant dataset. Not only does this allow us to reduce the variables from 18 to a maximum of 9 but also to determine the most important or main elements for each lubricant. The large number of analyzed elements and the high probability of linear correlations among them make PCA a valuable analytical tool for the present dataset. Although other dimensionality reduction methods, such as Self-Organizing Maps (SOM), can overcome PCA limitations with nonlinear data and interpretability [3], the anticipated linear relationships, along with the easier application and visualization of PCA were the main reasons for its selection. In LCM practice, independent PCA is typically applied to non-continuous data for separating mixed signals, while dynamic PCA is recommended for datasets exhibiting cross-correlations and auto-correlation characteristics.
As datasets do not follow normal distributions, Spearman coefficients were chosen for the correlation analysis. Correlations between lubricant parameters and additive, wear, and contamination elements were assessed in real conditions of wind turbine use, and differences between each type of lubricant were detected. Correlation coefficients would be considered when they were above 0.3 in absolute values.
After analyzing the relationships, the trends of lubricant parameters and the main elements were presented using boxplot charts without the removal of outliers. Threshold limits recommended by the standard ISO 14830-1 are included in this analysis. For the four lubricants, the differences in value trends will be discussed in the following sections, as will the tendency to be out of the recommended limits.
3. Results and Discussion
This section presents the results obtained from the analysis of the 10-year dataset. All analyses, including of the content of elements, refer to the field samples of used lubricants.
The discussion is divided into two subsections, in accordance with the previously described phases of the statistical analysis:
- Section 3.1 shows the PCA reduction in variables and correlation analysis. The results for the elements considered additives, metallic wear elements or contaminants are discussed separately. After the determination of principal components (PC), relationships between the main elements of these components and the lubricant parameters are determined, allowing us to perform an easier analysis with minimal loss of information.
- Section 3.2, after the reduction in variables obtained by PCA, shows the analysis of trends, distribution of data and average values for lubricant parameters and main elements. Boxplots charts are used for this purpose. Bar plots are included to compare the tendency of different lubricants to reach values beyond the recommended limits.
3.1. PCA Reduction and Correlation Analysis
For further details, component plots for each category and Spearman correlation matrixes for each lubricant have been included in the Supplementary Information.
3.1.1. Additive Elements
The elements included in this category have been selected based on the analysis of fresh samples (Table 4). The summary of results after applying PCA to the dataset of additive elements is shown in Table 5. PC1, PC2 and PC3 in Table 5 refer to the principal components (PCs), or new variables, derived from the reduction in the original number of variables.
Table 5.
PCA results for the additive elements category.
Additive elements can be reduced to two components for M01 and S01, and to three components for M02 and S02 (Figure S1). As stated, PCA allows us to determine the element with the highest contribution to each component, establishing the element with the greatest contribution to the variance of the data. The most representative elements are highlighted in bold in Table 5.
All the lubricants had a PC1 that accounts for more than 25% of the total variance of the dataset. The elements grouped into this component vary depending on the lubricant, although P was always present and had the highest (or nearly highest) contribution. Mineral lubricants also shared S as an element of PC1. For samples M01 and M02, these two additives, P and S, showed a certain positive correlation between them (Tables S1 and S2). In the case of the synthetic lubricants, all the additives grouped into PC1 showed positive correlations between them. For lubricant S01 there was a slight correlation (Table S3) between P and Si. However, the four additives included in PC1 for lubricant S02 showed strong correlations between them (Table S4).
Major component PC2 accounted for over 19% of the variance in all cases, but the additive with the highest contribution differed for the mineral and synthetic lubricants. M01 and M02 had Ca as the most representative element, whilst S01 and S02 had B and Ba, respectively. It is interesting to highlight that B and Ba are the additives with the smallest quantities in fresh samples in each case. M01, M02 and S01 did not show any noteworthy correlations between their additives of PC2 (Tables S1–S3), but S02 (Table S4) again showed strong relationships between most of them.
It should be mentioned that the correlations involving Si with Ba, Cu and S in S02 (Table S4) were negative. In fact, there were strong positive correlations between Si and the metallic wear elements Mn and Sn. These correlations could indicate that the Si detected in S02 records was more related to environmental contamination than to additive sources. Si could be present in the lubricant as abrasive particles that would be increasing wear.
Finally, a major component PC3 was necessary for lubricants M02 and S02, with only one additive: Zn for M02 and Na for S02. Once again, the additives in small quantities had an important role in the variance of the data.
After the reduction in dimensions, the analysis of the relationships between additives and lubricant properties can be simplified to Table 6.
Table 6.
Spearman correlation coefficients for the main additive elements and lubricant parameters (extracted from Tables S1–S4).
Only a few correlations can be detected in Table 6:
- There were no significant correlations for M01, indicating that the depletion or increase in additives did not significantly affect this lubricant.
- For M02, higher values of P and Zn were moderately correlated with the decrease in the VI and the increase in TAN, respectively. Thus, a variation in additive content, especially when it increases, alters the stability of M02.
- For S01, P correlated moderately with TAN values. Higher values of the additive were related to higher acidification of the lubricant, similarly to M02.
- In lubricant S02, only Ba had moderate correlations with several properties. Lower values of Ba were related to higher water content but with lower values of the PQ Index. Therefore, the presence of Ba containing additives may inhibit the water absorption tendency of the synthetic base in S02. Regarding the PQ Index, the positive correlation observed with Ba should be interpreted as an indirect effect. Ba also had a strong positive correlation with Cu (Table S4), another of the additives of S02 (Table 4). Although Ba, as a paramagnetic element, is not expected to influence PQ Index measurements, the high electrical conductivity and diamagnetic nature of Cu may affect these measurements, leading to increased registered values. The statistical analysis of the S02 dataset revealed some interesting aspects of the complex tribochemical interactions that characterize this kind of lubricants, as will be analyzed below.
3.1.2. Metallic Wear Elements
Following the ISO 14830-1 standard, the elements Al, Cu, Fe, Mn, Pb and Sn were considered in this category for application of PCA (in the case of S02, Cu had already been considered an additive). Table 7 summarizes the results of the reduction in variables.
Table 7.
PCA results for the metallic wear elements category.
In this case, the PCA gave similar results for all the lubricants, albeit with small differences. The wear elements for mineral lubricants can be reduced to two components (Figure S2a,b):
- PC1, which groups most of the elements and accounts for over 30% of the variance. Pb is the element with the greatest influence in the variance of the dataset and with positive correlations with the other elements of the component (Tables S1 and S2).
- PC2, with a contribution of over 20% in the variance of each dataset and Fe as the main element. Also in this case, Fe was positively correlated to Mn, the other element of this component (Tables S1 and S2).
In the case of the synthetic samples, there were two different analyses (Figure S2c–f):
- S01 showed a behavior similar to that of the mineral lubricants, with a PC1 including several metallic elements that correlated positively to Pb (Table S3), the element with the highest relevance. There was another main component (PC3 in this case) with nearly 17% of influence and with Fe as the only element. However, another component (PC2) had to be added, with Mn as the element with the greatest influence. In this case, Fe and Mn were not correlated.
- For S02, Pb was also a very influential element, that was included as the only element in PC2, with nearly 26% of influence on the variance of the dataset. The rest of the metallic elements were grouped into PC1, where Mn should be considered the element with the greatest influence. In this case, Fe had very little influence in the variance of the dataset (Figure S2f).
Therefore, Pb can be considered to be one of the most representative metallic wear elements in all cases. In lubricants M01, M02 and S01, Fe was also a wear element to consider. Although the PCA did not show the relevance of Fe for S02, this will be considered due to the relevance of that element as an indicator of metallic wear. This low influence of Fe on the variance of the S02 dataset is surprising, although it may be attributed to the presence of highly effective anti-wear additives in this lubricant. These additives are typically compounds containing S, P, Zn and/or Mo [38,52] which mitigate wear through the formation of thermal and tribofilms by absorption and chemical reactions with the metallic surface. Therefore, Fe correlated more in this case with additives such as Mo or Ca (Table S4) than with the rest of the wear elements, highlighting the particular tribological behavior of S02.
For S01 and S02, Mn must be added to the relevant metal wear elements. The influence of the selected elements on the properties of the lubricants can be analyzed with the Spearman correlations shown in Table 8.
Table 8.
Spearman correlation coefficients for the main metallic wear elements and lubricant parameters (extracted from Tables S1–S4).
While Pb did not correlate with the lubricant parameters in any case, there were clear correlations with Fe:
- It was positively correlated with viscosity values and/or VI in all cases. So, the higher presence of Fe in the lubricant was somewhat related to the thickening of the lubricant, a known effect of the oxidation of the lubricant and formation of sludges due to Fe particles. This can have a secondary effect for S01 and S02 in decreasing the difference between viscosity values at low and high temperatures, increasing VI.
- In mineral lubricants M01 and M02, higher quantities of Fe can also be correlated to the acidification of the oil, attributed to the oxidation processes.
- The PCA of S02 did not identify Fe as a major contributor to the dataset variation, although strong correlations between this element and lubricant parameters are evident in Table 8. Higher Fe contents were related to higher values of viscosity and water contamination. Unlike mineral oils, higher Fe contents were associated with lower TAN values. As will be discussed later, in lubricants with high additives content, higher TAN values should not be attributed solely to acidification caused by oxidation, but rather to higher presence of additives in the samples. In S02, Fe content also correlated to lower contents of Mo and Ca additives (Table S4). This suggests that the negative relationship between Fe and TAN may be considered an indirect effect of the depletion of additives that are consumed during the formation of protective films. In other words, corrosion and oxidation processes of this lubricant did not manifest as higher TAN values, as observed in mineral oils. Instead, corrosion and oxidation processes were reflected in lower contents of specific additives and higher water contents. A schematic representation of the proposed degradation mechanism for this lubricant is provided in Scheme 2.
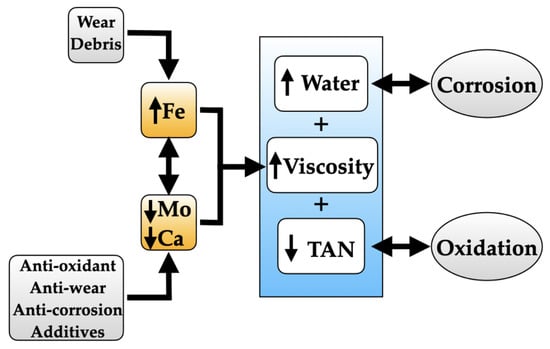 Scheme 2. Proposed degradation mechanism for S02.
In the case of synthetic lubricants, a third element, Mn, influenced the variation in the corresponding dataset:
- It correlated negatively to the PQ Index and positively to water content (Table 8), with stronger intensity in S01.
- It also correlated negatively to Cu and Ba (Tables S3 and S4), with stronger intensity in S02.
For lubricant S02, Cu and Ba are considered additives, and their correlation with PQ Index values has already been discussed. The negative correlation between the metallic wear element Mn and the additives can be explained in a similar way than negative correlations observed for Fe (Scheme 2). In the case of S01, these correlations can be associated with interactions between the synthetic lubricant and greases present in the system, pointing out that compatibility between greases and synthetic lubricants in wind turbine gearboxes is an important issue. Furthermore, absorption of water from the environment seems to have an important role in these interactions, due to the mentioned positive correlation between Mn and Water content.
3.1.3. Contamination Elements
According to ISO 14830-1, K, Si and Na should be considered contamination elements. However, to fully analyze the information contained in the dataset, the elements that have not been considered in previous categories will be considered in this one, and vice versa. As contaminants, the average concentration detected for those elements was generally very low, about 1 or 2 ppm. As will be discussed, elements with average concentrations higher than these values should not be considered contaminants.
The PCA results for each lubricant are summarized in Table 9.
Table 9.
PCA results for the contamination elements category.
As in the rest of the element categories, M01 and M02 had similar analysis results (Figure S3a–f):
- The elements included in this category were almost the same, although PCA grouped them differently (Table 9).
- The elements with the greatest influence in the variance of the dataset were Ba, K and Mo in both cases (Table 9).
- There were slight correlations between the elements grouped in each component, showing coherent results between PCA and Spearman coefficients (Tables S1 and S2).
Before analyzing PCA results for S01 (Figure S3g–l), some considerations should be taken into account. The three elements group in PC1 were detected in very high concentrations in the records of S01, and were not coherent with the definition of a contamination element:
- Mo showed an average value of 768 ± 200 ppm.
- Ca had an average value of 1510 ± 300 ppm.
- Mg was less abundant but had an average value of 6 ± 2 ppm.
Moreover, these three elements were strongly correlated with each other (Table S3), with Spearman coefficients above 0.6. With this analysis, Mo, Ca and Mg should be considered undetected additives of S01 instead of contaminants. This no detection in the fresh sample should be attributed to poor solubility of these additives in S01, giving rise to a deposition phenomenon, and a poor agitation when fresh samples were collected and analyzed.
The inclusion of these elements in the PCA of additives category for S01 did not significantly change the results shown before. The three elements were highly correlated to P, with Spearman coefficients higher than 0.58 (Table S3), so they would be included in PC1, together with P and Si. Consequently, correlations of Mo with lubricant parameters (Table 10) were similar to those observed for P (Table 6), albeit stronger.
Table 10.
Spearman correlation coefficients for the main contamination elements and lubricant parameters (extracted from Tables S1–S4).
Once the exclusion of PC1 for S01 in this category has been explained, it was observed that results for S01 had similarities with mineral lubricants: three main components with Ba, K and Zn (in this case) as the main elements to consider.
As in the previous categories, S02 exhibited a slightly different behavior, with only three elements considered environmental contaminants, grouped into two main components: PC1, containing K and B, and PC2, represented solely by Mg (Figure S3m). Both components had a great influence on the variance of the dataset. In PC1, K and B had a similar weight, so K was selected as the representative element, as in the other lubricants, along with Mg.
Significant correlations were not detected (Table 10) between any of the contamination elements and the lubricant properties for M01, M02 and S02. In the case of S01, there was a positive correlation between Ba and the PQ Index that was already discussed in the previous section and probably related to the interaction with greases.
3.2. Analysis of Trends and Alarms
For further details, dispersion plots with nominal and average values, along with corresponding thresholds limits, are provided in Figures S4–S9. Thresholds limits were strictly adopted in accordance with ISO 14830-1 recommendations. The severe and warning alarm thresholds for each studied parameter are defined in the Supplementary Information.
3.2.1. Lubricant Parameters
In the previous section, we observed several differences between mineral (M01 and M02) and synthetic (S01 and S02) lubricants, especially with S02; these will be assessed in terms of the values measured in the 10-year dataset.
Boxplots of Figure 1 show the range and distribution of the data for each lubricant parameter. The average value (light blue line) and the outlier values (black dots) are also represented.
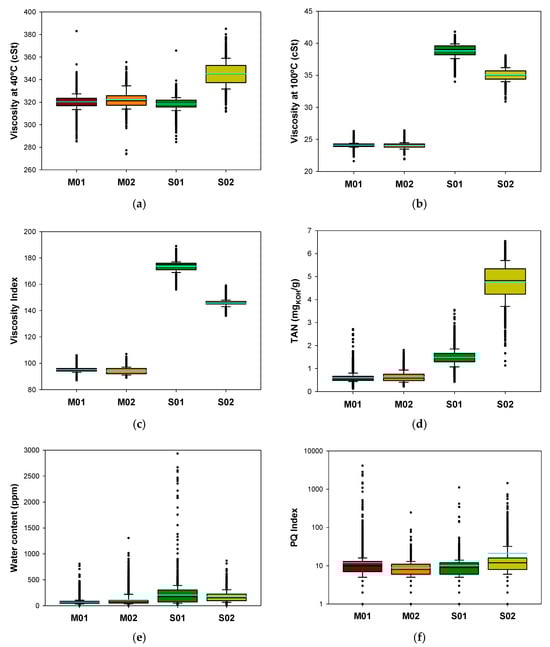
Figure 1.
Boxplots for lubricant parameters: (a) V@40 °C; (b) V@100 °C; (c) Viscosity Index; (d) TAN values; (e) Water content; (f) PQ Index (logarithmic scale). Black horizontal lines represent the median and cyan horizontal lines represent the mean.
From these plots, it is evident that M01 (dark red boxes) and M02 (orange boxes) are very similar in their physical and chemical parameters, with ranges and distributions of values that are quite similar. However, if we compare the percentage of severe alarms of each dataset (Figure 2), M02 showed higher levels than M01for all parameters, usually being the highest of the four lubricants. In our view, this should not be interpreted as indicative of inferior tribological performance, but rather as a consequence of its higher additive content and the need to review the standard thresholds values for this type of lubricant.
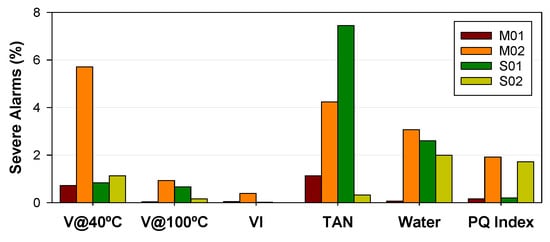
Figure 2.
Percentage of severe alarms of lubricant parameters for each dataset.
In the case of mineral lubricants, viscosity parameters V@40 °C, V@100 °C and VI were strongly corelated (Tables S1 and S2). Increases in viscosity at 40 °C were associated with increases in viscosity at 100 °C and decreases in the viscosity index. Therefore, the negative correlation found between P and the VI for M02 should be considered influential to the other viscosity parameters. Using V@40 °C as a reference, with nearly 6% of severe alarms, most of these alarms corresponded to viscosity values above the upper severe threshold (Figure S4b). Based on the previously described correlations, these higher viscosity values should be attributed to a higher concentration of extreme pressure additives containing P and S, rather than to additive depletion or lubricant degradation. This suggests that this standard threshold should be reconsidered for this type of lubricant.
Synthetic lubricant S01 (dark green boxes) showed similar trends to M01 and M02 for V@40 °C and the PQ Index (Figure 1a,f), but higher values and wider distributions for V@100 °C and VI (Figure 1b,c). Perhaps the most characteristic difference in S01 was its higher absorption of Water (Figure 1e), with the highest value and widest distribution of the dataset, but this did not cause the highest percentage of alarms (Figure 2). The highest percentage of severe water content alarms were observed for M02. Although increased water absorption had previously been associated with additives in mineral oils [43], no significant correlations were found in our dataset. For M02, the alarms appear to be linked to a specific location, as most outliers are clustered within a region of the dispersion plot (Figure S8b). However, since wind farm location data is not available in the dataset, this hypothesis cannot be confirmed.
In the case of S02, even V@40 °C (Figure 1a), the parameter that classifies the lubricant as ISO VG 320, showed a different value and a wider distribution than for the rest of the lubricants. S02 had a mean value of 345 cSt for that parameter, while the rest of the lubricants had mean values of about 320 cSt. Both V@100 °C and VI also had higher values than M01 and M02, but lower than S01.
One significant difference among the four lubricants was the range and distribution of TAN values (Figure 1d). The average value increased from M01 < M02 < S01 < S02. This same increasing trend of values was detected for P, as presented in the next section (Figure 3). TAN had a significant level of severe alarms for M02 and S01 (above 4% of their records). Although increases in TAN are usually associated with acidification due to oxidation processes by the presence of Fe debris, in the case of M02 and synthetic lubricants, TAN increases were also positively correlated with additive content. This correlation between acidification of used oils and higher content of additives is not reflected in the ISO 14830-1 recommended thresholds, leading to a high number of alarms that are not necessarily indicative of lubricant degradation.
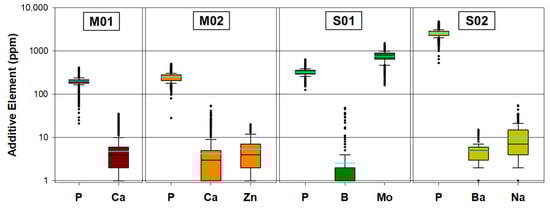
Figure 3.
Boxplots for the main additive elements of each lubricant (logarithmic scale). Black horizontal lines represent the median and cyan horizontal lines represent the mean.
The PQ Index (Figure 1f) presents outliers with very high values, the logarithmic scale of the plot showed these to be two orders of magnitude higher than the average values. S02 had higher average values than the rest of the lubricants. It was commented in Section 3.1.2 that the PQ Index did not correlate to Fe (Table 8) in the dataset, despite it being a measure of ferrous particles of the lubricant. In the case of S02, the PQ index was correlated to the small quantities of Ba added to the lubricant, which has previously been suggested indirectly affect PQ Index measurements. For M02, no correlations or trends were identified that could explain the high percentage of alarms associated with this parameter.
Despite the differences, the percentage of records with severe alarms was below 3%, with the commented exceptions (Figure 2). In the case of warning alarms for lubricant parameters (Figure S10a), the percentage of records beyond the threshold was below 40%, except for TAN in the case of M02 and S01.
3.2.2. Main Additive Elements
The additives selected as being the most representative from the PCA of Section 3.1.1 are included in the boxplots of Figure 3, with a logarithmic scale for clearer visualization. Mo has also been included in this analysis for S01.
As in the case of TAN values, P values followed the order M01 < M02 < S01 < S02. The rest of the main additives, with the exception of Mo in the S01 plot, barely reached values of 10 ppm, and outliers were always above the average value (Figure 3). In the case of S01, Mo was present in higher concentrations than P.
Severe alarms percentages were below 5% in all lubricants, except for Zn in M02 (Figure 4), an additive that correlated positively to TAN (Table 6), as discussed. In the case of M02, the higher percentage of alarms for Zn was coherent with the higher percentage of alarms for TAN in Figure 2.
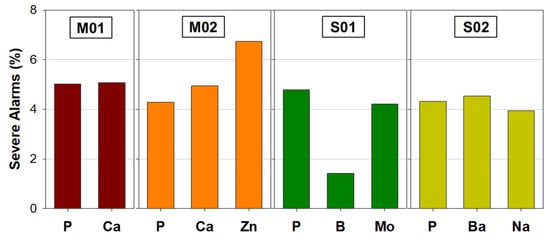
Figure 4.
Percentage of severe alarms of the main additive elements for each dataset. Black horizontal lines represent the median and cyan horizontal lines represent the mean.
Interestingly, the higher content of additives in synthetic lubricants did not lead to a higher percentage of severe alarms, although a slight increase in warning alarms was observed (Figure S10b).
3.2.3. Main Metallic Wear Elements
Figure 5 shows boxplots for the main metallic wear elements. The values and distributions were practically identical for M01 (dark red boxes) and M02 (orange boxes), denoting the similar tribological behavior of both mineral oils. S02 (light green boxes) showed slightly higher values of Fe and Pb than the mineral oils. However, S01 (dark green boxes) showed the minimum detected contents for Fe of the dataset, with an average value of 2 ppm. Although P, B and Mo, identified after PCA as the main additives in S01, did not show significant correlations with the PQ Index, other additives such as Ca, Mg and Si exhibited negative correlations with this parameter (Table S3). These elements are associated with anti-wear additives in S01 and may be responsible for the low Fe content observed.
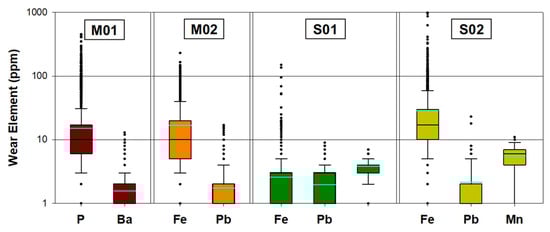
Figure 5.
Boxplots for the main metallic wear elements of each lubricant (logarithmic scale). Black horizontal lines represent the median and cyan horizontal lines represent the mean.
Higher percentages of severe alarms (Figure 6) were not usually due to Fe, except for M02, which had a value exceeding 5%. Pb and/or Mn were more commonly detected above admissible levels in M01, S01 and S02, but in no more than 6% of the records. We have commented above that for synthetic lubricants Mn seems to be part of some problem of compatibility with greases of the system. Although there was no significant increment in the percentage of severe alarms for that element, warning alarms for Mn in synthetic lubricants were above the rest (Figure S10c), reaching values of 25%, thus confirming that it is an issue to be taken into account for synthetic lubricants.
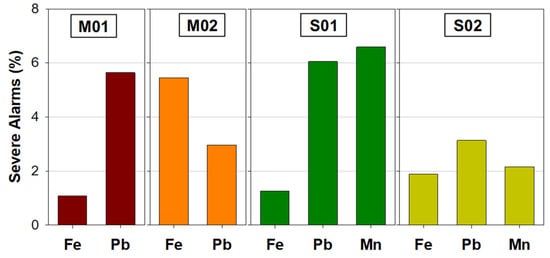
Figure 6.
Percentage of severe alarms of the main metallic wear elements for each dataset.
3.2.4. Main Contamination Elements
To conclude with this analysis of trends, boxplots of the main contamination elements are presented in Figure 7. The average values were about 5 ppm or lower in all cases. These average values are located in the higher part of the boxplots, revealing a very asymmetric distribution of data. K is the contaminant that was detected in the highest concentrations for all the lubricants, while Ba was more commonly detected in S01 than in the rest of the lubricants.
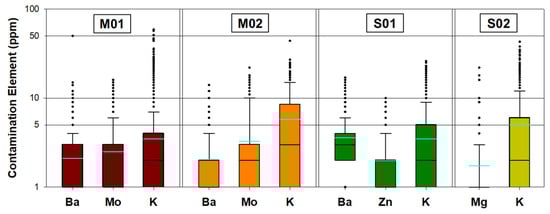
Figure 7.
Boxplots for the main contamination elements of each lubricant (logarithmic scale). Black horizontal lines represent the median and cyan horizontal lines represent the mean.
Similarly to that shown for additives and wear elements, severe alarms for the main contaminants (Figure 8) were around 5% or lower, with K as the element with the highest level of alarms in general, although no significant differences were detected among the four lubricants. The percentage of warning alarms (Figure S10d) was generally higher for contaminants than for wear elements, with S01 showing the highest percentages (above 10%).
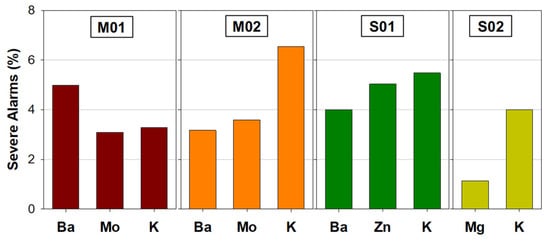
Figure 8.
Percentage of severe alarms of the main contamination elements for each dataset.
4. Conclusions
In this study, a dataset of over 25,000 records with 24 distinct tribological parameters, defined by the standard maintenance procedure of lubrication condition monitoring in wind turbine gearboxes, has been analyzed following a new multivariable analysis approach. The most used lubricants of the database, provided by a specialized laboratory, were selected: M01 and M02 as mineral lubricants, S01 and S02 as synthetic lubricants.
Despite the differences, PCA has revealed that the additive P, the metallic wear element Pb and the contaminant K have a major influence on the variance of the dataset in all cases. However, no significant correlations were found between variations in these elements and the lubricant parameters.
From the overall statistical analysis performed, clear differences in the tribological behavior of mineral and synthetic lubricants were identified:
- The mineral lubricant with a moderate content of additives (M01) was the most used lubricant. This type of lubricants is mainly affected by the presence of Fe, with no significant correlations observed between additive or other contaminants elements and the lubricant parameters. Parameters such as PQ Index and TAN proved to be reliable indicators of lubricant oxidation. When mineral lubricants with higher additive content were used (M02), operational instabilities were reflected in a greater number of alarms related to lubricant parameters and Fe content.
- Synthetic lubricants exhibited higher viscosity at 100 °C and higher viscosity index compared to mineral lubricants. They also contained a broader range and higher concentration of additive elements. They showed a greater tendency to absorb water, and correlations were found between this parameter and elements such as Ba, Fe and Mn. In this case, the PQ Index and TAN could not be directly related to lubricant oxidation but rather to variations in additive contents resulting from tribochemical reactions. Therefore, additional off-site testing methods should be incorporated into LCM protocols for synthetic lubricants. Differential scanning calorimetry (DSC) has been proposed as an effective technique to quantitatively assess oxidation-related parameters such as oxidation onset temperature (OT) and oxidation induction time (IT) [62,63,64].
Supplementary Materials
The following supporting information can be downloaded at https://www.mdpi.com/article/10.3390/lubricants13090397/s1: Figure S1: Component plots for the additive elements: (a) M01, PC1 vs. PC2; (b) M02, PC1 vs. PC2 plot; (c) M02, PC1 vs. PC3 plot; (d) M02, PC2 vs. PC3; (e) S01, PC1 vs. PC2; (f) S02, PC1 vs. PC2 plot; (g) S02, PC1 vs. PC3 plot; (h) S02, PC2 vs. PC3; Figure S2: Component plots for the metallic wear elements: (a) M01, PC1 vs. PC2 plot; (b) M02, PC1 vs. PC2 plot; (c) S01, PC1 vs. PC2 plot; (d) S01, PC1 vs. PC3 plot; (e) S01, PC2 vs. PC3; (f) S02, PC1 vs. PC2; Figure S3: Component plots for the contamination elements: (a) M01, PC1 vs. PC2 plot; (b) M01, PC1 vs. PC3 plot; (c) M01, PC2 vs. PC3; (d) M02, PC1 vs. PC2 plot; (e) M02, PC1 vs. PC3 plot; (f) M02, PC2 vs. PC3; (g) S01, PC1 vs. PC2 plot; (h) S01, PC1 vs. PC3 plot; (i) S01, PC1 vs. PC4; (j) S01, PC2 vs. PC3; (k) S01, PC2 vs. PC4; (l) S01, PC3 vs. PC4; (m) S02, PC1 vs. PC2; Figure S4: Dispersion data plots for V@40 °C: (a) M01; (b) M02; (c) S01; (d) S02; Figure S5: Dispersion data plots for V@100 °C: (a) M01; (b) M02; (c) S01; (d) S02; Figure S6: Dispersion data plots for VI: (a) M01; (b) M02; (c) S01; (d) S02; Figure S7: Dispersion data plots for TAN (a) M01; (b) M02; (c) S01; (d) S02; Figure S8: Dispersion data plots for Water Content (a) M01; (b) M02; (c) S01; (d) S02; Figure S9: Dispersion data plots for PQ Index (a) M01; (b) M02; (c) S01; (d) S02; Figure S10: Percentage of warning alarms of each dataset: (a) Lubricant parameters; (b) Main additive elements; (c) Main metallic wear elements; (d) Main contamination elements; Table S1: Spearman correlation coefficients matrix for lubricant M01; Table S2: Spearman correlation coefficients matrix for lubricant M02; Table S3: Spearman correlation coefficients matrix for lubricant S01; Table S4: Spearman correlation coefficients matrix for lubricant S02.
Author Contributions
Conceptualization, A.E.J. and H.J.B.; methodology, A.E.J., H.J.B., M.D.A. and F.J.C.-V.; investigation and data curation, A.E.J. and H.J.B.; writing—original draft preparation, A.E.J., M.D.A., I.J.M.-M. and F.J.C.-V.; writing—review and editing, all authors; funding acquisition, F.J.C.-V. All authors have read and agreed to the published version of the manuscript.
Funding
This study received funding from MCIN/AEI 10.13039/501100011033 and from the EU grant PID2021-122169NB-I00.
Data Availability Statement
Restrictions apply to the availability of these data. The data were obtained from SGS Société Générale de Surveillance SA and are available from A.E. Jiménez with the permission of SGS Société Générale de Surveillance SA.
Acknowledgments
We acknowledge the support given and the availability of the data by SGS Société Générale de Surveillance SA.
Conflicts of Interest
The authors declare no conflicts of interest. The funders had no role in the design of the study, in the collection, analyses, or interpretation of data, in the writing of the manuscript or in the decision to publish the results.
Abbreviations
The following abbreviations are used in this manuscript:
| ASTM | American Society for Testing and Materials |
| AV | Average Value |
| DSC | Differential Scanning Calorimetry |
| EHD | Elastohydrodinamic |
| EU | European Union |
| FTIR | Fourier Transform Infrared Spectroscopy |
| ICP | Inductively Coupled Plasma Mass Spectrometry |
| ISO | International Standard Organization |
| LCM | Lubrication Condition Monitoring |
| M01 | Mineral Lubricant 01 (Texaco Meropa WM 320) |
| M02 | Mineral Lubricant 02 (Shell Omala F 320) |
| MANOVA | Multivariate Analysis of Variance |
| IT | Oxidation Induction Time |
| OT | Oxidation Onset Temperature |
| PC | Principal Component |
| PCA | Principal Component Analysis |
| PQ Index | Particle Quantifier Index |
| S01 | Synthetic Lubricant 01 (Castrol Optigear Synthetic X 320 WTO) |
| S02 | Synthetic Lubricant 02 (Castrol Optigear Synthetic 1510/320) |
| SGS | Société Générale de Surveillance S.A. |
| TAN | Total Acid Number (mgKOH/g) |
| V@40 °C | Kinematic Viscosity measured at 40 °C (cSt) |
| V@100 °C | Kinematic Viscosity measured at 100 °C (cSt) |
| VG | Viscosity Grade |
| VI | Viscosity Index |
References
- Nosonovsky, M.; Bhushan, B. Green Tribology: Principles, Research Areas and Challenges. Philos. Trans. R. Soc. A Math. Phys. Eng. Sci. 2010, 368, 4677–4694. [Google Scholar] [CrossRef] [PubMed]
- Kotzalas, M.N.; Doll, G.L. Tribological Advancements for Reliable Wind Turbine Performance. Philos. Trans. R. Soc. A Math. Phys. Eng. Sci. 2010, 368, 4829–4850. [Google Scholar] [CrossRef] [PubMed]
- Wakiru, J.M.; Pintelon, L.; Muchiri, P.N.; Chemweno, P.K. A Review on Lubricant Condition Monitoring Information Analysis for Maintenance Decision Support. Mech. Syst. Signal Process. 2019, 118, 108–132. [Google Scholar] [CrossRef]
- Gertler, J. Fault Detection and Diagnosis. In Encyclopedia of Systems and Control; Baillieul, J., Samad, T., Eds.; Springer: London, UK, 2015; pp. 417–422. ISBN 978-1-4471-5058-9. [Google Scholar]
- Barker, J.; Cook, S.; Richards, P. Sodium Contamination of Diesel Fuel, Its Interaction with Fuel Additives and the Resultant Effects on Filter Plugging and Injector Fouling. SAE Int. J. Fuels Lubr. 2013, 6, 826–838. [Google Scholar] [CrossRef]
- Guillén, A.J.; González-Prida, V.; Gómez, J.F.; Crespo, A. Standards as Reference to Build a PHM-Based Solution. In Lecture Notes in Mechanical Engineering, Proceedings of the 10th World Congress on Engineering Asset Management (WCEAM 2015); Tampere, Finland, 28–30 September 2015; Koskinen, K.T., Kortelainen, H., Aaltonen, J., Uusitalo, T., Komonen, K., Mathew, J., Laitinen, J., Eds.; Springer International Publishing: Cham, Switzerland, 2016; pp. 207–214. [Google Scholar]
- Zhu, J.; He, D.; Bechhoefer, E. Survey of Lubrication Oil Condition Monitoring, Diagnostics, and Prognostics Techniques and Systems. J. Chem. Technol. 2013, 2, 100–115. [Google Scholar]
- ISO 14830-1:2019; Condition Monitoring and Diagnostics of Machine Systems—Tribology-Based Monitoring and Diagnostics—Part 1: General Requirements and Guidelines. International Organization for Standardization: Geneva, Switzerland, 2019.
- Roylance, B.J.; Hunt, T.M. The Wear Debris Analysis Handbook; Hunt, T.M., Ed.; Coxmoor Publishing Co.: Oxford, UK, 1999; ISBN 1901892026/9781901892024. [Google Scholar]
- Aucélio, R.Q.; de Souza, R.M.; de Campos, R.C.; Miekeley, N.; da Silveira, C.L.P. The Determination of Trace Metals in Lubricating Oils by Atomic Spectrometry. Spectrochim. Acta Part B At. Spectrosc. 2007, 62, 952–961. [Google Scholar] [CrossRef]
- Ahmed, N.S.; Nassar, A.M. Lubricating Oil Additives. In Tribology—Lubricants and Lubrication; Kuo, C.-H., Ed.; IntechOpen: London, UK, 2011. [Google Scholar]
- Kumar, S.; Mukherjee, P.S.; Mishra, N.M. Online Condition Monitoring of Engine Oil. Ind. Lubr. Tribol. 2005, 57, 260–267. [Google Scholar] [CrossRef]
- Mortier, R.M.; Fox, M.F.; Orszulik, S.T. Chemistry and Technology of Lubricants, 3rd ed.; Springer: Dordrecht, The Netherlands, 2010. [Google Scholar]
- Wakiru, J.; Pintelon, L.; Chemweno, P.; Muchiri, P. Analysis of Lubrication Oil Contamination by Fuel Dilu-tion with Application of Cluster Analysis. In Proceedings of the XVII International Scientific Conference on Industrial Systems, Novi Sad, Serbia, 4–6 October 2017; pp. 252–257. [Google Scholar]
- Yakubov, M.R.; Milordov, D.V.; Yakubova, S.G.; Borisov, D.N.; Ivanov, V.T.; Sinyashin, K.O. Concentrations of Vanadium and Nickel and Their Ratio in Heavy Oil Asphaltenes. Petrol. Chem. 2016, 56, 16–20. [Google Scholar] [CrossRef]
- Langfitt, Q.; Haselbach, L. Coupled Oil Analysis Trending and Life-Cycle Cost Analysis for Vessel Oil-Change Interval Decisions. J. Mar. Eng. Technol. 2016, 15, 1–8. [Google Scholar] [CrossRef]
- Kučera, M.; Kopčanová, S.; Sejkorová, M. Lubricant Analysis as the Most Useful Tool in the Proactive Maintenance Philosophies of Machinery and Its Components. Manag. Syst. Prod. Eng. 2020, 28, 196–201. [Google Scholar] [CrossRef]
- Sharma, S. Applied Multivariate Techniques; John Wiley & Sons, Inc.: New York, NY, USA, 1995; ISBN 0471310646. [Google Scholar]
- Lahijani, J.; Lockwood, F.E.; Klaus, E.E. The Influence of Metals on Sludge Formation. ASLE Trans. 1982, 25, 25–32. [Google Scholar] [CrossRef]
- Sheng, S. Monitoring of Wind Turbine Gearbox Condition through Oil and Wear Debris Analysis: A Full-Scale Testing Perspective. Tribol. Trans. 2016, 59, 149–162. [Google Scholar] [CrossRef]
- Lukas, M.; Anderson, D.P. Machine and Lubricant Condition Monitoring for Extended Equipment Lifetimes and Predictive Maintenance. In Proceedings of the 10th International Congress and Exhibition on Condition Monitoring and Diagnostic Engineering Management, Espoo, Finland, 9–11 June 1997; pp. 161–170. [Google Scholar]
- Ameye, J.; Kauffman, R.E. Lubricant Health Monitoring Programs—A Proactive Approach to Increase Equipment Availability. In Proceedings of the 2005 SAE Commercial Vehicle Engineering Conference, Rosemont, IL, USA, 1–3 November 2005. [Google Scholar]
- Perić, S.; Nedić, B.; Grkić, A. Applicative Monitoring of Vehicles Engine Oil. Tribol. Ind. 2014, 36, 308–315. [Google Scholar]
- Perić, S.; Nedić, B.; Trifković, D.; Vuruna, M. An Experimental Study of the Tribological Characteristics of Engine and Gear Transmission Oils. J. Mech. Eng. 2013, 59, 443–450. [Google Scholar] [CrossRef]
- Thapliyal, P.; Thakre, G.D. Correlation Study of Physicochemical, Rheological, and Tribological Parameters of Engine Oils. Adv. Tribol. 2017, 1257607. [Google Scholar] [CrossRef]
- Ebersbach, S.; Peng, Z.; Kessissoglou, N. Smart Condition Monitoring by Integration of Vibration, Oil and Wear Particle Analysis. In Proceedings of the 14th International Congress on Sound and Vibration (CSV14 2007), Cairns, Australia, 9–12 July 2007. [Google Scholar]
- Vališ, D.; Žák, L. Approaches in Correlation Analysis and Application on Oil Field Data. Appl. Mech. Mater. 2016, 841, 77–82. [Google Scholar] [CrossRef]
- Bassbasi, M.; Hafid, A.; Platikanov, S.; Tauler, R.; Oussama, A. Study of Motor Oil Adulteration by Infrared Spectroscopy and Chemometrics Methods. Fuel 2013, 104, 798–804. [Google Scholar] [CrossRef]
- Adnani, S.A.; Hashemi, S.J.; Shooshtari, A.; Attar, M.M. The Initial Estimate of the Useful Lifetime of the Oil in Diesel Engines Using Oil Analysis. Tribol. Ind. 2013, 35, 61–68. [Google Scholar]
- Prabhakaran, A.; Jagga, C.R. Condition Monitoring of Steam Turbine-Generator Through Contamination Analysis of Used Lubricating Oil. Tribol. Int. 1999, 32, 145–152. [Google Scholar] [CrossRef]
- Agocs, A.; Nagy, A.L.; Tabakov, Z.; Perger, J.; Rohde-Brandenburger, J.; Schandl, M.; Besser, C.; Dörr, N. Comprehensive Assessment of Oil Degradation Patterns in Petrol and Diesel Engines Observed in a Field Test with Passenger Cars—Conventional Oil Analysis and Fuel Dilution. Tribol. Int. 2021, 161, 107079. [Google Scholar] [CrossRef]
- Heredia-Cancino, J.A.; Ramezani, M.; Álvarez-Ramos, M.E. Effect of Degradation on Tribological Performance of Engine Lubricants at Elevated Temperatures. Tribol. Int. 2018, 124, 230–237. [Google Scholar] [CrossRef]
- Dhanola, A.; Garg, H.C. Tribological challenges and advancements in wind turbine bearings: A review. Eng. Fail. Anal. 2020, 118, 104885. [Google Scholar] [CrossRef]
- IEC 61400-4:2025; Wind Energy Generation Systems—Part 4: Design Requirements for Wind Turbine Gearboxes. International Electrotechnical Commission: Geneva, Switzerland, 2025.
- Kenworthy, J.; Hart, E.; Stirling, J.; Stock, A.; Keller, J.; Guo, Y.; Brasseur, J.; Evans, R. Wind turbine main bearing rating lives as determined by IEC 61400-1 and ISO 281: A critical review and exploratory case study. Wind Energy 2024, 27, 179–197. [Google Scholar] [CrossRef]
- Morales-Espejel, G.E.; Brizmer, V. Micropitting Modelling in Rolling–Sliding Contacts: Application to Rolling Bearings. Tribol. Trans. 2011, 54, 625–643. [Google Scholar] [CrossRef]
- Peng, H.; Zhang, H.; Fan, Y.; Shangguan, L.; Yang, Y. A Review of Research on Wind Turbine Bearings’ Failure Analysis and Fault Diagnosis. Lubricants 2023, 11, 14. [Google Scholar] [CrossRef]
- Liu, M.; Bayer, G.; Reimers, M.; Schünemann, W.; König, F.; Jacobs, G.; Schelenz, R.; Bader, N.; Poll, G.; Marian, M. Towards lifetime lubrication of wind turbine gearboxes: Technical and physical investigations on used oils. Wear 2025, 571, 205760. [Google Scholar] [CrossRef]
- Kumar, A.; Gandhi, C.P.; Zhou, Y.; Kumar, R.; Xiang, J. Latest developments in gear defect diagnosis and prognosis: A review. Measurement 2020, 158, 107735. [Google Scholar] [CrossRef]
- Yang, W.; Tavner, P.J.; Crabtree, C.J.; Feng, Y.; Qiu, Y. Wind turbine condition monitoring: Technical and commercial challenges. Wind Energy 2014, 17, 673–693. [Google Scholar] [CrossRef]
- Hamilton, A.; Quail, F. Detailed State of the Art Review for the Different On-Line/In-Line Oil Analysis Techniques in Context of Wind Turbine Gearboxes. In Proceedings of the ASME 2011 Turbo Expo: Turbine Technical Conference and Exposition, Vancouver, BC, Canada, 6–10 June 2011; pp. 971–988. [Google Scholar] [CrossRef]
- Kr Singh, D.; Kurien, J.; Villayamore, A. Study and analysis of wind turbine gearbox lubrication failure and its mitigation process. Mater. Today Proc. 2021, 44, 3976–3983. [Google Scholar] [CrossRef]
- Zhu, J.; Yoon, J.M.; He, D.; Bechhoefer, E. Online particle-contaminated lubrication oil condition monitoring and remaining useful life predictions for wind turbines. Wind Energy 2015, 18, 1131–1149. [Google Scholar] [CrossRef]
- Mia, S.; Mizukami, S.; Fukuda, R.; Morita, S.; Ohno, N. High-pressure behavior and tribological properties of wind turbine gear oil. J. Mech. Sci. Technol. 2010, 24, 111–114. [Google Scholar] [CrossRef]
- Greaves, M. Pressure viscosity coefficients and traction properties of synthetic lubricants for wind turbine gear systems. Lubr. Sci. 2012, 24, 75–83. [Google Scholar] [CrossRef]
- Fernandes, C.M.C.G.; Martins, R.C.; Seabra, J.H.O. Friction torque of thrust ball bearings lubricated with wind turbine gear oils. Tribol. Int. 2013, 58, 47–54. [Google Scholar] [CrossRef]
- Fernandes, C.M.C.G.; Martins, R.C.; Seabra, J.H.O. Friction torque of cylindrical roller thrust bearings lubricated with wind turbine gear oils. Tribol. Int. 2013, 59, 121–128. [Google Scholar] [CrossRef]
- Fernandes, C.M.C.G.; Amaro, P.M.P.; Martins, R.C.; Seabra, J.H.O. Torque loss in thrust ball bearings lubricated with wind turbine gear oils at constant temperature. Tribol. Int. 2013, 66, 194–202. [Google Scholar] [CrossRef]
- Fernandes, C.M.C.G.; Amaro, P.M.P.; Martins, R.C.; Seabra, J.H.O. Torque loss in cylindrical roller thrust bearings lubricated with wind turbine gear oils at constant temperature. Tribol. Int. 2013, 67, 72–80. [Google Scholar] [CrossRef]
- Goncalves, D.E.P.; Fernandes, C.M.C.G.; Martins, R.C.M.; Seabra, J.H.O. Torque loss in a gearbox lubricated with wind turbine gear oils. Lubr. Sci. 2013, 25, 297–311. [Google Scholar] [CrossRef]
- Martins, R.C.; Fernandes, C.M.C.G.; Seabra, J.H.O. Evaluation of bearing, gears and gearboxes performance with different wind turbine gear oils. Friction 2015, 3, 275–286. [Google Scholar] [CrossRef]
- Coronado, D.; Wenske, J. Monitoring the Oil of Wind-Turbine Gearboxes: Main Degradation Indicators and Detection Methods. Machines 2018, 6, 25. [Google Scholar] [CrossRef]
- del Álamo, J.R.; Duran, M.J.; Muñoz, F.J. Analysis of the Gearbox Oil Maintenance Procedures in Wind Energy. Energies 2020, 13, 3414. [Google Scholar] [CrossRef]
- ISO 14224:2016; Petroleum, Petrochemical and Natural Gas Industries—Collection and Exchange of Reliability and Maintenance Data for Equipment. International Organization for Standardization: Geneva, Switzerland, 2016.
- ASTM D445-24; Standard Test Method for Kinematic Viscosity of Transparent and Opaque Liquids (and Calculation of Dynamic Viscosity). ASTM International: West Conshohocken, PA, USA, 2024.
- ASTM D2270-10R16; Standard Practice for Calculating Viscosity Index from Kinematic Viscosity at 40 °C and 100 °C. ASTM International: West Conshohocken, PA, USA, 2016.
- ASTM D664-24; Standard Test Method for Acid Number of Petroleum Products by Potentiometric Titration. ASTM International: West Conshohocken, PA, USA, 2024.
- ASTM D5185-18; Standard Test Method for Multielement Determination of Used and Unused Lubricating Oils and Base Oils by Inductively Coupled Plasma Atomic Emission Spectrometry (ICP-AES). ASTM International: West Conshohocken, PA, USA, 2018.
- ASTM D6304-20; Standard Test Method for Determination of Water in Petroleum Products, Lubricating Oils, and Additives by Coulometric Karl Fischer Titration. ASTM International: West Conshohocken, PA, USA, 2020.
- ASTM D8184-18; Standard Test Method for Ferrous Wear Debris Monitoring in In-Service Fluids Using a Particle Quantifier Instrument. ASTM International: West Conshohocken, PA, USA, 2018.
- Hnilicová, M.; Turis, J.; Hnilica, R. Application of Multidimensional Statistical Analysis in Tribotechnical Diagnostics of Hydraulic Fluids in Woodworking Equipment. Materials 2021, 14, 4628. [Google Scholar] [CrossRef]
- Hu, J.Q.; Wei, X.Y.; Dai, G.L.; Fei, Y.W.; Liu, C.C.; Zong, Z.M.; Yao, J.B. Synergistic antioxidation of organic molybdenum complex with dithiocarbamate antioxidant evaluated by differential scanning calorimetry and thin film micro oxidation test. Thermochim. Acta 2007, 453, 21–26. [Google Scholar] [CrossRef]
- Nath, A.R.; Yehye, W.A.; Zulkifli, N.W.M.; Johan, M.R. Ester of thiolated butylated hydroxytoluene: Potential antioxidant for synthetic lubricant oil. Thermochim. Acta 2018, 670, 7–12. [Google Scholar] [CrossRef]
- Xia, D.; Wang, Y.; Liu, H.; Yan, J.; Lin, H.; Han, S. Research Progress of Antioxidant Additives for Lubricating Oils. Lubricants 2024, 12, 115. [Google Scholar] [CrossRef]


Disclaimer/Publisher’s Note: The statements, opinions and data contained in all publications are solely those of the individual author(s) and contributor(s) and not of MDPI and/or the editor(s). MDPI and/or the editor(s) disclaim responsibility for any injury to people or property resulting from any ideas, methods, instructions or products referred to in the content. |
© 2025 by the authors. Licensee MDPI, Basel, Switzerland. This article is an open access article distributed under the terms and conditions of the Creative Commons Attribution (CC BY) license (https://creativecommons.org/licenses/by/4.0/).