Abstract
Cu–graphite composites are widely used in pantograph sliders and crane brushes. Conventional sintering protocols, however, mandate processing temperatures above 860 °C with prolonged holding periods, which inevitably introduce defects within copper matrices. Drawing inspiration from ultrasonic machining, this study presents an innovative ultrasonic-assisted hot-press sintering (UAHP) technique. Using this novel method, Cu–graphite composites with graphite contents ranging from 0 to 30 vol.% were fabricated at a reduced temperature of 700 °C and a short holding time of 10 min, achieving a ca. 160 °C reduction in densification temperature. Aside from the high densification efficiency, enhanced mechanical properties were also obtained for UAHP-sintered Cu–graphite composites. The Cu–15 vol.% graphite composite exhibited a yield strength of 232 MPa, showing only a 7.2% decrease compared to pure Cu. The friction coefficient decreased with increasing graphite content, reaching a plateau value of 0.140 at 15 vol.% graphite, representing a 77.16% reduction compared to pure Cu. The wear rate initially decreased but gradually increased with the increase in graphite content. The superior tribological performance is attributed to the insitu-formed graphite lubricating film, while the primary wear mechanisms are deemed to be oxidative and abrasive wear. The ultrasonic vibration provides additional sintering driving force and enhances elemental diffusion, establishing UAHP as an innovative technical route for fabricating composites with an optimized microstructure and superior comprehensive properties.
1. Introduction
High electrical and thermal conductivity as well as chemical stability make copper ideal for use in heat exchangers, electrical switches, welding and electrical discharge machining electrodes [1,2]. However, its poor tribological properties and high density limit its applications in conductive and tribologically demanding environments. Incorporation of graphite as a secondary phase (in so-called Cu–graphite composites) has been proven to significantly improve the tribological performance of copper and concurrently reduce its density. It has come to light that Cu–graphite composites exhibit high electrical conductivity, good thermal conductivity, low thermal expansion coefficients, low friction coefficients and self-lubricating capabilities [3,4,5,6]. Owing to the aforementioned superior properties, Cu–graphite composites serve as essential components in brushes for starters or welding machines and sliding parts of pantographs for trains [1,2,3,4,5,6]. However, due to the poor affinity of graphite to Cu, effective interface bonding cannot be obtained [7]. Furthermore, their significant density disparity usually causes non-uniform dispersion of graphite in Cu matrices during mechanical mixing and pronounced agglomeration during sintering. These challenges critically influence the mechanical properties and tribological performance of Cu–graphite composites [8,9]. Consequently, developing novel fabrication techniques, including mixing and sintering, is essential to achieve uniform-microstructure and high-performance Cu–graphite composites.
To achieve homogenous mixing, many efforts have been made. One of the most effective methods is to use Cu-coated graphite powder as a starting material. The main advantage of using Cu-coated graphite powder is that the density disparity is reduced compared to utilizing Cu and graphite powders as starting materials. For example, by employing Cu-coated graphite powder as a starting material, Moustafa et al. [8] dispersed graphite uniformly into a Cu matrix and achieved a significant reduction in the friction coefficient. Using Cu-coated graphite powders with varying particle sizes as raw materials, Zhang et al. [4] fabricated Cu–graphite composites with improved bending strength. They also revealed that by using larger graphite flakes the friction coefficient and the wear rate were reduced. On the other hand, to obtain dense Cu–graphite composites, Kováčik et al. [9] employed hot isostatic pressing (HIP) sintering to fabricate Cu matrix composites with graphite in a wide content range (0–50 vol.%), establishing the fundamental relationship between graphite content and friction coefficient evolution. However, their work primarily focused on graphite content effects, while the critical influence of processing parameters on material performance has seldom been studied. To establish processing–microstructure–property relations, Nayak et al. [10] systematically investigated the effects of ball milling time, sintering temperature and holding time on the densification of Cu–graphite composites. The results revealed that the optimum preparation conditions were ball milling for 5 h, a sintering temperature of 1000 °C and a holding time of 1 h. Such a high processing temperature (approaching the melting point of Cu) with a prolonged dwell time, however, induced detrimental microstructural evolution in the Cu matrix, such as grain coarsening, surface oxidation and increased porosity. These processing-induced defects pose significant challenges to simultaneously satisfying all the aforementioned high-performance requirements of Cu–graphite composites. Thus, developing a novel sintering technique for preparing Cu–graphite composites at lower temperatures is appealing.
Ultrasonic-assisted powder consolidation/sintering represents an innovative low-temperature rapid fabrication technology. The pioneering work by Pokryshev and Marchenko [11] first demonstrated ultrasonic-assisted hot-press sintering of iron powders, achieving a remarkable 100–150 °C reduction in hot-press sintering temperature. Abedini et al. [12] employed ultrasonic-assisted hot-press sintering to fabricate a Ti-6Al-4V alloy, showing superior efficiency compared to hot isostatic pressing (HIP) sintering. The sintering conditions were 950 °C (250 °C lower than HIP) and 30 MPa (70 MPa lower than HIP), and the holding time was only 10 min. Inspired by these results, copper [13], bronze [14], Mg15Nb3Zn1Ca [15], Al [16], Ti [17] and Ag [18] have been successfully prepared up to now by the ultrasonic-assisted powder consolidation method. Nevertheless, in the literature, the research on ultrasonic-assisted sintering is focused predominantly on metallic materials, with limited exploration in other material domains. It has come to light that metal matrix composites (MMCs) with a unique combination of light weight and superior properties are usually difficult to fabricate using conventional densification techniques [19]. Since ultrasonic-assisted hot-press sintering excels with a low sintering temperature and a short holding time, this novel method was selected to prepare Cu–graphite composites with the aim of reducing the densification temperature and simultaneously improving the mechanical and tribological properties.
To address the drawbacks of the high processing temperatures of conventional sintering methods, in this work, ultrasonic-assisted hot-press sintering (UAHP) was used to fabricate Cu–graphite composites. The main difference between UAHP and conventional hot pressing (HP) is that ultrasonic vibration is applied in UAHP during the hot-pressing process. Through the application of ultrasonic vibration, the true contact surface can be decreased, the friction coefficient can be reduced, the friction vector can be altered and thermal softening can be induced such that during powder compaction, ultrasonic vibration efficiently enhances particle rearrangement, decreases interparticle friction and reduces the friction between powders and die walls, thereby improving the compact density and material homogeneity. In addition, the yield and flow stress of materials can be reduced under ultrasonic vibration by stress superposition and acoustic softening. Thus, UAHP is a novel method which has the advantages of high densification efficiency and a lower densification temperature, as well as the uniform microstructure and superior mechanical properties of the as-prepared materials. In order to ensure homogeneous mixing, Cu-coated graphite powders and pure Cu powders were used as starting materials. The electrical, mechanical and tribological properties of Cu–graphite composites fabricated via UAHP were systematically investigated. As we will show in later sections, a significant reduction in the sintering temperature (160 °C) was achieved using this novel UAHP technique. Furthermore, the Cu–graphite composites prepared by this novel UAHP technique exhibit both high strength and good tribological properties. The mechanisms for promoting material densification by UAHP and those underpinning the enhanced properties will be discussed based on the microstructure analysis. This work not only helps to further broaden the application fields of UAHP but also opens a new avenue to reduce the sintering temperature and improve the mechanical and tribological properties of MMCs.
2. Materials and Methods
Cu-coated graphite powders and Cu powders were selected as raw materials to minimize the density difference between Cu and graphite and improve the interfacial bonding between graphite and Cu, ensuring homogenous distribution of graphite within the Cu matrix. The Cu-coated graphite powders (50 wt.% copper content, which were prepared by the electrochemical deposition method, as claimed by the manufacturer, and the density of which was 3.54 g/cm3) were purchased from NangongJinnuo Welding Materials Co., Ltd., Nangong, China, while electrolytic copper powders (99% purity) were purchased from Shanghai Yunfu Nanotechnology Co., Ltd., Shanghai, China. To systematically investigate the effect of graphite content on the densification behavior and properties, six different volume fractions of graphite (ranging from 5 to 30 vol.%) were chosen, with pure Cu samples prepared under identical processing conditions for comparison (as shown in Table 1). As shown schematically in Figure 1, the powder mixtures were mechanically blended by dry ball milling (horizontal ball mill: GM/B-3; Jintong General Machinery Co., Ltd., Xianyang, China) for 5 h and then were loaded into graphite dies. To obtain near fully dense Cu–graphite composites, a two-stage ultrasonic-assisted process was utilized in an ultrasonic-assisted hot-press sintering furnace (UHP-5T-H-G-18-MIN; Shanghai Chenhua Science and Technology Co., Ltd., Huzhou, Zhejiang, China). In the first step, ultrasonic vibration (with an ultrasonic frequency of 20 kHz, an ultrasonic amplitude of ~15 μm and an ultrasonic power of 600 W) was applied at room temperature under a 30 MPa pressure for 10 min. In the second step, sintering was conducted at 700 °C for 10 min under a 30 MPa uniaxial pressure, with continuous ultrasonic excitation maintained throughout the holding stage. For comparison, Cu–graphite composites with the same compositions were prepared by the single-step ultrasonic-assisted process, i.e., the ultrasonic wave was only applied at 700 °C during the holding stage with other preparation parameters unchanged.

Table 1.
Designed compositions of the Cu–graphite composites in this work.
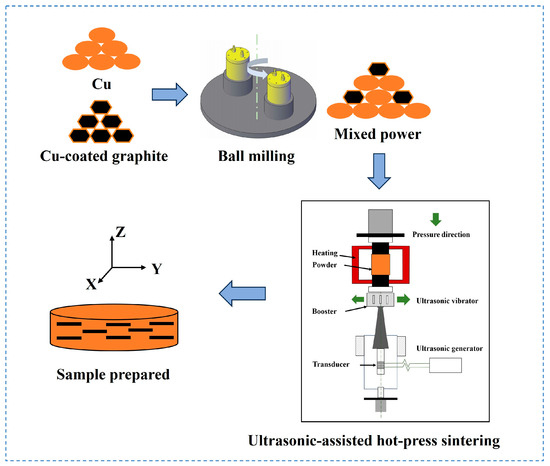
Figure 1.
Schematic process for the preparation of Cu–graphite composites by UAHP. Cartesian coordinates are marked in the figure such that the alignment of graphite flakes can be visualized. The schematic diagram of UAHP was shown in the lower right part of the figure.
The density of the as-prepared samples was measured using the Archimedes method. Phase identification was conducted in an X-ray diffractometer (XRD; Rigaku Ultima IV, Tokyo, Japan) using Cu Kα radiation (λ = 1.5406 Å) with a step size of 0.02° at a scanning rate of 1°/min. The distribution of graphite in the Cu matrix and the microstructure of the composites were observed using a scanning electron microscope (SEM; JSM-7001F, Tokyo, Japan). The room-temperature (25 °C) resistivity was measured using the standard four-point probe method (RTS 5000; Zhengzhou Dufu Instrument Factory, Zhenghou, China). Each sample was tested at least three times. The Vickers hardness of the composites was measured using a microhardness tester (HVS-1000M; Yanrun Guangji Technology Co., Ltd., Shanghai, China). At least 10 measurements were made in each sample to determine the microhardness (with a dwell time of 15 s and an applied load of 4.9 N). For flexural strength measurement, the as-fabricated Cu–graphite composites were sectioned into rectangular bars (3 × 4 × 40 mm). The tensile surface of the bars was mechanically polished. Three-point bending tests were conducted using a universal testing machine (LD23. 503; Lishi Instrument Co., Ltd., Shanghai, China) at a constant crosshead speed of 0.5 mm/min to evaluate flexural strength. The fracture surfaces of specimens were observed by SEM.
Tribological tests were conducted using a pin-on-disc tribometer (GHT-1000E; Zhongkekaihua Science and Technology Co., Ltd., Lanzhou, China) under dry sliding conditions (ambient air at 20 °C, 16% RH). The composite specimens (Φ10 × 3 mm) were ground to a surface roughness (Ra) below 0.2 μm prior to testing. A 5 mm diameter GCr15 steel ball served as the friction pair material. The rotational speed was 0.6 m/s, and the normal load was 5 N. The wear tests were conducted for 30 min. Microstructures and compositions of worn surfaces were characterized using an X-ray photoelectron spectroscope (XPS; Thermo Scientific-Escalab Xi+, Thermo Fisher Scientific, MA, USA). The analyses were carried out using Al Kα X-ray as the source of excitation, the gun being run at 15 kV and 10 mA. Survey spectra were obtained over a kinetic energy range of 200–1200 eV, in steps of 1.0 eV. The wear volumes were measured using a 2D profilometer (MT500; Zhongkekaihua Science and Technology Co., Ltd., Lanzhou, China). The 3D surface topography was analyzed by a 3D optical profilometer (S lynx 2; Sensofar Metrology, Barcelona, Spain).
3. Results
3.1. Phase Composition and Micromorphology of Raw Materials
To understand the processing–microstructure–property relationships, a comprehensive characterization of raw materials is fundamentally essential. In particular, the particle size critically influences multiple aspects of the sintering process. Finer powders with larger surface areas provide increased reactive sites during sintering, which accelerate mass transport and chemical reactions, enhance interparticle bonding and densification, and ultimately improve the density and performance of sintered compacts. Accordingly, we conducted systematic XRD and SEM analyses to precisely characterize the two raw materials. Figure 2a,b show the XRD patterns of the copper and copper-coated graphite powder, respectively. As shown in the figure, no impurity phases could be detected in either material.
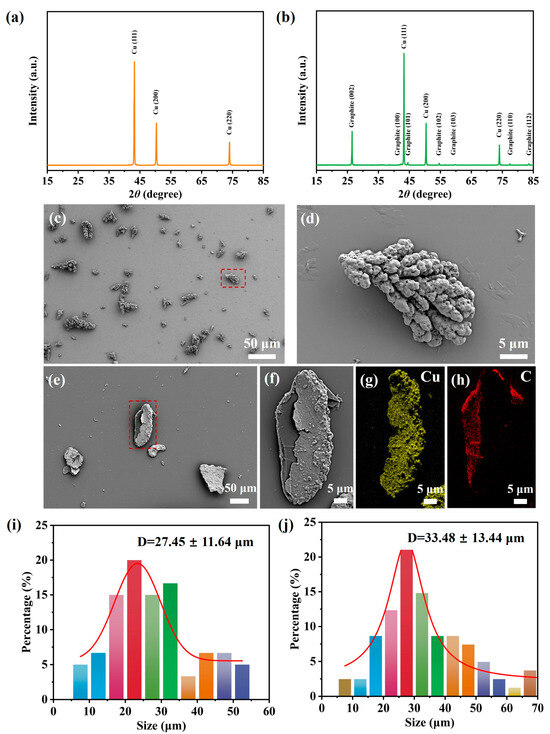
Figure 2.
The XRD patterns of (a) Cu and (b) Cu-coated graphite. SEM image of (c) Cu powders and (d) an enlarged view of the particle labeled in red rectangle. (e) SEM image of Cu-coated graphite powders and (f) an enlarged view of the particle labeled in red rectangle, and the corresponding EDS mapping of Cu (g) and C (h). Particle size distribution of Cu powder (i) and Cu-coated graphite powder (j).
Figure 2c presents the SEM image of Cu powders, while Figure 2d shows an enlarged view of the particle highlighted by the frame in Figure 2c. The Cu powder exhibits a dendritic morphology. In line with the XRD pattern in Figure 2a, only Cu particles were observed in the scanned images, with no impurities detected. Figure 2e displays the SEM image of Cu-coated graphite powders. Initial characterization confirmed that the Cu-coated graphite particles exhibit a flake-like morphology. Compositional analysis was performed via energy-dispersive spectroscopy (EDS) on a fractured Cu-coated graphite particle. Figure 2f presents the selected particle, while Figure 2g,h show the corresponding elemental distributions of Cu and C, respectively. The EDS results demonstrate that the bright region in the SEM image corresponds to Cu, whereas the dark region represents graphite. As observed in Figure 2e, the bright contrast in the SEM image of Cu-coated graphite powders confirms the successful deposition of Cu on the graphite surfaces. The particle size distribution of the raw materials was statistically analyzed using ImageJ 1.52a software. Multiple SEM images were captured, with over 100 particles measured to ensure the reliability of the statistical results. Figure 2i presents the particle size frequency distribution of Cu powders, with particle diameters ranging from 7.21 μm to 54.88 μm and an average size of 27.45 μm. Correspondingly, the particle size distribution of Cu-coated graphite powders is shown in Figure 2j, displaying a size range of 7.56 μm to 67.53 μm and an average particle size of 33.48 μm.
3.2. Phase Composition and Microstructure of Bulk Cu–GraphiteComposites
Figure 3a illustrates the variation in the relative density of Cu–graphite composites with different graphite volume fractions. For all compositions, the relative density of the Cu–graphite composites approaches the theoretical density, demonstrating the advantages of the two-stage ultrasonic-assisted process. It has come to light that achieving a high density at an elevated graphite volume fraction remains challenging for Cu–graphite composites through conventional sintering. However, UAHP enables these high-filler-containing composites to achieve exceptional high relative densities (>96% of theoretical density), which is the main advantage of this novel UAHP technique.
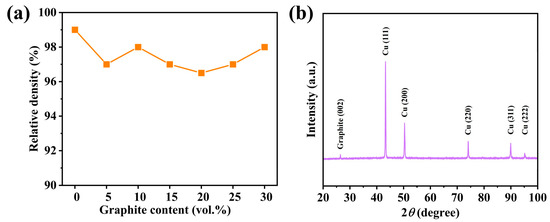
Figure 3.
(a) Relative density of Cu–graphite composites prepared by UAHP plotted as a function of graphite content. (b) The XRD pattern of Cu–20 vol.% graphite composite.
As evidenced by the XRD pattern of Cu–20 vol.% graphite in Figure 3b, the as-prepared Cu–20 vol.% graphite composite consists of only copper and graphite without secondary reaction products such as copper oxides or carbides. As schematically drawn in Figure 1, XRD scanning was performed on the X-Y plane of the sample prepared by the UAHP process. Scrutinizing the XRD pattern in Figure 3b, one finds only the (002) diffraction peak for graphite, which is an indication of the preferred orientation of the (002) plane. Graphite crystallizes in a hexagonal layered structure with a space group of P63/mmc. The detection of only the (002) peak is deemed to be mainly due to the fact that the (002) crystallographic plane is oriented parallel to the X-Y plane. A previous study [20] has demonstrated that when graphite exhibits highly oriented alignment within the Cu matrix, the XRD pattern reveals only (002) and (004) diffraction peaks. Since the XRD pattern obtained in this work showed exclusively the (002) peak, the excellent preferred orientation of graphite in the as-prepared bulk samples was confirmed. The XRD analysis provided indirect but statistically significant evidence of the preferred orientation of graphite, while SEM characterization delivered direct morphological verification, which will be shown below.
Figure 4 presents SEM images of Cu–graphite composites with 5–30 vol.% graphite contents. The SEM was performed on the bulk sample surface parallel to the X-Y plane. Apparently, there are no pores within the areas of observation, consistent with the measured high relative density. As evidenced from Figure 4, the graphite flakes are predominantly aligned perpendicular to the hot-pressing direction (on the X-Y plane), in good agreement with the XRD analysis. Furthermore, the micrographs reveal that the graphite flakes (dark pink in color) are uniformly distributed within the Cu matrix, and they are strongly related to the electrical conductivity and mechanical and tribological properties of the Cu–graphite composites.
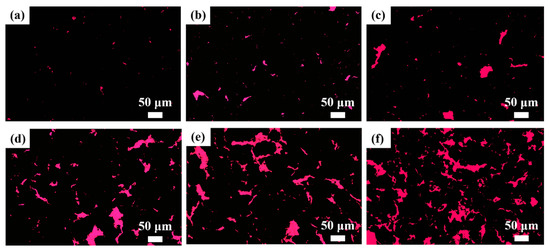
Figure 4.
SEM images of the Cu–graphite composites with different graphite contents: (a) Cu–5 vol.% graphite, (b) Cu–10 vol.% graphite, (c) Cu–15 vol.% graphite, (d) Cu–20 vol.% graphite, (e) Cu–25 vol.% graphite and (f) Cu–30 vol.% graphite. The dark grey colored phase is the Cu matrix, while the dark pink colored phase is graphite.
To further demonstrate the advantages of the two-stage ultrasonic-assisted process, the densities of Cu–graphite composites prepared by different methods are compared in Figure 5. Detailed descriptions of the processing methods and conditions used are listed in Table 2. It is of note that the density of Cu–graphite composites prepared by UAHP in this work was at a high level. Table 2 also compares the relative densities of Cu–graphite composites with identical compositions prepared by the two-stage ultrasonic-assisted process versus the single-stage ultrasonic-assisted process. For Cu–graphite composites containing 5–30 vol.% graphite, the two-stage method yields an average 5.9% density improvement over the one-stage method. Notably, the pure Cu samples prepared by ultrasonic-assisted sintering achieved a 99% relative density. In Cu matrix composites, porosity primarily originates from voids within the Cu matrix, interfacial gaps at matrix/reinforcement boundaries and clustering-induced pores around the reinforcement phase [21,22]. Thus, achieving theoretical density (>99%) in pure Cu is essential for fabricating high-density Cu–graphite composites. Critically, the relative density of the single-stage ultrasonic-assisted processed composites was consistently lower than 95%. Such a low density severely compromises their electrical conductivity, mechanical strength and tribological stability. Consequently, to obtain high-density Cu–graphite composites, the two-stage process, i.e., the application of ultrasonic vibrations at room temperature, is essential for UAHP.
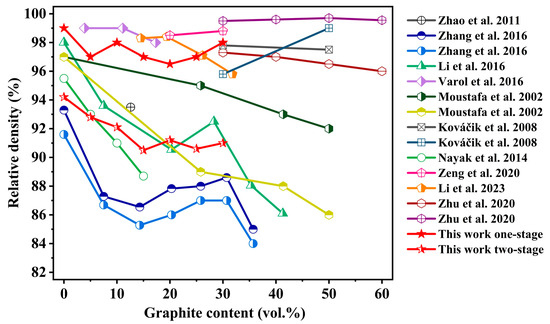
Figure 5.
Relative density of Cu–graphite composites prepared by UAHP plotted as a function of graphite content. The relative densities of Cu–graphite composites prepared in previous studies are also included for comparison [3,4,5,6,8,9,10,20,23,24].
Table 2.
Detailed preparation process and experimental conditions used in the previous studies compiled in Figure 5.
For the UAHP, the importance of applying ultrasound at the room-temperature stage has been demonstrated. It is equally important to demonstrate the role of ultrasound in material densification throughout the entire hot-pressing process. Since multiple studies have reported the preparation of Cu–graphite composites, comparing the preparation process of UAHP and the material’s relative density with the literature can reveal the technical advantages of applying ultrasound. It must be clarified that the results listed in this paper are trustworthy, and each preparation parameter was developed based on the researchers’ comprehensive evaluation. The sintering technologies listed in Figure 5 and Table 2 can be categorized into hot-press sintering processes and pressureless sintering processes based on whether pressure is applied. For pressureless sintering, the results presented in Figure 5 and Table 2 demonstrate that UAHP for fabricating Cu–graphite composites exhibits distinct advantages. This will not be elaborated upon further herein. For the pressure-assisted sintering processes, the techniques employed in the cited literature include HIP and HP. Based on the graphite volume fraction range investigated in these studies, the Cu–30 vol.% graphite composite was selected as the comparative reference. As shown in Figure 5, only the Cu–30 vol.% graphite composites fabricated in studies [20,24] exhibit a higher relative density than the samples prepared in this work. Specifically, the relative density of the Cu–30 vol.% graphite composites in study [20] increased by 0.8%, while that in study [24] increased by 1.5%. However, the relative density of all three comparative samples exceeded 98%, and such a density improvement only led to a modest enhancement in performance. On the other hand, sintering temperature is a key factor in material preparation technology. Therefore, from the perspective of sintering temperature, the results of sintering processes that achieved dense Cu–graphite composites are separately cited for comparison. For HP, Zeng et al. [20] achieved dense Cu–graphite composites at 1040 °C, significantly higher than the 700 °C employed in this work. Moreover, the preparation temperature close to copper’s melting point is detrimental to copper-based composites. Zhu et al. [24] employed a multi-stage sintering technology, which requires stringent thermal cycling and prolonged processing time, which lacks comparative advantages over UAHP. SPS is a novel powder consolidation technique. Li et al. [23] employed SPS to fabricate dense Cu–graphite composites at 860 °C with a 0.5-h holding time. In contrast, the two-stage UAHP technique enables the fabrication of near-fully dense Cu–graphite composites at a significantly reduced temperature and with a shorter holding duration, e.g., 700 °C and 10 min under 30 MPa in this work. In terms of sintering parameters, the advantages of UAHP technology are quite evident. Merely comparing sintering parameters and relative density is insufficient to fully validate the superiority of ultrasonic-assisted sintering. The performance enhancements of copper composites fabricated via UAHP, as well as the mechanisms underlying ultrasonic-driven densification, will be elaborated in subsequent sections.
3.3. Electrical Conductivity of Cu–Graphite Composites
As shown in Figure 6a, the electrical conductivity of the Cu–graphite composites prepared in this work decreased with increasing graphite content. In MMCs, the electrical conductivity is primarily governed by metal matrix factors like lattice defects, impurity scattering, phonon interactions and reinforcement phase, such as type, volume fraction, particle size and interface [19]. In Cu–graphite composites, the electrical conductivity is primarily determined by the Cu matrix. Generally, at low graphite contents (<15 vol.%), Cu forms continuous conductive pathways, allowing the composites to maintain high electrical conductivity; when the graphite content exceeds 15 vol.%, the graphite phase occupies a larger volume, disrupting the continuity of Cu conductive paths and causing conductivity decrease. In this work, an abrupt decrease in electrical conductivity was not observed for Cu–graphite composites with graphite volume fractions ranging from 20% to 30%, which can be attributed to the following factors. Firstly, by using Cu-coated graphite powder as a raw material, the uniformity of the mixture after ball milling and the wettability between graphite and Cu can be improved. In addition, UAHP greatly increased the density of Cu–graphite composites. Based on these facts, the as-prepared Cu–graphite composites exhibited relatively high conductivity. For standardized comparison, the electrical conductivity values from different studies were normalized relative to the International Annealed Copper Standard (IACS%). The electrical conductivity measured in this work was systematically compared with previous studies. While the electrical conductivity in Figure 6b does not represent the highest reported value, the Cu–graphite composites prepared in this work maintain stable conductivity even at high graphite contents without significant deterioration, demonstrating excellent performance stability. Zhang et al. [4] systematically compared the electrical conductivity of Cu–graphite composites with different average sizes of graphite flakes (44 μm and 19 μm). At comparable relative densities, composites containing smaller graphite flakes (19 μm) exhibited superior electrical conductivity. The work of Varol and Canakci [6] further demonstrated that nano-graphite reinforcements can enhance electrical conductivity at low volume fractions (<20 vol.%), as shown in Figure 6b. Collectively, these studies established an inverse relationship between graphite size and electrical conductivity. However, excessive size reduction compromises the lubricating function of graphite during friction. In this work, Cu-coated graphite powders with an average particle size of 33.48 μm were employed, achieving electrical conductivity comparable to the literature values.
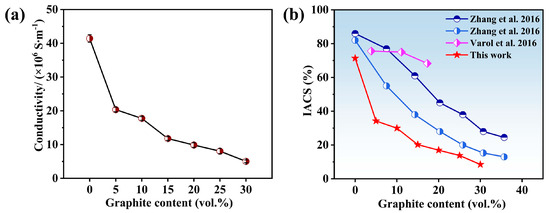
Figure 6.
(a) Electrical conductivity of Cu–graphite composites with different graphite contents. (b) Comparison of electrical conductivity of Cu–graphite composites prepared in this work with the data from references [4,6].
3.4. Mechanical Properties of Cu–Graphite Composites
3.4.1. Hardness
The hardness of a material represents its resistance to localized plastic deformation. In MMCs, hardness exhibits a positive correlation with wear resistance. According to Archard’s wear law [25], the wear rate (Q) is inversely proportional to hardness (H).
where k is the wear coefficient and w is the applied load. Therefore, for Cu–graphite composites used in electrical contact applications, hardness serves as one of the most critical material evaluation metrics. Figure 7a shows the effect of graphite volume fraction on the Vickers hardness of Cu–graphite composites prepared by UAHP. The hardness decreases from 66.43 to 39.13 HV with the increasing graphite content. This 41.1% reduction aligns with the lower Vickers hardness of graphite compared to the Cu matrix. The Vickers hardness values measured in this work were also systematically compared with the data from previous studies. As shown in Figure 7b, the Cu–graphite composites fabricated in this work exhibited superior Vickers hardness at equivalent graphite volume fractions compared to prior reported values. In other word, UAHP has successfully endowed Cu–graphite composites with high hardness.
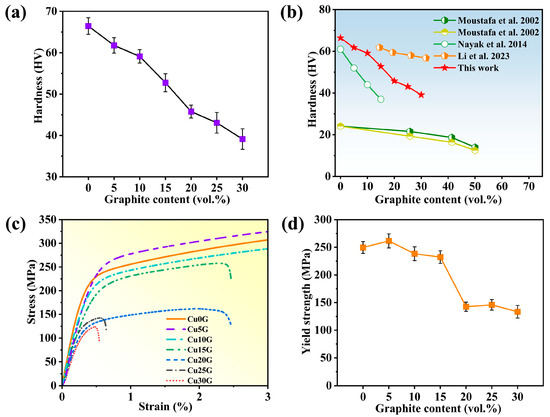
Figure 7.
(a) Hardness of Cu–graphite composites with different graphite contents. (b) Comparison of hardness of Cu–graphite composites prepared in this work with the data from references [8,10,21]. (c) Yield strength and (d) flexural strength of Cu–graphite composites with different graphite contents.
3.4.2. Flexural Strength
Cu–graphite composites are essential materials for pantograph sliders in tramway systems. Three-point bending tests can directly reflect in-service component conditions. Figure 7c shows the stress–strain curve of Cu–graphite composites in bending tests. The samples with graphite volume fractions ranging from 0% to 10% did not fail in the bending experiment, demonstrating the good plasticity of the Cu–graphite composites prepared in this work. In contrast, the Cu–graphite composites prepared by other methods are brittle. For example, Li et al. [5] fabricated Cu matrix composites with varying graphite contents via pressureless sintering at 860 °C for 1 h, and the Cu–7.5 vol.% graphite composite fractured under the bending test. The good plasticity exhibited by the Cu–10 vol.% graphite sample prepared using the UAHP is mainly due to the fact that ultrasonic waves make the prepared material denser, with the uniform distribution of the graphite phase and the continuity of the Cu matrix. Figure 7d shows the graphite-volume-fraction-dependent bending yield strength of the Cu–graphite composites. When 5 vol.% of graphite is added, the yield strength of the composite is enhanced. Then the yield strength of the Cu–graphite composites decreases as the volume fraction of graphite increases from 5% to 30%. Specifically, the yield strength of the Cu–20 vol.% graphite composite (142 MPa) exhibits a sharp decrease compared to the Cu–15 vol.% graphite composite (232 MPa), with a decrease of up to 38.8%.
The yield strength of the Cu–graphite composites was obtained from stress–strain curves, specifically defined as the stress value at the intersection between the stress–strain curve and a line with the slope equal to the Young’s modulus and 0.2% strain offset. Consequently, the Young’s modulus directly influenced the yield strength of the composites. Theoretically, the Young’s modulus of ceramic-particle-reinforced Cu matrix composites can be predicted by the classical Hashin–Shtrikman elasticity theory [26].
where V is the volume fraction and E is the Young’s modulus. The subscripts c, m and p denote the composite, matrix and particle, respectively. EHS − Upper and EHS − Lower are the upper limit and the lower limit of Hashin–Shtrikman theory, respectively, and EHS is the Young’s modulus of the composite predicted by Hashin–Shtrikman theory. Multiple studies have reported Young’s modulus values for Cu [27,28] and graphite [29,30,31]. For theoretical calculations in this work, ECu = 112.2 GPa [27] and Egraphite = 17.1 GPa [31] were selected as reference parameters. Table 3 compiles both the experimentally determined Young’s moduli obtained from stress–strain curves and the predicted values calculated using Hashin–Shtrikman theory.
Table 3.
Measured and calculated Young’s moduli of Cu–graphite composites with different graphite volume fractions.
One can see that both the experimentally measured and the theoretically predicted Young’s moduli exhibit a decreasing trend with increasing graphite volume fraction, although the measured values are much lower than the theoretical ones. The reason for the discrepancy is that the orientation of graphite makes Cu–graphite composites exhibit anisotropy in the Cu matrix. The decline trend of the Young’s moduli is in correspondence with that in yield strength, which is helpful in understanding the decrease in yield strength with graphite volume fraction in Cu–graphite composites.
Aside from the Young’s modulus, secondary strengthening mechanisms relative to the matrix phase significantly govern the yield strength of Cu matrix composites. These reinforcement effects operate through multiple pathways. The yield strength of Cu matrix composites can be predicted through the superposition of four primary strengthening mechanisms, including load transfer strengthening, grain refinement strengthening, dislocation strengthening and Orowan strengthening. For Cu–graphite composites, the strength of the graphite phase is much lower than that of Cu, so load is primarily carried by the Cu matrix. Therefore, as the graphite content increases, the load-bearing capacity of the Cu–graphite composites actually decreases. Thus, the yield strength of Cu–graphite composites decreases with increasing graphite volume fraction. The physical and chemical differences between graphite and Cu can also induce dislocation pinning and accumulation at the interface. Orowan reinforcement has a more significant enhancement effect when the reinforcement is relatively thin (<100 nm), such that it has little effect on the improvement of yield strength in the Cu–graphite composites investigated in this work. Therefore, we deem from the perspective of strengthening that the decrease in the yield strength of Cu–graphite composites is mainly due to the reduction in the content of Cu as the load-bearing agent.
The specific mechanical properties of the composites are listed in Table 4. The density of Cu–graphite composites decreased progressively from 8.81 to 6.75 g/cm3 with increasing graphite content (0–30 vol.%). Critically, the density reduction primarily originates from the low intrinsic density of graphite, as further supported by >96% relative density across all compositions (Figure 3a). To establish a robust correlation between hardness and strength, the measured Vickers hardness average values were converted to Brinell hardness according to Standard GBT 33362-2016 [32], with a conversion error of ±2 HBS. The derived Brinell hardness values exhibit a decreasing trend with increasing graphite content, consistent with the evolution of yield strength (Figure 7d). Although the Brinell hardness values were theoretically converted, their statistically significant correlation with direct Vickers hardness measurements validates the macroscopic hardness distribution pattern across compositions. This standardized hardness conversion provides critical data support for multi-scale property prediction through hardness–strength constitutive models and establishing a unified property database for copper matrix composites. As quantitatively demonstrated in Table 4, the UAHP-processed Cu–graphite composites achieve an optimal combination of lightweight characteristics, stable electrical conductivity, high hardness and yield strength. The unique combination of these properties originates from the microstructural characteristics observed in Section 4.2.
Table 4.
Density, electrical conductivity and mechanical properties of Cu–graphite composites with different graphite contents.
3.5. Friction and Wear Behaviors
3.5.1. Friction Coefficient of Cu–Graphite Composites
The unique layered structure and easy of delamination under shear of graphite makes it an excellent lubricating material. In the XRD and SEM analysis, the alignment of the graphite flakes with the (002) plane perpendicular to the hot-pressing direction was revealed. In other words, Cu–graphite composites with aligned graphite flakes, which are deemed to contribute to the better tribological performance, were successfully fabricated through UAHP. Figure 8a shows the variation in friction coefficients over time for the Cu–graphite composites with different graphite contents; the average friction coefficients and wear rates are shown in Figure 8b. Figure 8a reveals two distinct phases in the friction coefficient evolution of pure Cu. In the running-in period (0–7 min), the friction coefficient rapidly increases from 0 to 0.60 due to the formation of adhesive junctions between the Cu surface and the asperities of the GCr15 counterface [33]. In the steady-state period (>7 min), the friction coefficient stabilizes at approximately 0.60, with significant fluctuations (±5%) owing to the absence of a lubricating film. In contrast, the Cu–5 vol.% graphite composite (Cu5G) shows no pronounced running-in period, indicating that graphite acts as an effective lubricant. Moreover, the friction coefficient of Cu5G remains stable over time, suggesting continuous extrusion of graphite from the Cu matrix, which provides sustained lubrication. When the graphite volume fraction exceeds 5% (Cu10G–Cu30G), the friction coefficient trends of the composites become similar. Figure 8b demonstrates that the average friction coefficient of the composite exhibits a rapid initial decline followed by a gradual reduction with increasing graphite volume fraction under dry friction conditions. Profoundly, at 15 vol.% graphite, the average friction coefficient measures 0.140. When the graphite content reaches 30 vol.%, the friction coefficient slightly decreases to 0.135, indicating a plateau effect. Previous work [8] had demonstrated that the friction coefficient of Cu–graphite composites decreases with increasing graphite volume fraction until it reaches a threshold. When the volume fraction of graphite reaches the threshold, the friction coefficient of the Cu–graphite composites is closer to the dynamic friction coefficient of graphite (0.15–0.8) [34,35,36]. The volume fraction of graphite corresponding to this threshold is related to the particle size of the graphite phase. When the graphite particle size is 16 μm, the threshold is 12 vol.%; when the graphite particle size is between 25 and 40 μm, the threshold is 23 vol.%. In this work, the Cu-coated graphite powder has an average particle size of 33.48 μm, yielding a threshold of 15 vol.%, consistent with established trends.
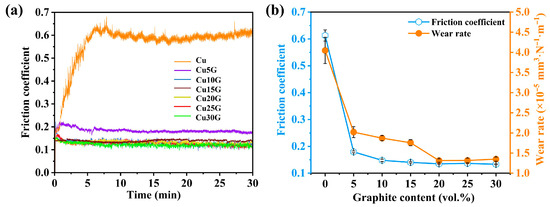
Figure 8.
(a) Variation in friction coefficients over time for Cu–graphite composites with different graphite contents. (b) Average friction coefficients and wear rates of Cu–graphite composites with different graphite contents.
3.5.2. Wear Properties of Cu–Graphite Composites
Figure 8b presents the average wear rate of Cu–graphite composites with varying graphite volume fractions. The wear rate exhibits a decreasing trend with increasing graphite content. Specifically, owing to the lubricating protective effect of graphite, the Cu–5 vol.% graphite composite shows a 45.5% reduction in wear rate compared to pure Cu. As the graphite content increases from 5 vol.% to 15 vol.%, the wear rate decreases gradually. However, a more pronounced reduction (22.8%) can be observed when the graphite volume fraction further increases from 15% to 20%. This abrupt transition can be explained by examining the surface morphology (Figure 4), since the high volume fraction of graphite in composites with >20 vol.% graphite resulted in the formation of almost continuous lubricating graphite films. Such continuous films provide dual benefits: (1) significant reduction in the friction coefficient and (2) effective protection of the Cu matrix from frictional damage during wear. During frictional processes, while the graphite films inevitably experience damage, the decreased Z-axis spacing in between the graphite flakes ensures continuous replenishment of graphite to the contact surface, maintaining effective film formation. When the graphite content reaches 20 vol.%, the aforementioned reduction in inter-flake spacing becomes more pronounced. However, as the graphite fraction further increases from 20 vol.% to 30 vol.%, the composite exhibits a gradual rise in wear rate due to lower hardness, as expressed in Equation (1) and the data shown in Figure 7.
Figure 9a shows the wear scar profiles perpendicular to the sliding directions of Cu–graphite composites with different graphite contents, and the wear depth and width of different Cu–graphite composites were counted in Figure 9b. Analysis of the wear scar morphology reveals that pure Cu exhibits the maximum width of 557.27 μm, attributable to continuous frictional damage in the absence of lubricating phases. As the graphite content increases from 5 to 20 vol.%, the scar depth progressively decreases, correlating with the observed reduction in wear rate. Between 20 and 25 vol.% graphite, the wear scars show increased width but reduced depth, corresponding to a slight overall wear rate increase. At 30 vol.% graphite, both the scar width (448.72 μm) and depth (10.93 μm) exceed those of the Cu–25 vol% graphite composite, indicating degraded wear resistance at excessive graphite loadings. As discussed in the hardness section, hardness exhibits an inverse correlation with wear loss. The Cu–30 vol.% graphite composite, having the lowest hardness, consequently shows increased wear scar width and depth. A previous study [6] investigated the effect of Cu-coated graphite on the tribological behavior of Cu–graphite composites, reporting that wear loss gradually increased when the graphite content exceeded 26.16 vol.%. However, in this study, UAHP-sintered Cu–graphite composites did not exhibit a sharp rise in wear loss within the 20–30 vol.% graphite range. This can be attributed to the following factors. First, the UAHP-prepared Cu–graphite composites retained a high relative density, resulting in a gradual and limited hardness reduction while maintaining superior mechanical properties (Figure 7). Second, the preferential alignment of graphite flakes ensures continuous lubricating film formation, which effectively shields the Cu matrix from wear damage. This optimized microstructure establishes a load-bearing Cu matrix coupled with a friction-reducing graphite phase, achieving an ideal balance between strength and tribological performance.
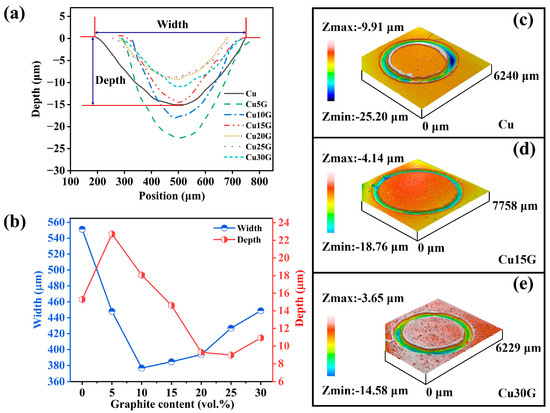
Figure 9.
(a) Wear scar profiles perpendicular to the sliding directions of Cu–graphite composites with different graphite contents. (b) Depth and width of Cu matrix composites with different graphite contents. Three-dimensional topographies of (c) Cu, (d) Cu–15 vol.% graphite and (e) Cu–30 vol.% graphite. Zmax and Zmin represent the maximum and minimum depth of the scar, respectively.
In Figure 9c–e, the 3D wear scar morphologies of pure Cu (c) and Cu–15 vol.% graphite (d) and Cu–30 vol.% graphite composites (e) are shown. For pure Cu, the wear scar exhibits an eccentric circular profile, indicating load instability during friction due to the absence of lubricating phases, in line with the friction coefficient change shown in Figure 8a. This instability results in combined normal and transverse loading during the wear process. These observations explain two key tribological characteristics of pure Cu: (1) the extended time required for the stabilization of the friction coefficient and (2) the significant fluctuations in the friction coefficient over time. The Cu–15 vol.% graphite composite exhibits a highly circular wear scar morphology with a narrow width (Figure 9d). The uniform scar depth, evidenced by consistent color mapping, demonstrates effective load-bearing by the Cu matrix enabled by graphite lubrication. This optimized stress distribution accounts for the exceptional stability of the friction coefficient over time observed in this composition, as shown in Figure 8a. The Cu–30 vol.% graphite composite displays a wider wear scar compared to the Cu–15 vol.% composite, consistent with the earlier discussion of this phenomenon. However, compared to pure Cu, the Cu–30 vol.% graphite composite exhibits both a shallower and more uniform scar depth. This demonstrates that while hardness reduction increases scar width, the effective graphite lubrication prevents further subsurface damage by load dissipation. Consequently, Cu–graphite composites maintain stable wear resistance even at high graphite loadings (>20 vol.%), avoiding the sharp wear rate increase.
4. Discussion
4.1. Densification-Temperature Reduction Mechanisms by UAHP
We have demonstrated in Figure 3a that the Cu–graphite composites prepared by UAHP achieved a higher density at a lower temperature of 700 °C and a shorter dwell time of 10 min compared to the conventional densification methods (achieving a 160 °C reduction in hot-pressing temperature). The lower densification temperature and short dwell time resulted in a higher density, allowing for the discussion of the densification mechanism by UAHP. As shown in Figure 1, ultrasonic waves are vertically loaded onto the graphite mold, parallel to the hot-pressing direction. A two-stage ultrasonic application process was used in this study. Thus, discussion of stage-specific ultrasonic effects on composite densification is necessary.
Firstly, for room-temperature ultrasonic processing, the experimental configuration features vertical ultrasonic excitation of the powders, which is similar to ultrasonic processing. Under additional pressure, ultrasonic vibration induces the relative motion of powder particles similar to friction. Due to the use of Cu-coated graphite as the source of graphite addition, the interaction between Cu and Cu is considered here. Ultrasonic waves propagating through solid media induce several non-distortional effects, among which the acoustic softening effect represents one of the most significant phenomena [37,38,39,40]. The mechanism of acoustic softening is complex and still a research hotspot. Current understanding of acoustic softening mechanisms primarily involves three dominant theories: the thermal softening effect [37,38], superposition of steady and alternating stresses [41,42] and dislocation activation [43]. At present, mechanical modeling and simulation are effective methods for predicting ultrasonic-induced softening. For the acoustic softening of Cu, Huang et al. [44] studied the acoustic softening effect of pure Cu after applying ultrasonic waves by an automatic wire bonding machine. They also measured the change in the Vickers hardness of Cu after applying ultrasonic waves of different powers. When the ultrasonic power reached 882 mW, the Vickers hardness of pure Cu decreased by 19%. In 2011, Huang et al. [45] conducted a comprehensive investigation combining experimental and finite element analysis (FEA) methods to characterize the deformation behavior of Cu under varying mechanical loads and ultrasonic intensities. It was found that ultrasound had a softening effect on Cu. With the increase in ultrasonic intensity, the strength of Cu decreases and its plasticity increases. For UAHP, acoustic softening can promote high-speed plastic deformation of Cu particles, which is beneficial for particle rearrangement and compact density increasement. James et al. [46] employed molecular dynamics (MD) simulations to investigate shear stress evolution between Cu particles during ultrasonic powder consolidation (UPC). After adding only longitudinal pressure, there was no shear force between Cu particles. The shear force increased rapidly upon the application of ultrasound. The shear stress and shear strain curve indicated that the maximum yield shear stress reached 3.26 GPa, and the shear strain reached 2 rad within 5000 fs in UPC. The shear rate reached 1011 rad/sec. In this work, the important effect of ultrasonic waves applied at room temperature in terms of increasing the relative density of Cu–graphite composites was demonstrated in Section 3.2. Under high-frequency vibration, the surface of Cu particles undergoes rough deformation and shearing and local surface asperities are flattened, which promotes the contact and bonding of Cu particles. In addition, high-speed plastic deformation [47] can provide more driving force for the sintering stage, fill large pores in the early stage of sintering and reduce porosity. At this stage, acoustic softening and the additional sintering driving force are the primary factors contributing to the reduced densification temperature. Furthermore, in the soft and easily deformable Cu matrix, graphite flakes, which are rigid in the basal plane (Young’s modulus of graphene, Egraphene = 1.0 ± 0.1 TPa [48]), rotate under pressure, resulting in the alignment of graphite flakes.
Secondly, during the holding stage, the ultrasound-promoted diffusion of elements serves as a critical mechanism for reducing the densification temperature. Ultrasonic waves can promote element diffusion and have been applied in multiple fields, such as strengthening and functionalization of metal surfaces [49], semiconductors [50],ultrasonic-assisted welding [51,52], etc. Xiong et al. [51] investigated the effect of welding energy on element diffusion at the Cu/Al welding joint interface. The results indicated that the increase in welding energy led to an increase in the thickness of the diffusion layer. The physical mechanisms can be systematically categorized as cavitation effects, acoustic flow, stress-induced lattice distortion, etc. The core function is to reduce the activation energy of diffusion and/or increase the atomic migration rate by applying ultrasonic waves [53]. Ultrasonic waves have been proven not only to promote the diffusion of elements, but also to reduce the activation energy of reactions. For example, Liao et al. [54] calculated the sintering activation energy of 1145 °C-sintered silicate ceramics without (conventional sintering, CS) and with ultrasound (ultrasound-assisted conventional sintering, UCS). The two activation energies were QCS = 1.2 × 10⁵ J and QUCS = 1 × 10⁵ J, respectively, demonstrating that the application of ultrasound could reduce the activation energy of sintering. As we have shown in Figure 4, there are no obvious pores in the Cu matrix, which proves that the Cu–graphite composites have good exhaust and mass transfer in the later stage of sintering. On the basis of the above analysis, the mechanisms by which ultrasound enhances densification during the holding stage in Cu–graphite composites are twofold. On the one hand, the softening effect generated by ultrasound can increase the fluidity of Cu, which is more conducive to eliminating air and filling pores. On the other hand, the mechanical vibration of ultrasound can generate periodic stress fields in the Cu matrix, which causes lattice distortion, resulting in a large number of crystal defects such as dislocations and vacancies. These defects provide channels for Cu atomic diffusion and promote the diffusion of elements.
The application of ultrasonic vibrations during both the room-temperature and holding stages promotes densification, as evidenced by the comparative analysis of the relative densities of UAHP-prepared Cu–graphite composites and data in the literature. This demonstrates the necessity of ultrasonic treatment for achieving dense Cu–graphite composites at lower temperatures. Beyond structural optimization through thermal reduction, ultrasonic vibrations enhance the structural uniformity of the material. It is known that ultrasonic waves improve the density uniformity of pressed green bodies, thereby refining the final structural homogeneity of the composite. Khasanov et al. [55] investigated the density distribution patterns of BaTi4O9-BaWO4 nano-powder green compacts under ultrasonic-assisted and conventional pressing conditions. Their experimental results demonstrated that ultrasonic vibrations reduced the friction between the powder and mold walls compared to traditional pressing, thereby improving the uniformity of the compact’s density distribution. Zhou et al. [56] demonstrated that 10 Hz vibration-assisted hot pressing significantly improved the pore distribution uniformity of aluminum billets compared to conventional hot pressing. Abedini et al. [12] investigated ultrasound-assisted hot-press sintering of Ti-6Al-4V, revealing that ultrasonic vibrations during thermal compression enhanced structural uniformity and increased relative density by optimizing stress distribution and refining grain boundaries. Based on the above analyses, it can be concluded that applying ultrasonic vibrations facilitates three key effects: reducing sintering temperature, minimizing powder friction and refining the material’s microstructure. Dense and structurally uniform materials inherently contribute positively to the enhancement of overall material performance. In this study, ultrasonic treatment improved both the relative density and structural uniformity of the Cu–graphite composites, which in turn strengthened their mechanical properties and tribological behavior. A detailed discussion of these findings will be provided in subsequent sections.
4.2. Mechanisms Underpinning the Mechanical Properties
We have shown in the previous section that the Cu–graphite composites fractured during bending tests at a critical graphite volume fraction of 10%, which is higher than the value of 7.5% previously reported in the literature [5]. Notably, a sharp decrease in yield strength can be observed when the graphite content increases from 15 vol.% to 20 vol.%. These phenomena encourage us to discuss the mechanisms that underpin the mechanical properties. Below the critical graphite volume fraction of 10%, the improved plasticity can be primarily attributed to two key factors: The first is the high volume fraction of ductile Cu (the excellent plasticity of Cu stems from its 12 active slip systems), since the high Cu volume fraction enables Cu to serve as the primary load-bearing constituent during bending deformation. Beyond the critical graphite volume fraction, the high graphite content and the preferred orientation of graphite flacks dominate the fracture. The fracture surfaces of Cu–(15–30) vol.% graphite composites are shown in Figure 10. The fracture surface of the Cu–15 vol.% graphite composite (Figure 10a) exhibits ductile fracture features with a high density of shallow dimples and limited graphite exposure. The observed graphite layers maintain a largely intact morphology with minimal deformation. The Cu matrix in between the graphite layers demonstrates significant plastic deformation and micro-void coalescence. Localized deformation leads to the nucleation and growth of micro-voids, ultimately resulting in matrix failure. The aligned arrangement of graphite flakes plays a crucial role. As shown in Figure 10b, the graphite flakes are preferentially oriented perpendicular to the hot-pressing direction within the Cu matrix. Li et al. [57] investigated the effect of graphene orientation on the mechanical properties of magnesium matrix composites using molecular dynamics simulations. The mechanical behavior was evaluated through uniaxial compression simulations. The results demonstrated that when graphene was oriented at 0° (perpendicular to the compressive stress direction), the magnesium matrix composites exhibited optimal plasticity along with the highest yield strength. In this study, the horizontal alignment of graphite flakes relative to the hot-pressing direction in the Cu matrix has been demonstrated through multiple characterization techniques, including XRD and SEM analyses. In the bending tests, the sample surface parallel to the X-Y plane (as illustrated in Figure 1) was subjected to tensile stress under bending. The oriented graphite arrangement accounts for enhanced plasticity at low graphite volume fractions (<15 vol%). In addition, the exceptionally high relative density of Cu–graphite composites achieved by UAHP also contributes to the high yield strength.
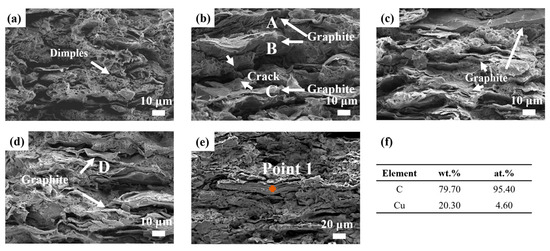
Figure 10.
Fracture surfaces of Cu–graphite composites with different graphite contents. (a) Cu–15 vol.% graphite. (b) Cu–20 vol.% graphite; the labels A, B and C indicate three exposed graphite flakes. (c) Cu–25 vol.% graphite. (d) Cu–30 vol.% graphite; a severely deformed graphite flake can be observed in D. (e) Cu–30 vol.% graphite composite with EDS point analysis performed on an exposed graphite flake (Point 1). (f)The corresponding EDS results for the Cu-30G sample are tabulated.
In contrast, more exposed graphite flakes can be observed on the fracture surface of the Cu–20 vol.% graphite composite, indicating increased graphite debonding. The severe delamination and fragmentation of graphite (labeled “A” in Figure 10b) demonstrate effective load-bearing capability during bending deformation. The micrographs reveal that both graphite laminates (labeled “B” and “C” in Figure 10b) have undergone deformation, with noticeable damage observed in graphite B. Also, there is a crack in between graphite B and graphite C. The dimples formed in the Cu matrix resulted from localized plastic deformation, while the crack originated from large voids caused by debonding between graphite C and the Cu matrix. These large voids subsequently coalesce with smaller micro-voids in the Cu matrix, ultimately forming cracks that lead to material failure. Furthermore, the aligned orientation of graphite laminates A, B and C provides direct evidence of preferred graphite alignment in the Cu matrix. Notably, although dimples are present in the plastic deformed Cu, their quantity remains relatively limited. This phenomenon clearly demonstrates that the cutting effect of the graphite phase on the Cu matrix becomes more pronounced, resulting in a significant reduction in yield strength compared to the Cu–15 vol.% graphite composite, as shown in Figure 7d. As the graphite volume fraction increases, increased exposure of graphite flakes and more severe damage to graphite flakes become evident on the fracture surface. Intriguingly, despite the sharp decrease in yield strength from the Cu–15 vol.% graphite to the Cu–20 vol.% graphite composites, the yield stage remains distinctly observable (Figure 7a), i.e., the primary fracture mechanism maintains ductile characteristics.
When the graphite content increases to 25 vol.%, there is more exposed graphite in the field of view and more graphite fractures, resulting in severe damage. In Figure 10c, delamination of graphite flakes can be observed, which is due to the breaking of van der Waals force-bonded layers when stretched perpendicular to the c-axis of the hexagonal lattice or under shear stress. In Figure 10d, it can be observed that the graphite layer (labeled “D” in the Figure 10d) exhibits a cleavage fracture along the (002) plane. Due to the delamination and fracture of the graphite phase, the stress–strain curves of the Cu–graphite composites with 25 vol.% and 30 vol.% graphite exhibit very short yielding stages, resembling the brittle fracture of ceramics. The above fracture surface analysis reveals that as the graphite content increases, it bears more load during bending tests, and as the graphite content reaches 25 vol.% or higher, the primary fracture mode transfers from ductile to brittle. The preferred orientation of graphite flakes is the primary microstructure origin enabling Cu–graphite composites to maintain high yield strength at high graphite volume fractions (>20 vol.%).
4.3. Mechanism for Low Friction Coefficient and Wear Rate
Previous studies [5,6,9] demonstrated that Cu–graphite composites formed mechanically mixed layers (MMLs) at the friction interface when sliding against counterpart materials. These MMLs typically consist of copper, copper oxides, counterpart material and the corresponding oxides. The lubrication mechanism of Cu–graphite composites was attributed to the in situ formation of graphite-rich films during friction, which effectively reduced friction and wear through solid lubrication. To elucidate both the composition of MMLs and the lubrication mechanism in Cu–graphite composites, X-ray photoelectron spectroscopy (XPS) analysis was conducted on the worn surface of the Cu–30 vol.% graphite composite. Prior to analysis, the characteristic graphite C 1s binding energy was established as 284.4 eV [58], enabling proper calibration and peak deconvolution of the acquired spectra. As shown in Figure 11a, the Cu 2p spectrum exhibits characteristic peaks at 933.6 eV (CuO 2p3/2) and 953.6 eV (CuO 2p1/2) [59]. The CuO signature is further confirmed by the presence of shake-up satellite peaks at higher binding energies, as indicated in Figure 11a. For Cu2O, the corresponding peaks appear at 932.4 eV (2p3/2) and 952.4 eV (2p1/2). Additional peaks that can be observed at 931.5 eV and 951.5 eV in Figure 11a are attributed to copper oxides with different valence states, based on their distinct binding energy positions. In Figure 11b, the C 1s spectrum exhibits characteristic peaks corresponding to graphitic carbon (C-C, 284.4 eV), ether/hydroxyl groups (C-O-C, 286.1 eV) and carbonyl groups (C=O, 287.7 eV) [60]. The O 1s spectrum (Figure 11c) is dominated by the primary peak at 531.8 eV [59], which is attributed to oxygen in copper oxides. Figure 11d presents the XPS survey spectrum of the worn surface, with Table 5 providing quantitative elemental analysis. The surface composition shows maximum C content (77.47 at.%), minimal Cu presence (4.81 at.%) and trace amounts of Fe and Cr. The MMLs consists primarily of CuO and CuxO, which participate in abrasive wear during friction. Distinct ploughing grooves can be observed within the wear scar in Figure 9e. Based on the above analysis, the primary wear mechanism of Cu–graphite composites involves three sequential stages. The Cu matrix undergoes surface oxidation, forming copper oxides which correspond to oxidative wear. These oxides are subsequently sheared off during sliding contact with the counterpart material GCr15. The detached particles form MMLs that induce abrasive wear.
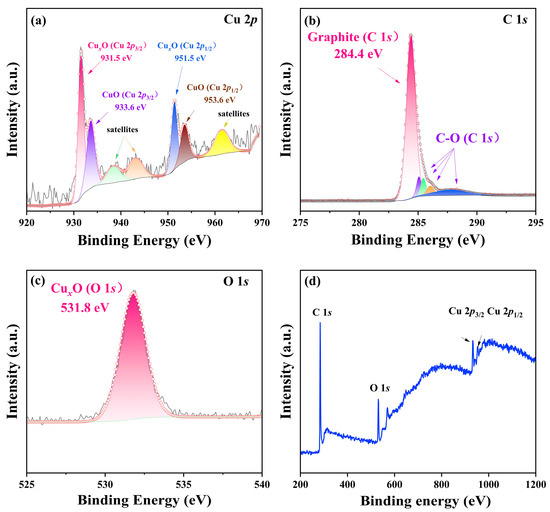
Figure 11.
XPS analysis of the worn surface of Cu–30 vol.% graphite: (a) Cu 2p spectrum, (b) C1s spectrum, (c) O1s spectrum and (d) the XPS survey spectrum.
Table 5.
The element contents (in at.%) on the worn surface of Cu–30 vol.% graphite composite.
In addition to the wear mechanism of Cu–graphite composites, the lubrication mechanism also affects their friction properties. The element contents on the worn surface reveal carbon as the dominant element (77.47 at.%). This finding confirms that the preferentially aligned graphite undergoes progressive delamination during friction, while simultaneously transferring to and coating the contact surface as an effective solid lubricant film. Quantitative analysis revealed minimal elemental transfer from the counterpart material GCr15, with Fe and Cr concentrations of merely 2.85 at.% and 1.14 at.%, respectively. These exceptionally low values demonstrate that the in situ-formed graphite lubricating film effectively prevents material transfer from the friction pair to Cu–graphite composites. The continuous graphite layer acts as a physical barrier that significantly mitigates damage caused by Fe and its oxides through three protective mechanisms: (1) preventing direct metal-to-metal contact, (2) reducing adhesive wear and (3) inhibiting oxidative reactions at the interface. The quantitative analysis shows a significantly reduced Cu content (4.81 at.%) on the worn surface, which serves as compelling evidence for two key findings. The exceptional continuity of the graphite lubricating film effectively isolates the Cu matrix from direct oxygen contact, thereby minimizing oxidative wear mechanisms. This continuous graphite coverage explains why Cu–graphite composites with >15 vol.% graphite exhibit an average friction coefficient approaching the intrinsic dynamic friction coefficient of graphite (0.15–0.8).
Beyond the lubricating and protective effects of the graphite phase, the microstructural features and other properties of Cu–graphite composites also influence their wear rate. First, for MMCs, the phase composition and distribution, as well as defects and inclusions, are structural factors that affect their wear rate [61,62]. In Cu–graphite composites, copper can bear the primary wear load, while graphite can buffer stress and prevent the spalling of the copper. As shown in Figure 4, the graphite phase is uniformly distributed within the Cu matrix, and the interfaces between the graphite and Cu are well-bonded. This ensures that a continuous graphite protective film can form on the graphite surface during the friction process. Meanwhile, the Cu–graphite composites prepared via UAHP exhibit a relative density close to the theoretical value, with almost no pores observed in the copper phase, as shown in Figure 4. The XRD results in Figure 3b indicate that the UAHP-prepared Cu–graphite composites contain no other impurity phases. The dense and phase-pure structure of these composites prevents stress concentration and the induction of microcracks during friction, which would otherwise arise from structural inhomogeneity. The in situ-grown graphite films and uniform microstructure are the key structural factors contributing to the low wear rate of the Cu–graphite composites. Furthermore, high hardness and yield strength are critical performance indicators for resisting micro-cutting and fatigue crack propagation [63]. As discussed in Section 3.4, the Cu–graphite composites fabricated via UAHP exhibit exceptional hardness and high yield strength, which constitute the fundamental mechanical basis for their low wear rates. Notably, both the hardness and yield strength of these composites decrease with increasing graphite content. A sharp decline in yield strength corresponds to the graphite volume fraction of 20 vol.%, which coincides with the inflection point where the wear rate begins to rise. This indicates that the deterioration of hardness and yield strength above 20 vol.% graphite content is the dominant factor driving the increased wear rate of Cu–graphite composites.
As established in preceding sections, the electrical conductivity, hardness and yield strength of Cu–graphite composites exhibit declining trends with increasing graphite content. Regarding tribological performance, the average friction coefficient of Cu–graphite composites reaches a threshold value when the graphite volume fraction is greater than 15%, and wear rate escalation emerges above 20 vol.% graphite. The variations in properties with graphite content, along with the threshold graphite concentrations and corresponding mechanisms, have been discussed in preceding sections. Consequently, the selected graphite content range (5–30 vol.%) comprehensively captures the full spectrum of property evolution. Cu–graphite composites within this compositional range demonstrate a balanced property profile, optimizing the electrical–mechanical–tribological triad for sliding contact applications.
5. Conclusions
In this work, Cu–graphite composites with different graphite contents were prepared using the two-stage ultrasonic-assisted hot-press sintering process. Through microstructure, electrical conductivity, hardness, and mechanical and tribological property investigations, the densification and property enhancement mechanisms were disclosed. The main conclusions can be summarized as follows:
- Using the two-stage ultrasonic-assisted hot-press sintering technique, dense Cu–graphite composites with aligned graphite flakes were fabricated at 700 °C in 10 min, achieving at least a 160 °C reduction in sintering temperature.
- The yield strength of Cu–graphite composites exhibits a two-stage evolution: at 0–15 vol.% graphite, it gradually decreases from 250 MPa to 232 MPa (7.2% reduction); at 20–30 vol.% graphite, the yield strength declines from 142 MPa to 133 MPa (6.3% reduction). The hardness of the composites decreases from 66.43 HV to 39.13 HV with the addition of graphite from 0 to 30 vol.%, while the electrical conductivity of the composites decreases from 41.4 × 10⁶ S/m to 5.0 × 10⁶ S/m.
- At a graphite volume fraction beyond 15%, the average friction coefficient of Cu–graphite composites approaches that of the dynamic coefficient of friction of graphite. In addition, the wear rate decreases significantly from 4.05 × 10⁻⁵ to 1.31 × 10⁻⁵ mm3·N−1·m−1 as the graphite content increases from 0 to 20 vol.%.
- The densification mechanism in ultrasonic-assisted hot-press sintering operates through two distinct stages. At the room-temperature stage, ultrasonic vibration induces acoustic softening, generating high-speed plastic deformation on particle surfaces that allows for efficient contacting and packing of the powders. At the high-temperature sintering stage, ultrasound reduces the sintering activation energy, simultaneously enhancing elemental diffusion.
Author Contributions
Conceptualization, Y.Z. and S.Z. (Shijia Zhou); methodology, C.F.; software, W.X. (Wei Xu); validation, W.X. (Wei Xu), K.S. and H.X.; formal analysis, H.X.; investigation, S.Z. (Shijia Zhou); resources, W.X. (Wei Xie); data curation, S.Z. (Shuang Zhang); writing—original draft preparation, S.Z. (Shijia Zhou); writing—review and editing, Y.Z.; visualization, H.W.; supervision, Y.Z.; project administration, H.W.; funding acquisition, C.F. All authors have read and agreed to the published version of the manuscript.
Funding
This research was funded by the National Natural Science Foundation of China grant number U23A20562 and 52302074.
Data Availability Statement
Dataset available on request from the authors.
Acknowledgments
The author would like to thank Z. Wang in UAHP experiments and sample preparation.
Conflicts of Interest
Authors Wei Xu and Kuang Sun were employed by the company Shanghai Chenhua Science and Technology Co., Ltd. The remaining authors declare that the research was conducted in the absence of any commercial or financial relationships that could be construed as a potential conflict of interest.
Correction Statement
This article has been republished with a minor correction to the Data Availability Statement. This change does not affect the scientific content of the article.
References
- Kaczmar, J.W.; Pietrzak, K.; Włosiński, W. The production and application of metal matrix composite materials. J. Mater. Process. Technol. 2000, 106, 58–67. [Google Scholar] [CrossRef]
- Mazloum, A.; Kováčik, J.; Emmer, Š.; Sevostianov, I. Copper–graphite composites: Thermal expansion, thermal and electrical conductivities, and cross-property connections. J. Mater. Sci. 2016, 51, 7977–7990. [Google Scholar] [CrossRef]
- Zhao, X.G.; He, G.Q.; Fu, P. Research on attrition loss of copper-graphite alloy material. Met. Funct. Mater. 2011, 18, 42–46. [Google Scholar] [CrossRef]
- Zhang, G.X. Effects of copper-coated graphite content and particle size on properties of the Cu/copper-coated graphite composite. Power Met. Technol. 2016, 34, 196–198. [Google Scholar] [CrossRef]
- Li, K.Q.; Xiang, X.Z.; Bai, X.J.; Liang, B.Y.; Gong, W.Y. Effects of particle size and copper-coated graphite content on properties of the Cu/copper-coated graphite composite. Met. Funct. Mater. 2016, 23, 47–50. [Google Scholar] [CrossRef]
- Varol, T.; Canakci, A. The effect of flake microstructure on the preparation and properties of Cu-graphite sintered nanocomposites. Powder Metall. Met. Ceram. 2016, 55, 426–436. [Google Scholar] [CrossRef]
- Zhu, L.Y.; Yi, M.Z.; Ge, Y.C.; Zhang, B.; Xie, A.L. Intuitive analysis of the microtribological behavior of copper-coated graphite–graphite/Cu composites with high graphite contents. ACS Omega 2022, 7, 28217–28225. [Google Scholar] [CrossRef]
- Moustafa, S.F.; El-Badry, S.A.; Sanad, A.M.; Kieback, B. Friction and wear of copper–graphite composites made with Cu-coated and uncoated graphite powders. Wear 2002, 253, 699–710. [Google Scholar] [CrossRef]
- Kováčik, J.; Emmer, Š.; Bielek, J.; Keleši, L. Effect of composition on friction coefficient of Cu–graphite composites. Wear 2008, 265, 417–421. [Google Scholar] [CrossRef]
- Nayak, D.; Debata, M. Effect of composition and milling time on mechanical and wear performance of copper–graphite composites processed by powder metallurgy route. Powder Metall. 2014, 57, 265–273. [Google Scholar] [CrossRef]
- Pokryshev, V.R.; Marchenko, V.I. Effect of ultrasound oscillationson the consolidationof iron powder in hot pressing. Powder Metall. Met. Ceram. 1969, 8, 110–112. [Google Scholar] [CrossRef]
- Abedini, R.; Abdullah, A.; Alizadeh, Y. Ultrasonic hot powder compaction of Ti-6Al-4V. Ultrason. Sonochem. 2017, 37, 640–647. [Google Scholar] [CrossRef] [PubMed]
- Singh, G.; Pandey, P.M. Rapid manufacturing of copper components using 3D printing and ultrasonic assisted pressureless sintering: Experimental investigations and processoptimization. J. Manuf. Process. 2019, 43, 253–269. [Google Scholar] [CrossRef]
- Singh, G.; Pandey, P.M. Design and analysis of long-stepped horn for ultrasonic-assisted sintering. Adv. Mater. Process. Technol. 2020, 7, 216–226. [Google Scholar] [CrossRef]
- Kumar, A.; Pandey, P.M. Effect of ultrasonic assisted sintering on mechanical properties and degradation behaviour of Mg15Nb3Zn1Ca biomaterial. J. Magnes. Alloys 2021, 9, 1989–2008. [Google Scholar] [CrossRef]
- Liu, Z.Y.; Ge, Y.; Zhao, D.D.; Lou, Y.; Liu, Y.; Wu, Y.; Yu, P.; Yu, C.Y. Ultrasonic assisted sintering using heat converted from mechanical energy. Metals 2020, 10, 971. [Google Scholar] [CrossRef]
- Chen, P.; Liao, W.B.; Liu, L.H.; Luo, F.; Wu, X.Y.; Li, P.J.; Yang, C.; Yan, M.; Liu, Y.; Zhang, L.C.; et al. Ultrafast consolidation of bulk nanocrystalline titanium alloy through ultrasonic vibration. Sci. Rep. 2018, 8, 801. [Google Scholar] [CrossRef]
- Wang, F.L.; Nie, N.T.; He, H.; Tang, Z.K.; Chen, Z.X.; Zhu, W.H. Ultrasonic-assisted sintering of silver nanoparticles for flexible electronics. J. Phys. Chem. C 2017, 121, 28515–28519. [Google Scholar] [CrossRef]
- Yan, Y.F.; Kou, S.Q.; Yang, H.Y.; Shu, S.L.; Qiu, F.; Jiang, Q.C.; Zhang, L.C. Ceramic particles reinforced copper matrix composites manufactured by advanced powder metallurgy: Preparation, performance, and mechanisms. Int. J. Extrem. Manuf. 2023, 5, 032006. [Google Scholar] [CrossRef]
- Zeng, F.K.; Ma, H.B.; Jiang, N.; Xue, C. Preparation and thermophysical properties of aligned graphite flake/Cu composites. Acta Mater. Compos. Sin. 2020, 37, 1951–1959. [Google Scholar] [CrossRef]
- Mortensen, A.; Llorca, J. Metal Matrix composites. Annu. Rev. Mater. Res. 2010, 40, 243–270. [Google Scholar] [CrossRef]
- Chawla, N.; Shen, Y.L. Mechanical behavior of particle reinforced metal matrix composites. Adv. Eng. Mater. 2001, 3, 357–370. [Google Scholar] [CrossRef]
- Li, H.Q.; Liu, Y.Z.; Zheng, B.C.; Wang, S.; Yi, Y.L.; Zhang, Y.Z.; Li, W. On the tribological behaviors of Cu matrix composites with different Cu-coated graphite content. J. Mater. Res. Technol. 2023, 25, 83–94. [Google Scholar] [CrossRef]
- Zhu, X.; Chen, R.S.; Zhu, X.F.; Li, Z.; Xu, G.F.; Jia, Y.L.; Zhang, Y.H. Microstructure, and physical and mechanical properties of copper–graphite composites obtained by in situ reaction method. J. Mater. Eng. Perf. 2020, 29, 1696–1705. [Google Scholar] [CrossRef]
- Archard, J.F. Contact and rubbing of flat surfaces. J. Appl. Phys. 1953, 24, 981–988. [Google Scholar] [CrossRef]
- Hashin, Z.; Shtrikman, S. A variational approach to the theory of the elastic behaviour of multiphase materials. J. Mech. Phys. Solids 1963, 11, 127–140. [Google Scholar] [CrossRef]
- Lassnig, A.; Zak, S. Precise determination of Young’s modulus of amorphous CuZr/nanocrystalline Cu multilayer via nanoindentation. J. Mater. Res. 2023, 38, 3324–3335. [Google Scholar] [CrossRef]
- Marques, V.M.F.; Johnston, C.; Grant, P.S. Nanomechanical characterization of Sn–Ag–Cu/Cu joints—Part 1: Young’s modulus, hardness and deformation mechanisms as a function of temperature. Acta Mater. 2013, 61, 2460–2470. [Google Scholar] [CrossRef]
- Cho, J.; Luo, J.J.; Daniel, I.M. Mechanical characterization of graphite/epoxy nanocomposites by multi-scale analysis. Compos. Sci. Technol. 2007, 67, 2399–2407. [Google Scholar] [CrossRef]
- Komatsu, K. Interpretation of the specific heat of various graphites at very low temperatures. J. Phys. Chem. Solids 1964, 25, 707–712. [Google Scholar] [CrossRef]
- Riley, D.P. The thermal expansion of graphite: Part II. Theoretical. Proc. Phys. Soc. 1945, 57, 486–495. [Google Scholar] [CrossRef]
- GB/T 33362-2016; Metallic Materials-Conversion of Hardness Values. Standards Press of China: Beijing, China, 2016.
- Su, Y.M.; Jiang, F.; Xiao, Z.Y.; Wu, F.F.; Long, M.J. Microstructure and tribological properties of copper/graphite composites with Ti3AlC2 addition prepared by rapid hot press sintering. Tribol. Int. 2024, 194, 109537. [Google Scholar] [CrossRef]
- Savage, R.H. Graphite lubrication. J. Appl. Phys. 1948, 19, 1–10. [Google Scholar] [CrossRef]
- Arnell, R.D.; Teer, D.G. Lattice parameters of graphite in relation to friction and wear. Nature 1968, 218, 1155–1156. [Google Scholar] [CrossRef]
- Li, B.B.; Wang, W.D.; Wang, F.; Li, Y. Friction and wear performance of graphite/SA533GrB steel end surface. Hot Work. Tech. 2024, 53, 111–115. [Google Scholar] [CrossRef]
- Han, Q.Y. Ultrasonic Processing of Materials. Metall Mater Trans B. 2015, 46, 1603–1614. [Google Scholar] [CrossRef]
- Blaha, F.; Langenecker, B. Dehnung von zink-kristallenunterultraschalleinwirkung. Natur. Wiss. 1955, 42, 556. [Google Scholar] [CrossRef]
- Blaha, F.; Langenecker, B. Untersuchungenzurbearbeitungserholung (verformungsentfestigung) von metallkristallen. Int. J. Mater. Res. 1958, 49, 357–360. [Google Scholar] [CrossRef]
- Blaha, F.; Langenecker, B. Plastizitätsuntersuchungen von metallkristallen in ultraschallfeld. Acta Metall. 1959, 7, 93–100. [Google Scholar] [CrossRef]
- Daud, Y.; Lucas, M.; Huang, Z.H. Ultrasonic compression tests on aluminium. Appl. Mech. Mater. 2006, 3–4, 99–104. [Google Scholar] [CrossRef]
- Daud, Y.; Lucas, M.; Huang, Z.H. Superimposed ultrasonic oscillations in compression tests of aluminium. Ultrasonics 2006, 44, 511–515. [Google Scholar] [CrossRef]
- Blaha, F.; Langenecker, B.; Oelschlägel, D. Zum plastischenverhalten von metallenunterschalleinwirkung. Int. J. Mater. Res. 1960, 51, 636–638. [Google Scholar] [CrossRef]
- Huang, H.; Pequegnat, A.; Chang, B.H.; Mayer, M.; Du, D.; Zhou, Y.; Daud, Y.; Lucas, M.; Huang, Z.H. Influence of superimposed ultrasound on deformability of Cu. J. Appl. Phys. 2009, 106, 113514. [Google Scholar] [CrossRef]
- Huang, H.; Chang, B.H.; Du, D. Effect of superimposed ultrasound on mechanical properties of copper. Mater. Sci. Technol. 2011, 27, 1117–1122. [Google Scholar] [CrossRef]
- James, S.; Rajanna, P. Molecular dynamics simulation study of ultrasonic powder consolidation process. In Proceedings of the ASME 2018 13th International Manufacturing Science and Engineering Conference, College Station, TX, USA, 18–22 June 2018; ASME: New York, NY, USA, 2018; Volume 4, p. V004T03A026. [Google Scholar] [CrossRef]
- Li, X.Q.; Hu, L.X.; Wang, E.D.; He, W.X.; Liu, Z.Y. Microstructure of TiAl alloy prepared by intense plastic deformation and subsequent reaction sintering. Trans. Nonferrous. Met. Soc. China 2002, 12, 621–624. [Google Scholar]
- Lee, C.G.; Wei, X.D.; Kysar, J.W.; Hone, J. Measurement of the elastic properties and intrinsic strength of monolayer graphene. Science 2008, 321, 385–388. [Google Scholar] [CrossRef]
- Zhao, W.D.; Liu, D.X.; Qin, H.F.; Zhang, X.H.; Zhang, H.; Zhang, R.X.; Ren, Z.C.; Ma, C.; Amanov, A.; Pyun, Y.-S.; et al. The effect of ultrasonic nanocrystal surface modification on low temperature nitriding of ultra-high strength steel. Surf. Coat. Technol. 2019, 375, 205–214. [Google Scholar] [CrossRef]
- Preeyanghaa, M.; Vinesh, V.; Sabarikirishwaran, P.; Rajkamal, A.; Ashokkumar, M.; Neppolian, B. Investigating the role of ultrasound in improving the photocatalytic ability of CQD decorated boron-doped g-C3N4 for tetracycline degradation and first-principles study of nitrogen-vacancy formation. Carbon 2022, 192, 405–417. [Google Scholar] [CrossRef]
- Xiong, Z.L.; Zhang, Y.F.; Chen, D.Y.; Zhang, Y. Effect of welding energy on interdiffusion behavior of interfacial elements in Cu/Al joints welded by ultrasonic welding. Hot Work. Technol. 2021, 50, 118–121. [Google Scholar] [CrossRef]
- Cui, Y.; Xu, C.L.; Han, Q. Effect of ultrasonic vibration on unmixed zone formation. Scr. Mater. 2006, 55, 975–978. [Google Scholar] [CrossRef]
- Gallego-Jua’rez, J.A.; Graff, K.F. Power Ultrasonics Applications of High-Intensity Ultrasound, 1st ed.; Woodhead Publishing: Cambridge, UK, 2015; pp. 259–292. [Google Scholar]
- Liao, S.; Zhang, H.; Jia, B.; Wu, H.M.; Di, Y.J.; Wan, X.; Liu, B. Ultrasound-assisted conventional sintering of silicate ceramics. Ceram.–Silikáty 2022, 66, 571–578. [Google Scholar] [CrossRef]
- Khasanov, O.L.; Dvilis, E.S. Net shaping nanopowders with powerful ultrasonic action and methods of density distribution control. Adv. Appl. Ceram. 2008, 107, 135–141. [Google Scholar] [CrossRef]
- Zhou, Q.; Song, S.T.; Chen, Q.F.; Bai, Y.L. Comprehensive studies on hot compaction and vibration-assisted compaction tests of aluminum powder. ASME J. Manuf. Sci. Eng. 2021, 143, 011006. [Google Scholar] [CrossRef]
- Li, Q.; Wu, Z.C.; Zhou, L.M. Study on plastic deformation mechanism of GNSs/Mgcomposites from GNSs orientation angle. Hot Work. Technol. 2025, 54, 74–81+88. [Google Scholar] [CrossRef]
- Blyth, R.I.R.; Buqa, H.; Netzer, F.P.; Ramsey, M.G.; Besenhard, J.O.; Golob, P.; Winter, M. XPS studies of graphite electrode materials for lithium ion batteries. Appl. Surf. Sci. 2000, 167, 99–106. [Google Scholar] [CrossRef]
- Poulston, S.; Parlett, P.M.; Stone, P.; Bowker, M. Surface oxidation and reduction of CuO and Cu2O studied using XPS and XAES. Surf. Interface Anal. 1996, 24, 811–820. [Google Scholar] [CrossRef]
- Xie, Y.; Sherwood, P.M.A. X-ray photoelectron-spectroscopic studies of carbon fiber surfaces. Part XII: The effect of microwave plasma treatment on pitch-based carbon fiber surfaces. Appl. Spectrosc. 1990, 44, 797–803. [Google Scholar] [CrossRef]
- Lakshmikanthan, A.; Angadi, S.; Malik, V.; Saxena, K.K.; Prakash, C.; Dixit, S.; Mohammed, K.A. Mechanical and Tribological Properties of Aluminum-Based Metal-Matrix Composites. Materials 2022, 15, 6111. [Google Scholar] [CrossRef]
- Ujah, C.O.; Kallon, D.V.V.; Aigbodion, V.S. Tribological Properties of CNTs-Reinforced Nano Composite Materials. Lubricants 2023, 11, 95. [Google Scholar] [CrossRef]
- Chen, W.Y.; Tan, H.; Cheng, J.; Zhu, S.Y.; Yang, J. Research Progress and Prospect of Tribological Properties of Cold Sprayed Copper-based Composite Coatings. Mater. Rep. 2022, 36, 21080083-7. [Google Scholar] [CrossRef]


Disclaimer/Publisher’s Note: The statements, opinions and data contained in all publications are solely those of the individual author(s) and contributor(s) and not of MDPI and/or the editor(s). MDPI and/or the editor(s) disclaim responsibility for any injury to people or property resulting from any ideas, methods, instructions or products referred to in the content. |
© 2025 by the authors. Licensee MDPI, Basel, Switzerland. This article is an open access article distributed under the terms and conditions of the Creative Commons Attribution (CC BY) license (https://creativecommons.org/licenses/by/4.0/).