Article

Crushing Removal Conditions and Experimental Research on Abrasive Water Jets Impacting Rock

1
School of Mechanical and Power Engineering, Henan Polytechnic University, Jiaozuo 454003, China
2
School of Energy Science and Engineering, Henan Polytechnic University, Jiaozuo 454003, China
3
State Collaborative Innovation Center of Coal Work Safety and Clean-Efficiency Utilization, Jiaozuo 454003, China
4
Zhengzhou Institute for Advanced Research, Henan Polytechnic University, Zhengzhou 451464, China
*
Author to whom correspondence should be addressed.
Lubricants 2025, 13(8), 348; https://doi.org/10.3390/lubricants13080348
Submission received: 12 June 2025 / Revised: 27 July 2025 / Accepted: 29 July 2025 / Published: 4 August 2025

Abstract

This paper describes the complex process of rock crushing removal by AWJ impact from the microscopic perspective. The acceleration and deceleration mechanism of abrasive particles throughout the whole process of single abrasive particles impacting rocks, the spherical cavity expansion mechanism of the abrasive particles’ impact on the rock, and the elastic contact force of the collision between the abrasive particles and rock were investigated; a mathematical model of AWJ’s impact on the rock crushing removal conditions was established; and the threshold values of the jet impact parameters were obtained. The mathematical model of the rock crushing removal conditions was verified through numerical simulation and jet impact experiments. The research results show that the theoretical value of the jet impact velocity that meets the conditions for limestone crushing removal is greater than or equal to 36 m/s, and the theoretical value of the pressure is greater than or equal to 2.7 MPa. Numerical simulation was used to obtain the displacement of marked points, stress, and strain variation in marked elements of rock under different impact velocities. The effect of impact rock breaking obtained through the experiment demonstrates the correspondence between the test pressure and the theoretical pressure, which verifies the accuracy of the mathematical model of the rock crushing removal conditions.

1. Introduction

Abrasive water jet (AWJ) technology is an unconventional specialty processing technology that is used in almost every industry sector due to its high applicability. It has been applied in engineering fields such as machinery manufacturing [1], coal mining [2], tunnel excavation [3], oil and gas engineering [4], and rock cutting [5,6]. In the field of coal mining, AWJ is considered one of the most effective technologies for the cutting and crushing of coal rocks [7,8], and there are a large number of coal rock projects that need to implement cutting in the coal mining process—for example, in broken coal bodies and roof control, etc. The control of the roof occurs through the destruction of the integrity of the top plate of the coal seam, seeking to promote the collapse of the top plate after coal mining and reduce the stress of the roadway surrounding the rock; this is implemented along empty stay roadways or in small pillar mining and so on. At present, mechanical and blasting methods are mainly used to destroy the integrity of the coal seam roof rock in coal mine roof control [9,10], but there are certain limitations in the implementation process. Mechanical methods are generally suitable for large-scale broken coal seams or soft rock formations but are not suitable for cutting hard rock seams or cutting coal seams in small localized areas. Although the blasting method can be used for hard rock and localized coal rock cutting works, it is affected by factors such as inconvenient storage and transportation and the use of a large degree of restriction, as well as being affected by factors such as dust and toxic gases generated by blasting. Therefore, it is important to adopt an appropriate cutting technology to meet the needs and safety requirements of coal and rock cutting projects. The AWJ cutting roof decompression technology is a new technology developed in recent years for the control of roof plates in coal mines, and it will become one of the most effective methods to control the mine pressure under the condition of hard roof plates in the coal seam in the future [11,12]. Thus far, researchers such as Huang [13], Xia [14], Pan [15], Zhang [16], and others have carried out relevant research on abrasive water jet top cutting pressure relief technology, the process, and the experimental equipment. They have used abrasive water jets to cut the hole wall in a directional manner in the borehole; then, under the action of high-pressure water, the roof is directionally collapsed along the prefabricated cuts to achieve the purpose of precise roof cutting pressure relief. They have also developed a complete set of experimental equipment for high-pressure water jet cutting–fracturing pressure relief technology in coal mines, and they have verified through relevant experiments that it has the effect of weakening the stress transfer of the roof and relieving the pressure of the surrounding rock. At present, this technology is not widely used in actual projects; the main reasons are that abrasive particles cannot be supplied for a long time and evenly, and the wear of abrasives on equipment and parts has not been effectively resolved, but it is expected that this problem will be gradually solved and optimized with the upgrading of technology, materials, and equipment.
AWJ technology belongs to cold cutting technology; it has the characteristics of no heat generation, no pollution, strong applicability, and high flexibility in the process [17,18,19], and it is especially suitable for the underground environment of coal mines with explosive gases and localized coal rock body cutting works [20]. AWJ uses high-pressure water as the transport medium to carry tiny abrasive particles. After clustering, solid–liquid mixed jet beams with high energy are formed by injection from the tiny nozzles. When the sprayed high-energy jet beam acts on the processed material, the energy conversion between the two is realized through impact, and the removal of the processed material is realized. The impact of abrasive particles is dominant in the process of material removal by AWJ [21,22], being responsible for almost the entire removal task. The removal process of brittle materials is mainly achieved via microcracks generated by the impact of abrasive particles on the processed material, and the crack formation process of microcracks mainly includes mixed modes such as radial cracks, transverse cracks, conical cracks, intergranular or perforated cracks, and ring-break cracks [23,24]. Due to the influence of the fluid–solid coupling characteristics of AWJ and the physical properties of rocks, the magnitude and distribution of stress on rocks become more complicated during the impact rock-breaking process. Therefore, there is currently no unified explanation of the microscopic mechanism of AWJ rock breaking. Since the magnitude and distribution of stress on rocks during the rock-breaking process by AWJ impact are directly related to the form, effect, and efficiency of rock crushing, the conditions for rock crushing removal have important theoretical value in improving the rock cutting ability and cutting efficiency of AWJ. When the AWJ impacts the rock, strong impact stress is generated in the impact area; when it is greater than the internal stress threshold for rock damage, the rock will be damaged, and this will be further expanded under continuous impact. Due to the stepwise and real-time nature of damage evolution in the rock-breaking process, domestic and foreign scholars mainly study the crushing characteristics and failure modes of rocks under jet impact through numerical simulation and experimental research. Farmer [25] found that, when a high-pressure water jet erodes rocks, if the jet impact on the rock velocity is less than a critical velocity, no significant damage will be caused to the rock surface. Jiang [26] also found the same phenomenon through numerical simulation. Researchers such as Momber [27,28] and Liu [29,30] have conducted research related to the damage threshold for rock damage; a mathematical model of the threshold velocity or pressure for rock damage was established mainly through the methods of impact tests, theoretical derivation, and numerical simulation, and the results were verified. Hu et al. [31] studied the evolution of rock stress during water jet rock breaking based on the assumption of elastic–brittle damage, pointing out that such damage is related to the effective stress of the internal microelement of the rock, and it starts to become damaged gradually when the stress state of the microelement is larger than the critical value of the failure state. It was found that the peak value of the change curve of the rock stress state determines the destruction of the internal microelement of the rock. Based on the above research, this paper mainly focuses on three aspects: theory, simulation, and experiments. In this work, we describe the complex process of rock crushing removal by AWJ impact from the microscopic perspective. On the one hand, the mechanism of the whole process of abrasive particles impacting rock was studied, including the acceleration and deceleration mechanism of a single abrasive particle impacting rocks, the expansion mechanism of spherical cavities when abrasive particles impact rocks, and the contact mechanism of abrasive particles and rocks. On the other hand, a mathematical model of the AWJ impact rock crushing removal conditions was established, and the threshold values of the jet impact parameters were obtained. The mathematical model of the rock crushing removal conditions was verified through numerical simulation and jet impact experiments. In the process of an engineering application, by determining the destruction threshold of rock, reasonable jet parameters can be selected during implementation to ensure that the rock can achieve the desired destruction form and improve the efficiency of rock breaking.

2. Movement of Abrasive Particles in Abrasive Water Jets

2.1. Accelerated Motion Process of Abrasive Particles

The accelerated motion of the abrasive particles relies on the fluid generating a thrust effect on the abrasive particles. Based on the fact that water is the continuous phase and abrasive particles are the sparse phase, the interaction between abrasive particles is ignored, and the movement process of the two is regarded as a one-dimensional flow. Based on the above conditions, a theoretical analysis is conducted on the whole process of the accelerated motion of abrasive particles in the nozzle, and we establish mathematical equations of motion for this process to obtain the mathematical relationship between the velocities of aqueous fluids and abrasive particles, as well as the corresponding relationship between the abrasive particle velocity and the pressure of the jet. According to the widely used conical convergent nozzle analysis [32,33], the acceleration process of the abrasive particles is divided into a contraction section and a cylindrical straight-line section, as shown in Figure 1.
As shown in Figure 1, L 1 is the length of the nozzle contraction section, L 2 is the length of the nozzle cylindrical section, θ is the nozzle contraction angle, and ϕ d f is the diameter at the nozzle outlet; the specific parameters of the nozzle structure are shown in Table 1.
(1)
Abrasive particles in contraction section of nozzle
When the jet enters the contraction section of the nozzle, the radial force is ignored, and the abrasive particles are subjected to an inertial force, resistance, additional mass force, and pressure gradient force during the movement. According to Newton’s second law, the motion equation of the abrasive particles in the constricted section of the nozzle is
1 6 π d m 3 ρ m d u m 1 d t = 1 12 π d m 3 ρ w d u m 1 d t d u w 1 d t + 1 8 π C D d m 2 ρ w u w 1 u m 1 u w 1 u m 1 + 1 6 π d m 3 d p d x
Due to the sparse solid–liquid two-phase flow,
d p d x = ρ w d u w 1 d t
Substituting Equation (2) into Equation (1) gives
a m 1 = d u m 1 d t = 3 ρ w C D 4 ρ m + 2 ρ w d m u w 1 u m 1 2 + 3 ρ w 2 ρ m + ρ w d u w 1 d t
When the operating pressure is stable, the flow field inside the nozzle can be regarded as a constant accelerated flow field, and the velocity can be expressed by the distance x as
d u w 1 d t = u w 1 d u w 1 d x , d u m 1 d t = u w 1 d u m 1 d x
Substituting Equation (4) into Equation (3) leads to
d u m 1 d x = 3 ρ w C D 4 ρ m + 2 ρ w d m u w 1 u m 1 2 u w 1 + 3 ρ w 2 ρ m + ρ w d u w 1 d x
Let M = 3 ρ w C D 4 ρ m + 2 ρ w d m , N = 3 ρ w 2 ρ m + ρ w , and simplifying Equation (5) gives
d u m 1 d x = M u w 1 u m 1 2 u w 1 + N d u w 1 d x
(2)
Abrasive particles within straight-line segment of nozzle
When the jet enters the straight section of the nozzle, the secondary factors of the force on the abrasive particles are ignored, and the abrasive particles are considered to be subjected to a combination of an inertial force, resistance force, and additional mass force during their movement. According to Newton’s second law, the motion equation of the abrasive particles in the straight-line segment of the nozzle is
1 6 π d m 3 ρ m d u m 2 d t = 1 12 π d m 3 ρ w d u m 2 d t d u w 2 d t + 1 8 π C D d m 2 ρ w u w 2 u m 2 u w 2 u m 2
where u m 2 is the velocity of the abrasive particles in the straight section of the nozzle; u w 2 is the velocity of the water in the straight section of the nozzle.
The velocity in the straight section of the nozzle is expressed by the distance:
d u w 2 d t = u w 2 d u w 2 d x , d u m 2 d t = u w 2 d u m 2 d x
Substituting Equation (8) into Equation (7) gives
d u m 2 d x = 3 ρ w C D 4 ρ m + 2 ρ w d m u w 2 u m 2 2 u w 2
Simplifying Equation (9) gives
d u m 2 d x = M u w 2 u m 2 2 u w 2
Integrating Equation (10) yields
ln u w 2 u m 2 + u w 2 u w 2 u m 2 + C = M x
Since the water velocity is always greater than the abrasive velocity during the acceleration process in the nozzle, we set the velocity of the abrasive particles at the entrance of the nozzle’s straight section (i.e., x = 0 ) to u m 2 ( 0 ) . Substituting it into Equation (11) yields
C = ln u w 2 u m 2 ( 0 ) u w 2 u w 2 u m 2 ( 0 )
Substituting Equation (12) into Equation (11) leads to
x = 1 M ln 1 u m 2 u w 2 + 1 1 u m 2 u w 2 ln 1 u m 2 ( 0 ) u w 2 1 1 u m 2 ( 0 ) u w 2
If the velocity of the abrasive particles at the inlet of the nozzle’s straight section is u m 2 ( 0 ) = 0 , Equation (13) reduces to
x = 1 M ln 1 u m 2 u w 2 + 1 1 u m 2 u w 2 1
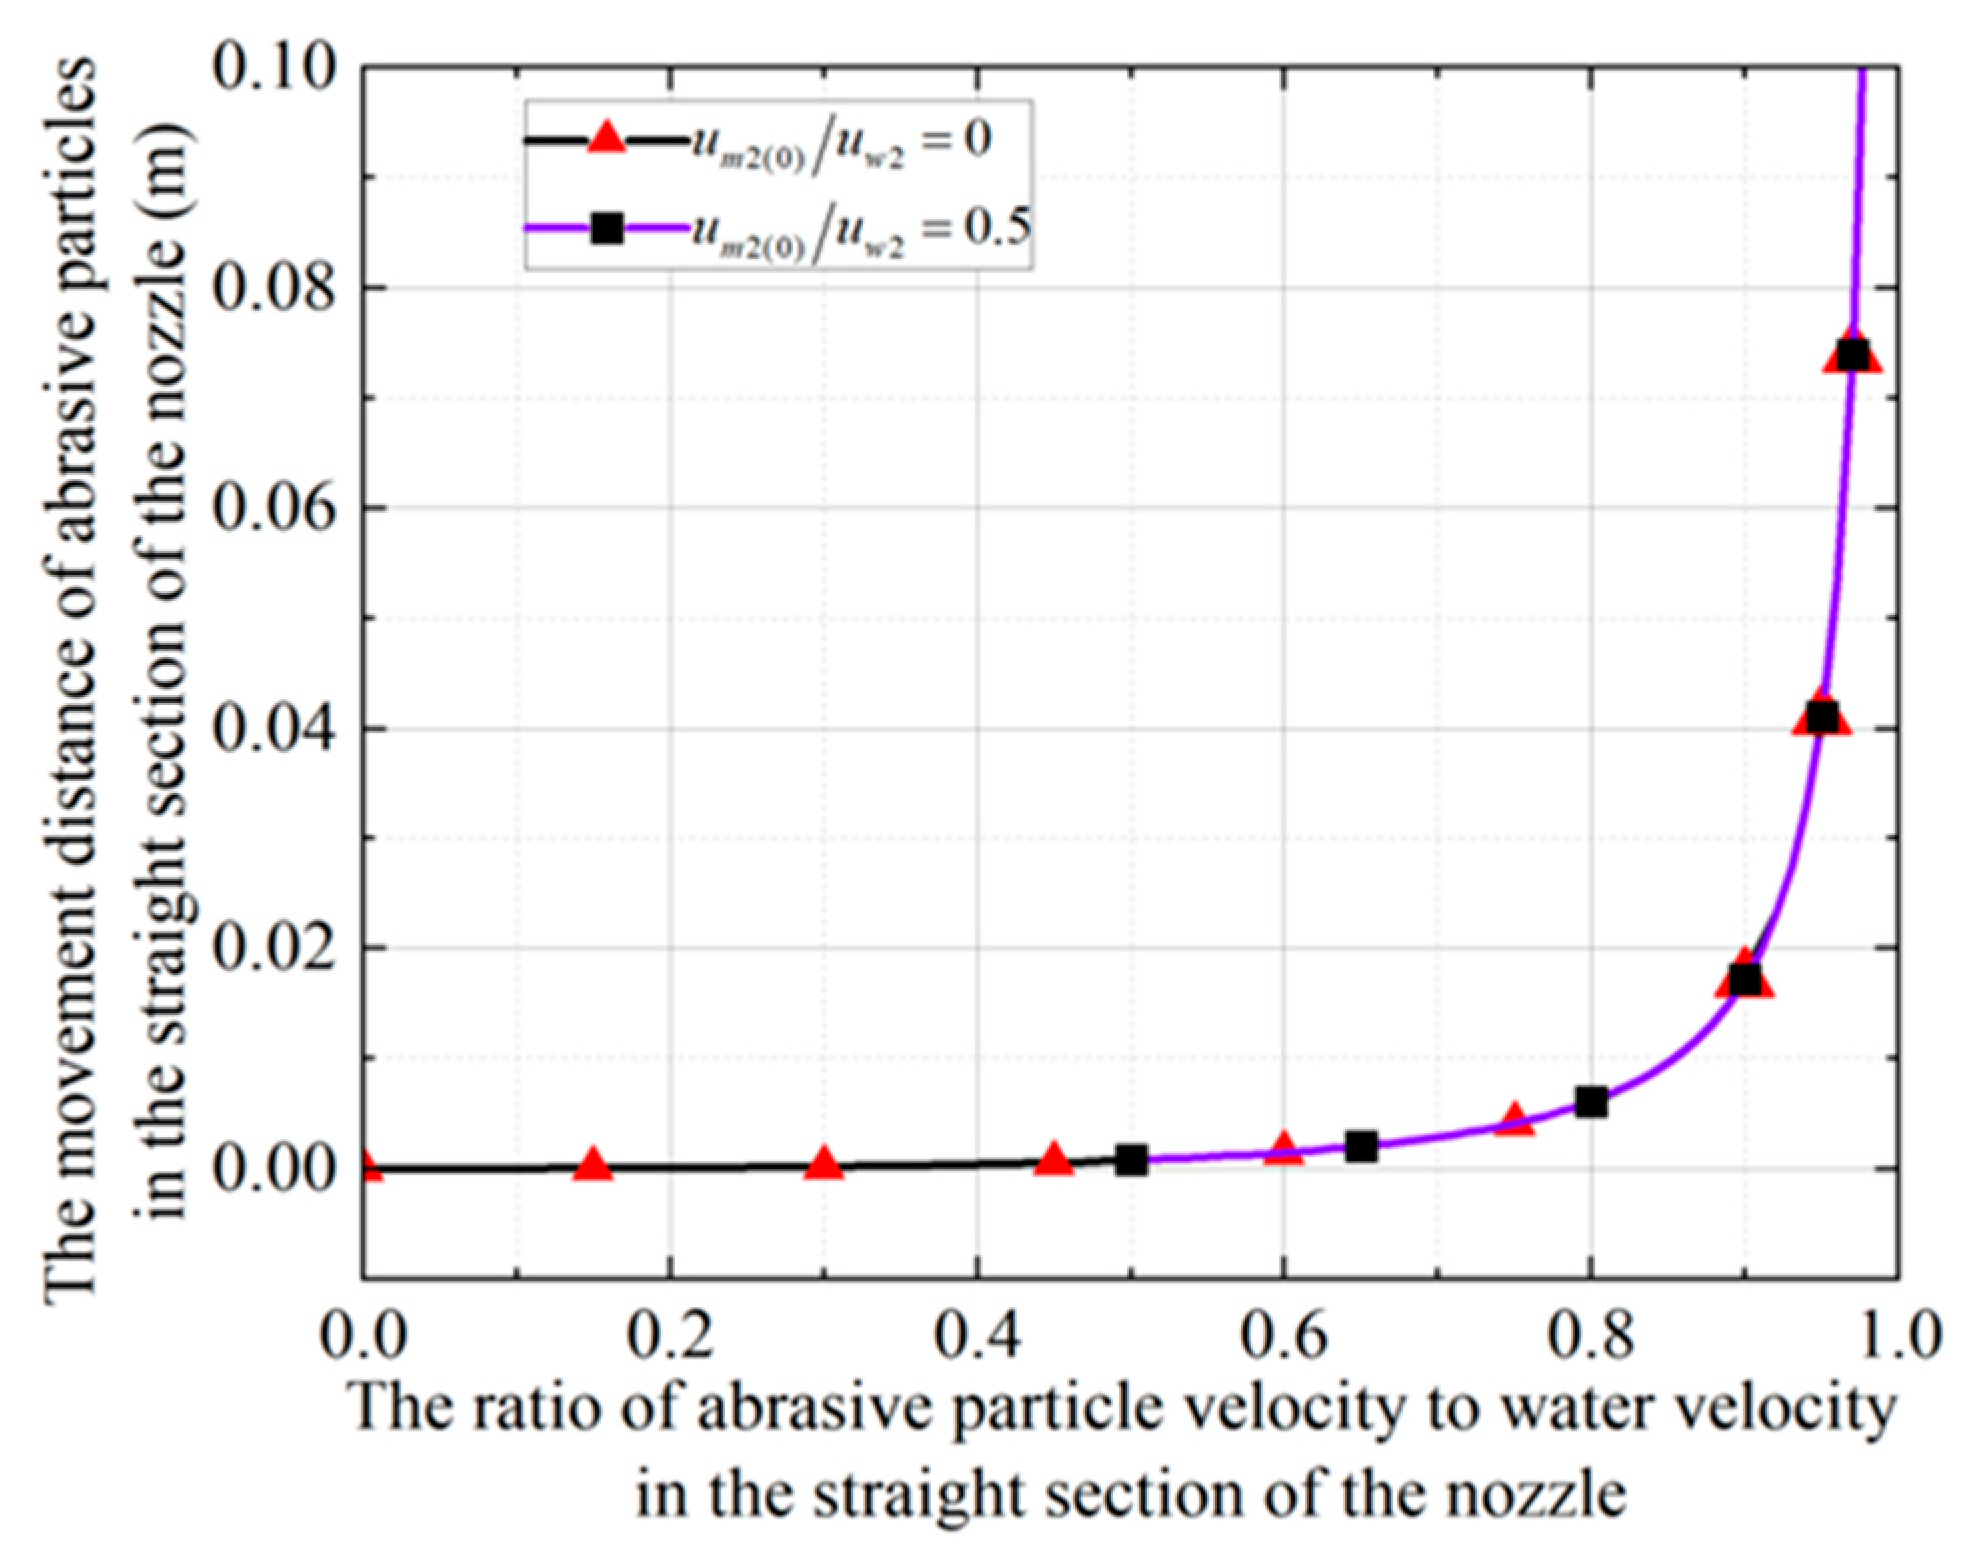
Taking C D = 0.44 [34], the physical property parameters of the abrasive particles and water, as shown in Table 2, as well as the structural dimensional parameters of the nozzle, are substituted into Equation (14) to obtain the relationship between the variation in the velocity u w 2 of the abrasive particles in the straight section of the nozzle and the distance x , as shown in Figure 2.
An analysis of Figure 2 shows that the abrasive particles in the nozzle’s straight section continue to accelerate; when the speed of the abrasive particles is accelerated to 90% of the water speed, the speed of the abrasive particles increases slowly. If we continue to increase the distance in the straight section of the abrasive particles, the increase in the impact is very limited; at the same time, the speed of the water in this process is basically constant. When the speed of the abrasive particles at the entrance of the straight section of the nozzle is accelerated from u m 2 ( 0 ) = 0 to 90% of the water speed, the required distance of the straight-line segment of the nozzle is 17.2 mm; if the speed of the abrasive particles at the entrance of the straight-line segment of the nozzle is accelerated from u m 2 ( 0 ) = 50 % u w 2 to 90% of the water speed, the required distance of the straight-line segment of the nozzle is 16.4 mm, and the difference between the two is very small. Therefore, the initial velocity of the abrasive particles at the entrance of the nozzle’s straight segment can be ignored. According to the nozzle structure, when the nozzle’s straight section length is 65 mm, the nozzle outlet velocity of the abrasive particles is 96% of the water outlet velocity; then, the velocity of the abrasive particles at the nozzle outlet is expressed by the velocity of water at the nozzle outlet as
u m 2 = 0.96 u w 2
According to the Bernoulli equation, the velocity of the water at the nozzle outlet is
u w 2 = ψ 2 P ρ w
In the formula, P is the pump driving pressure (MPa), and ψ is the velocity flow coefficient of the nozzle, ranging from 0.83 to 0.93 [35].
Substituting Equation (16) into Equation (15) yields
u m 2 = 0.96 u w 2 = 0.96 ψ 2 P ρ w

2.2. Decelerating Motion Process of Abrasive Particles

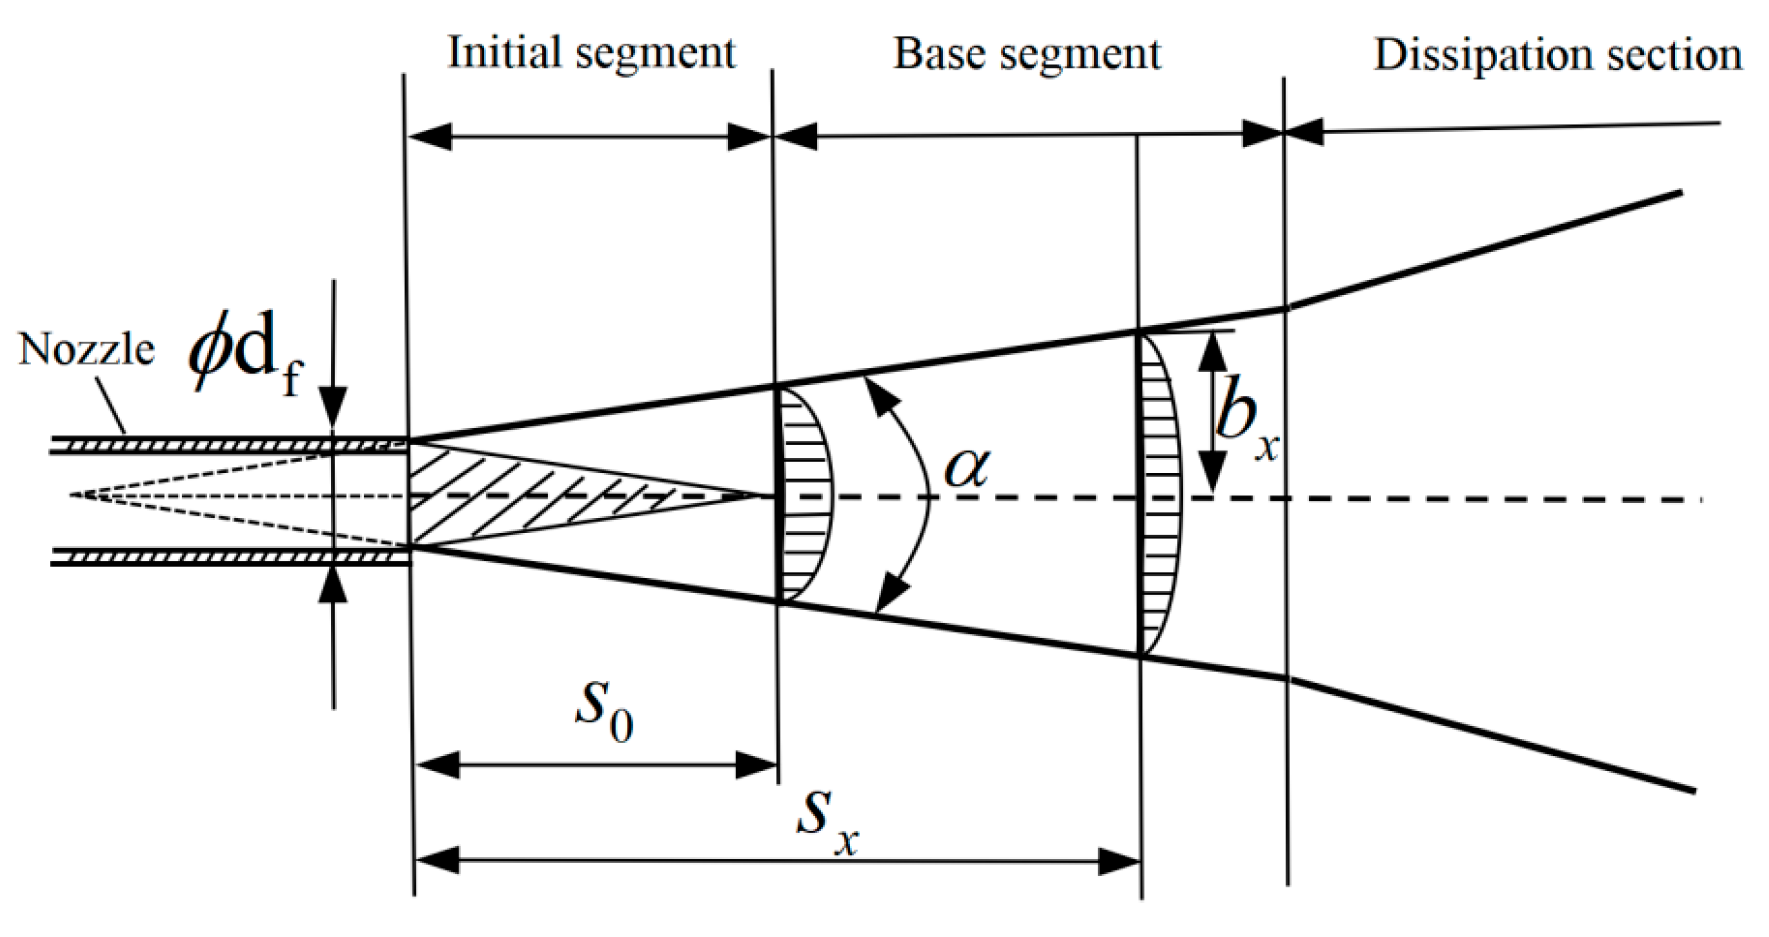
After the jet is ejected from the nozzle and enters the external environment, it interacts with the surrounding medium and causes the jet to diverge, as shown in Figure 3. In the initial stage, the degree of jet divergence is relatively small, and it can be considered that the jet velocity in the axial direction of this area does not decay, and the velocity of the abrasive particles in the jet does not change in the initial stage. In the basic stage, the jet velocity along the axis direction continuously decays, and the radial velocity decreases from the axis to the periphery. Moreover, the velocity of the abrasive particles in the jet decreases rapidly with an increase in the injection distance in the basic section of the jet. During the dissipation phase, the jet fuses with the ambient surrounding medium, and the jet becomes atomized.
The process of abrasive water jets impacting rocks is divided into the initial stage and the basic stage. The length of the initial section of the jet is proportional to the nozzle diameter and is unrelated to the fluid velocity at the nozzle outlet, and the length of the initial section satisfies [36,37]
s 0 = 6.2 d f = 6.2 m m
The relationship between the velocity u m of the abrasive jet axis and the jet distance s x along the axis is expressed as
u m = u m 2 s x s 0 6.2 d f s x u m 2 s x > s 0
Substituting Equation (17) into Equation (19), the relationship between the velocity of the abrasive jet axis and the distance of the jet along the axis is expressed as
u m = 0.96 ψ 2 P ρ w s x s 0 5.952 d f ψ s x 2 P ρ w s x > s 0

3. Establishment of Mathematical Model of Abrasive Particle Impact on Rock Breaking

When the AWJ impacts the rock, the rock will be damaged by the impact of the two-phase flow of the abrasive jet and the water jet at the same time, as shown in Figure 4. Firstly, the abrasive jet impact on the rock is a high-speed, high-frequency impact effect, which causes strong impact stress to be generated in the impacted area of the rock. When it is greater than the internal stress threshold of rock crushing, it causes rock crushing removal destruction; when it exceeds the ultimate tensile and shear strength of the rock, microcracks are generated inside, causing damage destruction. Secondly, water jets tend to act on the weakened surfaces (microcracks) of rocks damaged by abrasive jets; thus, the destructive capacity of water jets in the process of rock breaking is limited, and its effect can be ignored under certain circumstances. Therefore, the conditions for the crushing removal of rock by abrasive water jets are also studied based on the above aspects. Considering the dominant role of abrasive particles in the process of rock breaking, the influence of water can be ignored when analyzing the rock crushing removal conditions. The impact effect of abrasive particles on rocks can be converted into the continuous impact cluster effect of a certain number of abrasive particles within a certain period of time. From a microscopic perspective, a single abrasive particle impacting a rock is selected as the research object for analysis. Taking the impact of the abrasive water jet nozzles perpendicular to the rock surface as an example, a single high-speed abrasive particle ejected perpendicularly to the rock surface is selected for analysis. The abrasive particle is regarded as a rigid material and the rock is a non-rigid material, and the impact process between the two is considered an inelastic collision and contact problem. By analyzing the state of stress to which the rock is subjected, it is determined whether it is capable of damage and the form of damage. Since the damage evolution in the rock-breaking process occurs in steps and in real time, domestic and foreign scholars have mainly studied the crushing characteristics and damage mechanisms of rocks under jet impact through numerical simulation and experiments [38,39,40,41]. Therefore, it is necessary to establish a theoretical model of the jet impact rock crushing removal conditions to further improve our understanding of the rock-breaking mechanism.

3.1. Conditional Assumptions in Modeling

Based on the microscopic perspective, certain assumptions are made about the actual process of abrasive water jets impacting rocks: the abrasive particles are solid spheres of the same size, and the size differences between the abrasive particles are ignored. The rock is an elastic half-space body with isotropic homogeneity and no initial microcracks. The abrasive particles in the premixed AWJ are evenly distributed in the water during the acceleration process. The above assumptions are in line with the processing methods of abstract or microscopic analysis under certain conditions, aiming to facilitate a certain degree of simplification of the mathematical model and ensure that it can truly reflect the conditions of the abrasive water jet impacting a rock. At the same time, the correction coefficients of relevant parameters are introduced to verify the simplified parts in the model establishment process and establish a more accurate mathematical and theoretical model.

3.2. Theoretical Analysis of Abrasive Particles Impacting Rock

3.2.1. Theoretical Modeling of Single Abrasive Particle Impact on Rock Breaking

When the high-speed abrasive particles impact a breaking rock, significant crushing damage will occur on the surface of the rock, and, at the same time, there will be hidden damage, such as microfractures, deformation, and so on. Spherical cavity expansion theory is the main theory applied in solving the projectile impact problem [42]. This theory holds that, when a rigid abrasive particle of a certain mass impacts a rock at a certain speed, the disturbed rock will undergo plastic deformation and elastic deformation, and the spherical cavity zone, crushed zone, cracked zone, elastic zone, and undeformed zone are expanded in the impact region of the rock [43,44,45]. Let the spherical radius of the cavity area be a , the outer diameter of the rock crushing area be b , the outer diameter of the cracking area be c , and the outer diameter of the elastic deformation area be d , as shown in Figure 5. This paper uses spherical cavity expansion theory as a guide to analyze the scope and mechanical characteristics of each area in order to obtain a mathematical model of the conditions for the crushing removal of rocks under the impact of abrasive water jets.
According to the symmetry of the spherical cavity expansion model, its mass and momentum conservation equations can be expressed as follows [46]:
ρ s t + 1 r 2 ρ s r 2 u m r = 0
σ r r + 2 r σ r σ θ = ρ s u m t + v u m r
where r is the radial coordinate in the Euler coordinate system of the rock; ρ s is the density of the rock; u is the impact velocity of the abrasive particles; σ r is the radial stress; σ θ and σ φ are the annular stresses; t is the time; and the calculation process is positive in the direction of the pressure.
According to spherical cavity expansion theory, the displacement stress can be expressed by the following equation:
σ r = E s κ 1 ν s s r r + 2 ν s s r r
σ θ = σ φ = E s κ ν s s r r + s r r
Differentiating Equation (23) concerning r yields
d σ r d r = E s κ 1 ν s 2 s r r 2 2 ν s s r r 2 + 2 κ s s r r r
The stress equilibrium equation at an infinitesimal point on the rock is
d σ r d r + 2 ( σ r σ θ ) r = 0
Solving the combined Equations (23)–(26) yields
2 s r r 2 + 2 s r r r 2 s r r 2 = 0
① Scope of resilient areas
The boundary conditions in the elastic region are
σ θ | r = c = σ t σ r | r = d = 0
In the above equation, σ t is the tensile strength of the rock.
Based on the second-order variable coefficient differential equation and the Riccati equation solution method [47], the integral transformation of Equations (27) and (28) is performed to find the boundary displacement s r in the elastic zone:
s r = 1 E s σ t c 3 2 c 3 + b 3 2 1 2 ν s r + 1 + ν s d 3 r 2
Substituting Equation (29) into Equation (23) and Equation (24) yields an elastic region of σ r , σ θ as follows:
σ r = 2 c 3 σ t 2 c 3 + d 3 1 d 3 r 3 σ θ = c 3 σ t 2 c 3 + d 3 2 + d 3 r 3
According to the displacement continuity condition at the interface between the elastic and undeformed regions, Equations (28) and (30) are substituted into Equation (29) to find the minimum radius of the elastic region:
d = σ t c 3 E s u r 2 1 2 ν s r + 1 + ν s d 3 r 2 2 c 3 3
② Scope of cracked and broken areas
The generation of cracks is the damage caused by the hoop stress on the rock being greater than its tensile strength, and the crushing zones represent the crushing damage caused by the radial compressive stress in the plastic corresponding area of the rock being greater than the compressive strength of the rock. If the critical condition of rock breaking is reached during the impact of the abrasive particles on the rock, the crushed region is only minimally formed and is very small (i.e., b a ); therefore, the boundary condition of the crack area can be expressed as follows:
σ θ | r = c = σ t σ r | r = a = σ b c
where σ b c is the uniaxial compressive strength of the rock.
Taking the boundary condition as the integration interval, by applying Formula (27), the displacement s r of the crack area is obtained as
s r = 1 E s a 3 c 3 2 c 3 + a 3 1 + ν s σ t + σ b c 1 r 3 + σ b c c 3 2 σ t a 3 1 2 ν s r
By substituting Equation (33) into Equations (23) and (24), σ r and σ θ of the crack region can be obtained as
σ r = a 3 c 3 2 c 3 + a 3 2 r 3 σ t + σ b c + σ b c c 3 2 σ t a 3 σ θ = a 3 c 3 2 c 3 + a 3 1 r 3 σ t + σ b c + σ b c c 3 2 σ t a 3
Substituting r = c . into Equations (30) and (34), and based on the fact that the radial stress values on both sides of this point are equal (i.e., σ r = c + = σ r = c ), the radius c of the crack area can be obtained as
σ r = c + = 2 c 3 σ t 2 c 3 + d 3 1 d 3 c 3 = a 3 c 3 2 c 3 + a 3 2 c 3 σ t + σ b c + σ b c c 3 2 σ t a 3 = σ r = c
By rearranging Equation (35), the following can be obtained:
d 3 c 3 2 c 3 + a 3 σ t = 2 c 3 + d 3 3 a 3 σ b c + 2 a 3 σ t 2 c 3 σ t
Treating the rock as a semi-infinite state, then there is c d , which is obtained by further simplification by dividing both sides of Formula (36) by d 3 at the same time:
c = 3 a 3 σ b c + a 3 σ t 4 σ t 3
When the process of abrasive particles impacting the rock reaches the critical condition for rock breaking, the crushing area is initially formed; the crack radius can be used to approximately replace the crushing radius, and the coefficient K c can be used to correct it, where K c 1 .
③ Scope of cavity area
Hertz elastic contact analysis is used to analyze the collision between a single abrasive particle and a rock under an abrasive water jet. The abrasive particles are regarded as impacting the rock under the action of a concentrated force, and small disturbances will occur in the contact area on the rock surface. During the inelastic collision contact between the two, the collision extrusion process ends when the relative velocity between the two is zero; at this time, the ball crown indentation formed by collision extrusion reaches its maximum value. A spherical cavity area is formed on the rock surface, and the radius of its largest concave notch circle is a . The Hertz contact force at this time is the maximum impact pressure ( F t max ) generated at the end of the extrusion process, and the principal stress at each point in the spherical indentation is not equal to the average stress ( F t max / S ) on the entire spherical indentation surface but presents a certain distribution law. Under the impact pressure of the abrasive particles, all points in the spherical-shaped indentation are in a three-way stress state.
According to Hertz contact theory [48,49], the indentation depth and cavity radius at the end of compression are expressed as follows:
δ = 9 F e 2 16 ζ r m 1 ν m 2 E m + 1 ν s 2 E s 2 1 3
a = 3 F e ζ r m 4 1 ν m 2 E m + 1 ν s 2 E s 1 3
In the formula, F e is the concentration force acting on the abrasive particles; ν m and ν s are the Poisson’s ratios of the abrasive particles and the rock, respectively; E m and E s are Young’s moduli of the abrasive particles and the rock, respectively; ζ ( ζ > 1 ) is the shape modification coefficient of the abrasive particles [50], which reflects the degree to which the abrasive particles deviate from the sphere in shape, and the more angular they are, the larger the shape modification coefficient; and r m is the abrasive particle radius.

3.2.2. Calculation of Maximum Concentrated Force of Abrasive Particles Impacting Rock

Adjusting Formula (38), the relationships among the pressure F e between the abrasive particles and the rock and other parameters can be obtained as follows:
F e = 4 δ 3 2 ζ r m 1 2 3 1 ν 1 2 E 1 + 1 ν 2 2 E 2
According to Newton’s second law, the differential equation of motion during the collision deceleration process can be expressed as follows:
m m · d u m d t = F e
where m m is the mass of the abrasive particles, and u m is the velocity of the abrasive particles. The relationship between the relative velocity and absolute speed can be obtained as follows:
u r = d δ d t = u m + u s = u m
In the above formula, u r is the relative velocity between the abrasive particles and rock; u s is the velocity of the rock, where u s 0 .
Taking the derivatives of both sides of Formula (42) concerning time t ,
d u r d t = d 2 δ d t 2 = d u m d t = F e m m
We substitute Formula (40) into Formula (43) to get
d 2 δ d t 2 = 4 δ 3 2 ζ r m 1 2 3 m m 1 ν m 2 E m + 1 ν s 2 E s
Multiplying both sides of Formula (44) by d δ converts it into a differential equation of δ :
1 2 d d δ d t 2 = d 2 δ d t 2 · d δ = 4 δ 3 2 r m 1 2 3 m m 1 ν m 2 E m + 1 ν s 2 E s · d δ
Integrating both sides of Formula (45) simultaneously, the left side of the formula is the integral of the relative velocity interval, and the right side is the integral of the relative displacement interval corresponding to the relative velocity interval. Substituting Formula (40) into it, we obtain
u r 0 u r t 1 2 d u r 2 d u r = δ 0 δ t 4 δ 3 2 ζ r m 1 2 3 m m 1 ν m 2 E m + 1 ν s 2 E s · d δ
where u r 0 denotes the collision impact of the abrasive particles and rock before the start of the relative speed ( u r 0 = u m ), considering the corresponding collision impact between the abrasive particles and rock before the relative displacement of δ 0 (i.e., δ 0 = 0 ). u r t is the relative velocity of the abrasive particles after the collision impact with the rock, and the corresponding relative displacement after impact is δ t . When the relative velocity of the collision between the two is the smallest (i.e., u r t = 0 ), the relative displacement of the collision between the two reaches the maximum (i.e., δ t = δ t max ), and, at this time, the contact pressure between the two also reaches the maximum.
Integrating Formula (46) yields
1 2 u r t 2 u r 0 2 = 8 ζ r m 1 2 15 m m 1 ν m 2 E m + 1 ν s 2 E s δ t 5 2 δ 0 5 2
When u r t = 0 , substituting δ 0 = 0 , δ t = δ t max , and u r 0 = u m into Formula (47) yields
δ t max = 15 m m u r 0 2 1 ν m 2 E m + 1 ν s 2 E s 16 ζ r m 1 2 2 5
Substituting Formula (48) into Formula (40) yields the maximum contact pressure F t max ; at this time, the maximum contact pressure is equal to the equivalent concentrated force of the high-speed abrasive particles impacting the rock (i.e., F t max = F e ):
F e = F t max = 4 3 15 16 3 5 ζ r m 1 5 m m 3 5 u m 6 5 1 ν m 2 E m + 1 ν s 2 E s 2 5
Substituting Formula (49) into Formula (39) gives the value of the cavity radius:
a = 15 16 3 5 ζ r m 6 5 · m m 3 5 · u m 6 5 1 ν m 2 E m + 1 ν s 2 E s 3 5 1 3
We substitute Formula (50) into Formula (37) to obtain the value of the radius of the plastic crack region:
c = 15 16 3 5 ζ r m 6 5 m m 3 5 u m 6 5 1 ν m 2 E m + 1 ν s 2 E s 3 5 ( 3 σ b c + σ t ) 4 σ t 3

3.2.3. Maximum Contact Stress of Abrasive Particles Impacting Rock

According to Hertz contact theory, the contact between the abrasive particles and rock is Hertz pressure, and the pressure distribution in the region of contact disturbance satisfies the following equation [51]:
F ( r a ) = F 0 ( 1 r a 2 / r 0 ) 1 2
F 0 = 3 F e 2 π r 0 2
where r 0 is the radius of the circular domain of the Hertzian pressure distribution; r a is the radius from a point in the circular domain to the center of the circular domain; and F 0 is the maximum pressure.
When the critical conditions for rock crushing removal are reached during the impact breaking of the abrasive particles, according to spherical cavity expansion theory, because the forces and deformations in the elastic region of the rock and beyond are small enough to be ignored, they are not considered to be within the destruction of the rock. Therefore, the radius of the disturbed region of the rock can be considered as the distance from the center of the contact point to the interface separating the cracked region from the elastic region (i.e., the radius of the circular domain is c , r 0 = c ). Based on knowledge of elastic contact mechanics, when the pressure acting on the circular domain is Hertz pressure, the stress calculation process [46] is as follows.
① The stress formula for the rock surface point (i.e., z = 0 ) within the circular domain is as follows:
σ r ¯ = F e ( 1 2 ν s ) 2 π c 2 c 2 / r a 2 1 1 r a 2 / c 2 3 / 2 3 F e 2 π c 2 1 r a 2 / c 2 1 / 2 σ θ ¯ = F e ( 1 2 ν s ) 2 π c 2 c 2 / r a 2 1 1 r a 2 / c 2 3 / 2 3 F e ν s π c 2 1 r a 2 / c 2 1 / 2 σ z ¯ = 3 F e 2 π c 2 1 r a 2 / c 2 1 / 2
where σ r ¯ is the radial stress in the cylindrical coordinate system, σ θ ¯ is the circumferential stress in the cylindrical coordinate system, and σ z ¯ is the axial stress in the cylindrical coordinate system.
② The formula for the stress along the z -axis at a point in the circular domain is as follows:
σ r ¯ = σ θ ¯ = 3 F e ( 1 + ν s ) 2 π c 2 1 z / r a t g 1 r a / z + 3 F e 4 π c 2 1 + z 2 / c 2 1 σ z ¯ = 3 F e 2 π c 2 1 + z 2 / c 2 1
When r = 0 , z = 0 is at the center of the circle, and the maximum compressive stress is generated at the center of the contact surface:
σ z ¯ max = 3 F e 2 π c 2 = 2 π 15 16 1 5 ζ r m 3 5 m m 1 5 u m 2 5 1 ν m 2 E m + 1 ν s 2 E s 4 5 3 σ b c + σ t 4 σ t 2 3

3.2.4. Conditions for Crushing Removal by Abrasive Particles Impacting Rock

Since the condition for direct rock crushing is determined based on the critical crushing pressure (compressive strength threshold), when the jet pressure reaches the threshold, the binding force between the particles inside the rock is completely overcome, resulting in structural instability and crushing. If the pressure is lower than the threshold, only crack damage or shear slip damage can be formed on the rock, and direct crushing destruction cannot be achieved. Therefore, the direct rock crushing conditions are more in line with the actual needs of jet cutting rock engineering. According to the boundary conditions of the rock crushing area in cavity expansion theory ( σ r | r = a = σ b c ), we can obtain
σ z ¯ max σ bc
Substituting Formula (57) into Formula (56) leads to
u m π σ b c 2 5 2 15 16 1 2 ζ r m 3 2 m m 1 2 1 ν m 2 E m + 1 ν s 2 E s 2 3 σ b c + σ t 4 σ t 5 3
Taking the shape coefficient ζ = 1.5 , and substituting the relevant performance parameters of the abrasive particles and limestone in Table 2 and Table 3 into Equation (58), the minimum impact velocity for rock breaking is calculated as
u m 36 m / s
Taking the target distance as 10 mm ( s x = 10 m m ), ψ = 0.83 , and we substitute Formula (59) into (20) to calculate
u m = 5.952 d f ψ s x 2 P ρ w 36
Solving for the minimum pressure to break the rock, we have
P 18.29 ρ w s x 2 d f 2 ψ 2 2.7 Mpa

4. Simulation Analysis

4.1. Numerical Model Establishment

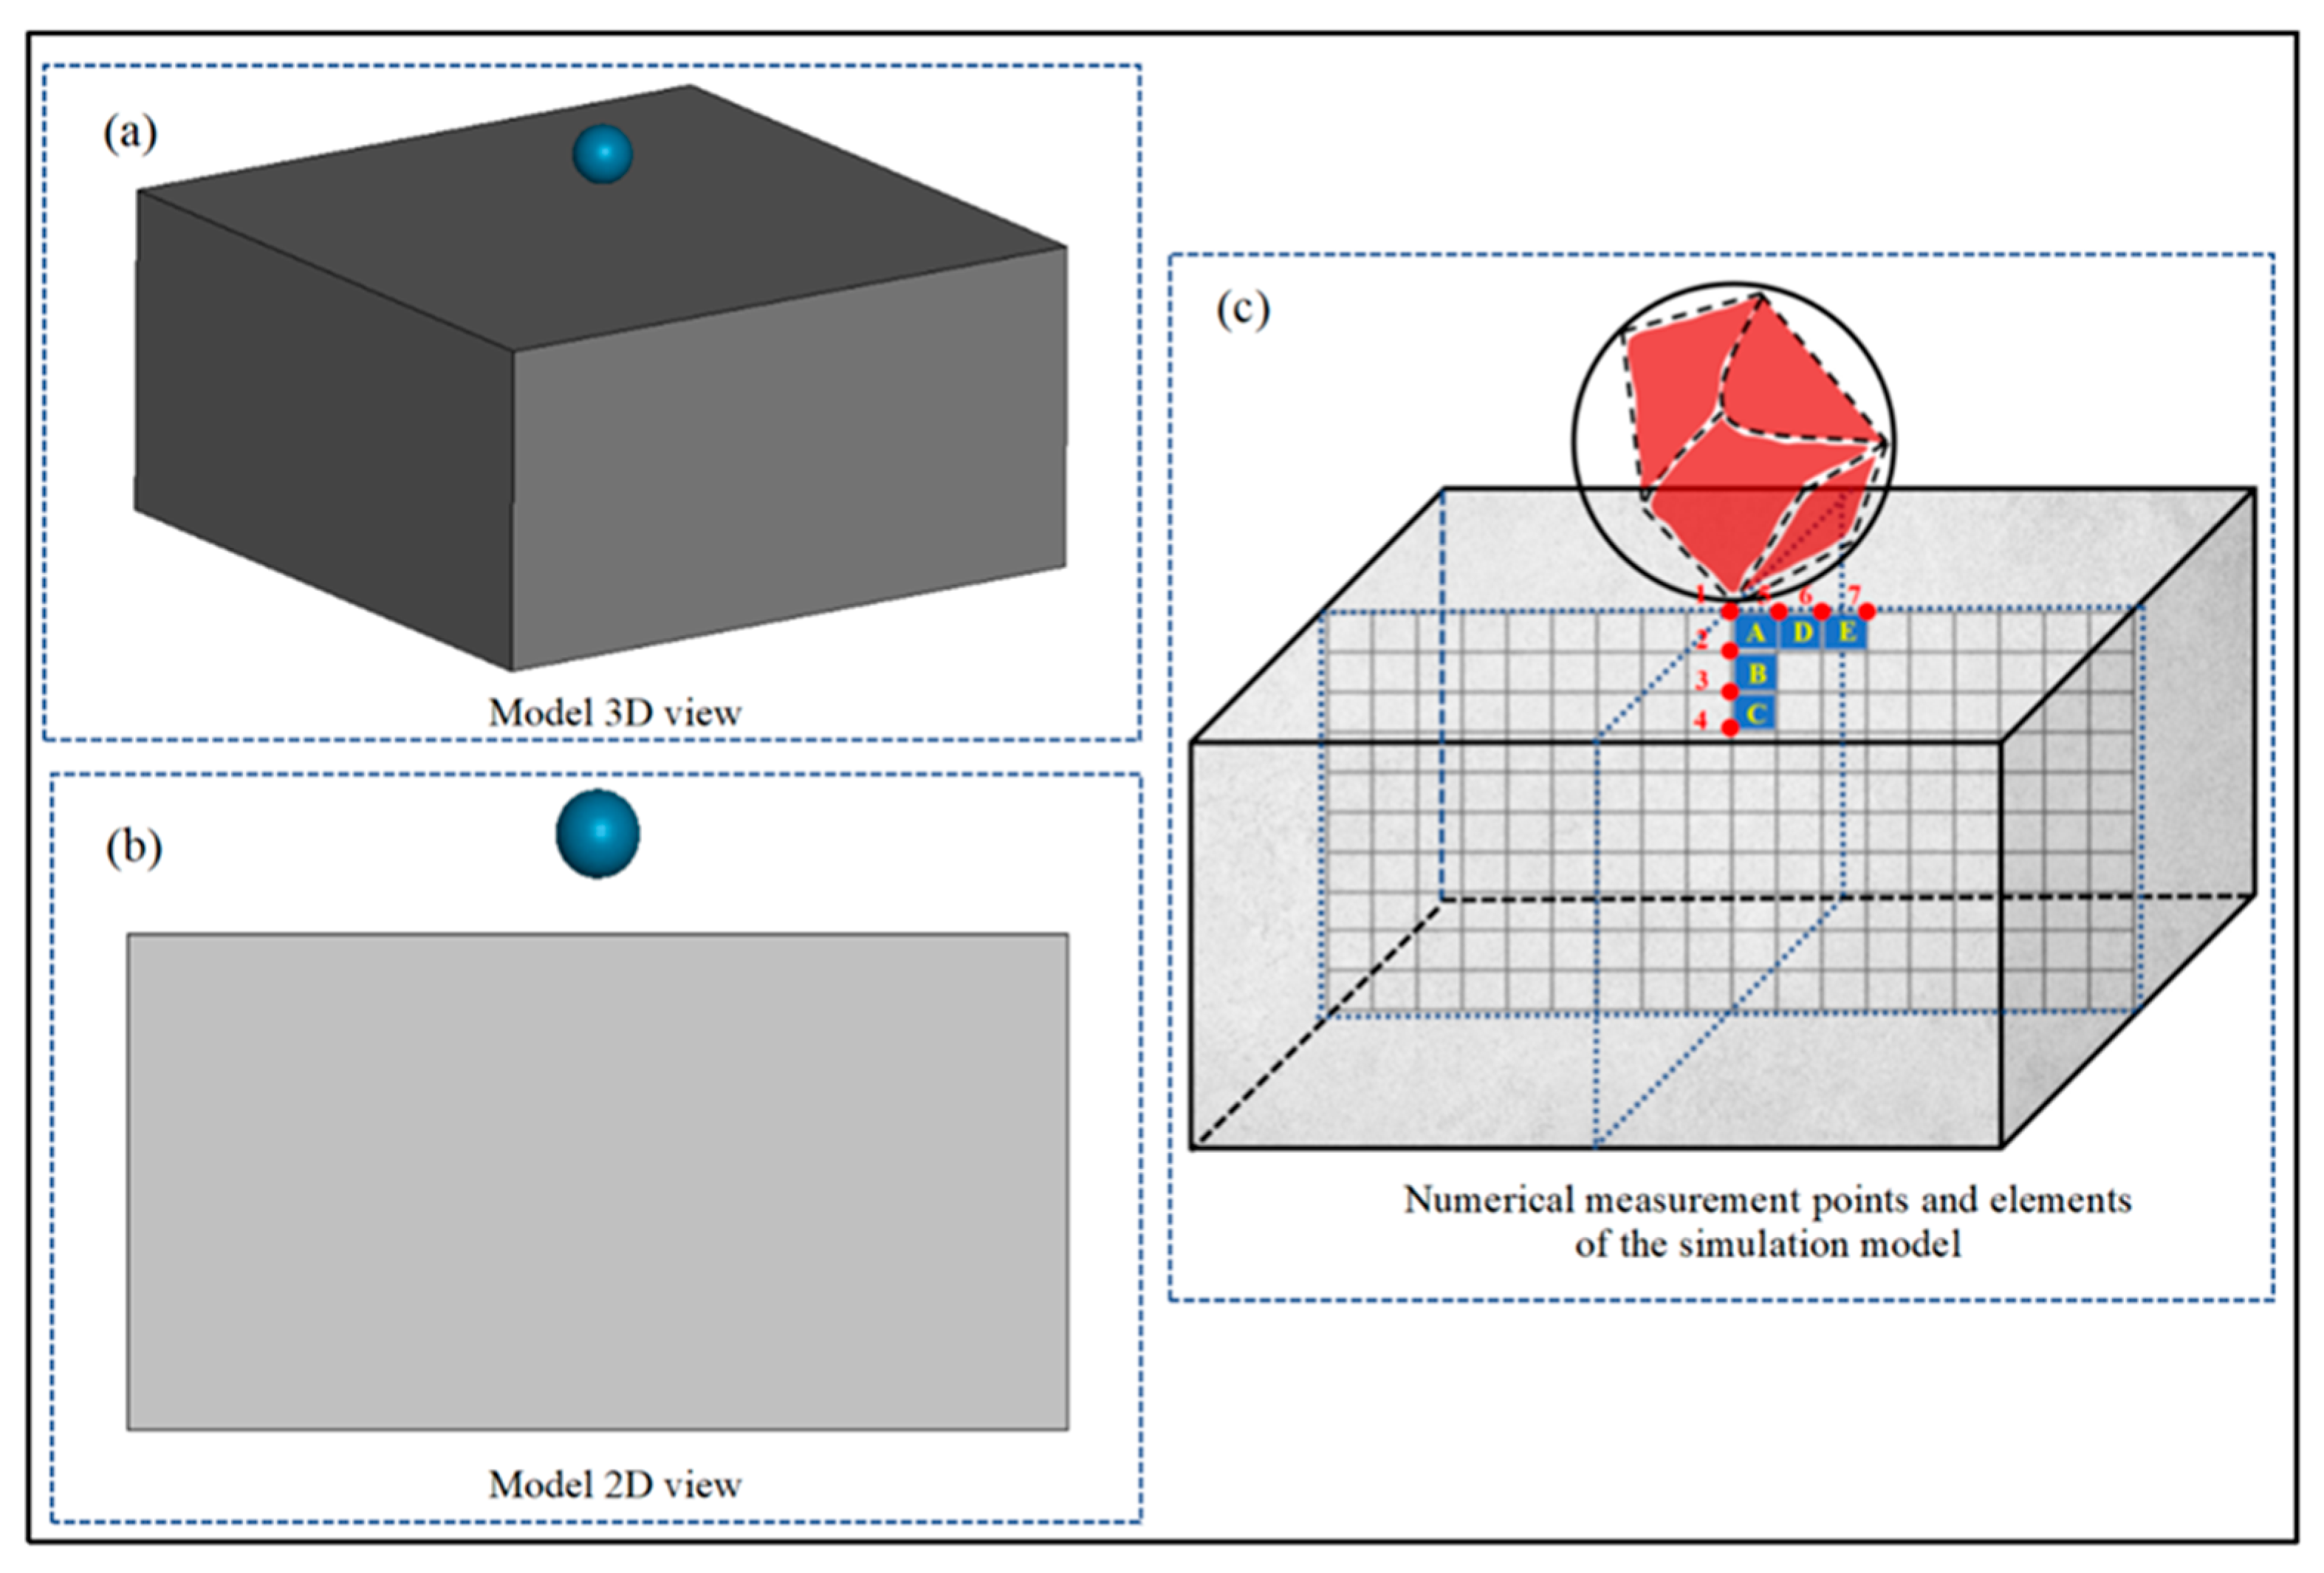
Based on simulation software, a three-dimensional simulation model of abrasive particles’ impact on rocks is established to perform a transient kinetic analysis of abrasive particles’ impact on rock breaking. The abrasive particles are regarded as circular rigid bodies with a particle diameter of 0.18 mm. Based on the physical characteristics of the rock, the rock is regarded as a homogeneous material body; the rock can be regarded as an elastically brittle body, which is represented by the RHT model. The RHT constitutive model was proposed by Riedel, Hiermaier, and Thoma [52]; this model describes the elastic stage, linear strengthening stage, and damage softening stage corresponding to the stress–strain curves of brittle materials by introducing the elastic limit surface, failure surface, and residual strength surface. It can accurately describe the strain rate effects of brittle materials under compression and tension conditions by introducing a dynamic strain rate enhancement factor. It is therefore suitable for simulating the mechanical behavior under high-strain-rate impact loads, and it is thus suitable for the damage constitutive models of brittle materials such as rocks. The p-α state equation is used to describe the pressure–porosity relationship in the material, and the dynamic impact compression behavior is fitted with the Hugoniot curve. The state equation parameters are used to characterize the volume compression characteristics of the material under high pressure, and the porosity α is used as a variable to reflect the densification process. The rock model is simplified to a cuboid (0.2 cm × 0.1 cm × 0.2 cm), and the distance from the center of the abrasive particle to the rock surface is 0.02 cm. The model is essentially based on a finite element mesh, where the rock material model is discretized through solid elements, and the Lagrange algorithm is used to describe solid deformation and failure. When the element stress exceeds the critical damage stress threshold, damage begins to accumulate rather than being removed immediately. At this point, the element can still withstand a certain increase in stress until it is crushed and removed, while the stress threshold for the direct deletion of the element is based on the compressive strength criterion. The RHT model is usually used in conjunction with the LS-DYNA explicit solver. Considering the feasibility and efficiency of the model solution, it is necessary to ensure that the grid elements are sufficiently dense. The total number of abrasive particle element cells is 23,625, and the total number of rock element cells is 62,500. The displacement of the abrasive particle along the X-axis and Z-axis is set to 0, and the abrasive particle can move along the Y-axis. The rotation of the abrasive particle around the X-axis, Y-axis, and Z-axis is set to 0°. The non-reflecting boundary condition is applied to the rock side, the rock bottom is fully constrained, and the abrasive particles impact the rock vertically. The simulation impact velocity is set by the keyword “INITIAL_VELOCITY_GENERATION”, and the contact setting between the abrasive particles and the rock is realized by the keyword “CONTACT ERODING SURFACE TO SURFACE”, which allows the rock surface elements to fail due to damage accumulation to simulate the crushing process. For the corresponding parameter values for the abrasive particles and rocks in the simulation, refer to Table 2, Table 3 and Table 4. Based on the parameter sensitivity of the RHT constitutive model, the parameter values of the RHT constitutive model of limestone are determined in combination with the relevant literature [52,53,54] and a rock performance parameter calibration experiment. The main relevant parameters are shown in Table 4, and the simulation model is shown in Figure 6.

4.2. Simulation Analysis of the Abrasive Impact on Rock

The critical impact velocity of 36 m/s for rock crushing removal conditions, calculated by the mathematical theoretical model, is taken as the benchmark. Considering consistency with the subsequent verification test parameters, i.e., when the jet pressure of the test is selected as 2 MPa, 3 MPa, and 5 MPa, the corresponding impact velocities are 30 m/s, 36 m/s, and 50 m/s, respectively. Therefore, the simulated impact velocity is set to the above velocity value, and the data of the marked points and marked elements on the model are monitored and analyzed; the rules of point displacement, element stress, and deformation under the impact velocity are obtained. The marking points and marking units are points 1, 2, 3, 4, 5, 6, and 7 and elements A, B, C, D, and E in Figure 6.
(1)
Displacement change rule of marking points under different impact velocities
In Figure 7a, the displacement curve when the impact velocity is 30 m/s is shown; it can be seen that the maximum displacement changes in the order of point 1, point 2, point 5, point 3, point 6, point 4, and point 7. The displacement of point 1 first reaches the maximum value downward with the impact time and then recovers to a certain value below the baseline as the abrasive particle rebounds. It then remains basically unchanged, indicating that elastic–plastic deformation occurs at point 1. According to an analysis of the rock’s complete stress–strain curve [55,56], this point is in the unstable development stage of rock cracks. The displacements of points 2, 5, 3, 6, and 4 first reach the maximum values downward with the impact time; then, as the abrasive particles rebound, the displacements of these points return to a certain value above the baseline and then remain unchanged, indicating that these points are in the stable development stage of rock cracks, and new microcracks begin to appear inside the rock, causing the effect of volume expansion. The displacement of point 7 first reaches the maximum value downward with the impact time and then remains basically unchanged after the displacement of the point recovers to the baseline as the abrasive rebounds, indicating that elastic deformation occurs at point 7 and that this point is in the elastic deformation stage. In Figure 7b, the curve for an impact velocity of 36 m/s is shown. Analysis shows that the displacement at point 1 with the impact time firstly reaches the maximum value downwards, and then the displacement of the point instantly returns to the baseline and remains unchanged, indicating that crushing removal occurs at point 1. The reason is that, when the plastic deformation of the rock gradually accumulates and reaches the compressive strength of the rock, it causes the rock to be broken, ruptured, and removed. Based on an analysis of the full stress–strain curve of the rock, points 2, 3, 4, and 5 are in the unstable development stage of rock cracks. Point 6 is in the stable development stage of rock cracks. Point 7 is in the elastic deformation stage. In Figure 7c, the curve for an impact velocity of 50 m/s is shown. Analysis shows that the displacements of point 1 and point 5 with the impact time successively decrease to reach the maximum value, and then the displacement instantly recovers to the baseline and remains unchanged, indicating that rupture removal occurs at point 1 and point 5, and the order in which the two-point displacement reaches the maximum indicates that the rock can be continuously fractured and removed at this speed. Points 2, 3, and 4 are in the unstable development stage of rock cracks, while points 6 and 7 are in the stable development stage of rock cracks. In summary, the displacement of the marking points along the Y direction conforms to the corresponding relationship between the theoretical impact velocity and the simulation setting velocity.
(2)
Stress cloud diagrams and stress variation law of rock under different impact velocities
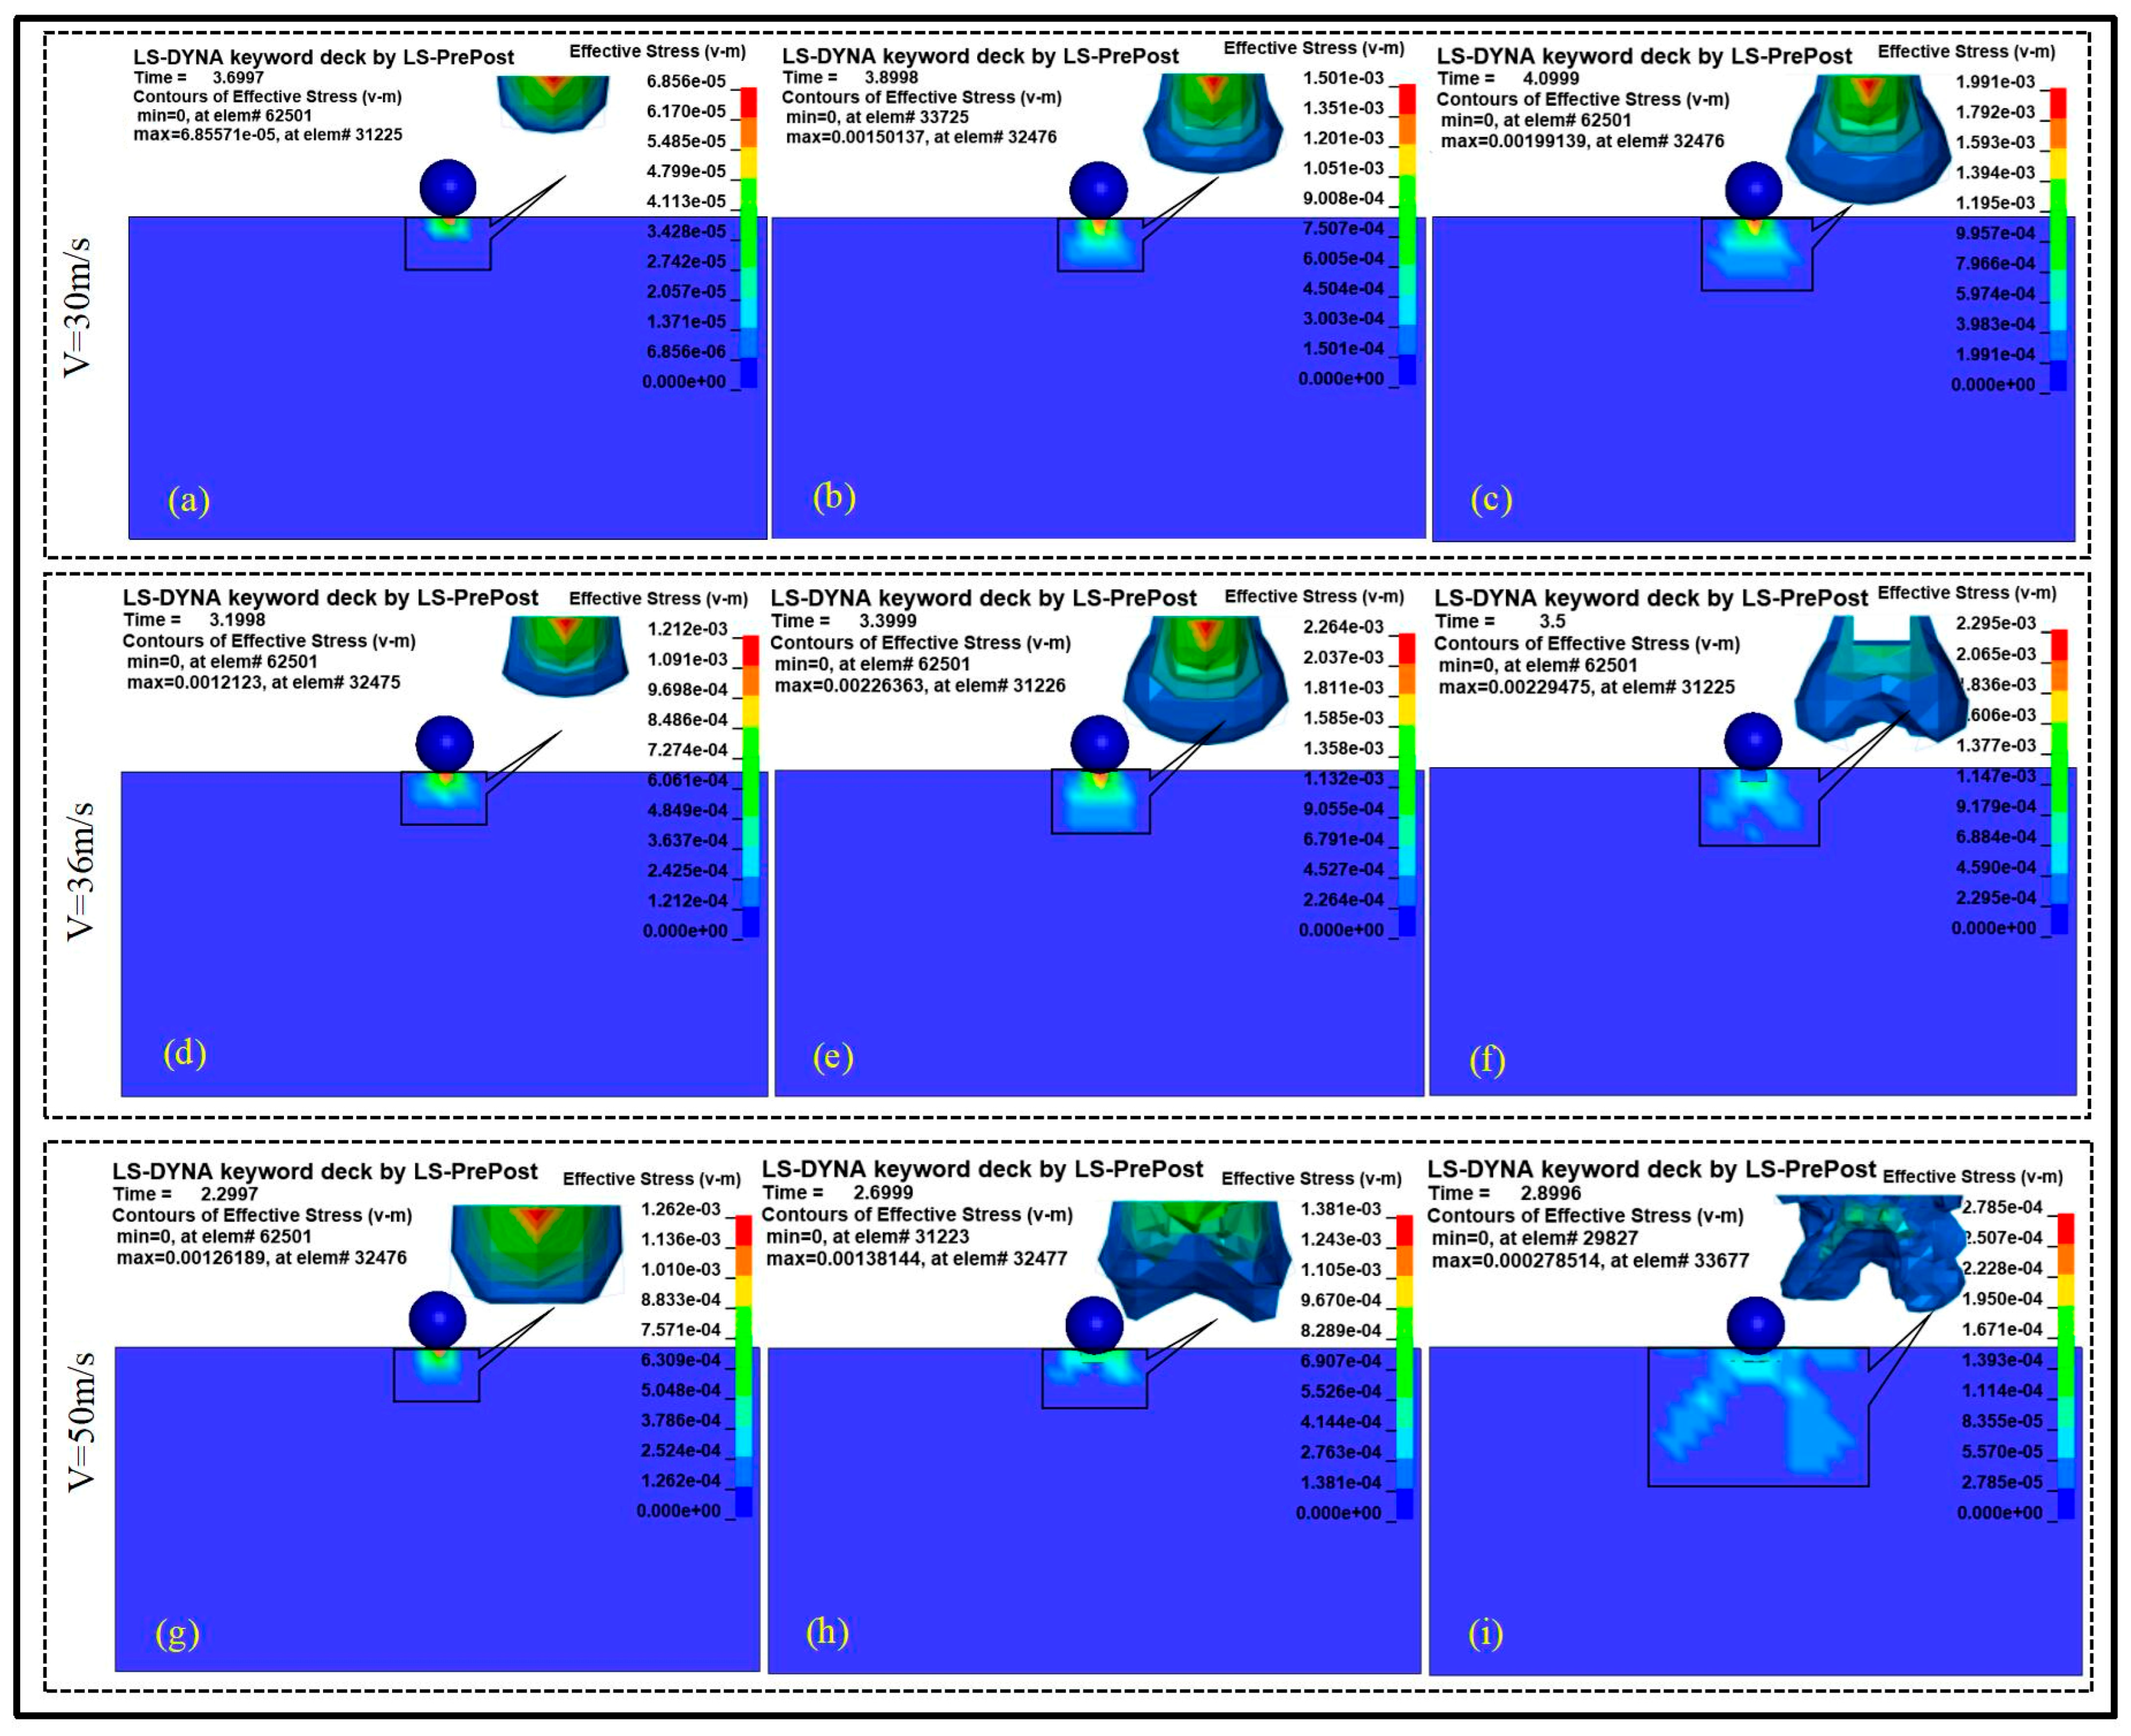
The stress intensity differences among various parts of the rock are visualized through the distribution of stress cloud diagrams, especially in areas with high stress concentration. The Y-direction stress cloud diagram and the effective stress cloud diagram of the rock under different impact velocities are shown in Figure 8 and Figure 9, respectively.
In Figure 8 and Figure 9, (a) to (c) present stress cloud diagrams of the rock compressed at different times when the impact velocity is 30 m/s. As the impact time increases, the cloud diagram expands approximately in a spherical shape centered on the contact point, and it shows a rapid spherical expansion trend with the increase in time. However, the range of the stress cloud diagram affected by impact is still relatively small compared to the rock as a whole. In Figure 8 and Figure 9, (d) to (f) present the stress cloud diagrams with an impact velocity of 36 m/s. As the impact velocity and time increase, the spherical diffusion area range and expansion speed are larger and faster than in the former case (30 m/s). The stress cloud diagrams of the impact area in Figure 8e and Figure 9e are still approximately spherical. However, as the impact time increases further, the stress cloud diagrams of the impact area in Figure 8f and Figure 9f are no longer spherical but show a depression at the bottom, which indicates the crushing removal of the rocks within the impact area. In Figure 8 and Figure 9, (g) to (i) present the stress cloud diagrams when the impact velocity is 50 m/s. However, compared with that at other impact velocities, as the impact time increases, the stress in the cloud diagrams shows a trend of first increasing and then decreasing. The reason is that the maximum compressive stress values in Figure 8g and Figure 9g do not reach the compressive strength of the rock, making the stress range in the impact area approximately spherical. As the impact time continues to increase, the rock subjected to compressive stress continues to increase; when the compressive stress value exceeds the compressive strength of the rock, the rock is broken and removed, causing pressure relief and causing the maximum compressive stress of the rock to fluctuate. In Figure 8 and Figure 9, (h) to (i) reflect this phenomenon. The effective stress value of the rock has an overall increasing trend compared to the Y-direction stress value, mainly because the effective stress reflects the comprehensive stress state of the rock, while the Y direction only describes the stress state in a certain direction. However, both reflect the evolution law of the internal stress of the rock, so the expansion shape and law shown are similar. In summary, the element stress cloud diagram in the Y direction and the element effective stress cloud diagram conform to the corresponding relationship between the theoretical impact velocity and the simulation velocity.
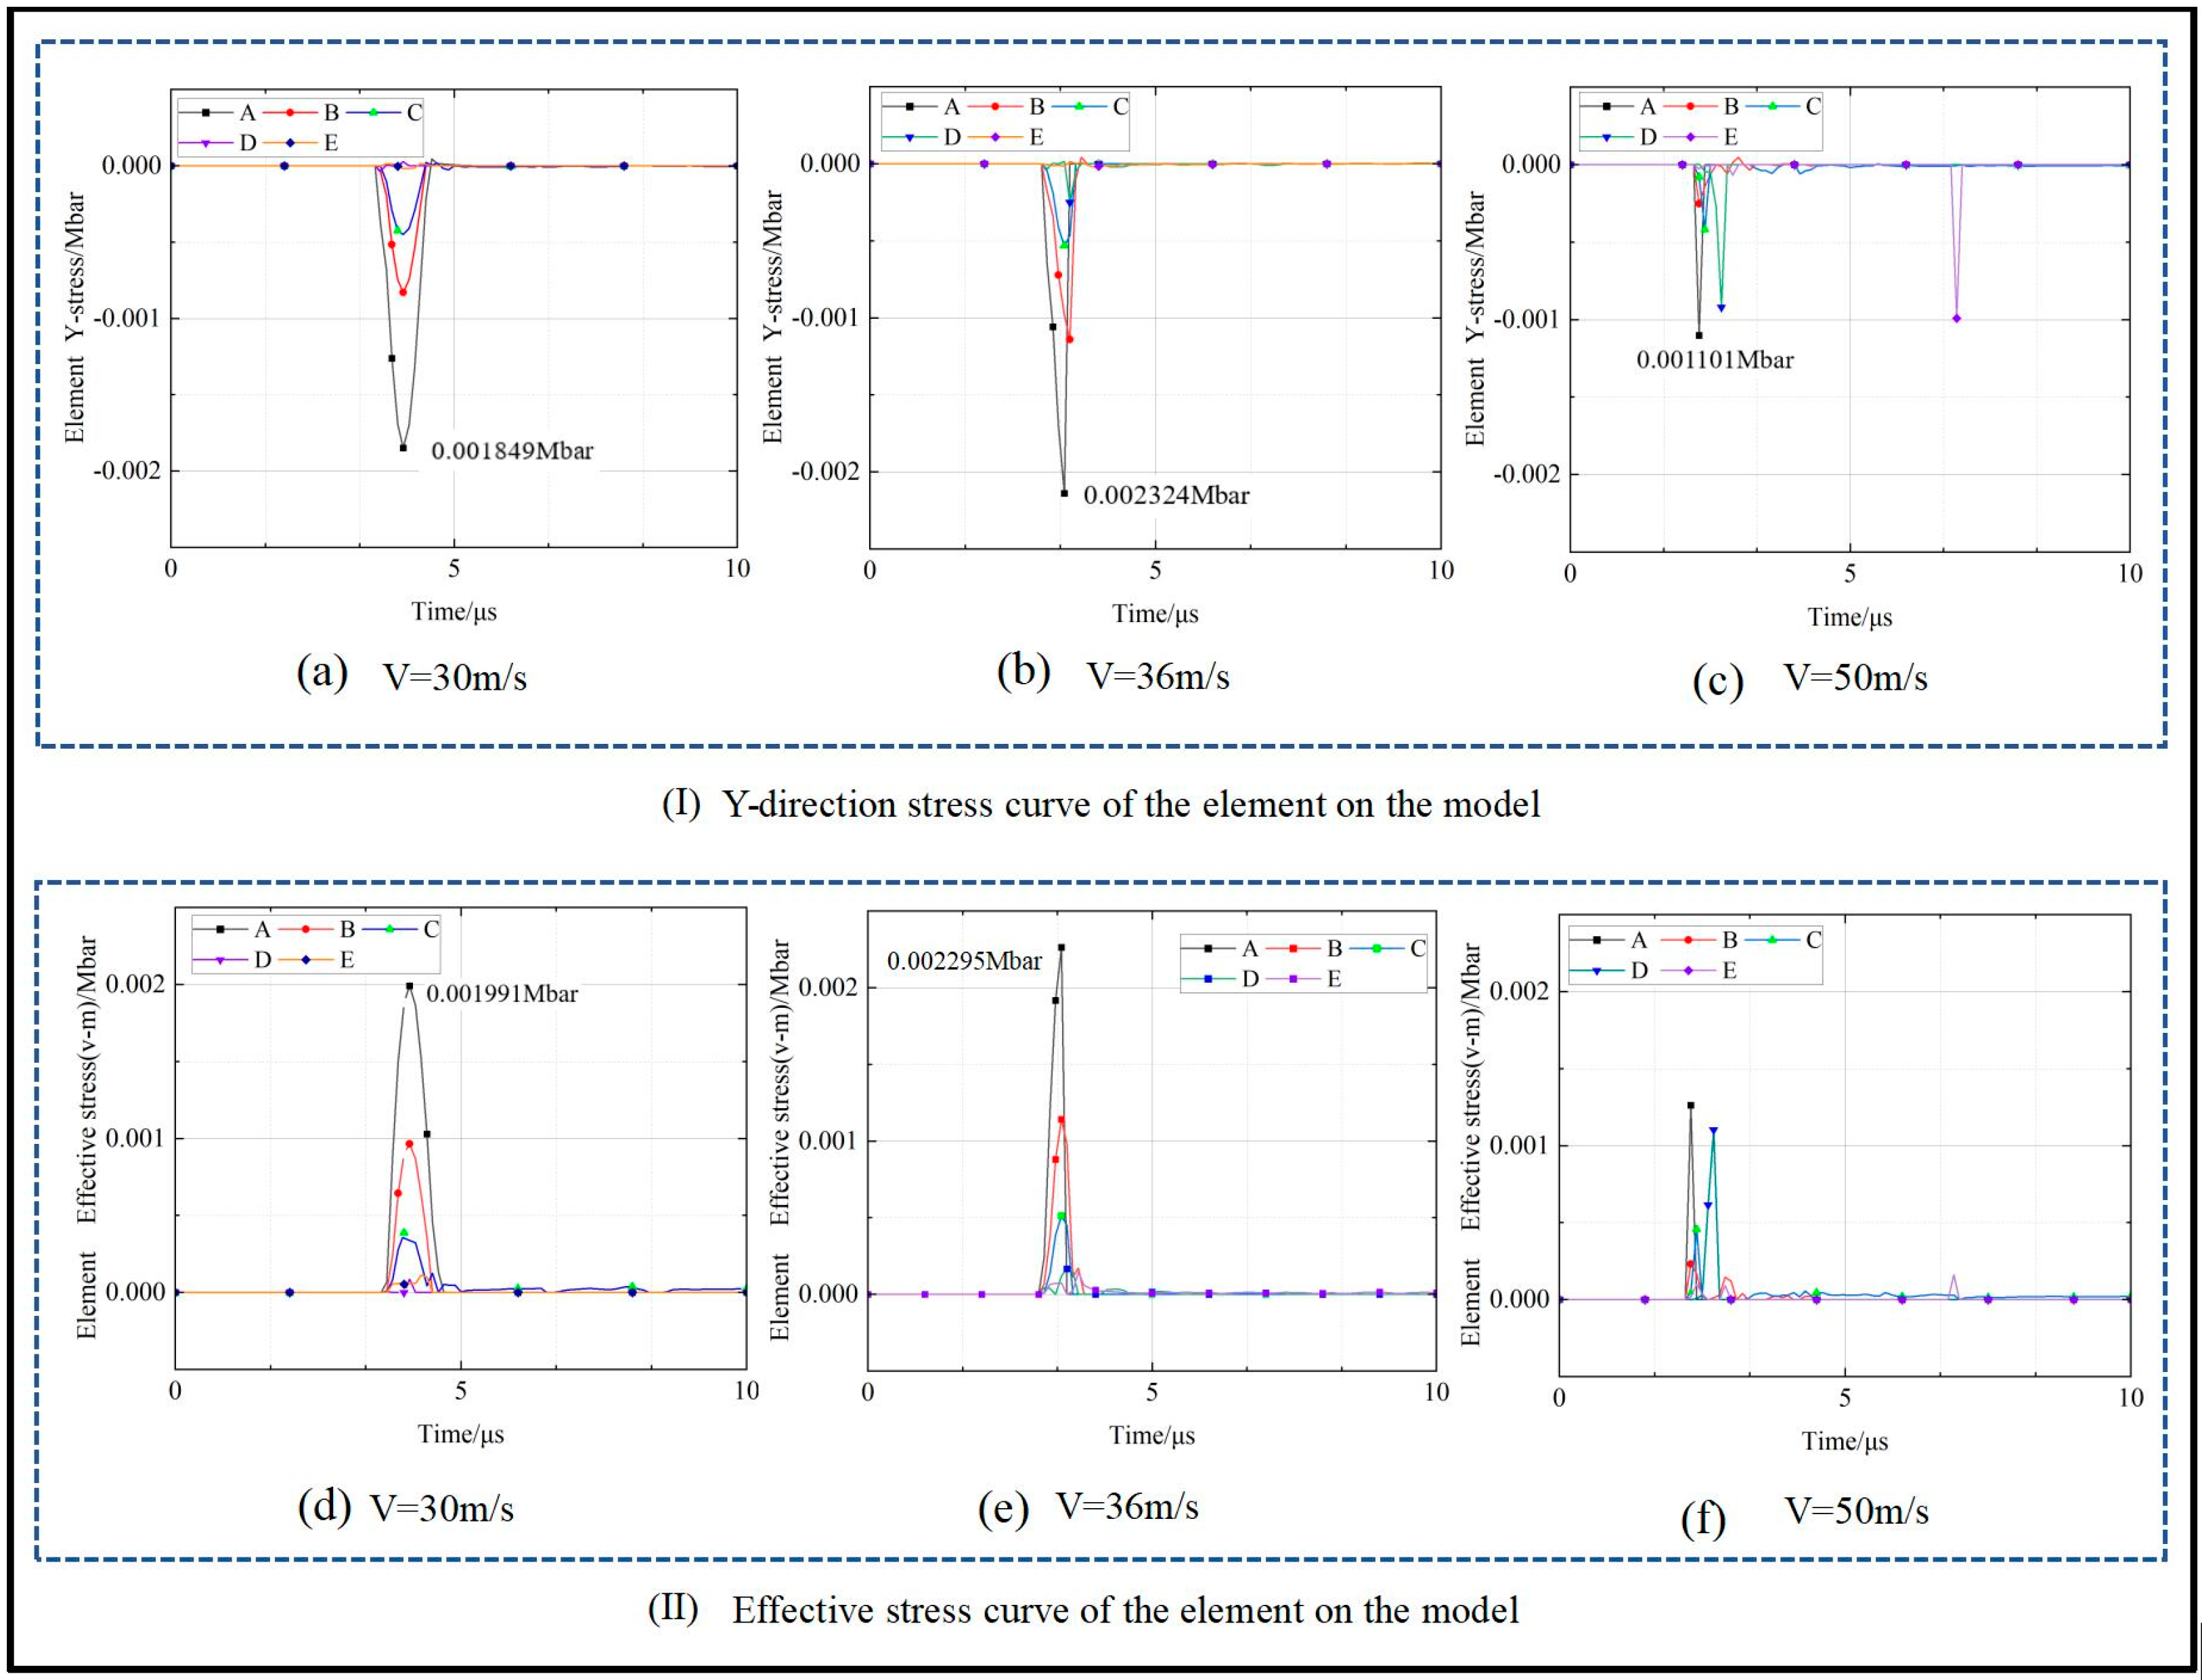
The distribution law of the element stress is revealed by obtaining the stress changes of rock elements under different impact velocities, and the damage and failure states are analyzed. The Y-direction stress curves and the effective stress curves of the rock element at different impact velocities are shown in Figure 10 (I) and Figure 10 (II), respectively.
Figure 10a,d shows the stress curves in the Y direction for the marked element and the effective stress curves, respectively, when the impact velocity is 30 m/s. From the figure, it can be seen that the maximum values of the stress curves in the Y direction of element A and the effective stress are 0.001849 Mbar (the stress value calculated in the g-cm-μs unit system corresponds to the stress value under the g-mm-μs unit system, which is 180 MPa) and 199.1 MPa, respectively. The maximum values of other units are seen in the B, C, D, and E elements, respectively, indicating that the compressive stress of the vertical element under the impact is greater than that of the horizontal element. At the same time, elements A, B, and C reach the maximum values of the two types of stresses almost at the same time, indicating that the marked elements on the rock model have not been broken and removed, and their element stress will increase with an increase in the impact velocity. Figure 10b,e presents stress curves corresponding to the impact velocity of 36 m/s; at this time, the two stress values for unit A are 232.4 MPa and 229.5 MPa, respectively, which exceed the compressive strength of the rock (202.2 MPa). The maximum values of other elements are in the order of B, C, D, and E. At this time, the maximum stress values of elements A, B, and C begin to appear at different times, indicating that the marked elements in the rock model begin to break and be removed. At the same time, the maximum compressive stress values of the elements also appear at different times as the impact velocity increases. Figure 10b,e presents the stress curves corresponding to the impact velocity of 50 m/s. At this time, the maximum values of the two types of compressive stress in elements A, D, and E, as well as the corresponding time points, change, indicating that the marked elements on the rock model within the impact area have been broken and removed. The reason is that the maximum compressive stress value of the element increases with the impact time; when it exceeds the compressive strength of the rock, the element breaks and is removed, and the compressive stress is released; during continuous impact, this process is repeated continuously, so that the maximum stress of the force-bearing element appears at different times. In summary, the element stress curve in the Y direction and the element effective stress curve conform to the corresponding relationship between the theoretical impact velocity and the simulation velocity.
(3)
Effective plastic strain cloud diagram and strain variation law of rock under different impact velocities
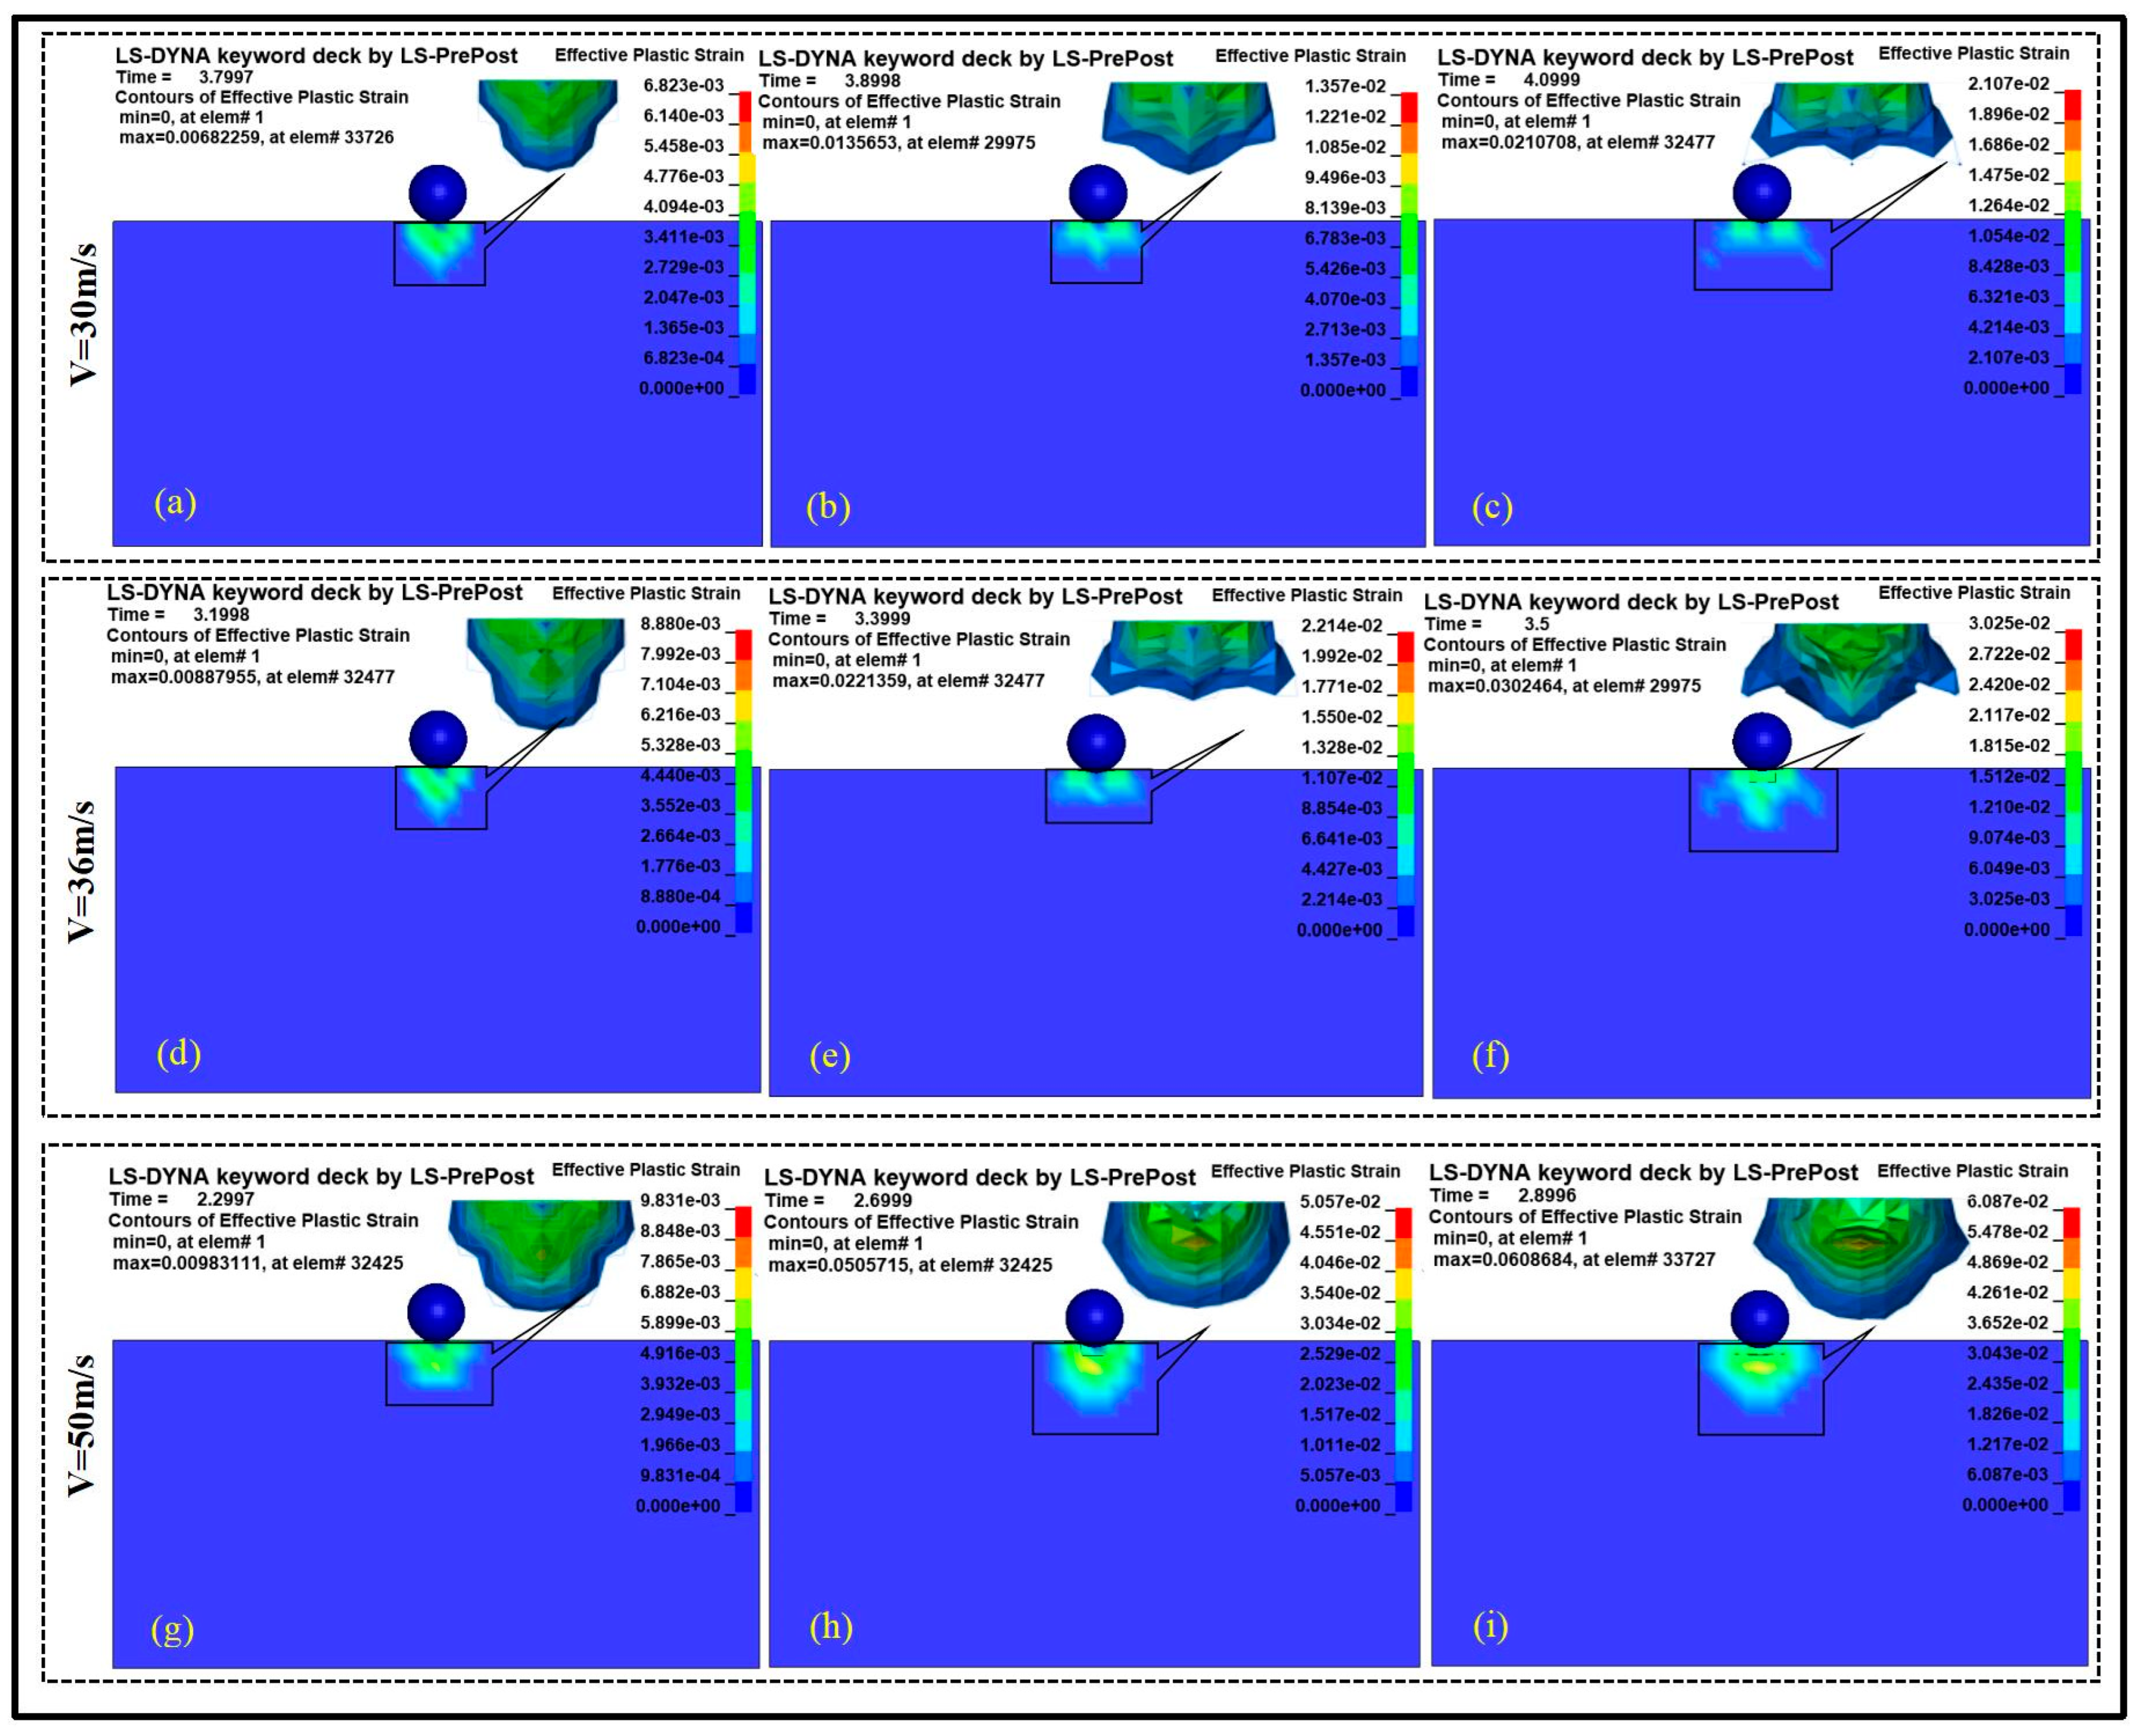
Figure 11a–c are the effective plastic strain cloud diagrams of the rock under compression at different impact times when the impact velocity is 30 m/s. As the impact time increases, the effective plastic strain of the rock continues to increase, with the maximum value being 0.021 (Figure 11c). The range of the effective plastic strain cloud diagram in the impact area expands in an approximately spherical, irregular shape with the impact contact point as the center; it expands rapidly with the increase in time, and the transverse expansion is greater than the vertical expansion. Compared with the rock as a whole, the range of the effective plastic strain cloud map in the impact area is still relatively small. Figure 11d–f are the effective plastic strain cloud diagrams of the rock under compression at different impact times when the impact velocity is 36 m/s. Compared with the former case (30 m/s), the effective plastic strain is larger. The maximum strain value in Figure 11e is 0.0221; at this time, irregular protrusions begin to appear at the edge of the effective plastic strain cloud diagram in the impact area. From an analysis of this figure, it can be seen that, with an increase in the impact time, the effective plastic strain of the rock continues to increase, where the maximum strain value in Figure 11e is 0.0221. At this time, irregular protrusions begin to appear at the edges of the effective plastic strain cloud diagrams in the impact area. As the impact time continues to increase, the maximum strain value in Figure 11f is 0.0302, and an obvious irregular bulge appears at the edge of the effective plastic strain cloud diagram, which indicates that the rock damage within the impact zone is caused by crack propagation. Figure 11g–i are the effective plastic strain cloud diagrams of the rock under compression at different impact times when the impact velocity is 50 m/s. Compared with the previous two impact velocities, the effective plastic strain reaches its maximum overall. As the impact time increases, the effective plastic strain of the rock continues to increase, but the shape of the effective plastic strain cloud map in the impact area is approximately spherical, and there is no obvious bulge at the edge. The reason is that, when the impact speed is too high, the rock in the impact area is mainly crushed and removed, rather than being damaged by crack propagation. In summary, the element in the effective plastic strain cloud diagram is consistent with the corresponding relationship between the theoretical impact velocity and the simulation setting velocity.
Figure 12a is the effective plastic strain curve of the element with an impact velocity of 30 m/s. Deformation occurs in elements D, B, E, A, and C in descending order, and the effective plastic strain of the transverse element is larger than that of the vertical element. Moreover, the maximum deformation is seen for the transverse element, which is at a certain distance from the contact point, which indicates that the rock is mainly subjected to elastic–plastic-based extrusion deformation, and the rock is almost undamaged. Figure 12b is the effective plastic strain curve of the element with an impact velocity of 36 m/s. Deformation occurs for elements B, D, C, E, and A in descending order, and the effective plastic strain of the vertical element is larger than that of the transverse element. The maximum deformation is seen for the vertical element, which is at a certain distance from the contact surface, indicating that the rock begins to undergo fissure damage dominated by plasticity. Among the elements, only element A’s deformation is zero, indicating that the rock has recently begun to undergo removal damage. Figure 12c is the effective plastic strain curve of the element with an impact velocity of 50 m/s. The deformation of element D increases and then becomes zero, and the deformation of element A is almost zero, indicating that the impact process of element A instantly occurred during the removal of the damage, while element D was damaged after a certain period of time. Meanwhile, it also shows that, at this impact speed, the rock will be removed as the impact time continues to increase. The other elements show a basic trend of increasing deformation with an increasing impact velocity, but the rock is more likely to undergo crushing removal when subjected to higher impact velocities, while the magnitude of the strain on the elements also fluctuates sequentially. In summary, the effective plastic strain curve of the marked element is consistent with the corresponding relationship between the theoretical impact velocity and the simulation setting velocity.

5. Abrasive Water Jet Impact Rock-Breaking Experiment

In AWJ, abrasive particles play a dominant role in the rock-breaking process, while the impact effect of the pure water jet on the rock is relatively small; therefore, considering that the threshold value of the jet for rock breaking is relatively small compared with the normal working pressure of the jet, the effect of the pure water jet on the impact of the rock can be ignored, and an abrasive water jet under a certain working pressure is used in the experiment to replace the effect of the abrasive particle flow impacting the rock. The effect of a single continuous impact of abrasive particles on the rock is simulated by controlling the abrasive mass concentration. The minimum working pressure of the jet required for rock crushing removal in the impact experiment is compared with the theoretical pressure required for the calculation to verify the accuracy of the mathematical model.

5.1. Experimental Equipment and Materials

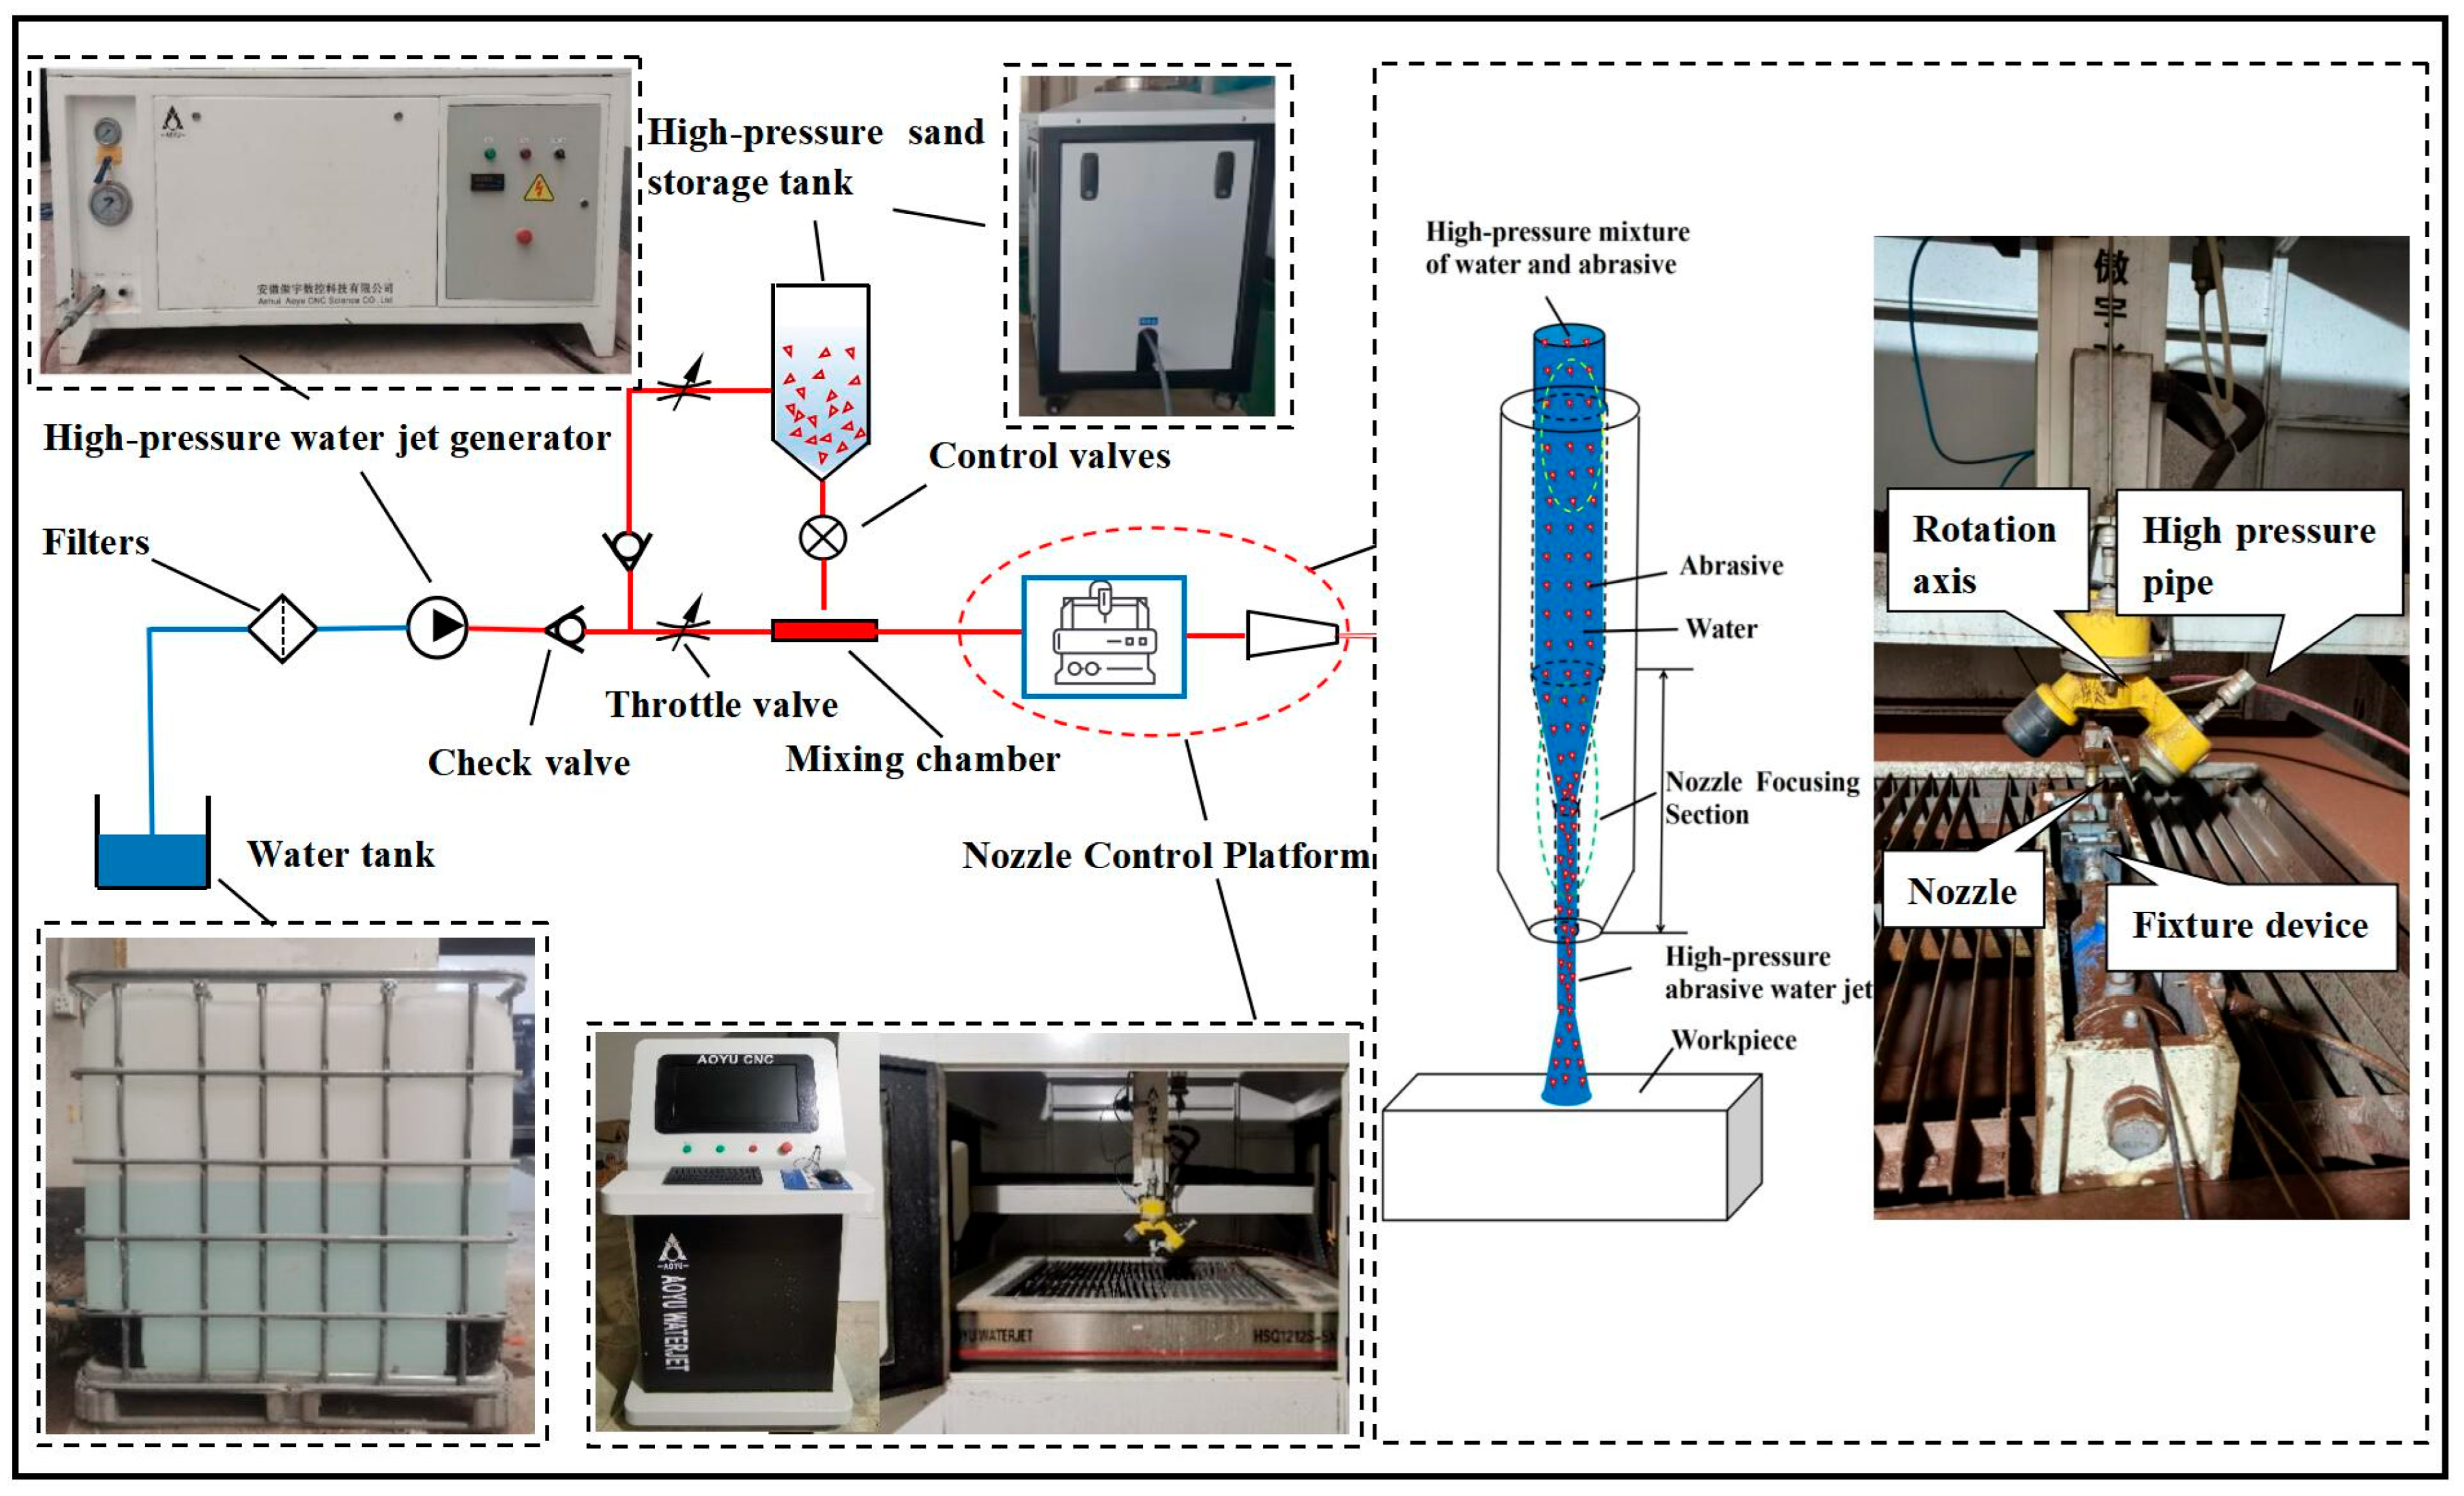
The model HSQ1212S-AC5X ultra-high-pressure CNC five-axis water jet cutting machine was used, as shown in Figure 13. During the experiment, the operator used a TST3000 bar high-pressure water jet protection suit (1028/2030) to ensure their safety. Because garnet has the advantages of a wide range of applications, high hardness, good water resistance, environmental protection, and economy, this experiment used 80-mesh garnet as the abrasive; its appearance was reddish- brown, the average diameter of the particles was 0.18 mm, and the density was 4200 kg/cm3. The specific performance parameters are shown in Table 1. Limestone was used as the rock in the coal system, and the specific physical performance parameters of the material are shown in Table 3.

5.2. Experimental Program

Based on the experimental conditions and the rock-related parameters, the test pressure (3 MPa) was used instead of the theoretical pressure (2.7 MPa) required for limestone crushing and removal as the standard for comparison with the other test pressures. Considering consistency with the previous simulation’s experimental parameters, the test pressures of 2 MPa, 3 MPa, and 5 MPa were selected to erode the rock surface for different time periods, and the corresponding impact velocities were, respectively, 30 m/s, 36 m/s, and 50 m/s. The main process parameters, such as the jet pressure, target distance, mass concentration impact time, and so on, are given in Table 5. The impact angle was 90°—that is, the axis direction of the jet was perpendicular to the rock surface, the nozzle adopted conical convergence, and the nozzle diameter was 1.0 mm.

5.3. Analysis of Experimental Results

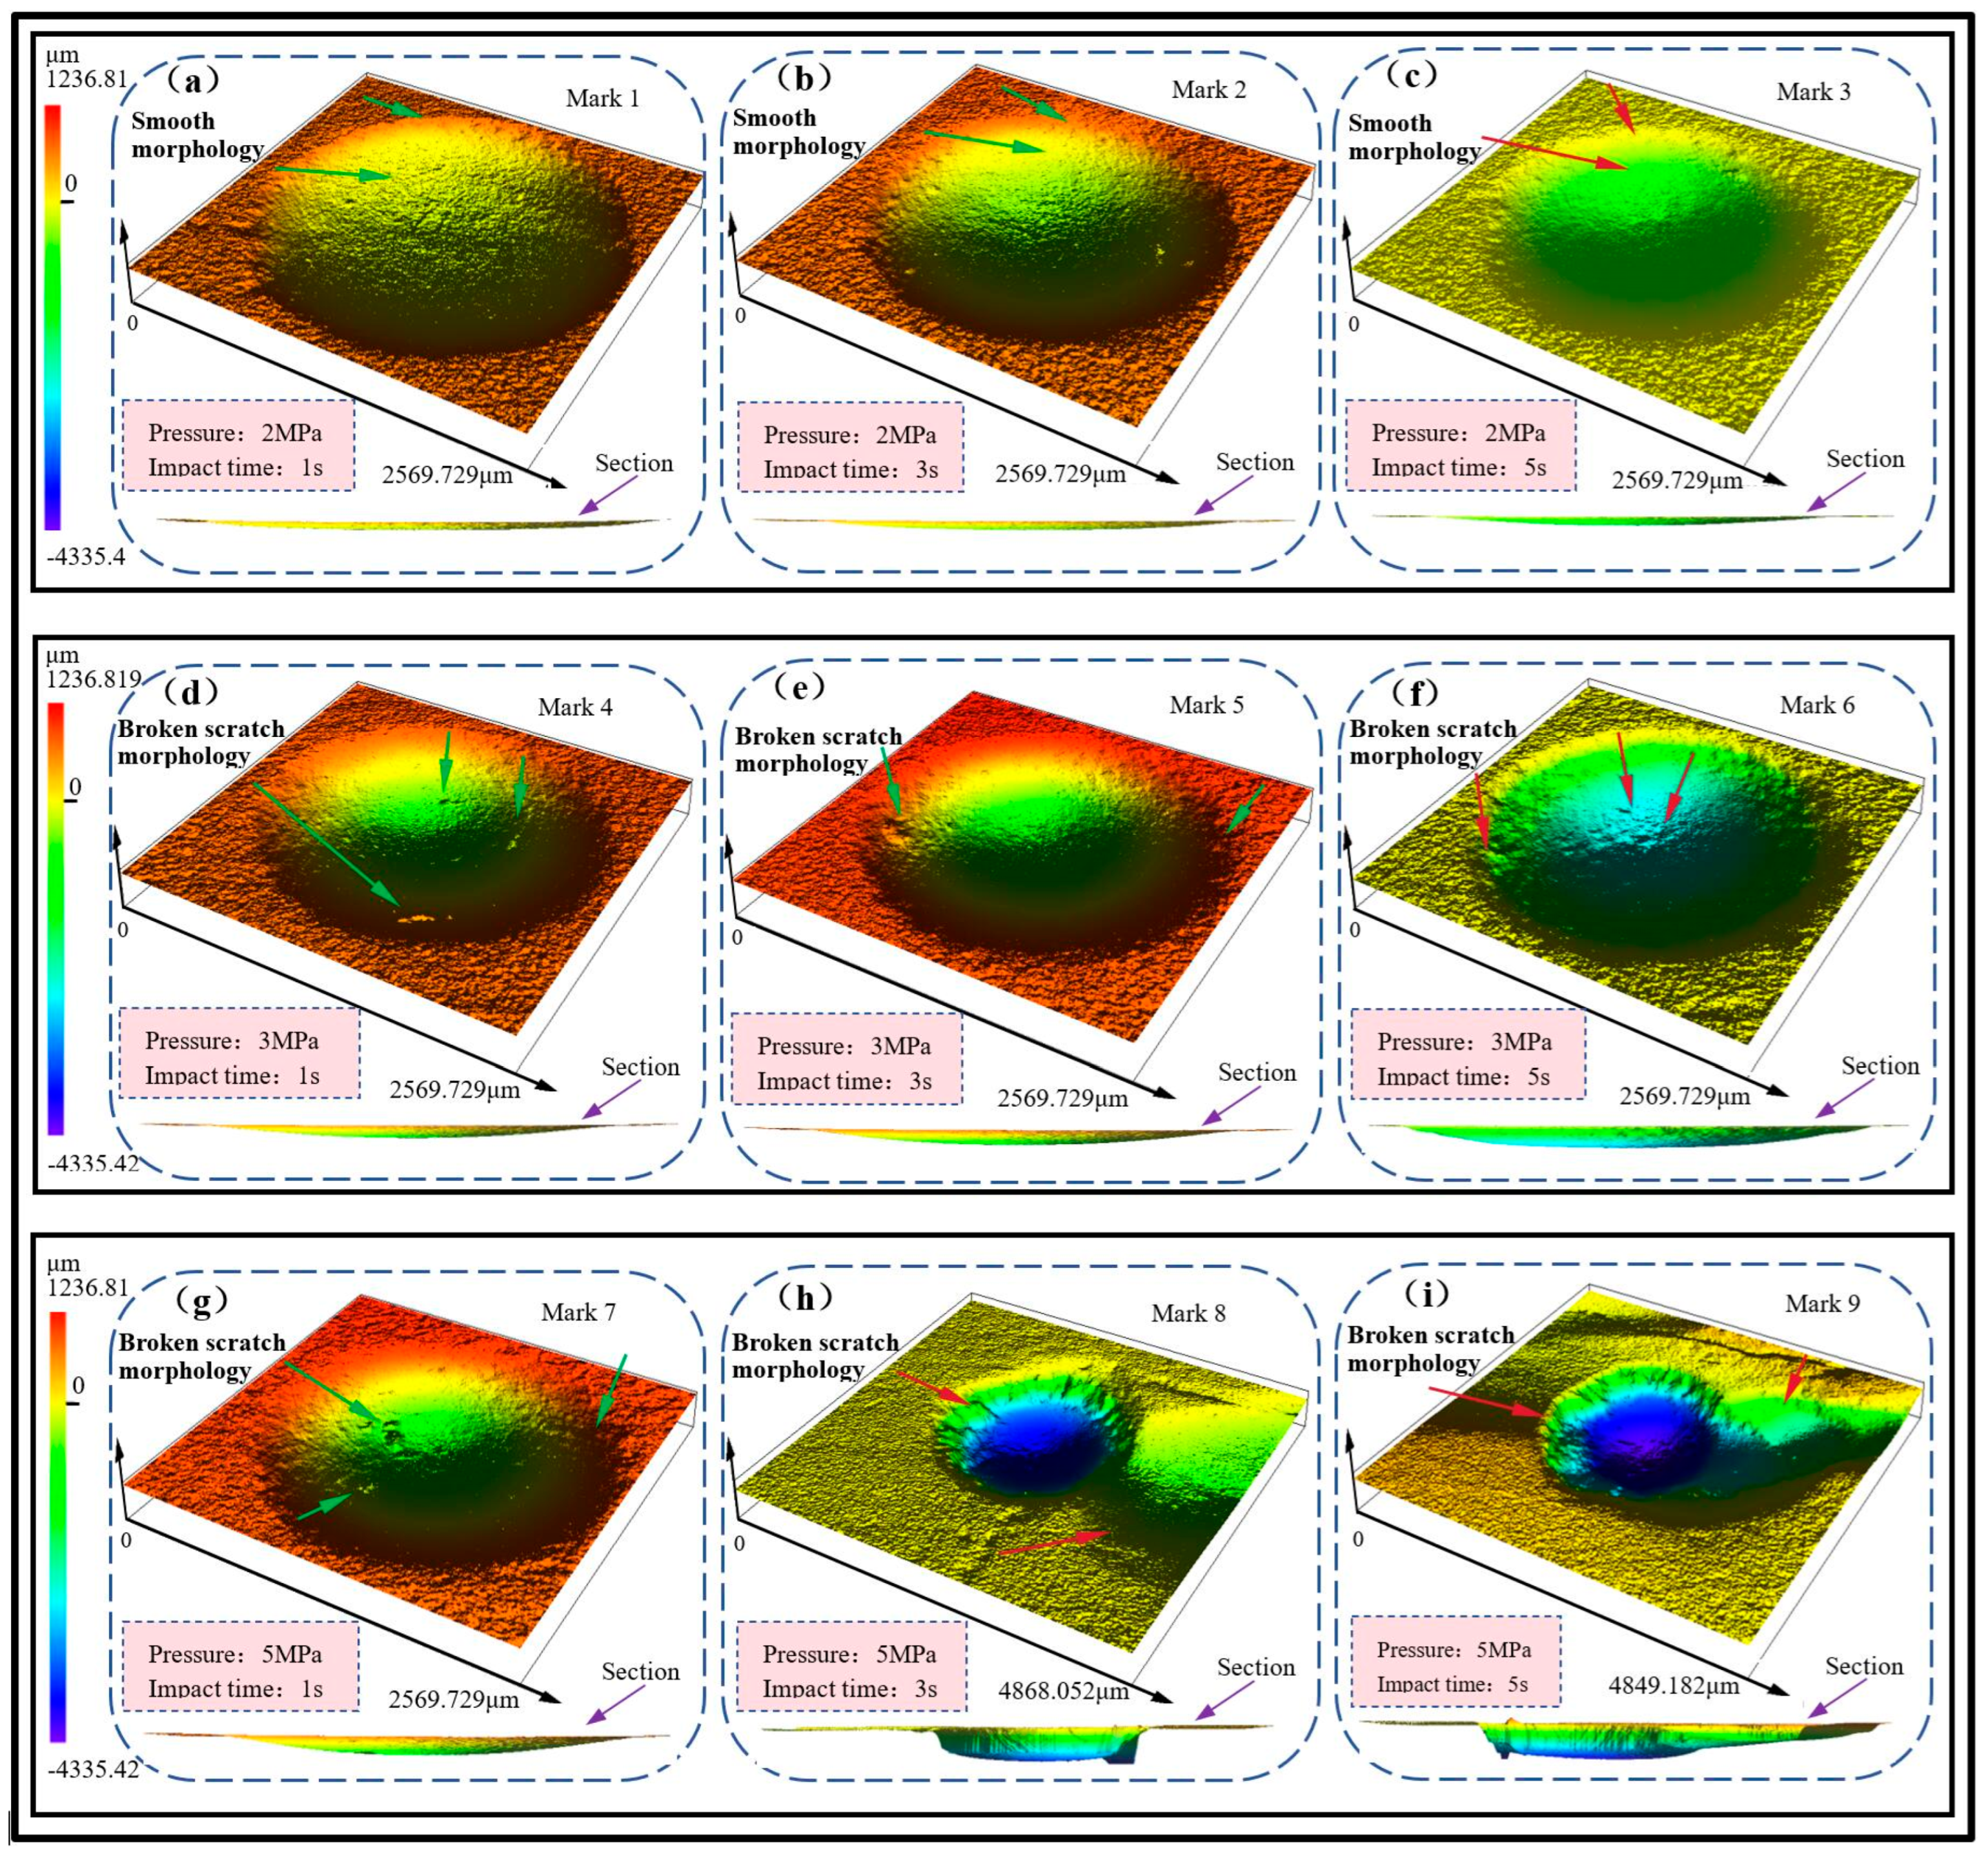
Abrasive water jets were used to erode the limestone surface at different test pressures for 1 s, 3 s, and 5 s tests, and the results are shown in Figure 14. The microscopic topography of the limestone surface marked by the point pit was measured using a laser confocal microscopy 3D measurement system, as shown in Figure 15; the measurement results regarding the depth of the pit are shown in Table 6.
In Figure 14 and Figure 15 (a) to (c), the experimental marker points are noted as 1, 2, and 3 when the limestone surface is eroded with 2 MPa pressure for 1 s, 3 s, and 5 s, respectively. The results show that, from the three-dimensional and cross-sectional image analysis of the marked points, no significant erosion pit damage was formed on the limestone surface, and a smooth morphology regarding wear is present only in the impact area, as indicated by the arrows. The maximum depth of wear is about 0.84mm, which is almost negligible. Meanwhile, the wear amount or depth did not change significantly with a continuous increase in the erosion time, indicating that the jet could not cause erosion removal damage to the limestone under the pressure condition. The experimental result aligned with the testing effect when the test pressure was less than the calculated theoretical pressure. In Figure 14 and Figure 15 (d–f), the experimental marker points are noted as 4, 5, and 6 when the limestone surface is eroded with 3 MPa pressure for 1 s, 3 s, and 5 s, respectively. The results show that, from the three-dimensional and cross-sectional image analysis of the marked points, erosion pit damage occurred at marker point 4 on the limestone surface, and a broken scratch morphology due to crushing removal was present only in the impact area, as indicated by the arrows, where the maximum depth of wear was about 1.49mm. Meanwhile, there was a significant change in the depth of the erosion pits at marker points 5 and 6 with a continuous increase in the erosion time, indicating that the jet could cause erosion removal damage to the limestone under this pressure condition. The reason is that, when the abrasive particles impact the rock, the local compressive stress generated in the contact area is greater than the compressive strength of the limestone, so that the rock surface experiences crushing removal. As the impact time continues to increase, the surface crushing gradually expands, forming an erosion pit. The experimental result aligns with the testing effect when the test pressure is greater than the calculated theoretical pressure. In Figure 14 and Figure 15 (g–i), the experimental marker points are noted as 7, 8, and 9 when the limestone surface is eroded with 5 MPa pressure for 1 s, 3 s, and 5 s, respectively. The results show that erosion pit damage occurred at marker point 7 on the limestone surface, and a broken scratch morphology due to crushing removal was present also in the impact area, as indicated by the arrows, where the maximum depth of wear was about 1.65 mm. Meanwhile, a more significant change in the depth of the erosion pits at marker points 8 and 9 occurred with the continued increase in the erosion time, and, on the rock surface, large pieces had broken off, indicating that, under these pressure conditions, the jet can cause greater erosion and damage. The experimental result aligns with the testing effect when the test pressure is significantly greater than the calculated theoretical pressure. The reason is that, in the process of impacting the rock, cavity expansion occurs, with the gradual accumulation of energy and instantaneous release; when the locally generated tensile or shear stresses in the impact area are greater than the destructive strength of the rock, it prompts the generation, expansion, and convergence of microcracks within the rock and forms a local spherical broken compact nucleus. As the impact time continues to increase, when the local compressive stress in the impact area is greater than the rock’s compressive strength, the energy of the compact nucleus accumulates to a certain extent. Meanwhile, the rapid expansion of the cavity occurs so that the energy is released, resulting in the rapid crushing and removal of the rock around the cavity. The above processes occur continuously, and the rock is broken in a step type under the continuous high-frequency abrasive particle erosion, exhibiting ‘V’-shaped erosion crater removal damage. In summary, the experiment demonstrates that when 3 MPa is used as the limestone crushing removal pressure, compared with the theoretical 2.7 MPa pressure required for mathematical model calculation, the error between the two is within a reasonable range, and good accuracy is achieved.

6. Conclusions

(1)
The acceleration and deceleration mechanism of abrasive particles was studied by applying high-pressure water jet theory, and a mathematical calculation model for the velocity change during the whole process of abrasive particle impact was established. Based on cavity expansion theory, the mechanism of single abrasive particles impacting rocks was studied, and a mathematical model for the radius of each expansion area was established. Knowledge of contact mechanics and rock mechanics was used to study the elastic contact force of single abrasive particles colliding with rocks, and the concentrated force acting on the abrasive particles and the maximum compressive stress on the rock were obtained. On the basis of the above, a mathematical model of the rock-crushing removal conditions by abrasive water jet impact was established, and the parameter thresholds of the rock-crushing removal conditions by jets were obtained.
(2)
Based on the simulation of the environment and the rock-related parameters, the mathematical model of the rock-crushing removal conditions was verified by numerical simulation. The research results show that the theoretical value of the velocity of the jet impact when limestone undergoes crushing removal is no less than 36 m/s, and the theoretical value of the required jet pressure is no less than 2.7 MPa. Through numerical simulation, the displacement change law of the marked points on the rock at different impact velocities was obtained, as well as the stress cloud diagram of the rock in the impact direction and the change law of the marked element stress.
(3)
Based on the equipment test conditions and the rock-related parameters, erosion of the rock surface at 2 MPa, 3 MPa, and 5 MPa pressure for different time periods was carried out by replacing the 2.7 MPa pressure calculated by the mathematical model with the 3 MPa pressure used as the benchmark for limestone crushing removal. The results of the study showed that, when the pressure was 2 MPa, no significant erosion pit damage was formed on the limestone surface, and a smooth morphology due to wear was present only in the impact area; meanwhile, the wear amount or depth did not change significantly with a continuous increase in the erosion time. When the pressure is 3 MPa, erosion pit damage begins to occur on the limestone surface, and a broken scratch morphology due to crushing removal was present in the impact area. Moreover, there was a significant change in the depth of the erosion pits with the continued increase in the erosion time, indicating that, under these pressure conditions, the jet can cause the erosion of limestone, which is more obvious when the pressure is 5 MPa. In summary, the impact rock-breaking effect in the experiment was consistent with the corresponding relationship between the test pressure and the theoretical pressure, and the error between the test reference pressure and the theoretical pressure was within reasonable limits, which confirms that the mathematical model of the rock-crushing removal conditions has good accuracy.

Author Contributions

Conceptualization, H.W.; methodology, H.W.; investigation, H.W. and P.Z.; writing—original draft preparation, H.W. and P.Z.; writing—review and editing, R.Y. and X.Z.; visualization, J.D. and J.F.; supervision, R.Y. and X.Z. All authors have read and agreed to the published version of the manuscript.

Funding

This work was supported by the National Natural Science Foundation of China (52174109) and the Program for Innovative Research Teams (in Science and Technology) at the University of Henan Province (22IRTSTHN005).

Data Availability Statement

The data used to support the findings of this study are included within this article.

Conflicts of Interest

The authors declare no conflict of interest.

Nomenclature

d f The nozzle diameter
d m The diameter of abrasive particles
ρ m The density of abrasive particles
ρ w The density of water
u m 1 The velocity of abrasive particles in the nozzle contraction section
u w 1 The velocity of water in the nozzle contraction section
C D The water resistance coefficient
p The fluid pressure on abrasive particles
u m 2 The velocity of abrasive particles in the straight section of the nozzle
u w 2 The velocity of water in the straight section of the nozzle
u m 2 ( 0 ) The velocity of abrasive particles at the inlet of the nozzle straight section
P The pump driving pressure
ψ The velocity flow coefficient of the nozzle
s 0 The length of the initial phase
s x The spray distance along the axis
a The spherical radius of the cavity area
b The outer diameter of the rock crushing area
c The outer diameter of the cracking area
d The outer diameter of the elastic deformation area
u m The abrasive particle impact velocity
r The radial coordinate in the Euler coordinate system of the rock
ρ s The density of the rock
σ r The radial stress in the Euler coordinate system
σ θ , σ φ The cyclic stress in the Euler coordinate system
s r The radial displacement of a micro-point on the rock
E s The Young’s modulus of the rock
ν s The Poisson’s ratio of the rock
σ t The tensile strength of the rock
K c The correction factor for the rock crushing radius
σ b c The uniaxial compressive strength of the rock
δ The depth of compression
F e The concentrated stress
ν m The Poisson’s ratio of abrasive particles
E m The Young’s modulus of abrasive particles
ζ The shape correction coefficient of abrasive particles
r m The radius of abrasive particles
m m The abrasive particle mass
u r The relative velocity between the abrasive particles and rock
u r 0 The relative velocity of the abrasive particles and the rock before collision
u r t The relative velocity of the abrasive particles and the rock after collision
δ 0 The relative displacement of the abrasive particles and rock before impact
δ t The relative displacement of the abrasive particles and rock after impact
r 0 The radius of the circular domain of the pressure distribution
r a The radius from a point in the circular domain to the center of the circular domain
σ r ¯ The radial stress in the cylindrical coordinate system
σ θ ¯ The circumferential stress in the cylindrical coordinate system
σ z ¯ The axial stress in the cylindrical coordinate system

References

  1. Saraçyakupoğlu, T. Abrasive Water Jet (AWJ) Applications in the Aviation Industry. Int. J. Mech. Prod. Eng. Res. Dev. 2019, 9, 347–356. [Google Scholar]
  2. Xue, Y.; Si, H.; Xu, D.; Yang, Z. Experiments on the microscopic damage of coal induced by pure water jets and abrasive water jets. Powder Technol. 2018, 332, 139–149. [Google Scholar] [CrossRef]
  3. Wang, G.; Qiao, S.; Wang, G.; Jiang, H.; Singh, J. Cutting depth of pile materials subjected to the abrasive waterjet and its prediction model. Tunn. Undergr. Space Technol. 2022, 124, 104473. [Google Scholar] [CrossRef]
  4. Li, H.; Li, J.; Huang, Z.; Cheng, K.; Hu, J.; Li, W. Experimental Investigation into the Effect of Process Parameters on the Drilling Performance for Swirling Impeller Abrasive Water Jet. Rock Mech. Rock Eng. 2023, 56, 8833–8850. [Google Scholar] [CrossRef]
  5. Wang, F.; Wang, R.; Zhou, W.; Chen, G. Numerical simulation and experimental verification of the rock damage field under particle water jet impacting. Int. J. Impact Eng. 2017, 102, 169–179. [Google Scholar] [CrossRef]
  6. Liu, S.; Zhou, F.; Li, H.; Chen, Y.; Wang, F.; Guo, C. Experimental investigation of hard rock breaking using a conical pick assisted by abrasive water jet. Rock Mech. Rock Eng. 2020, 53, 4221–4230. [Google Scholar] [CrossRef]
  7. Oh, T.M.; Cho, G.C. Rock cutting depth model based on kinetic energy of abrasive waterjet. Rock Mech. Rock Eng. 2016, 49, 1059–1072. [Google Scholar] [CrossRef]
  8. Aydin, G.; Karakurt, I.; Amiri, M.R.; Kaya, S. Improvement of rock cutting performance through two-pass abrasive waterjet cutting. Sustainability 2022, 14, 12704. [Google Scholar] [CrossRef]
  9. Wang, F.; Zhou, D.; Zhou, X.; Xiao, N.; Guo, C. Rock breaking performance of TBM disc cutter assisted by high-pressure water jet. Appl. Sci. 2020, 10, 6294. [Google Scholar] [CrossRef]
  10. Ge, Z.; Zhang, H.; Zhou, Z.; Cao, S.; Zhang, D.; Liu, X.; Chao, T. Experimental study on the characteristics and mechanism of high-pressure water jet fracturing in high-temperature hard rocks. Energy 2023, 270, 126848. [Google Scholar] [CrossRef]
  11. Lu, Y.; Huang, S.; Ge, Z.; Zhou, Z. Research progress and strategic thinking of coal mine water jet technology to enhance coal permeability in China. J. China Coal Soc. 2022, 47, 3189–3211. [Google Scholar] [CrossRef]
  12. Wei, J.; Cai, Y.; Liu, Y.; Yu, D.; Huang, Y.; Li, X.; Gao, M. Progress and trends in non-tool rock breaking theory and technology. J. China Coal Soc. 2024, 49, 801–832. [Google Scholar]
  13. Huang, B.; Zhao, X.; Chen, S.; Liu, J. Theory and technology of controlling hard roof with hydraulic fracturing in underground mining. Chin. J. Rock Mech. Eng. 2017, 36, 2954–2970. [Google Scholar] [CrossRef]
  14. Xia, Y.; Lu, C.; Yang, G.; Su, S.; Pang, L.; Ding, G.; Su, B. Experimental study on axial fracture cutting and fracturing of abrasive jet in boreholes within hard rock roofs. J. Min. Strat. Control Eng. 2020, 2, 33522. [Google Scholar]
  15. Pan, J.; Ma, W.; Liu, S.; Gao, J. A prevention technology of rock burst based on directional presplitting of water jet prefabricated slot in hard roof. Chin. J. Rock Mech. Eng. 2021, 40, 1591–1602. [Google Scholar] [CrossRef]
  16. Zhang, Y.; Ji, F.; Zhao, T.; Yang, K.; Wu, W.; Jiang, G. Theoretical and applied research on hydraulic slit-fracture joint roof control and pressure relief of hard roof in goaf roadway. J. China Coal Soc. 2024, 49, 4739–4751. [Google Scholar]
  17. Gupta, K. Introduction to Abrasive Water Jet Machining. In Abrasive Water Jet Machining of Engineering Materials; Springer: Berlin/Heidelberg, Germany, 2020; pp. 1–11. [Google Scholar]
  18. Jiang, H.; Du, C.; Dong, J. Investigation of rock cutting dust formation and suppression using water jets during mining. Powder Technol. 2017, 307, 99–108. [Google Scholar] [CrossRef]
  19. Li, M.; Ni, H.; Wang, G.; Wang, R. Simulation of thermal stress effects in submerged continuous water jets on the optimal standoff distance during rock breaking. Powder Technol. 2017, 320, 445–456. [Google Scholar] [CrossRef]
  20. Yuan, R.; Chen, C.; Zai, P.; Hou, Z. Investigation on the wear characteristics of slurry abrasive flow to key passage parts of the pump body. J. Braz. Soc. Mech. Sci. Eng. 2023, 45, 331. [Google Scholar] [CrossRef]
  21. Muthuramalingam, T.; Vasanth, S.; Vinothkumar, P.; Geethapriyan, T.; Mohamed Rabik, M. Multi criteria decision making of abrasive flow oriented process parameters in abrasive water jet machining using Taguchi–DEAR methodology. Silicon 2018, 10, 2015–2021. [Google Scholar] [CrossRef]
  22. Natarajan, Y.; Murugasen, P.K.; Sundarajan, L.R.; Arunachalam, R. Experimental investigation on cryogenic assisted abrasive water jet machining of aluminum alloy. Int. J. Precis. Eng. Manuf.-Green Technol. 2019, 6, 415–432. [Google Scholar] [CrossRef]
  23. Wang, H.; Yuan, R.; Zhang, X.; Zai, P.; Deng, J. Research progress in abrasive water jet processing technology. Micromachines 2023, 14, 1526. [Google Scholar] [CrossRef]
  24. Monno, M.; Pellegrini, G.; Ravasio, C. Effect of workpiece heat treatment on surface quality of AWJ kerf. Int. J. Mater. Prod. Technol. 2015, 51, 345–358. [Google Scholar] [CrossRef]
  25. Farmer, I.W.; Attewell, P.B. Rock penetration by high velocity water jet: A review of the general problem and an experimental study. Int. J. Rock Mech. Min. Sci. Geomech. Abstr. Pergamon 1965, 2, 135–153. [Google Scholar] [CrossRef]
  26. Jiang, H.; Du, C.; Liu, S. The effects of impact velocity on energy and size distribution of rock crushing. J. China Coal Soc. 2013, 38, 604–609. [Google Scholar] [CrossRef]
  27. Momber, A.W. Deformation and Fracture of Rocks Due to High-Speed Liquid Impingement. Int. J. Fract. 2004, 130, 683–704. [Google Scholar] [CrossRef]
  28. Momber, A.W. The Response of Geo-Materials to High-Speed Liquid Drop Impact. Int. J. Impact Eng. 2016, 89, 83–101. [Google Scholar] [CrossRef]
  29. Liu, Y.; Cui, J.W.; Xu, Z.Y.; Li, Z.F. Comparison of the Rock Breakage Pressure of Abrasive Water Jets and Abrasive Air Jets. Geomech. Geophys. Geo-Energy Geo-Resour. 2020, 6, 1–11. [Google Scholar] [CrossRef]
  30. Liu, Y.; Chen, C.; Wei, J.; Zhang, J. Comparison analysis on the rock breakage pressure induced by abrasive water jets and abrasive gas jets. J. China Coal Soc. 2018, 43, 2510–2517. [Google Scholar] [CrossRef]
  31. Hu, M.; Li, B.; Zhang, B.; Nie, L.; Liu, Z.; Cao, W. Effect of Rock Stress Evolution on Failure under Transverse Plain Water Jet. Geotech. Geol. Eng. 2020, 38, 3941–3954. [Google Scholar] [CrossRef]
  32. Chen, X.; Deng, S.; Guan, J.; Hua, W. Experiment and simulation research on abrasive water jet nozzle wear behavior and anti-wear structural improvement. J. Braz. Soc. Mech. Sci. Eng. 2017, 39, 2023–2033. [Google Scholar] [CrossRef]
  33. Nanduri, M.; Taggart, D.G.; Kim, T.J. The effects of system and geometric parameters on abrasive water jet nozzle wear. Int. J. Mach. Tools Manuf. 2002, 42, 615–623. [Google Scholar] [CrossRef]
  34. Morsi, S.A.J.; Alexander, A.J. An investigation of particle trajectories in two-phase flow systems. J. Fluid Mech. 1972, 55, 193–208. [Google Scholar] [CrossRef]
  35. Du, M.; Guo, Y.; Wang, H.; Dong, H.; Liang, W.; Wu, H.; Ke, Y. Modeling of the cutting front profile in abrasive water jet machining based on the energy balance approach. Precis. Eng. 2023, 79, 210–220. [Google Scholar] [CrossRef]
  36. Abrmovich, G.; Schindel, L. General Properties of Turbulent Jets; MIT Press: Cambridge, MA, USA, 1963; pp. 3–49. [Google Scholar]
  37. Bush, W.B.; Krishnamurthy, L. Asymptotic analysis of the fully developed region of an incompressible, free, turbulent, round jet. J. Fluid Mech. 1991, 223, 93–111. [Google Scholar] [CrossRef]
  38. Li, H.; Li, J.; Huang, Z.; Kuru, E.; Guo, C.; Hu, J. Numerical Investigation of Abrasive Water Jet Rock Damage Characteristics That Considers the Shape, the Interaction and the Fragmentation of Abrasive Particles. Rock Mech. Rock Eng. 2024, 58, 2105–2131. [Google Scholar] [CrossRef]
  39. Li, Z.; Ge, Z.; Zhou, Z.; Mi, J.; Liu, L.; Shangguan, J.; Shao, C. Numerical simulation and experimental verification of heterogeneous granite impacted by abrasive water jet based on SPH-FEM coupling algorithm. Powder Technol. 2023, 416, 118233. [Google Scholar] [CrossRef]
  40. Huang, F.; Zhao, Z.; Li, D.; Mi, J.; Wamg, R. Investigation of the breaking manifestations of bedded shale impacted by a high-pressure abrasive water jet. Powder Technol. 2022, 397, 117021. [Google Scholar] [CrossRef]
  41. Feng, L.; Dong, X.; Li, Z.; Liu, J.; Sun, Z. Modeling of waterjet abrasion in mining processes based on the smoothed particle hydrodynamics (SPH) method. Int. J. Comput. Methods 2020, 17, 1950075. [Google Scholar] [CrossRef]
  42. Liu, J.; Zhang, X.; Liu, C.; Chen, H.; Xiong, W.; Tan, M. Research progress of target resistance model of cavity expansion theory and its application. Explos. Shock. Waves. 2021, 41, 101101. [Google Scholar] [CrossRef]
  43. Deng, Y.J.; Chen, X.W.; Yao, Y. Study on the cavity expansion response of the concrete target under penetration. Sci. Sin. Phys. Mech. Astron. 2020, 50, 024606. [Google Scholar] [CrossRef]
  44. Wang, Y.; Huang, F. A dynamic spherical cavity-expansion theory for concrete materials. Explos. Shock Waves 2009, 29, 95–100. [Google Scholar] [CrossRef]
  45. Forrestal, M.J.; Tzou, D.Y. A spherical cavity-expansion penetration model for concrete targets. Int. J. Solids Struct. 1997, 34, 4127–4146. [Google Scholar] [CrossRef]
  46. Satapathy, S. Dynamic spherical cavity expansion in brittle ceramics. Int. J. Solids Struct. 2001, 38, 5833–5845. [Google Scholar] [CrossRef]
  47. Cao, G.N. Second order homogeneous variable coefficient differential equation and Riccati equation. J. Xi’an Univ. Sci. Technol. 2004, 2, 247–249. [Google Scholar] [CrossRef]
  48. Fischer-Cripps, A.C. The Hertzian contact surface. J. Mater. Sci. 1999, 34, 129–137. [Google Scholar] [CrossRef]
  49. Greenwood, J.A. Analysis of elliptical Hertzian contacts. Tribol. Int. 1997, 30, 235–237. [Google Scholar] [CrossRef]
  50. Momber, A.W.; Kovacevic, R. Principles of Abrasive Water Jet Machining; Springer: Berlin/Heidelberg, Germany, 2012. [Google Scholar]
  51. Johnson, K.L. Contact Mechanics; Cambridge University Press: Cambridge, MA, USA, 1985. [Google Scholar] [CrossRef]
  52. Borrvall, T.; Riedel, W. The RHT concrete model in LS-DYNA. In Proceedings of the 8th European LS-DYNA User Conference, Strasbourg, France, 23–24 January 2011. [Google Scholar]
  53. Wang, Z.L.; Huang, Y.P.; Li, S.Y.; Xiong, F. SPH-FEM coupling simulation of rock blast damage based on the determination and optimization of the RHT model parameters. In IOP Conference Series: Earth and Environmental Science; IOP Publishing: Bristol, UK, 2020; Volume 570, p. 042035. [Google Scholar]
  54. Wang, H.; Wang, Z.; Wang, J.; Wang, S.; Wang, H.; Yin, Y.; Li, F. Effect of confining pressure on damage accumulation of rock under repeated blast loading. Int. J. Impact Eng. 2021, 156, 103961. [Google Scholar] [CrossRef]
  55. Xu, L.; Xu, X.; Sun, Y.; Lu, T. Evaluation of Rock Brittleness Based on Complete Stress-Strain Curve. Mathematics 2022, 10, 4470. [Google Scholar] [CrossRef]
  56. Chen, G.; Jiang, W.; Sun, X.; Zhao, C.; Qin, C. Quantitative evaluation of rock brittleness based on crack initiation stress and complete stress-strain curves. Bull. Eng. Geol. Environ. 2019, 78, 5919–5936. [Google Scholar] [CrossRef]
Figure 1. Conical convergent nozzle structure image.
Lubricants 13 00348 g001
Figure 2. Relationship between the ratio of the abrasive velocity to the water velocity in the straight-line section of the nozzle and the abrasive position.
Lubricants 13 00348 g002
Figure 3. Schematic diagram of jet structure.
Lubricants 13 00348 g003
Figure 4. Schematic diagram of abrasive water jet impacting the rock.
Lubricants 13 00348 g004
Figure 5. Dynamic response region of spherical cavity expansion of rock under abrasive particle impact.
Lubricants 13 00348 g005
Figure 6. Numerical simulation model of a single abrasive particle impacting the rock. (a) 3D view of the simulation model; (b) 2D view of the simulation model; (c) numerical measurement points and elements of the simulation model.
Lubricants 13 00348 g006
Figure 7. Displacement curves of the marked points on the model along the Y direction at different impact velocities. (a) the displacement curve when the impact velocity is 30 m/s; (b) the displacement curve when the impact velocity is 36 m/s; (c) the displacement curve when the impact velocity is 50 m/s.
Lubricants 13 00348 g007
Figure 8. Stress cloud diagram of the rock in the Y direction under different impact velocities. (ac) are the stress states corresponding to different moments when the impact velocity is v = 30 m/s, respectively; (df) are the stress states corresponding to different moments when the impact velocity is v = 36 m/s, respectively; (gi) are the stress states corresponding to different moments when the impact velocity is v = 50 m/s, respectively.
Lubricants 13 00348 g008
Figure 9. Effective stress cloud diagrams of rocks under different impact velocities. (ac) are the effective stress states corresponding to different moments when the impact velocity is v = 30 m/s, respectively; (df) are the effective stress states corresponding to different moments when the impact velocity is v = 36 m/s, respectively; (gi) are the effective stress states corresponding to different moments when the impact velocity is v = 50 m/s, respectively.
Lubricants 13 00348 g009
Figure 10. Stress curves of the elements of the rock at different impact velocities. (I) Y-direction stress curve of the element on the model; (ac) are the stress curves of the element in the Y direction when the impact speed is 30 m/s, 36 m/s and 50 m/s respectively. (II) Effective stress curve of the element on the model; (df) are the effective stress curves of the element when the impact velocity is 30 m/s, 36 m/s and 50 m/s respectively.
Lubricants 13 00348 g010
Figure 11. Effective plastic strain cloud image of the rock at different impact velocities. (ac) are the effective plastic strain states corresponding to different moments when the impact velocity is v = 30 m/s, respectively; (df) are the effective plastic strain states corresponding to different moments when the impact velocity is v = 36 m/s, respectively; (gi) are the effective plastic strain states corresponding to different moments when the impact velocity is v = 50 m/s, respectively.
Lubricants 13 00348 g011
Figure 12. Effective plastic strain curves of the elements in the model at different impact velocities. (a) the effective plastic strain curve when the impact velocity is 30 m/s; (b) the effective plastic strain curve when the impact velocity is 36 m/s; (c) the effective plastic strain curve when the impact velocity is 50 m/s.
Lubricants 13 00348 g012
Figure 13. Principle diagram of abrasive water jet impacting rock processing technology.
Lubricants 13 00348 g013
Figure 14. Abrasive jet impact limestone experiment.
Lubricants 13 00348 g014
Figure 15. 3D topographic image of the limestone surface. (ai) correspond to the surface micromorphologies of the erosion pits marked 1 to 9 in Figure 14, respectively.
Lubricants 13 00348 g015
Table 1. Structural parameters of conical convergent nozzles.
Contraction Angle (o)Length of Contraction Section (mm)Straight Section of Cylinder (mm)Outlet Diameter (mm)
θ = 28 o L 1 = 9 L 2 = 63 d f = 9
Table 2. Physical parameters of abrasive particles and water.
MaterialDensity
(kg/m3)
Poisson’s RatioAverage Particle Size (mm)Elastic Modulus
(GPa)
Garnet42000.250.18240
Water998
Table 3. Physical parameters of limestone.
Density (kg/m3)Poisson’s RatioCompressive Strength (MPa)Tensile Strength (MPa)Modulus of Elasticity (GPa)
29000.16202.23.728.1
Table 4. Main parameters of limestone RHT constitutive model.
Parameter and SymbolValueParameter and SymbolValue
Mass density ρ 0 ( kg / m 3 )2900Compressive strain rate dependence exponent B E T A C 0.025
Elastic shear modulus G ( GPa )10.68Tensile strain rate dependence exponent B E T A T 0.02
Parameter for polynomial EOS B 0 0.9Compressive yield surface parameter g c * 0.53
Parameter for polynomial EOS B 1 0.9Tensile yield surface parameter g t * 0.7
Parameter for polynomial EOS T 1 ( GPa )22.5Shear modulus reduction factor X i 0.5
Failure surface parameter A 1.92Damage parameter D 1 0.04
Failure surface parameter N 0.76Damage parameter D 2 1
Compressive strength f c ( MPa )200Minimum damaged residual strain E P M 0.01
Relative shear strength f s * 0.3Residual surface parameter A f 2.24
Relative tensile strength f t * 0.02Residual surface parameter N f 0.854
Lode angle dependence factor Q 0 0.6805Hugoniot polynomial coefficient A 1 ( GPa )22.5
Lode angle dependence factor B 0.0105Hugoniot polynomial coefficient A 2 ( GPa )20.25
Parameter for polynomial EOS T 2 ( GPa )0Hugoniot polynomial coefficient A 3 ( GPa )2.1
Reference compression strain rate ε ˙ 0 c 3.0 × 10⁻¹¹Crush pressure p e l ( GPa )0.092
Reference tensile strain rate ε ˙ 0 t 3.0 × 10⁻¹²Compaction pressure p c o ( MPa )130
Break compressive strain rate ε ˙ c 3.0 × 10¹⁹Porosity exponent N p 3
Break tensile strain rate ε ˙ t 3.0 × 10¹⁹Note: The system unit is g-cm-μs.
Table 5. Parameter settings in the experimental scheme.
No.PressureImpact TimeTarget DistanceAbrasive FlowNozzle DiameterImpact AngleAbrasive Particle DiameterCutting Material
12 Mpa1 s10 mm120 g/min1 mm90°0.18 mmLimestone
22 Mpa3 s
32 Mpa5 s
43 Mpa1 s
53 Mpa3 s
63 Mpa5 s
75 Mpa1 s
85 Mpa3 s
95 Mpa5 s
Table 6. Measurement data.
Impact Time1 s3 s5 s
Impact Pressure
2 MPaMark No.123
Depth (mm)0.710.760.84
3 MPaMark No.456
Depth (mm)1.491.602.05
5 MPaMark No.789
Depth (mm)1.653.153.66
Disclaimer/Publisher’s Note: The statements, opinions and data contained in all publications are solely those of the individual author(s) and contributor(s) and not of MDPI and/or the editor(s). MDPI and/or the editor(s) disclaim responsibility for any injury to people or property resulting from any ideas, methods, instructions or products referred to in the content.