Abstract
In the process of heavy-duty cutting, the reciprocating motion of the sliding guide pair surface is prone to local wear, which seriously affects the overall machining accuracy and service life of the machine tool. This study proposes a biomimetic micro-texture design scheme combining elliptical grooves and shell-shaped grooves on the surface of carp as biomimetic prototypes to enhance the oil film bearing capacity, drag reduction, and wear resistance of guide rail pairs. Based on Fluent fluid simulation research, it has been shown that this texture has a better dynamic pressure lubrication effect. We used response surface methodology to optimize the texture design parameters and further verify the accuracy of the optimal parameters with the NSGA-II genetic algorithm. The results show that under lubricated conditions, the load-bearing pressure of the combined micro-textured guide rail pair increased by 53.79%, the friction coefficient decreased by 39.04%, and the temperature decreased by 15.83%. This texture can still significantly improve drag reduction and wear resistance in a low-oil state.
1. Introduction
High-end machines, as an important component of various equipment manufacturing industries, play an important role in promoting the overall strength of a country by helping to provide developments and innovations. The sliding slider guide rail pair, which plays a guiding and load-bearing role in machine tools, is one of the key components of various high-end CNC machine tools. The working life and machining accuracy of the guide rail has a significant impact on the overall machining accuracy of the machine tool [1]. Due to the large volume of heavy-duty cutting machine equipment and the frequent reciprocating feed of the guide rail pair, the friction coefficient of the motion pair is high and the pair is prone to wear. When the temperature is high, it can cause the rupture of the oil film, exacerbating wear and affecting transmission accuracy. Domestic and foreign scholars have found that introducing micro-texture technology into the surface of guide rails, a process which is based on bionics theory, can effectively improve the oil film bearing capacity, reduce the friction coefficient, lower the surface temperature of the guide rails, and effectively suppress oil film rupture.
Ogawa et al. [2] used mask sandblasting technology to prepare different micro-textures on the surface of the guide rail, as well as testing the effect of micro-textures on the friction coefficient and oil film thickness of the sliding guide rail. Research has found that under mixed lubrication conditions, both concave and groove microstructures can reduce the friction coefficient of sliding guides. The concave grooves serve as oil reservoirs, while the parallel grooves prevent the lateral leakage of lubricating oil and improve lubrication efficiency. Wos et al. [3] studied the effect of micro-texture on the friction performance of sliding components under poor oil lubrication conditions using the pin–disk test. Research has found that when there are micro-textures on both sides, the interaction between pits affects the lubrication effect. However, when only one side is textured, high-density pit micro-textures store more lubricating oil, generate greater fluid dynamic pressure, increase film thickness, and improve the friction performance. Pang et al. [4] prepared biomimetic micro-textures on cast iron guide rails using lasers, as well as conducting friction and wear studies. It was found that the microstructure can significantly improve the tribological properties of cast iron guide rails, with a grid-like microstructure demonstrating the best performance. Using laser processing, Andriy Kovalchenko et al. [5] prepared circular micro-textured pits that were arranged in a certain distribution on steel guide rail specimens. The results show that machining the micro-textured pits increased their oil storage capacity and improved their friction and wear performance. O. Dykha et al. [6] studied the effects of surface roughness and lubrication structure on the operating characteristics of linear guides. Special attention was paid to the dynamic behavior of the guide rail, and a mathematical model based on the work of Archard was used to study the effect of lubricants on reducing the friction coefficient and improving anti-friction performance, which helps to increase the durability of the guide rail. Atwal, JC et al. [7] prepared micro-textures on thrust bearings and studied the effects of micro-texture depth, radial length, etc., on the friction coefficient, minimum oil film thickness, and pressure distribution of thrust bearings. Research has found that compared to non-textured bearings, the minimum film thickness increased by 48% and the friction coefficient decreased by 24%. Ji Jinghu et al. [8] studied groove micro-texture sliders and found that the angle, depth, and area density have a significant impact on the dynamic pressure effect, while the width factor of the groove has almost no effect on the average pressure. This indicates that optimizing the surface micro-texture parameters can improve the fluid dynamic pressure effect. Zuobo Pang et al. [4] conducted friction and wear tests on guide rail friction pairs containing micro-textures using a self-made reciprocating friction and wear testing machine. The results show that biomimetic micro-textures can improve friction and wear performance, among which network biomimetic micro-textures have an excellent performance in relation to anti-friction and wear.
Meanwhile, some scholars [9] have studied the influence of micro-texture on the low-speed stability of sliding guides, finding that the micro-texture can effectively reduce the low-speed crawling phenomenon between guides and improve low-speed stability. Furthermore, Wang et al. [10] conducted a study on the crawling phenomenon of textured surfaces using pin–disk experiments and found that convex textured surfaces had the best low-speed stability, followed by concave textured surfaces, while polished surfaces had the worst low-speed stability. A study by He et al. [11,12,13] also obtained similar results. The authors analyzed the effect of micro-pits using a fluid lubrication model and believed that texturing can enhance the dynamic pressure on the surface, change the critical point of fluid lubrication transformation in mixed lubrication, and, subsequently, alter the relationship between the velocity and the friction coefficient, which is beneficial for improving friction stability. Zhang et al. [14] used special laser processing technology to prepare three types of unit cell micro-textures on the surface of guide rail friction pairs—a grid type, a pit type, and a mixture of the two types. Experiments were carried out in conditions lacking oil, and the results show that the anti-friction and wear properties of the micro-texture in the grid and pit interaction type were better. Jinghu Ji et al. [15] studied the influence of micro-textured fluid dynamic pressure performance by establishing a slider analytical model. The research results show that surface friction pairs with cross-hatched micro-textures can generate fluid dynamic lubrication, while mesh micro-textures with different geometric parameters have a significant effect on the distribution of fluid dynamic pressure. Han Hongsong et al. [16] studied the influence of surface micro-textures on the friction and wear performance of sliding slider guide pairs, finding that concave micro-textures produced significant fluid dynamic pressure effects, reducing the maximum friction coefficient by 72% and exerting a positive effect on reducing wear. Jie Xuan et al. [17] used laser processing technology to prepare pits and grid-like micro-textures on the surface of sliding guide pairs, in addition to conducting wear tests. The results indicate that the micro-texture has a significant effect on suppressing the crawling phenomenon of guide rails, while the combination of lubricating oil and solid lubricant has a better lubrication and wear reduction effect on textured guide rails. Zhang Dongya et al. [18,19] studied the influence of fluid lubrication characteristics on groove-type microstructured surface guide pairs based on the N–S equation. The results indicate that when the groove volume is the same, two-layer grooves generate a larger average oil film pressure than single-layer grooves. When there is no vortex in the groove, the oil film bearing capacity increases with the depth of the groove. However, when there is a vortex in the groove, it weakens the wedge effect of the groove and reduces the oil film bearing capacity. Therefore, it is necessary to avoid the generation of vortices in the groove. Zhu Kan et al. [20] analyzed the load-bearing performance and friction characteristics between parallel slider friction pairs using the Reynolds equation. The research results indicate that the distribution parameters of micro-textures have a significant impact on improving the load-bearing pressure and friction performance between guide rail friction pairs.
Zhang et al. [21] used a self-made guide rail friction and wear testing machine to investigate the variation law relating to the friction coefficient and wear morphology of micro-textured guide rail pairs, exploring the influence of micro-texture on the friction and wear characteristics of guide rail pairs under lubrication conditions. The results indicate that the optimal surface density range for biomimetic hexagonal micro-textures is around 20%. However, when biomimetic hexagonal micro-textures exist on both surfaces of the guide rail pair, the micro-textures will increase their friction and wear. Fan Yujie et al. [22] explored the influence of different composite lubrication structures on friction characteristic parameters. Research has found that the multi-level composite lubrication structure composed of groove-type micro-textures and hexagonal micro-pits exhibits the best performance in suppressing crawling phenomena. Yue Hongzhi et al. [23] designed and built a friction and wear test platform for guide rails, studying their friction and wear and low-speed stability under different loads and speeds. The results show that in terms of friction and wear, the performance of the lower textured guide rail was enhanced compared to the upper textured guide rail and the two textured guide rails. The average friction force was reduced by about 12%, the wear depth was reduced by 15%, and the amplitude of friction fluctuation during low-speed crawling could be reduced by up to about 80%. The low-speed stability was significantly improved. Chen Cheng et al. [24] improved the friction performance of sliding guides by processing various texture morphologies on the surface of the guide rail, as well as solving the oil film pressure distribution on each texture surface through numerical calculations. Research has found that the oil film pressure of convex textures is much lower than that of concave textures. As the depth of concave texture increases, the oil film pressure shows a trend of first increasing and then decreasing. At the same time, some scholars have applied micro-textures to tool cutting, such as Ahmed et al. [25], who found that, compared to non-textured tools, square groove micro-textured tools have the best anti-bonding and anti-wear performance, significantly reducing the cutting force and friction coefficient. Qi Zhixu et al. [26] applied composite micro-textures to the field of metal cutting, and the research results show that composite micro-textures can significantly reduce cutting forces and lower cutting temperatures.
Based on the analysis and research contained in the existing literature, it was found that incorporating biomimetic micro-texture technology into the surface of guide rails can effectively improve the oil film bearing capacity, reduce the friction coefficient and temperature increases, and effectively suppress the rupture of the oil film between guide rail friction pairs. The significant effect of preventing the excessive wear of the guide rail and suppressing oil film rupture provides a sufficient theoretical basis for the research in this article [27]. However, research has found that although biomimetic micro-textures can significantly improve the performance of guide rails, most of the studies are related to single micro-textures. Despite this, some studies have pointed out that composite micro-textures demonstrate a superior performance in improving the oil film bearing capacity compared to single micro-textures; however, there is relatively little research on composite micro-textures.
Based on the above research, this article selects carp and shells as biomimetic design prototypes through the extensive observation and analysis of aquatic organisms; we conduct microscopic observations of their body surfaces to obtain three types of surface morphology distribution characteristics—single ellipse, single groove, and a combination of elliptical grooves. In order to study the influence of these textures on improving the oil film bearing capacity, this paper compares the oil film bearing capacity, shear stress, temperature, and other important simulation results of no texture, single texture, and combination texture through simulation analysis, selecting the optimal micro-texture guide surface. The simulation results show that the elliptical groove combination micro-textured guide surface is superior to the single micro-textured surface in suppressing the rupture of the oil film between guide friction pairs. Additionally, we further optimize the parameters of the elliptical groove combination micro-texture using response surface methodology and validate it using genetic algorithms to investigate the effects of size and distribution parameters on oil film-related indicators. In addition, equivalent stress analysis was conducted on the surface of the combination micro-textured guide rail pair with the optimal parameter indicators. The results show that the elliptical groove combination micro-texture demonstrated a lower average equivalent stress, thereby improving the drag reduction and wear resistance characteristics of the biomimetic micro-textured guide rail pair.
2. Materials and Methods
2.1. Selection of Biomimetic Design Prototypes
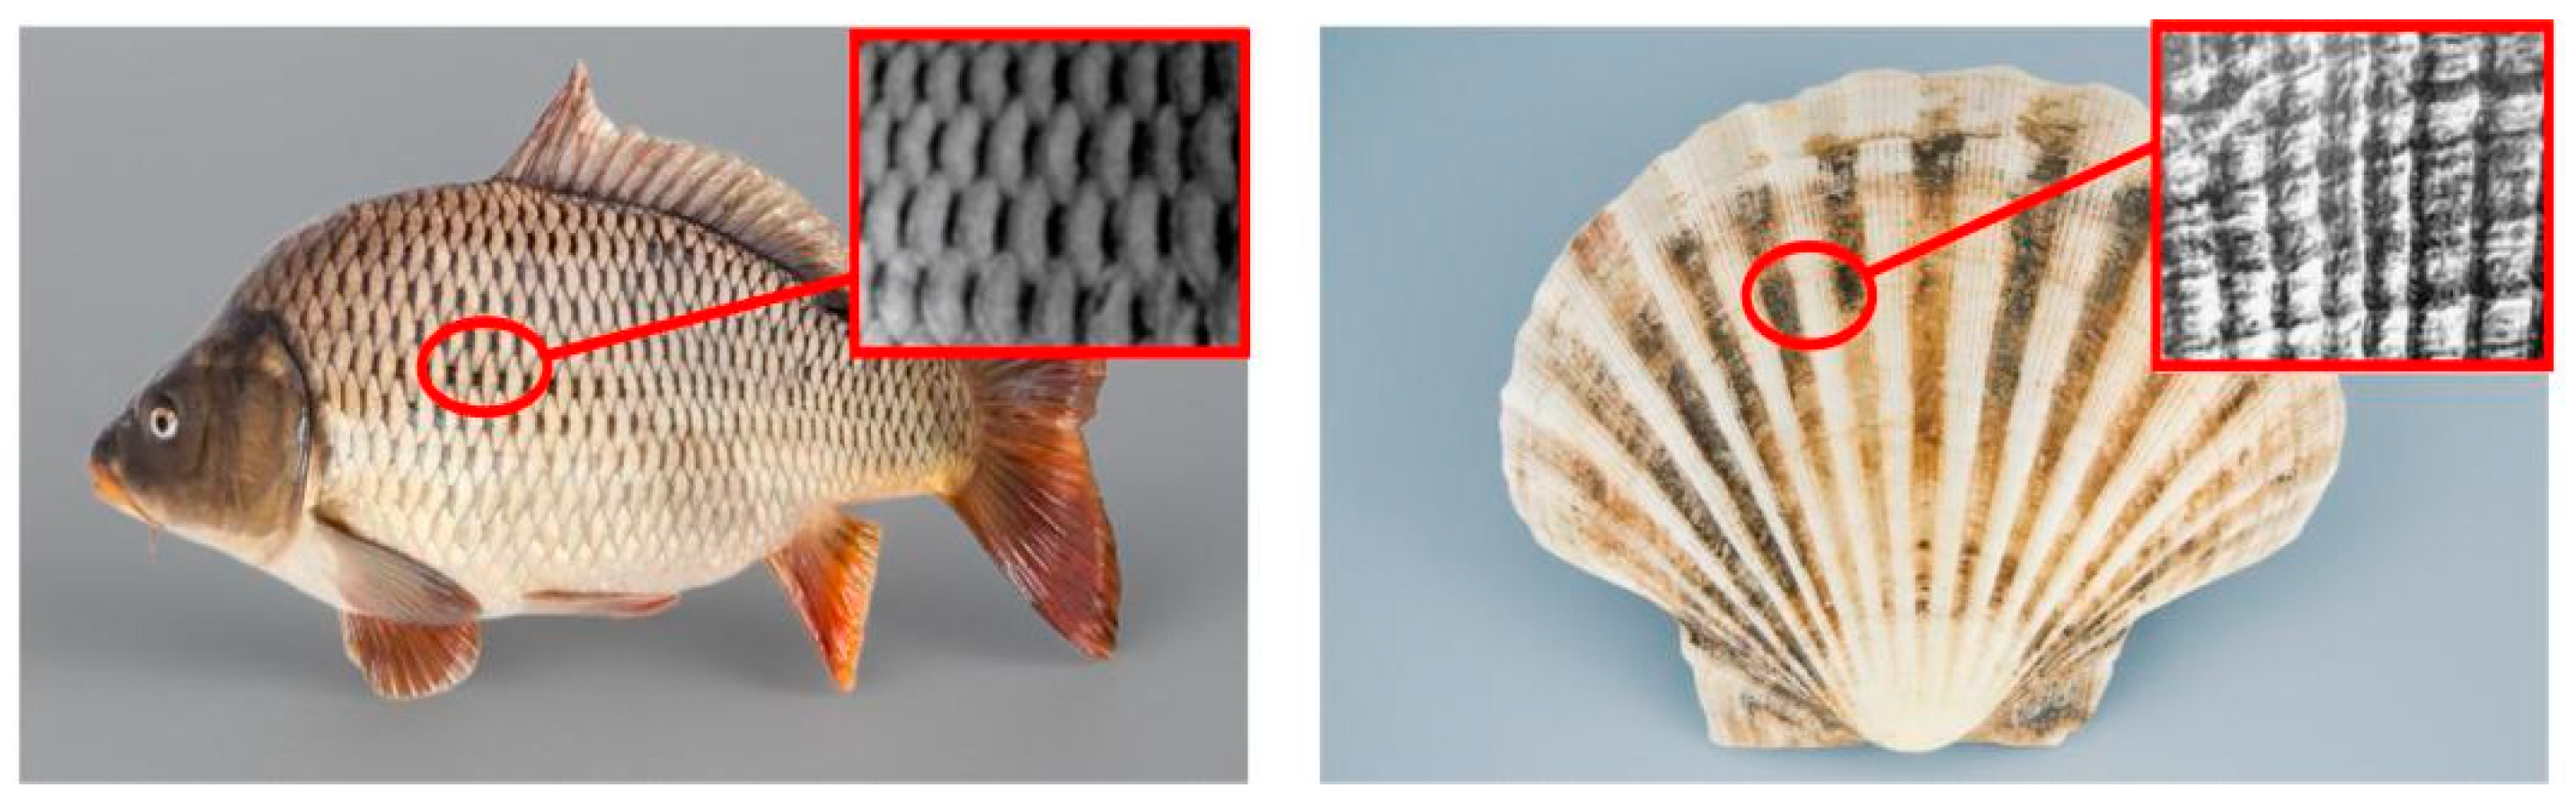
Surface texturing technology involves the preparation of micro-pits or micro-protrusions with a certain shape and size, as well as a regular distribution on the surface of existing mechanical equipment friction pairs. The preparation of micro-textures on the surface of mechanical equipment friction pairs has been proven to be an effective method for reducing wear and improving load-bearing performance [28,29,30]. When observing and studying the scales or microscopic textures of animal skin, it was found that the skin of animals such as carp, shark, and shell has a micro-morphology of unevenness, as well as a regular arrangement. Therefore, through the microscopic observation of the surface of carp and shells, it was found that the surface of carp is covered with a large number of regularly arranged elliptical micro-pits, while the surface of the shell contains directionally arranged groove-like microstructures. These surface textures play different functional roles in aquatic environments, such as reducing water flow resistance and enhancing surface lubrication. These observations form the biological basis for selecting elliptical and grooved textures as our biomimetic design elements. Therefore, it is introduced into the micro-texture guide rail design theory studied in this article, and a combination of elliptical and groove-shaped micro-textures is designed to explore the effects of the three types of micro-textures on the relevant properties of the guide rail pair. A microscopic observation of the surface morphology of the pits on carp and shells is shown in Figure 1.

Figure 1.
Microscopic observation results of micro-pits on the surface of carp and shells.
2.2. Fluid Lubrication Theory
With the continuous development of machine tools with high speed, heavy load, and high stability characteristics, the performance of guide rail friction pairs is particularly important as a key component that affects the machining accuracy of machine tools. Particularly in heavy-duty metal-cutting machine tools, once the guide rail friction pair experiences severe wear, it will directly affect the machining accuracy of the machine tool. Research has shown that under normal working conditions, the oil film forms well and the lubricating oil on the surface of the guide rail friction pair is usually in a laminar flow state. During the start-up or emergency stop of the machine tool, due to fluctuations in lubrication conditions, the flow state may transition from laminar to locally turbulent. Due to the fact that most machine tools are still in normal working condition during their operating time, this article mainly focuses on the laminar flow of machine tools in normal working condition for research. In addition, the introduction of micro-textures on the surface of the guide rail may alter the thickness of the local oil film, further promoting the transition of lubricating oil from a layer state to a local turbulent state. However, through a simulation analysis of various turbulence models, Dai Jinyue et al. [31] found that textured surfaces can significantly improve the oil film bearing capacity, reduce the risk of oil film rupture, and prevent direct contact between friction pairs and pitting corrosion. Chongpei Liu et al. [32] further demonstrated that the introduction of micro-textures not only reduces the temperature of lubricating oil but also enhances the viscosity of the oil film. Although local turbulence may cause slight pitting, overall, micro-textures can effectively enhance the load-bearing capacity and reduce the temperature, thereby suppressing oil film rupture and weakening the impact of local turbulence on pitting.
Osborne Reynolds [33] proposed the basic equations of lubrication theory based on fluid mechanics, laying the foundation for modern fluid lubrication theory. Most of the current fluid lubrication calculations are based on the application and solution of the Reynolds equation; the theoretical research on the dynamic pressure effect of micro-textures is also based on this. The general form of the Reynolds equation is as follows:
In the formula, h (x, y, t) is a function of the oil film thickness with respect to the spatial coordinates x, y, and time t; π (x, y, t) is the pressure distribution; ρ (x, y, t) is the lubricating oil density; η is the dynamic viscosity of the lubricating oil; and U and V are the sliding velocities in the x and y directions, respectively. Considering that when the guide rail is in a stable sliding state, ignoring the viscosity changes and extrusion effects of the lubricating oil, the Reynolds equation can be written as follows:
It can be seen that under the condition of ignoring the viscosity and density changes in lubricating oil, the surface pressure distribution is determined by the oil film thickness distribution (h) and the sliding speed (U) of the lubricating oil. Therefore, in the analysis, only the oil film thickness distribution model needs to be established and there is no need to establish physical guide rails and sliders.
When the guide rail moves in a liquid lubrication state, the lubricating oil film between the guide rail pairs follows the two-dimensional steady-state incompressible lubricating oil fluid dynamic pressure Reynolds equation under a laminar flow state, as follows [34,35]:
In the formula, p is the pressure between the guide rails, Pa; h is the thickness of the oil film, mm; η is the viscosity of the lubricating oil, Pa·s; and V is the relative sliding speed of the guide rail pair, m/s, neglecting the velocity vector in the direction of oil film thickness in the steady state, i.e., ∂h/∂t = 0.
According to Equation (3), the bearing pressure P (x, y) of the lubricating oil film is integrated to obtain the bearing capacity of the lubricating oil film; the bearing capacity formula is as follows:
The frictional force exerted by the lubricating oil film on the surface of the sliding slider can be obtained by integrating the fluid shear stress in contact with the sliding slider along the entire unit. From this, the formula for frictional force can be derived as follows:
The formula for the friction coefficient μ can be obtained from Formulas (4) and (5), as follows:
Integrating the temperature of the lubricating oil film Τ (x, y) between the sliding slider guide rail pairs to obtain the temperature of the lubricating oil film, the average temperature can be obtained as follows:
- —friction, N;
- —velocity gradient along the direction of lubricating oil film thickness, S-1;
- —shear stress of lubricating oil, Pa;
- —friction coefficient, which is the ratio of frictional force to bearing pressure;
- T1—average temperature, °C;
- S—oil film area, mm2;
- D—integration region ;
- W—bearing capacity, N.
2.3. Analysis of the Coupling Mechanism of Composite Biomimetic Micro-Textures
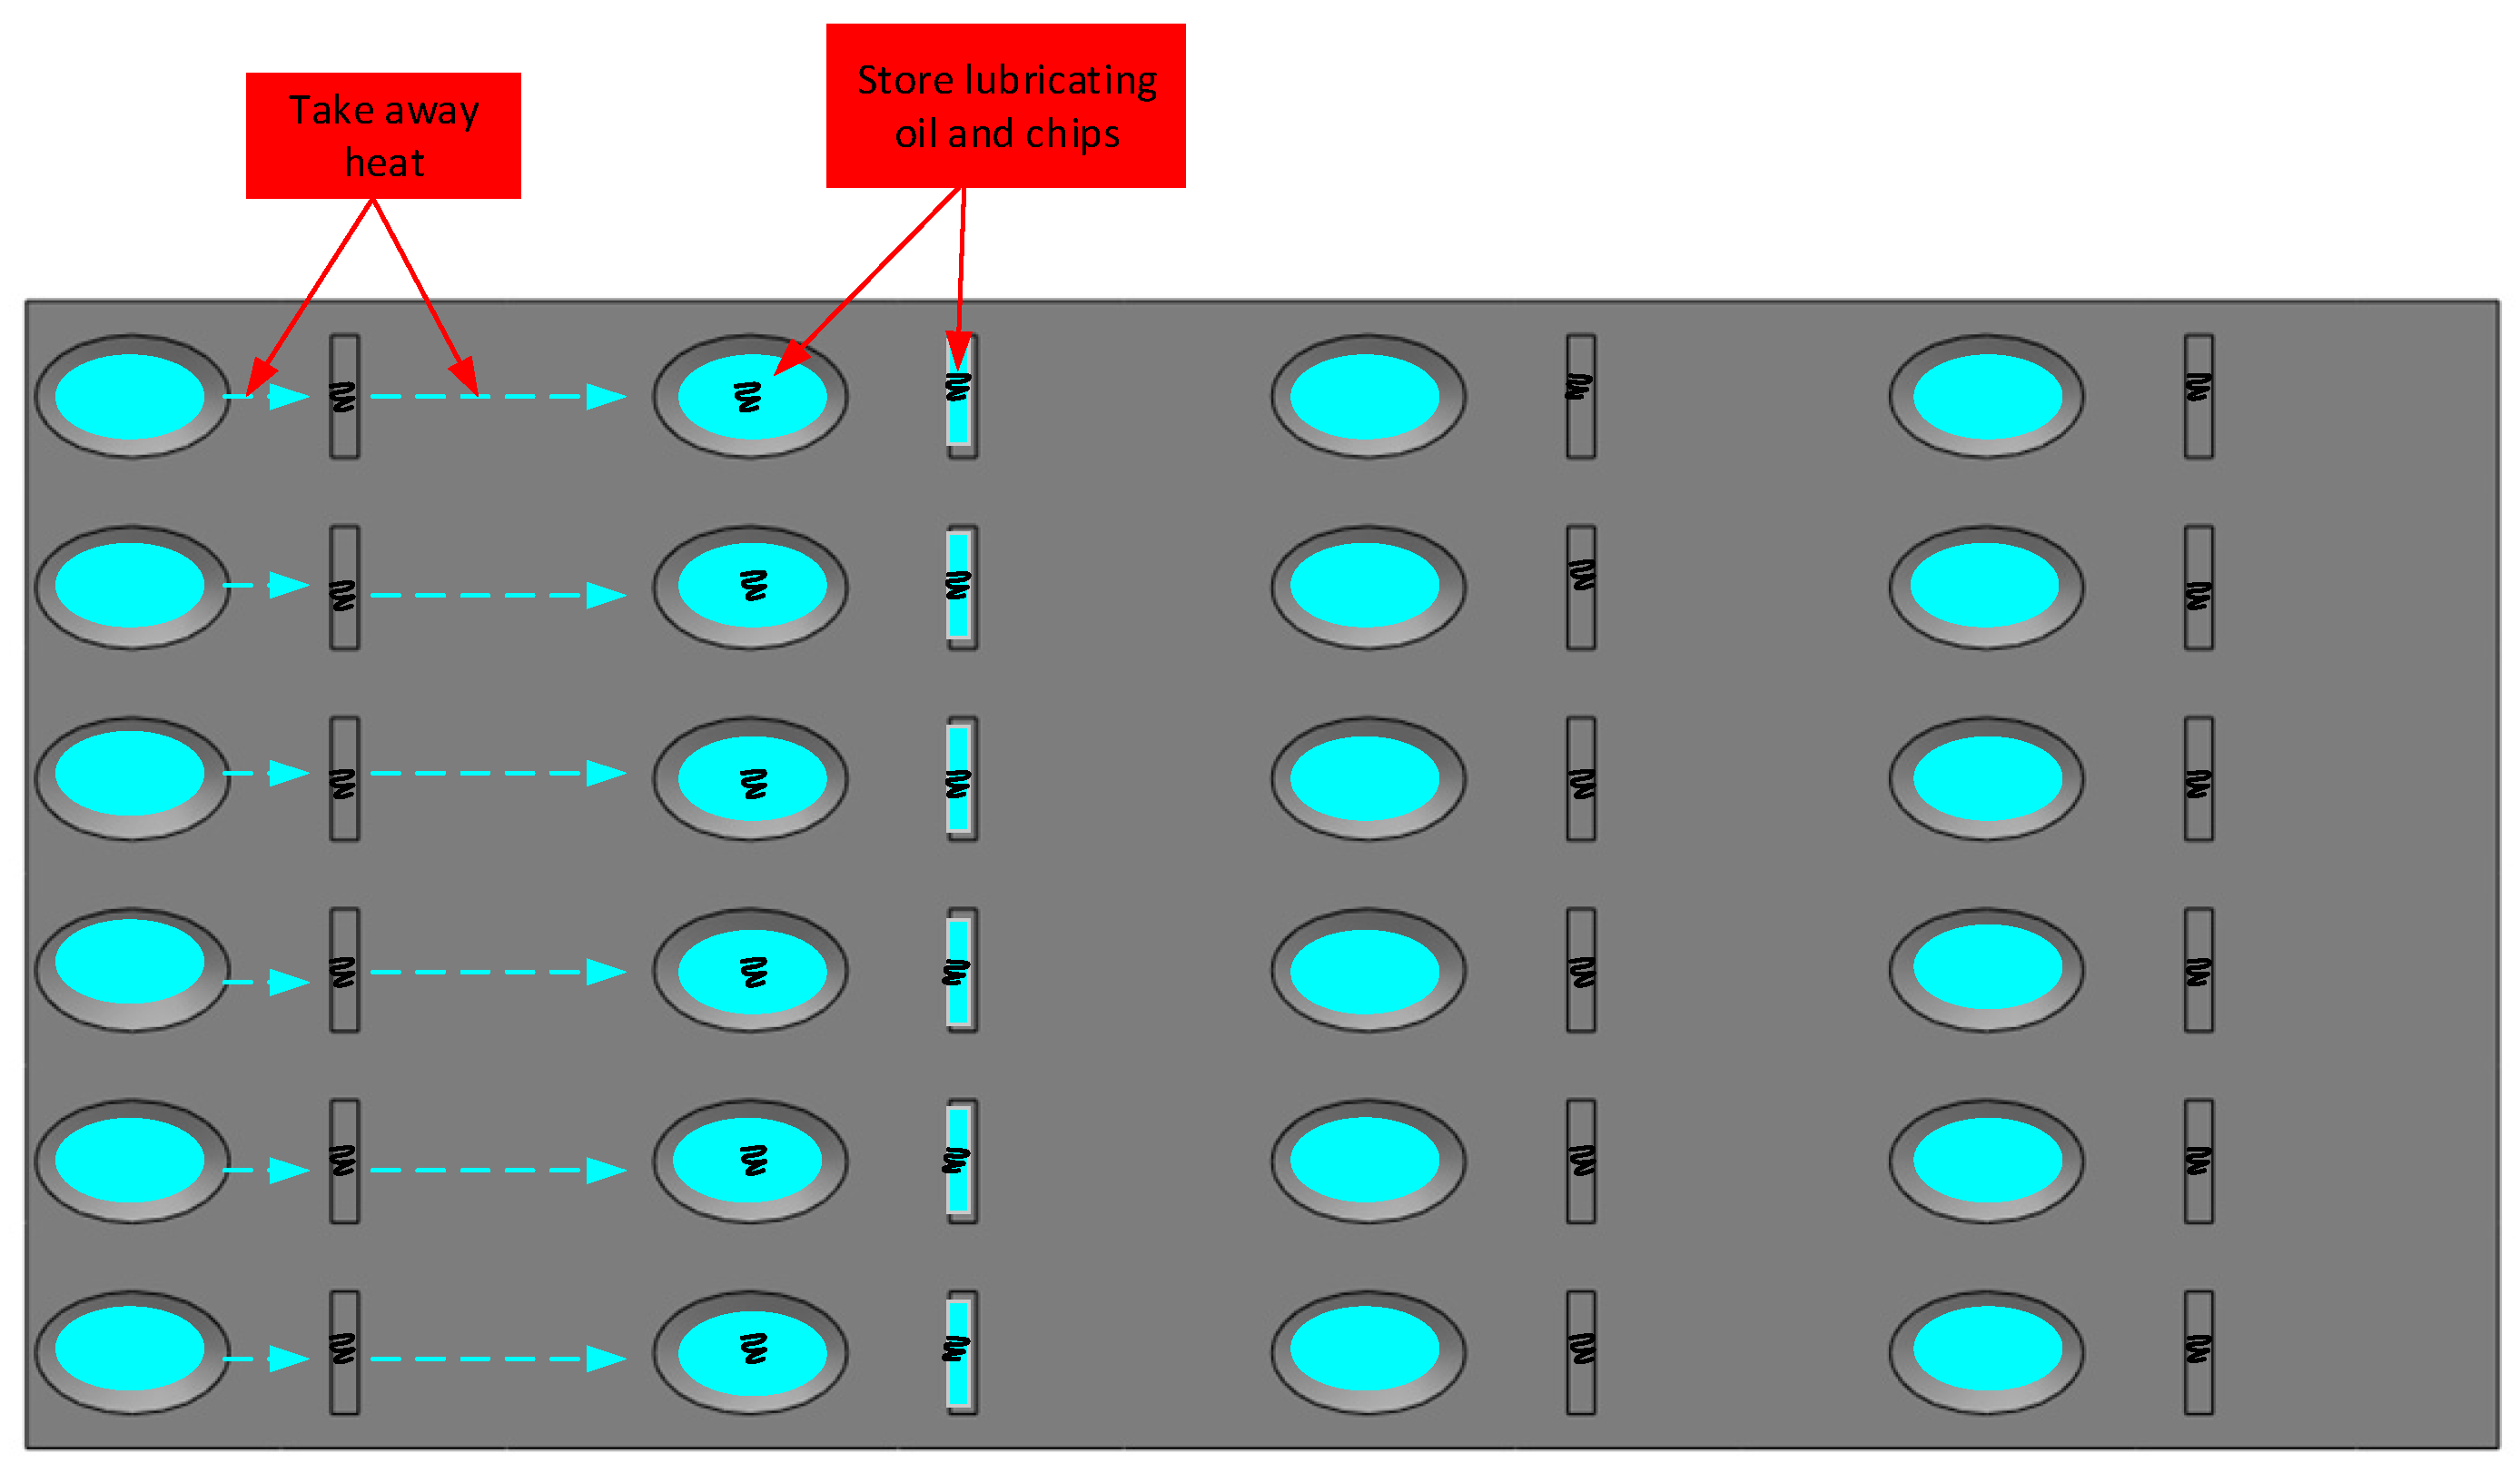
The combination of biomimetic micro-textures promotes fluid dynamic sliding. In the rapid feed transmission of machine tools, the geometric shape of groove texture can play a role in super-hydrophobicity and flow guidance, allowing lubricating oil to quickly reach the surface of the guide rail in order for it to be guided to concentrate in the micro-texture area, taking away a large amount of the heat generated during the feed process. At the same time, a more uniform lubricating oil film is formed, which reduces the friction between the sliding slider friction pairs. The geometric shape of elliptical pits results in a higher load-bearing capacity, which is more conducive to forming a stable lubricating oil film and reducing the friction coefficient between the guide rail friction pairs. At the same time, elliptical pits are more conducive to storing lubricating oil, allowing it to be stored near the elliptical pit area for a longer period of time, thereby reducing wear in the microstructure area. The reasonable distribution of elliptical pits can make the distribution of lubricating oil more uniform. The combination of groove-shaped micro-textures and elliptical pit-shaped micro-textures not only utilizes groove textures to guide lubricating oil to quickly flow into the micro-texture area, taking away a large amount of heat and reducing wear, as well as ensuring the long-lasting operation of the friction pair, but also utilizes the higher load-bearing capacity of elliptical pits to make it easier for the overall texture area of the elliptical pits and grooves to form a lubricating oil film. Through elliptical pits, lubricating oil can be stored more persistently, providing more durable lubrication conditions for the overall texture area of the elliptical pits and grooves. Therefore, the combination of elliptical pits and grooves in biomimetic micro-texture cutting tools achieves the simultaneous alleviation of wear on the upper and lower surfaces of the guide rail pair through the coupling mechanism of elliptical pits and grooves, as shown in Figure 2.

Figure 2.
Schematic diagram of the coupling mechanism of biomimetic micro-textures in combination.
Combining biomimetic micro-textures is more conducive to forming local lubricating oil pools. During the feeding process, the groove microstructure can serve to store some lubricating oil and form a local lubricating oil pool. The lubricating oil pool is more conducive to forming a uniform lubricating oil film through fluid dynamics effects, which provide local lubrication on the surface of micro-textured guide rails. Elliptical pits can store more lubricating oil, forming a lubricating oil pool that continuously provides lubrication for the feeding process. The coupling mechanism between the formation of a uniform lubricating oil film and the storage and provision of lubricating oil in elliptical pits through groove micro-texture facilitates the lubrication effect of combined biomimetic micro-texture guide rail pairs.
Combining biomimetic micro-textures can reduce the contact area between the guide rail surface and debris. During the feeding process, the elliptical concave micro-texture can guide the lubricating oil and the rapid discharge of debris, achieving the goal of reducing the wear of the guide rail surface by reducing the contact time between the guide rail surface and debris. The groove-like structure can effectively reduce the accumulation of debris on the surface of the guide rail by storing debris. The cooling and wear reduction effects of combined biomimetic micro-texture guide rails are achieved through the coupling mechanism of guiding debris discharge through elliptical concave pit micro-textures and reducing debris accumulation through the groove-like design.
3. Design and Scheme Optimization of Biomimetic Micro-Textured Guide Rail Friction Pairs
3.1. Determination of Prototype Guides
Sliding rail pairs are widely used in mechanical equipment, especially in the feed system of heavy-duty machine tools, due to their simple structure, easy manufacturing and disassembly processes, and low cost. However, due to the direct friction of the contact surface, its friction coefficient is relatively high, which can easily lead to increased energy loss, significant temperature increases, and reduced wear life, thereby affecting the machining accuracy and motion stability of the machine tool. Therefore, in-depth research on the lubrication and friction characteristics of sliding rail pairs is of great significance for improving their working performance.
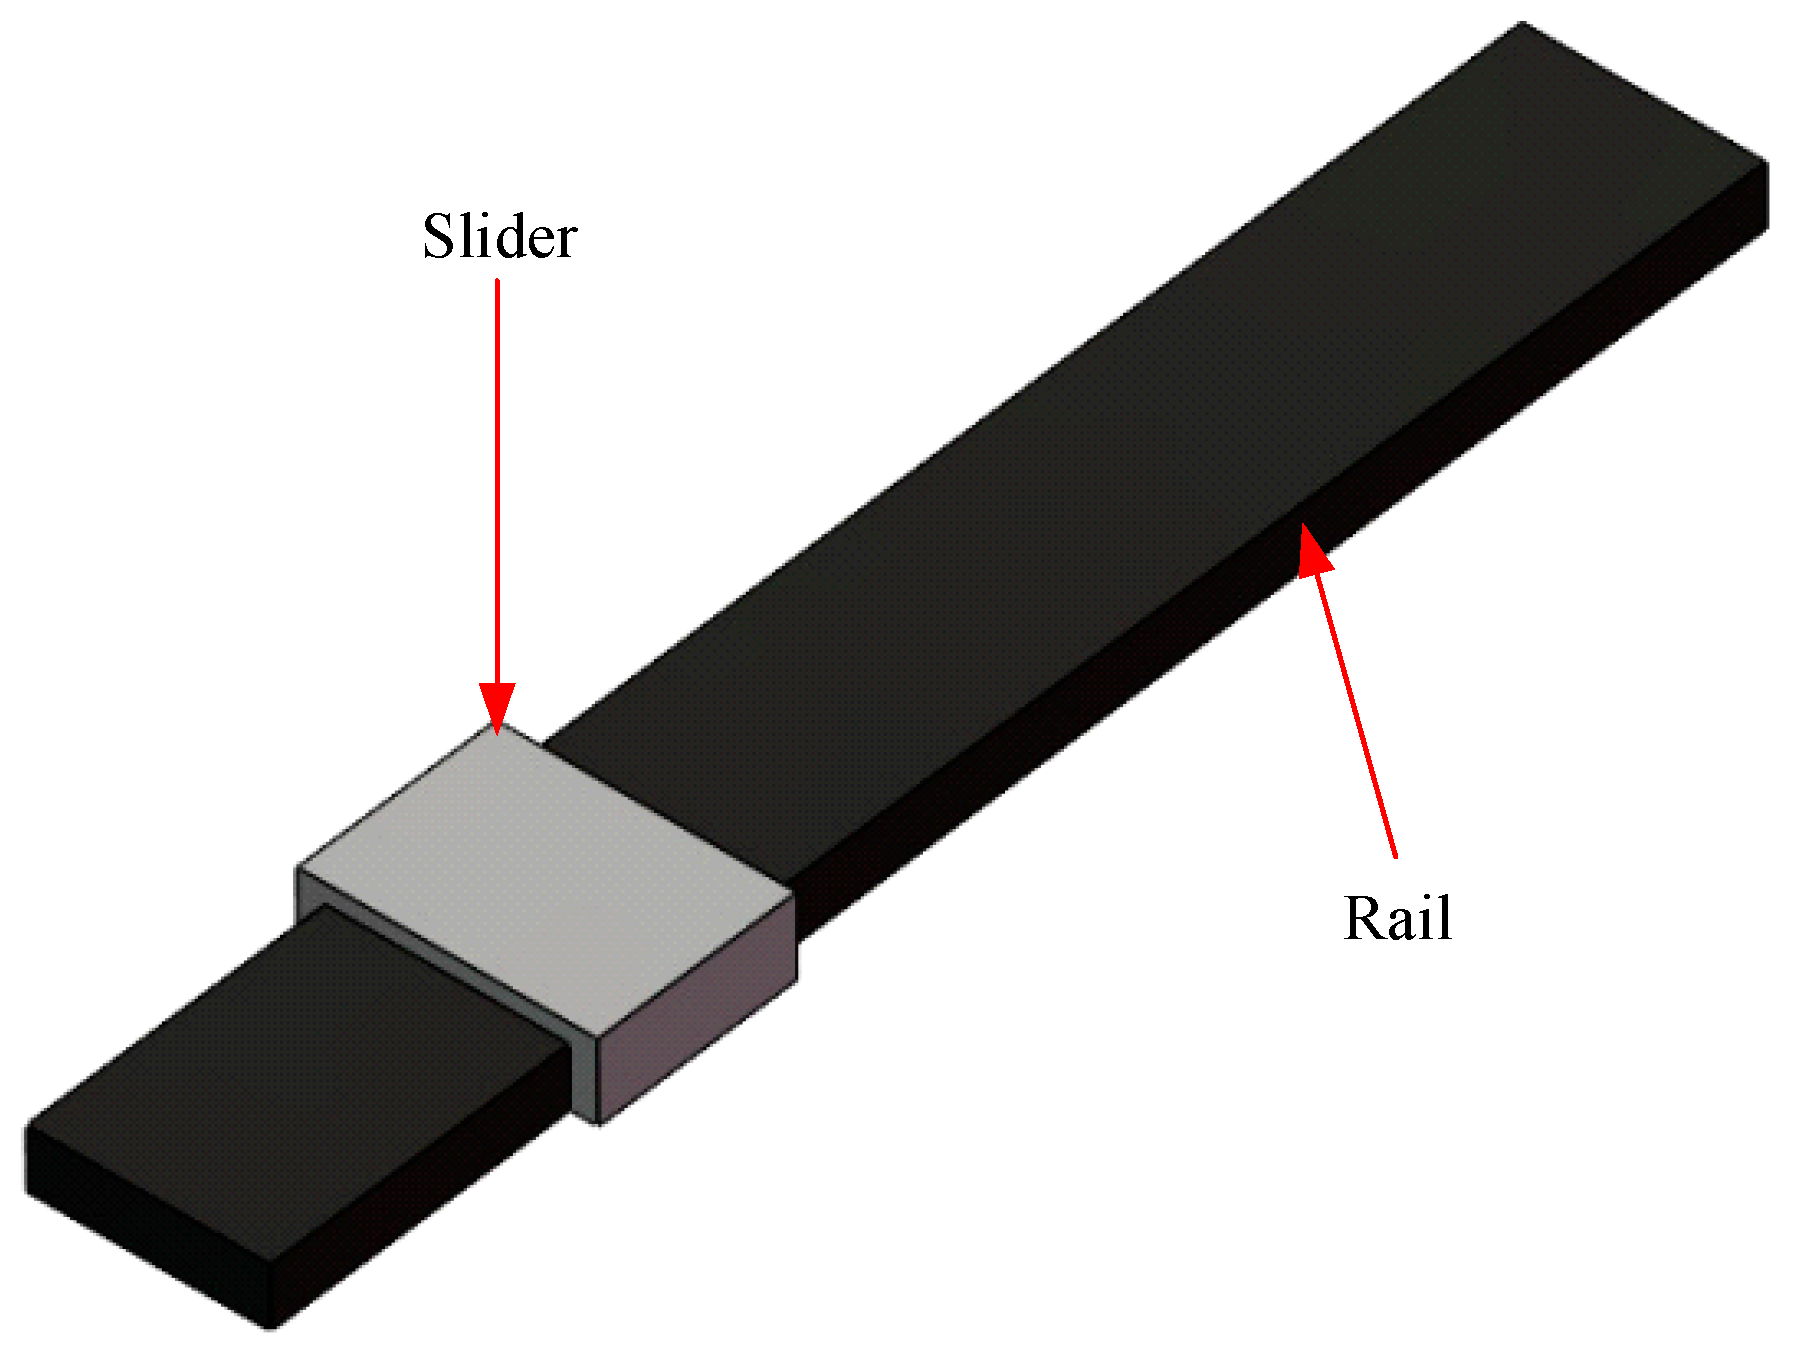
This study focuses on the sliding guide rail pair in the feed transmission system of heavy-duty machines, and analyzes the pressure distribution characteristics, friction and wear laws, and temperature rise trends of its lubricating oil film in order to reveal the influence of lubrication conditions on the friction performance of the guide rail pair. For the convenience of simulation analysis and in combination with actual working conditions, the guide rail pair structure is reasonably simplified; its geometric model is shown in Figure 3.
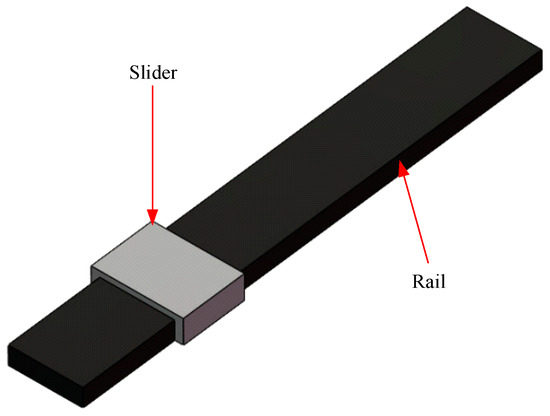
Figure 3.
Simple model diagram of sliding slider guide rail pair.
3.2. Surface Biomimetic Micro-Texture Design
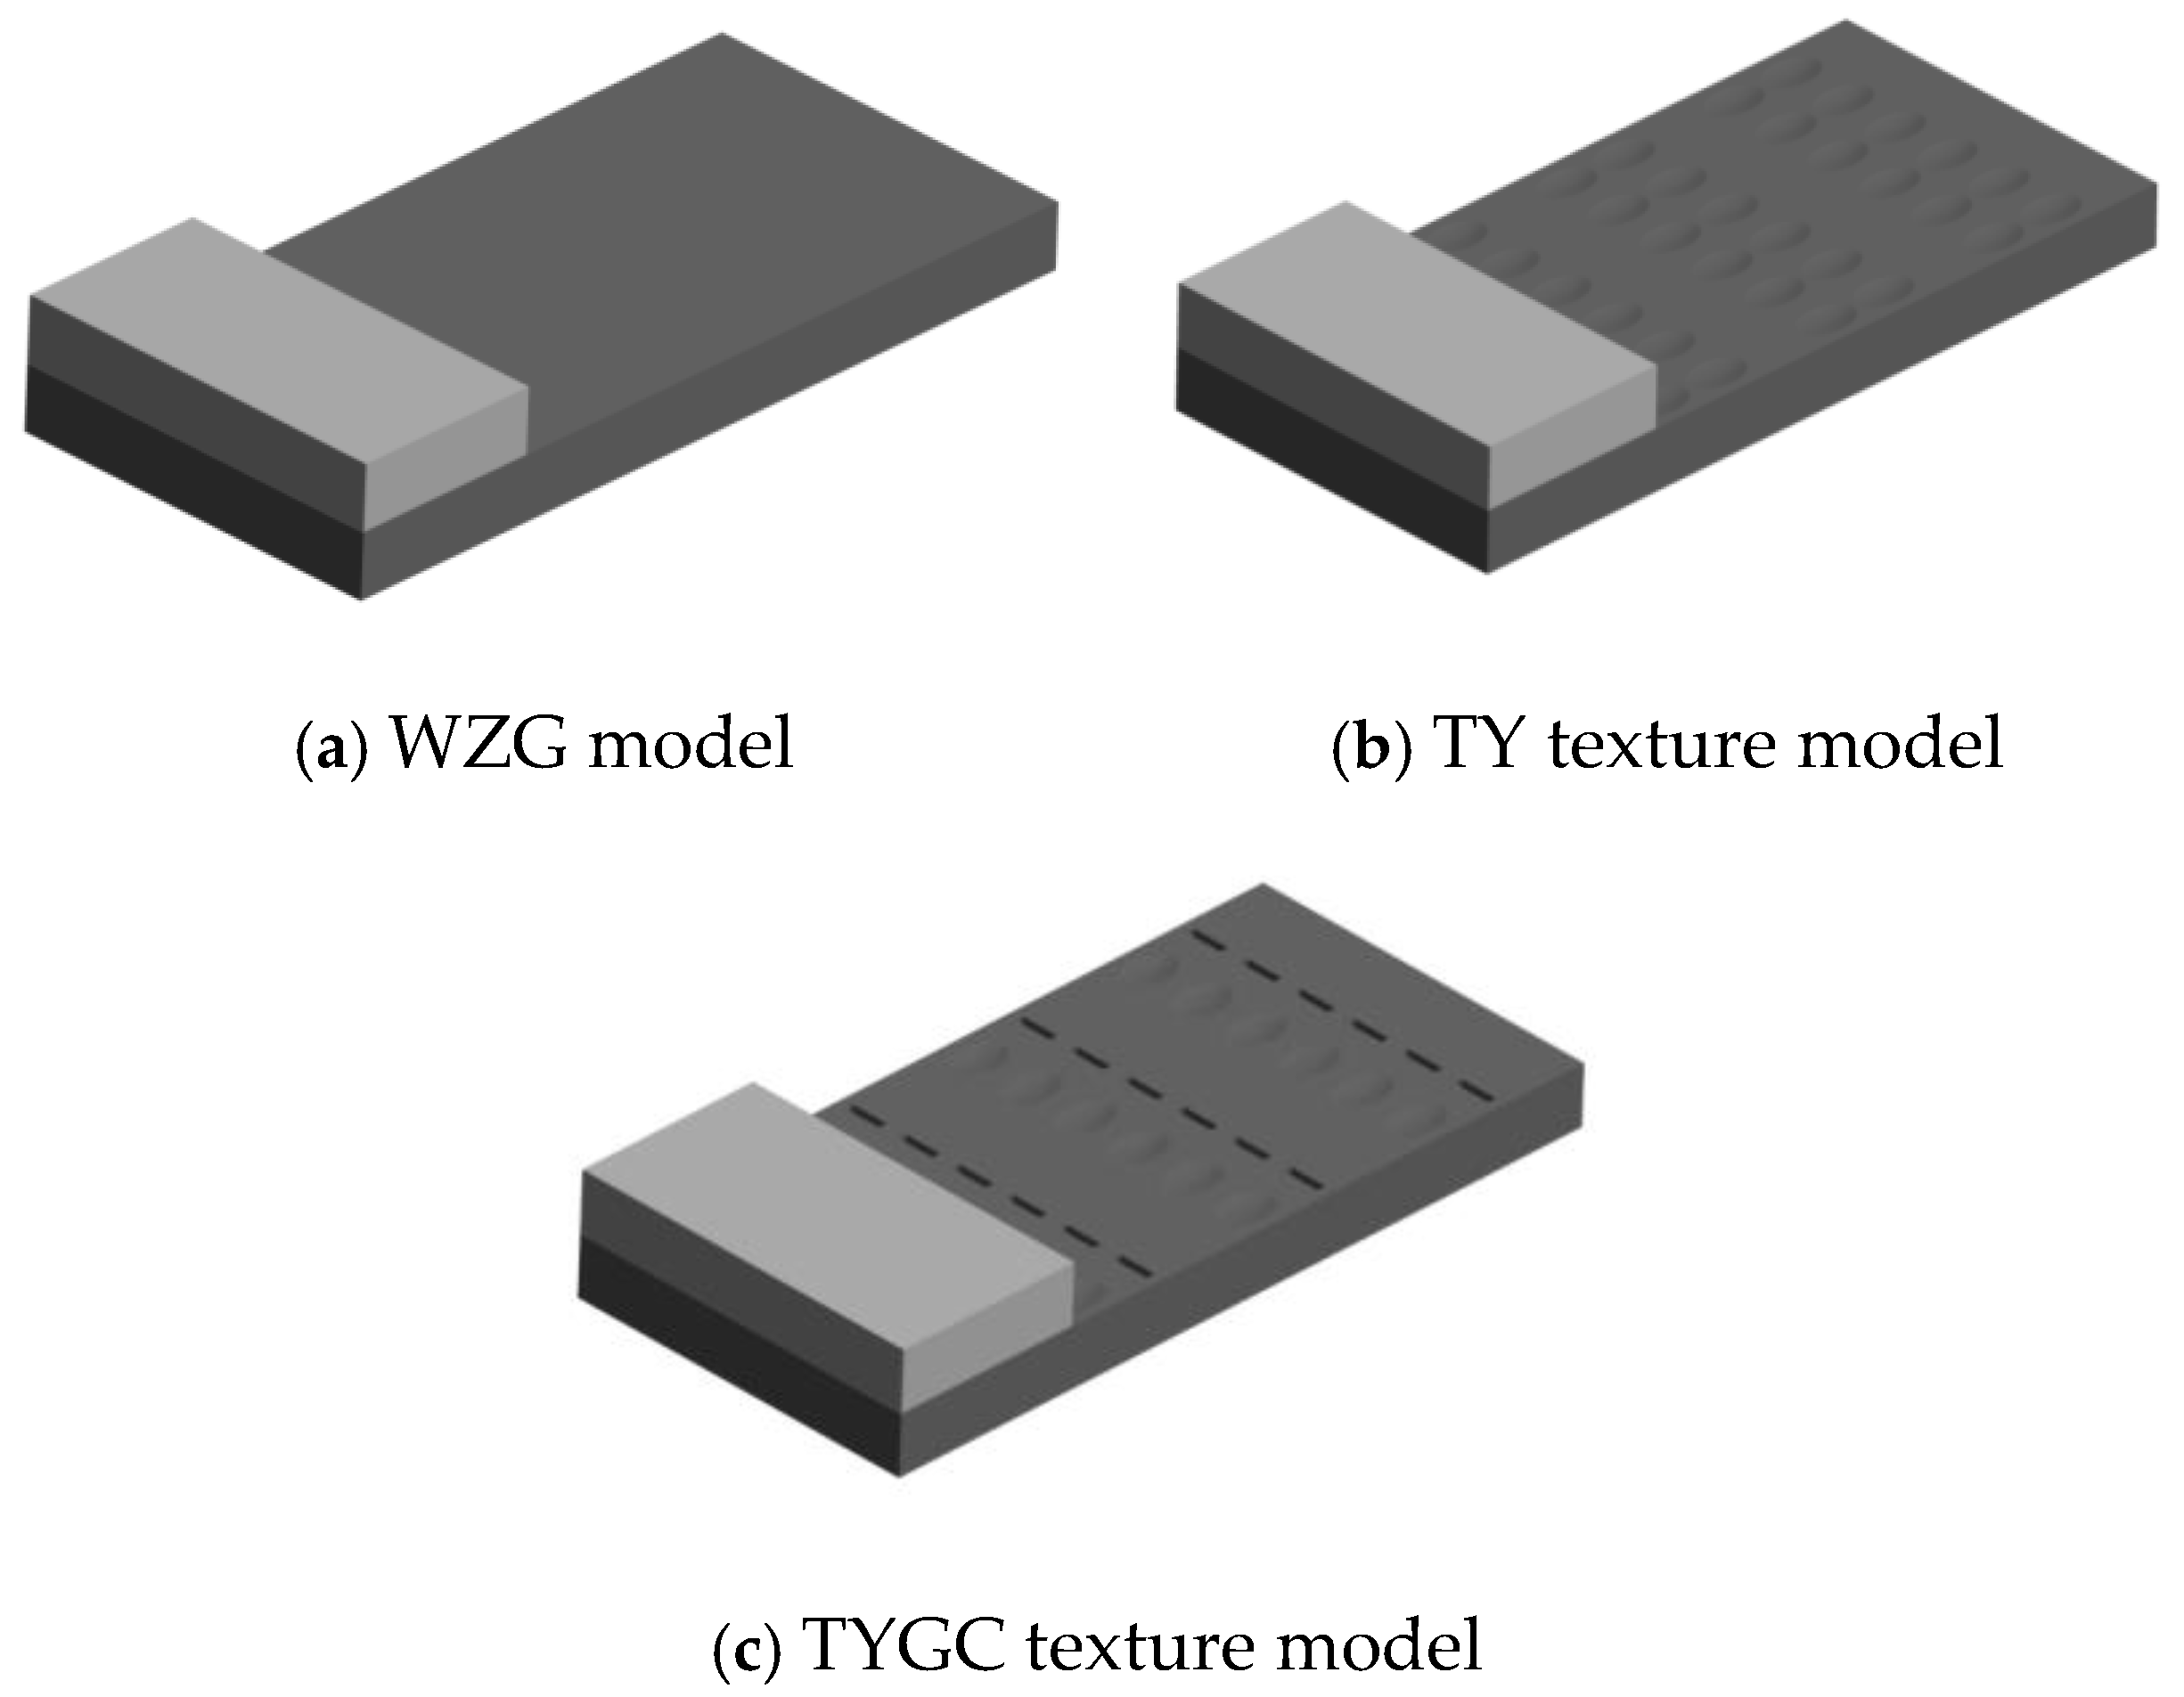
This study is based on the microstructure of concave pits on the surface of carp and shells as biomimetic design prototypes. Four different micro-textured oil film models of guide rail pairs were designed. In order to improve the efficiency of simulation analysis without affecting the results, a 3000 μm × 800 μm local element of the machine tool guide rail was selected for finite element simulation analysis of WZG, TY texture, GC texture, and TYGC combination texture. Assuming that the two surfaces of the sliding slider guide pair under study are in a fluid lubrication state, with an oil film thickness h of 10 μm, a texture center distance of 1500 μm, and a texture depth of 150 μm, the WZG lubricating oil model is assumed to have a size of 3000 μm × 800 μm × 10 μm, as shown in Figure 4a. The size of the TY micro-texture is shown in Figure 4b, with an elliptical long-axis radius of 750 μm, an elliptical short-axis radius of 520 μm, and an elliptical parabolic coefficient of 0.7, and the distance between the lowest point of the elliptical parabola and the elliptical centerline is 200 μm. The size of the GC micro-texture is shown in Figure 4c, with a groove length of 140 μm and a groove width of 520 μm. The size of the TYGC combined texture is shown in Figure 4d, with an elliptical long-axis radius of 750 μm, an elliptical short-axis radius of 520 μm, and an elliptical parabolic coefficient of 0.7; the distance between the lowest point of the elliptical parabola and the centerline of the ellipse is 200 μm, the groove length is 140 μm, and the groove width is 520 μm. The simulation analysis model is established in sequence, as shown in Figure 4.
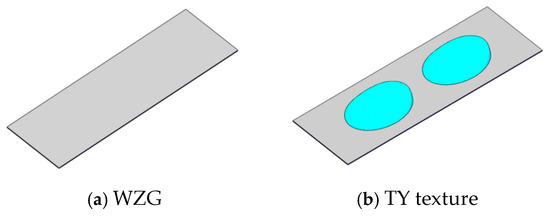
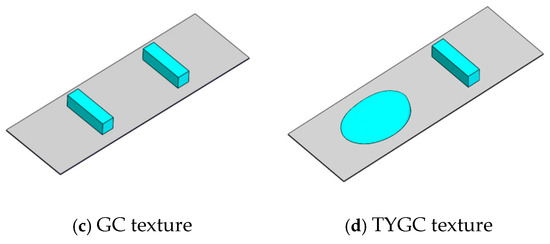
Figure 4.
Micro-textured lubricating oil film model.
3.3. Simulation Result Analysis
In order to explore the texture shape with the best bearing capacity of lubricating oil film between friction pairs among the four different texture shapes, the three-dimensional model in the previous text was meshed, while the oil film boundary constraints were set as shown in Figure 5.
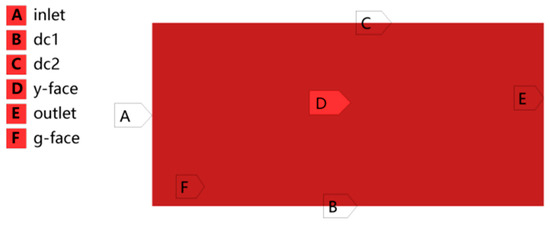
Figure 5.
Setting the oil film boundary constraints.
This study used ANSYS Fluent (2024 R1, ANSYS Inc., Canonsburg, PA, USA) and assumed steady-state conditions. The lubricating oil film flow between the guide rail pairs was set to a laminar flow. The energy equation was opened, and the performance parameters of the lubricating oil were input. The lubricating oil density was 890 kg/m3 and the dynamic viscosity was 0.11 Pa·s. Due to the small-sized unit of the simulation analysis model, as well as the small difference in inlet and outlet pressure, the simulation model was set to have no differential pressure flow. The inlet and outlet were both set to 1 atmosphere. The upper wall of the oil film was set as a moving wall with a velocity of 0.5 m/s, while the lower wall of the oil film was set as a fixed wall. The boundary conditions of the model were also set.
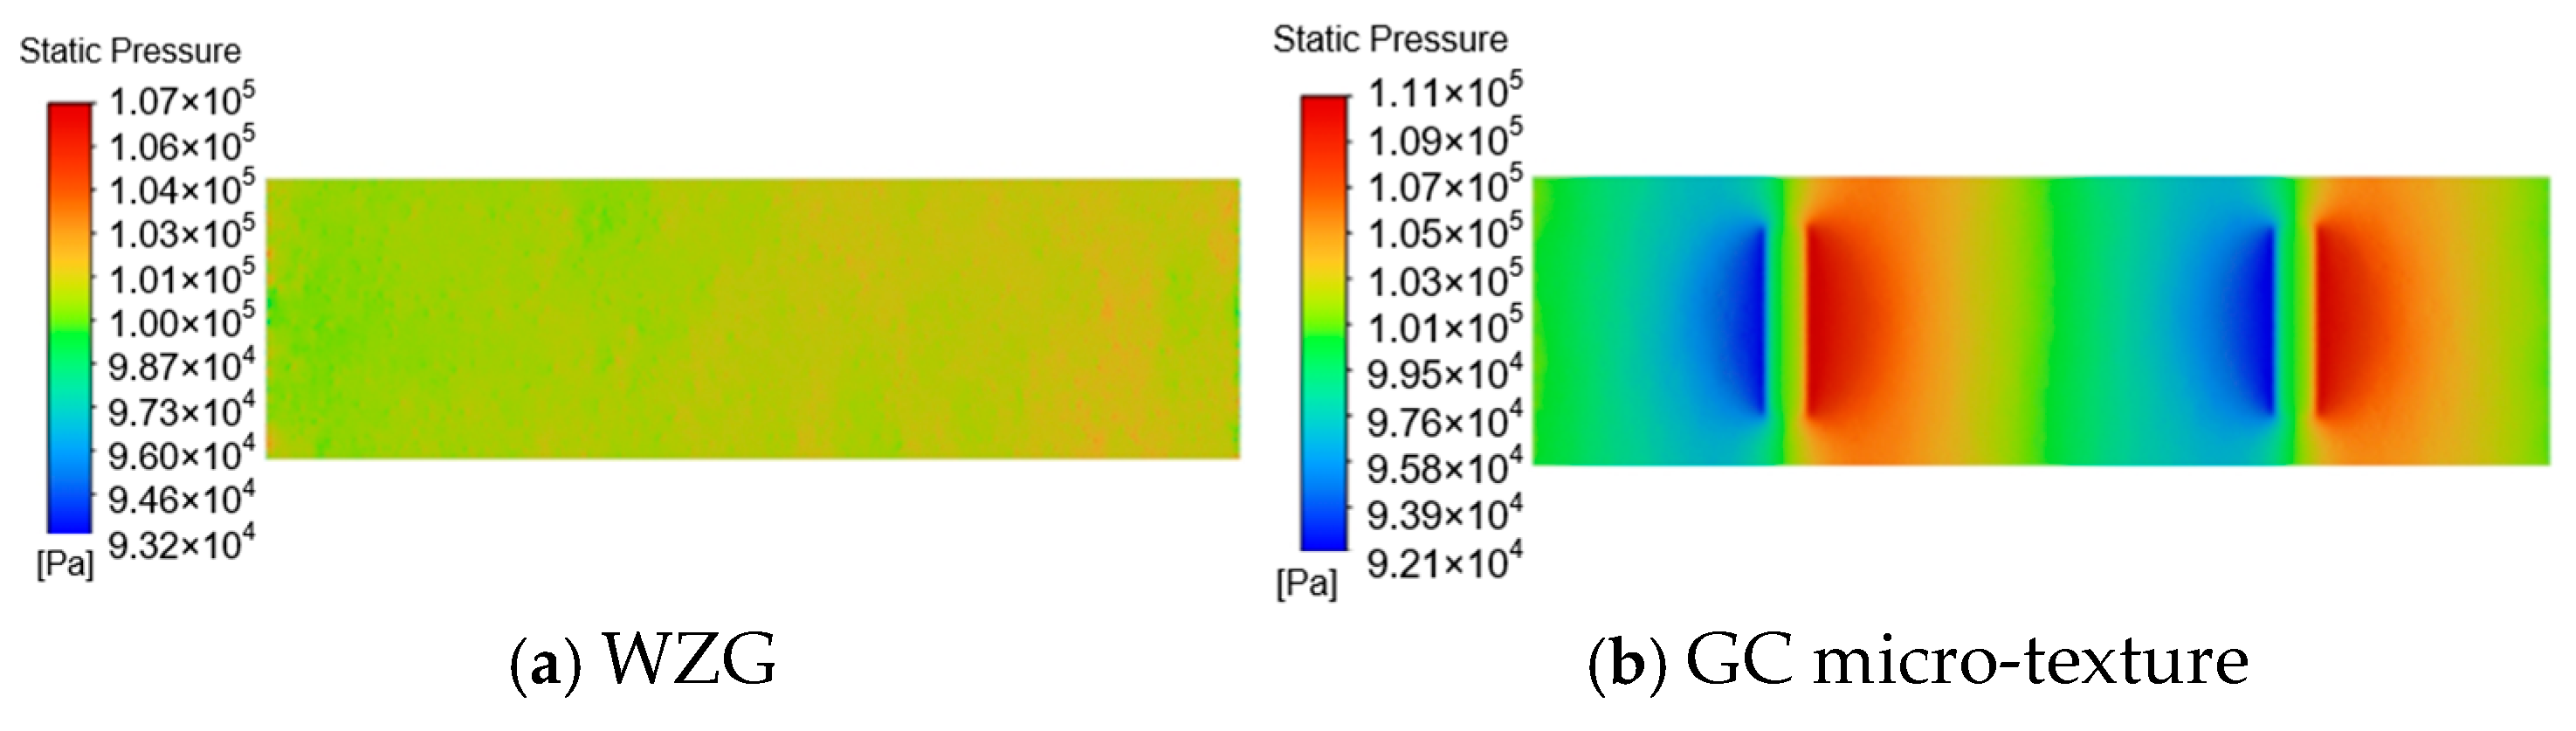
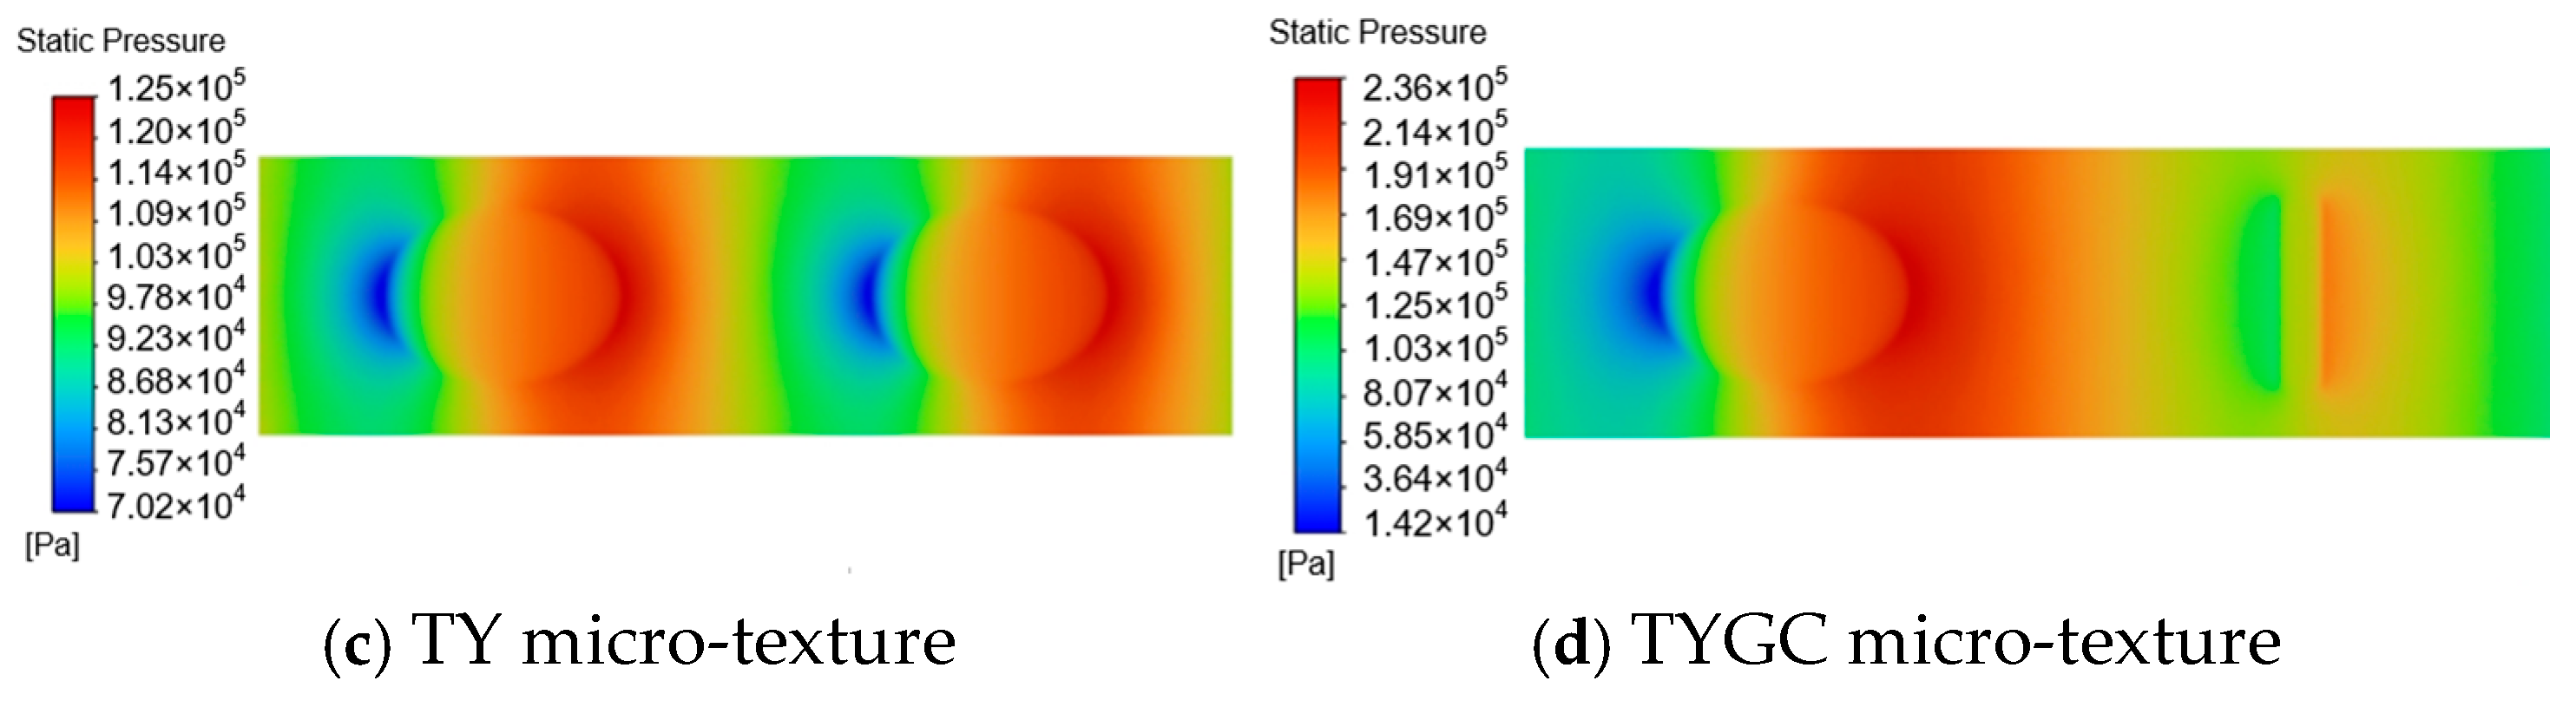
After the post-processing of the simulated bearing pressure cloud map using ANSYS Workbench (2024 R1, ANSYS company, Pittsburgh, PA, USA), the distribution cloud map of the bearing pressure on the upper surface of the oil film was finally obtained, as shown in Figure 6. In Figure 6, it can be seen that the flow direction of the four different morphologies of lubricating oil films is oriented from left to right. From Figure 6a, it can be observed that the pressure distribution of the WZG lubricating oil film is relatively uniform. Due to the absence of micro-textures in the lubricating oil film, the pressure values in various regions of the film change relatively little, resulting in the poor bearing capacity of the lubricating oil film. From Figure 6b,c, it can be seen that by introducing micro-textures, the pressure distribution of the lubricating oil film changes. The inlet and outlet of the two single micro-textures form low-pressure and high-pressure zones, respectively, but the pressure difference is small and the bearing capacity is average. This is because when the lubricating oil flows through the textured area, it is affected by the texture, causing a change in the flow velocity of the lubricating oil. According to the theory of continuous flow, when lubricating oil flows near the entrance of the texture, due to the increase in flow space, the flow velocity of the lubricating oil will gradually decrease, resulting in a gradual decrease in pressure value. When the lubricating oil enters the texture area, the speed reaches its minimum value and the pressure value is at its lowest. As the lubricating oil continues to flow towards the texture outlet, due to the reduction in flow space, the flow velocity of the lubricating oil will gradually increase and the pressure value will also gradually increase, forming a high-pressure zone due to pressure accumulation. When the lubricating oil flows out of the textured area, the speed reaches its highest value and the pressure value is also at its highest. Comparing the two single-texture pressure values, the maximum pressure value of the TY texture is the highest among the two single-texture shapes. Upon investigation, the TY texture is more conducive to meeting the wedge-shaped oil film-forming conditions of fluid dynamic pressure lubrication compared to the GC texture. It has a greater pressure bearing capacity and is more likely to produce local lubricating oil films, thereby improving lubrication conditions and making the oil film less prone to rupture. On the contrary, the maximum pressure value of the GC texture is the smallest among the two single-texture shapes. This is because the GC texture has more divergent oil outlets compared to the TY texture; thus, the lubricating oil will diverge along the direction of the groove, resulting in a slightly lower flow velocity than the TY texture, leading to the maximum pressure value of the GC texture being smaller than that of the TY texture. From the numerical values in the pressure cloud map of the combined texture shown in Figure 6d, it can be seen that compared to the two single textures, the maximum and minimum values of the oil film pressure of the combined texture are significantly different, indicating a stronger lubricating oil film bearing capacity. This is because compared to the single GC texture, the presence of the TY texture in the composite texture is more conducive to meeting the wedge-shaped oil film-forming conditions of fluid dynamic pressure lubrication. Compared to the single TY texture, the GC texture in the composite texture exhibits superhydrophobic properties. Through the coupling mechanism of the composite texture, the maximum pressure value of the lubricating oil flowing out of the TY texture outlet in the composite texture is greater than that of the single TY texture, while the minimum pressure value flowing into the GC texture inlet is higher than that of the single-groove GC texture, thereby making the dynamic pressure lubrication effect of the composite texture lubricating oil stronger.
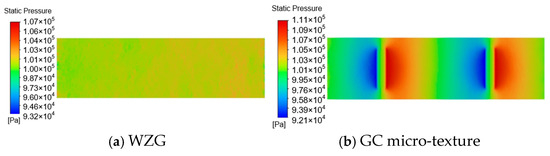

Figure 6.
Cloud map of pressure distribution on the surface of oil films with different micro-textures.
Based on the above analysis of the oil film pressure, according to Formula (4), the average surface bearing pressure of the oil film WZG, with a single GC texture, with a single TY texture, and with a combination texture of TYGC is 1.01123 × 10⁵ Pa, 1.013526 × 10⁵ Pa, 1.04685 × 10⁵ Pa, and 1.454865 × 10⁵ Pa, respectively; This means that compared to the WZG oil film, the bearing pressure of the oil film is increased by 0.22%, 3.52%, and 43.87%, respectively.
4. Optimization of the Design of Combined Biomimetic Micro-Texture Parameters
4.1. Optimization of the Size Parameters for Composite Microstructures
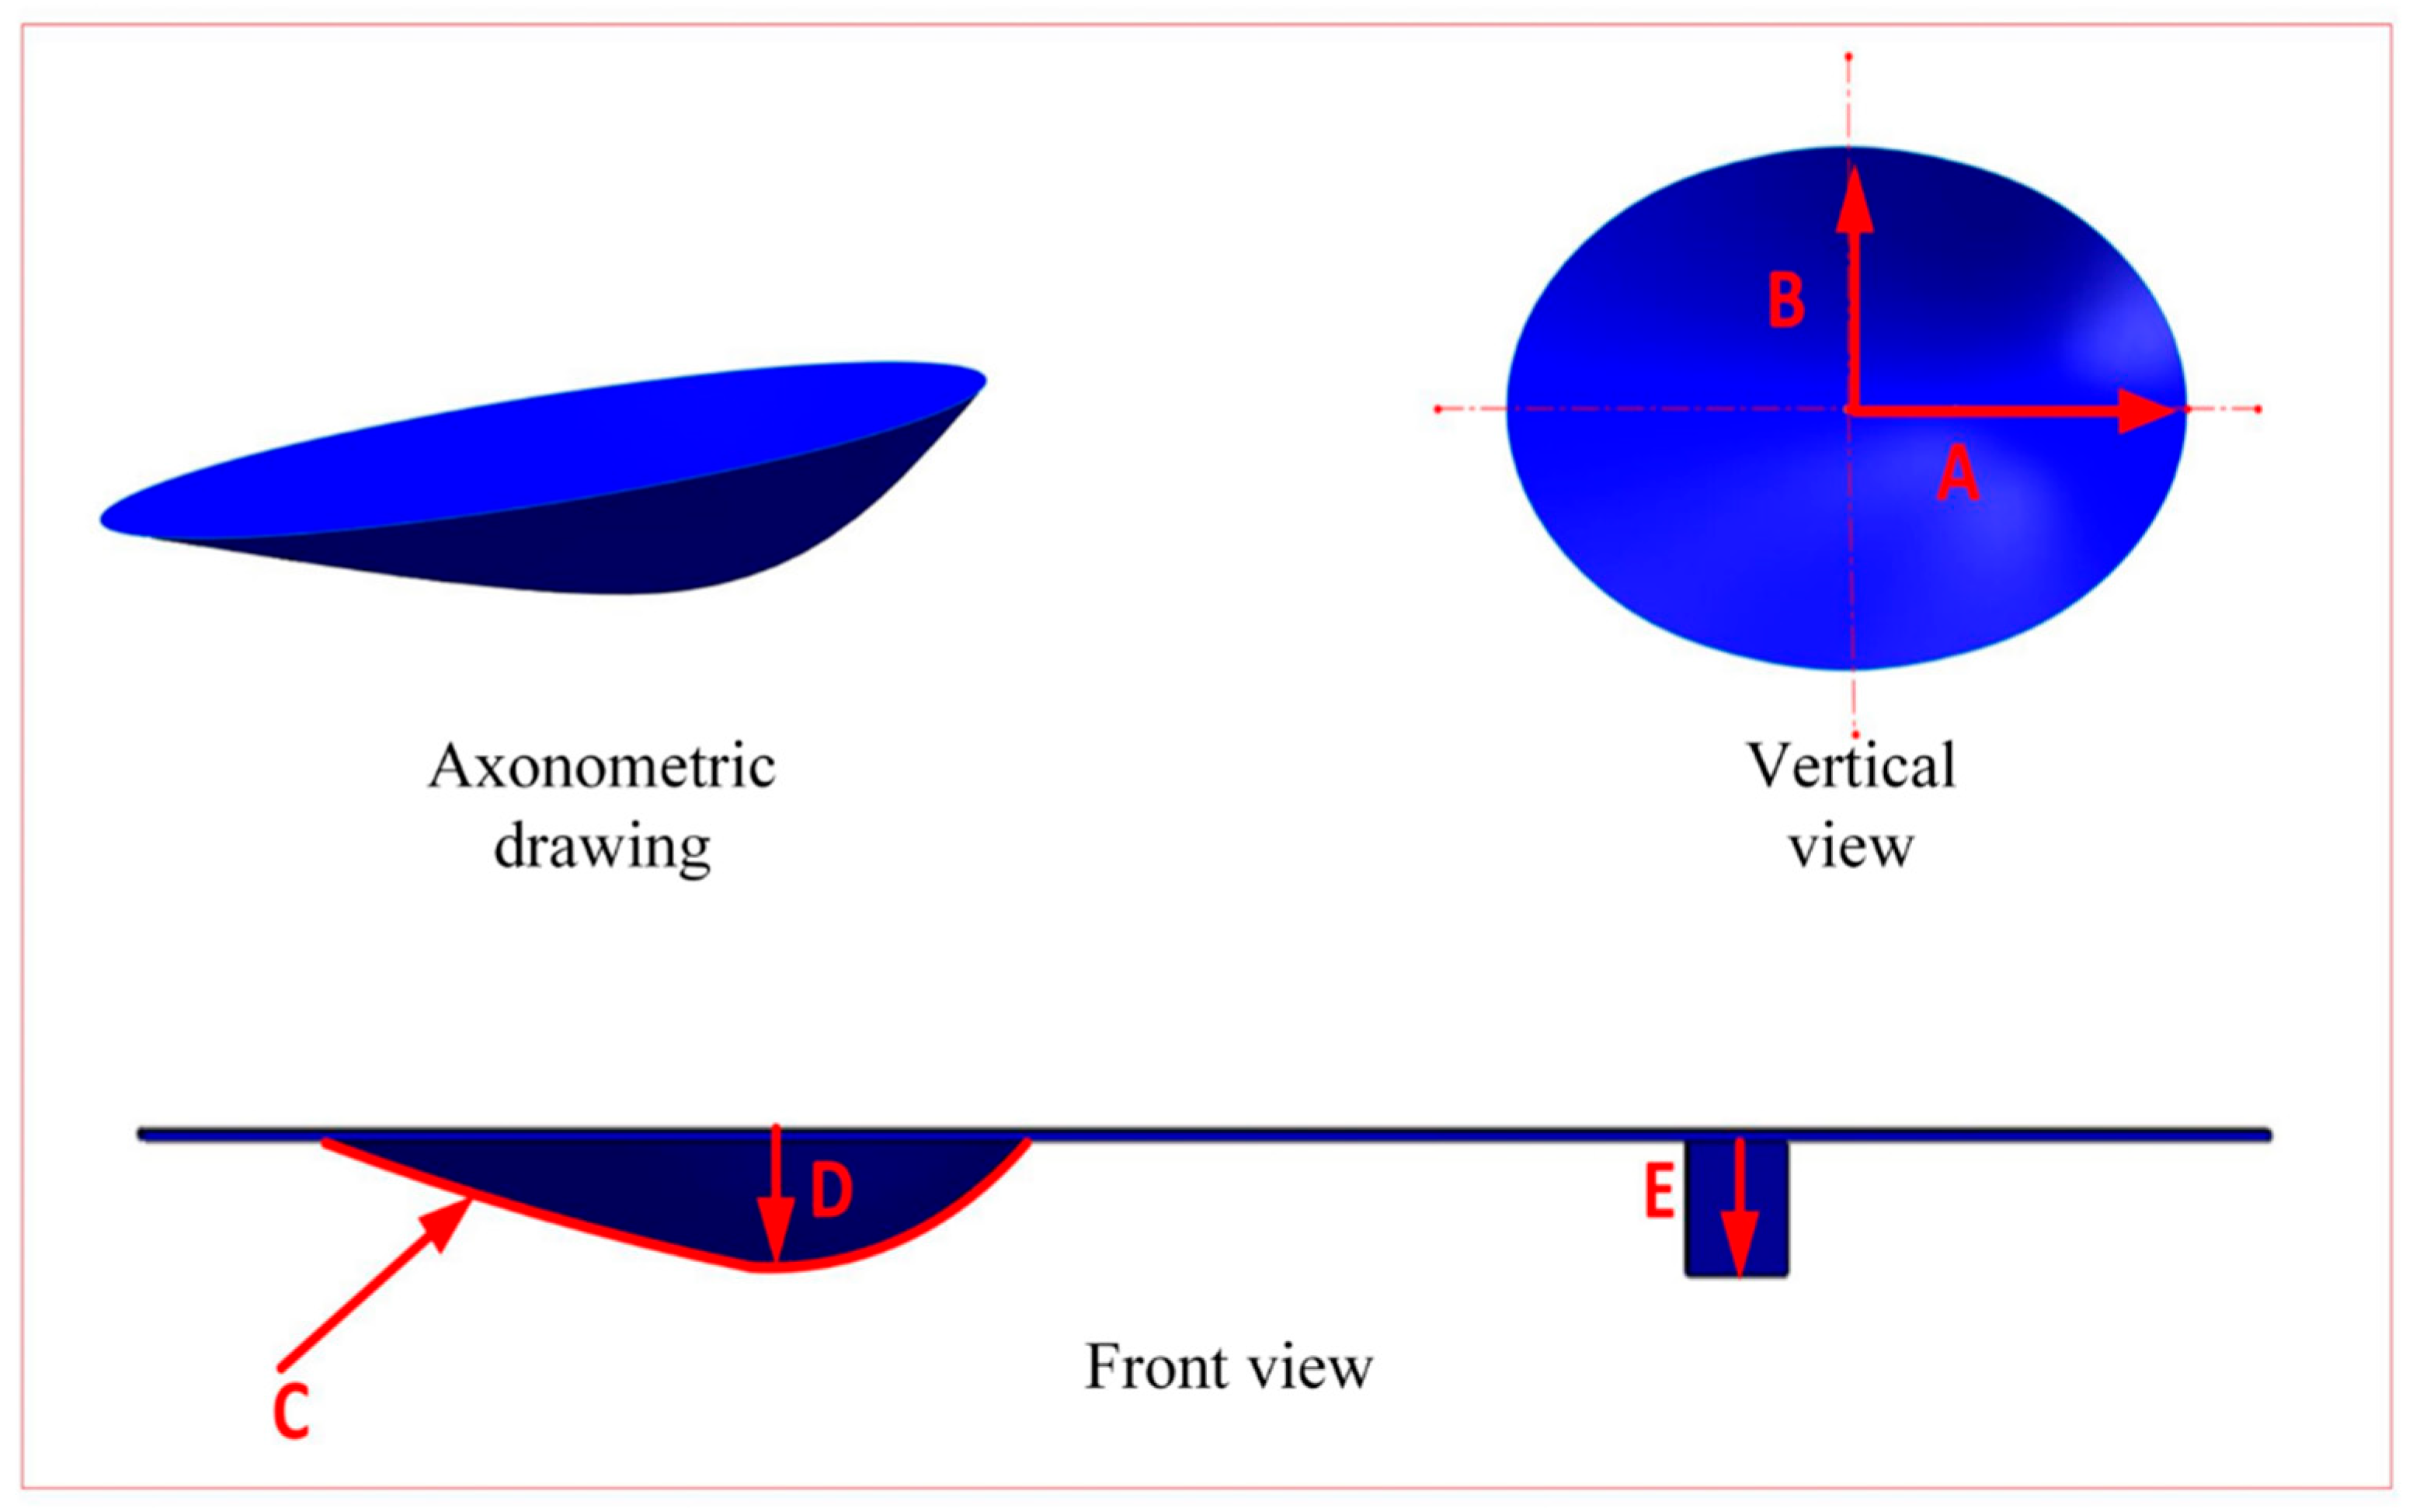
Through simulation analysis and a comparison of four different textures, the TYGC combined micro-texture was determined to be the parameter optimization object; a three-dimensional model was established, as shown in Figure 7. An elliptical opening with a long half-axis length of A and a short half-axis length of B was machined on the surface of a guide rail with a unit size of 3000 μm × 800 μm. The type coefficient Rho of the TY texture parabolic line (i.e., the ratio of the depth of the pit to the perpendicular distance between the intersection point of the parabolic inlet and outlet tangents and the opening surface) was C, while the parabolic depth of the TY texture was D. The groove depth is E, the groove width is 140 μm, and the groove length is consistent with the length of the short axis of the ellipse.
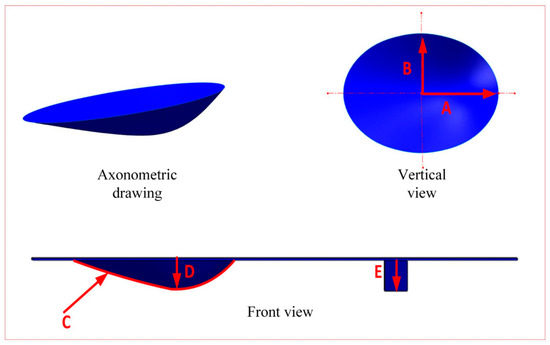
Figure 7.
Schematic diagram of parameter optimization.
4.2. Response Surface Methodology Scheme Design
By using response surface theory and Design Expert software (version 13.0, Stat-Ease Inc., Minneapolis, MN, USA), the influence of micro-texture size parameters on guide rail performance was studied. The main influencing factors were selected for response surface analysis, including elliptical long half-axis A, elliptical short half-axis B, Rho C, elliptical depth D, and groove depth E. To explore the comprehensive effects of their interaction on bearing pressure and friction coefficient, 50 sets of three-dimensional structural models with five factors and five levels of micro-texture shape parameters were constructed, as shown in Table 1. The bearing pressure and friction coefficient were simulated and analyzed.

Table 1.
Response surface design and results.
Fitting regression was performed on the experimental results obtained under 50 conditions, and multivariate fitting was performed on the response surface design experimental results. The regression equations for the influence of various distribution parameters on the bearing pressure Y1 and friction coefficient Y2 were obtained, which are as follows:
Y1 = 215,172 − 201.43 * A − 411.78 * B + 8834.12 * C − 315.29 * D + 41.02 * E + 0.40 * AB + 92.54 * AC − 0.56 * AD + 0.26 * AE − 184.72 * BC − 0.11 * BD − 0.42 * BE − 5.30 * CD − 158.96 * CE + 0.17 * DE + 0.18 * A2 + 0.77 * B2 + 32,015.9 * C2 + 1.85 * D2 + 0.20 * E2
Y2 = 0.043 + 1.60 × 10⁻⁵ * A + 2.23 × 10⁻⁵ * B − 1.67 × 10⁻⁴ * C + 3.84 × 10⁻⁵ * D − 1.57 × 10⁻⁵ * E − 1.16 × 10⁻⁷ * AB − 2.69 × 10⁻⁵ * AC + 8.54 × 10⁻⁸ * AD − 5.21 × 10⁻⁵ * AE + 2.03 × 10⁻⁵ * BC + 1.51 × 10⁻⁷ * BD − 5.21 × 10⁻⁹ * BE + 2.81 × 10⁻⁵ * CD + 1.35 × 10⁻⁵ * CE + 1.28 × 10⁻⁷ * DE − 7.25 × 10⁻⁹ * A2 − 4.53 × 10⁻⁸ * B2 − 1.81 × 10⁻³ * C2 − 4.51 × 10⁻⁷ * D2 + 7.71 × 10⁻⁸ * E2
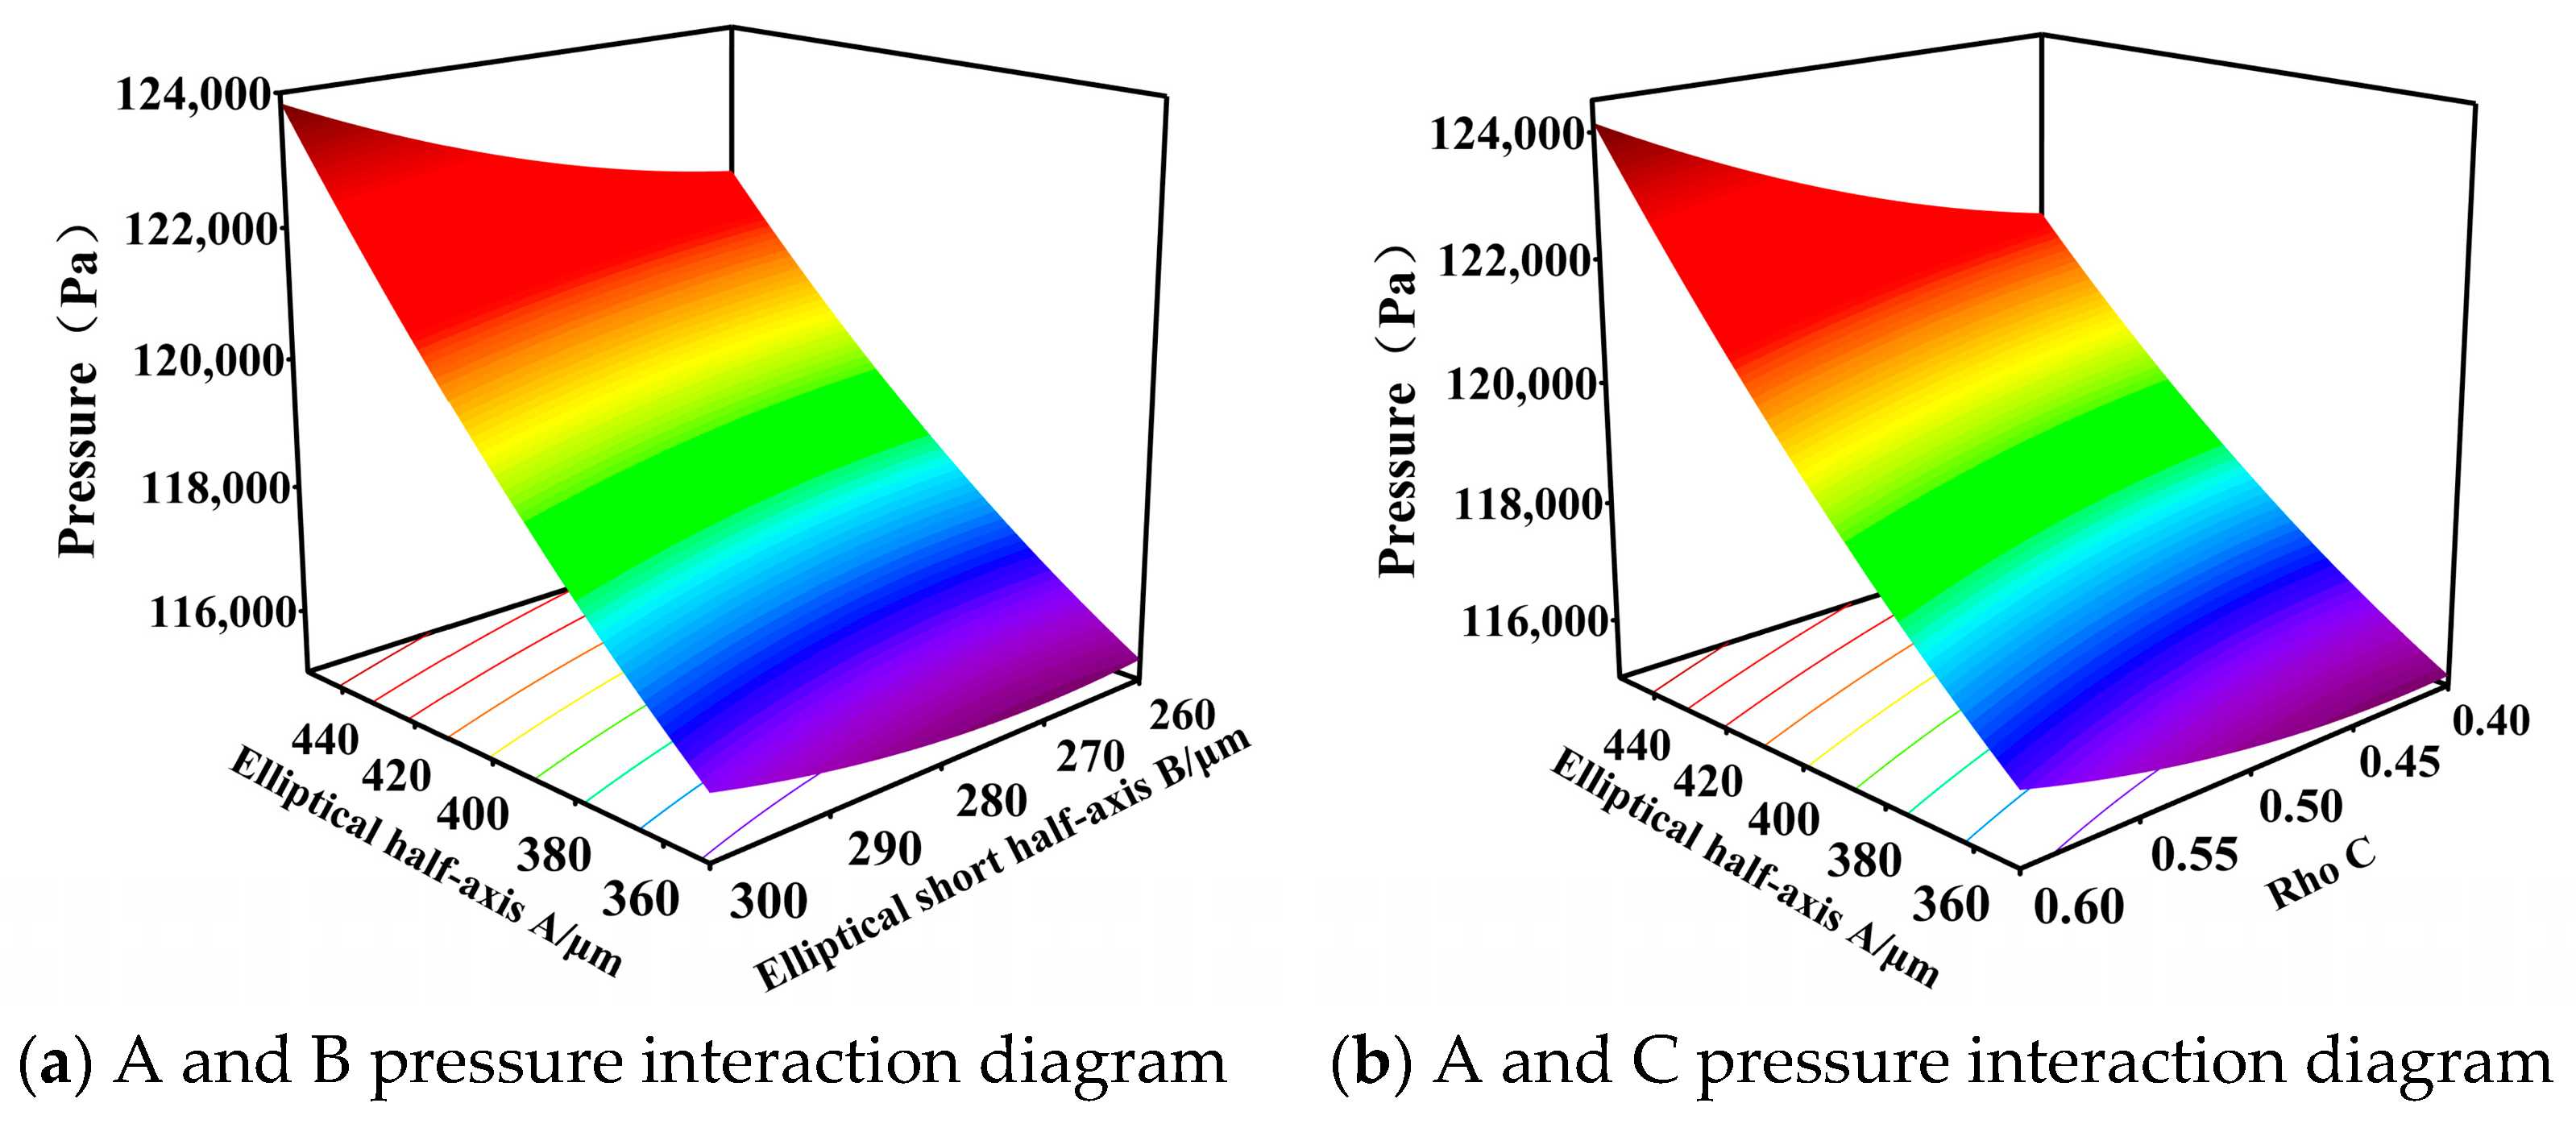
A curve graph of the influence of the interaction between two factors of micro-texture size parameters on the bearing pressure and friction coefficient was generated. Figure 8 depicts a response surface diagram of the interaction effects of various factors on the bearing pressure, visually demonstrating the effects of each interaction on the bearing pressure of the experimental results. In the interaction between the major and minor axes of the ellipse in Figure 8a, the carrying pressure shows a gradually increasing trend. The response surface plot has almost no curvature, and the projected contour plot determines that the major axis of the ellipse plays a major role in this interaction. The interaction between the major axis of the ellipse and Rho in Figure 8b, as well as the depth of the groove in Figure 8d, shows the same trend. In the interaction between the major axis of the ellipse and the depth of the ellipse in Figure 8c, the bearing pressure gradually increases with the increase in the major axis of the ellipse and the decrease in the depth of the ellipse. Figure 8e shows the interaction between the short-axis of the ellipse and Rho, and the response surface graph exhibits a relatively gentle inclination and sparse contour lines. However, the influence of Rho on groove depth, elliptical short-axis and depth, elliptical short-axis and groove depth, Rho and elliptical depth, and elliptical depth and groove depth is not significant; therefore, further analysis and discussion are not conducted.
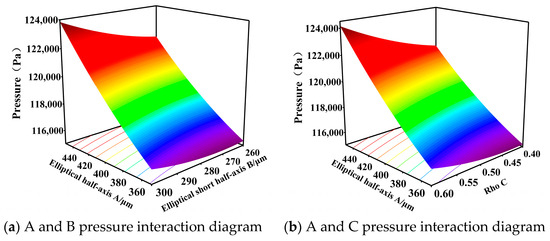
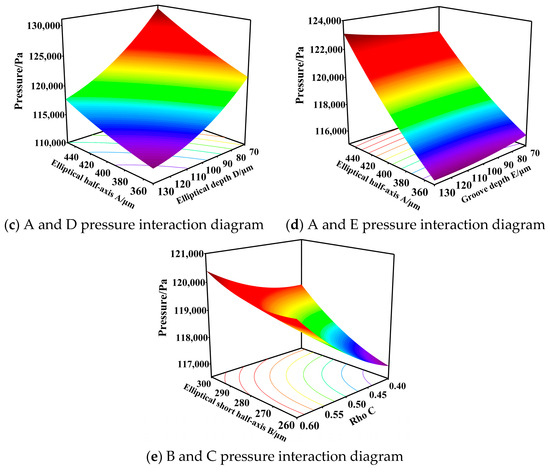
Figure 8.
Response surface diagram of bearing pressure.
Figure 9 is a response surface graph of the interaction effects of various factors on the friction coefficient, visually demonstrating the impact of each interaction on the friction coefficient of the experimental results. The response surface plots of the major axis and minor axis of the ellipse in Figure 9a, as well as the major axis and groove depth in Figure 9d, are similar, indicating that these two factors have similar effects on the friction coefficient. According to the planar projection of the response surface graph, i.e., the contour map, it can be seen that the contour density in the long-axis direction of the ellipse is much higher than that in the short-axis direction and groove depth, indicating that the influence of the long axis of the ellipse is much higher than the other two factors in these two interactions, thus playing a major role. Figure 9b shows the interaction between the major axis of the ellipse and Rho, while Figure 9e shows the interaction between the minor axis of the ellipse and Rho. As the minor axis of the ellipse increases, the friction coefficient gradually decreases, while the effect of Rho on the friction coefficient is not significant. In the interaction between the major axis of the ellipse and the depth of the ellipse in Figure 9c, it can be observed that the contour map density in both directions is similar and the response surface of the major axis of the ellipse to the depth of the ellipse shows a significant curvature, indicating that the influence of the major axis of the ellipse and the depth of the ellipse is similar. However, the influence of Rho on groove depth, elliptical short-axis and elliptical depth, elliptical short-axis and groove depth, Rho and elliptical depth, and elliptical depth and groove depth is not significant; therefore, further analysis and discussion are not conducted.
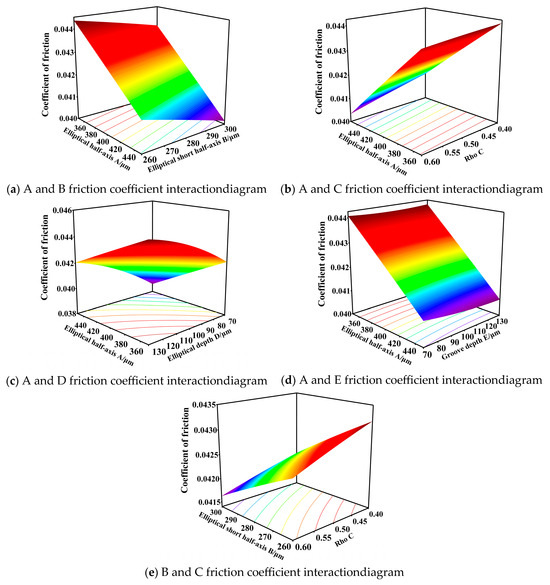
Figure 9.
Response surface diagram of friction coefficient.
Based on the good fitting results of the response surface model, the optimal size parameters were predicted. The prediction results show that an optimal bearing pressure of 1.55278 × 10⁵ Pa and a friction coefficient of 0.030 could be obtained when the elliptical long axis was 500 μm, the elliptical short axis was 320 μm, Rho was 0.7, the elliptical depth was 40.000 μm, and the groove depth was 160 μm. In order to verify this prediction result, simulation verification was conducted on the predicted result, and as shown in Figure 10, the optimal solution has a bearing pressure of 1.60373 × 10⁵ Pa and a friction coefficient of 0.032. The error between the pressure and the predicted value is 3.28%, and the error between the friction coefficient and the predicted value is 6.66%. The predicted value error is low and close to the predicted value, proving that the model is reasonable, accurate, and effective.
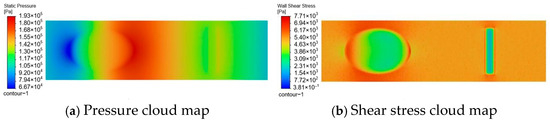
Figure 10.
Simulation verification of bearing pressure and shear stress predicted according to optimal size parameters.
5. Optimization of the Distribution Parameters and Performance Influence of Composite Micro-Textures
5.1. Distributed Parameter Optimization Design
The load-bearing performance of the lubricating oil film between friction pairs is not only related to dimensional parameters, but also to its distribution parameters on the surface of the friction pair. Therefore, based on the optimal size parameters mentioned earlier, this study explores the influence of distributed parameters on the bearing performance of lubricating oil films between friction pairs, as well as optimizing the design of distributed parameters.
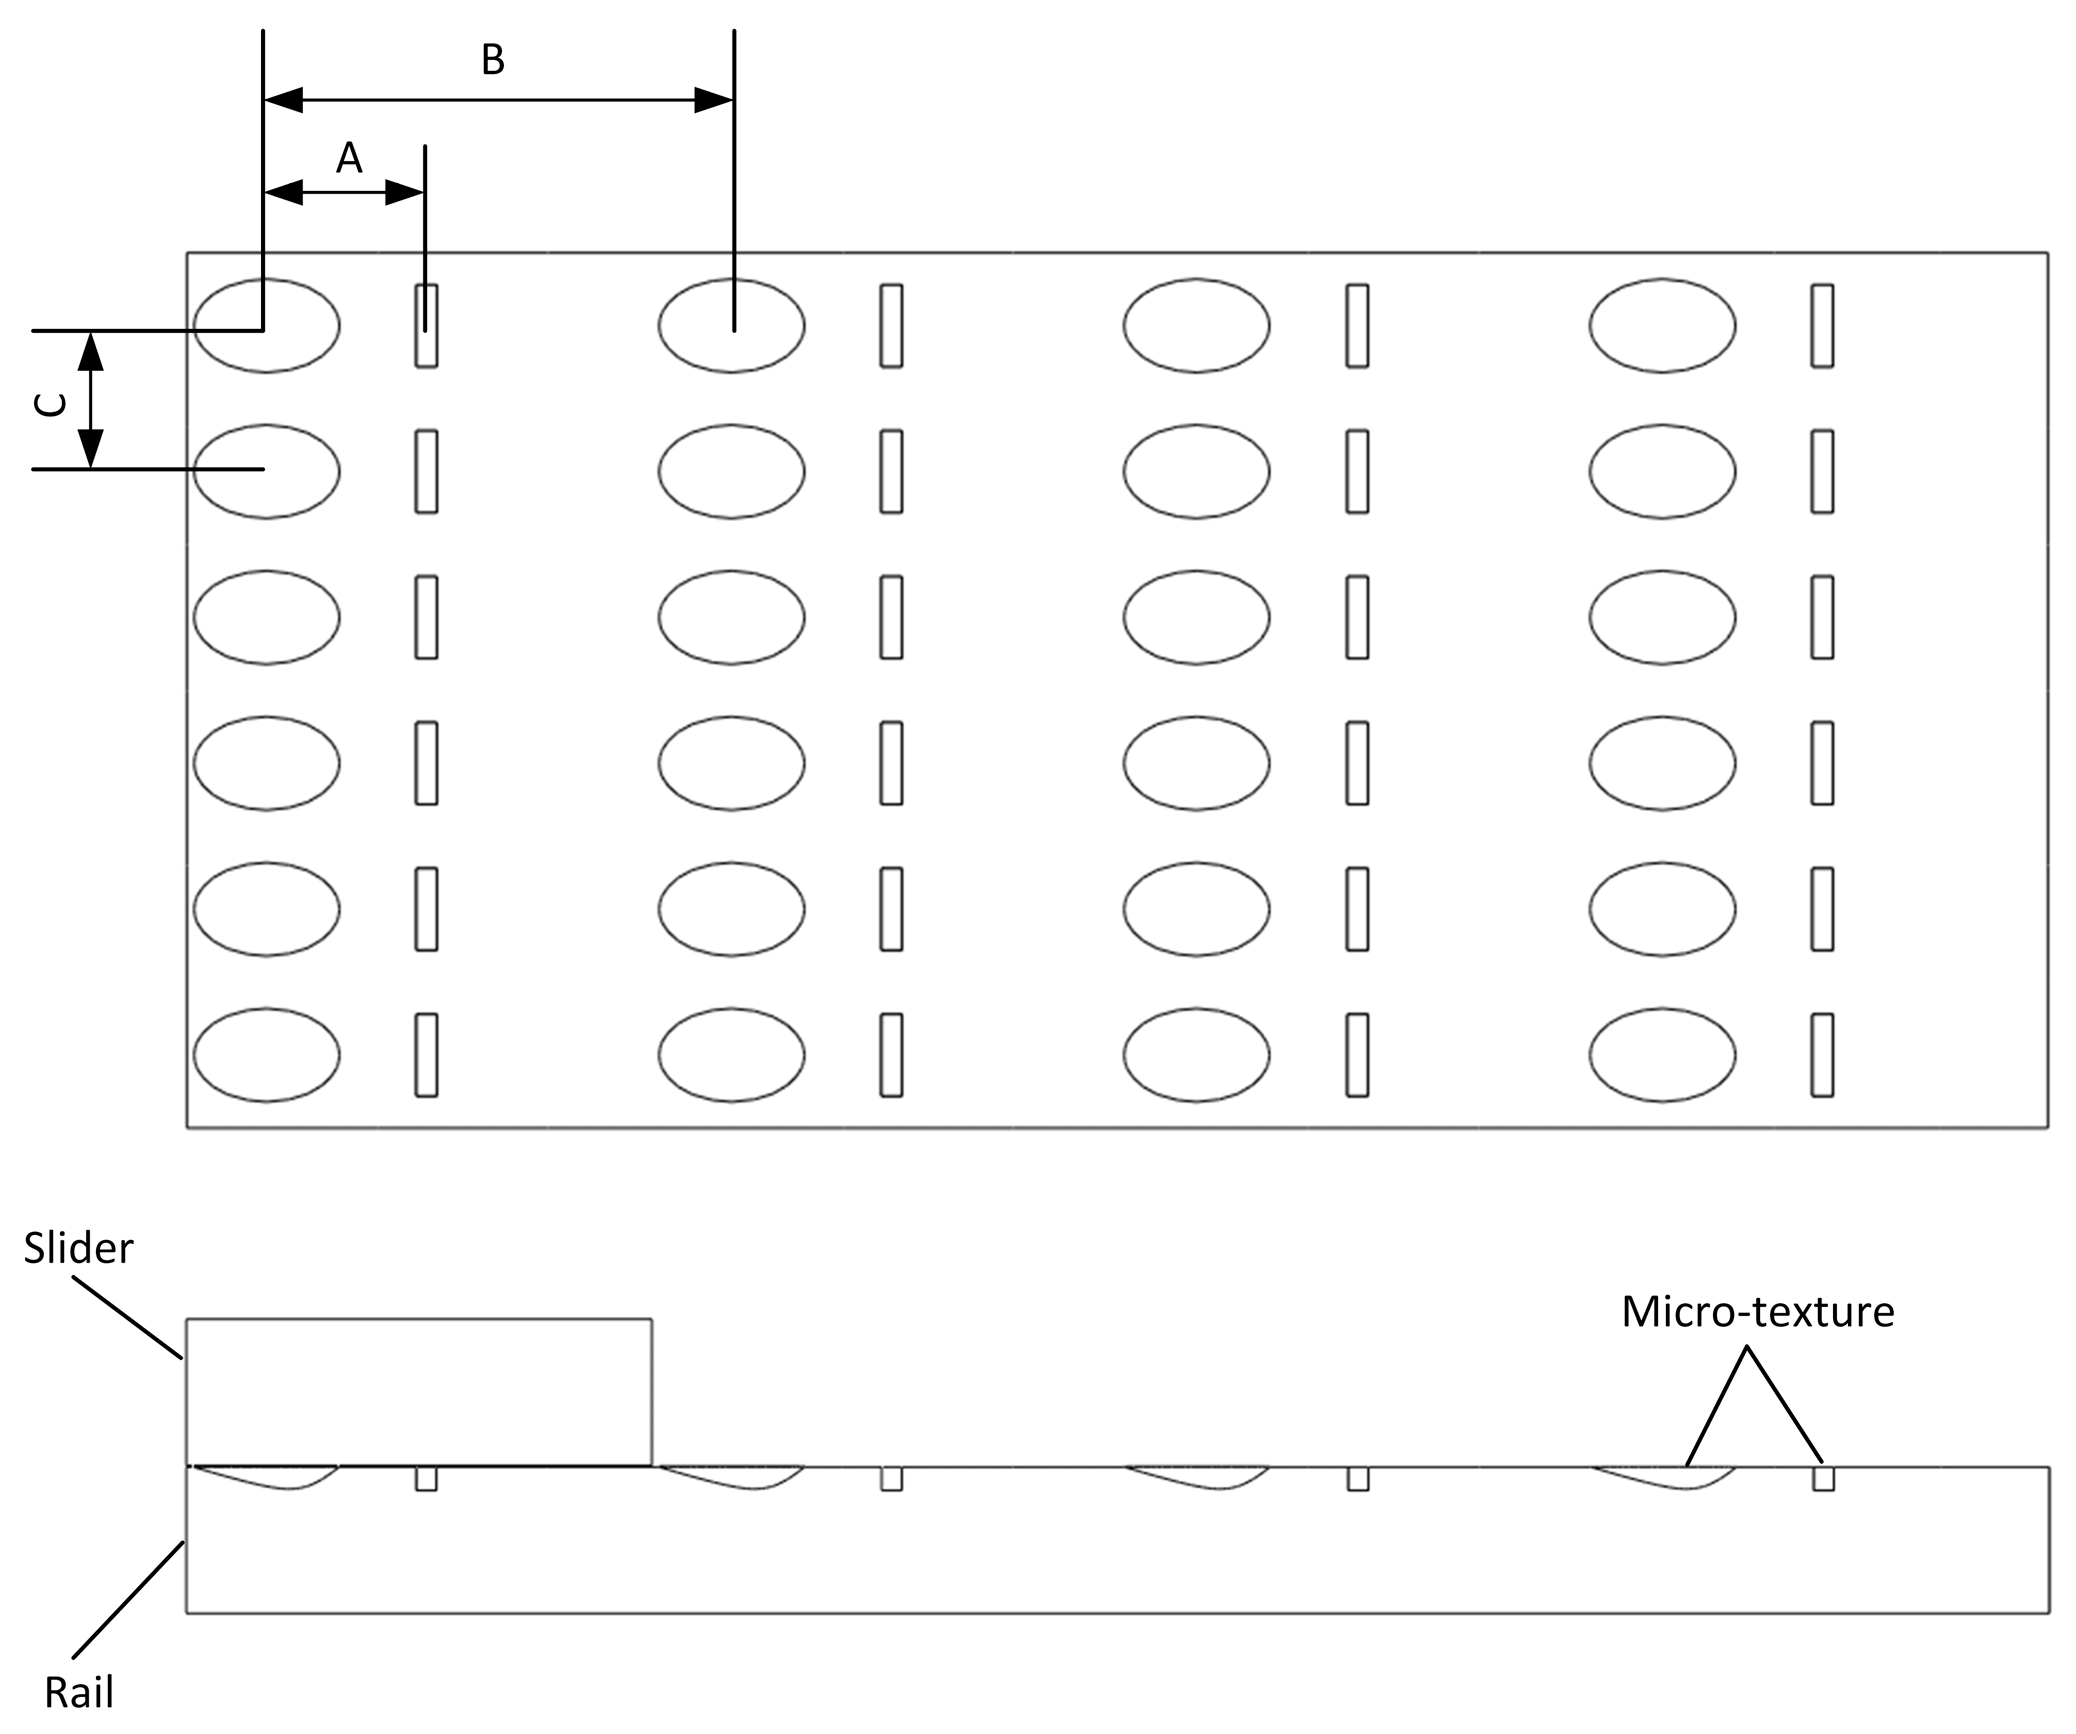
In order to facilitate a comparison of the influence of distribution parameters on the oil film bearing performance, a 4 × 6 group TYGC optimal distribution parameter texture model was established. A simple micro-texture friction pair model is shown in Figure 11, where transverse A, transverse B, and longitudinal C are used as the response surface factors, and three horizontal values are selected for each factor. At the same time, pressure, friction coefficient, and temperature are used as response values to establish a Box–Behnken Design response surface model with three factors and three levels. The response surface design table with pressure, friction coefficient, and temperature as response indicators and the experimental results of each group are shown in Table 2.

Figure 11.
Simplified model of distributed parameters.
Table 2.
Response surface design and results.
Fitting regression was performed on the experimental results obtained under 17 conditions, and multivariate fitting was performed on the experimental results of the pressure response surface design. The regression equations for the influence of various distribution parameters on the bearing pressure Y3, friction coefficient Y4, and temperature Y5 were obtained as follows:
Y3 = 182,162 − 107.067 * A + 49.92 * B − 43.04 * C + 0.01 * AB + 0.01 * AC − 0.005 * BC + 0.011 * A2 − 0.008 * B2 + 0.008 * C2
Y4 = 0.024 + 2.598 × 10⁻⁵ * A − 1.238 × 10⁻⁵ * B + 1.208 × 10⁻⁵ * C − 3.75 × 10⁻⁹ * AB − 7.5 × 10⁻¹⁰ * AC + 5 × 10⁻¹⁰ * BC − 1.938 × 10⁻⁹ * A2 + 2.438 × 10⁻⁹ * B2 − 2.11 × 10⁻⁹ * C2
Y5 = 25.254 + 0.007 * A + 0.004 * B + 0.003 * C − 4.375 × 10⁻⁷ * AB − 9.75 × 10⁻⁷ * AC + 3 × 10⁻⁷ * BC − 1.05 × 10⁻⁷ * A2 − 7.375 × 10⁻⁷ * B2 − 5.98 × 10⁻⁷ * C2
An influence curve of the interaction between the two factors of microstructure distribution parameters on the bearing pressure, friction coefficient, and temperature was further generated, as shown in Figure 12.
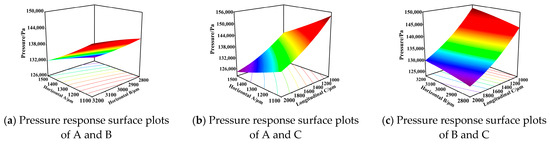
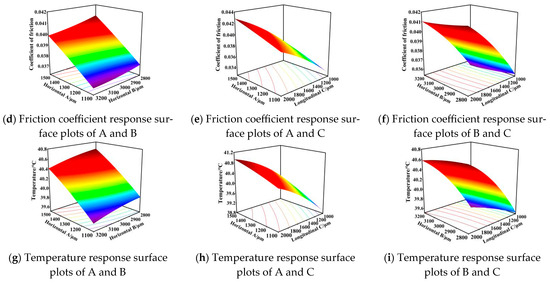
Figure 12.
Response surface plots of distribution parameters on oil film performance.
Based on the good fitting results of the response surface model, the optimal distribution parameters were predicted. The prediction results show that a maximum pressure of 1.55968 × 10⁵ Pa, a minimum friction coefficient of 0.0331, and a minimum temperature of 38.748 °C could be obtained when transverse A was 1100 μm, transverse B was 3200 μm, and longitudinal C was 1000 μm. In order to verify this prediction result, simulation verification was conducted on the predicted result and as shown in Figure 13, the optimal solution was obtained with a bearing pressure of 1.55993 × 10⁵ Pa, a friction coefficient of 0.033, and a temperature of 38.71 °C. The error between the pressure and the predicted value was 0.015%; the error between the friction coefficient and the predicted value was 0.3%; and the error between the temperature and the predicted value was 0.098%. Through comparison, it was found that the error between the simulated values and the predicted values is at a relatively low level, and the two are extremely close. This fully proves that the constructed response surface model exhibits rationality, accuracy, and effectiveness, as well as having the ability to provide solid and reliable theoretical support for this experimental research and subsequent related practices.

Figure 13.
Simulation verification of bearing pressure, shear stress, and temperature predicted according to optimal distribution parameters.
5.2. Genetic Algorithm Design and Validation
In order to verify the correctness and rationality of the predicted values of the response surface method, the genetic algorithm NSGA-II was used to further verify the optimal distribution parameters of the micro-texture on the guide rail surface. This genetic algorithm can be used to search for the optimal solution by simulating the natural evolution process, which has inherent hidden parallelism and better global optimization ability.
NSGA-II is a multi-objective optimization algorithm that is a type of genetic algorithm. By adjusting the relationship between various objective functions, the aim is to find a set of optimized solutions that enable each fitness function to approach its maximum or minimum value. Therefore, the solution to multi-objective optimization problems is not unique, but forms a set of optimal solutions, namely the Pareto optimal solution set [36]. In multi-objective optimization, the optimization of one variable usually leads to the deterioration of another variable. As the optimization objective is to increase the bearing pressure, while the friction coefficient and temperature are optimized to decrease, they demonstrate opposite trends. Combining response surface methodology, with the objective functions of higher bearing pressure, lower friction coefficient, and lower temperature, and three distribution parameters A, B, and C of microstructure as design variables in response surface design, an NSGA-II optimization mathematical model is established, as follows:
- X1(P)—micro-textured sliding slider guide rail pair bearing pressure;
- X2(P)—coefficient of friction;
- X3(P)—temperature;
- P1, P2, P3—micro-texture shape parameters A, B, and C.
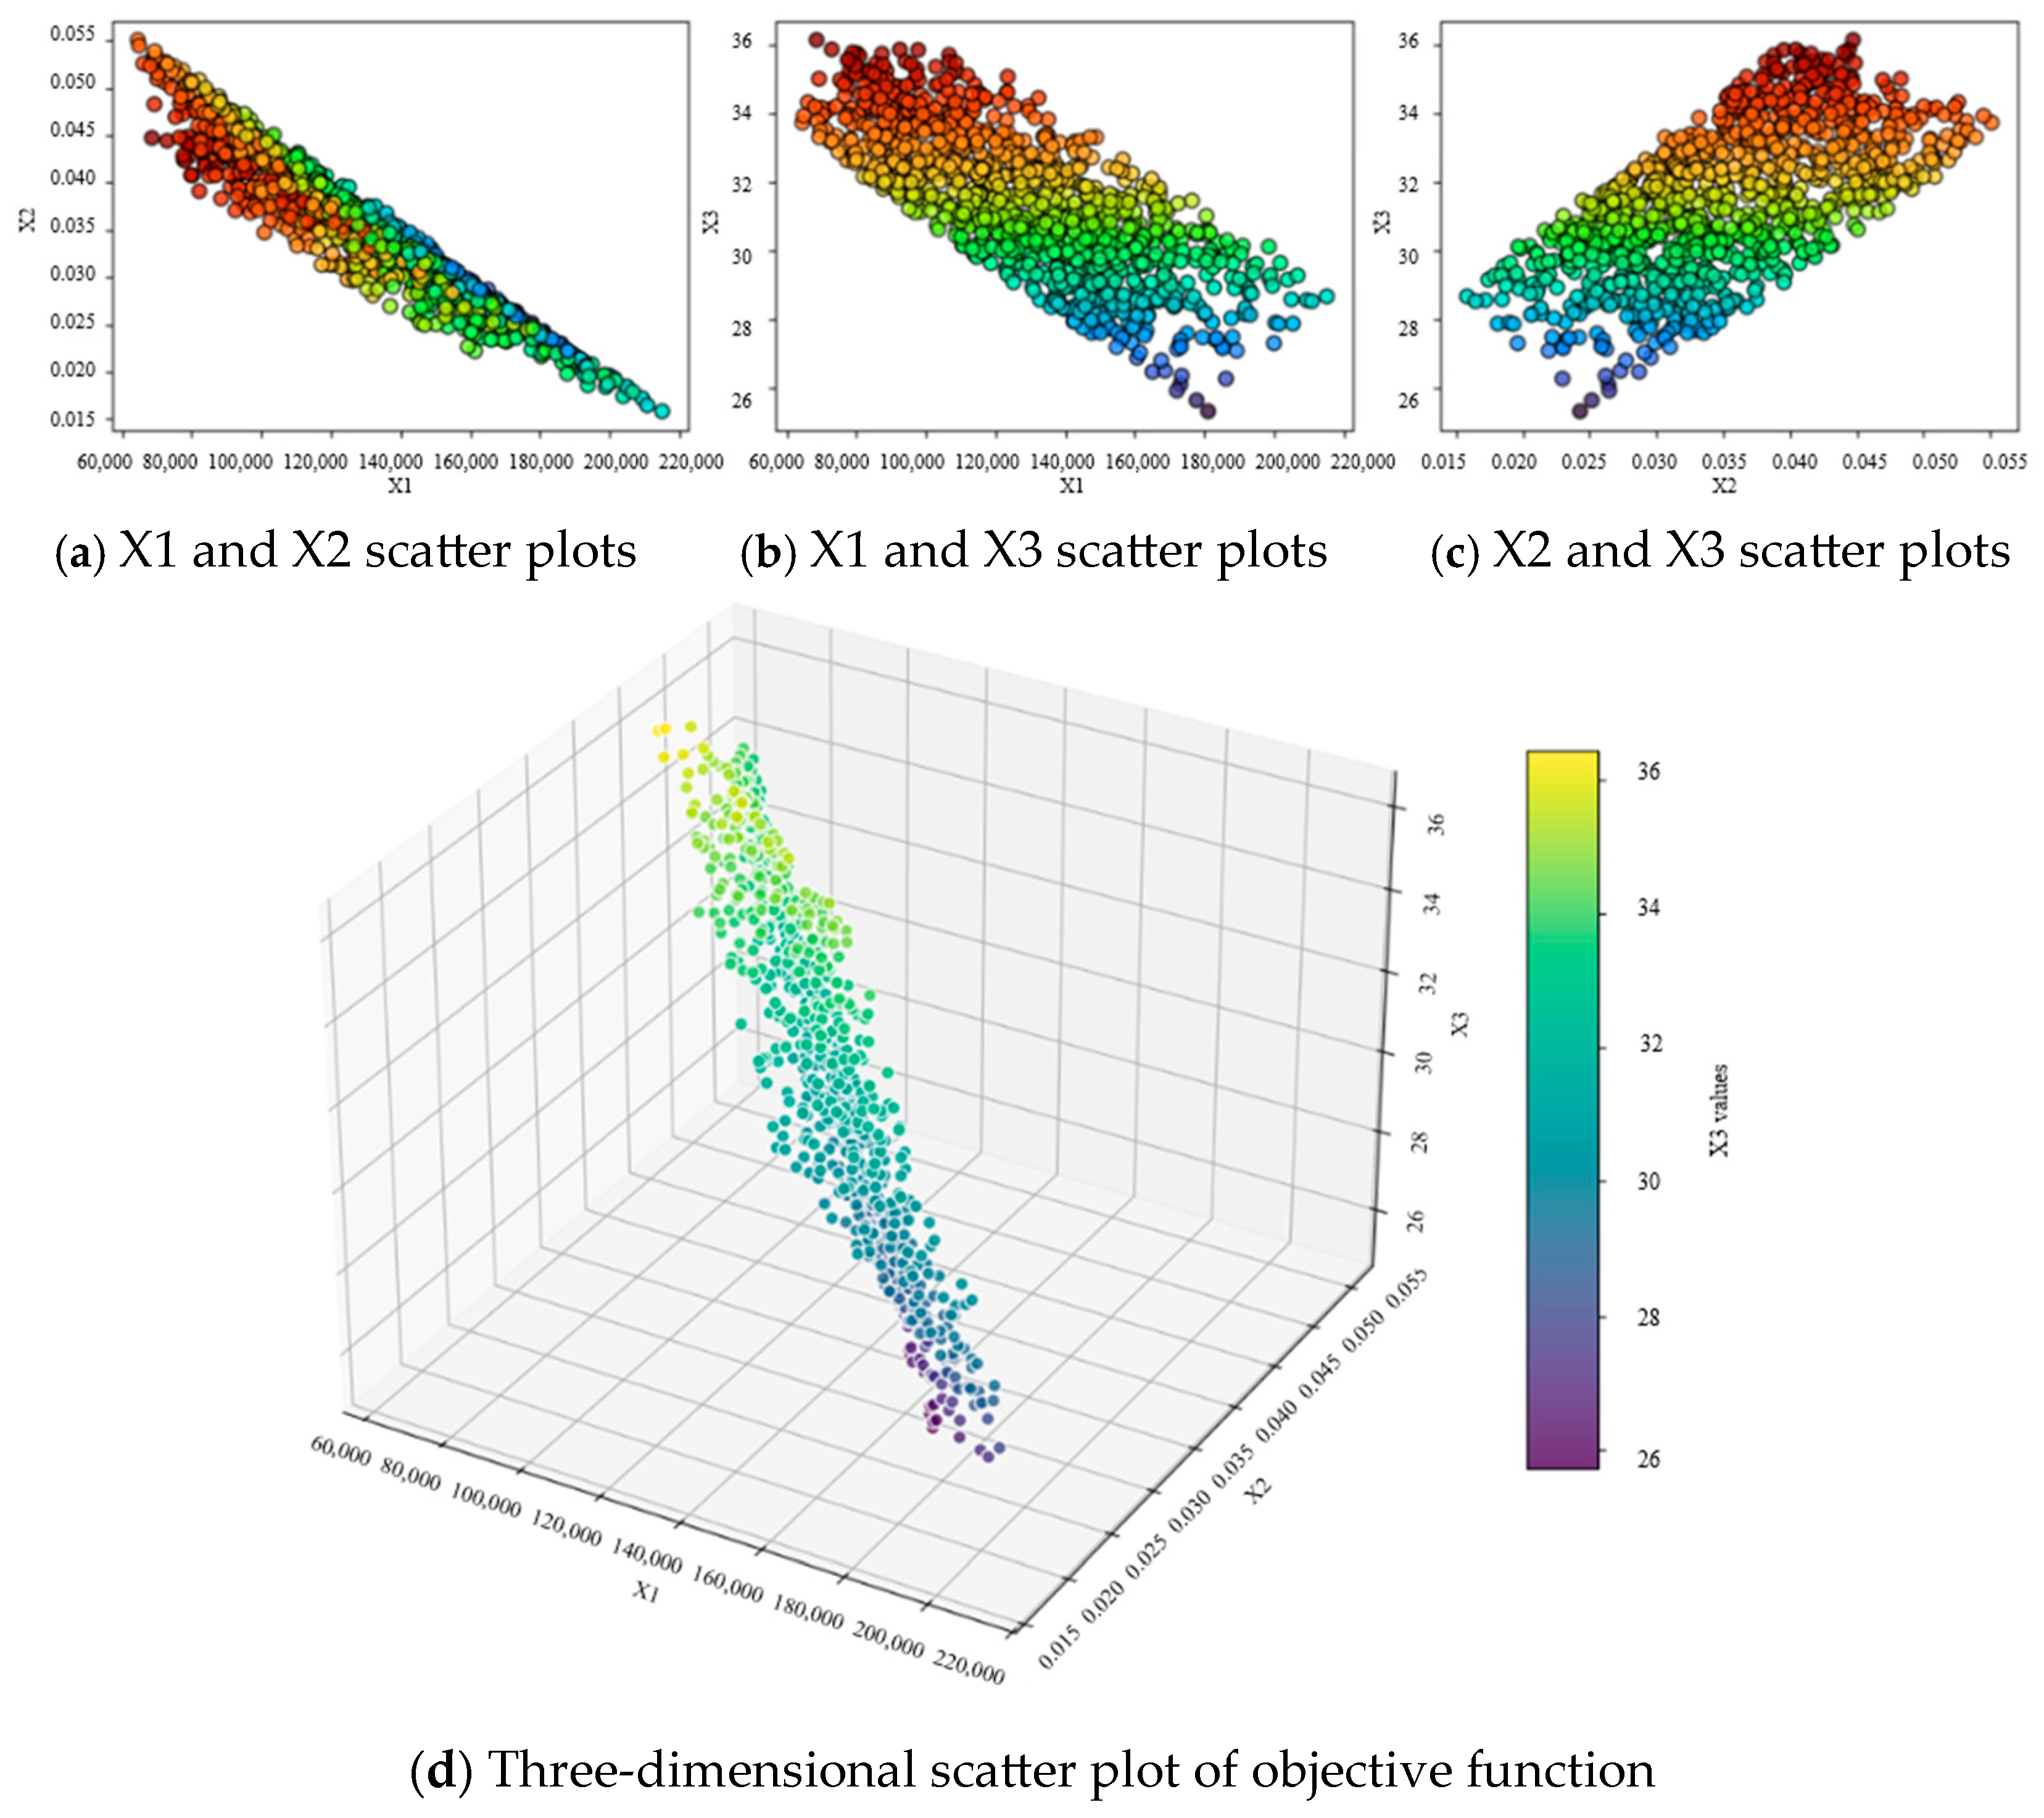
The initial population size of the algorithm was set to 100, the crossover rate was set to 0.8, the maximum number of iterations was set to 200, and the mutation rate was set to 0.2. After the iteration of the algorithm program, three relationship graphs between two objective functions and one three-dimensional scatter plot are generated, which visually demonstrate the results of multi-objective optimization. From Figure 14a, it can be seen that the data points are most dense in the middle region. As the pressure on X1 increases, the friction coefficient shows a decreasing trend. When the X1 value is large, the X2 value almost no longer decreases. From Figure 14b, it can be seen that the data points form a wide band-like area with a relatively scattered distribution, indicating that at the same X1 value, X3 may have multiple different values. When X1 carries an increasing pressure, the friction coefficient also shows a decreasing trend. From Figure 14c, it can be seen that the data points are relatively dense in the center of the region, showing a positive correlation trend from bottom left to top right. This trend is in line with the norm, where a higher coefficient of friction generates more heat, leading to an increase in temperature. When X2 reaches its lowest value, X3 also reaches its lowest value.

Figure 14.
Optimization result scatter plots.
Figure 14d shows a three-dimensional scatter plot that maps the values of three objective functions simultaneously to three-dimensional space, providing the most intuitive visualization of the Pareto front. All non-dominated solutions form a curved surface in three-dimensional space, with a relatively uniform distribution and relatively thin surface thickness, indicating that the algorithm effectively identifies non-dominated solutions.
Based on the data displayed in the image, the optimal design variables for this experiment are determined to be A = 11,000,000,198, B = 3199.9999914, and C = 1000.000009, while the corresponding objective function values are X1 = 150,682.299, X2 = 0.033127, and X3 = 38.824 for parameters A, B, and C.
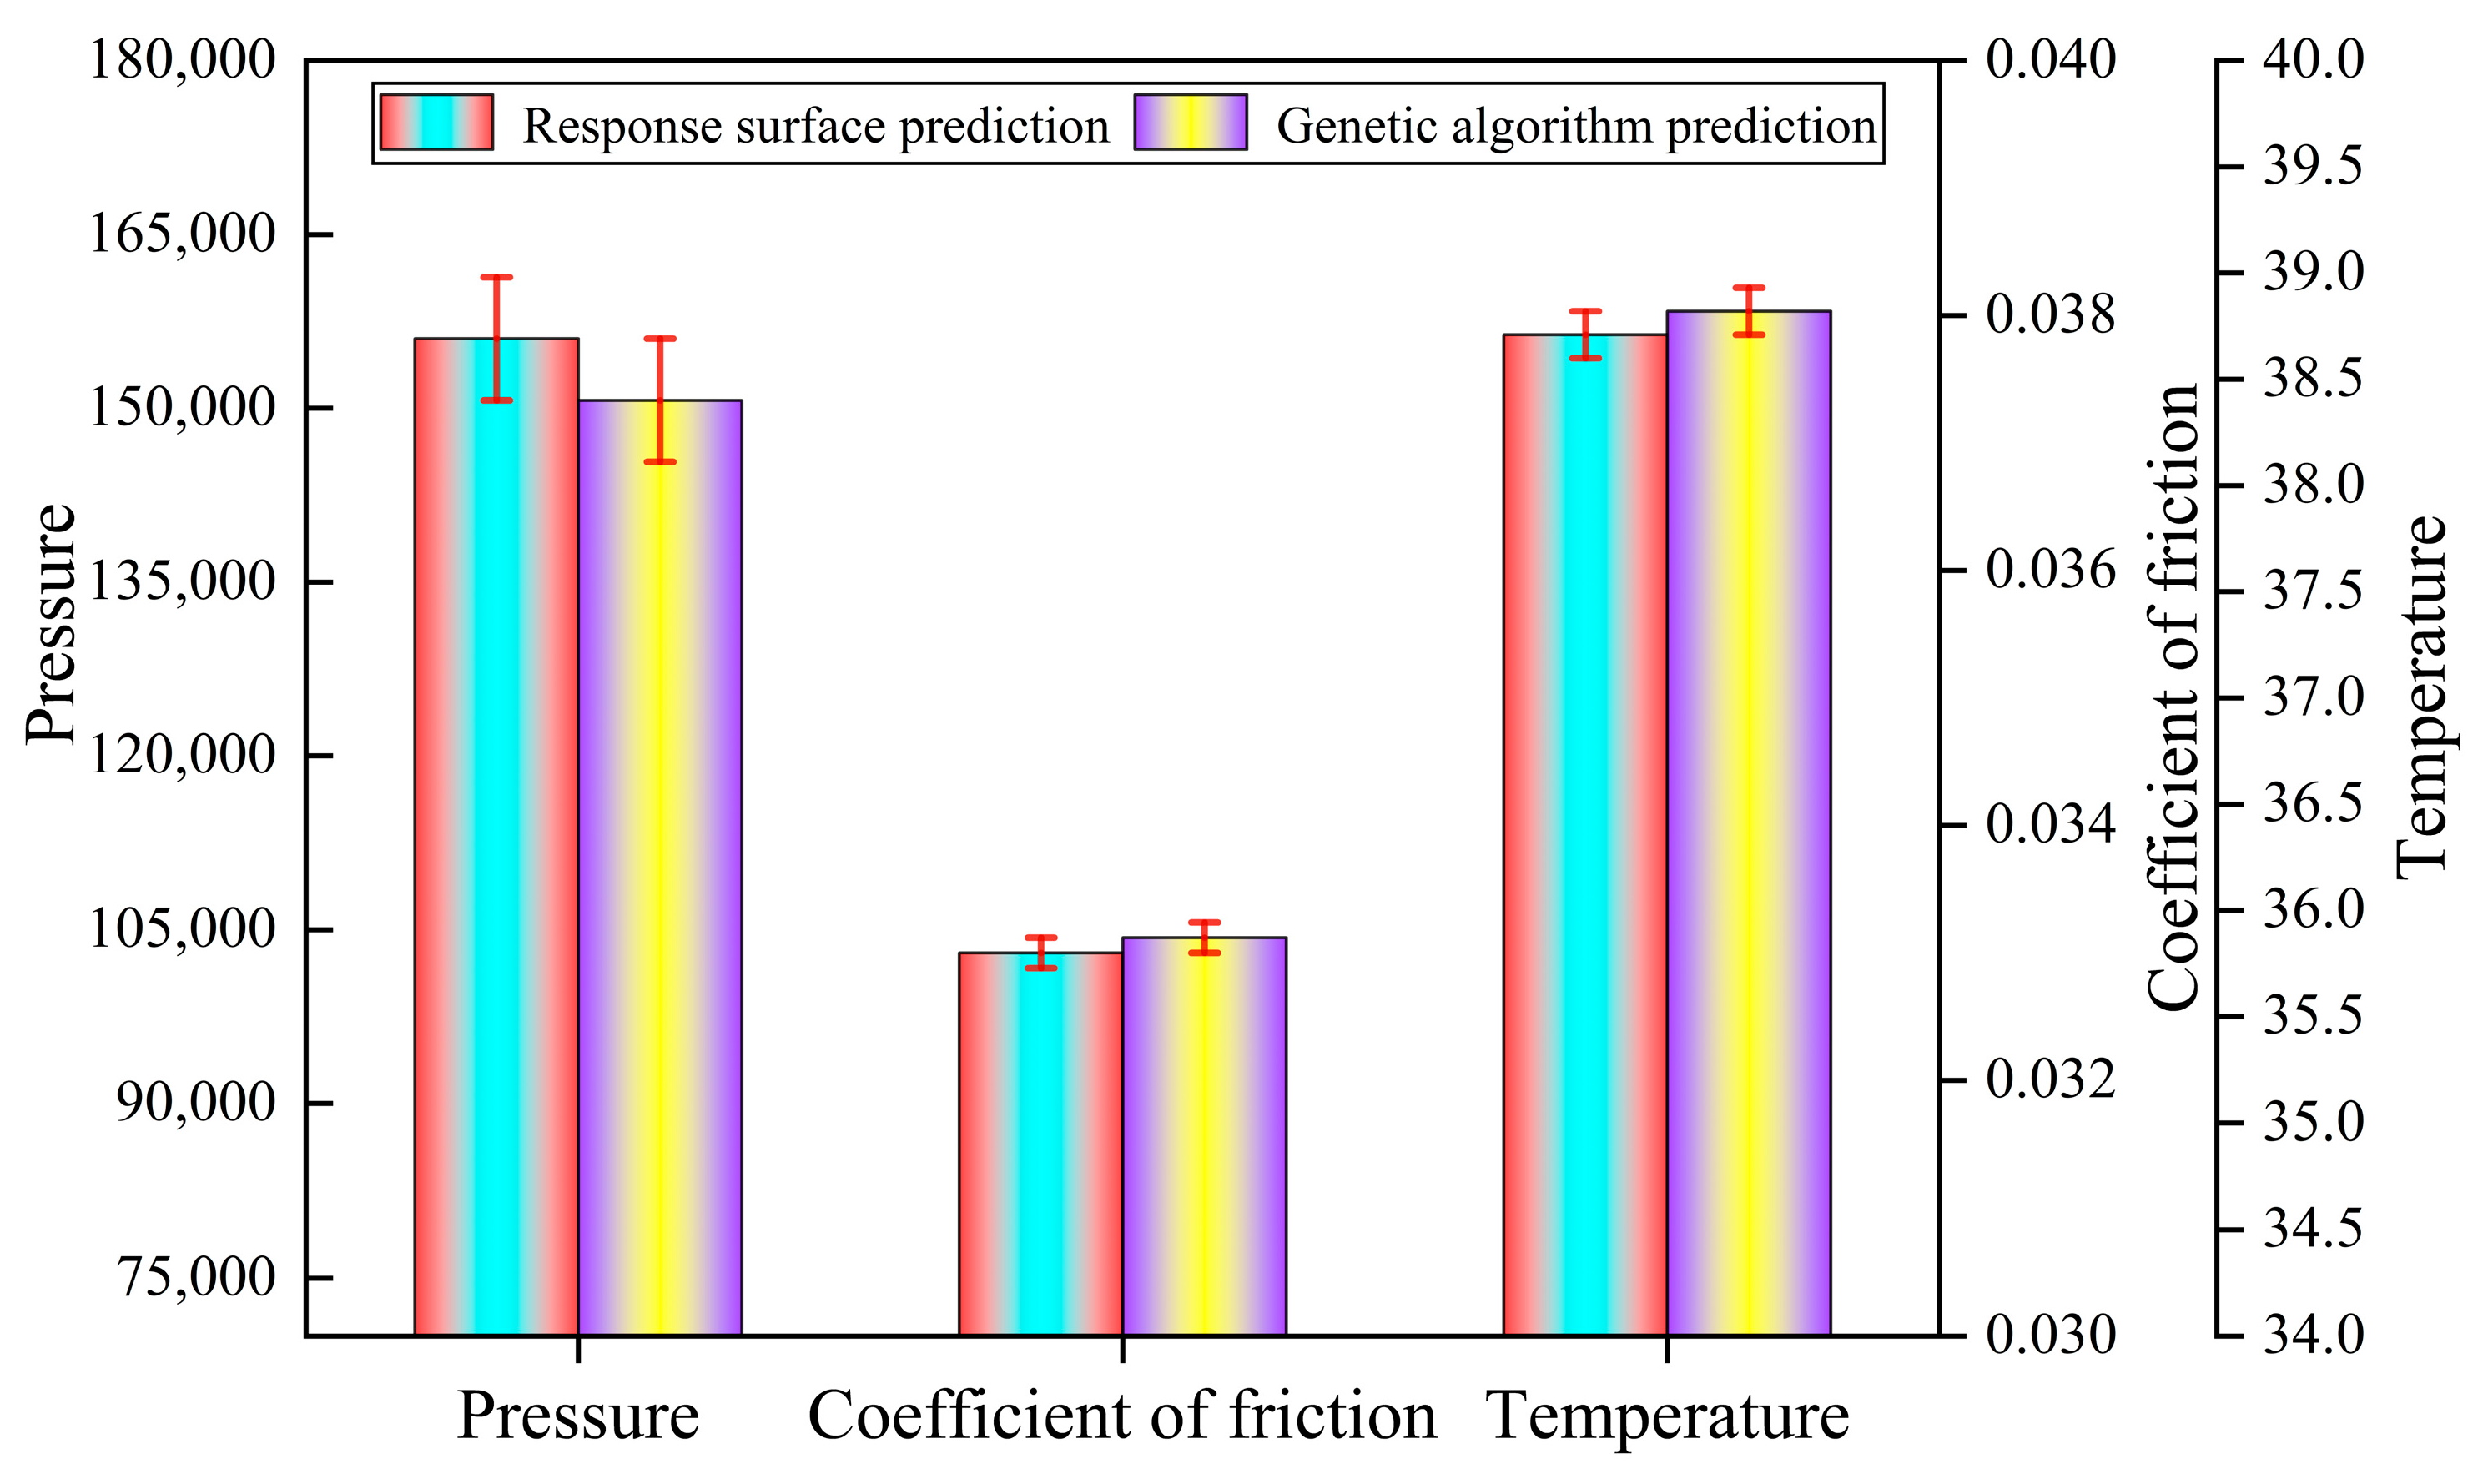
The analysis and comparison between the optimized design results of the genetic algorithm and the response surface method are shown in Figure 15. The predicted values of pressure, friction coefficient, and temperature calculated by the genetic algorithm are 1.55993 × 10⁵ Pa, 0.033, and 38.71°, respectively. The predicted values of pressure, friction coefficient, and temperature calculated using the response surface method are 1.50682 × 10⁵ Pa, 0.03312, and 38.82°, respectively. The pressure error of the two methods is 3.4%, the friction coefficient error is −0.36%, and the temperature error is −0.28%, which are all within the range of ±4%. This indicates that their predicted results have a high reliability and a good reference value.
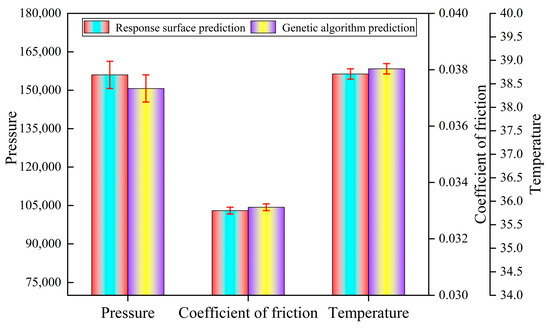
Figure 15.
Comparison between response surface prediction and genetic algorithm prediction.
5.3. Comparative Analysis of Combined Biomimetic Micro-Texture Oil Film Performance
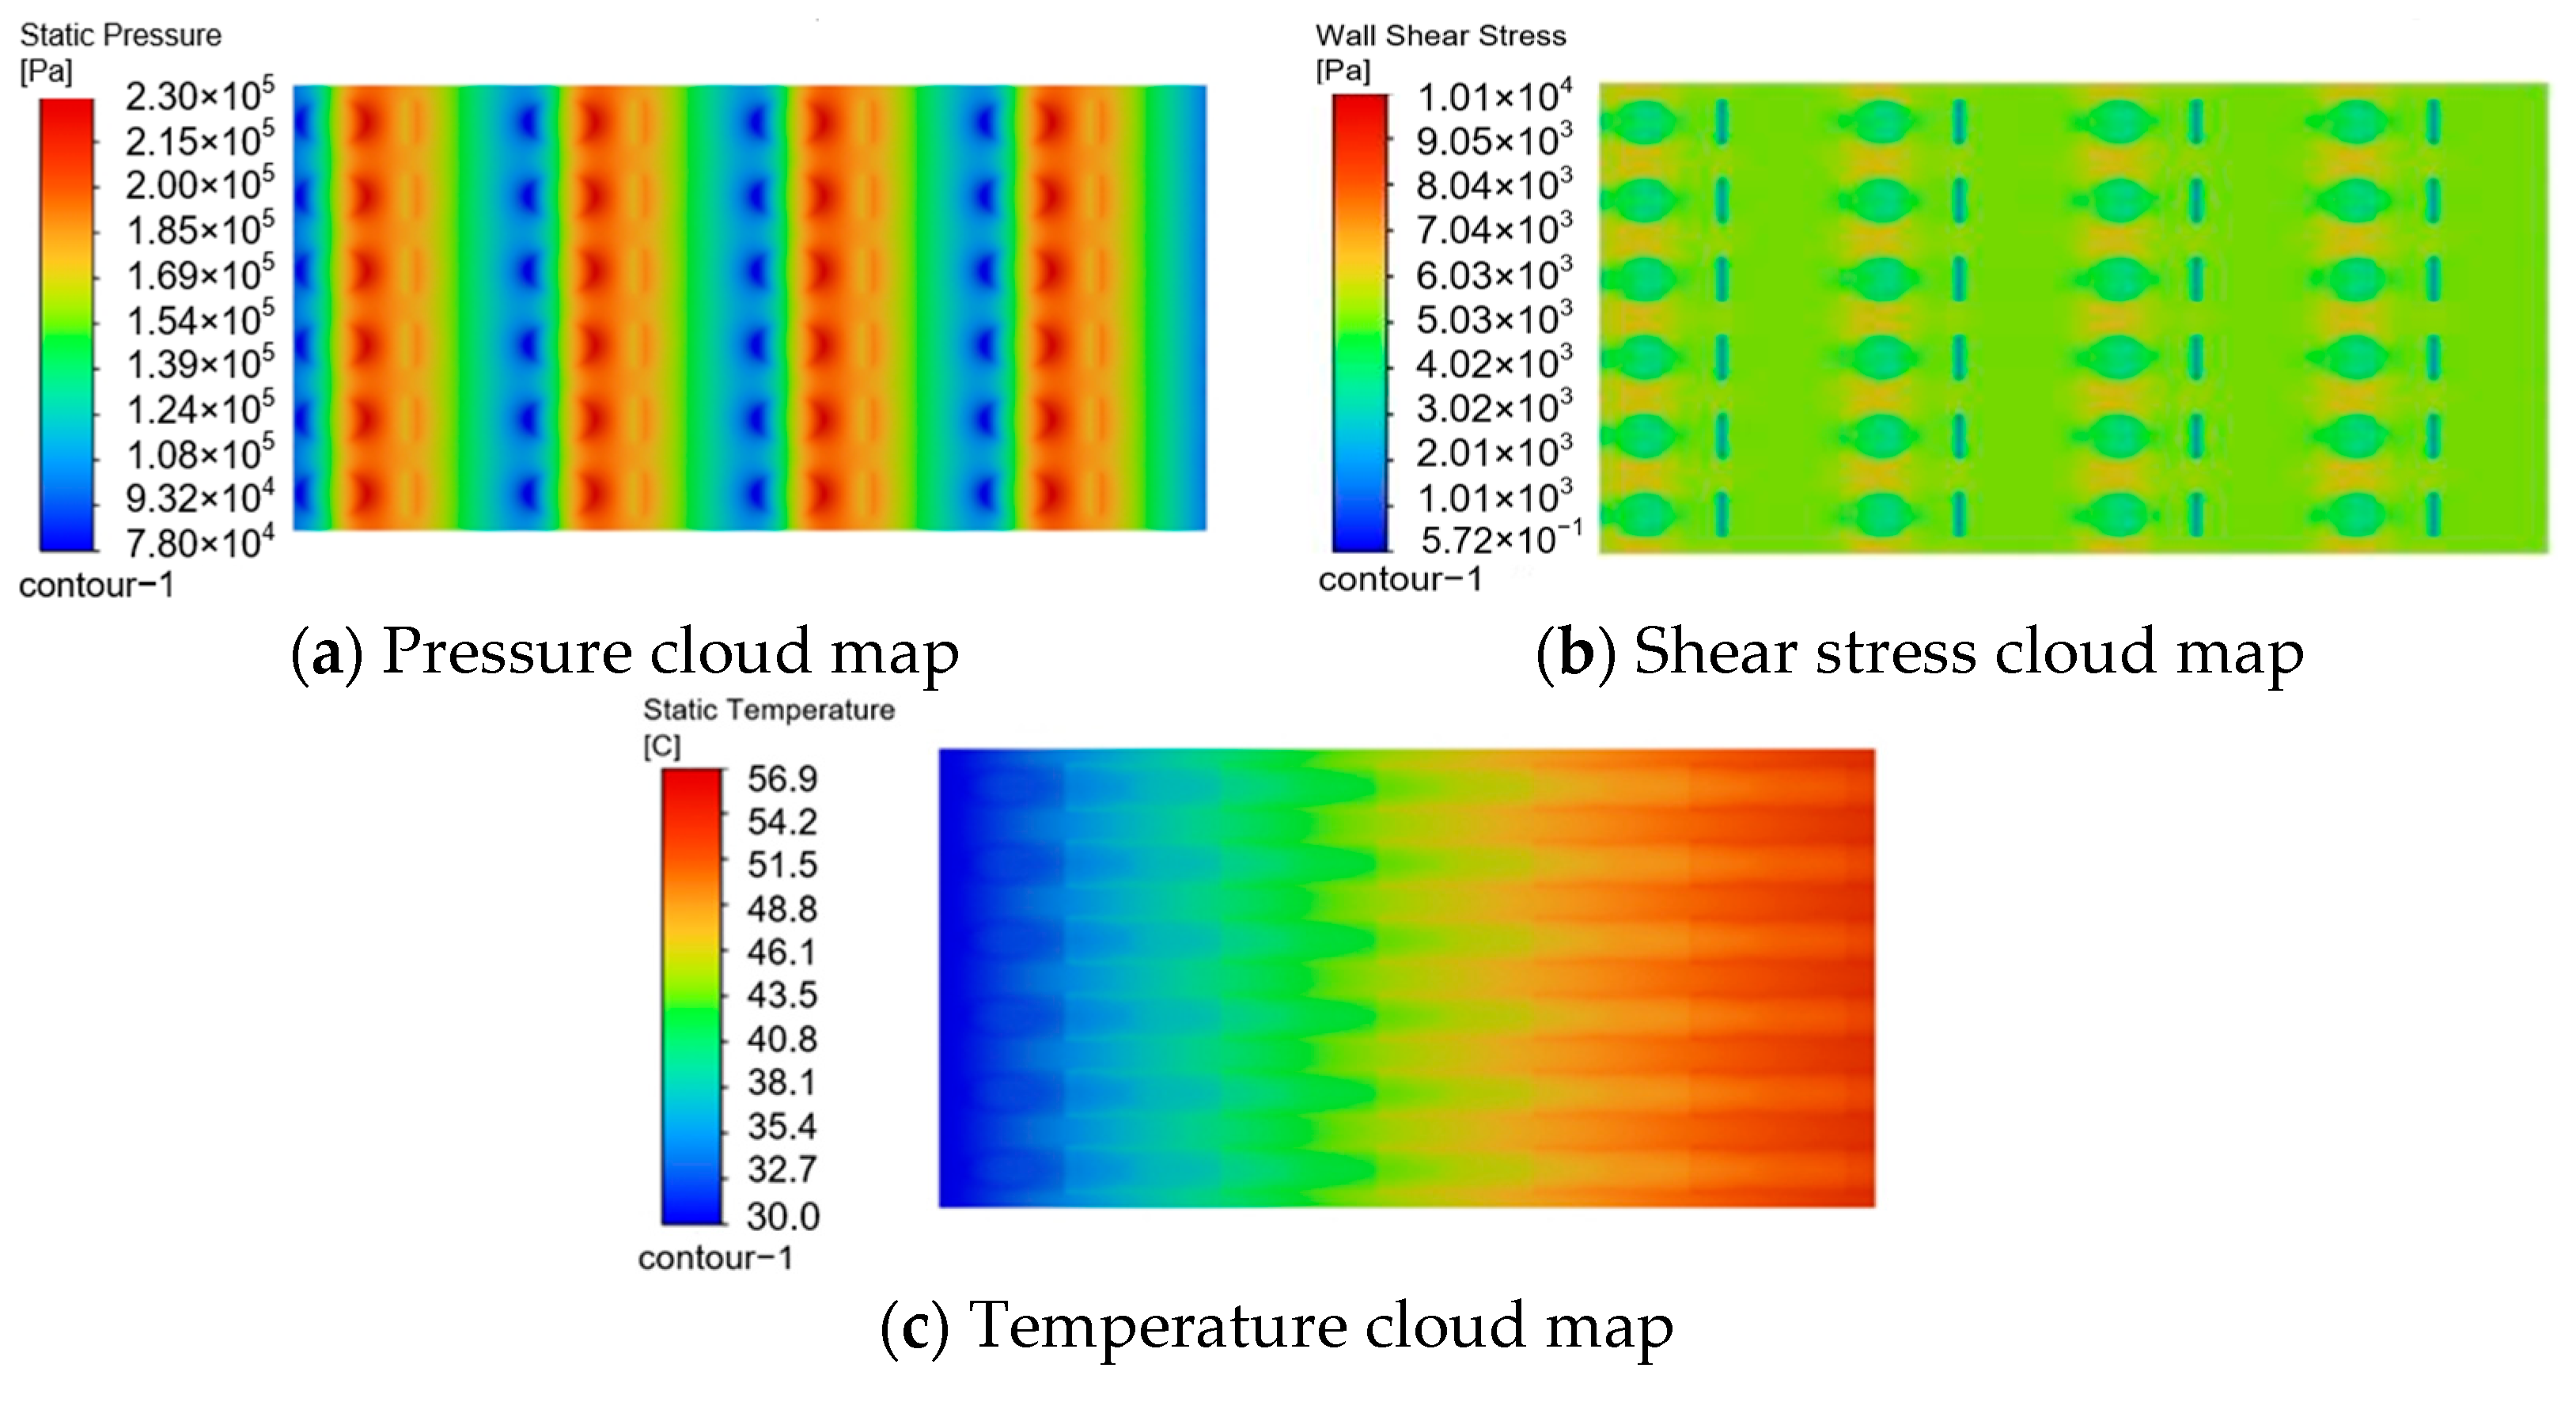
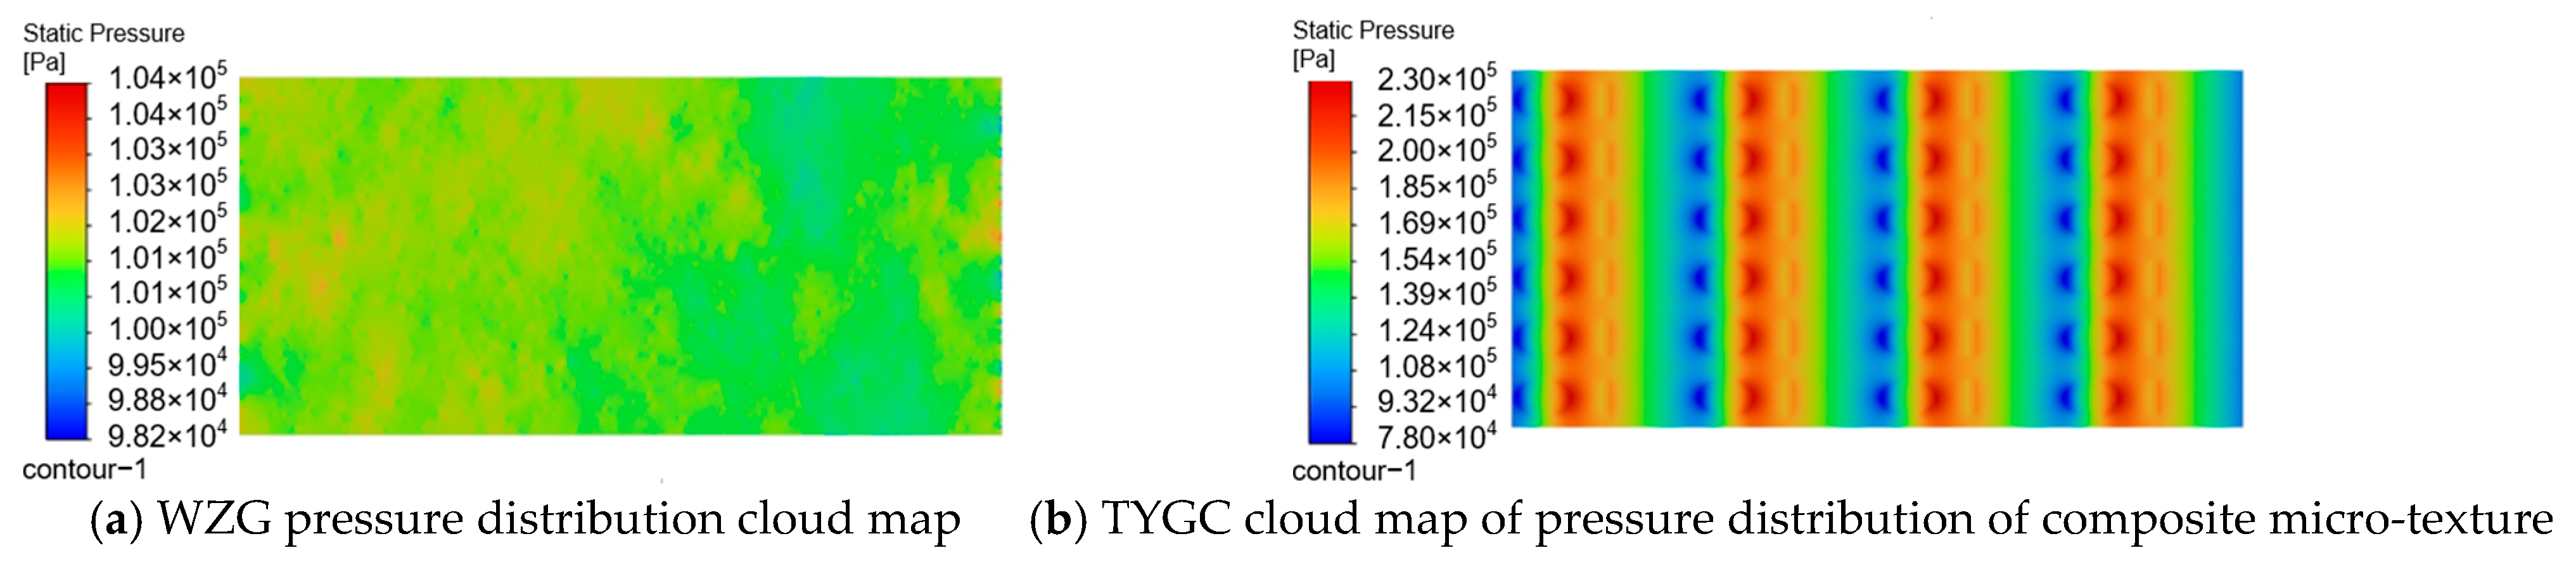
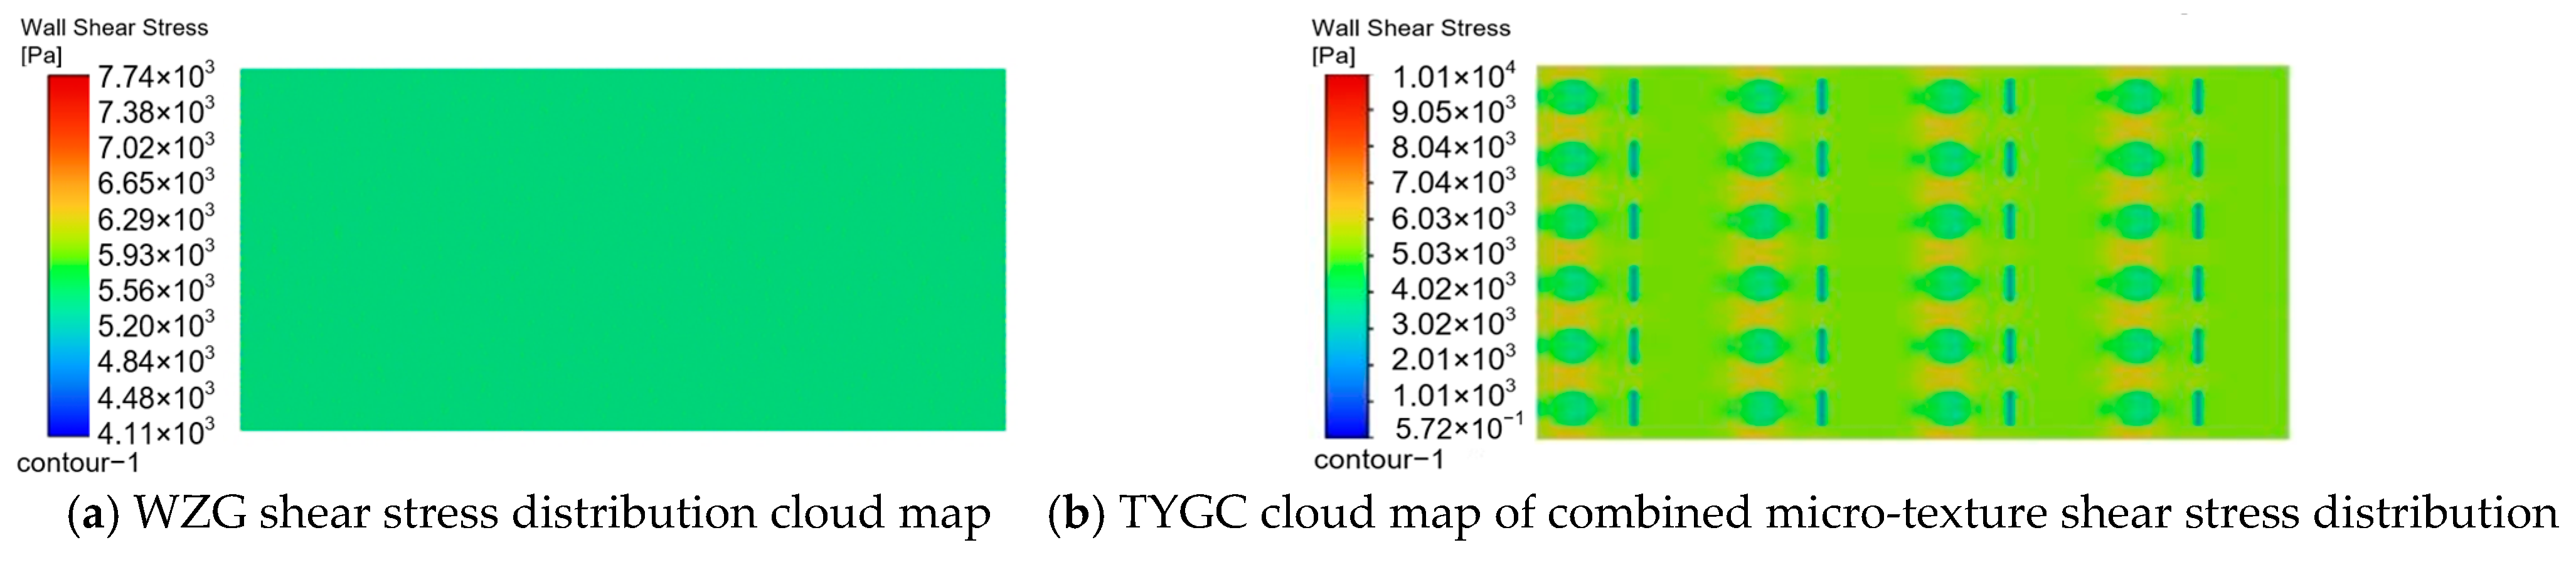
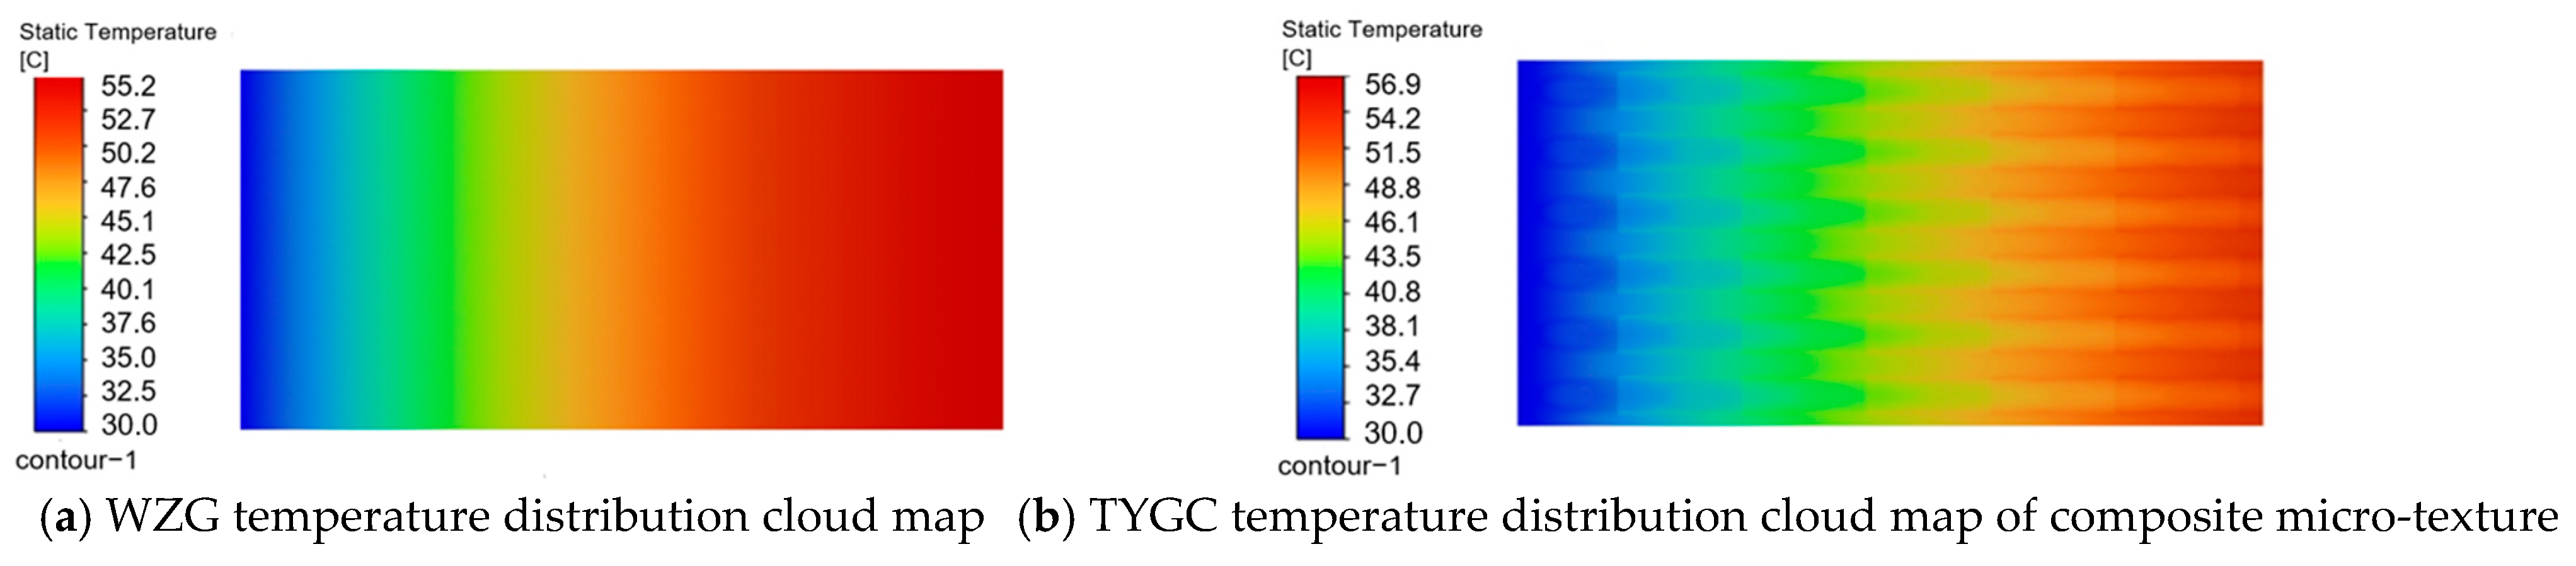
In order to verify the performance of the optimal combination micro-textured guide rail, a three-dimensional model of the WZG oil film was established with the same area as the optimal feature parameter combination micro-textured oil film. It was imported into Fluent and meshed with the same boundary settings as discussed in Chapter 3 in order to obtain the surface pressure, shear stress, and temperature distribution cloud maps of the WZG oil film. From the comparison cloud map of bearing pressure in Figure 16, it can be seen that due to the addition of micro-textures, the flow velocity decreases when lubricating oil flows into the micro-textured area, resulting in the appearance of a low-pressure zone. When the lubricating oil flows out of the microstructured area, the flow velocity increases, resulting in a high-pressure zone. From a numerical perspective, it can be concluded that the difference between the highest and lowest values of the TYGC microstructure bearing pressure is large, which is more conducive to the formation of a fluid dynamic pressure lubricating oil film, thereby reducing the occurrence of dry friction in sliding guide friction pairs. From the comparison cloud map of shear stress in Figure 17, it can be seen that there is no significant change in the shear stress of the oil film of WZG, while the shear stress in the micro-textured area of the TYGC micro-textured oil film surface is significantly reduced. According to the calculation of the friction coefficient using Formula (6), as the bearing pressure increases and the shear stress decreases, the friction coefficient also decreases, thereby improving the drag reduction and wear resistance characteristics of the biomimetic micro-textured guide rail pair. From the temperature comparison cloud map in Figure 18, it can be clearly seen that the oil film temperature of the non-textured guide rail pair shows a monotonic upward trend along the direction of motion, with the highest temperature being observed at the end of the contact zone. This is due to the accumulation of heat caused by continuous friction, as well as the viscosity of the oil film decreasing with increasing temperature, further exacerbating the generation of frictional heat. The oil film temperature in the combined micro-textured region is significantly lower than that in the surrounding non-textured region, and the overall temperature gradient is smoother. The viscosity temperature characteristics of the lubricating oil are better in low-temperature environments, further suppressing temperature increases. Moreover, due to the elliptical texture in the micro-texture of the elliptical groove, it is easier to form a wedge-shaped oil film, which increases the load-bearing pressure and thus suppresses the rupture of the oil film. The geometric shape of the groove texture can play a role in super-hydrophobicity and flow guidance, providing continuous lubrication for the friction pair and avoiding local dry friction.

Figure 16.
WZG and TYGC combined microstructure pressure contrast plots.
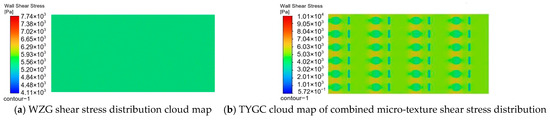
Figure 17.
WZG and TYGC combined microstructure shear stress contrast plots.
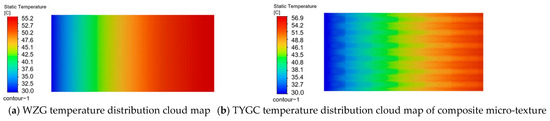
Figure 18.
WZG and TYGC combined microstructure temperature contrast plots.
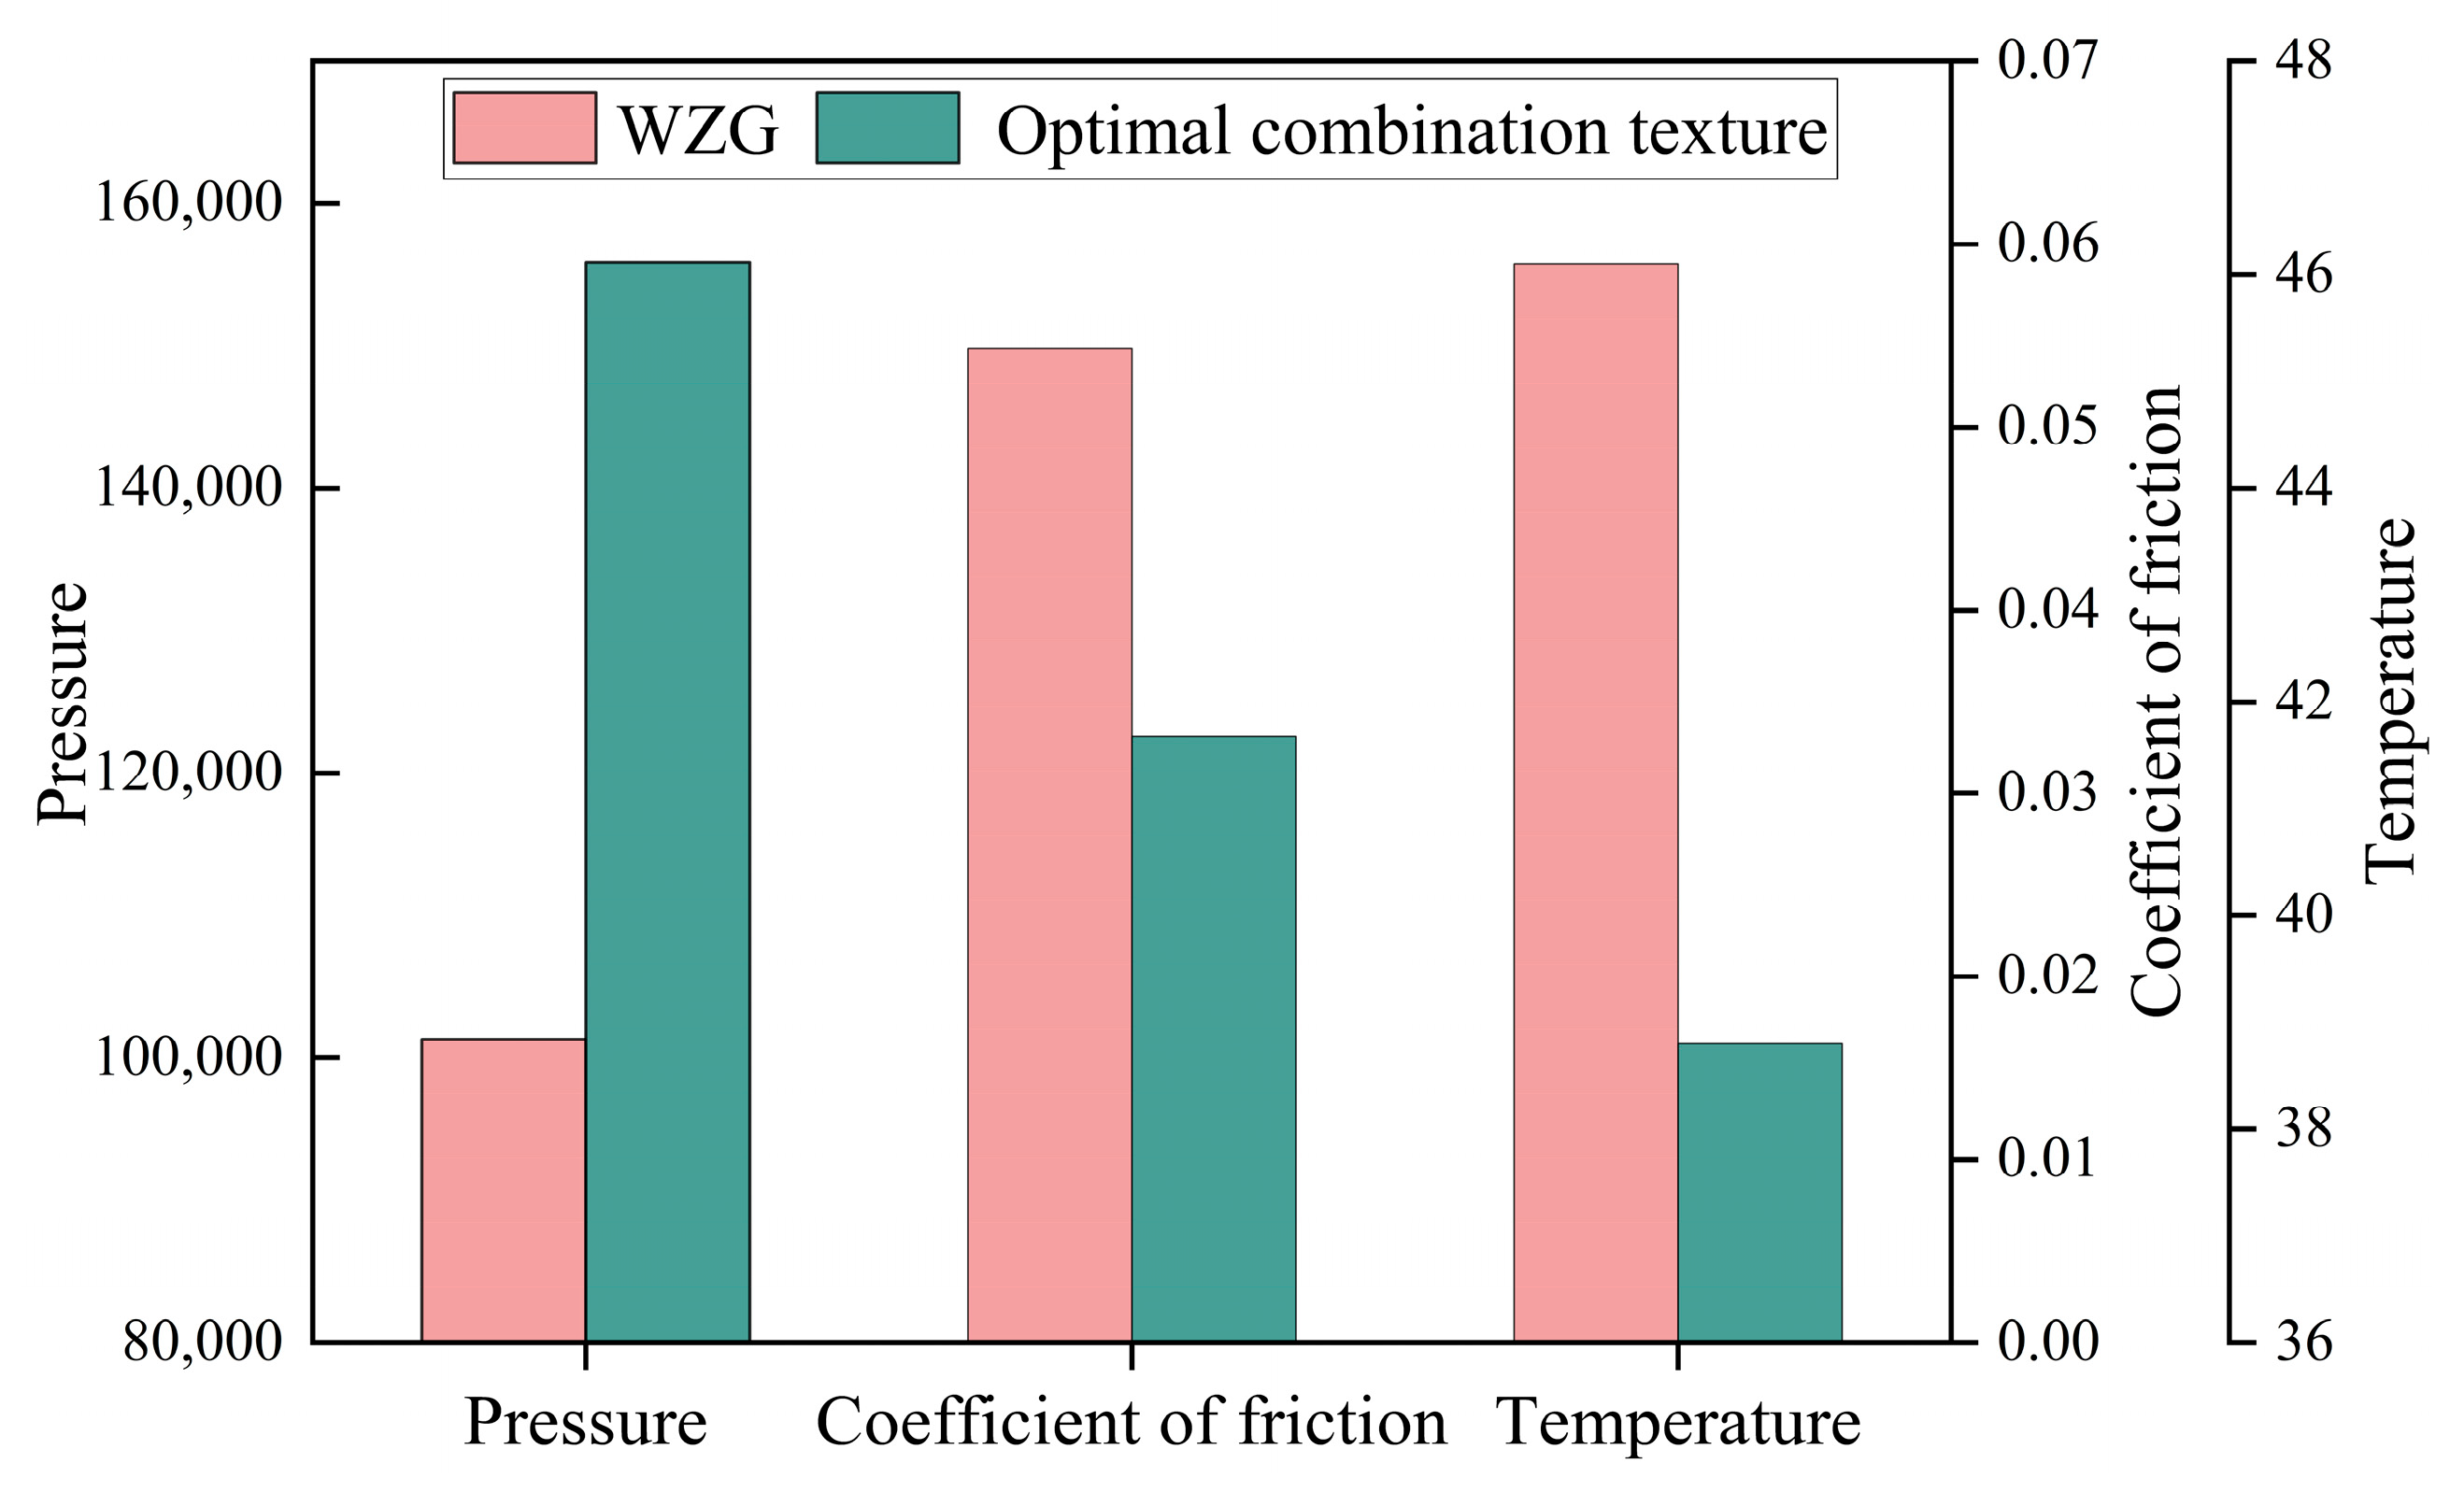
The simulated pressure, shear stress, and temperature are calculated using the weighted average; then, Formulas (4)–(7) are used. The oil film bearing pressure for the optimum combination of micro-texture was 1.55993 × 10⁵ Pa, the friction of coefficient was 0.032, and the temperature was 38.71 °C; the bearing pressure of the WZG oil film was 1.013466 × 10⁵ Pa, the friction of coefficient was 0.0543, and the temperature was 46.1 °C. It can be seen from Figure 19 that the bearing pressure of the prepared TYGC combined micro-texture on the lower surface of the guide rail pair is 53.79% higher than that of WZG, the friction coefficient is reduced by 39.04%, and the temperature is reduced by 15.83%, which indicates that the preparation of the TYGC combined micro-texture on the surface of the guide rail pair can improve the bearing capacity of the oil film, playing a positive role in preventing oil film rupture and reducing friction wear.
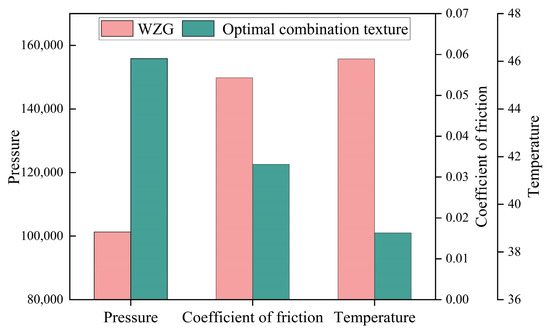
Figure 19.
WZG and TYGC optimal texture comparison diagram.
Sun Yihao et al. [37] applied laser composite texture technology to sliding guide rails and found that the optimal combination of convex and concave texture parameters had a friction coefficient of 0.0994, which was 31.84% lower than that of the prototype guide rail. The optimal combination of micro-textures in this study has a friction coefficient of 0.032, which is lower and can effectively reduce the wear between guide rail pairs. The main reason for the difference is the presence of the elliptical texture in the combined microstructure, which reduces the fluid shear stress, thus lowering the friction coefficient. At the same time, the groove texture forms a more uniform lubricating oil film, achieving a reduction in friction between the sliding slider friction pairs. Therefore, the friction coefficient in this study is relatively small.
6. Simulation Analysis of the Contact Stress of Micro-Texture Guide Rails Under Oil Depletion Conditions
When the machine tool moves at a low speed, the lubricating oil film between the sliding guide rail pairs has not yet formed a complete oil film and is in the state of oil depletion. At this time, the conditions comprise dry friction or boundary friction, while the contact stress will affect the lubrication effect of the fluid. Therefore, it is necessary to study the contact stress on the surface of each guide rail pair under the state of oil depletion.
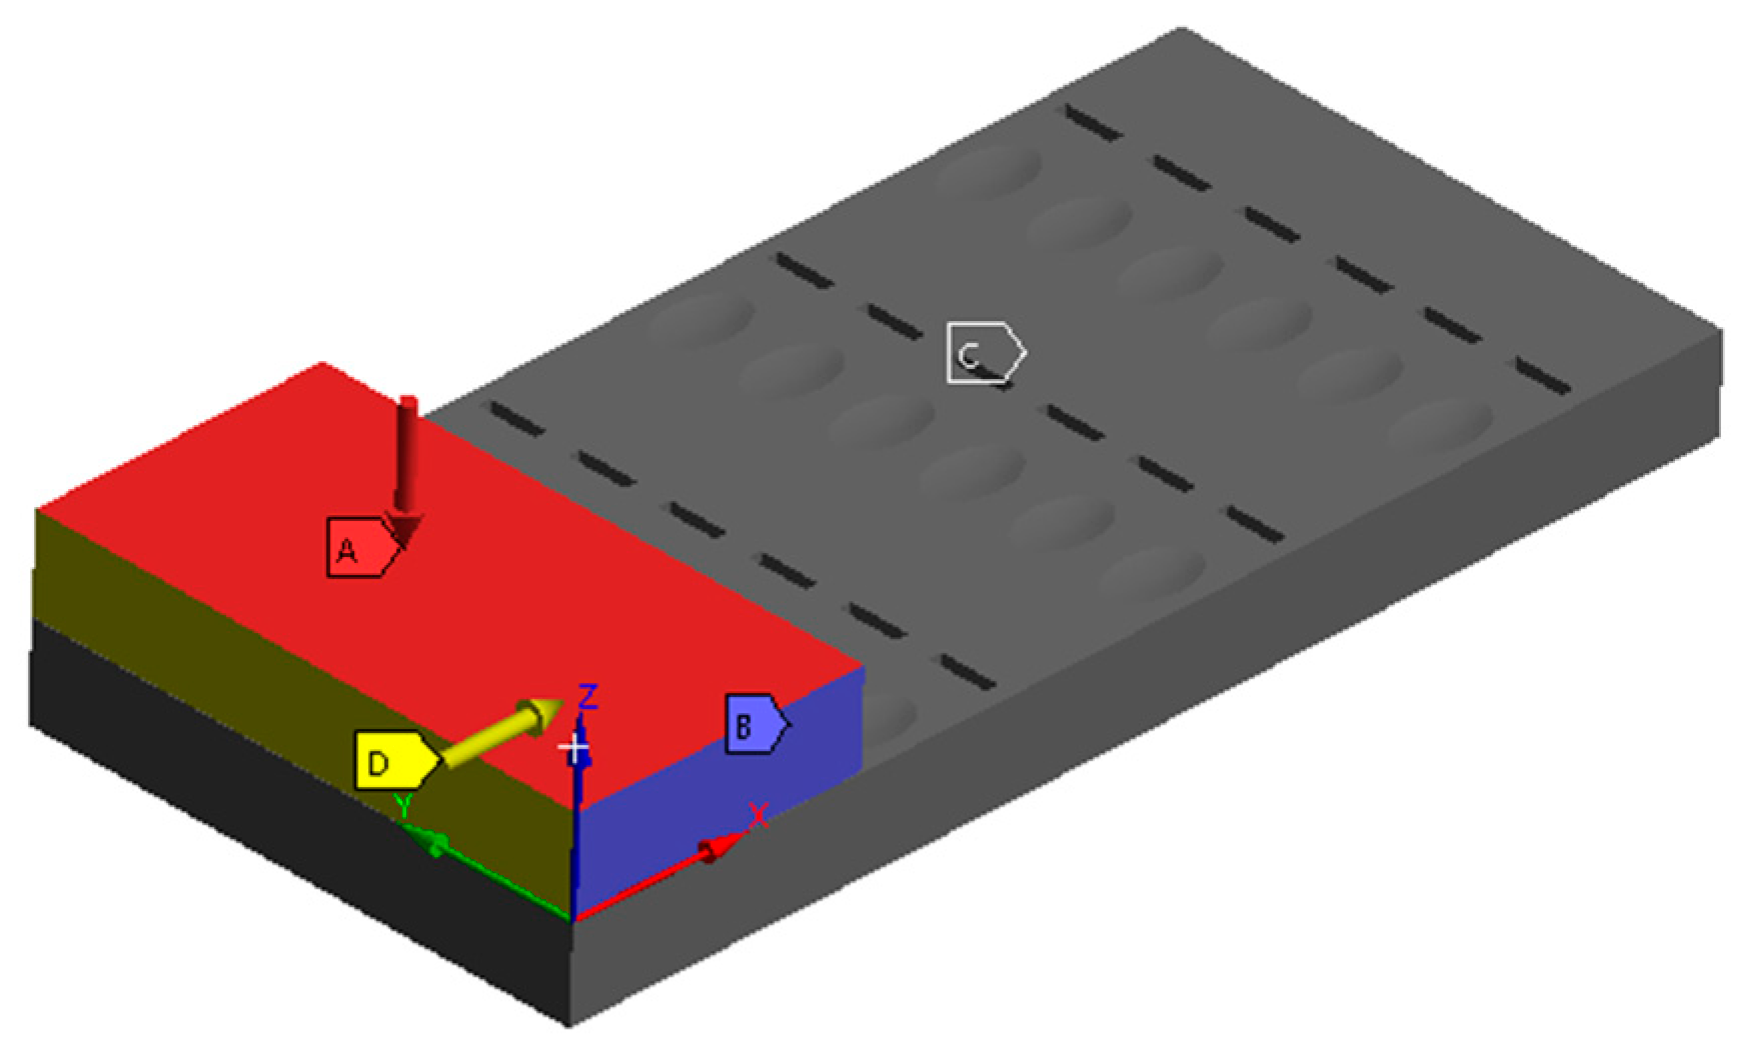
The contact stress simulation experiment of the WZG guide rail pair model, TY textured guide rail pair model, and TYGC combined-texture guide rail pair model is carried out using ANSYS workbench software. The contact stress surface models of the three guide rail pairs with the same area as the distribution parameters mentioned above are shown in Figure 20.

Figure 20.
Contact stress surface model of guide rail pairs.
The material properties were set as structural steel, the slider was set as the target geometry, the guide rail was set as the contact geometry, and the contact type between the slider and the guide rail was set as the friction contact with a friction coefficient of 0.1. In order to limit the movement of the slider from left to right, the two sides of the slider are set to be free of friction support, with a speed of 0.5 mm/s. Then, a downward pressure of 1 MPa was applied on the upper surface of the slider, while the lower surface of the guide rail was fixed. The model after applying load and constraint is shown in Figure 21.

Figure 21.
Model after application of loads and constraints.
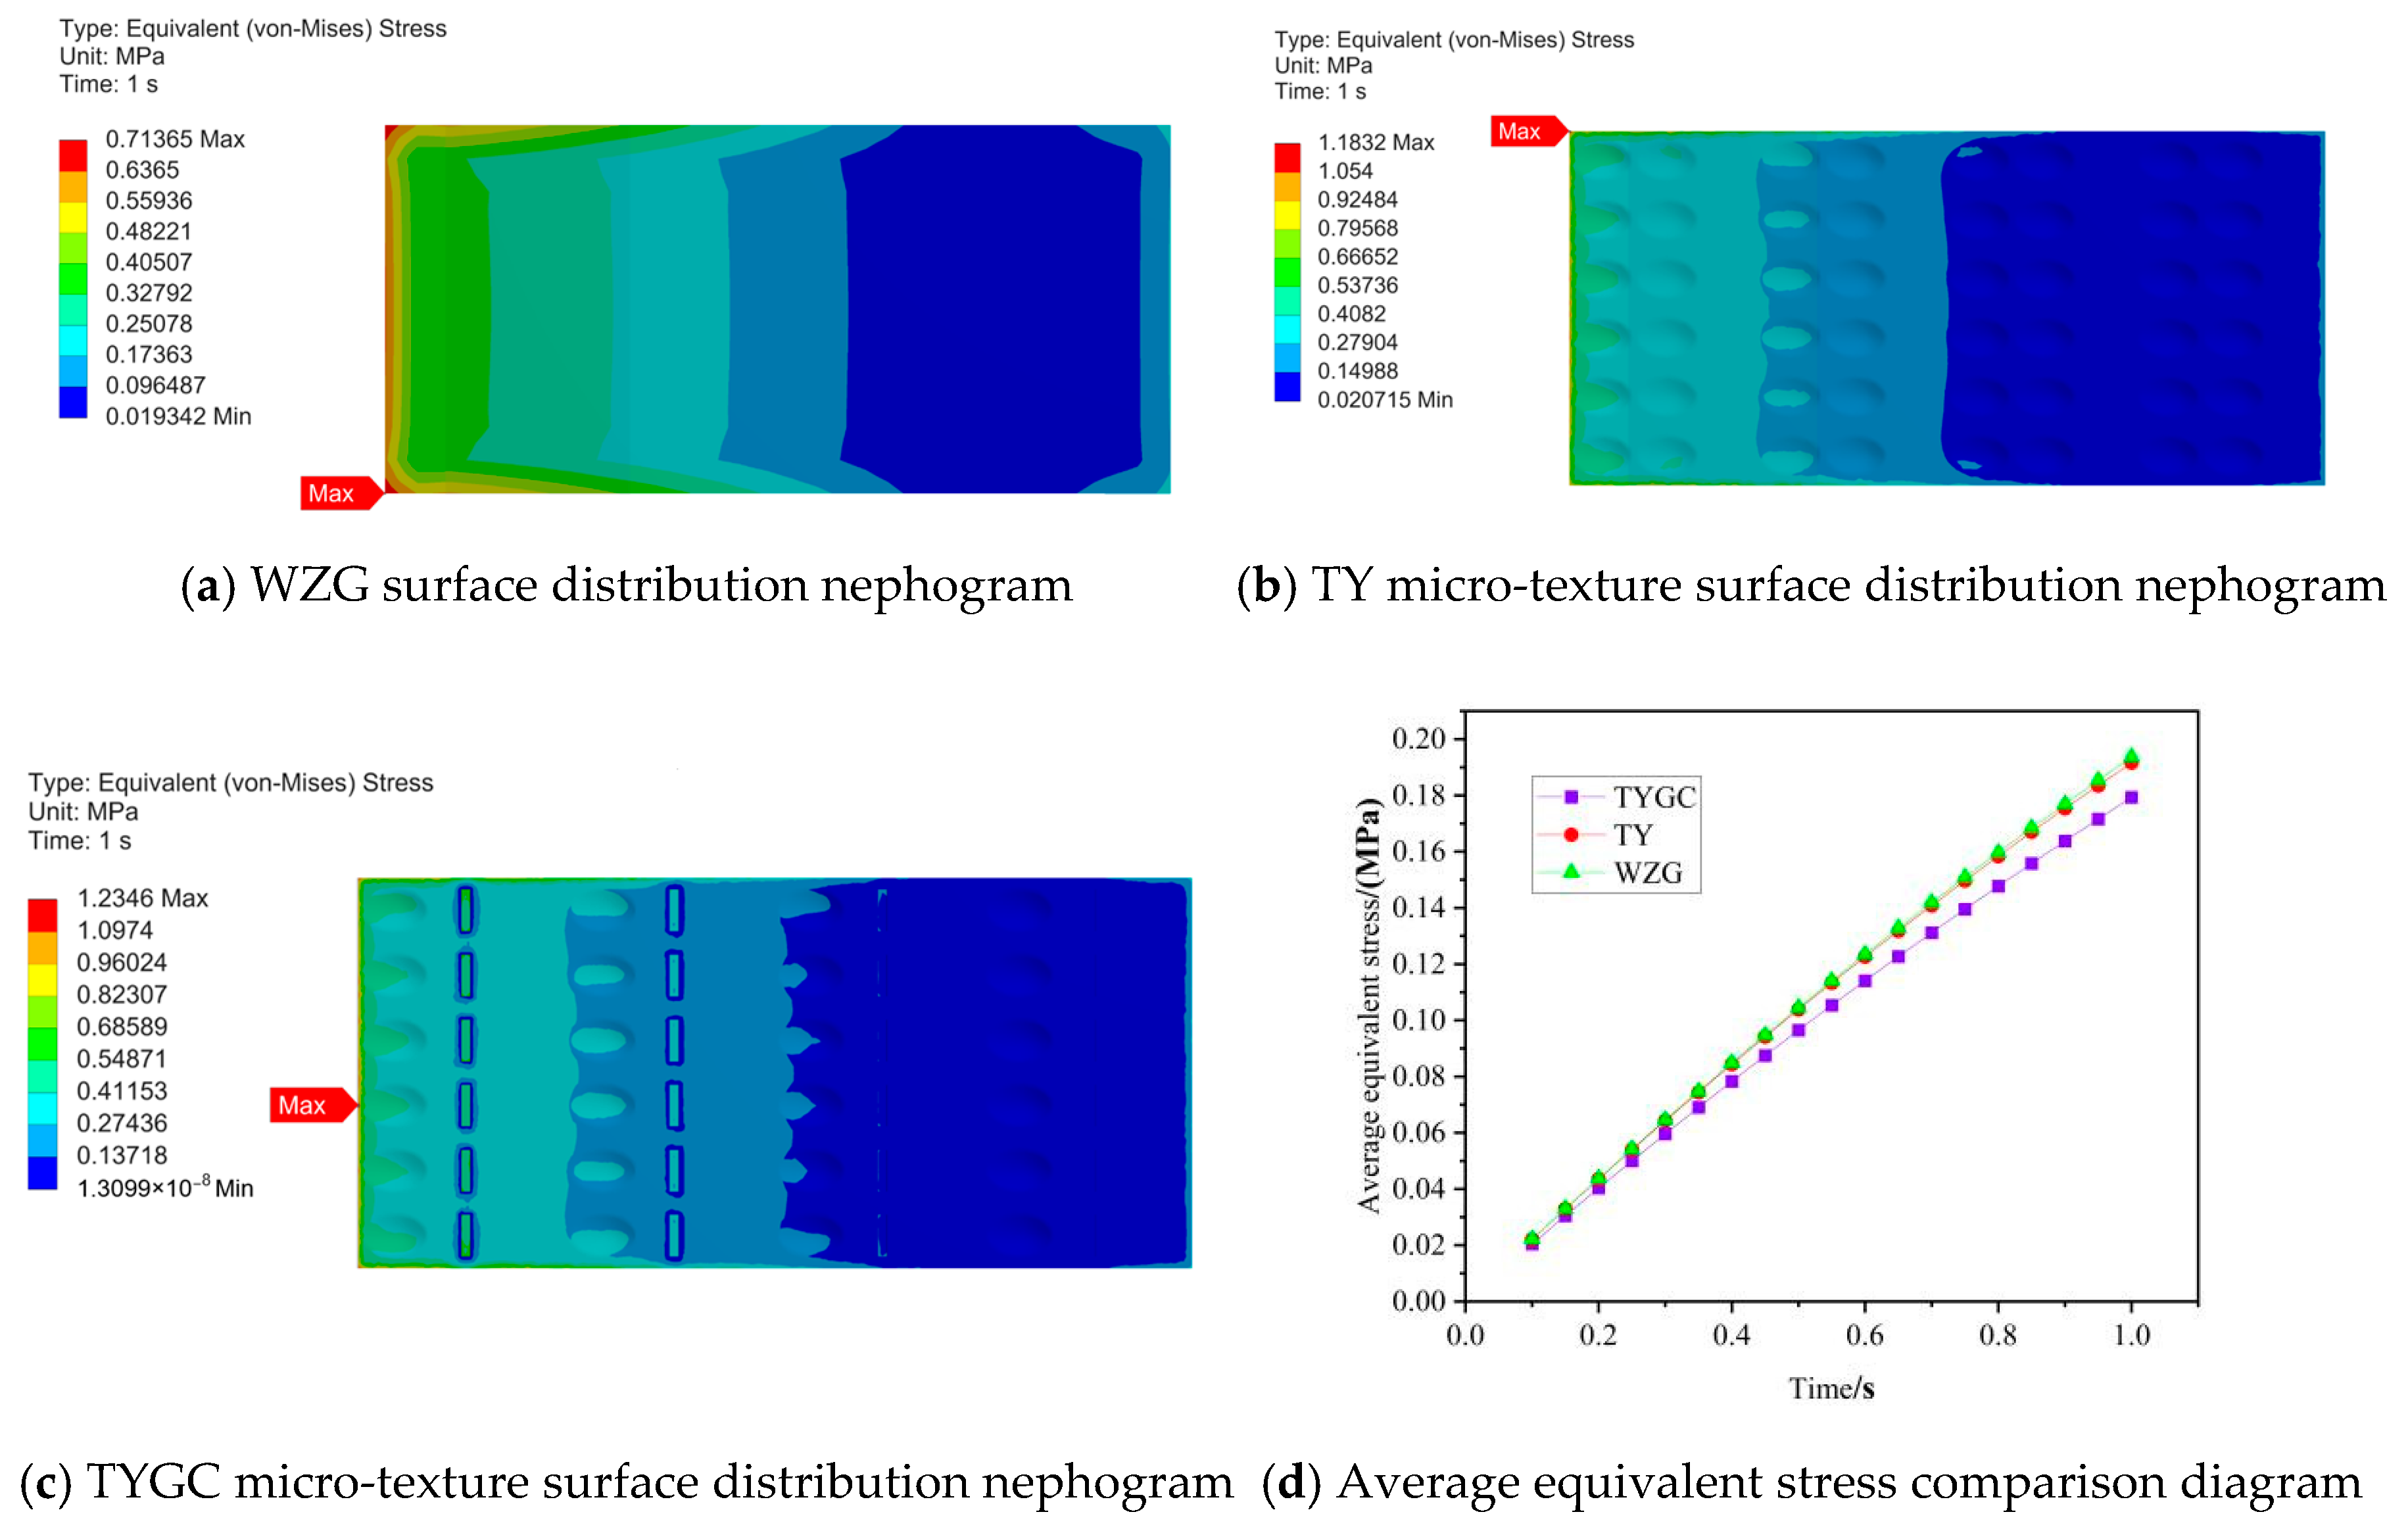
Through analysis, the contact stress distribution of the three types of surface in the friction process is finally obtained, as shown in Figure 22. From the analysis of Figure 22a,b, it can be seen that the maximum contact stress of the TY micro-textured surface and the TYGC combined micro-textured surface is greater than that of the WZG surface. The maximum stress of WZG and the TY micro-textured surface appears at the edge of the friction surface. There is an obvious stress gradient between the left and right boundaries of WZG, forming a continuous stress concentration zone. The initial local wear of the friction surface is usually caused by excessive stress, but the stress distribution of the TY micro-textured surface becomes relatively uniform due to the addition of the micro-textured surface. It can be seen from Figure 22c,d that there is an obvious low stress distribution area around the micro-texture surface of the TYGC combination. Since the high- and low-stress areas produced by the micro-texture play a role in stress mitigation, the average value of the equivalent stress is reduced, and the micro-texture surface is improved so that the average stress of the TYGC composition texture is smaller than the average stress of the WZG and TY textures. It further verifies that the average equivalent stress of the TYGC composition texture in the friction pair movement is smaller, and, subsequently, the abrasion is smaller.

Figure 22.
Comparison of equivalent stress distribution nephograms and the average stress of different micro-textures.
Although surface texturing may introduce local material discontinuities and stress concentration, thereby increasing the risk of wear, if the microstructure design is appropriate, it can effectively slow down potential wear trends and extend the service life of friction pairs. Firstly, micro-textures contribute to oil storage and re-lubrication. Texture pits act as miniature oil reservoirs between friction pairs, providing instantaneous oil supply when lubrication conditions are unstable (such as during start-up or emergency stops), thereby maintaining oil film continuity, avoiding direct contact between metals, and effectively reducing the occurrence of adhesive wear. Secondly, the micro-texture changes the microscopic load distribution in the contact area, redistributing local contact stress and alleviating stress concentration. In addition, the micro-texture can capture abrasive particles and debris, reducing the damage of third-body abrasive particles to the contact surface. This effect is particularly significant under boundary lubrication or dry friction conditions, which are beneficial for maintaining the cleanliness and lubrication stability of the contact surface. In summary, although the introduction of micro-textures may bring about local structural changes, under optimized design and process parameter control, it has a significant positive effect on slowing down friction pair wear and improving overall service life.
7. Conclusions
The surface of machine tool guide rail pairs is often subject to local wear, which affects the machining accuracy and service life of the machine tool. In order to solve the above problems, a bionic micro-texture is placed on the surface of the guide rail pair, which can increase the bearing pressure, reduce the friction coefficient, and reduce the temperature rise, i.e., slow down the local wear of the guide rail pair surface, so as to improve the service life of the guide rail pair. Based on the above research, the main conclusions are as follows:
(1) The results show that the bearing pressure, friction coefficient, and the temperature of the TYGC combined micro-texture are significantly optimized compared with the WZG texture and the single-texture surface guide pair; additionally, the elliptical pits in the combined micro-texture have a higher bearing pressure, which is more conducive to the formation of a stable lubricating oil film, while the groove texture plays a superhydrophobic and diversion role, which is more conducive to guiding the lubricating oil to take away heat.
(2) Based on the response surface method, the combined micro-texture parameters of the rail friction pair surface were optimized, and the genetic algorithm NSGA-II was used for multi-objective verification. The results show that the error ranges of the response surface optimization values and the NSGA-II genetic algorithm optimization values are within ± 4%, which verifies the correctness and rationality of the simulation model and analysis method in this paper. Among them, the TYGC combined texture can significantly improve the service life of guide rails and can effectively inhibit the occurrence of oil film rupture.
(3) By revealing and analyzing the drag reduction and wear resistance mechanism of the TYGC combined micro-texture guide pair, it is verified that the TYGC combined micro-texture demonstrates a better lubrication performance than WZG under lubrication conditions, and through the contact stress simulation analysis of the guide pair, it is verified that the TYGC combined micro-texture also demonstrates a better performance under conditions that lack oil.
This article mainly focuses on the investigation of sliding slider rectangular guide rail pairs. By introducing a biomimetic combination micro-texture design, the aim is to significantly improve the load-bearing performance, service life, and friction performance of the oil film between the guide rail pairs. However, the structural forms of guide rail pairs are diverse, and the wear mechanisms under different working conditions are complex. Under the same lubrication conditions, typical guide rails such as V-shaped guide rails, T-shaped guide rails, and triangular guide rails also commonly exhibit local wear, further demonstrating the wide applicability and strong feasibility of this method.
Author Contributions
Conceptualization: Y.C., H.M., M.Z. and B.Y.; methodology: Y.C., B.Y. and C.L.; software: Y.C., B.Y., C.L., Q.H. and F.W.; investigation: Y.C., M.Z., H.M. and Q.L.; resources: Y.C.; data curation: Y.C., H.J., D.W., X.L. and H.M.; writing—original draft preparation: Y.C. and B.Y.; writing—review and editing: Y.C.; supervision: H.J.; project administration: Y.C.; funding acquisition: Y.C. All authors have read and agreed to the published version of the manuscript.
Funding
This research was funded by the Research Projects of Basic Scientific Research Business Expenses of Provincial Colleges and Universities in Heilongjiang Province (145409603).
Data Availability Statement
All data included in this study are available upon request to the corresponding author.
Conflicts of Interest
Authors Youzheng Cui and Hui Jiang were employed by QiQiHar Heavy CNC Equipment Co., Ltd. The remaining authors declare that the research was conducted in the absence of any commercial or financial relationships that could be construed as a potential conflict of interest.
References
- Wang, C.; Hu, Y.; Tan, Y.; Zhang, L. Research on the Accuracy Maintenance of Machine Tool Sliding Guides under Boundary Lubrication Conditions. Mach. Tool Hydraul. 2020, 48, 93–96. [Google Scholar]
- Ogawa, H.; Sasaki, S.; Korenaga, A.; Miyake, K.; Nakano, M.; Murakami, T. Effects of surface texture size on the tribological properties of slideways. Proc. Inst. Mech. Eng. Part J J. Eng. Tribol. 2010, 224, 885–890. [Google Scholar] [CrossRef]
- Wos, S.; Koszela, W.; Pawlus, P. The effect of both surfaces textured on improvement of tribological properties of sliding elements. Tribol. Int. 2017, 113, 182–188. [Google Scholar] [CrossRef]
- Pang, Z.; Zhou, H.; Xie, G.; Cong, D.; Meng, C.; Ren, L. Effect of bionic coupling units’ forms on wear resistance of gray cast iron under dry linear reciprocating sliding condition. Opt. Laser Technol. 2015, 70, 89–93. [Google Scholar] [CrossRef]
- Kovalchenko, A.; Ajayi, O.; Erdemir, A.; Fenske, G.; Etsion, I. The effect of laser texturing of steel surfaces and speed-load parameters on the transition of lubrication regime from boundary to hydrodynamic. Tribol. Trans. 2004, 47, 299–307. [Google Scholar] [CrossRef]
- Dykha, O.; Dytyniuk, V.; Kovtun, O.; Fasolia, V.; Hetman, M. Improving the wear resistance of guides: Tribological analysis, surface texture and lubricants. Probl. Tribol. 2025, 30, 51–59. [Google Scholar] [CrossRef]
- Atwal, J.C.; Pandey, R.K. Film thickness and friction investigations in a fluid film thrust bearing employing a new conceived micro-texture on pads. J. Tribol. 2021, 143, 061801. [Google Scholar] [CrossRef]
- Fu, Y.; Ji, J.; Bi, Q. The Influence of Partially Textured Slider with Oriented Parabolic Grooves on the Behavior of Hydrodynamic Lubrication. Tribol. Trans. 2012, 55, 210–217. [Google Scholar] [CrossRef]
- Wang, H.; Xie, X.; Hua, X.; Yin, B.; Du, H.; Xu, S.; Qiu, B.J. The effect of laser surface texturing to inhibit stick-slip phenomenon in sliding contact. Adv. Mech. Eng. 2019, 11, 1687814019874635. [Google Scholar] [CrossRef]
- He, Y.; Fu, Y.; Wang, H.; Yang, J. Inhibiting mechanism of micro dimples on the stick-slip of sliding guideway: Combined numerical analysis with tribological tests. Tribol. Int. 2021, 162, 107144. [Google Scholar] [CrossRef]
- He, Y.; Fu, Y.; Wang, H.; Yang, J. Enhancing anti-stick-slip performance by laser surface texturing on sliding guideway surface. J. Manuf. Process. 2022, 75, 1089–1099. [Google Scholar] [CrossRef]
- He, Y.; Yang, J.; Wang, H.; Gu, Z.; Fu, Y. Micro-dimple and micro-bulge textures: Influence of surface topography types on stick--slip behavior under starved lubrication. Appl. Surf. Sci. 2022, 585, 152501. [Google Scholar] [CrossRef]
- Fu, Y.; Yang, J.; Wang, H.; He, Y. Effect of laser-textured micro dimples on inhibition of stick-slip phenomenon of sliding guideway. Ind. Lubr. Tribol. 2022, 74, 34–44. [Google Scholar] [CrossRef]
- Zhang, H.; Zhou, T.; Zhou, H.; Chen, Z.; Yang, W.; Ren, L. Effects of different bionic units coupling on the sliding wear of gray cast iron. Surf. Coat. Technol. 2017, 309, 96–105. [Google Scholar] [CrossRef]
- Ji, J.; Dong, B.; Fu, H.; Wang, W.; Zhang, Y. Hydrodynamic lubrication of textured infinitely long slider with cross-hatched texture. Meccanica 2019, 54, 2067–2079. [Google Scholar] [CrossRef]
- Han, H.; Wu, S.; Wu, G.; Fu, Y.; Zhu, W.; Song, C.; Zhang, X. Research on Laser Biomimetic micro texture to improve the friction characteristics of sliding guide. Appl. Laser 2018, 38, 436–441. [Google Scholar]
- Xie, X. Research on Friction Reduction and Anti Creep of Sliding Guide Rail Based on Laser Composite Micro Texture Technology; Jiangsu University: Zhenjiang, China, 2018. [Google Scholar]
- Zhang, D.; Zhao, F.; Gao, F.; Duan, J. Effect of two-layer groove texture on surface lubrication characteristics ofmachine tool guide rail. China Mech. Eng. 2018, 29, 1661–1665. [Google Scholar]
- Zhang, D.; Zhao, F.; Li, Y.; Li, P.; Zeng, Q.; Dong, G. Study on tribological properties of multi-layer surface texture on Babbitt alloys surface. Appl. Surf. Sci. 2016, 390, 540–549. [Google Scholar] [CrossRef]
- Zhu, K.; Jin, J.; Sun, J. Study on lubrication characteristics of parallel slider with surface texture. Metrol. Test. Technol. 2016, 43, 90–92. [Google Scholar]
- Zhang, Y. Study on the Influence of Micro Texture on the Friction and Wear Characteristics of Guide Rail; Shandong University: Jinan, China, 2021. [Google Scholar]
- Fan, Y.; Chen, M.; Hao, M.; Wang, S.; Du, Y.; Xia, J.; Guan, X. Research on the improvement of sliding guide surface creep phenomenon by composite lubrication structure. China Mech. Eng. 2024, 35, 1740–1746+1761. [Google Scholar]
- Yue, H. Study on the Effect of Surface Texture on the Friction and Lubrication Characteristics of Sliding Guide; Shandong University: Jinan, China, 2022. [Google Scholar]
- Chen, C. Research on Anti Creep and Friction Reduction Technology of Laser Micro Texture on Sliding Guide Surface; Jiangsu University: Jinan, China, 2022. [Google Scholar]
- Ahmed, Y.S.; Paiva, J.M.; Arif, A.; Amorim, F.L.; Torres, R.D.; Veldhuis, S. The effect of laser micro-scale textured tools on the tool-chip interface performance and surface integrity during austenitic stainless-steel turning. Appl. Surf. Sci. 2020, 510, 145455. [Google Scholar] [CrossRef]
- Qi, Z.; Chen, X.; Liu, Y.; Wang, L. Optimization of Texture Parameters for Combination Micro textured Cutting Tools. Equip. Mach. 2023, 32–36+52. [Google Scholar]
- Tang, Z.; Liu, S.; Liu, J.; Jiang, S.; Liao, J. Study on the Triboelectric Properties of Composite Micro textured Aluminum Alloy Surface. Lubr. Seal. 2022, 47, 84–91. [Google Scholar]
- Zhang, W. Research on Design and Sealing Performance of Tail Shaft Transmission System of Large Depth AUV Platform; Harbin Engineering University: Harbin, China, 2018. [Google Scholar]
- Wang, X.; Wang, J.; Han, W. Study on friction reduction characteristics of surface micro texture under boundary lubrication. Lubr. Seal. 2007, 36–39. [Google Scholar]
- Yin, B.; Qian, Y.; Dong, F.; Lu, Z. Simulation and experimental study on Tribological Properties of grooved texture. Lubr. Seal. 2012, 37, 9–13. [Google Scholar]
- Dai, J.; Zhang, H.; Zhang, Y.; Hua, X.; Fu, Y. Research on the Low Reynolds Number k–ε Model of Lubrication Field in Trapezoidal Groove Texture Friction Pair. J. Jiangsu Univ. Sci. Technol. (Nat. Sci. Ed.) 2018, 32, 351–356. [Google Scholar]
- Liu, C.; Li, W.; Lu, X.; Zhao, B. Effects of double parabolic profiles with groove textures on the hydrodynamic lubrication performance of journal bearing under steady operating conditions. Mech. Ind. 2020, 21, 301. [Google Scholar] [CrossRef]
- Reynolds, O.I.V. On the theory of lubrication and its application to Mr. Beauchamp tower’sexperiments, including an experimental determination of the viscosity of olive oil. Philos. Ofthe R. Soc. Oflondon 1886, 157–234. [Google Scholar]
- Yu, Y.; Wang, Z. Want golden dragons, etc Multi objective optimization design of micro texture for machine tool sliding guide rails. Aerosp. Manuf. Technol. 2022, 65, 36–44. [Google Scholar]
- Meng, F.M.; Wang, Q.J.; Hua, D.; Liu, J. A simple method to calculate contact factor used in average flow model. J. Tribol. 2010, 132, 483–485. [Google Scholar] [CrossRef]
- Xu, Y.; Zhang, H.; Huang, L.; Qu, R.; Nojima, Y. A Pareto Front grid guided multi-objective evolutionary algorithm. Appl. Soft Comput. 2023, 136, 110095. [Google Scholar] [CrossRef]
- Sun, Y.; Li, J.; Hua, X.; Li, L.; Sun, Y.; Zhu, Y. Simulation study on friction reduction and anti crawling of sliding guide based on laser composite texture technology. Lubr. Seal. 2025, 1, 1–9. [Google Scholar]


Disclaimer/Publisher’s Note: The statements, opinions and data contained in all publications are solely those of the individual author(s) and contributor(s) and not of MDPI and/or the editor(s). MDPI and/or the editor(s) disclaim responsibility for any injury to people or property resulting from any ideas, methods, instructions or products referred to in the content. |
© 2025 by the authors. Licensee MDPI, Basel, Switzerland. This article is an open access article distributed under the terms and conditions of the Creative Commons Attribution (CC BY) license (https://creativecommons.org/licenses/by/4.0/).