Abstract
In slurry shield tunneling projects, leakage from floating seals frequently leads to abnormal failures of disc cutters. To investigate the leakage characteristics at the floating seal end faces of the cutters, a numerical method is proposed for analyzing the dynamic leakage behavior of the floating seal end faces, considering the effects of wear. The elastohydrodynamic lubrication problem of the floating seal was addressed using the Reynolds equation and the slicing method, leading to the development of a computational model for the pressure and thickness distribution of the oil film on rough surfaces. Based on the Archard wear equation, a dynamic surface roughness model considering wear was established. Furthermore, a numerical model for dynamic leakage of the floating seal end faces in shield machine cutters, incorporating wear effects, was developed. Simulated friction and wear tests of the floating seal end faces, along with cutter seal leakage experiments, were conducted for validation. The results demonstrate that the dynamic surface roughness model considering wear can effectively predict the roughness evolution of worn surfaces. The trend of the theoretical leakage rate is generally consistent with that of the experimental results, verifying the effectiveness of the proposed model.
1. Introduction
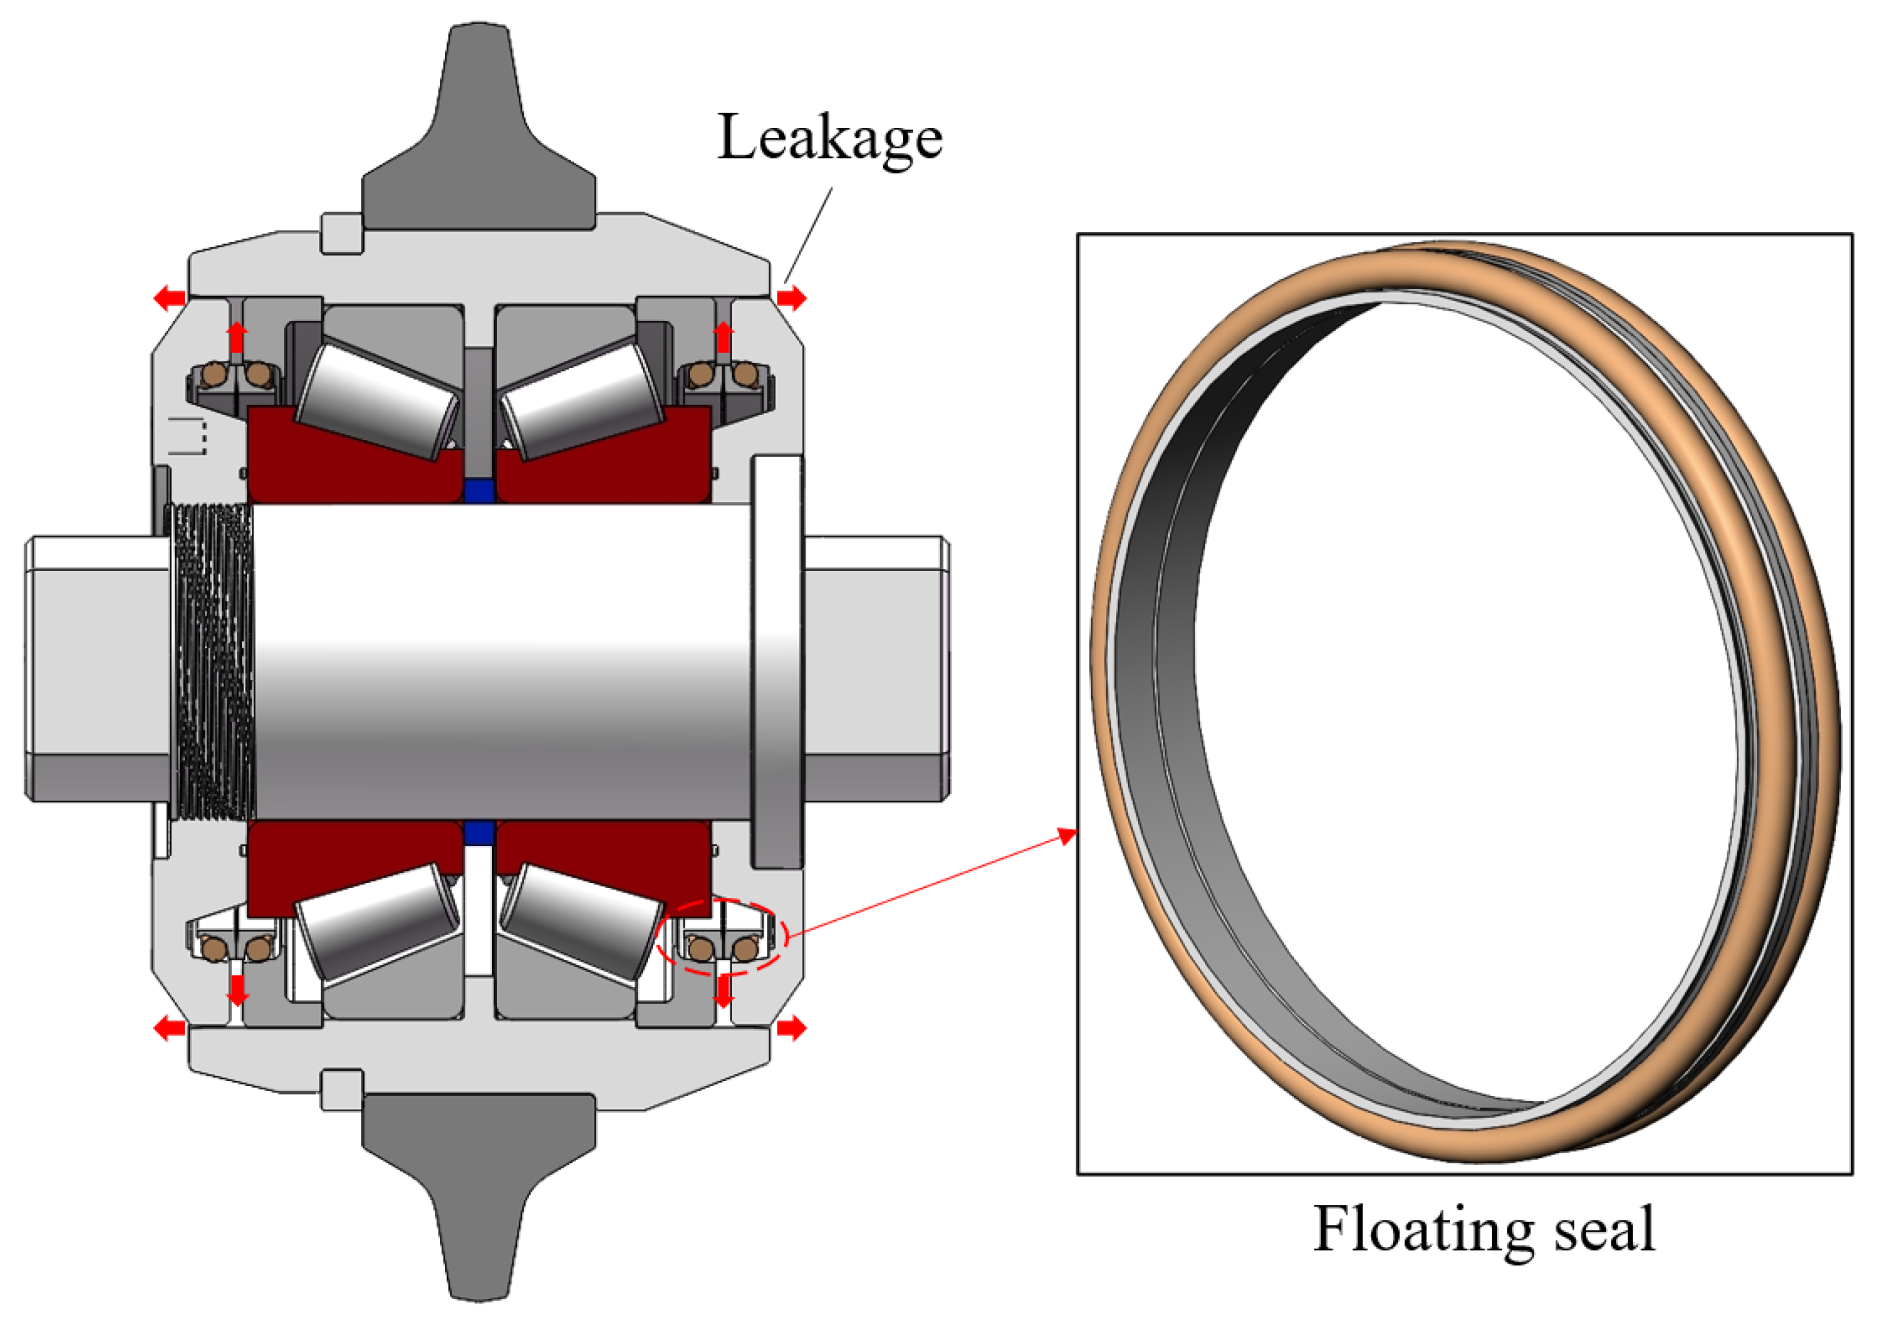
The cutter is a consumable component of the tunnel boring machine, and its performance directly determines the construction efficiency and cost of the project [1,2,3]. Abnormal failures such as seal failure, cutter ring fracture, and uneven wear of the cutter ring significantly reduce the service performance of cutters [4,5,6]. In particular, excessive seal leakage is one of the main abnormal failure modes of cutters in slurry shield tunneling projects [7]. Increased leakage leads to greater contamination of the internal lubricant, which in turn degrades the performance and service life of bearings and other components. Compared with other static seals, floating seal leakage is the dominant form of cutter leakage, as shown in Figure 1. In practice, the replacement of lubricant is often determined empirically, making it difficult to accurately identify the optimal replacement timing. Replacing it too early results in resource waste, while replacing it too late may lead to bearing failure and other abnormal issues. Therefore, the study of floating seal leakage characteristics provides essential theoretical support and engineering guidance for enhancing cutter sealing performance and optimizing lubricant replacement strategies.

Figure 1.
Schematic of the cutter cross-section and floating seal leakage. The short and thick arrows indicate the leakage channels of the lubricating oil for the floating seal of the cutter. The slender arrow indicates that the floating seal is pulled out and enlarged.
At present, research on floating seal leakage is mainly conducted through experimental testing and theoretical modeling. Ha [8] conducted a comparative study on the leakage characteristics of planar seals, labyrinth seals, and floating ring seals using both experiments and CFD analysis, and found that the floating ring seal exhibited superior performance. Li [9] investigated the sealing capabilities of floating ring seals and labyrinth seals under cold and hot conditions through rotational experiments, concluding that floating ring seals outperform labyrinth seals in terms of leakage resistance. Hu [10] proposed a mechanism and computational method for analyzing variations in the working clearance and operating conditions of sealing chambers, revealing the correlation between operating conditions and the leakage characteristics of floating ring seals. A large number of studies have established steady-state theoretical models of floating seal leakage based on the Reynolds equation [11,12,13], which clearly provides a reliable theoretical foundation for modeling floating seal leakage.
In addition, the texture of the sealing end face has a significant impact on the performance of floating seals [14]. Lee [15] conducted experimental comparative analyses of floating ring seals with smooth surfaces and circular groove patterns, and identified relevant design parameters based on the results. He [11] found that surface textures with appropriate roughness can significantly improve the sealing performance of floating ring seals. Lebeck [16] considered the influence of surface roughness on end-face morphology and developed spatial leakage gap models for an annular surface with a perfect sinusoidal wave and for an ideal planar surface. Zhao [17] used the W-M fractal function to characterize tooth surface profiles and investigated the effect of randomly rough surfaces on gear meshing contact, proposing a theoretical method that combines the analytical slicing method with a two-dimensional elastohydrodynamic lubrication model. Wu [18] proposed a micro-contact thermodynamic model to study the interface characteristics of wet friction pairs, established a mixed lubrication model of end faces with Gaussian-distributed surface roughness, and introduced a simplified Reynolds equation to describe the film characteristics in the solid contact region. All of the above studies were conducted under fixed surface roughness conditions and did not account for the effects of roughness evolution on floating seal leakage. However, due to wear, the surface roughness of floating seals changes over time during service. As a result, current models fail to reliably evaluate the leakage performance of floating seals throughout their operational lifespan.
The frictional conditions of floating seal end faces are similar to those of conventional mechanical seals. The Archard adhesive wear model is one of the most widely used models for analyzing wear on mechanical seal end faces. Huang [19] numerically assessed the potential leakage risk of rotary lip seals based on elastohydrodynamic analysis and a modified Archard wear model. Ni [20] validated the fractal model of mechanical seal end faces using the traditional Archard model. Sapozhnykov [21] investigated seal wear mechanisms using ANSYS software with the built-in Archard model. Huang [22] embedded a modified Archard model into finite element software to evaluate the wear volume of seals. A substantial body of research has demonstrated that the Archard model can effectively predict and evaluate wear on seal end faces [23,24]. However, the relationship between wear volume and surface roughness on the sealing end face remains to be further explored.
To investigate the effect of end-face wear on the leakage characteristics of floating seals in shield machine cutters, a leakage rate model and a rough surface characterization model were established. The elastohydrodynamic lubrication problem of the floating seal was addressed using the Reynolds equation and the slicing method, resulting in a computational model for the pressure and thickness distribution of the oil film on rough surfaces. Based on Archard adhesive wear theory, a dynamic surface roughness model considering wear was developed. Building upon these theoretical models, a numerical model was established to analyze the dynamic leakage behavior of floating seal end faces in shield machine cutters with wear taken into account. Through experiments and numerical analyses, the constant parameters of the roughness evolution model were calibrated, the leakage characteristics of the floating seal were analyzed, and the validity of the proposed model was verified. This theoretical framework enables accurate prediction of lubricant leakage under operating conditions, facilitates optimized lubricant replacement strategies, and provides a solid foundation for enhancing the sealing performance of floating seals, which can effectively reduce the risk of abnormal cutter failure.
2. Establishment of the Theoretical Models
2.1. Leakage Rate Model of the Floating Seal End Face
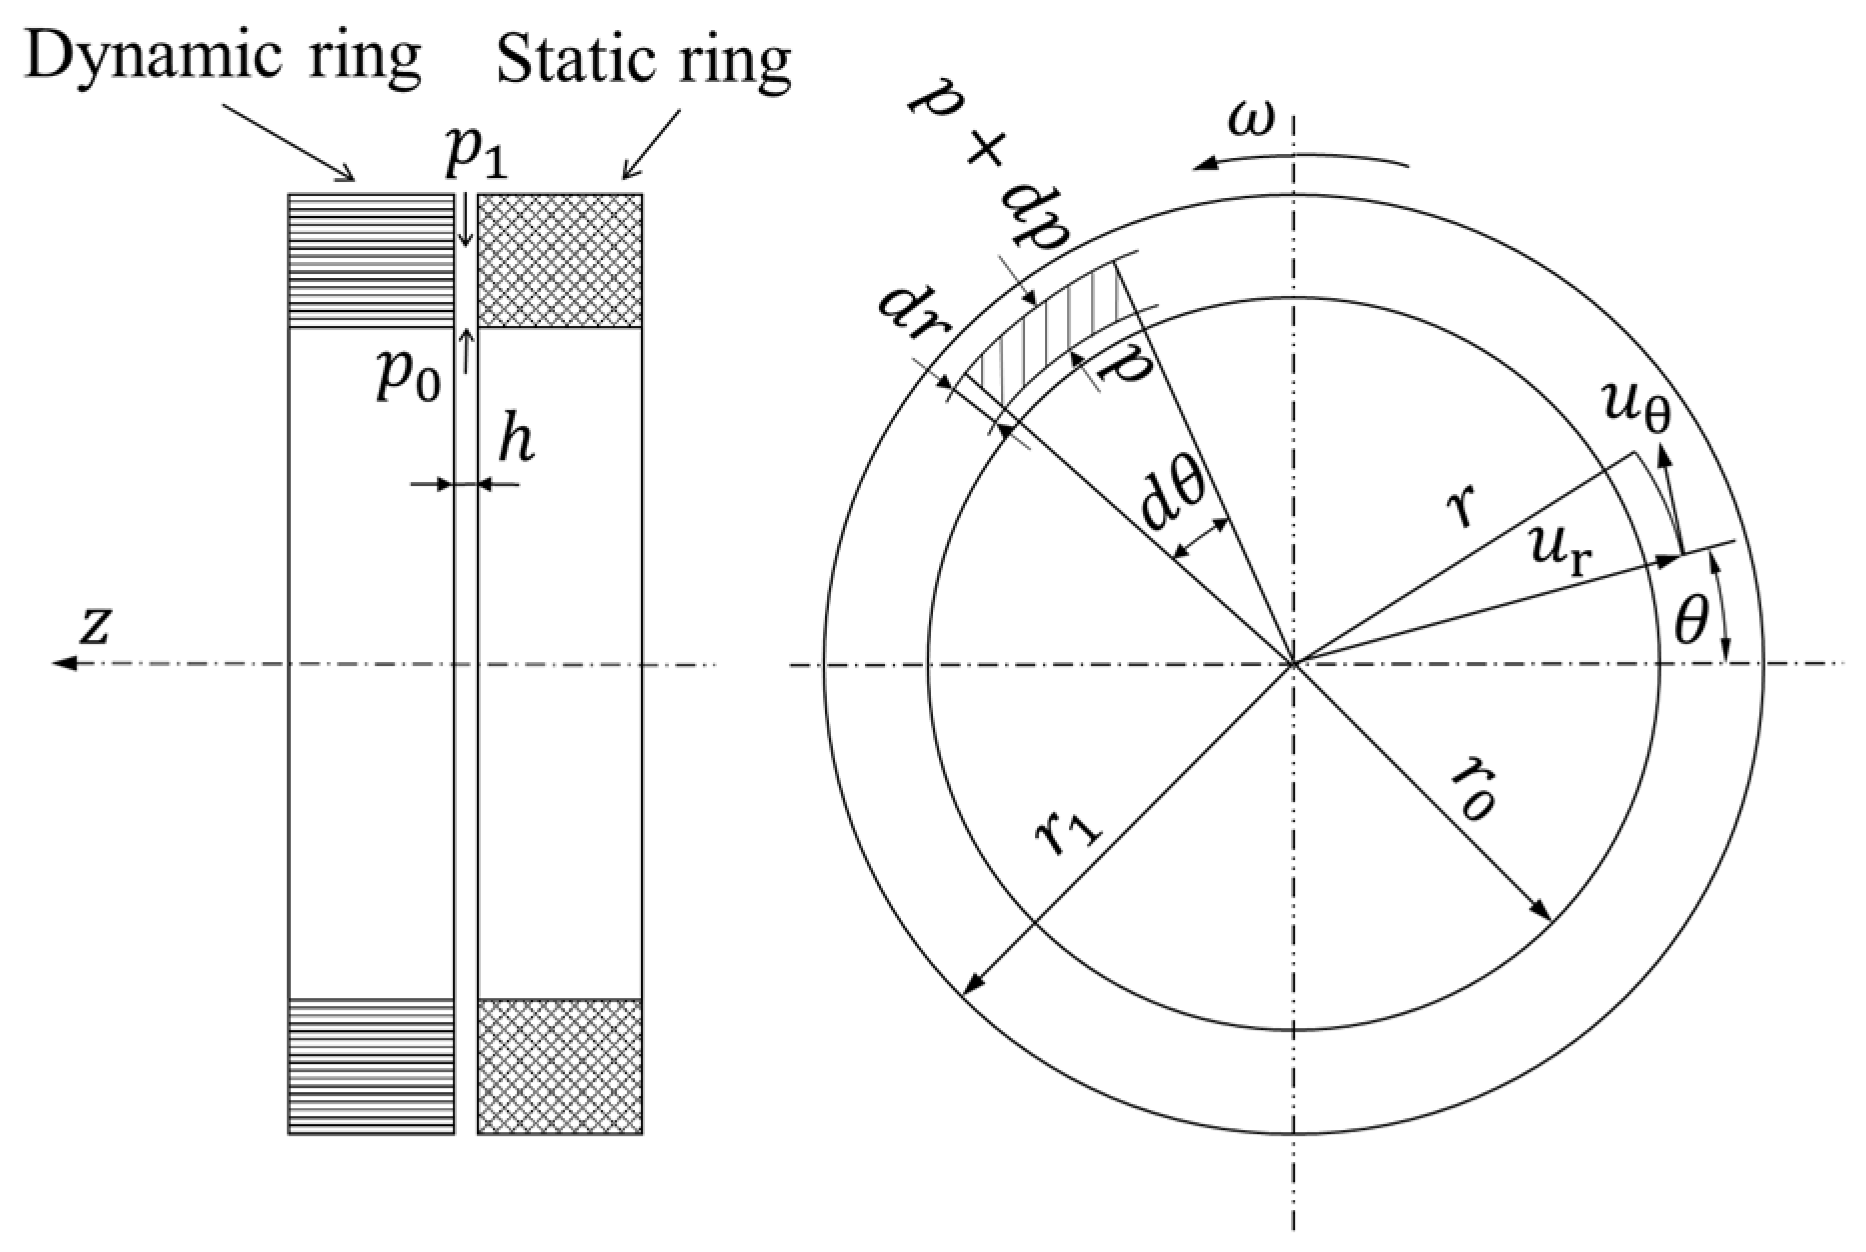
The sealing end face of a floating ring seal consists of two mating metal floating rings. Under normal operating conditions, the dynamic ring rotates while the static ring remains fixed. During assembly, lubricant is applied to the contact surfaces of the floating rings. As the dynamic ring rotates, the relative motion between the two contact surfaces draws lubricant from inside the cutter into the sealing interface. Therefore, in actual operation, a viscous lubricating oil film is formed between the contact surfaces of the floating seal.
A cylindrical coordinate system is adopted to represent the flow parameters on the floating seal end face, as shown in Figure 2. This cylindrical coordinate system consists of the radial distance , angular position , and the axial direction . The variables and denote the radial and tangential velocity components, respectively.
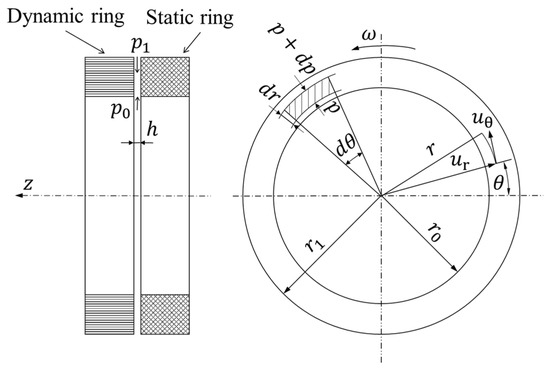
Figure 2.
End face clearance flow model between rotating and stationary rings.
The radial velocity component of a fluid element in the oil film along the r direction is given by:
The tangential velocity is:
where , , , and represent the lubricant viscosity, oil film pressure, film thickness, and relative rotational speed, respectively. The leakage on the floating seal end face is related to the radial velocity component. By integrating along the direction, the radial volumetric flow rate per unit width can be obtained, which represents the fluid flow through a unit cross-section with a height of and a width of 1.
Consequently, the end-face leakage rate is derived through integration as follows:
By combining Equations (1), (3), and (4), the general form of the end-face leakage rate can be obtained as:
When the sealing end faces are two parallel smooth surfaces, the film thickness is constant. For rough surfaces, the roughness effect can be accounted for by using an average film thickness in the calculations. Patir and Cheng introduced the pressure flow factor into the study of lubrication effects on rough surfaces and developed the average flow model [25]. The pressure flow factor can be expressed as follows:
where represents the average fluid flow rate over the actual rough surface, while denotes the corresponding average flow rate over a smooth surface. The pressure flow factor equations for various anisotropic surfaces are given as:
where denotes the average film thickness of the rough surface, . is the number of discrete points on the rough end face of the floating seal. The equivalent surface roughness is defined as , where and represent the surface roughness of the rotating and stationary sealing end faces, respectively. This approach effectively models the two rough mating surfaces as an equivalent combination of a rough surface and a smooth surface. The leakage rate of the rough sealing surface in the floating seal is given by:
The critical challenge in solving the leakage rate model is to develop an accurate mathematical representation of the rough surface topography and to compute the corresponding film thickness and pressure distribution.
2.2. Characterization Model of Rough Surface
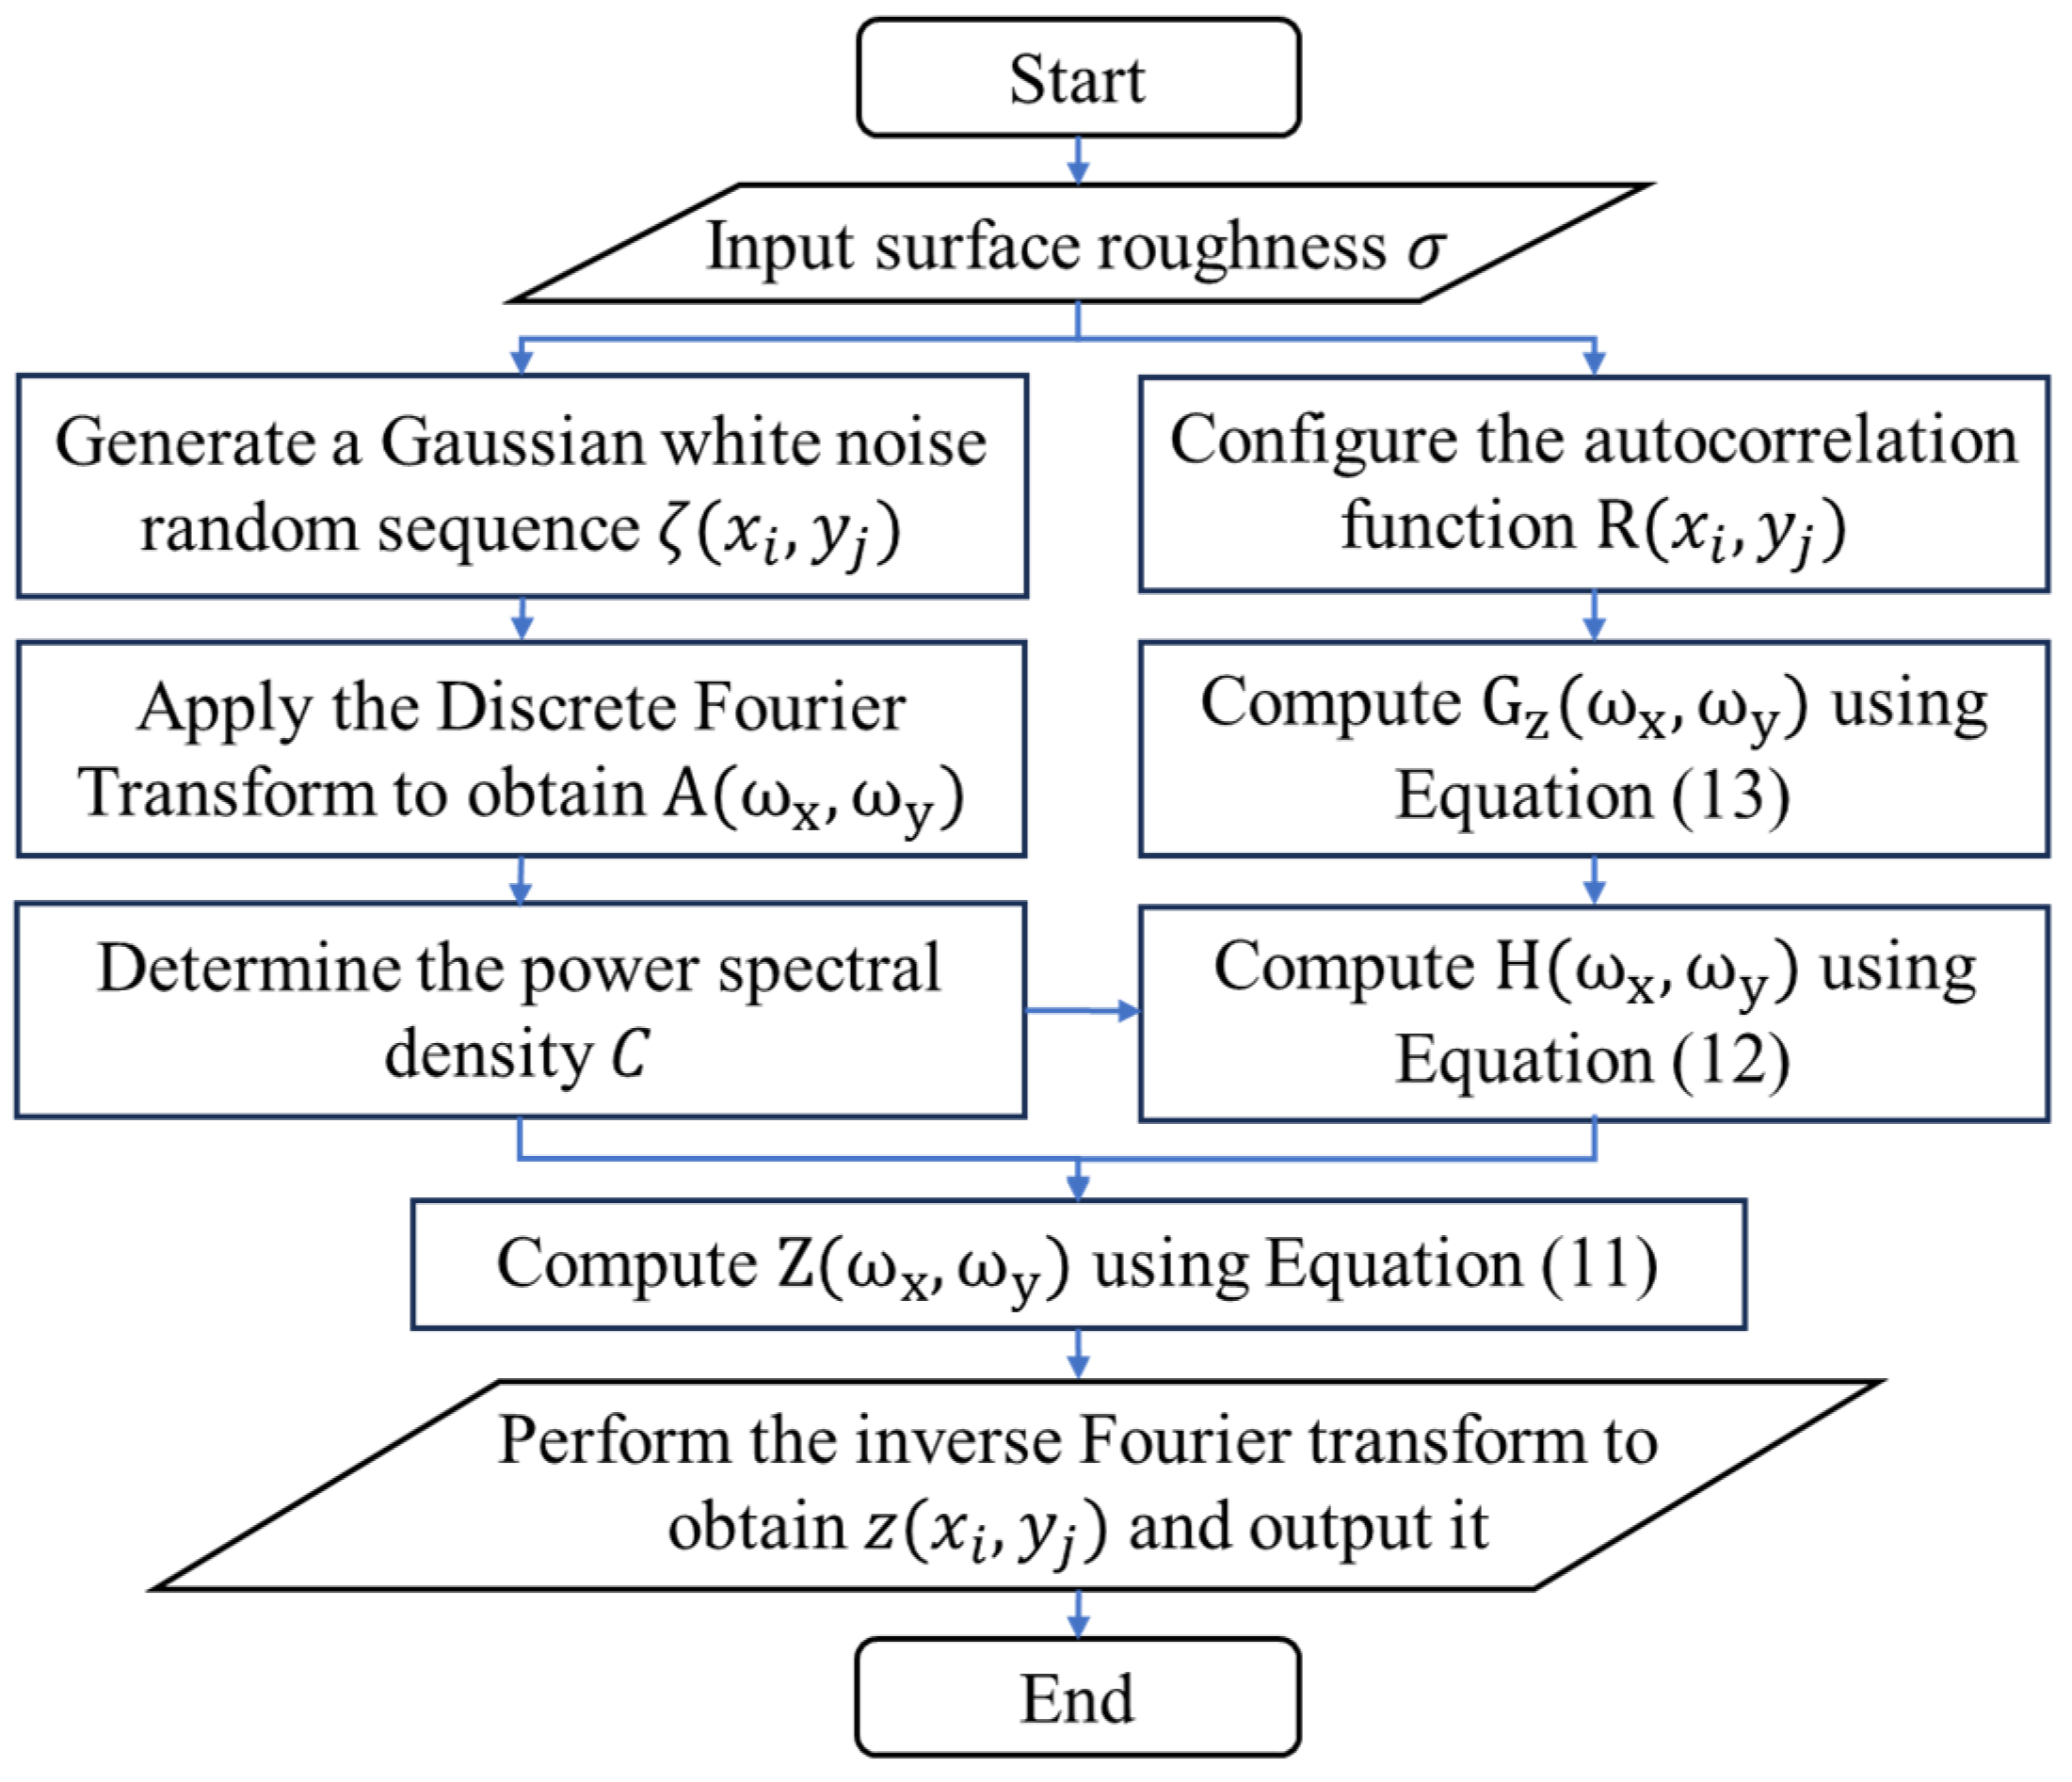
Numerous studies have found that the peak heights of metal surface roughness approximately follow a Gaussian distribution, and can be generated using computer simulation methods based on stochastic processes and time series models [26,27,28]. In this section, digital filtering techniques are employed to construct random rough surfaces with specified parameters. The root mean square of surface height is used as the characteristic parameter to quantify surface roughness.
In engineering applications, the measured surface roughness is typically obtained through digital sampling, resulting in a discretized random process. The fundamental principle of the digital filtering method is to treat any given surface profile as a set of discrete random height values , which are generated as an output sequence controlled by an input sequence and a frequency response function. For an arbitrary random process , a corresponding random surface profile can be obtained by applying a two-dimensional digital filtering function , as expressed by:
The result obtained through the Fourier transform is given by:
where is the discrete Fourier transform of the input sequence . is the discrete Fourier transform of the filter function , also referred to as the system transfer function.
The relationship between the power spectral density of the output sequence and the transfer function is given by:
where the constant denotes the power spectral density of the input random sequence, which is assumed to follow a Gaussian distribution.
For the majority of machined surfaces, the autocorrelation function typically follows an exponential form, as given in [28]:
where and represent the autocorrelation lengths of the rough surface in the and directions, respectively. These values correspond to the boundary distances at which the autocorrelation function decays to a specified level, indicating the rate of decline. The solution process for characterizing a Gaussian random rough surface is illustrated in Figure 3.
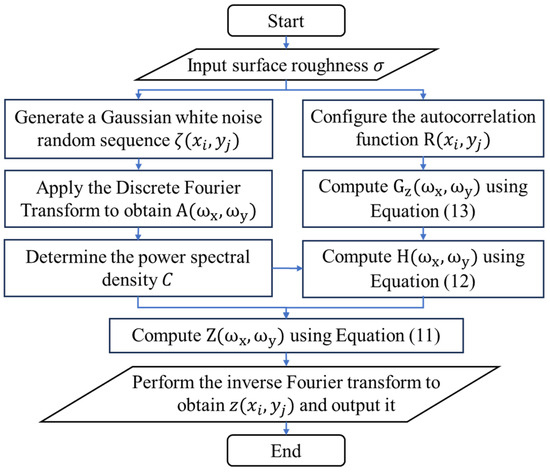
Figure 3.
Solution flowchart of the rough surface characterization model.
2.3. Oil Film Pressure and Thickness Distribution Model for Rough Surfaces
An elastohydrodynamic lubrication model of the floating seal end face is established using the slicing method, as illustrated in Figure 4. The sealing end face is circumferentially divided into differential elements. Since is sufficiently small, each element can be approximated as a rectangle, with a tangential length defined as , where is the inner radius of the sealing end face. Each differential element is further divided into slices. The pressure at the centerline of the -th slice, indicated in red, is used to represent the oil film pressure . The slice width is related to the discretization level of the rough surface characterization model, and the red centerline aligns with the discrete point positions defined in the model. The width is defined as , where is the outer radius of the sealing end face. Through the slicing method, the two-dimensional problem of oil film pressure and thickness is converted into a one-dimensional problem for simplified computation.
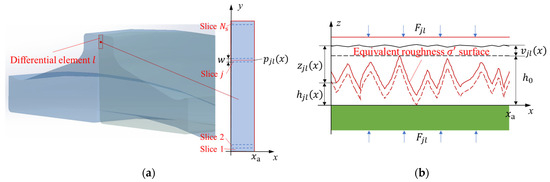
Figure 4.
(a) Schematic of the sliced elastohydrodynamic lubrication model; (b) schematic of oil film thickness in the sliced cross-section.
Assuming that the lubricant is isothermal, has constant viscosity, and behaves as an ideal liquid, and that the solid is isotropic, the oil film pressure is uniform along the thickness direction. The relative slip between the solid and the lubricant at the interface is neglected. Under these assumptions, the oil film pressure on the sealing end face can be obtained using the classical one-dimensional Reynolds equation [29]:
where is the density of the lubricant, is the lubricant viscosity. And is the relative sliding velocity, given by , where is the rotational speed of the rotating ring. denotes the oil film pressure, and is the film thickness. In the context of floating seals, the second term on the right-hand side of the Reynolds equation primarily accounts for the vertical (normal) motion between the end faces. During normal operation, the rotating and stationary rings of the floating seal remain in continuous contact under pressure. When no wear occurs, it can be assumed that there is no relative vertical motion between the sealing end faces. As a result, the Reynolds equation can be simplified as follows:
The solid contact region is solved using the simplified form of the Reynolds equation, as given in [30]:
The oil film thickness, as illustrated in Figure 4, is expressed as:
where represents the elastic deformation term, and denotes the roughness height of the equivalent rough surface. The surface deformation caused by the normal load distribution acting on a semi-infinite plane is given by [17]:
where is the equivalent elastic modulus. The influence of pressure and temperature on the viscosity [31] and density [32] of lubricant is considered as follows:
where is the lubricant viscosity at room temperature, and is the pressure–viscosity index, taken as 0.68. denotes the oil film temperature in the steady state of the floating seal, while is the ambient temperature. represents the lubricant density under standard temperature and pressure, and is the thermal expansion coefficient.
The load equilibrium equation for the slice can be expressed as:
where represents the external load acting on the -th slice of the -th differential element. is the load acting perpendicular to the floating seal end face, which is primarily generated by the deformation of the O-ring.
2.4. Dynamic Evolution Model of Surface Roughness Under Wear
In this section, the Archard adhesive wear theory is employed to establish the wear rate of the floating seal end face. The volumetric wear rate per unit of time is given by [33]:
where is the wear coefficient, and is the hardness of the floating seal end face. In Section 4.1, an oil-lubricated pin-on-disk wear test is conducted, and the experimental data are used to fit Equation (23) to determine the value of the constant parameter .
Numerous studies have shown that within a relatively low surface roughness range, material wear increases with increasing roughness [34,35,36]. In other words, higher surface roughness intensifies wear. The initial surface roughness of floating seal end faces is typically around 0.2 μm, and wear tests have confirmed that the floating seal material follows this trend. As the floating seal wears, the wear depth directly alters the height distribution of the rough surface, indicating that wear depth has a decisive influence on surface roughness. Therefore, an exponential model is established to fit the relationship between wear depth and surface roughness.
where denotes the initial surface roughness before wear, is the wear duration, is the wear correction coefficient, is the time-dependent coefficient, and is the sampling area used for calculating surface roughness. In Section 4.1, the surface roughness of the specimen was measured after the wear test, and the resulting data were used to fit Equation (24) to determine the constant parameters and .
3. Numerical Solution Method
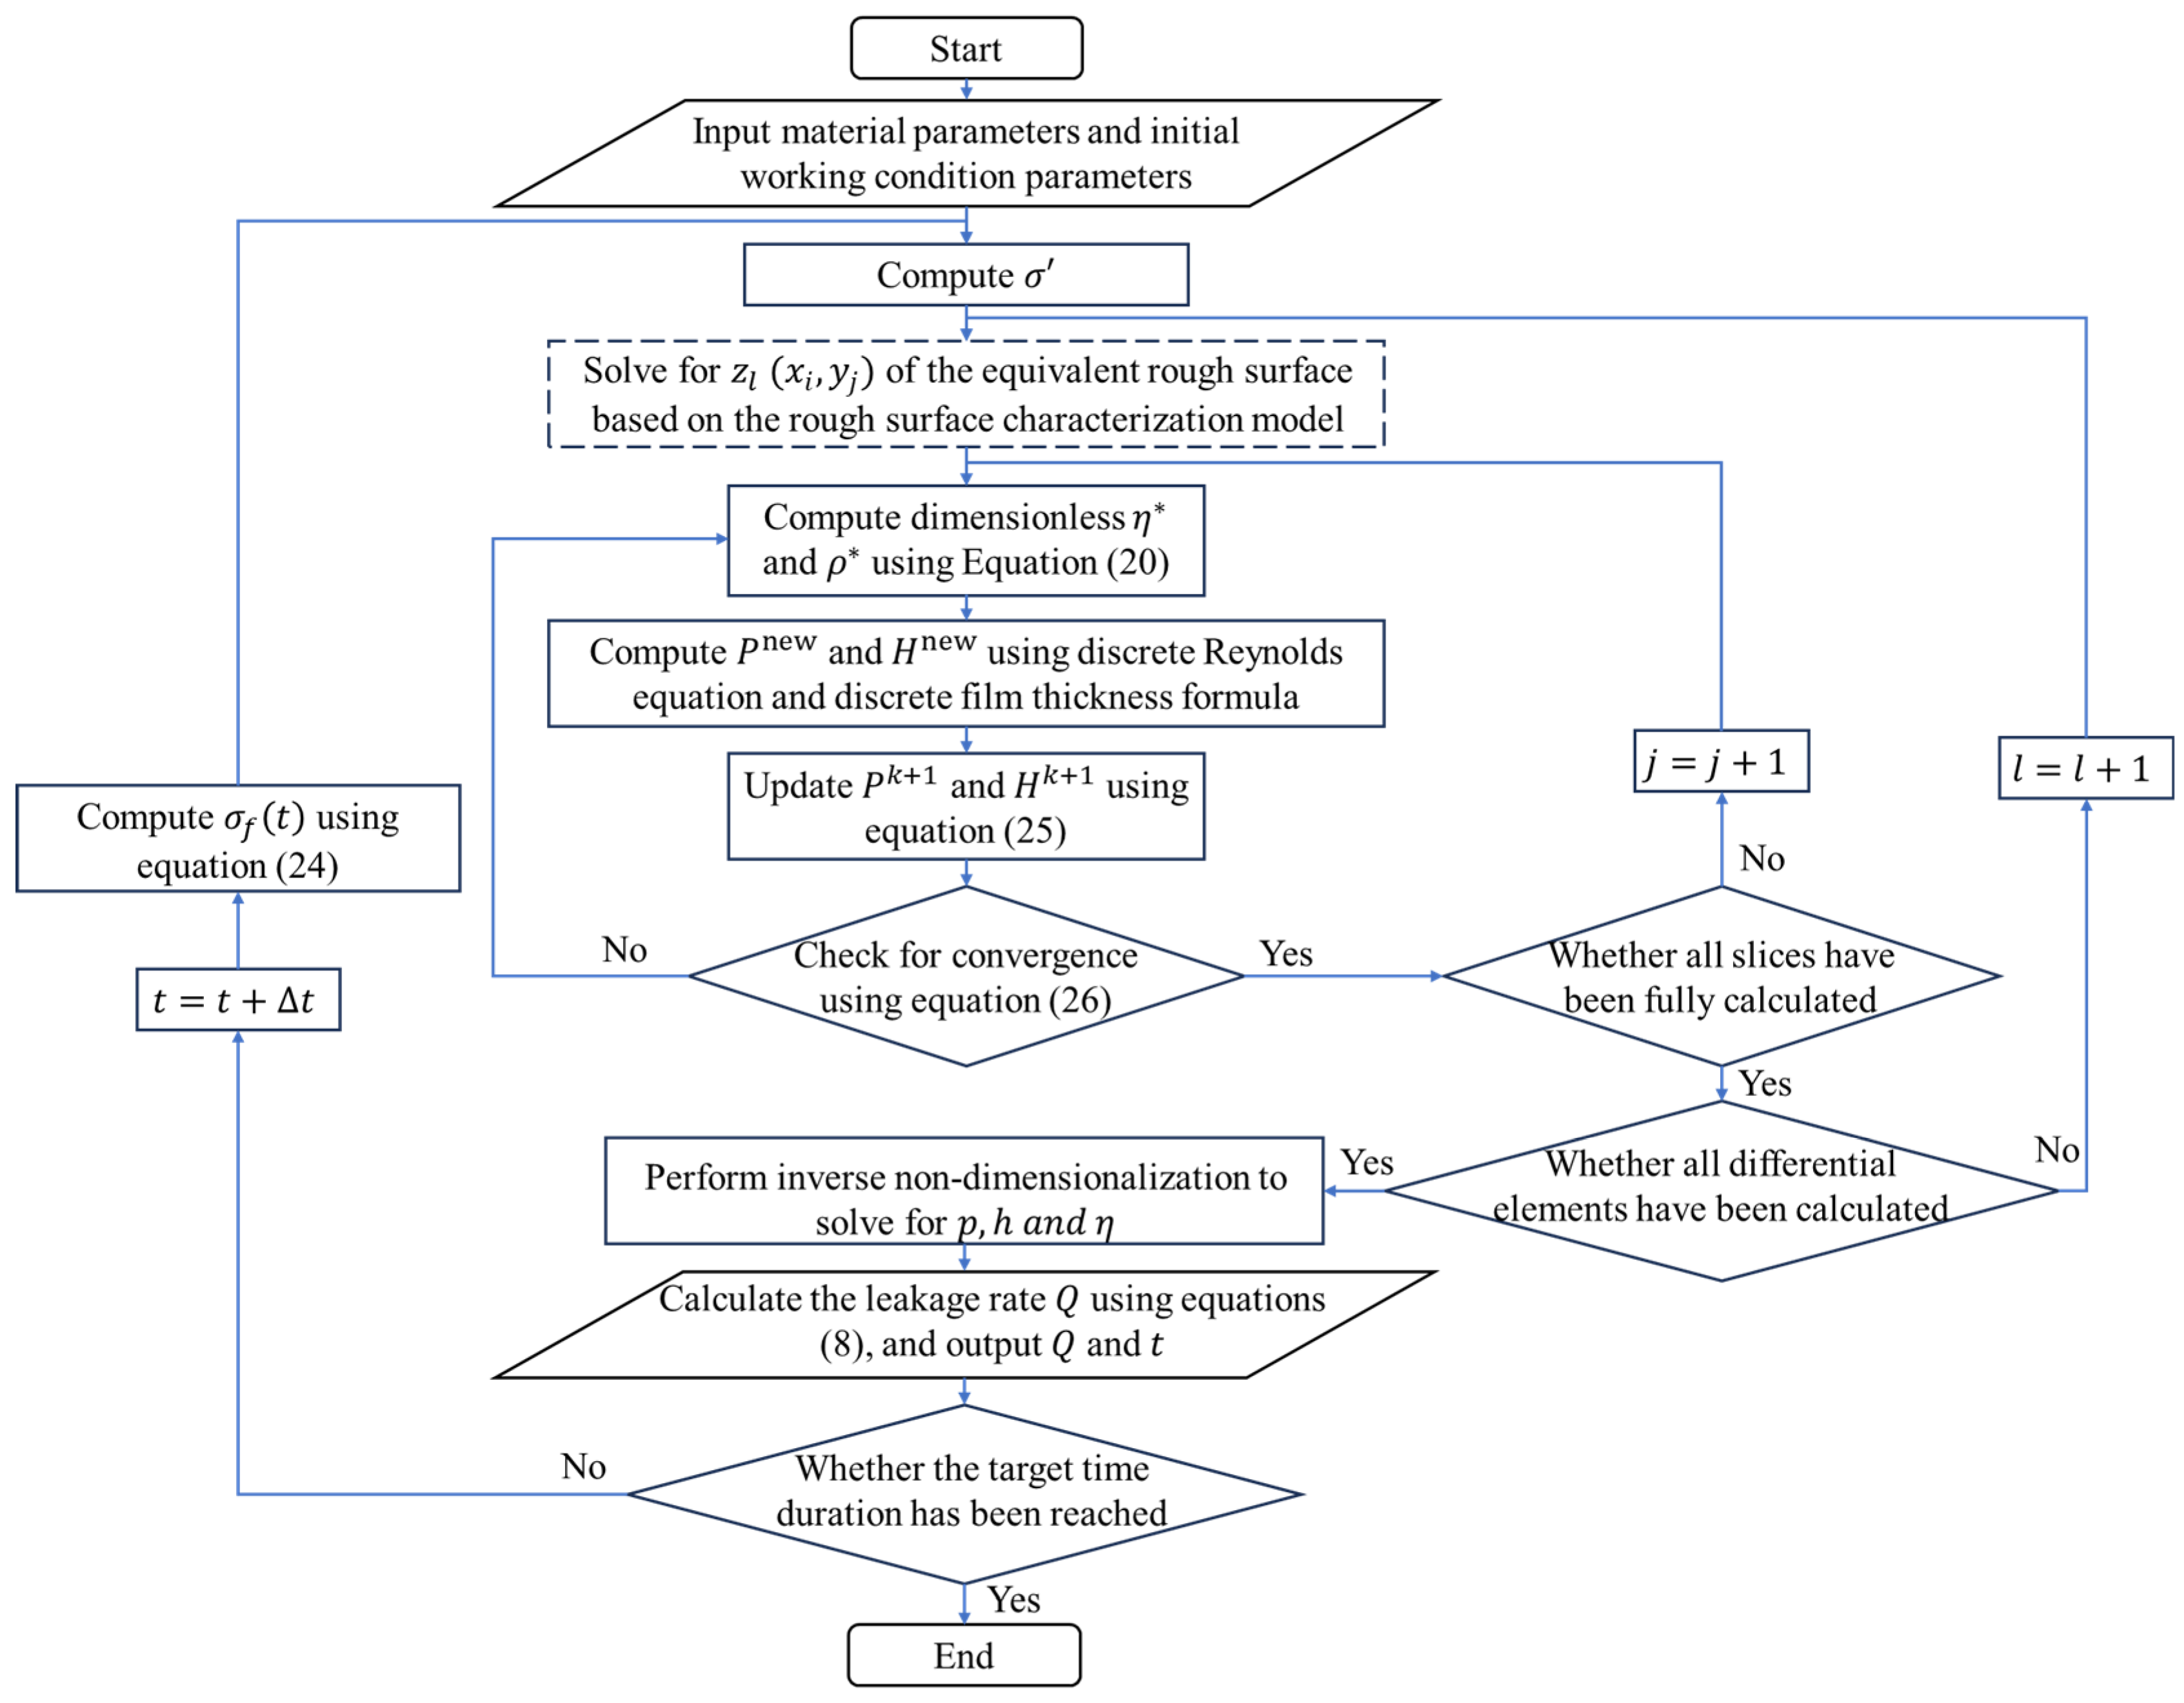
In solving the Reynolds equation, the finite difference numerical method is commonly used to approximate the optimal solution. To enhance computational stability, a nondimensionalization process is first applied. This is followed by meshing and discretization, and the Gauss–Seidel relaxation iteration method is employed to obtain an approximate solution. The mesh nodes are aligned with the discrete points of the rough surface characterization model, where . As shown in Figure 5, based on the given material and operating parameters, the equivalent surface roughness of the floating seal end face is first calculated. The rough surface characterization model is then used to compute the roughness height distribution of the -th differential element. The Reynolds equation is solved iteratively across all slices to obtain the pressure and thickness distribution of the lubricant film. The nondimensional variables are subsequently converted back to obtain the actual pressure, thickness, and viscosity distributions of the lubricant. Subsequently, the leakage rate of the floating seal at time is calculated using Equation (8). This process is repeated for all time steps to obtain the time-varying leakage behavior.
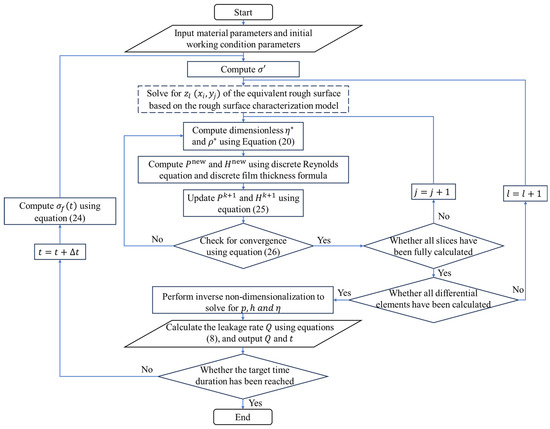
Figure 5.
Flowchart of the numerical simulation process.
The oil film pressure and film thickness are updated using the following iterative expressions:
where and denote the relaxation factors for pressure and film thickness, respectively. The convergence criterion for the discretized Reynolds equation is defined as:
4. Model Validation and Discussion
4.1. Calibration Experimental for the Dynamic Surface Roughness Model Considering Wear
4.1.1. Experimental Setup
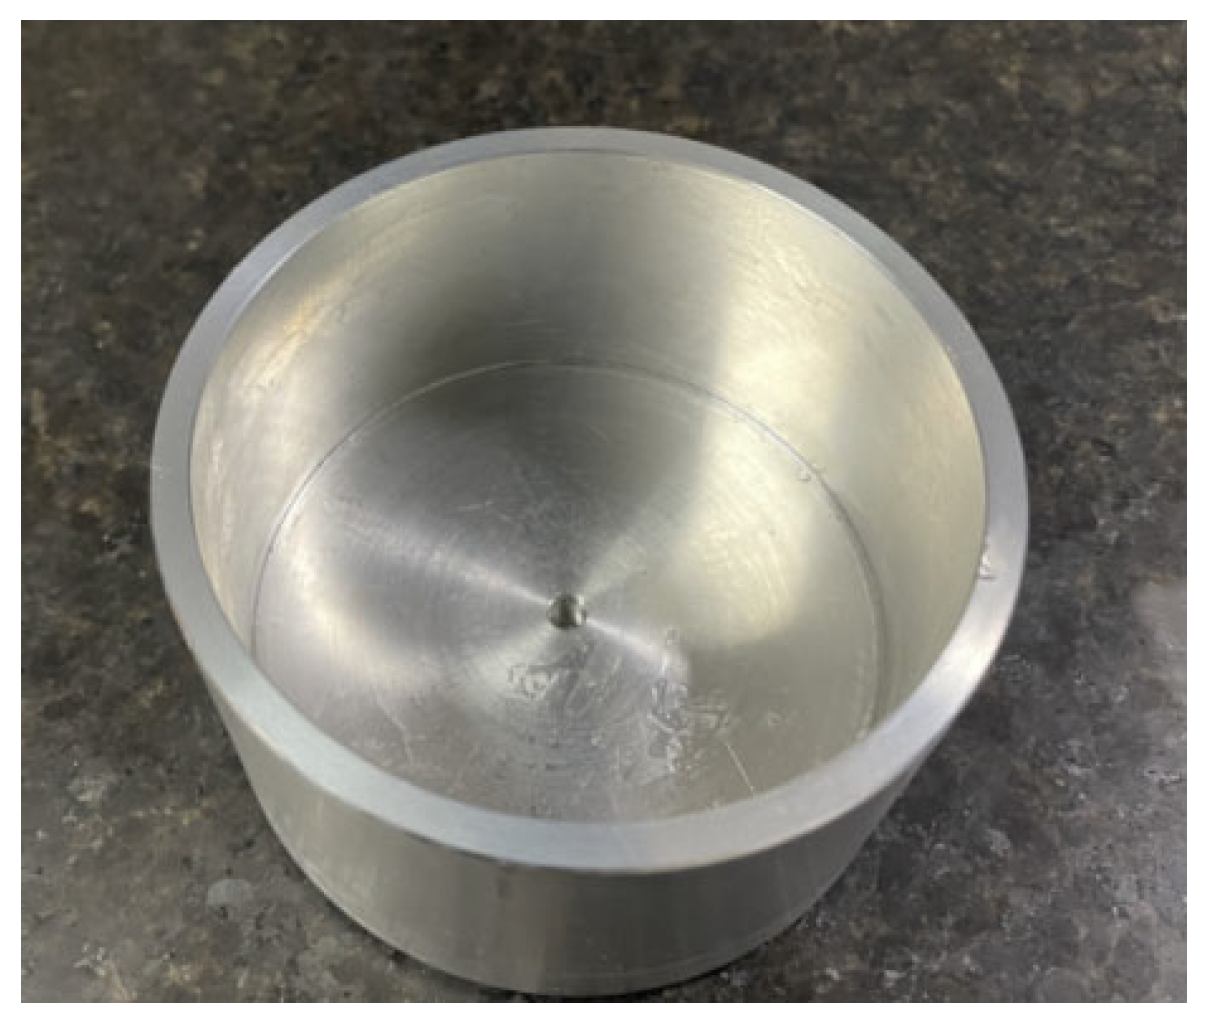
The material of the floating seal metal ring is 15CrMo steel. A CSM tribometer was used to investigate the wear characteristics of a 15CrMo steel–15CrMo steel contact pair. To simulate mixed lubrication conditions, a custom oil-retaining fixture was designed, as shown in Figure 6, ensuring that the disc and specimen remained continuously lubricated throughout the friction process. The lubricant used was Shell 460, the same type applied in cutters. The rotational speed was determined based on the size of the friction disc and the cutter’s maximum speed in actual engineering applications. The applied load was calculated based on the contact area of the specimen and the specific pressure on the floating seal end face. The initial temperature was set to room temperature. The detailed experimental parameters are listed in Table 1.

Figure 6.
Lubrication fixture.

Table 1.
Bearing material parameters.
- Archard model calibration experimental setup
A total of four groups of experiments were conducted. Group A served as the calibration test, aiming to determine the wear coefficient of the floating ring material. Groups B, C, and D were verification tests under different pressure conditions to validate the Archard model. The experimental conditions for each group are listed in Table 2. Before the test, the mass of each friction block was measured using a TE214S electronic balance with an accuracy of 0.1 mg. After a specified wear period, the specimen was removed and weighed again. The difference between the two measurements was recorded as the wear mass. Based on the material density of 7.85 g/cm3, the wear volume was calculated. By repeating this process, the wear volume curve of the friction block over time was obtained.
Table 2.
Test conditions for friction and wear experiments.
- Wear depth and surface roughness experimental setup
Using the experimental parameters of Group A, the wear volume and surface roughness were measured every 40 min until a total wear duration of 240 min was reached. The surface roughness of the worn specimens in the accelerated wear test was measured using a JB-1C surface profilometer, with a measurement accuracy of 0.005 μm. To ensure accuracy and scientific validity, measurements were taken every 30° along the circumferential direction of the friction disc. Each measurement started from the inner diameter of the worn track, with a radial sampling length of 0.25 mm and a total measurement length of 2.5 mm. The average surface roughness was then calculated based on the values obtained at different angular positions.
4.1.2. Results and Discussion
- Archard model calibration
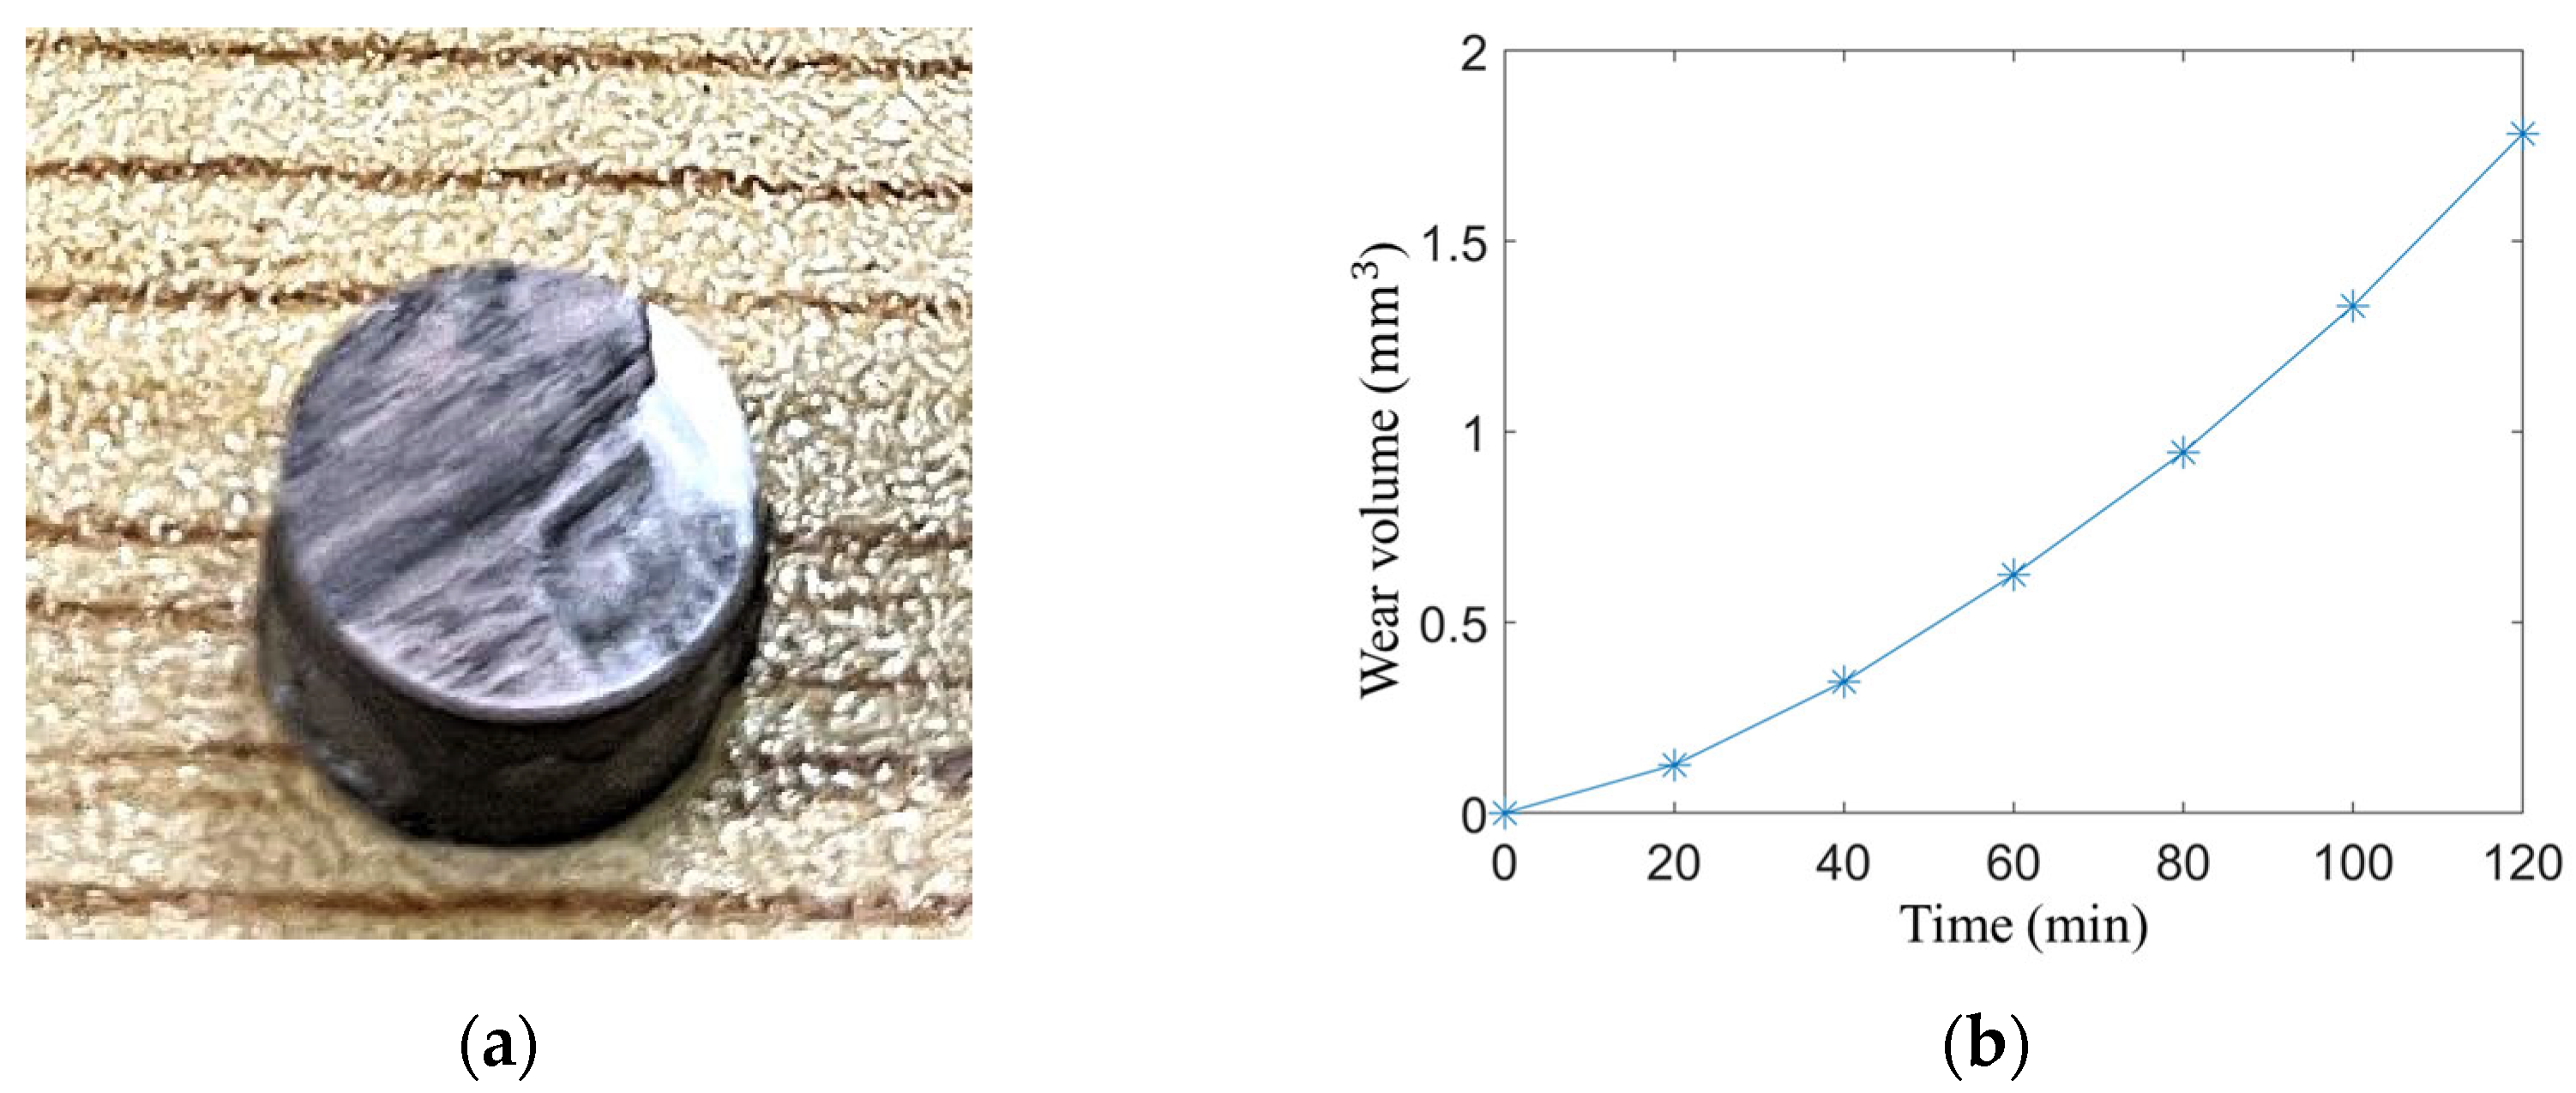
The wear results of the Group A specimen are shown in Figure 7. It can be observed that after a certain period of wear, noticeable wear debris appeared on the surface, and the originally smooth surface exhibited increased roughness. This indicates that when the machining accuracy of two metallic contact surfaces is high, the predominant wear mechanism tends to be adhesive wear. The adhesion between metal surfaces leads to an increase in roughness rather than a reduction. As the surface roughness increases, the volumetric wear rate correspondingly increases, leading to a rapid growth in average wear depth. Hence, an exponential function is well-suited for capturing the relationship between wear depth and surface roughness. Based on the values obtained from the wear volume curve, the average volumetric wear rate was calculated and substituted into Equation (23), yielding a wear coefficient of .
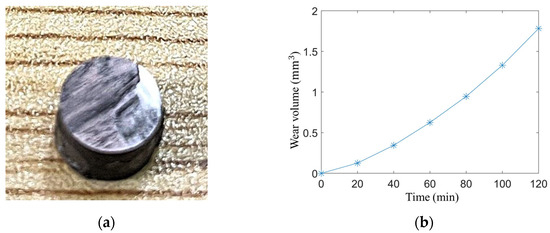
Figure 7.
(a) Surface wear morphology; (b) corresponding wear volume curve for group A.
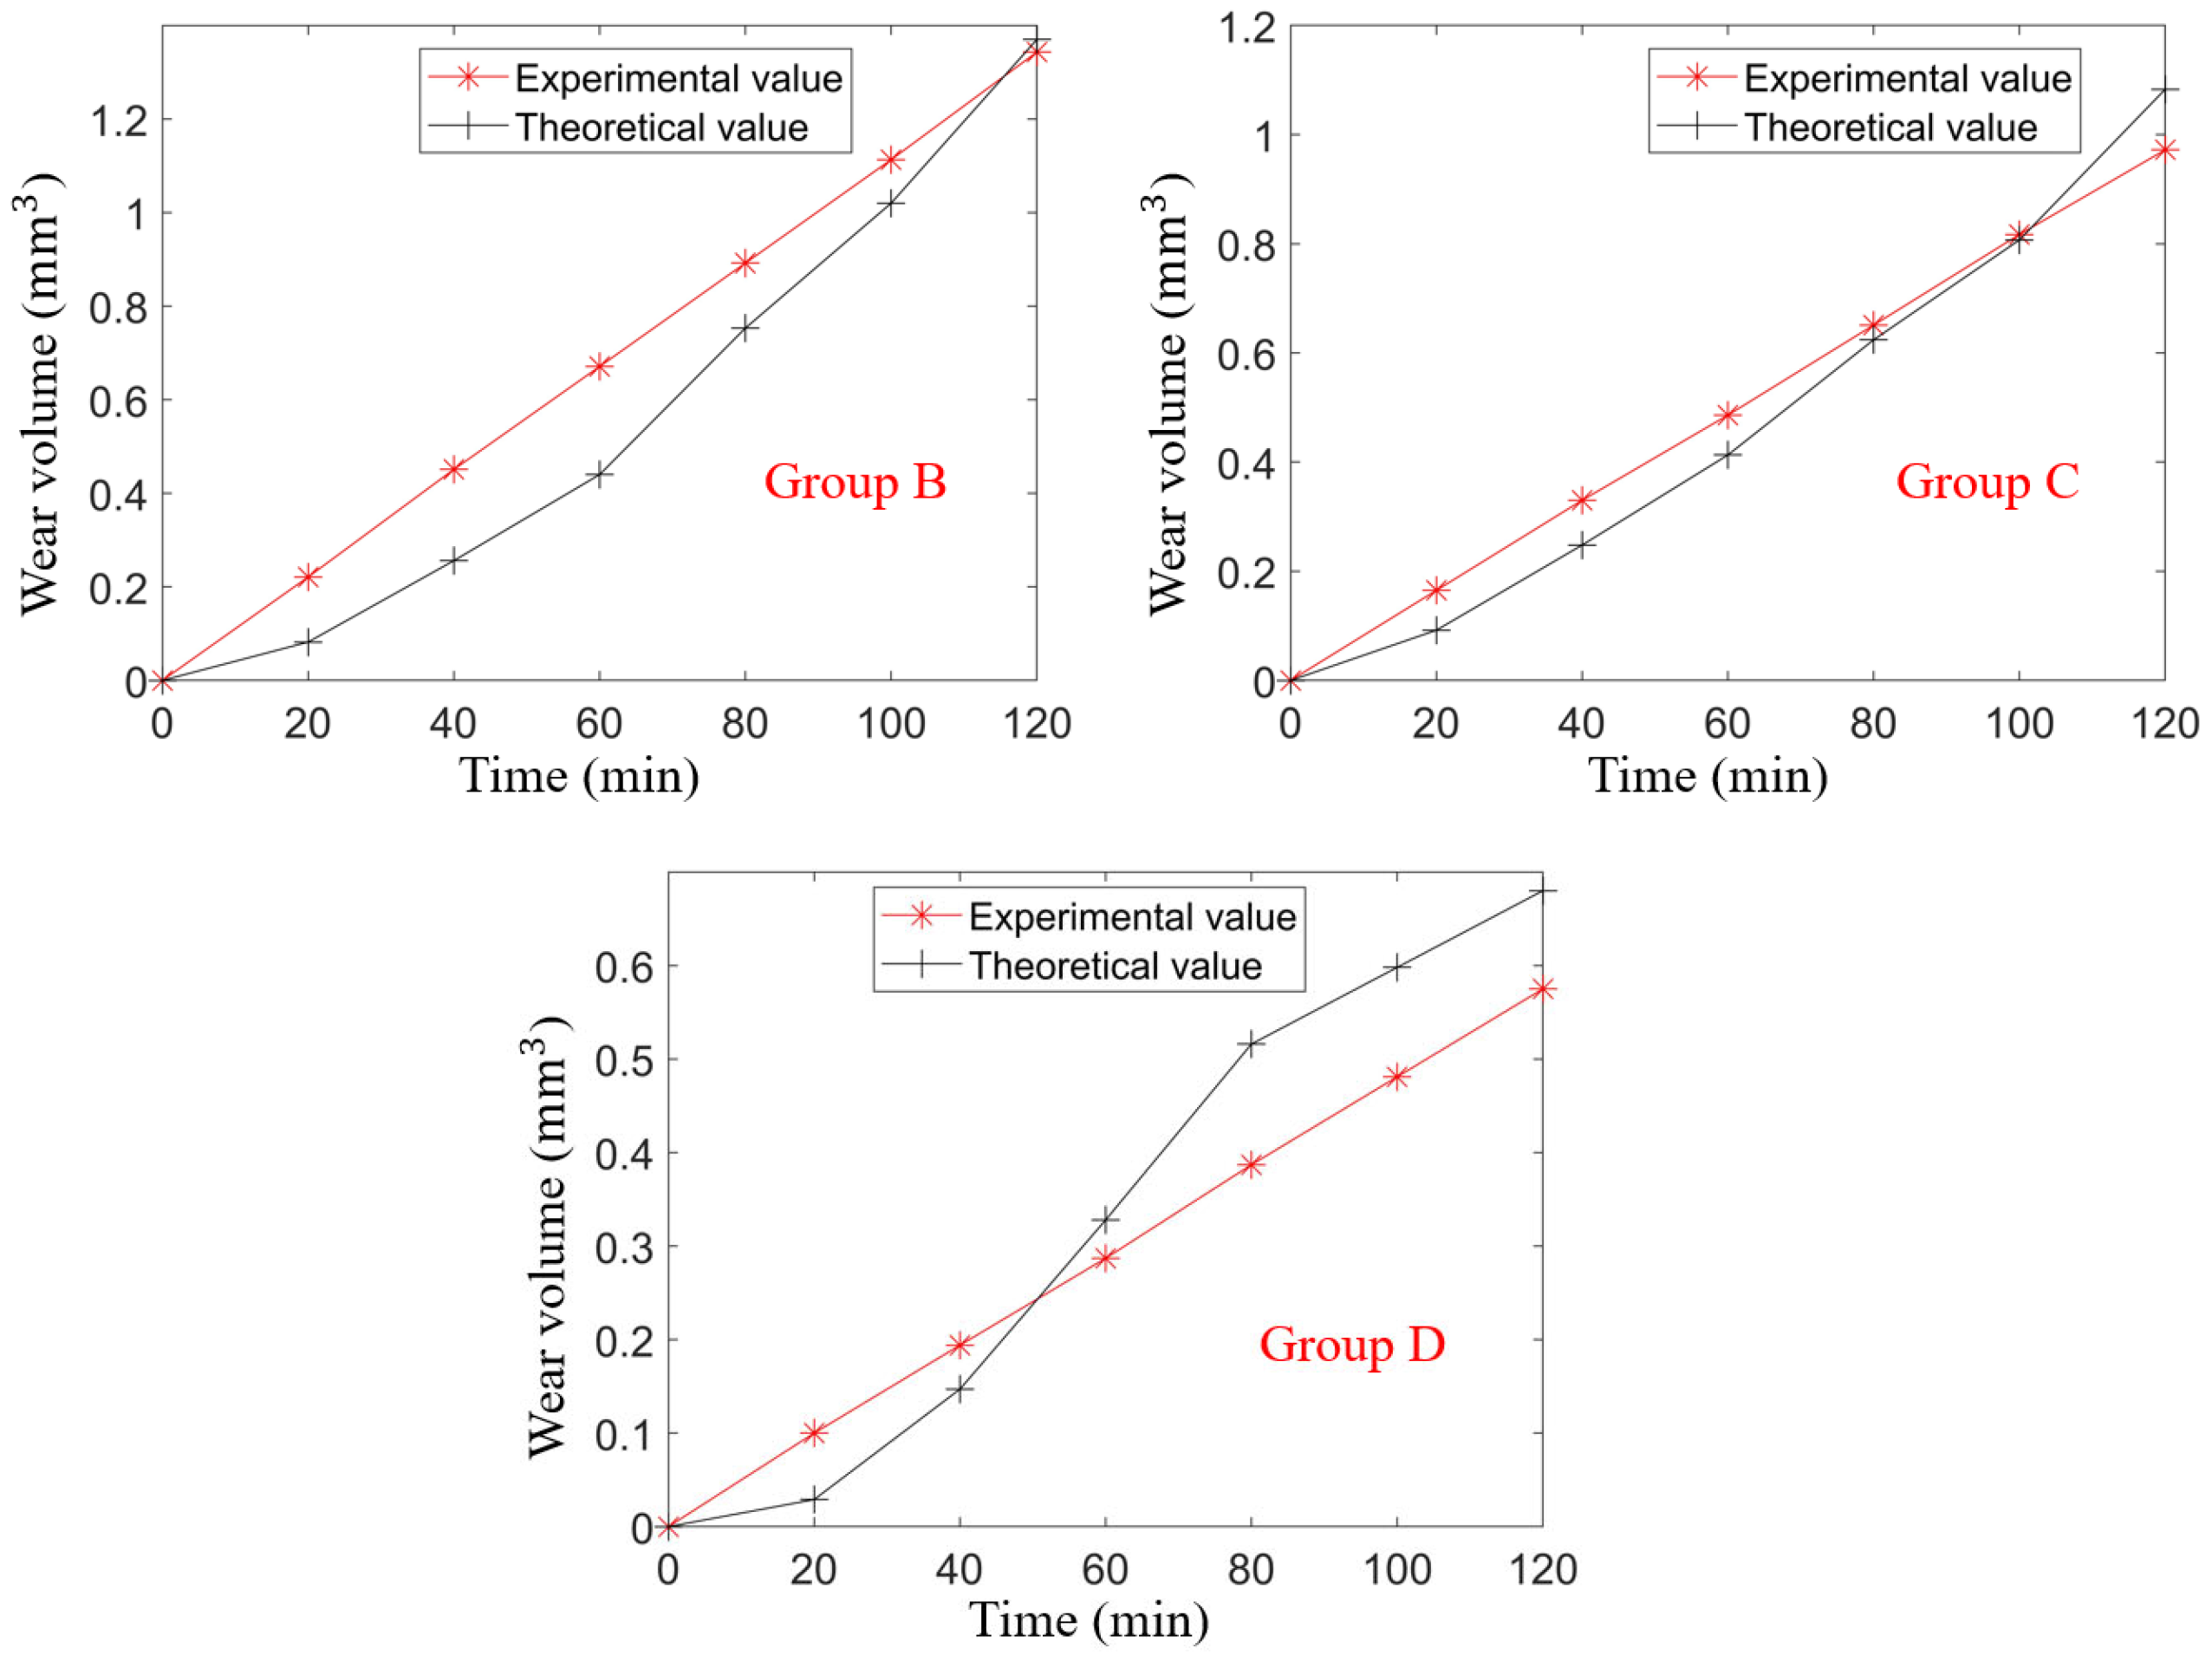
Based on the fitted Archard model, the wear rates under different end-face pressures were calculated and compared with the experimental wear data obtained from Groups B, C, and D, as shown in Figure 8. Although there are some discrepancies between the theoretical calculations and the experimental results, the Archard adhesive wear model demonstrates a generally good accuracy in predicting the volumetric wear rate.
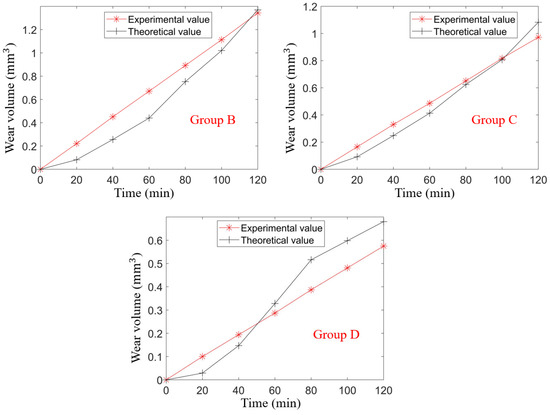
Figure 8.
Comparison of theoretical and experimental wear volume.
- Relationship between wear depth and surface roughness
The measured results of wear depth and surface roughness are listed in Table 3. To analyze the correlation between the experimental data, the Pearson product–moment correlation coefficient is introduced.
Table 3.
Experimental results of wear depth and surface roughness.
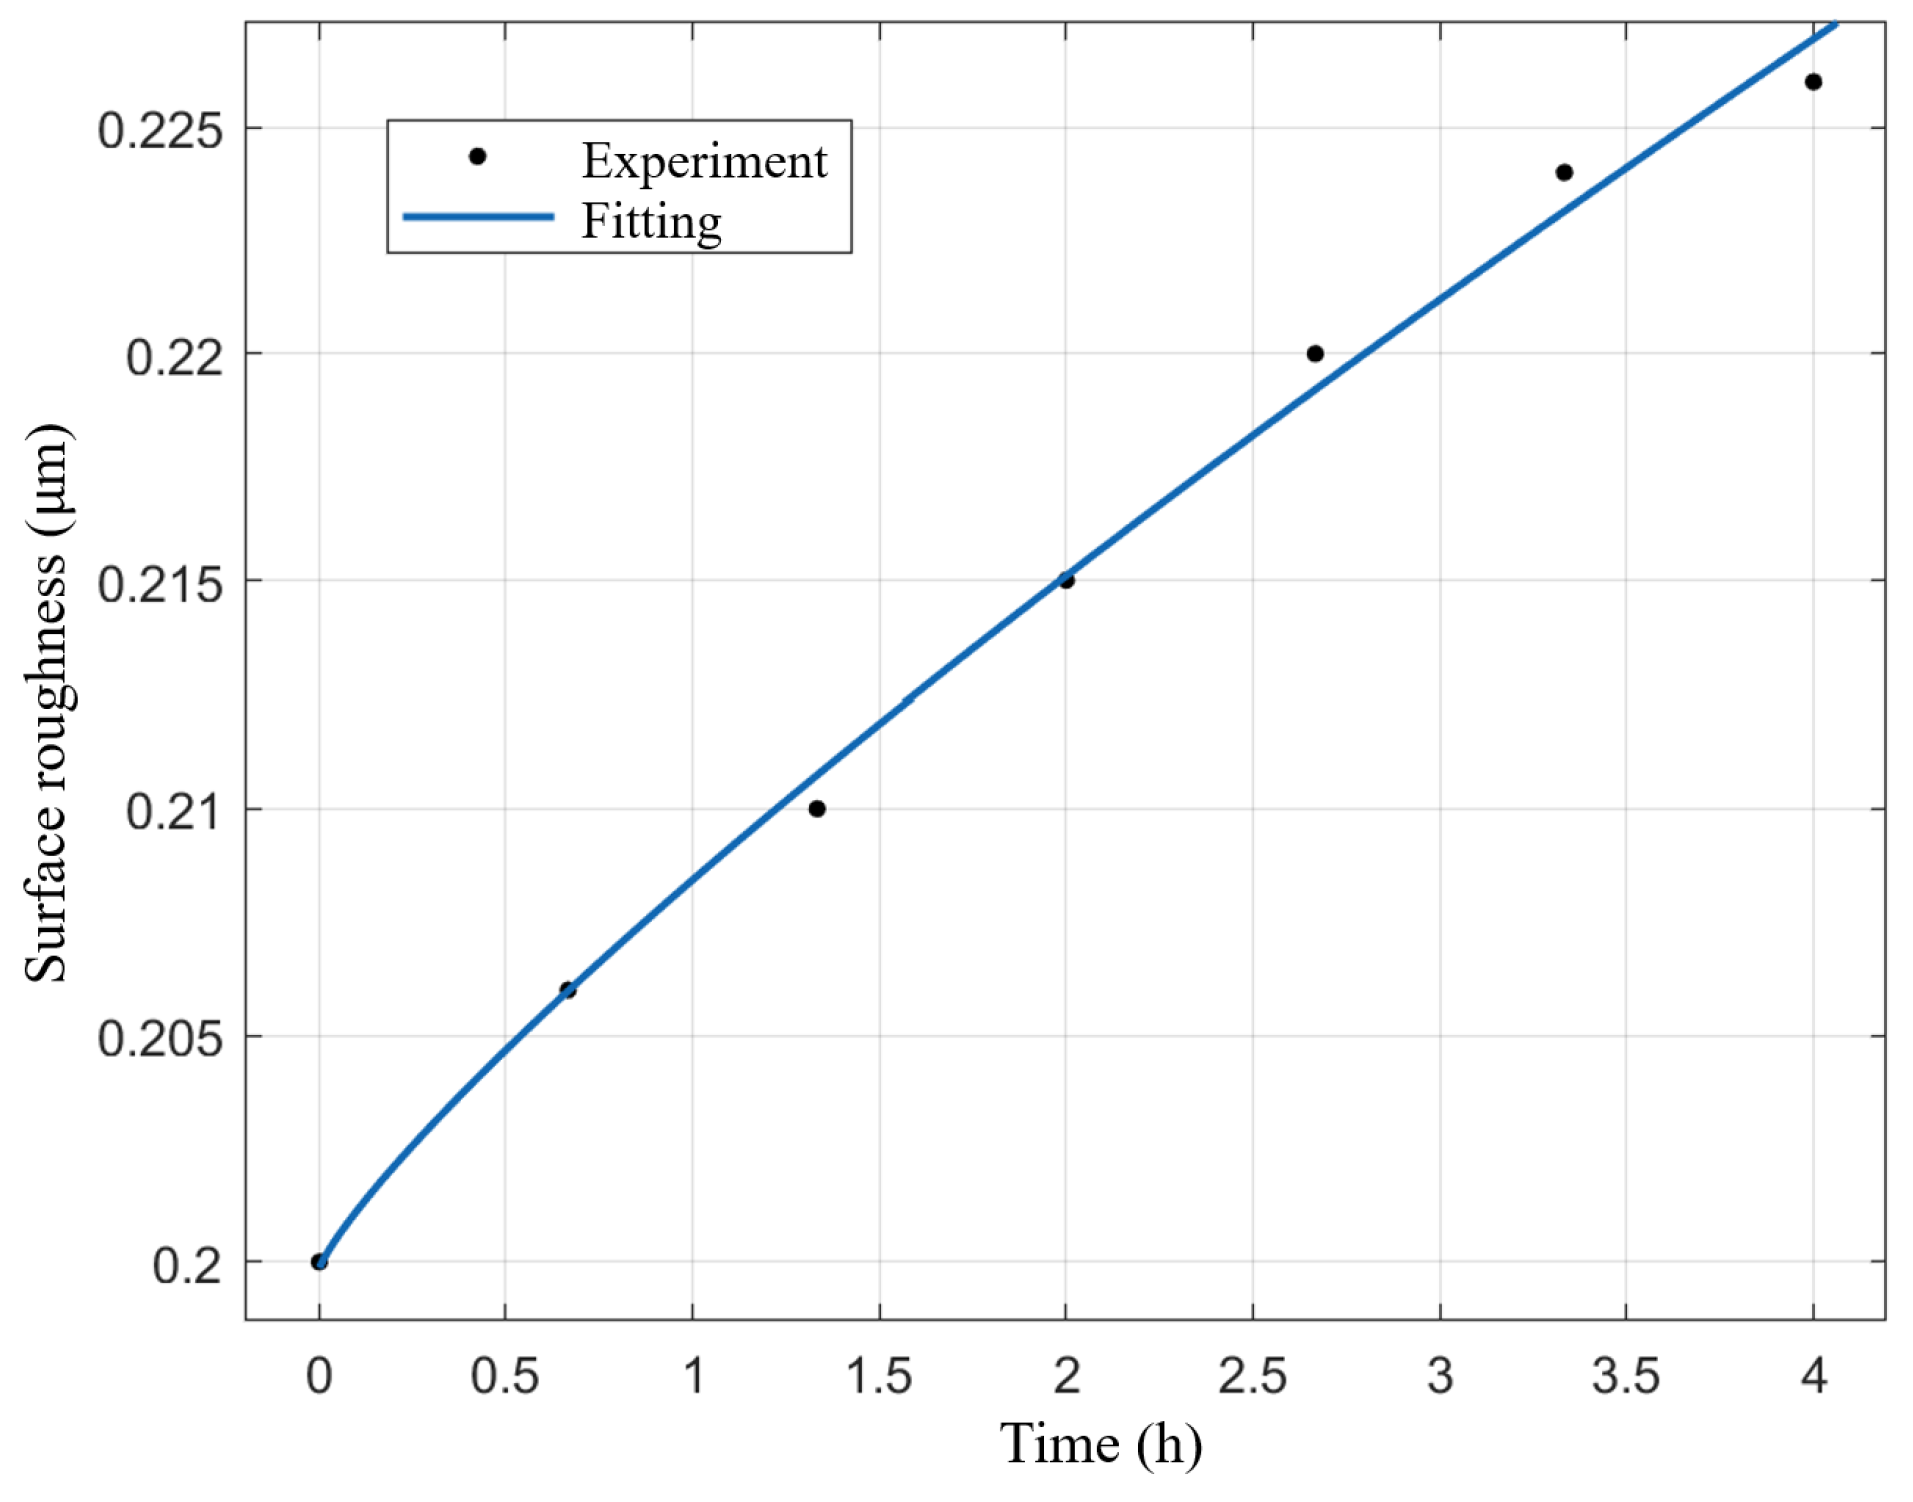
The calculated Pearson correlation coefficient is , indicating a strong positive correlation between wear depth and surface roughness. Therefore, surface roughness can be effectively predicted based on wear depth.
Using the data from Table 3, Equation (24) was fitted, yielding and . The time-dependent surface roughness fitting curve, along with the experimental data points, is shown in Figure 9. The experimental points closely align with the fitted curve, indicating that Equation (24) provides high predictive accuracy for the surface roughness of worn surfaces.
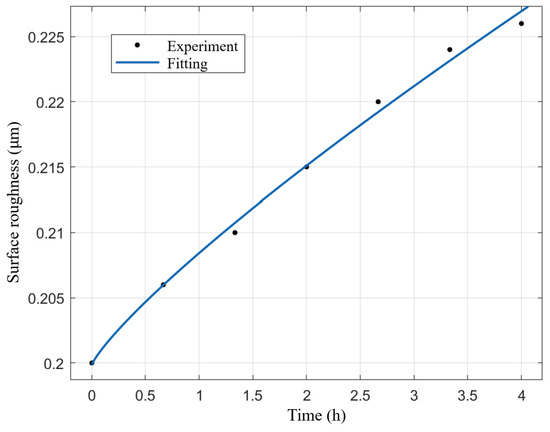
Figure 9.
Time-dependent surface roughness fitting curve and experimental data points.
4.2. Analysis of Floating Seal Leakage Characteristics
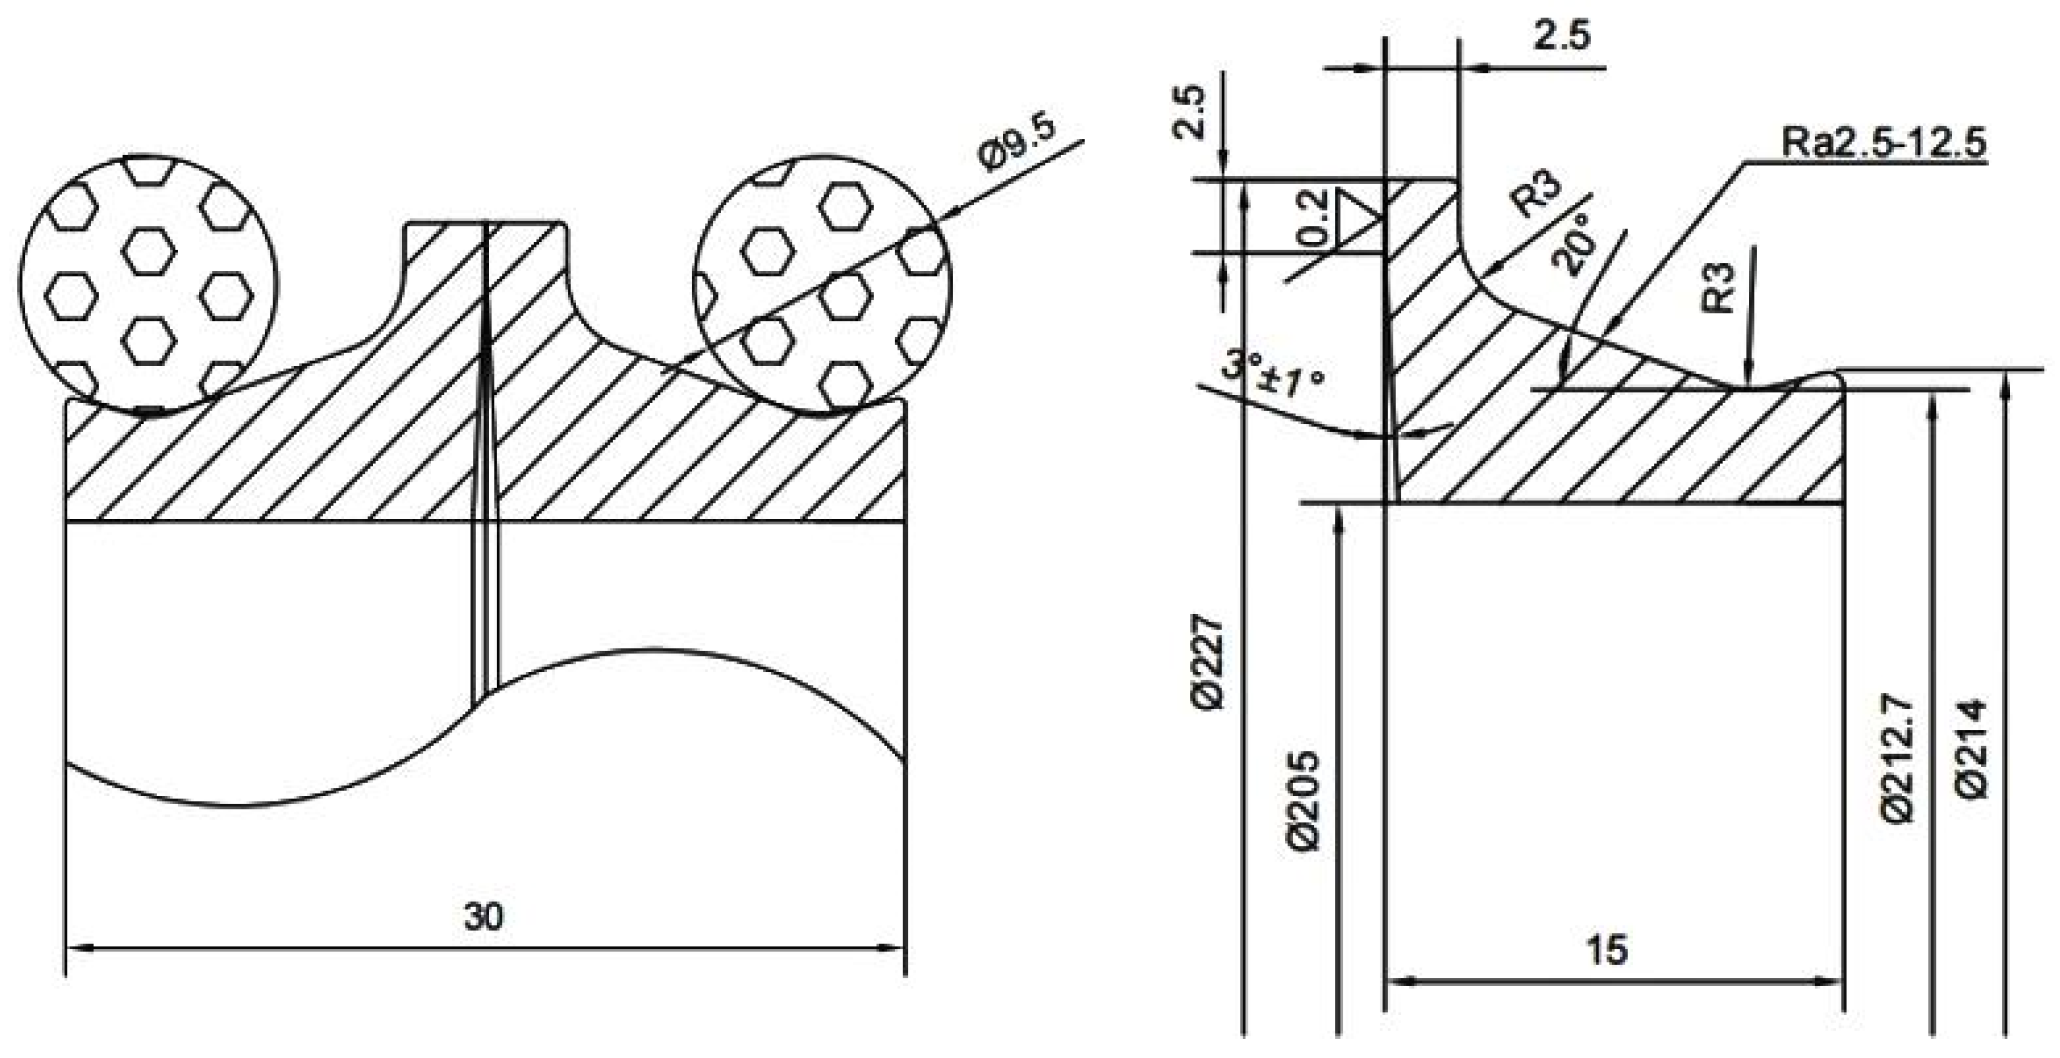
Taking the floating seal THS227 of a 17-inch single-edged cutter as an example, the effects of surface roughness and end-face-specific pressure on floating seal performance are investigated. The geometric parameters of the seal are shown in Figure 10. The constant parameters used in the numerical model are listed in Table 4.
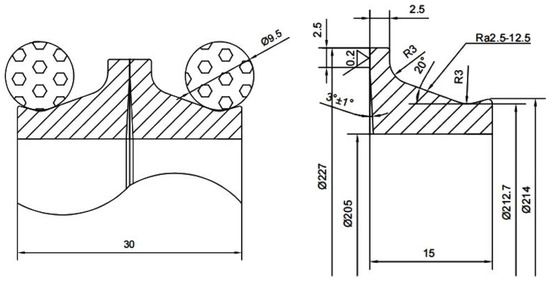
Figure 10.
The geometric parameters of the seal.
Table 4.
Settings of constant parameters in the numerical model.
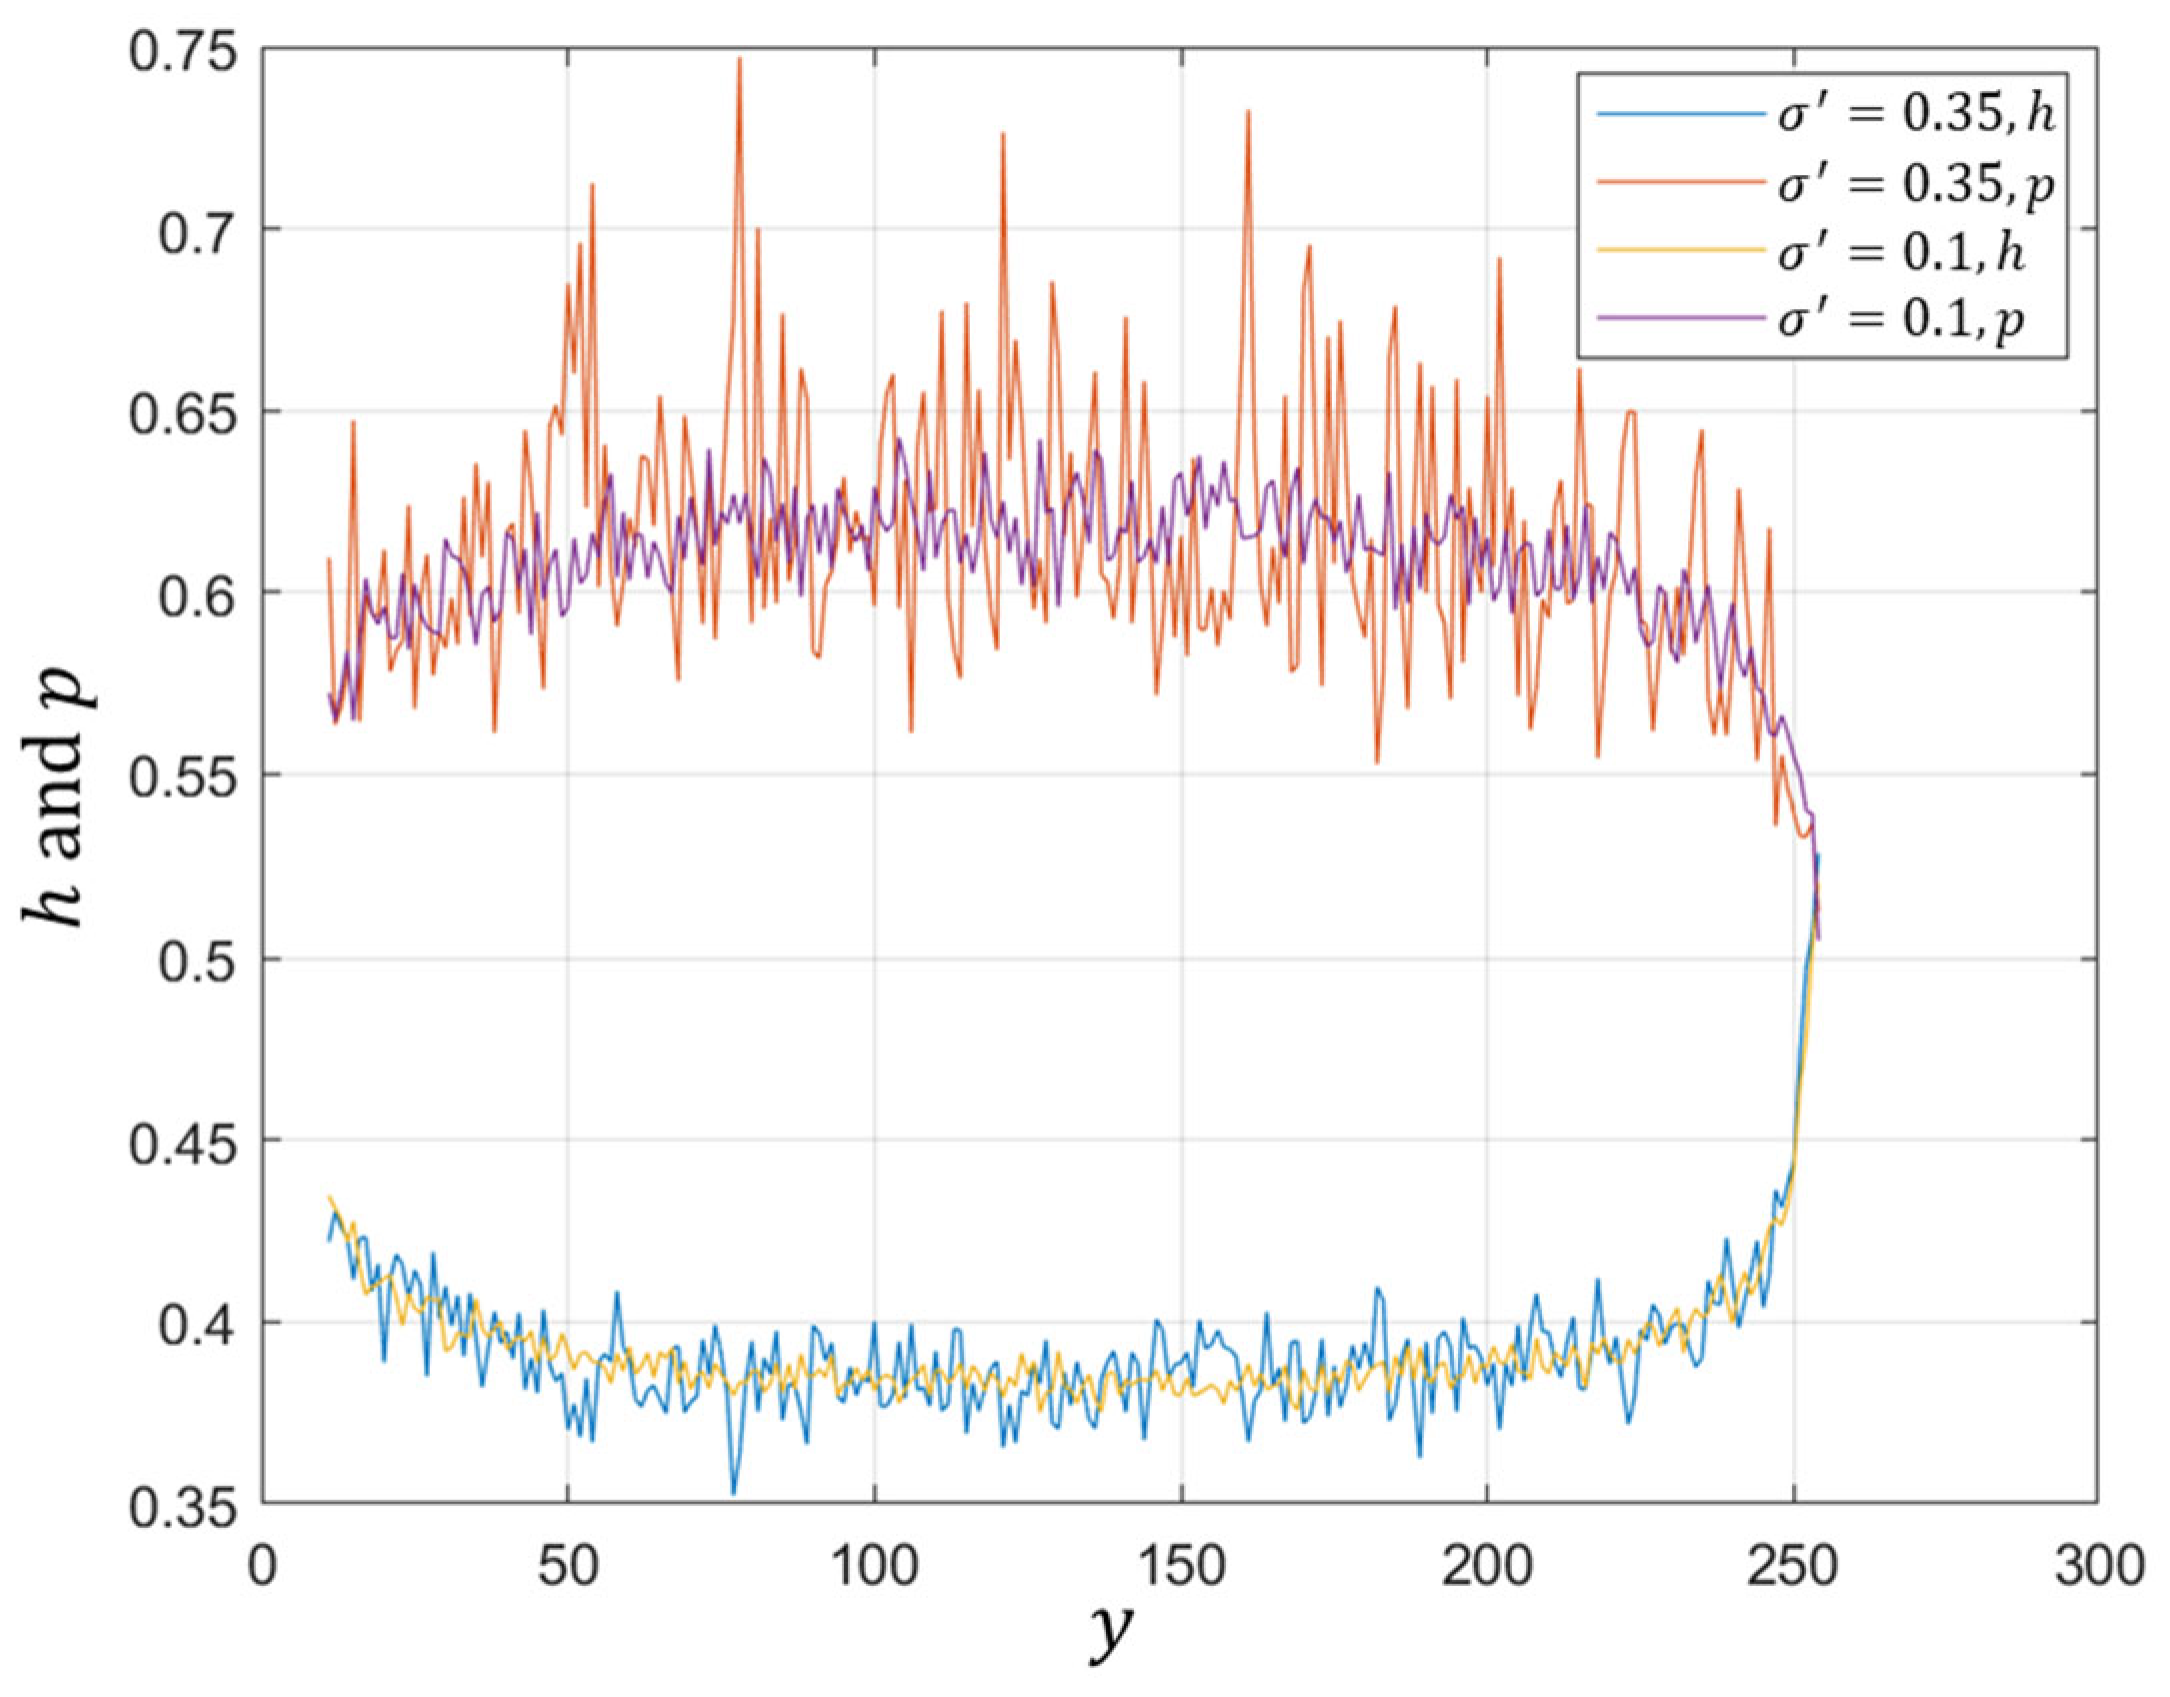
The distribution of oil film pressure and thickness along the -axis of the Differential element is shown in Figure 11. It is evident that surface roughness has a more pronounced effect on oil film pressure. When the end-face-specific pressure is held constant, increasing surface roughness leads to significantly steeper pressure gradients, higher localized pressure peaks, and reduced film thickness—in some regions approaching zero. This indicates that as roughness increases, the influence of asperities on the fluid film becomes more substantial.

Figure 11.
Oil film pressure and thickness distribution along the y-axis.
When is extremely small, the region can be considered a solid contact zone. The film thickness ratio is used to determine the occurrence of solid contact. The solid load-carrying capacity on the differential element can be expressed as:
Furthermore, the solid load ratio on the differential element is defined as the ratio of the solid load carrying capacity to the total applied load. The relationship between the solid load ratio, equivalent surface roughness , and end-face-specific pressure is illustrated in Figure 12. The solid load ratio increases with increasing roughness, but the growth trend is not significant. This is because although higher roughness leads to more concentrated stress and greater peak values, the number of asperities involved in actual contact tends to decrease. The solid load ratio also increases with increasing end-face-specific pressure. Under higher loading, the deformation of asperities intensifies, resulting in a reduced overall film thickness and an expanded area judged as solid contact. However, the rate of increase in the solid load ratio gradually decreases as the end-face-specific pressure continues to rise.

Figure 12.
Effect of surface roughness and end-face pressure on solid load ratio: o and * represent experimental data points.
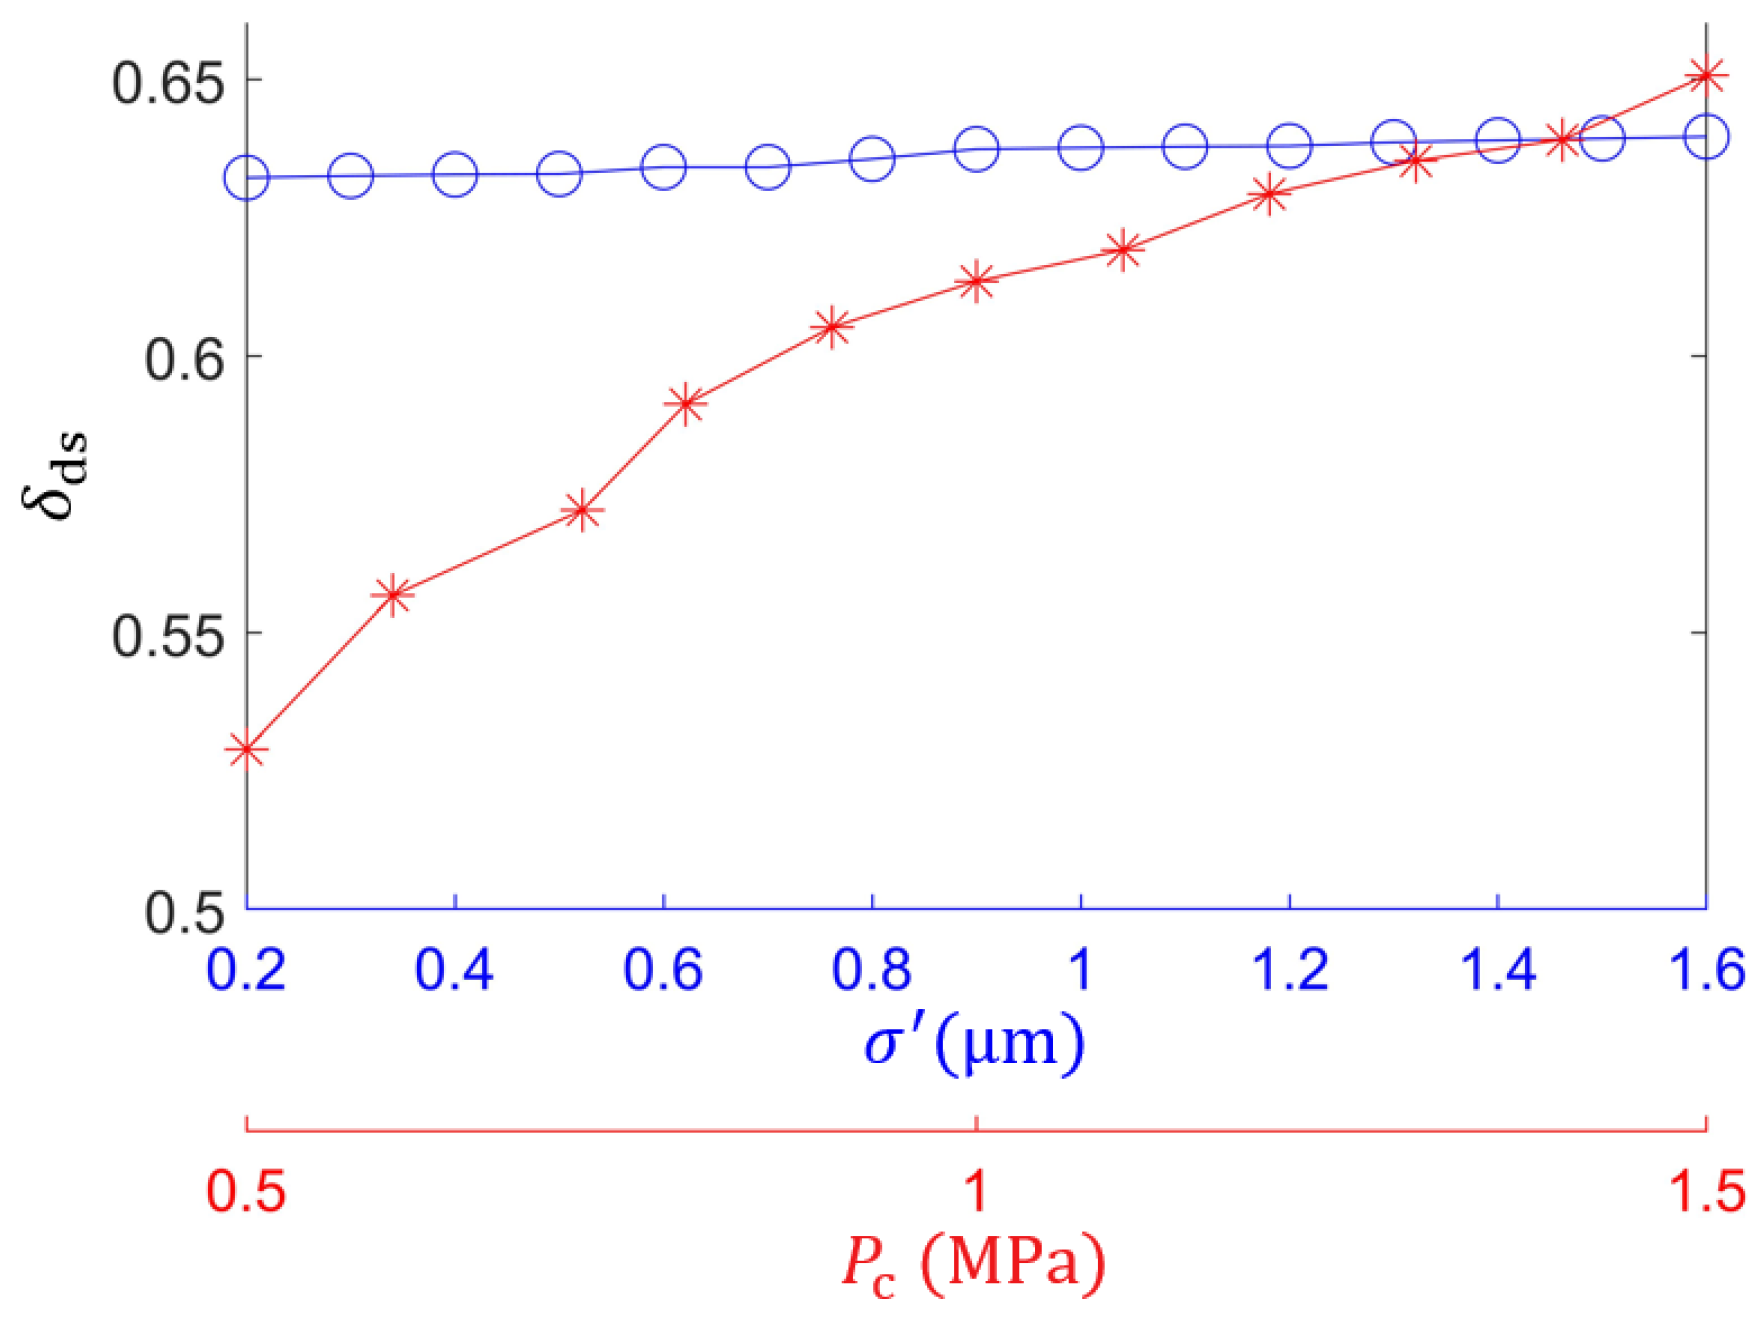
Based on the discrete form of Equation (8), the leakage rate over the entire end face was further calculated. The relationship between surface roughness, end-face-specific pressure, and leakage rate is shown in Figure 13. An increase in surface roughness leads to both a greater average film thickness and a steeper pressure gradient, resulting in a positive correlation with the leakage rate. In contrast, as the end-face-specific pressure increases, both the film thickness and pressure gradient decrease, leading to a significant reduction in the leakage rate. However, increasing the end-face-specific pressure also accelerates surface wear. Therefore, when optimizing the performance of the floating seal, the coupled effects of these two parameters must be considered comprehensively.
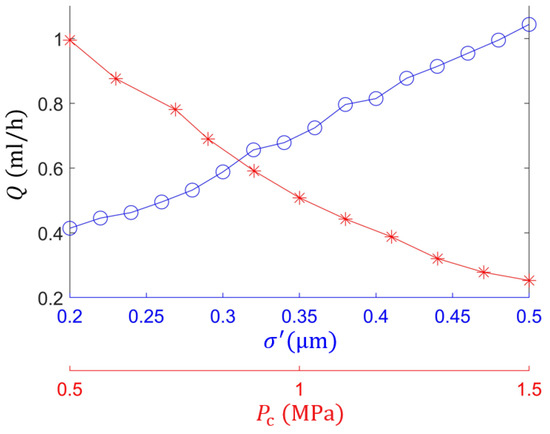
Figure 13.
Effect of surface roughness and end-face pressure on leakage rate: o and * represent experimental data points.
4.3. Experimental Validation of Cutter Seal Leakage
In this study, a 17-inch single-edged cutter was used to test the leakage rate of the floating seal. The cutter seal performance test was conducted using a dedicated experimental apparatus, as shown in Figure 14. During the test, the cutter was installed inside a pressure vessel. A hydraulic motor was used to drive the cutter shaft, providing the relative rotational speed of the floating seal. The pressure supply and control system is employed to regulate the external water pressure around the cutter within the pressure vessel, as well as the rotational speed of the shaft.
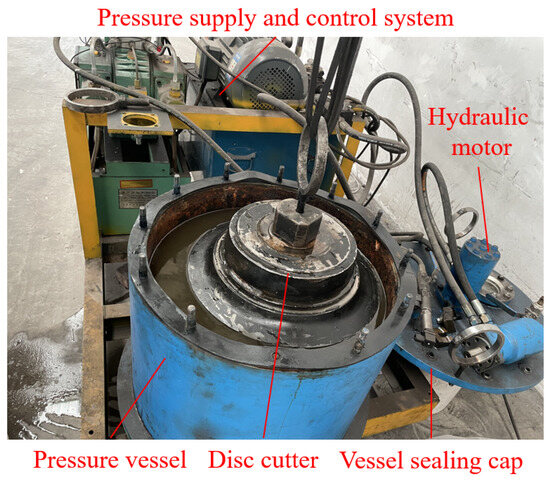
Figure 14.
Experimental apparatus for testing the performance of cutter seals.
The experimental parameters are listed in Table 5. The internal lubricant pressure of the cutter was set to 0.6 MPa. Since the external pressure was higher than the internal pressure, the resulting pressure-driven flow caused external fluid to leak into the cutter interior. After the test, the cutter was dried and weighed. The increase in mass was converted into volume, representing the total leakage.
Table 5.
Test conditions for the leakage experiments.
Furthermore, the experimental leakage rate, denoted as , can be expressed as:
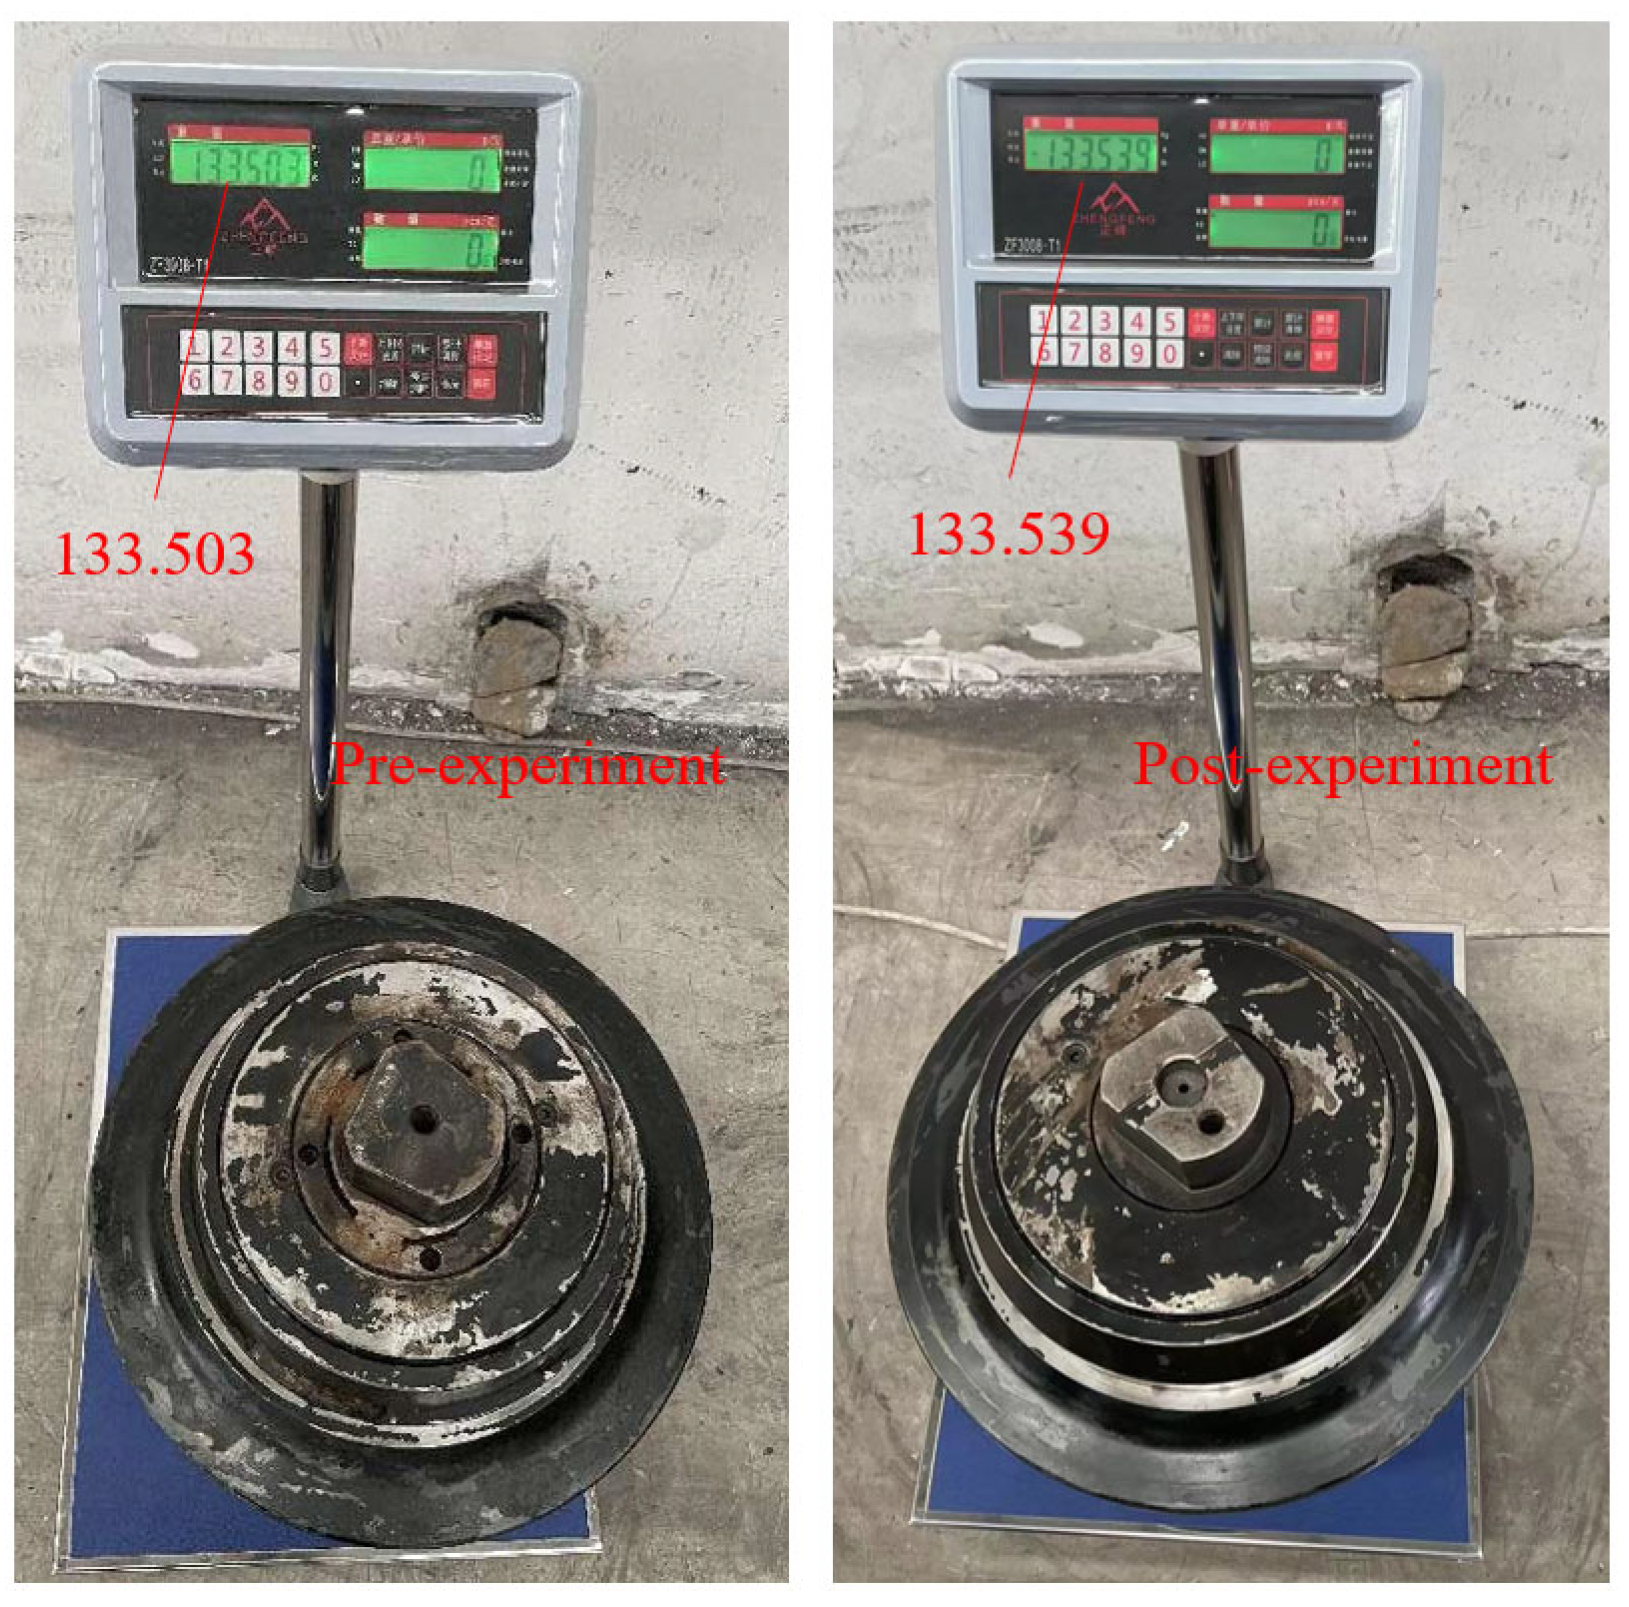
where represents the mass difference in the cutter before and after the experiment, is the density of water, the factor of 2 accounts for the presence of two floating seals, and represents the time interval between measurements during the experiment. The cutter was weighed every 8 h of operation. Figure 15 illustrates the change in cutter mass before and after a representative test cycle.

Figure 15.
Variation in cutter mass before and after testing.
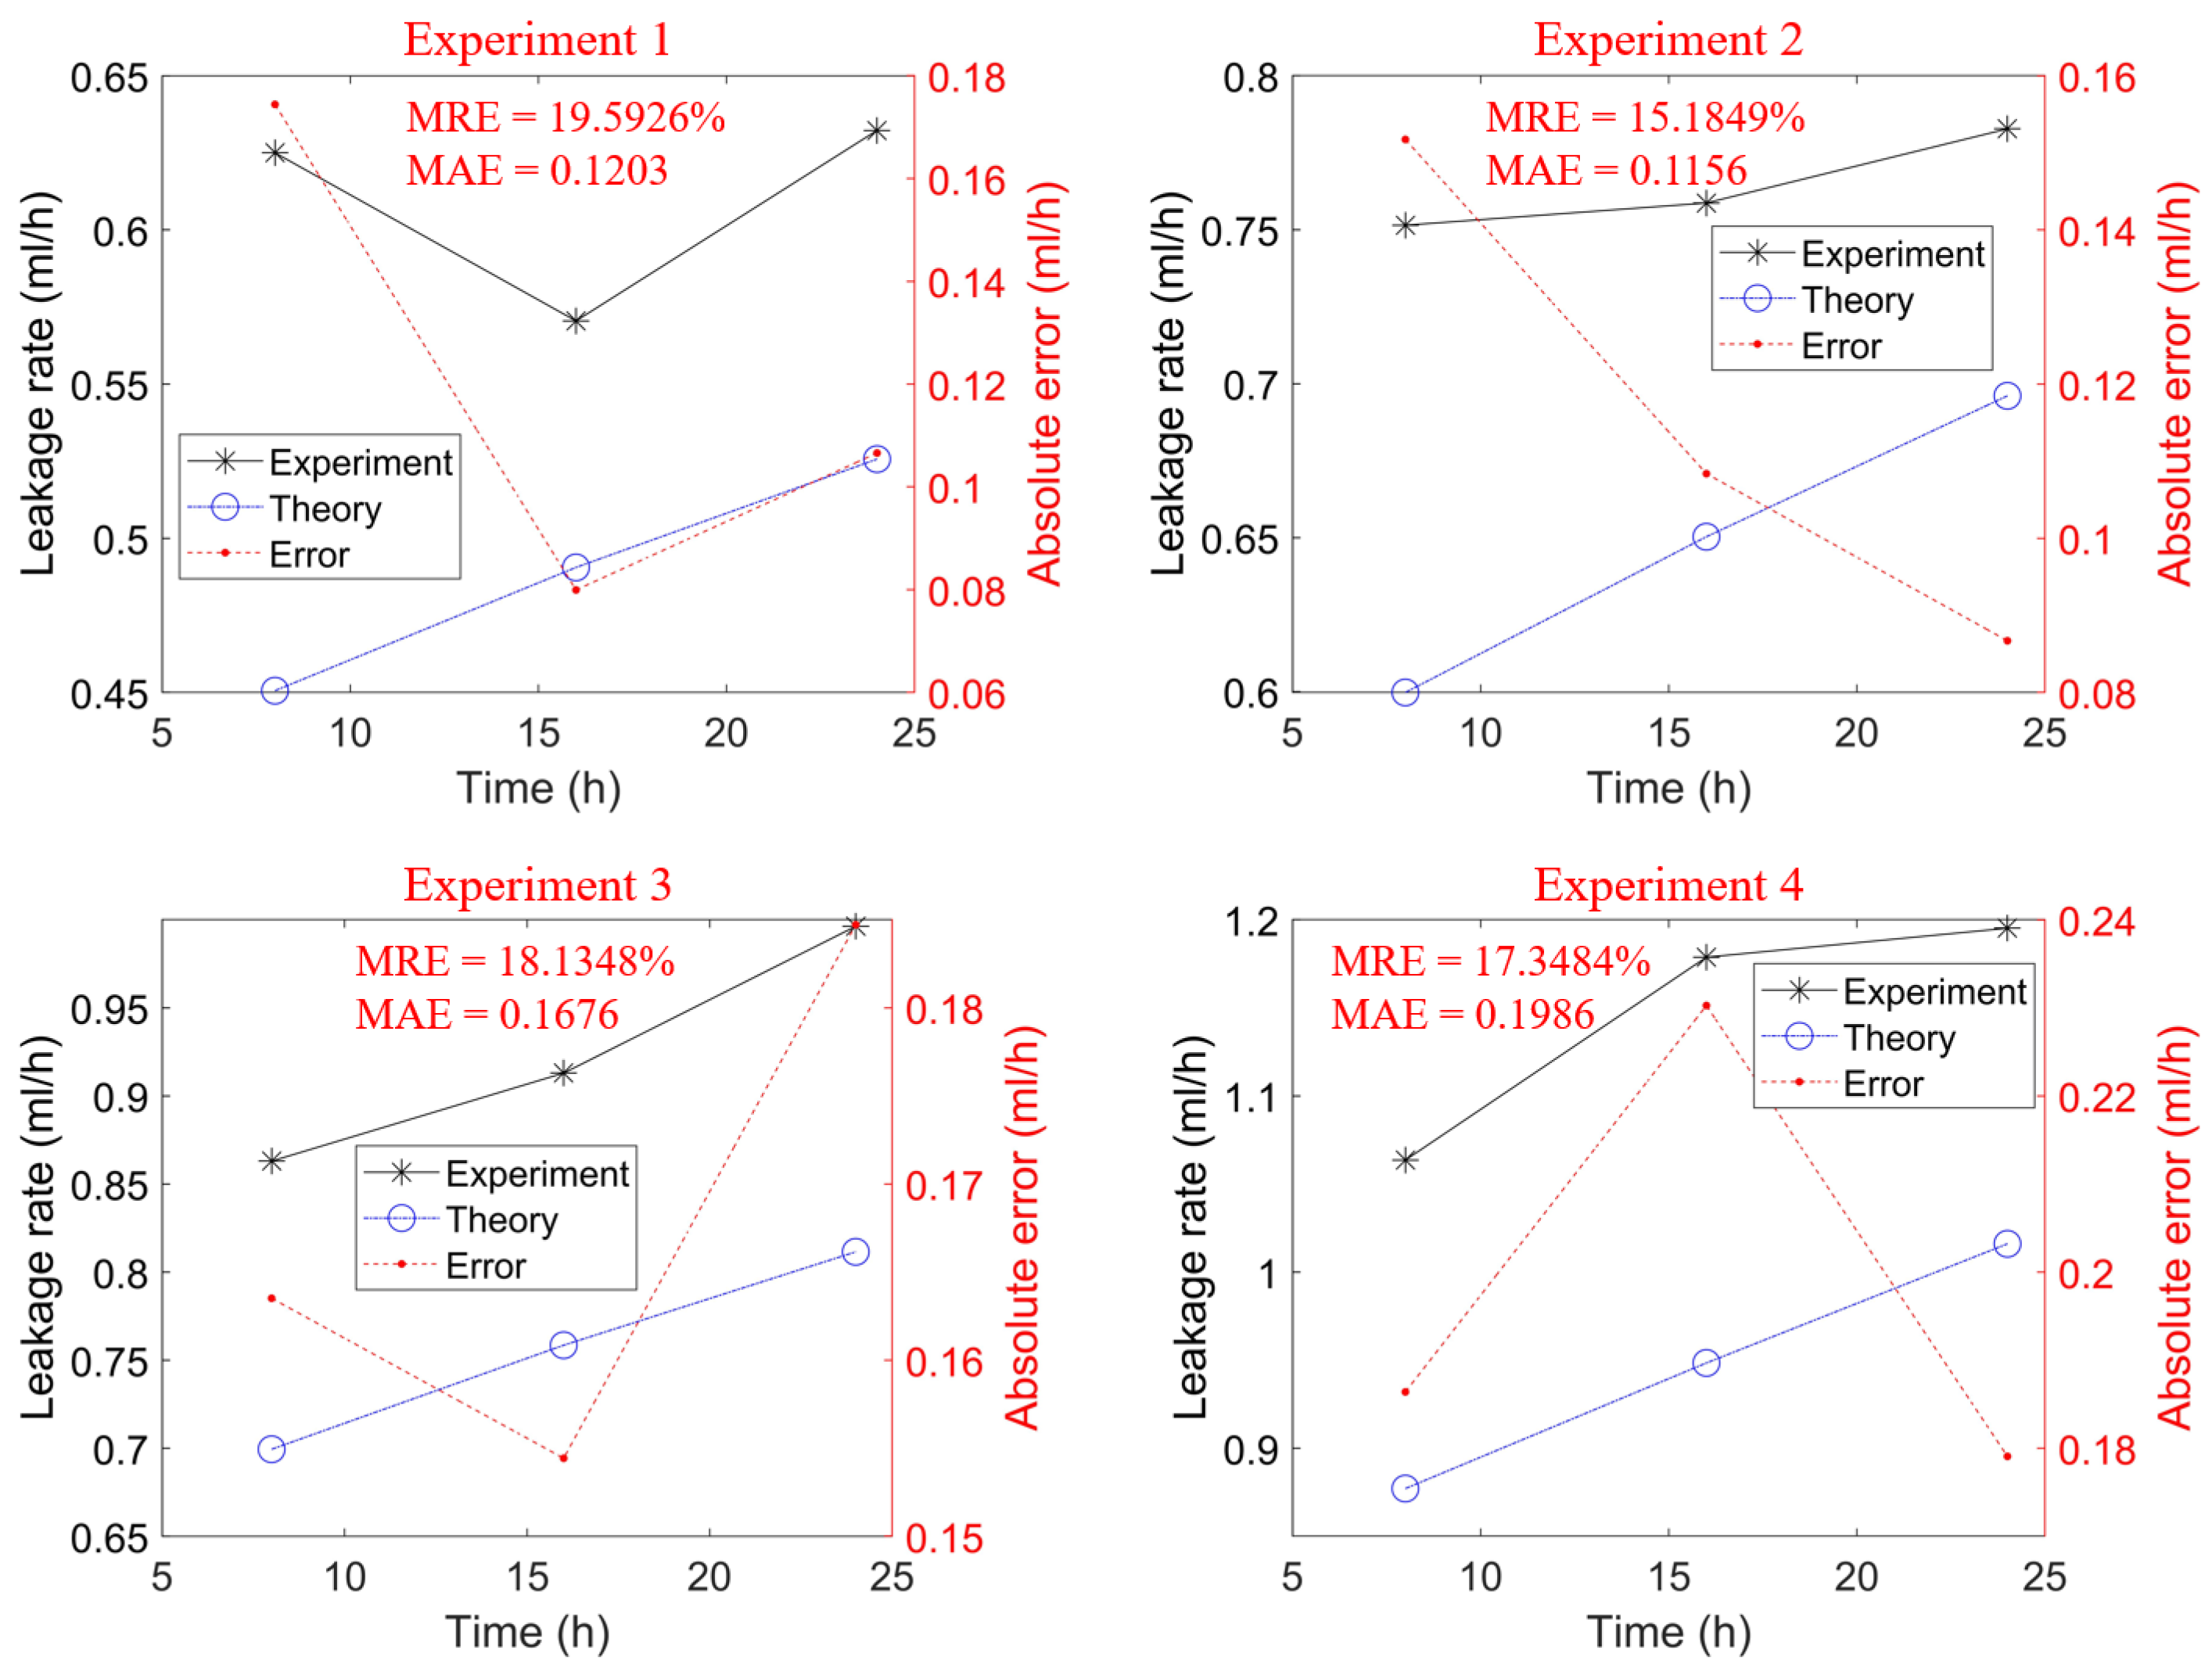
As shown in Figure 16, under four different pressure conditions, the theoretical predictions and experimental results exhibit generally consistent trends over time. With increasing external pressure, the leakage rate increases significantly. The mean relative error (MRE) between the theoretical and experimental leakage rates remains within 20%, and the mean absolute error (MAE) is within 0.2 mL/h. Overall, the results of the theoretical model agree well with the experimental data, demonstrating the validity of the proposed model. The slightly higher experimental leakage rates are primarily attributed to minor leakage at other static sealing locations in the cutter, in addition to the leakage at the floating seal end face. These static sealing leakages were not considered in the theoretical model. As the external pressure increases, the leakage from static seals also increases, leading to a rise in the MAE between theoretical and experimental leakage rates.
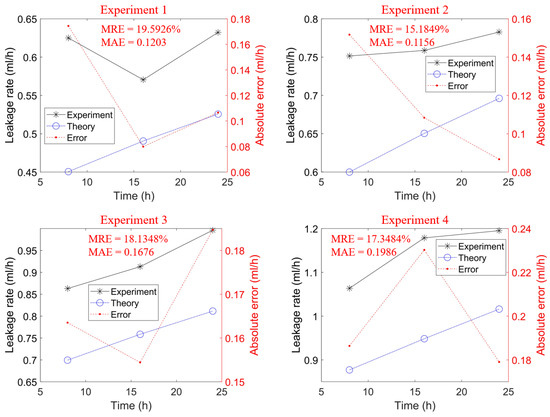
Figure 16.
Comparison between experimental and theoretical results for each test group.
5. Conclusions
This study proposes a numerical method to evaluate the dynamic leakage behavior of floating seal end faces in shield machine cutters, with consideration of wear effects. A surface roughness evolution model was developed based on Archard’s adhesive wear theory, with parameters calibrated through friction and wear experiments. A strong positive correlation was observed between wear depth and surface roughness, with a correlation coefficient as high as 0.961, validating the model’s applicability.
To solve for the oil film pressure and thickness in the floating seal leakage rate model, a rough surface pressure and thickness distribution model was developed using the Reynolds equation and a slicing method. Based on this, a finite difference-based numerical model was formulated to simulate leakage under wear conditions. The results indicate that increased specific pressure and reduced surface roughness significantly suppress leakage. Experimental validation further revealed that higher external pressure aggravates leakage, with the theoretical predictions exhibiting a mean relative error below 20% and an absolute error under 0.2 mL/h.
While the present work focuses on the dynamic leakage characteristics of floating seal, future studies should incorporate the contribution of static seal leakage in the disc cutters, particularly under elevated external pressure. Furthermore, implementing pressure-balancing structures between the cutter’s internal and external environments may further enhance sealing performance. These findings offer a solid foundation for improving the reliability and service life of sealing systems in shield machine cutters.
Author Contributions
Conceptualization, G.H. and Z.Z. (Zhengzhong Zhou); Methodology, G.H. and Z.Z. (Zhengzhong Zhou); Software, G.H., Z.Z. (Zhengzhong Zhou) and Z.Z. (Zhihao Zhang); Validation, Z.Z. (Zhengzhong Zhou) and Z.Z. (Zhihao Zhang); Formal analysis, G.H. and Z.Z. (Zhengzhong Zhou); Investigation, Z.Z. (Zhengzhong Zhou); Resources: H.Z.; Data curation, G.H. and Z.Z. (Zhengzhong Zhou); Writing—original draft preparation, G.H.; Writing—review and editing, G.H., Z.Z. (Zhengzhong Zhou), Z.Z. (Zhihao Zhang) and H.Z.; Visualization, G.H. and Z.Z. (Zhengzhong Zhou); Supervision, H.Z.; Project administration, H.Z.; Funding acquisition, H.Z., G.H. and Z.Z. (Zhihao Zhang). All authors have read and agreed to the published version of the manuscript.
Funding
The work was financially supported by Special funding support for the Yuelu Mountain National University Science and Technology City “Ranking the Top of the List” Research Project: (Tunnel Boring Machine High-performance Long-life Cutting Tools) and the Graduate Research and Innovation Projects of Hunan Province under Grant CX20240193. This work also was sponsored by the Graduate Innovation Project of Central South University.
Data Availability Statement
Data is contained within the article.
Conflicts of Interest
The authors declare no conflicts of interest.
References
- Shen, X.; Chen, X.; Fu, Y.; Cao, C.; Yuan, D.; Li, X.; Xiao, Y. Prediction and analysis of slurry shield TBM disc cutter wear and its application in cutter change time. Wear 2022, 498, 13. [Google Scholar] [CrossRef]
- Hu, G.; Yu, L.; Zhang, Z.; Yang, C.; Fu, J.; Xue, J.; Zhao, H.; Xia, Y.; Yu, L.; Chang, L. Research on fatigue failure analysis and fracture mechanisms of a cutter ring in tunnel boring machine. Eng. Fail. Anal. 2025, 169, 16. [Google Scholar] [CrossRef]
- Fu, J.; Wu, D.; Lan, H.; Ji, Z.; Li, W.; Xia, Y. Online monitoring and analysis of TBM cutter temperature: A case study in China. Measurement 2021, 174, 8. [Google Scholar] [CrossRef]
- Wang, L.; Kang, Y.; Zhao, X.; Zhang, Q. Disc cutter wear prediction for a hard rock TBM cutterhead based on energy analysis. Tunn. Undergr. Space Technol. 2015, 50, 324–333. [Google Scholar] [CrossRef]
- Fu, J.; Xia, Y.; Zhang, L.; Lin, L.; Zhang, X.; Zhao, S. Failure analysis on the fracture of disc cutter in EPB shield machine. Eng. Fail. Anal. 2020, 108, 12. [Google Scholar] [CrossRef]
- Hu, G.; Zhao, H.; Fu, J.; Xue, J.; Xia, Y. Impact fracture failure analysis and mechanism study of a TBM disc cutter ring. Eng. Fail. Anal. 2024, 163, 12. [Google Scholar] [CrossRef]
- Hu, X.; Wang, Z.; Cheng, W.; Huang, L. Study on Damage Form and Dismantling Inspection Standard of Hob of Super-large Diameter Slurry Shield. Tool Eng. 2021, 55, 61–65. [Google Scholar]
- Ha, Y.; Lee, Y.; An, B.; Lee, Y. Experiment and CFD Analysis of Plain Seal, Labyrinth Seal and Floating Ring Seal on Leakage Performance. In Proceedings of the 11th IFToMM International Conference on Rotordynamics, Beijing, China, 18–21 September 2023. [Google Scholar]
- Li, G.; Zhang, Q.; Huang, E.; Lei, Z.; Wu, H.; Xu, G. Leakage performance of floating ring seal in cold/hot state for aero-engine. Chin. J. Aeronaut. 2019, 32, 2085–2094. [Google Scholar] [CrossRef]
- Hu, T.; Deng, W.; Tang, Z.; Mi, D.; Zhang, W.; Wang, X. Analysis of leakage characteristics and structural optimization of two-stage floating ring seal. Int. J. Turbo. Jet-Engines 2025. [Google Scholar] [CrossRef]
- He, Z.; Guo, Y.; Si, J.; Li, N.; Jia, L.; Zou, Y.; Wang, H. Numerical Optimization Analysis of Floating Ring Seal Performance Based on Surface Texture. Lubricants 2024, 12, 241. [Google Scholar] [CrossRef]
- Chen, Y.; Xiong, C.; Li, Y.; Li, X.; Xue, X.; Wang, B.; Gan, Y. Dynamic performance analysis and parameter collaborative optimization of floating seal dam compliant foil face gas seal. J. Braz. Soc. Mech. Sci. Eng. 2023, 45, 612. [Google Scholar] [CrossRef]
- Liu, D.; Wang, S.; Zhang, C. A multiscale wear simulation method for rotary lip seal under mixed lubricating conditions. Tribol. Int. 2018, 121, 190–203. [Google Scholar] [CrossRef]
- Liu, D.; Wang, S.; Zhang, C.; Tomovic, M.M. Numerical study of the effects of textured shaft on the wear of rotary lip seals. Tribol. Int. 2019, 138, 215–238. [Google Scholar] [CrossRef]
- Lee, Y.B.; Shin, S.K.; Ryu, K.; Kim, C.H.; And Jang, G. Test Results for Leakage and Rotordynamic Coefficients of Floating Ring Seals in a High-Pressure, High-Speed Turbopump. Tribol. Trans. 2005, 48, 273–282. [Google Scholar] [CrossRef]
- Lebeck, A.O. Hydrodynamic lubrication in wavy contacting face seals—A two dimensional model. ASME J. Lubr. Technol. 1981, 103, 578–586. [Google Scholar] [CrossRef]
- Zhao, Z.; Yang, Y.; Han, H.; Ma, H.; Wang, H.; Li, Z. Meshing Characteristics of Spur Gears Considering Three-Dimensional Fractal Rough Surface under Elastohydrodynamic Lubrication. Machines 2022, 10, 705. [Google Scholar] [CrossRef]
- Wu, J.; Cui, J.; Shu, W.; Wang, L.; Chen, R. Elastohydrodynamic lubrication model and failure test for micro-contact thermodynamic characteristics of friction interface. Tribol. Int. 2023, 185, 108499. [Google Scholar] [CrossRef]
- Huang, T.C.; Lin, C.Y.; Liao, K.C. Sealing performance assessments of PTFE rotary lip seals based on the elasto-hydrodynamic analysis with the modified archard wear model. Tribol. Int. 2022, 176, 107917. [Google Scholar] [CrossRef]
- Ni, X.; Sun, J.; Ma, C.; Zhang, Y. Wear Model of a Mechanical Seal Based on Piecewise Fractal Theory. Fractal Fract. 2023, 7, 251. [Google Scholar] [CrossRef]
- Sapozhnykov, Y.I.; Zahorulko, A.V. Computational studies of stuffing box packing seal wear mechanism using the Archard model. Probl. Tribol. 2024, 29, 6–15. [Google Scholar] [CrossRef]
- Huang, T.C.; Tsai, J.W.; Liao, K.C. Wear and leakage assessments of canted coil Spring–Energized polytetrafluoroethylene seals under Ultra-High cycle operations. Eng. Fail. Anal. 2022, 135, 106110. [Google Scholar] [CrossRef]
- Liu, D.; Wang, S.; Zhang, C.; Tomovic, M. Wear Simulation Method for Mechanical Seals Under Mixed Lubrication Using Flow Factors. In Proceedings of the 7th International Conference on Fracture Fatigue and Wear: FFW 2018, Ghent, Belgium, 9–10 July 2018. [Google Scholar]
- Wang, J.; Li, J.; Ma, C. A performance degradation analysis method for a reciprocating rod seal in the wear process under mixed lubrication conditions. Proc. Inst. Mech. Eng. Part J.-J. Eng. Tribol. 2023, 237, 681–697. [Google Scholar] [CrossRef]
- Patir, N.; Cheng, H.S. An average flow model for determining effects of three-dimensional roughness on partial hydrodynamic lubrication. ASME J. Lubr. Technol. 1978, 100, 12–17. [Google Scholar] [CrossRef]
- Manesh, K.K.; Ramamoorthy, B.; Singaperumal, M. Numerical generation of anisotropic 3D non-Gaussian engineering surfaces with specified 3D surface roughness parameters. Wear 2010, 268, 1371–1379. [Google Scholar] [CrossRef]
- Chen, H.; Hu, Y.; Wang, H.; Wang, W. Computer Simulation of Rough Surfaces. Lubr. Eng. 2006, 52–55+59. [Google Scholar]
- Hui, Y.; Wang, Y.; Liu, Y. Effects of Anisotropic Autocorrelation Length on Parameters of 3D Computer Simulation Surface. Surf. Technol. 2018, 47, 246–251. [Google Scholar] [CrossRef]
- Dowson, D. A generalized Reynolds equation for fluid-film lubrication. Int. J. Mech. Sci. 1962, 4, 159–170. [Google Scholar] [CrossRef]
- Hu, Y.; Zhu, D. A full numerical solution to the mixed lubrication in point contacts. J. Tribol. 2000, 122, 1–9. [Google Scholar] [CrossRef]
- Jianmei, W.; Jianfeng, K.; Yanjuan, Z.; Xunjie, H. Viscosity monitoring and control on oil-film bearing lubrication with ferrofluids. Tribol. Int. 2014, 75, 61–68. [Google Scholar] [CrossRef]
- Wong, P.L.; Wang, R.; Lingard, S. Pressure and temperature dependence of the density of liquid lubricants. Wear 1996, 201, 58–63. [Google Scholar] [CrossRef]
- Aghababaei, R.; Zhao, K. Micromechanics of material detachment during adhesive wear: A numerical assessment of Archard’s wear model. Wear 2021, 476, 203739. [Google Scholar] [CrossRef]
- Huang, P.; Lee, C. Estimation of tool wear and surface roughness development using deep learning and sensors fusion. Sensors 2021, 21, 5338. [Google Scholar] [CrossRef] [PubMed]
- Bayer, R.G.; Sirico, J.L. The influence of surface roughness on wear. Wear 1975, 35, 251–260. [Google Scholar] [CrossRef]
- Yuan, Z.; Jiang, Z.; Zhou, Z.; Wang, H.; Li, J.; Cai, Z.; Xing, Z.; Ding, C.; Piao, Z. Effect of surface roughness on friction and wear behavior of GCr15 bearing steel under different loads. Surf. Sci. Technol. 2024, 2, 28. [Google Scholar] [CrossRef]


Disclaimer/Publisher’s Note: The statements, opinions and data contained in all publications are solely those of the individual author(s) and contributor(s) and not of MDPI and/or the editor(s). MDPI and/or the editor(s) disclaim responsibility for any injury to people or property resulting from any ideas, methods, instructions or products referred to in the content. |
© 2025 by the authors. Licensee MDPI, Basel, Switzerland. This article is an open access article distributed under the terms and conditions of the Creative Commons Attribution (CC BY) license (https://creativecommons.org/licenses/by/4.0/).