Article

Simulation Study on the Surface Texturing Design of COC Hip Joints Based on Elastohydrodynamic Lubrication Model

1
School of Mechatronic Engineering and Automation, Shanghai University, Shanghai 200444, China
2
Department of Engineering, Nottingham Trent University, Nottingham NG1 4FQ, UK
*
Authors to whom correspondence should be addressed.
Lubricants 2025, 13(5), 217; https://doi.org/10.3390/lubricants13050217
Submission received: 29 April 2025 / Revised: 11 May 2025 / Accepted: 12 May 2025 / Published: 14 May 2025
(This article belongs to the Special Issue Tribology in Artificial Joints)

Abstract

:
Post-operative feedback from hip replacement surgeries indicates that implanted ceramic artificial hip joints may produce abnormal noises during movement. This occurrence of joint noise is highly correlated with insufficient lubrication of ceramic-on-ceramic (COC) prostheses. Studies have shown that surface texture design can improve lubrication performance. In this study, the elastohydrodynamic lubrication model was established with designing textures on the surface of the COC hip joint, using Matlab R2018b and GNU FORTRAN in Codeblocks 20.03 programming. Iterative calculations were performed to determine the average bearing capacity of the oil film and the friction coefficient. The study explored the impact of texture parameters, including the aspect ratio and density, on the lubrication and friction performance of the hip joints. The results indicate that the textured surface generally has a higher fluid film bearing capacity by 161.5~637.7% and a lower friction coefficient by 10.7~60% than the smooth surface. The average bearing capacity of the fluid film increases with an increasing texture aspect ratio, while the trend of the friction coefficient is identical to the average bearing capacity results. As the texture density increases, the average bearing capacity of the fluid film first decreases and then increases, and the trend of the friction coefficient also increases accordingly. Among the nine design groups ( S p = 0.05 , 0.15 , 0.35 , ε = 0.075 , 0.1 , 0.15 ), based on the fuzzy comprehensive evaluation, the local optimal solution is S p = 0.15 , ε = 0.075 for lubrication and wear resistance.

1. Introduction

Total hip arthroplasty (THA) has been widely used to treat hip joint diseases, with the implanted artificial hip joint replacing the diseased joint to perform normal joint functions. However, studies have shown that the implanted hip joints after total hip arthroplasty (THA) generated wear debris particles during long-term wear, which can cause symptoms such as osteolysis and prosthesis loosening, and eventually lead to prosthesis failure, requiring patients to undergo revision surgery [1,2,3]. Improving the performance of wear materials is one effective method to reduce wear in artificial hip joints. Research on the wear materials of the acetabular liner and femoral head of artificial hip joints has found that ceramic-on-ceramic (COC) prostheses produce fewer wear particles compared to (1) metal-on-metal (MOM), (2) metal-on-polymer (MOP), and (3) ceramic-on-polymer materials (COP) [4,5,6,7,8].
However, numerous studies have also indicated that COC prostheses may produce squeaking [9,10,11] compared with other materials. Walter et al. [10] found that the mechanisms causing squeaking include stripe wear, edge loading, third-body particles, and liner fracture. Among these, abnormal contact positions in the hip joint lead to lubrication imbalance and edge loading, which in turn leads to increased stripe wear and a higher degree of wear. Reducing the wear between friction pairs and improving the lubrication are the main strategies to extend the service life of materials. Furthermore, texturing surface is one of the important research directions for improving lubrication.
Surface texturing technology has been widely used in the field of wear-resistant ceramics, including cutting tools, plungers, bearings and mechanical seal rings [12,13,14,15]. The tribological properties of ceramic materials with surface texture have been greatly improved. Surface textures are categorized based on their geometric structures into the following functions [16]: (a) lubricant reservoirs and accumulating wear debris; (b) micro-hydrodynamic bearings; and (c) reducing the nominal contact area. Different types of surface textures have quite significant differences in their impact on the tribological properties of ceramic materials. Roy et al. [17] performed Pin-on-disk (PoD) friction experiments using a ceramic pin articulating with a textured and smooth ceramic disk and determined that the friction coefficient decreased by 17% and wear decreased by 53% for the textured compared to the smooth ceramic disks. Han et al. [18] compared the friction reduction properties of ZrO2 ceramics with different surface texture shapes (circular, elliptical, triangular, fish-scale-like) through numerical simulation and experiments and found that the ZrO2 ceramics with a fish-scale-like texture had a higher fluid film carrying capacity, resulting in the lowest friction coefficient. Zou et al. [19] fabricated pit-type surface textures with different diameters (15–85 μm), depths (5–16 μm), and area ratios (0.5–6.0%) on the surface of Si3N4 ceramics and investigated the tribological properties of Si3N4 ceramics with surface textures of different geometric parameters under water lubrication conditions. It was found that when the diameter of the pit-type surface texture was 22 μm, the depth was 11 μm, and the area ratio was 2.0%, the ceramics had the most excellent tribological properties. Hao et al. [20] used FEA simulation to solve the friction coefficient of textured zirconia ceramic artificial hip joint materials. It was found that within the area ratio of 5–25%, the average fluid film bearing capacity of the three textures (cylindrical, diamond-shaped, and circular-ring) increased as the area ratio increased, and the friction coefficient decreased as the area ratio increased. The best values were obtained when the area ratio was 25%. Different ceramics have different optimal surface texture types. Therefore, texture size and density are key parameters affecting lubrication performance.
The existing research on the surface textures of COC hip joints mainly focuses on the influence of texture shapes and densities on the wear resistance and lubrication of ceramic materials. However, the working conditions (sliding distance, sliding speed, loading) also affect the lubricating fluid film formed by the COC friction. The lubricating performance of the same texture parameters varies under different working conditions. Choudhury et al. [21] measured the friction coefficient between textured ( S p = 0.09 , ε = 0.23 ) and DLC-coated stainless steel femoral heads and the ceramic acetabular liners using pendulum hip joint simulators (HJS). They found that the smooth DLC coating initially reduced the friction coefficient more than the femoral heads with the combination of texture and coating by 88%. The femoral heads with texture and coating maintained a constant friction coefficient during repeated tests, while the friction coefficient of the femoral heads with smooth coating increased by nearly 24% within the same time interval. Theoretically, there is an optimal texture ratio under specific working conditions. The exploration of the texture design on the surfaces of COC hip prostheses is still insufficient.
This study proposes a research method that is based on the EHL model of textured prostheses under ISO standard gait. The EHL model utilizes the finite difference method to discretize the governing equations, and the results solve the pressure distribution and film thickness within the lubrication film. It also investigates the influence of surface texture parameters ( S p = 0.05 , 0.15 , 0.35 , ε = 0.075 , 0.1 , 0.15 ) on the tribological performance of prostheses under fluid lubrication conditions. The aim of this study is to explore the feasibility of introducing texture design to enhance lubrication ability, reducing squeaking in COC joints.

2. Methods

2.1. Materials

In this study, a hard-on-hard artificial hip replacement structure was adopted, and the theoretical framework for calculating the wear of hard materials has been established in a previous study [22]. The elastic modulus, size of ceramic hip joint materials, texture parameters of the hip joint surface and lubricating medium are summarized in Table 1, where the texture aspect ratio is determined by the texture depth and the texture diameter. According to the lubrication mechanism of the texture, set the texture diameters to 0.2 mm, 0.3 mm and 0.4 mm, respectively. For effectively calculating the Reynolds equation of the EHL model and considering the range in which the texture density causes significant changes in the lubricating fluid film pressure, the texture densities are taken as 0.05, 0.15 and 0.35.

2.2. Establishing Hip Joint EHL Model

The tribological component of artificial hip joints can be simplified into two friction pairs: the acetabular liner surface is smooth, while the femoral head surface is textured. The simplified model of the artificial hip joint is shown in Figure 1. Existing studies typically use pin-on-disk or ball-on-disk models to verify the lubrication performance of prosthesis interface friction. In these models, the components in contact move linearly or in a circular motion on a plane, with the relative sliding speed of the friction pairs selected between 0.027 and 2 m/s [23,24]. However, the combination of multi-directional angular displacement and axial load based on the walking cycle will produce an elliptical wear area on the joint surface, the wear depth within the wear area will affect the degree of wear. It was reported [25,26] in the literature that different joint sliding distances in different hip joint simulators will lead to different wear rates. Therefore, this study uses the standard gait as the working condition shown in Figure 1a. The cup axis is inclined at a certain angle to the load application axis and covers the femoral head. The liner diameter of the liner is slightly larger than the outer diameter of the femoral head, as shown in Figure 1b. The gap between the liner and the femoral head stores lubricating fluid, which reduces friction and wear of the assembly.
Under the transient elastohydrodynamic lubrication (EHL) condition and gait condition shown in Figure 2, the film thickness varies with time. The corresponding Reynolds equation [27] for this model in spherical coordinates is expressed as:
φ h 3 p φ + sin θ θ h 3 p θ = 6 η R 2 sin θ [ ω x sin φ sin θ h θ + cos φ cos θ h φ + ω y cos φ sin θ h θ sin φ cos θ h φ + ω z sin θ h φ ] + 12 η R 2 sin 2 θ h t
where φ is the polar coordinate direction along the axis of flexion/extension; θ is the polar coordinate direction along the axis of adduction/abduction; ω x , y , z are the angular velocity components along the three axes; R is the radius of the femoral head in mm; p represents the pressure of the lubricating fluid film in MPa; h is the film thickness on surface; η is the dynamic viscosity of the Newtonian fluid in MPa·s; and t is time.
The linear velocity at any point on the femoral head is determined by the angle between the position of that point and the center of the sphere. The expression for the linear velocity was described as:
v θ = R ω x sin φ + R ω y cos φ v φ = R ω x cos φ cos θ R ω y sin φ cos θ
The applied load ( w ) was balanced by the integral of the hydrodynamic pressure in the three Cartesian coordinate dimensions:
f x , y , z = R 2 φ θ p x , y , z d θ d φ = w x , y , z p x = p sin 2 θ cos φ p y = p sin 2 θ sin φ p z = p sin θ sin θ

2.3. Construct the Film Thickness Field with Texture

A texture control unit as shown in Figure 3 is created on the surface of the femoral head. The texture is designed in the shape of a square with a side length of L . The cylindrical texture has a radius of r , and the texture is a flat-bottomed dimple with a depth of h p . The plane depth of the textured unit is:
Establishing the Surface Texture Film Thickness Field: (1) Construct a spherical coordinate system with the center of the femoral head as the origin, as shown in Figure 1c. (2) Divide into a grid with N rows and M columns in the φ and θ directions. (3) Further Subdivision: Divide the grid units and arrangements of equivalent texture size and density according to the actual size of the femoral head. Combining the deformation of the ceramic material under fluid film pressure and the eccentric component, the film thickness field expression for the surface as:
h = c e x sin θ cos φ e y sin θ sin φ e x cos θ + δ φ , θ + h p φ , θ
where c is the radial clearance between the acetabular liner and femoral head in µm; e x , y , z are the eccentricity components along the three axes. The elastic deformation of the femoral head δ is expressed as:
δ φ , θ = φ θ K φ φ , θ θ , θ m · p φ , θ d θ d φ
where in the elastic deformation, K denotes the influence coefficient matrix of the elastic surfaces and θ m denotes a fixed mean latitude; h p is the depth of the film thickness field. In the smooth area h p = 0 , while in the textured area, its value is the relative value of texture depth and clearance. The texture units cover the femoral head according to different texture parameters (size and density).

2.4. Solving the Reynolds Equation

Non-dimensionalization not only reduces the number of variables in the control equation during the solution process using characteristic length and characteristic velocity but also leads to universally applicable solutions represented by non-dimensional parameters. The defined non-dimensional parameters are as follows:
P = p / E , H = h / c , Δ = δ / c , W x , y , z = w x , y , z / E R 2 , F x , y , z = f x , y , z / E R 2 , ε = c 2 E · H 3 / 6 η R 2 ω 0 , Ω x , y , z = ω x , y , z / ω 0 , T = t · ω 0 , e ¯ x , y , z = e x , y , z / c
By substituting the non-dimensional parameters into the Reynolds Equation (1) of the model, where E is the material elastic modulus, P is the non-dimensionalized pressure at point ( φ , θ ) , and H is the non-dimensionalized fluid film thickness at point ( φ , θ ) , the normalized governing equation is derived as:
φ H 3 P φ + sin θ θ H 3 P θ = 1 ε [ Ω x sin φ sin θ H θ + cos φ cos θ H φ + Ω y cos φ sin θ H θ sin φ cos θ H φ + Ω z sin θ H φ ] + 12 η R 2 sin 2 θ H T
Equation (7) is subjected to pressure iteration using the Gauss–Seidel relaxation method. For ensuring discrete consistency, Multi-Grid techniques are employed to mesh the EHL model into M × N (where M = N = 129), and the numerical method used to solve the lubrication equation is the same as that in Ref. [28]. The numerical simulation was implemented in GNU FORTRAN and compiled using CodeBlocks 20.03.
The determination method for computational accuracy is shown in Equation (8), where k represents the number of iterations, and E p represents the error limit.
i = 1 m i = 1 n P i , j k + 1 P i , j k / i = 1 m i = 1 n P i , j k + 1 E p
For this calculation, E p = 0.01 . According to the convergence determination formula, when the difference between successive iteration numbers ≤ E p , the computation is considered converged, and the iterative calculation loop ends. The error limit E p is positively correlated with the convergence speed, but a larger E p will decrease the computational accuracy. The pressure value obtained from the previous iteration loop can be directly substituted into Equation (8) to calculate the fluid film pressure value at a particular node. However, this approach leads to slower convergence and increased computational iterations. To accelerate convergence, a relaxation factor ω (0.5 < ω < 2) is introduced after a certain node pressure iteration calculation, resulting in Equation (9).
P i , j k + 1 = P i , j k + ω × P i , j k + 1 P i , j k + 1
The fluid film load is expressed as the sum of p ( φ , θ ) over the φ and θ directions on the spherical surface. Additionally, by taking the partial derivative of the femoral head’s convective velocity, the expression for fluid film shear resistance is Equation (10). Finally, the friction factor f is used to characterize the lubrication performance of the texture.
D = i = 1 n j = 1 m p φ , θ Δ θ Δ φ F = τ d θ d φ = i = 1 n j = 1 m 1 2 p x + U h η Δ θ Δ φ f = F / D
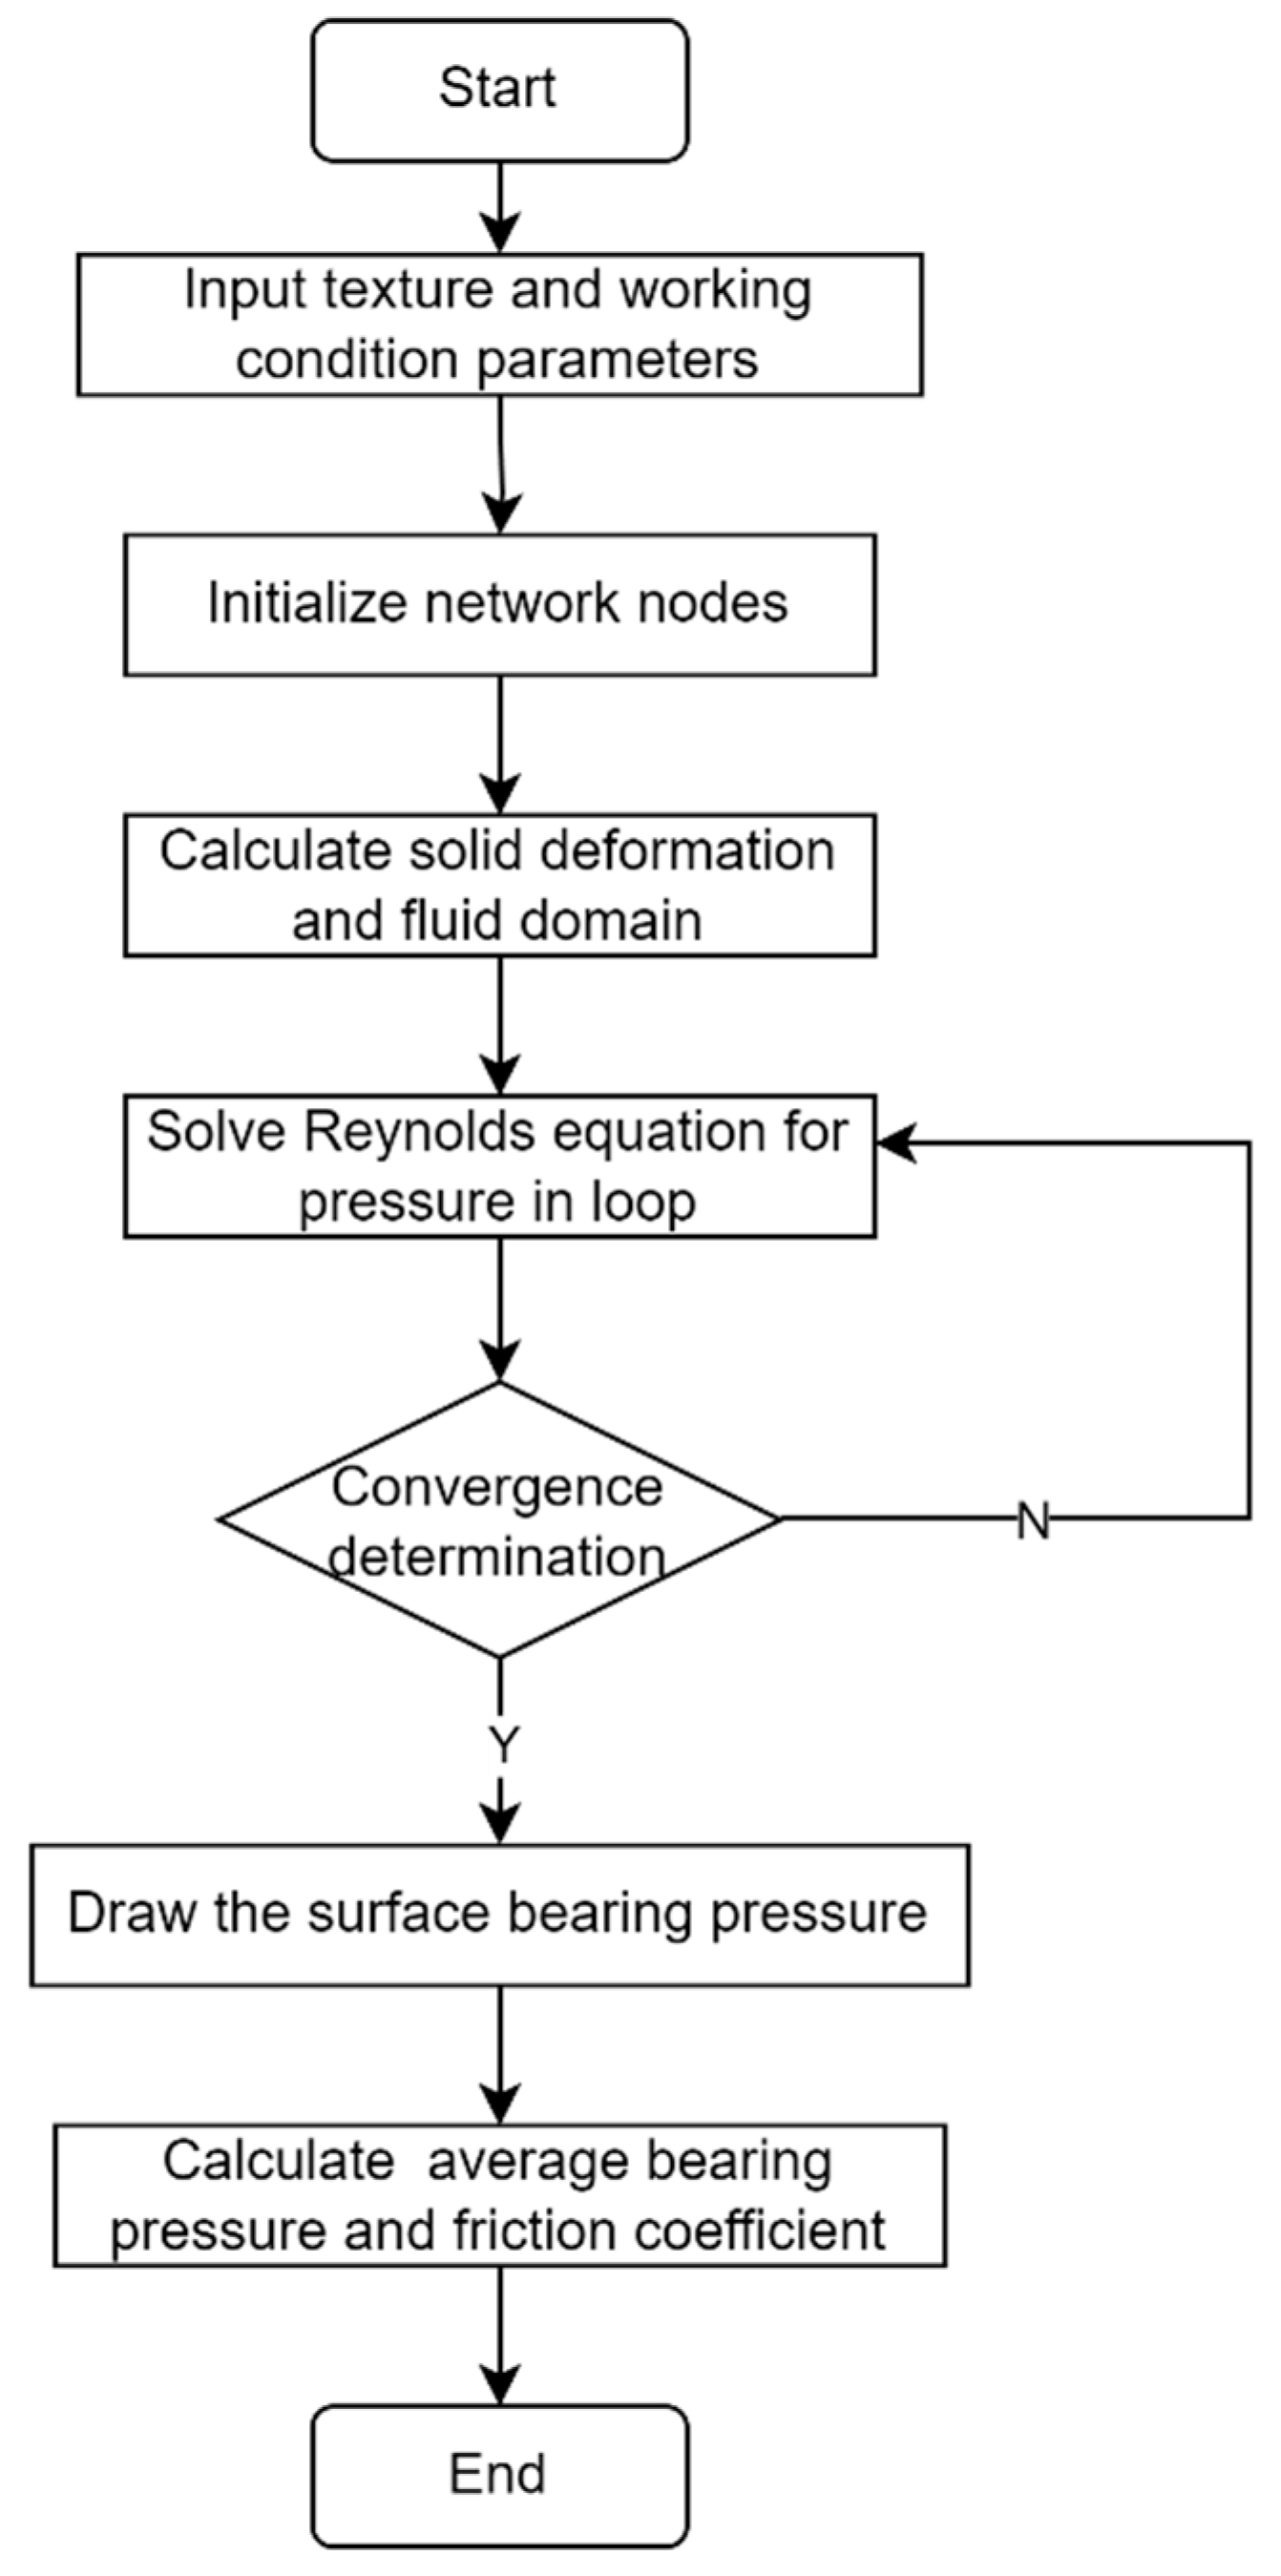
The procedure for solving an EHL model of hip joints is shown in Figure 4.

3. Results

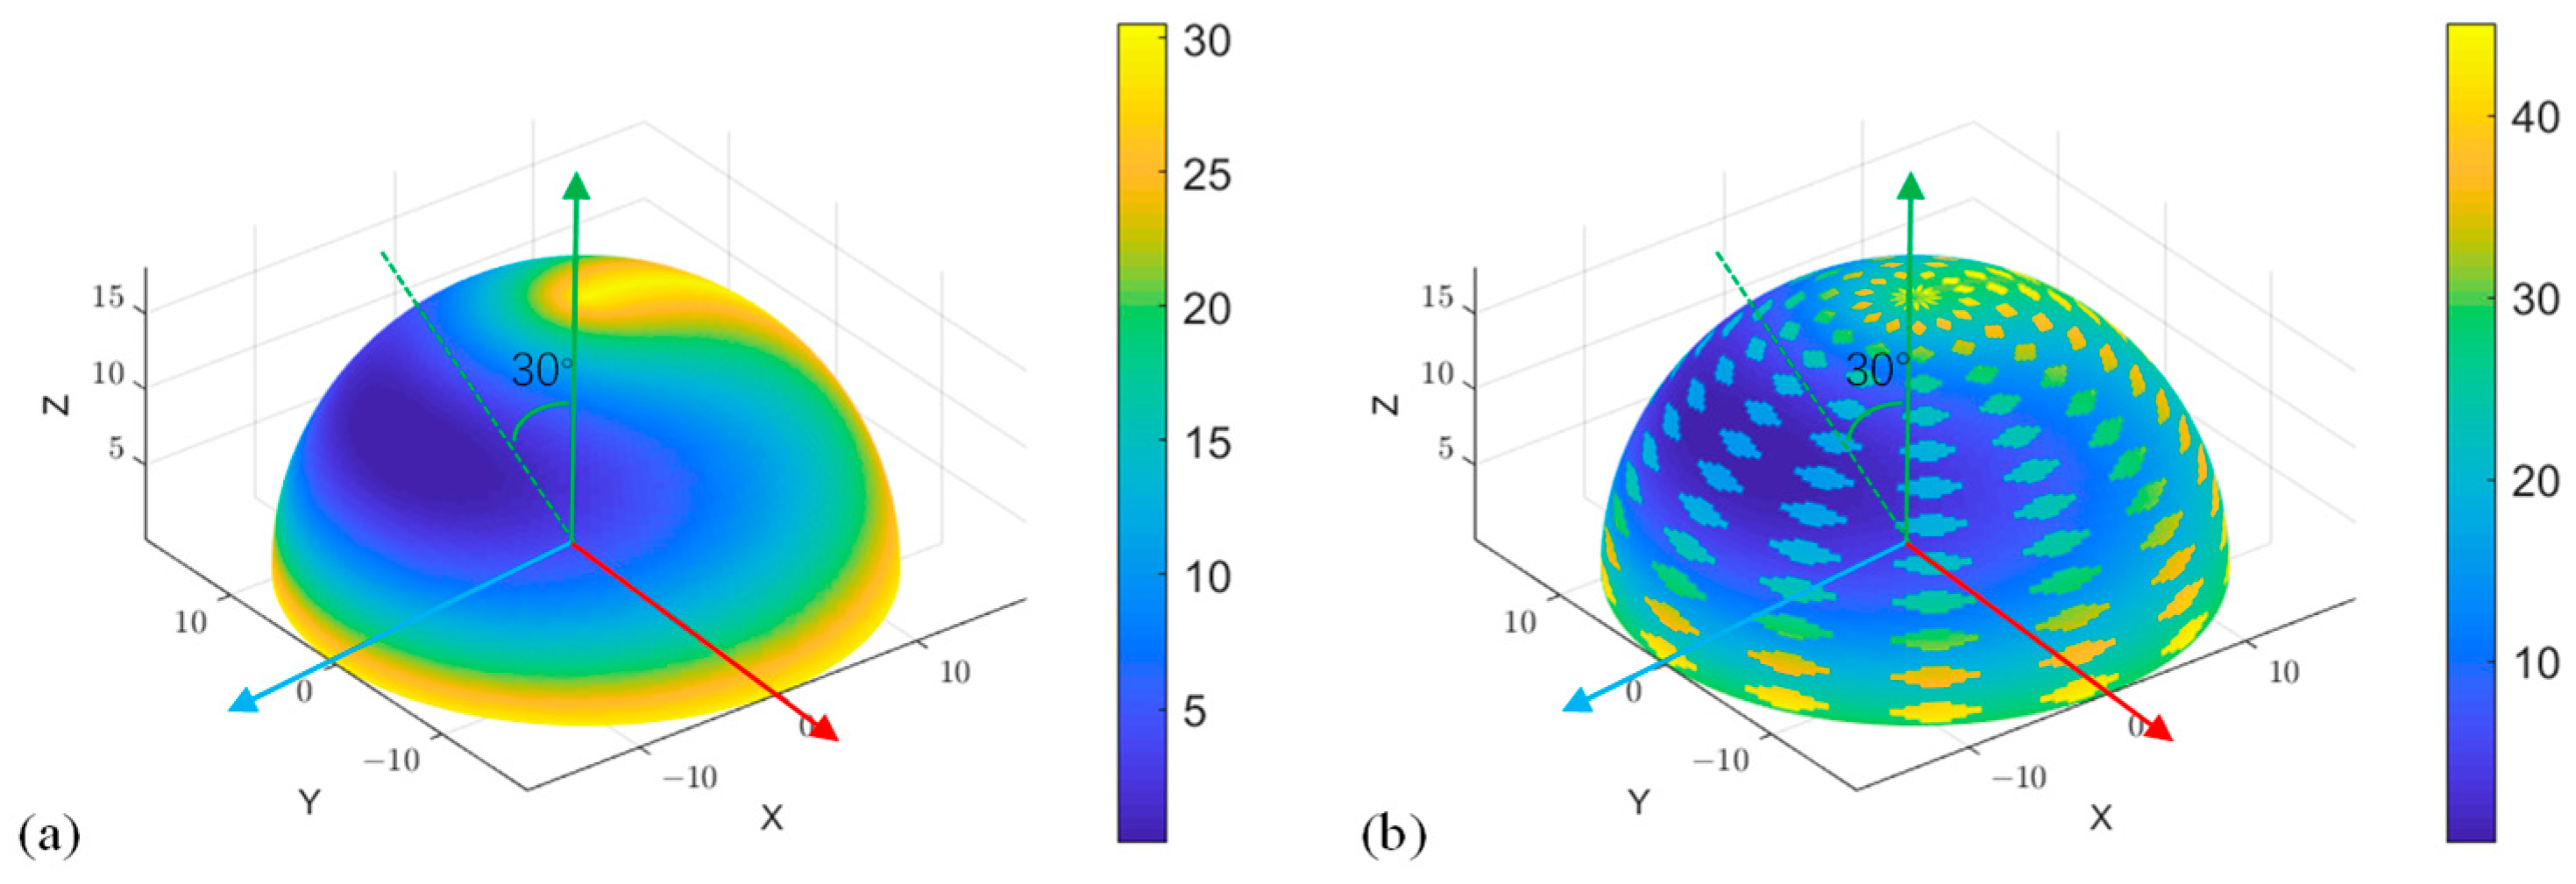
Considering that there is no significant difference in the film thickness on the surface of the hip joint between the stance phase and the swing phase, the moment when the fluid film bearing capacity reaches its maximum is selected as the condition for the film thickness analysis. During the stance phase of the standard gait cycle (Cycle Time = 12%), the film thickness distribution in the EHL model mapped onto the surface of the hip joint is shown in Figure 5. Comparing the smooth surface and the textured surface, the film thickness at the non-textured areas of the textured surface is at the same level as that at the same positions on the smooth surface. However, the fluid film thickness inside the textured pits is higher than that of the surrounding smooth surface. This indicates that the textured surface has more space to store the lubricating fluid. The film thickness at the edge where the hip joint is perpendicular to the polar axis by 30° is lower than that at the edge, indicating that the lubrication environment at the edge is worse than that at the center.
The motion speed and loading generated during the swing phase of the hip joint in a standard gait cycle change the film thickness and load-carrying capacity on the fluid film surface. The results of the film thickness and load-carrying capacity per gait cycle under different texture density and aspect ratio parameters of the hip joint are shown in Figure 6, in which the pressure represents the maximum value of the load-carrying capacity on the fluid film surface within the cycle. Combining the load change in Figure 2 and the pressure change in Figure 6, it is found that the trend of the fluid film pressure is mainly affected by the axial load applied to the hip joint, and when ε = 0.075 , it significantly affects the amplitude of the oil film pressure. When the load experiences the change from the peak to the trough and then to the peak, the overall trend of the oil film pressure also changes. When the movement of the hip joint transitions from the swing phase to the stance phase, as the axial load decreases to around 300 N, the fluid film pressure also decreases accordingly to a stable range. The average load-carrying capacity of the fluid film is obtained by calculating the mean of all pressure values and film thicknesses within the calculation cycle in Figure 7.
By comparing nine design groups and one control group with different texture densities and texture aspect ratios in Table 2, the following conclusions can be drawn: The minimum film thickness on the surface of the hip joint is inversely proportional to the average pressure of the fluid film. A larger fluid film pressure indicates better lubrication performance. As the texture density increases from 0.05 to 0.35, the variation trend of the fluid film pressure first decreases and then increases, and as the texture aspect ratio increases from 0.075 to 0.15, the fluid film pressure gradually increases. The shear stress of the grid unit is calculated according to the Newtonian fluid shear stress formula, and the friction coefficients of different textured surfaces in Figure 8 are calculated based on the shear stress structure. Compared with the fluid film pressure and friction coefficient of the smooth surface of the hip joint in Table 2, the hip joint with a textured surface has a larger fluid film pressure and a smaller friction coefficient during the friction process, which indicates that the surface texture design can significantly improve the lubrication performance.
Orthogonal experimental analysis can evenly examine the influence of various factors on the objective function, and it can help determine which combinations of factors may lead to local optimal solutions. The fuzzy comprehensive evaluation is used to evaluate the membership degree of the lubricity of the textured surface from multiple factors. Orthogonal analysis is carried out for the textured surface with two factors and three levels. Take the fluid film bearing capacity, film thickness and friction coefficient as the evaluation factors to establish a factor set, and use the data in Table 2 as the evaluation set to construct a fuzzy membership degree matrix R . In actual evaluation, it is required that the larger the fluid film bearing capacity is, the better, which is a larger preference factor. The smaller the film thickness and the friction coefficient are, the better, both of which are smaller preference factors. The membership function is shown in Equation (11) as follows:
r 1 n = min ( p ) p min ( p ) max ( p ) , r 2 n = h max ( h ) min ( h ) max ( h ) , r 3 n = f max ( f ) min ( f ) max ( f ) ( 1 n 9 )
where r 1 n is the 1st membership degree value of the fluid film bearing capacity, r 2 n is the 2nd membership degree value of the film thickness, and r 3 n is the 3rd membership degree value of the friction coefficient. Substitute the data in Table 2 to calculate the fuzzy membership degree matrix R :
R = 0 0.1205 0.1671 0.8922 0.1122 0.048 0.7017 0.4734 1 0.3926 0.2683 0.6305 1 0.2328 0 0.8902 0.3858 0.6239 0.8254 0.7677 0.8319 0.9572 0.6384 0.6593 1 0.3605 0
Considering both lubrication and wear resistance [29,30], the weight ratio is assigned as A = [ 0.3 , 0.2 , 0.5 ] , and the fuzzy membership degree is H = A × R . Then, the calculation results of the membership degree are presented in Table 2.
Range analysis can determine which factors have a significant impact on the objective function through the mean response, thereby achieving more refined adjustment and optimization in the optimization process, with the expectation of finding a better local optimal solution. The results obtained from the range analysis in Minitab 21 are shown in Table 3. Texture density is a more significant factor in changing wear resistance.
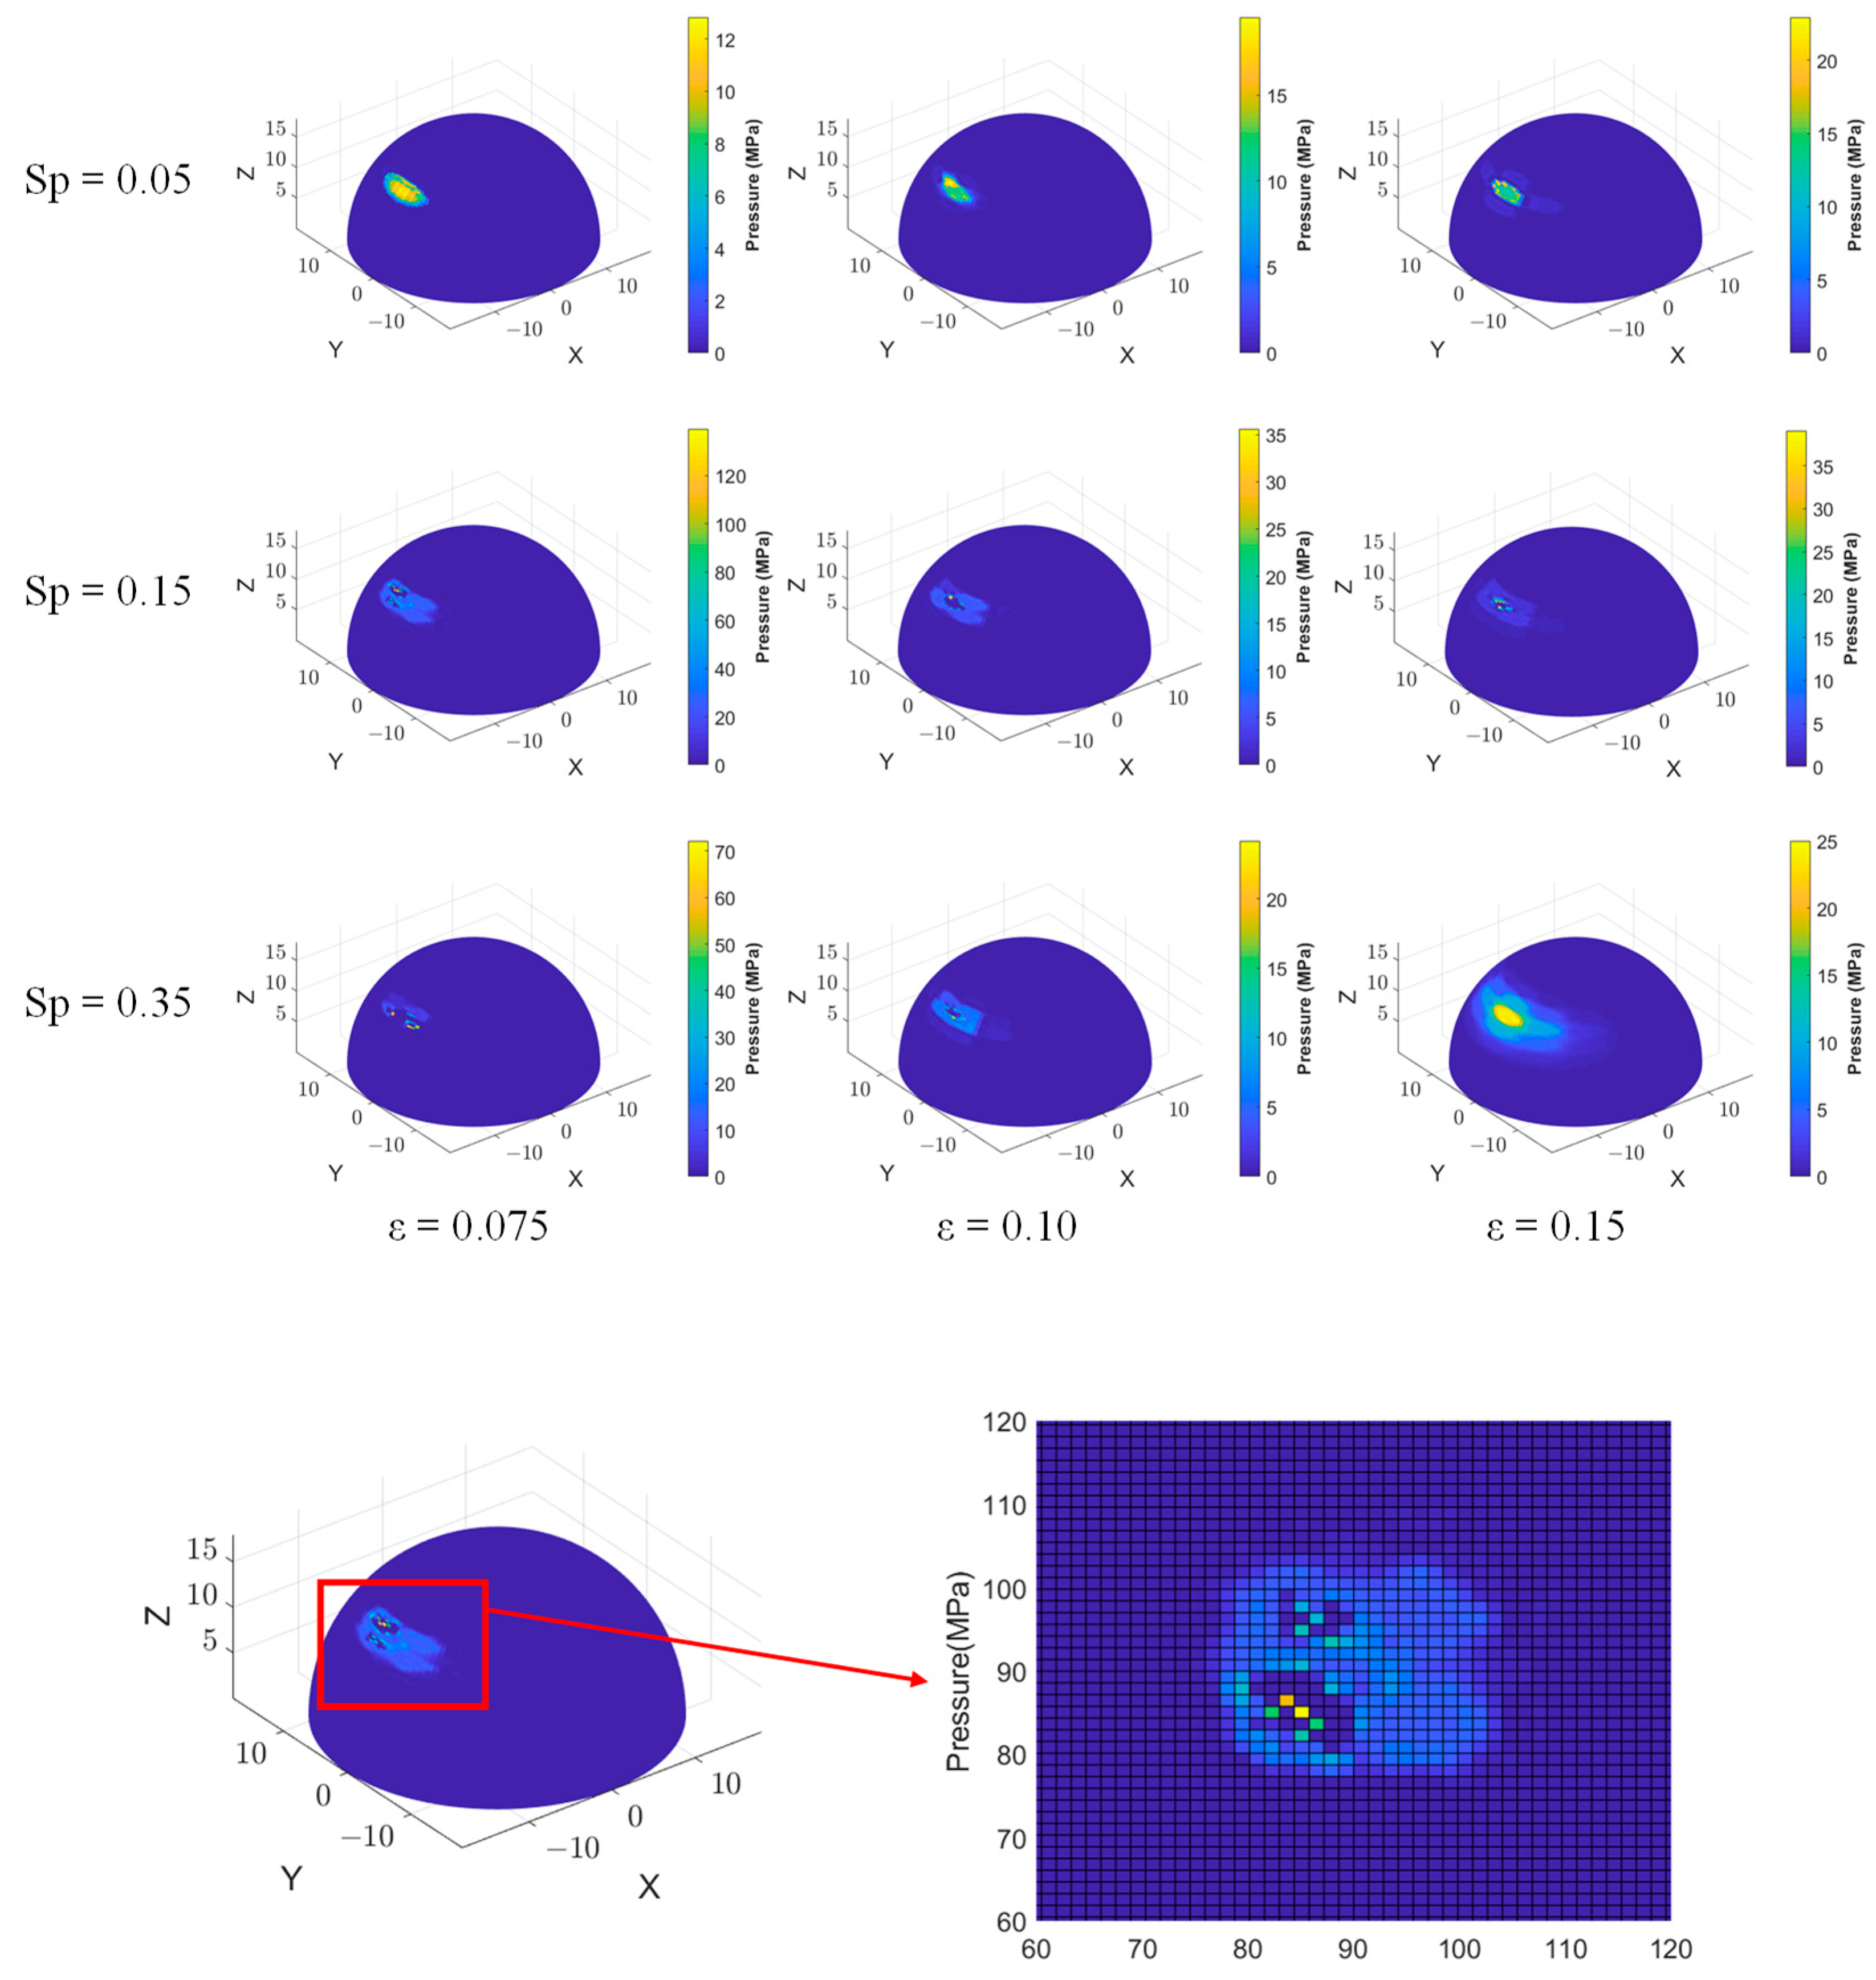
When comparing the surface fluid film pressure during the stance phase of gait in Figure 9, it was found that when ε = 0.075 , the fluid film pressure was relatively high and the friction coefficient was the smallest. The magnified view corresponds to S p = 0.15 , ε = 0.075 . It can be seen that this area is the location with a relatively severe degree of wear, as reported. This combination has a higher oil film load-bearing capacity, thus exhibiting better lubrication and anti-friction effects. This indicates that when the texture functions as a micro hydrodynamic bearing, it is more capable of reducing friction. Excessively high texture density will, on the contrary, reduce the elastohydrodynamic lubrication effect and fail to effectively reduce friction.
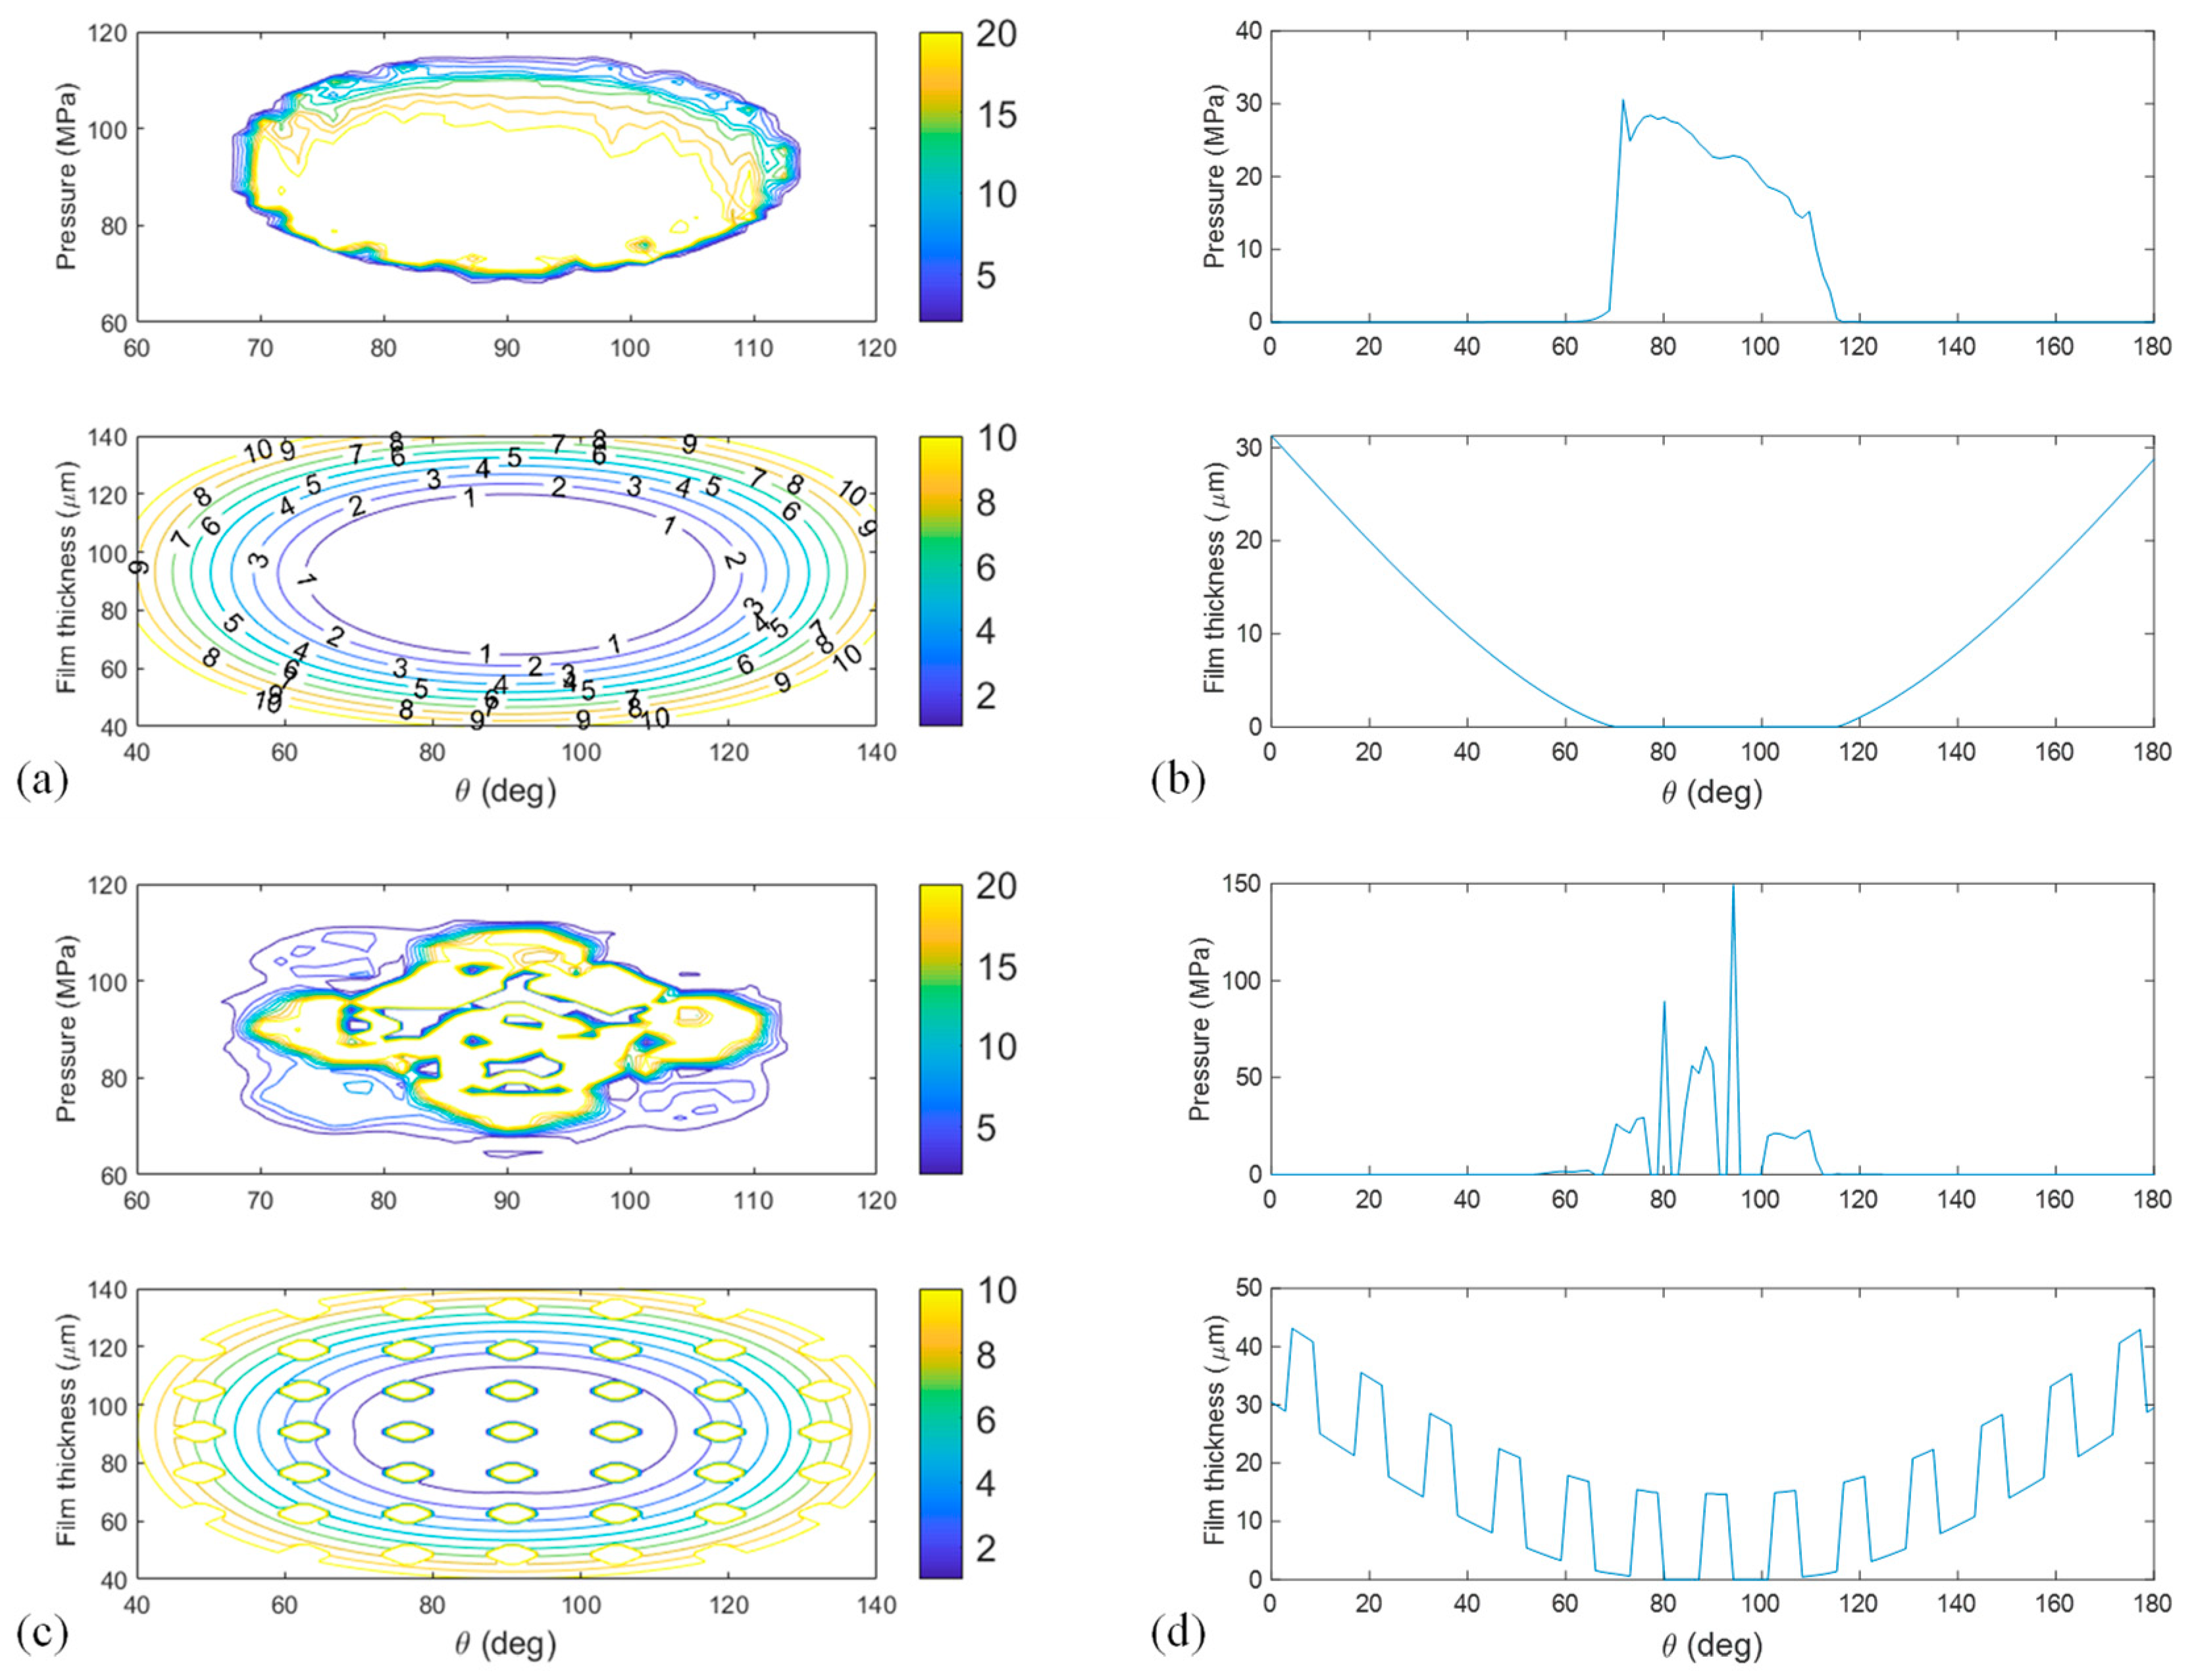
Comparing the pressure, film thickness contour diagrams and central sectional views of the smooth surface and the textured surface of the hip joint in Figure 10, it can be found that: (a) The pressure distribution on the smooth surface tends to be relatively uniform and gentle. Under the action of normal physiological loads, the pressure in the contact area between the femoral head and the acetabulum will gradually transition from the center to the periphery according to a certain pattern. (b) The pressure distribution of the texture becomes more complex and uneven. The instantaneous pressure fluctuations on the textured surface are affected by the undulating film thickness, making it easier to form tiny local buffer points, the large, concentrated pressure is dispersed to multiple local points, avoiding the generation of excessively high pressure over a large area. When the load changes, by means of the deformation characteristics of the texture, it can better buffer the pressure peaks, making the overall pressure change of the joint more reasonable during complex movements and reducing the impact load on the joint. (c) The film thickness at the center of the smooth surface is relatively thick and then gradually thins out towards the periphery. In contrast, the film thickness profile of the textured surface shows an “undulating” state, with local “high points” of film thickness formed at the textured areas.

4. Discussion

Texture features that act as lubricant reservoirs and accumulate wear debris typically have a larger aspect ratio ( ε > 0.1 ) since they need sufficient space to hold lubricants and debris [31]. In contrast, texture features that serve as micro-hydrodynamic bearings require a smaller aspect ratio ( ε < 0.1 ) to enhance lubricant film pressure [32]. It is important to note that the aspect ratio of the texture does not significantly affect the reduction of contact area; this reduction is dominantly determined by the texture density.
Through numerical simulation methods, Allen and Raeymaekers [33] determined that the impact of texture aspect ratio and texture density on the lubricating film thickness exhibits non-linear characteristics. Moreover, the influence of the shape of the texture on the bottom surface on the friction coefficient also demonstrates non-linear traits. Krupka [34] and Mourier [23] found that as the aspect ratio increases, the fluid shear effect gradually strengthens, which weakens the fluid dynamic pressure effect. When the aspect ratio ε is greater than 0.1, the role of texture in storing lubricating fluid and accumulating debris gradually increases, replacing the role of microfluidic hydrodynamic bearings. This may result in the actual clinical wear rate being lower than the CFD simulation results. Li et al. [35] investigated the effect of three different densities of hemispherical pits (5%, 13%, and 35%) at the ε ratio of 0.01. They found that the lowest friction coefficient was achieved with a density of 13%. Similarly, Raeymaekers et al. [36] found that aspect ratios of 0.006 and densities in the range of 0.1 to 0.3 produced the best results. A greater dimple aspect ratio will reduce the optimum dimple density. Although under the condition that the texture density parameters are approximately the same, the surface wear resistance shows different results. In the reference, a density of 15% has better wear resistance, while in this simulation result, it is lower than that at a density of 5%. This may be caused by the differences in materials, working conditions and optimization objectives.
Allen [33] suggested that when the area density reaches a certain level and continues to increase, overly dense texture distribution may lead to difficulties in establishing a stable lubricating fluid film. Judging from the in vitro results after surgical operations, overly dense texture distribution may lead to a situation where the wear resistance of the femoral head with a textured surface is poorer than that of the femoral head with a smooth surface. When there is no significant difference in the friction coefficient, texture size and density should prioritize the design for conditions with lower average fluid film load capacity to ensure a lower limit of service life. Meanwhile, if the textured surface is not processed promptly, it will cause stress concentration on the surface, which is more likely to result in the rupture of the liner. Moreover, ensuring that the textured processing does not cause damage to ceramic prostheses is also a major problem faced by the industry.

5. Conclusions

This study constructs a friction lubrication model for the interface of hip joint prostheses based on the fluid dynamics state equation. By solving the Reynolds equation, numerical values of fluid film load capacity and friction coefficient are obtained to characterize lubrication performance, leading to the following conclusions:
  • Within the range of aspect ratio from 0.075 to 0.15, the average bearing capacity of the fluid film shows a tendency to increase with the increase in aspect ratio, and the changing trend of the friction coefficient is the same as that of the average bearing capacity. The friction coefficient is lowest when ε = 0.075 .
  • Within the range of density from 0.05 to 0.35, with the increase in texture density, the average bearing capacity of the fluid film first decreases and then increases, while the friction coefficient also increases accordingly.
  • The fuzzy comprehensive evaluation found that the textured structure with a density of 0.15 and an aspect ratio of 0.075 is the local optimal solution for improving lubrication and wear resistance, and the density can affect the surface wear resistance to a greater extent.
  • Although the lubrication mechanism of the texture changes when the aspect ratio is greater than 0.1, considering that the amount of wear generated by ceramic hip joints is much lower than that of other materials, it is recommended to adopt the texture design with an aspect ratio of less than 0.1.

Author Contributions

Methodology, X.H.; Writing—original draft, Z.W.; Writing—review & editing, L.G. and Z.H. All authors have read and agreed to the published version of the manuscript.

Funding

This research received no external funding.

Data Availability Statement

The raw data supporting the conclusions of this article will be made available by the authors on request.

Conflicts of Interest

The authors declare no conflict of interest.

References

  1. Badarudeen, S.; Shu, A.C.; Ong, K.L.; Baykal, D.; Lau, E.; Malkani, A.L. Complications After Revision Total Hip Arthroplasty in the Medicare Population. J. Arthroplast. 2017, 32, 1954–1958. [Google Scholar] [CrossRef] [PubMed]
  2. Gundtoft, P.; Varnum, C.; Pedersen, A.B.; Overgaard, S. The Danish Hip Arthroplasty Register. CLEP 2016, 8, 509–514. [Google Scholar] [CrossRef] [PubMed]
  3. Gwam, C.U.; Mistry, J.B.; Mohamed, N.S.; Thomas, M.; Bigart, K.C.; Mont, M.A.; Delanois, R.E. Current Epidemiology of Revision Total Hip Arthroplasty in the United States: National Inpatient Sample 2009 to 2013. J. Arthroplast. 2017, 32, 2088–2092. [Google Scholar] [CrossRef] [PubMed]
  4. Neumann, D.R.P.; Thaler, C.; Hitzl, W.; Huber, M.; Hofstädter, T.; Dorn, U. Long-Term Results of a Contemporary Metal-on-Metal Total Hip Arthroplasty: A 10-Year Follow-Up Study. J. Arthroplast. 2010, 25, 700–708. [Google Scholar] [CrossRef]
  5. Whang, P.; Cher, D.; Polly, D.; Frank, C.; Lockstadt, H.; Glaser, J.; Limoni, R.; Sembrano, J. Sacroiliac Joint Fusion Using Triangular Titanium Implants vs. Non-Surgical Management: Six-Month Outcomes from a Prospective Randomized Controlled Trial. Int. J. Spine Surg. 2015, 9, 6. [Google Scholar] [CrossRef]
  6. Abdel Hameed, R.M.; Medany, S.S. Influence of Support Material on the Electrocatalytic Activity of Nickel Oxide Nanoparticles for Urea Electro-Oxidation Reaction. J. Colloid Interface Sci. 2018, 513, 536–548. [Google Scholar] [CrossRef]
  7. Pezzotti, G.; Saito, T.; Padeletti, G.; Cossari, P.; Yamamoto, K. Nano-Scale Topography of Bearing Surface in Advanced Alumina/Zirconia Hip Joint before and after Severe Exposure in Water Vapor Environment. J. Orthop. Res. 2010, 28, 762–766. [Google Scholar] [CrossRef]
  8. Perrichon, A.; Reynard, B.; Gremillard, L.; Chevalier, J.; Farizon, F.; Geringer, J. A Testing Protocol Combining Shocks, Hydrothermal Ageing and Friction, Applied to Zirconia Toughened Alumina (ZTA) Hip Implants. J. Mech. Behav. Biomed. Mater. 2017, 65, 600–608. [Google Scholar] [CrossRef]
  9. Imbuldeniya, A.M.; Pearce, S.J.; Walter, W.L.; Zicat, B.A.; Walter, W.K. Squeaking: Current Knowledge and How to Avoid It. Curr. Rev. Musculoskelet. Med. 2013, 6, 342–349. [Google Scholar] [CrossRef]
  10. Levy, Y.D. Review on Squeaking Hips. WJO 2015, 6, 812. [Google Scholar] [CrossRef]
  11. Walter, W.L.; Kurtz, S.M.; Esposito, C.; Hozack, W.; Holley, K.G.; Garino, J.P.; Tuke, M.A. Retrieval Analysis of Squeaking Alumina Ceramic-on-Ceramic Bearings. J. Bone Jt. Surg. Br. Vol. 2011, 93-B, 1597–1601. [Google Scholar] [CrossRef] [PubMed]
  12. Sugihara, T.; Enomoto, T. Performance of Cutting Tools with Dimple Textured Surfaces: A Comparative Study of Different Texture Patterns. Precis. Eng. 2017, 49, 52–60. [Google Scholar] [CrossRef]
  13. Niu, Y.; Hao, X.; Xia, A.; Wang, L.; Liu, Q.; Li, L.; He, N. Effects of Textured Surfaces on the Properties of Hydrodynamic Bearing. Int. J. Adv. Manuf. Technol. 2022, 118, 1589–1596. [Google Scholar] [CrossRef]
  14. Gavrilov, K.; Rozhdestvenskii, Y.; Umurzakov, I. A Method for Mathematical Modeling of Hydrodynamic Friction of Plunger Pairs with Consideration of Microgeometry. Mathematics 2023, 11, 2637. [Google Scholar] [CrossRef]
  15. Chen, T.; Ji, J.; Fu, Y.; Yang, X.; Fu, H.; Fang, L. Tribological Performance of UV Picosecond Laser Multi-Scale Composite Textures for C/SiC Mechanical Seals: Theoretical Analysis and Experimental Verification. Ceram. Int. 2021, 47, 23162–23180. [Google Scholar] [CrossRef]
  16. Allen, Q.; Raeymaekers, B. Surface Texturing of Prosthetic Hip Implant Bearing Surfaces: A Review. J. Tribol. 2021, 143, 040801. [Google Scholar] [CrossRef]
  17. Roy, T.; Choudhury, D.; Ghosh, S.; Bin Mamat, A.; Pingguan-Murphy, B. Improved Friction and Wear Performance of Micro Dimpled Ceramic-on-Ceramic Interface for Hip Joint Arthroplasty. Ceram. Int. 2015, 41, 681–690. [Google Scholar] [CrossRef]
  18. Han, Z.; Ma, L.; Yu, X.; Li, H.; Jiang, H. Numerical Simulation and Experimental Investigation on the Friction Reduction Properties of ZrO₂ by Laser Surface Texture. Appl. Phys. A 2024, 130, 64. [Google Scholar] [CrossRef]
  19. Zou, H.; Yan, S.; Shen, T.; Wang, H.; Li, Y.; Chen, J.; Meng, Y.; Men, S.; Zhang, Z.; Sui, T.; et al. Efficiency of Surface Texturing in the Reducing of Wear for Tests Starting with Initial Point Contact. Wear 2021, 482–483, 203957. [Google Scholar] [CrossRef]
  20. Hao, J.; Zhang, Q.; Zhang, C. Study on Tribological Properties of Artificial Hip Textured Surface. Lubr. Eng. 2023, 48, 55–61. [Google Scholar] [CrossRef]
  21. Choudhury, D.; Ay Ching, H.; Mamat, A.B.; Cizek, J.; Abu Osman, N.A.; Vrbka, M.; Hartl, M.; Krupka, I. Fabrication and Characterization of DLC Coated Microdimples on Hip Prosthesis Heads. J. Biomed. Mater. Res. 2015, 103, 1002–1012. [Google Scholar] [CrossRef] [PubMed]
  22. Gao, L.; Hua, Z.; Hewson, R. Can a “Pre-Worn” Bearing Surface Geometry Reduce the Wear of Metal-on-Metal Hip Replacements?—A Numerical Wear Simulation Study. Wear 2018, 406–407, 13–21. [Google Scholar] [CrossRef]
  23. Mourier, L.; Mazuyer, D.; Lubrecht, A.A.; Donnet, C. Transient Increase of Film Thickness in Micro-Textured EHL Contacts. Tribol. Int. 2006, 39, 1745–1756. [Google Scholar] [CrossRef]
  24. Zheng, Q.; Mao, L.; Shi, Y.; Zhang, C.; Hu, Y. Analysis of Biomimetic Texture Surface on Dynamic Compression Lubrication and Friction Reduction of Artificial Hip Pair. J. Mech. Eng. 2021, 57, 102. [Google Scholar] [CrossRef]
  25. Calonius, O.; Saikko, V. Slide Track Analysis of Eight Contemporary Hip Simulator Designs. J. Biomech. 2002, 35, 1439–1450. [Google Scholar] [CrossRef]
  26. Fisher, J.; Jin, Z.; Tipper, J.; Stone, M.; Ingham, E. Tribology of Alternative Bearings. Clin. Orthop. Relat. Res. 2006, 453, 25–34. [Google Scholar] [CrossRef]
  27. Gao, L. 16—Lubrication Modelling of Hip Joint Implants. In Computational Modelling of Biomechanics and Biotribology in the Musculoskeletal System, 2nd ed.; Jin, Z., Li, J., Chen, Z., Eds.; Woodhead Publishing Series in Biomaterials; Woodhead Publishing: Cambridge, UK, 2021; pp. 415–436. ISBN 978-0-12-819531-4. [Google Scholar]
  28. Gao, L.; Dowson, D.; Hewson, R.W. Predictive Wear Modeling of the Articulating Metal-on-Metal Hip Replacements. J. Biomed. Mater. Res. Part B Appl. Biomater. 2017, 105, 497–506. [Google Scholar] [CrossRef]
  29. Tewelde, F.B.; Allen, Q.; Zhou, T. Multiscale Texture Features to Enhance Lubricant Film Thickness for Prosthetic Hip Implant Bearing Surfaces. Lubricants 2024, 12, 187. [Google Scholar] [CrossRef]
  30. Niemczewska-Wójcik, M. Wear Mechanisms and Surface Topography of Artificial Hip Joint Components at the Subsequent Stages of Tribological Tests. Measurement 2017, 107, 89–98. [Google Scholar] [CrossRef]
  31. Zhang, H.; Hua, M.; Dong, G.; Zhang, D.; Chin, K.-S. A Mixed Lubrication Model for Studying Tribological Behaviors of Surface Texturing. Tribol. Int. 2016, 93, 583–592. [Google Scholar] [CrossRef]
  32. Codrignani, A.; Savio, D.; Pastewka, L.; Frohnapfel, B.; van Ostayen, R. Optimization of Surface Textures in Hydrodynamic Lubrication through the Adjoint Method. Tribol. Int. 2020, 148, 106352. [Google Scholar] [CrossRef]
  33. Allen, Q.; Raeymaekers, B. Maximizing the Lubricant Film Thickness Between a Rigid Microtextured and a Smooth Deformable Surface in Relative Motion, Using a Soft Elasto-Hydrodynamic Lubrication Model. J. Tribol. 2020, 142. [Google Scholar] [CrossRef] [PubMed]
  34. Křupka, I.; Hartl, M. Effect of Surface Texturing on Very Thin Film EHD Lubricated Contacts. Tribol. Trans. 2008, 52, 21–28. [Google Scholar] [CrossRef]
  35. Li, K.; Yao, Z.; Hu, Y.; Gu, W. Friction and Wear Performance of Laser Peen Textured Surface under Starved Lubrication. Tribol. Int. 2014, 77, 97–105. [Google Scholar] [CrossRef]
  36. Raeymaekers, B.; Etsion, I.; Talke, F.E. A Model for Magnetic Tape/Guide Friction Reduction by Laser Surface Texturing. Tribol. Lett. 2007, 28, 9–17. [Google Scholar] [CrossRef]
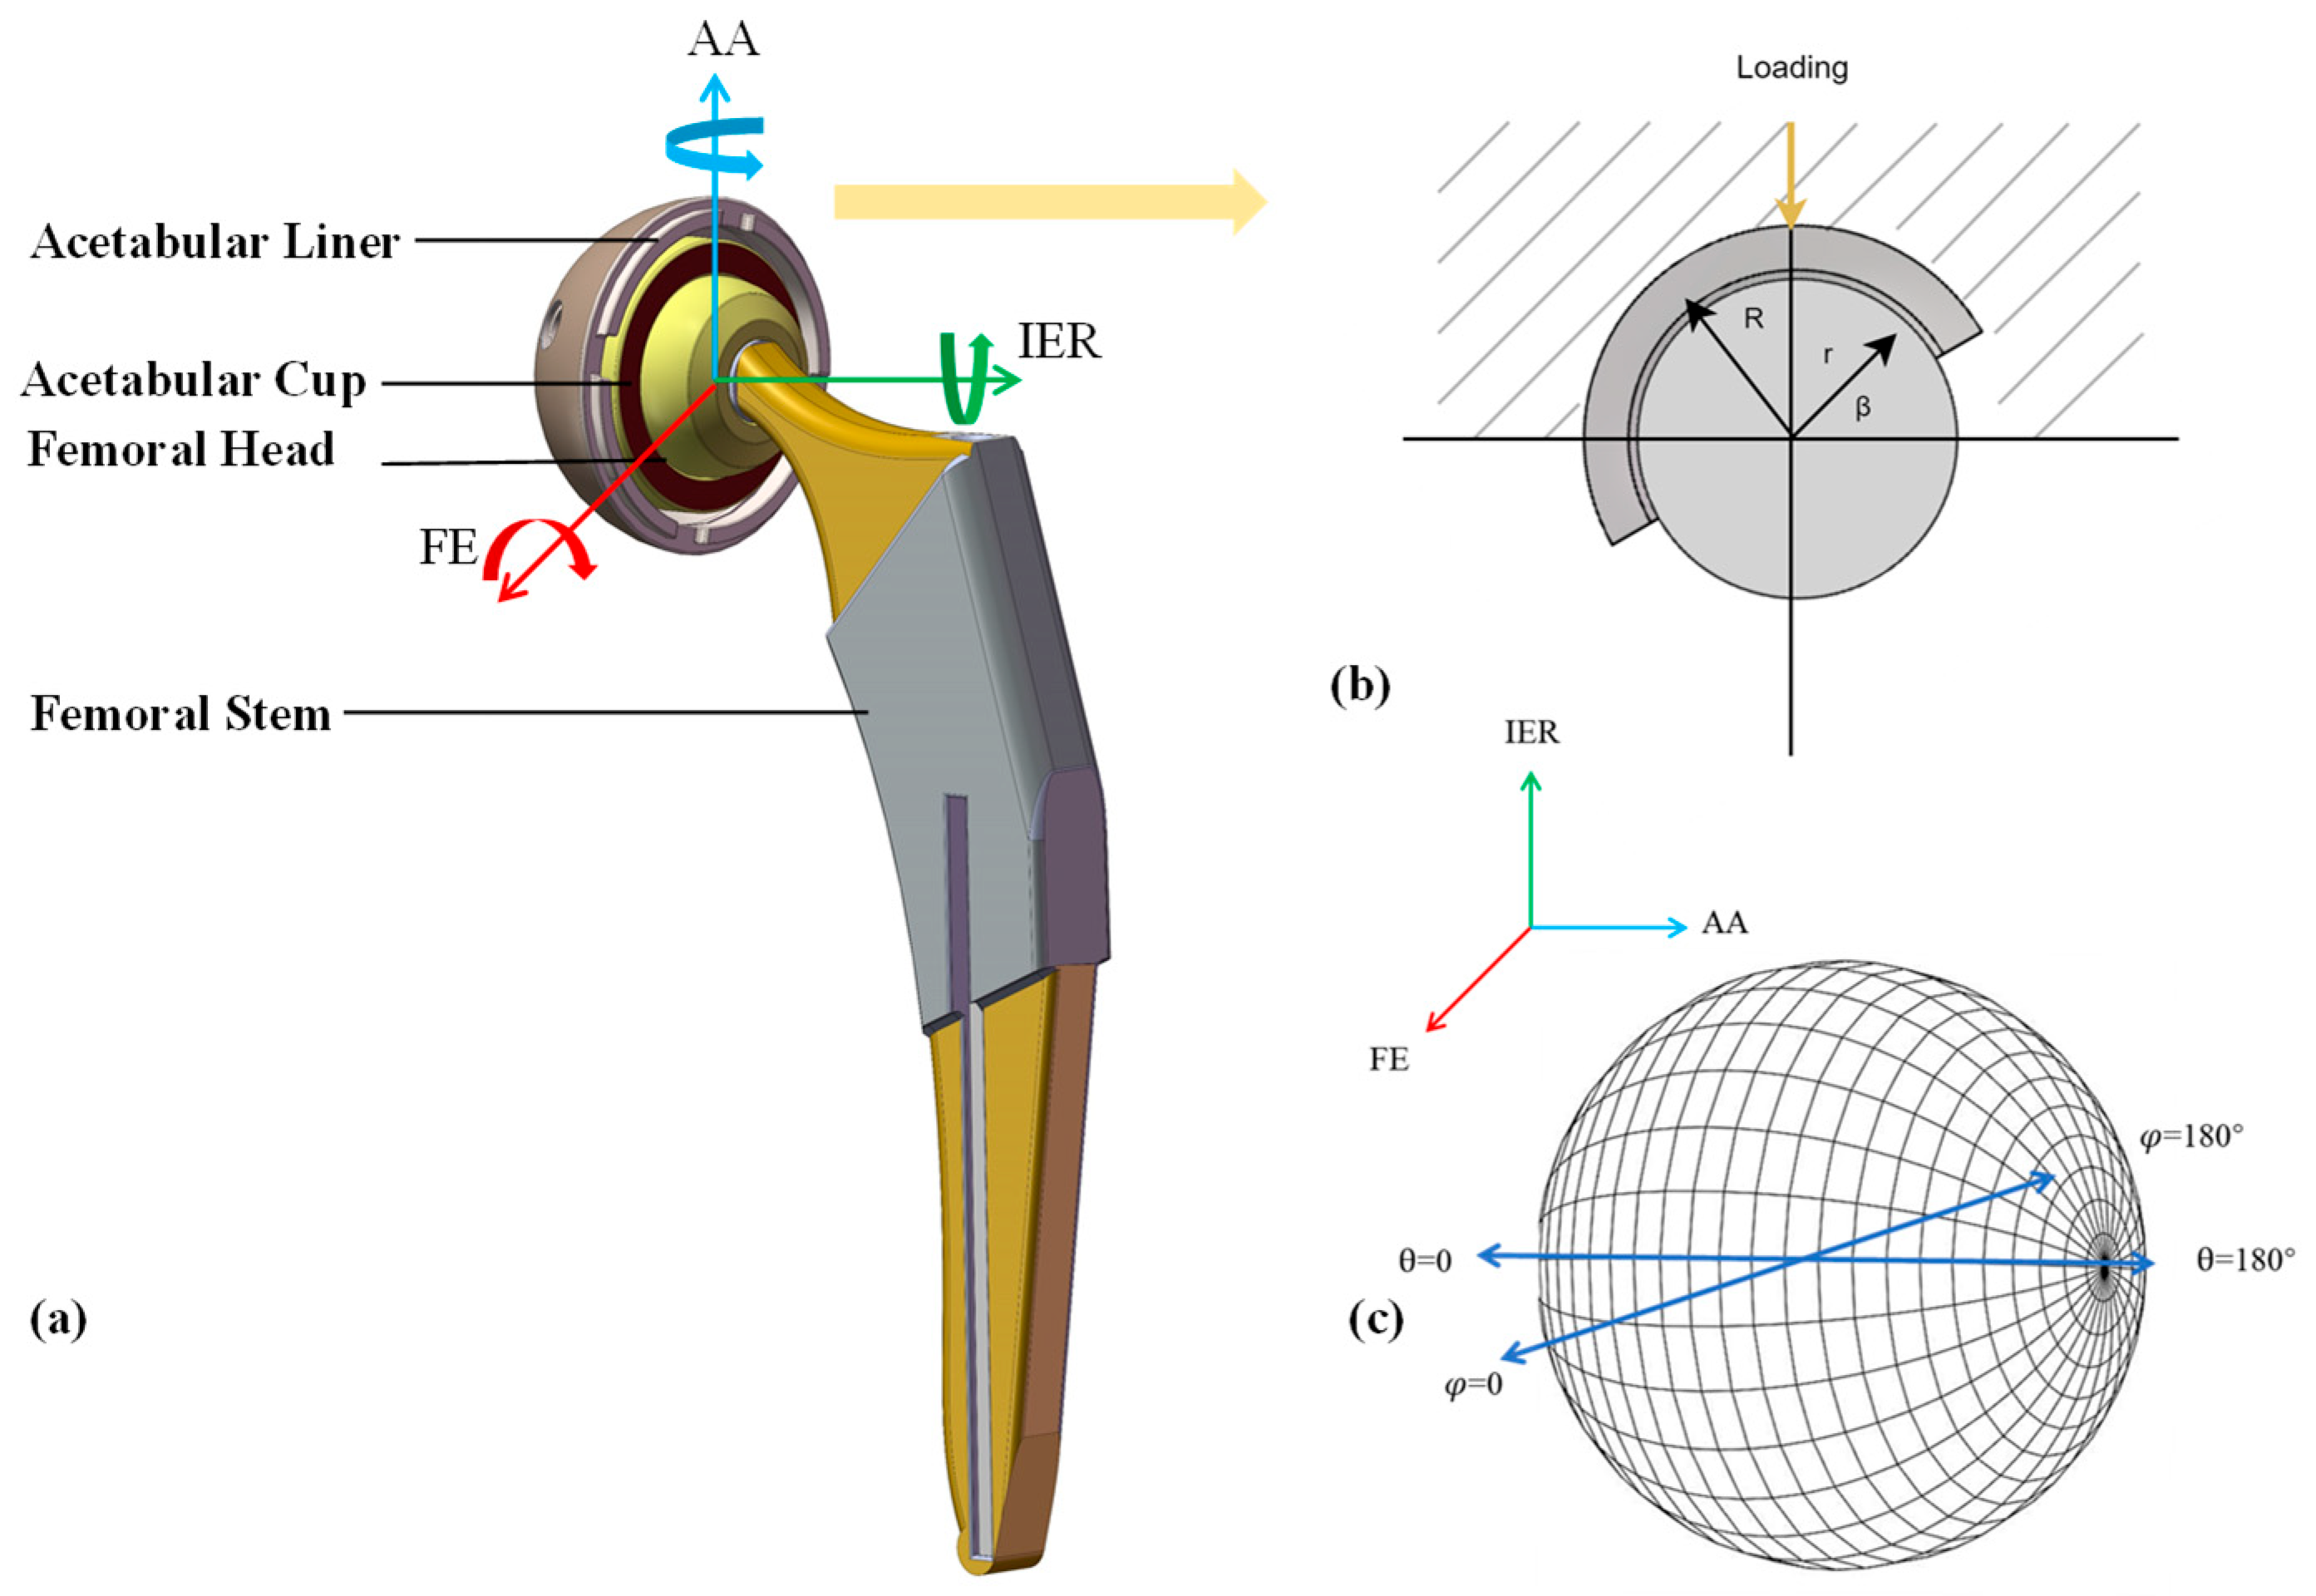
Figure 1. (a) Hip joint model schematic; (b) model cross-sectional view; (c) spherical coordinate of femoral head.
Lubricants 13 00217 g001
Figure 2. Gait condition: (a) ISO gait angle displacement; (b) ISO gait loading.
Lubricants 13 00217 g002
Figure 3. Textured unit on the hip joint surface.
Lubricants 13 00217 g003
Figure 4. Flow chart of solving EHL model procedure.
Lubricants 13 00217 g004
Figure 5. Distribution of the film thickness under the maximum load on: (a) smooth surface; (b) textured surface ( S p = 0.15 , ε = 0.075 ).
Lubricants 13 00217 g005
Figure 6. Load-carrying capacity within gait cycle.
Lubricants 13 00217 g006
Figure 7. Average bearing pressure and minimum film thickness.
Lubricants 13 00217 g007
Figure 8. Friction coefficient on the surface of the hip joint.
Lubricants 13 00217 g008
Figure 9. The surface fluid film pressure during the stance phase of gait.
Lubricants 13 00217 g009
Figure 10. The pressure and film thickness contour: (a) smooth surface; (b) textured surface; (c) central sectional views of the smooth surface; (d) central sectional views of the texture surface.
Lubricants 13 00217 g010
Table 1. Geometrical, material and texture parameters of a COC THR.
ParametersValue
Sphere Radius18 mm
Texturing Depth0.03 mm
Elastic modulus380 GPa
Dynamic Viscosity0.0009 Pa·s
Dimple Diameter0.2/0.3/0.4 mm
Dimple Density0.05/0.15/0.35
Table 2. Tribological parameters of the hip joint.
Texture ParametersAverage Bearing Pressure/MPaFriction CoefficientMembership Degree
Smooth28.940.013/
Sp = 0.05ε = 0.07546.740.00250.4912
Sp = 0.05ε = 0.1169.710.00160.4737
Sp = 0.05ε = 0.15143.460.00140.5922
Sp = 0.15ε = 0.07563.360.00290.9462
Sp = 0.15ε = 0.162.210.00370.3994
Sp = 0.15ε = 0.15111.980.00550.3442
Sp = 0.35ε = 0.07569.770.00240.8886
Sp = 0.35ε = 0.153.410.00360.3994
Sp = 0.35ε = 0.15184.560.00780.4248
Table 3. Range analysis.
LevelAspect RadioDensity
10.0025960.001830
20.0029600.004005
30.0048750.004595
Patch21
Disclaimer/Publisher’s Note: The statements, opinions and data contained in all publications are solely those of the individual author(s) and contributor(s) and not of MDPI and/or the editor(s). MDPI and/or the editor(s) disclaim responsibility for any injury to people or property resulting from any ideas, methods, instructions or products referred to in the content.