1. Introduction
In current simulations and experiments related to oil wear debris monitoring, spheres with varying diameters are commonly used to simulate and characterize wear debris. Wang et al. proposed a coaxial capacitive sensor network to monitor wear debris and simulated the effects of different spherical debris sizes on capacitance signals [
1,
2]. However, actual wear debris predominantly exhibits irregular shapes [
3,
4,
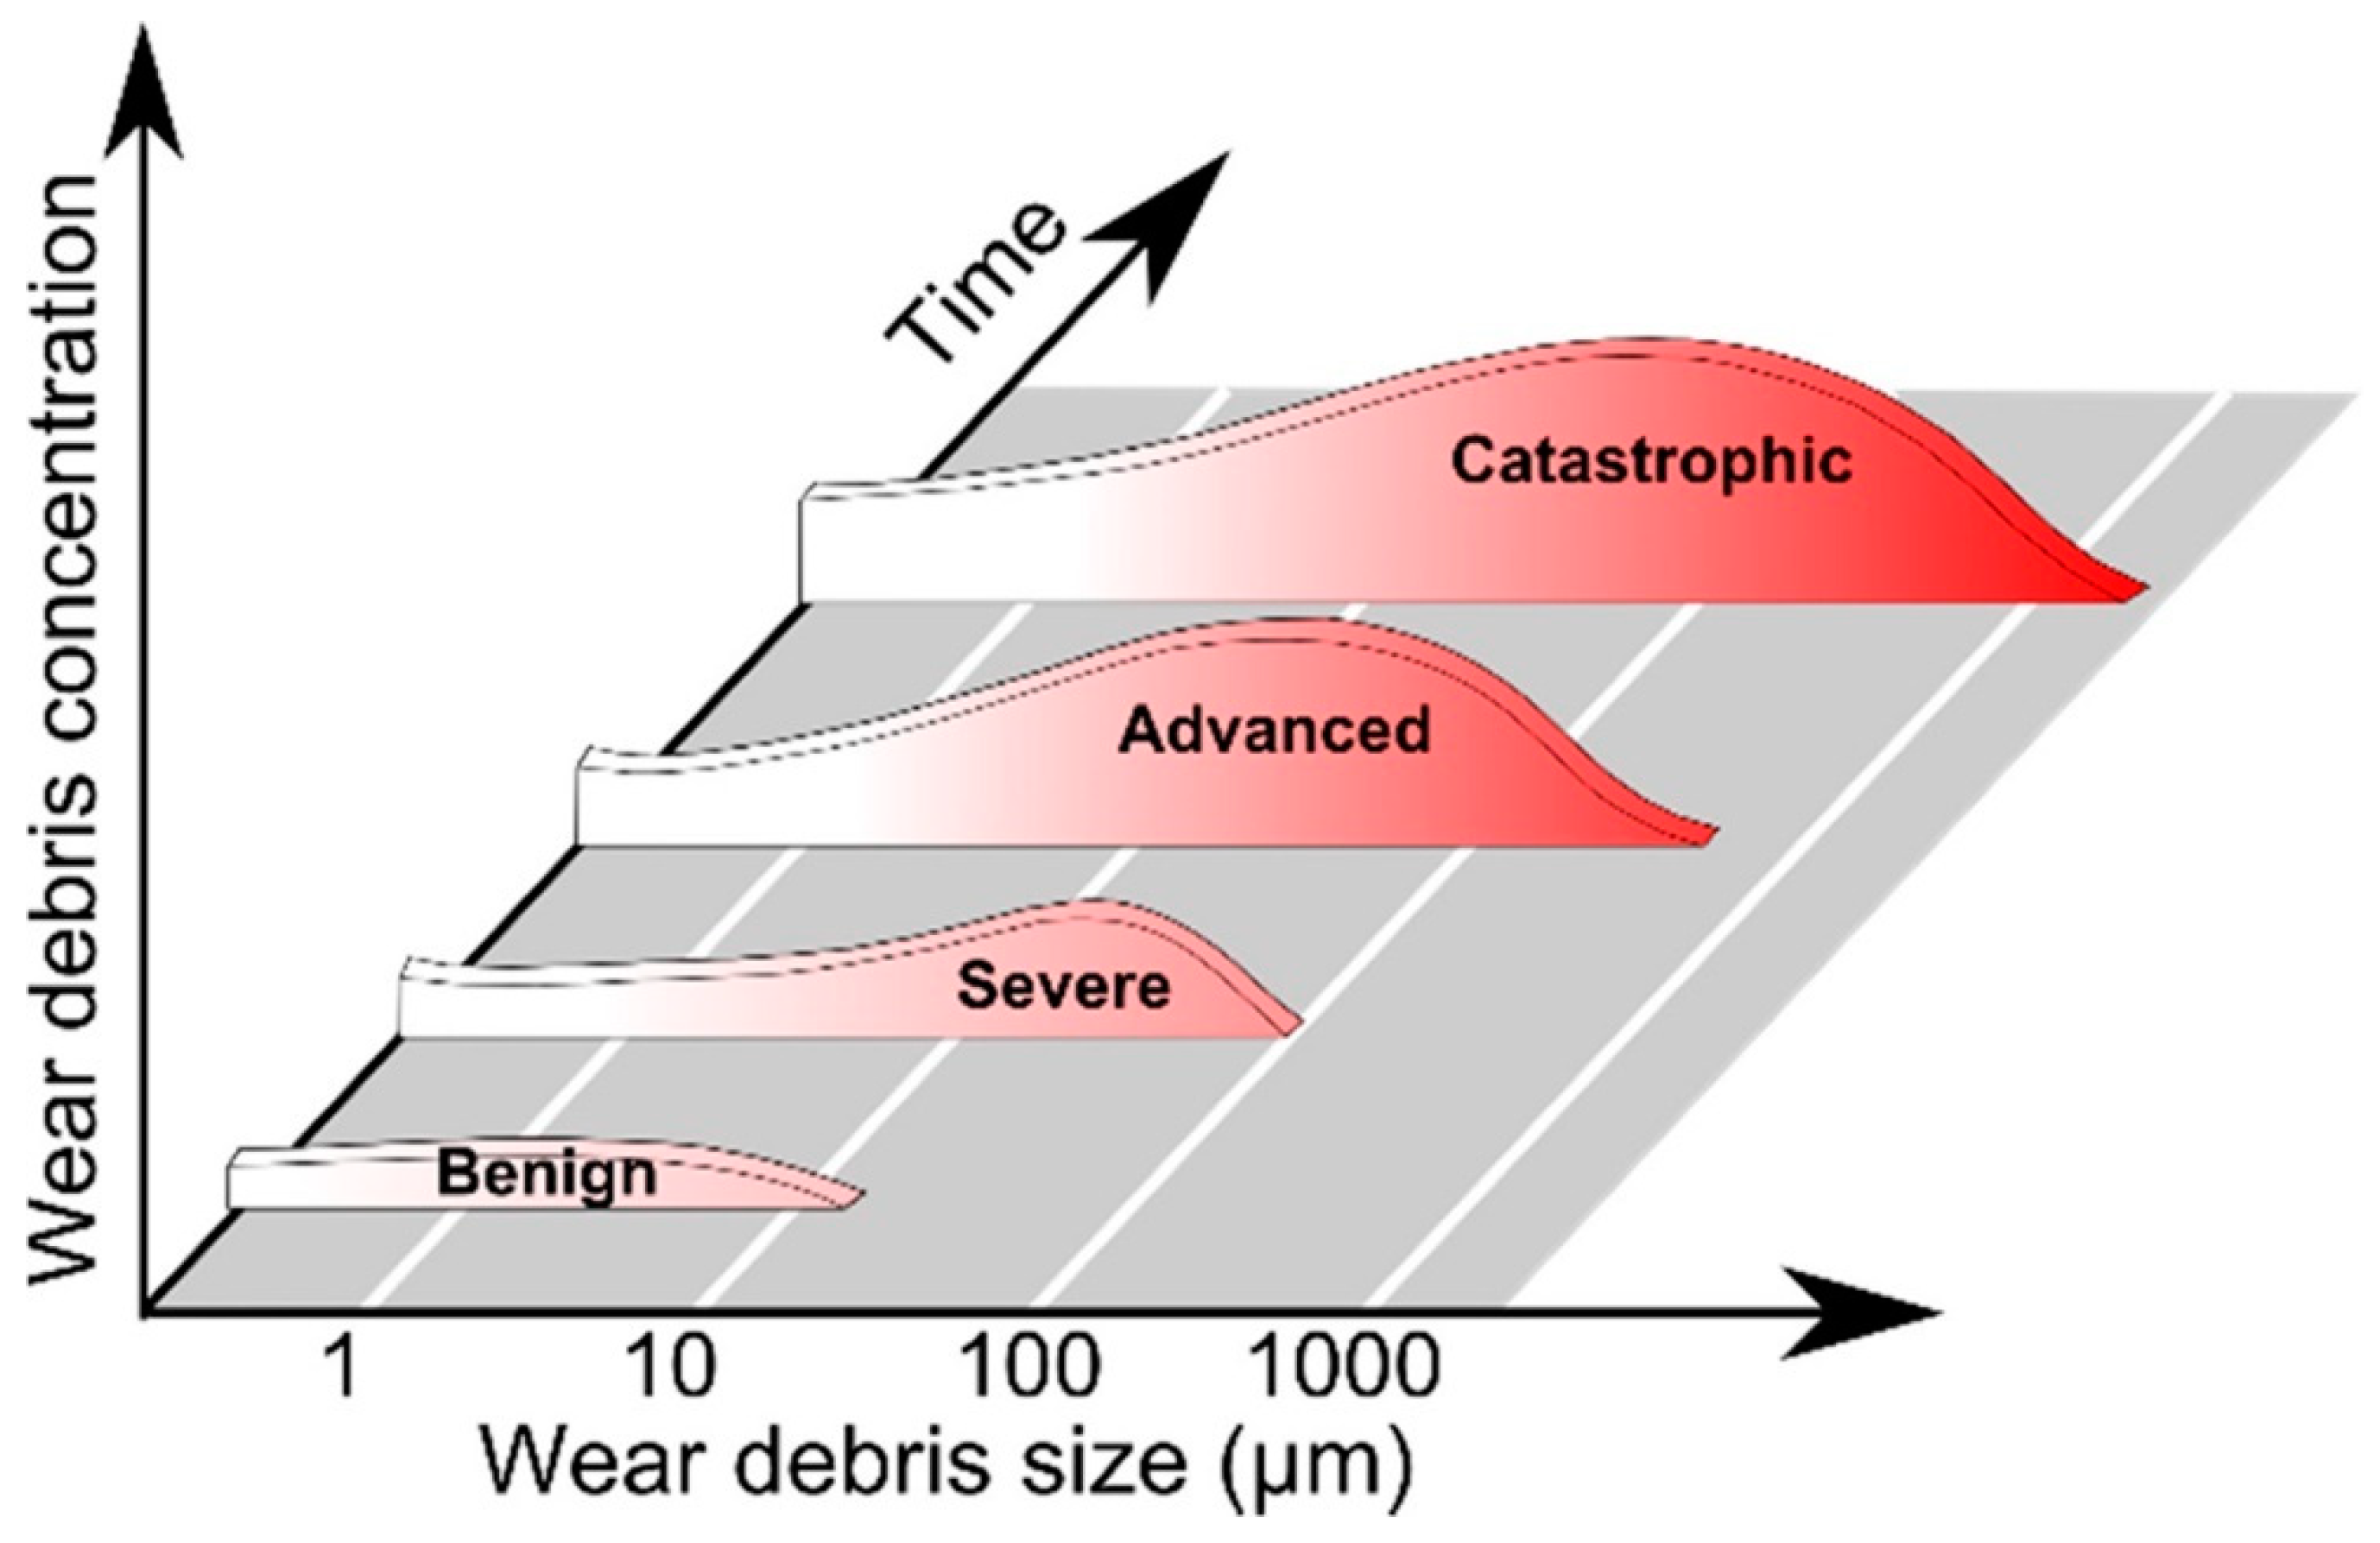
5]. The wear debris detection methods that are verified by idealized spherical particles presents several challenges in engineering, including low recognition rates, high false alarm rates, and insufficient reliability. The size and concentration of wear debris are directly related to the wear condition of rotating components, as shown in
Figure 1 [
6]. Improving the reliability of oil wear debris recognition methods requires accurate information about the debris, including its quantity, size, and shape.
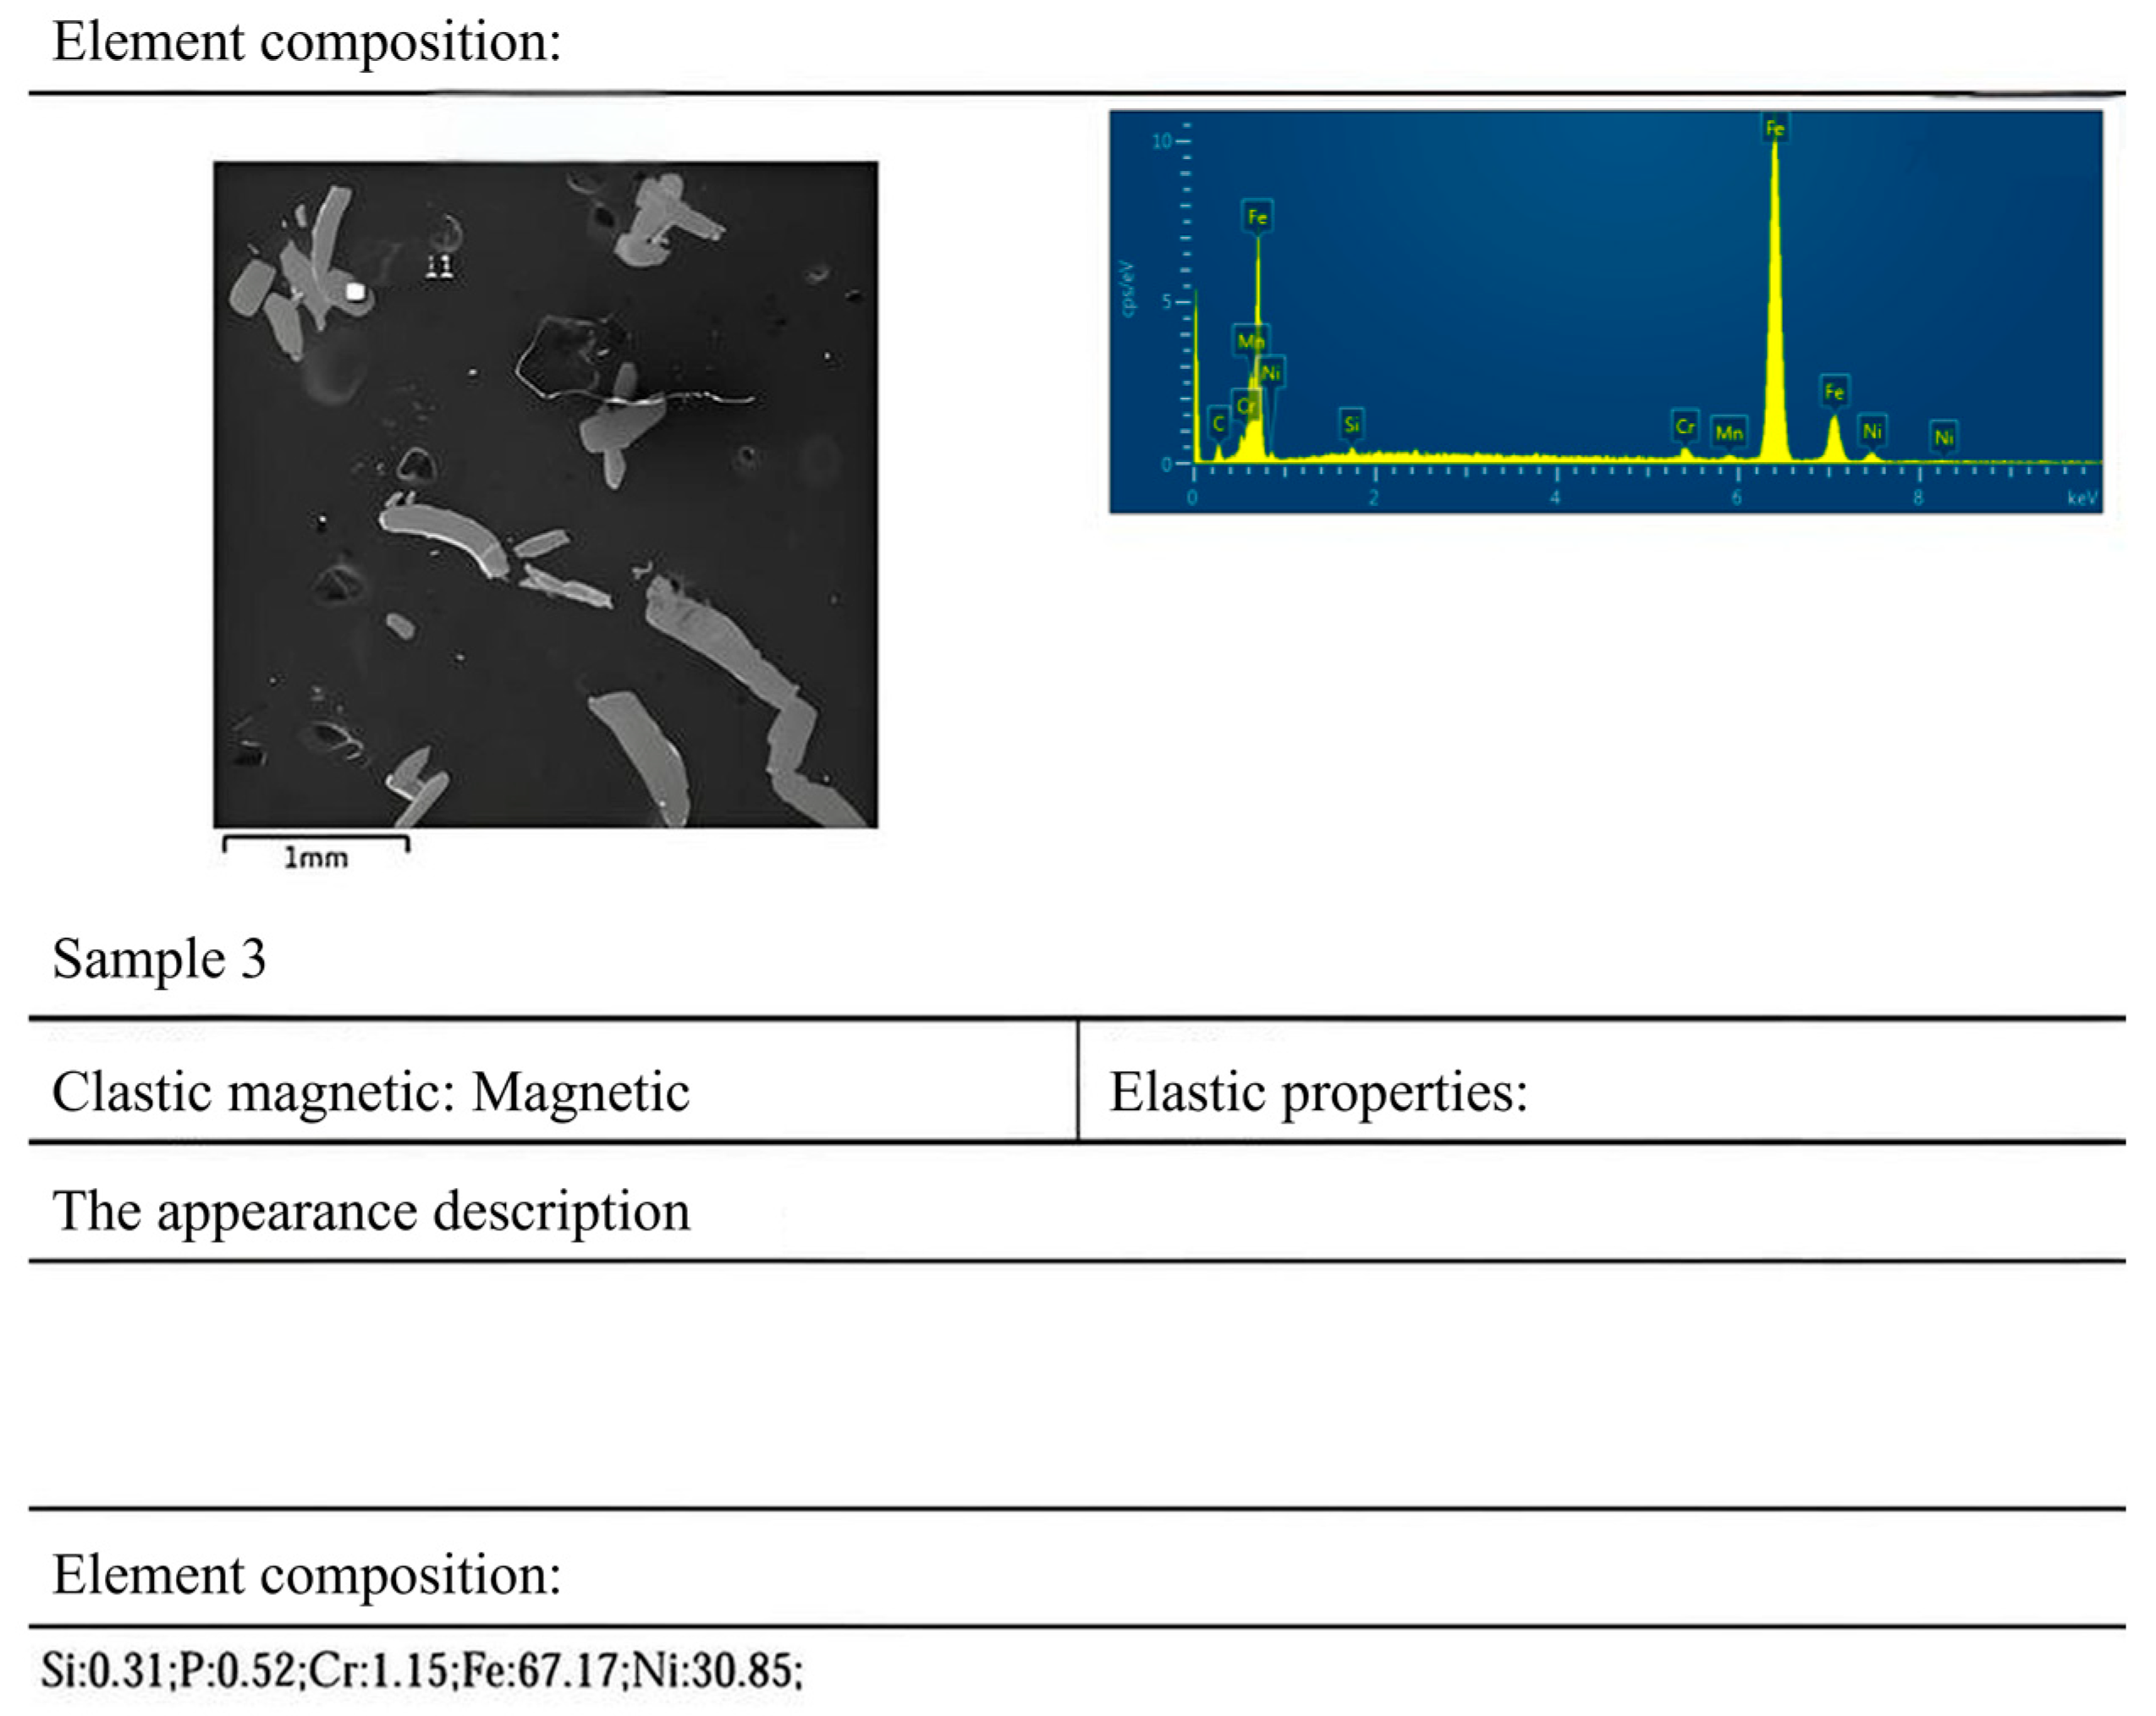
The standardized procedure for aviation oil debris analysis comprises four operational phases, as schematically depicted in
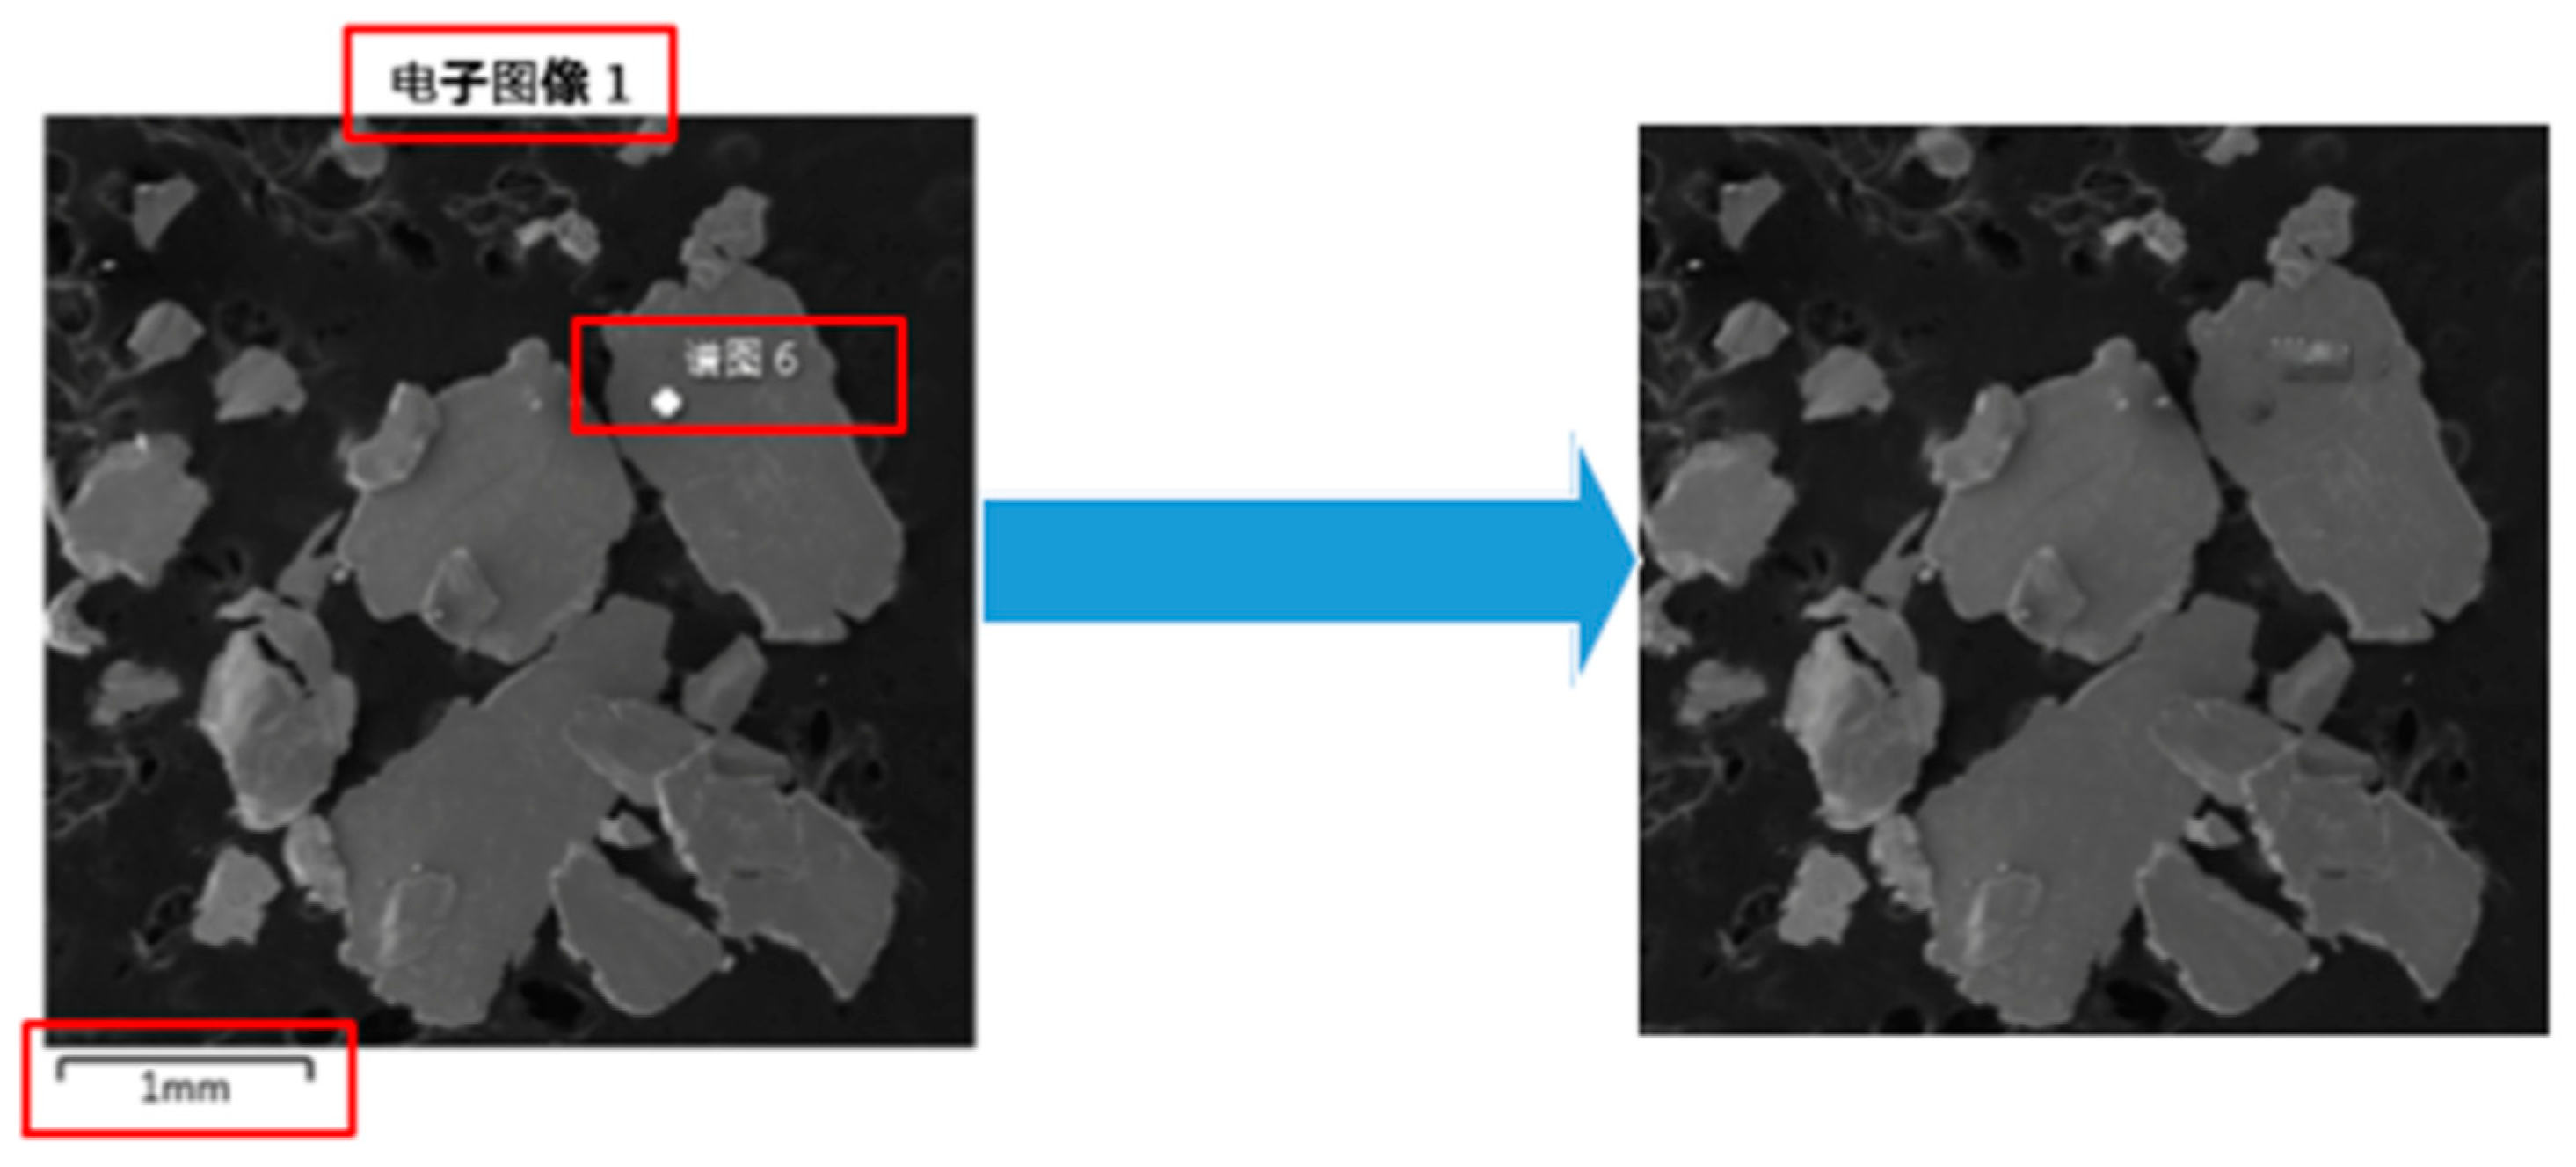
Figure 2. Upon alert activation by the Oil Debris Monitoring System (ODMS) or during scheduled maintenance intervals, maintenance crews extract oil samples from strategic collection points—specifically the low-pressure circulation lines and reservoir sumps of turbine lubrication systems—to capture gravimetrically settled particulates. Following vacuum degassing to eliminate entrapped air bubbles, the protocol implements dual diagnostic modalities: (1) ferrographic microscopy for morphological characterization of particulate matter, and (2) spectrometric analysis for elemental composition determination to trace debris origination. This process culminates in the generation of standardized Magnetic Chip Detector (MCD) reports, as shown in
Figure 2.
Magnetic Chip Detector (MCD) reports contain ferrography wear debris images, offering valuable information about wear debris, including its magnetism, size, and appearance. The extraction and identification of the number, size, and shape of wear debris in ferrography images have become a focal point of current research.
The application of digital image processing technology provides an effective approach for analyzing wear debris images. Image detection techniques in digital image processing can be categorized into two main types: traditional methods and neural network-based techniques [
7].
Among traditional digital image processing methods, techniques such as graying, binarization, filtering, and morphological operations are commonly employed to detect the edges of ferrography wear debris images. Subsequently, morphological features including aspect ratio, roundness, debris size, crimp, and other morphological factors are extracted. Concurrently, principal component analysis (PCA) is used to classify the wear debris. Wu et al. applied morphological operations to segment wear debris images and found that the size of the wear debris after segmentation follows a Weibull distribution [
8]. However, the large number of morphological feature parameters poses challenges in selecting the appropriate parameters and developing a high-accuracy detection model. These challenges limit the practical application of traditional digital image processing methods in engineering. In contrast, neural network-based image processing technology offers greater robustness, as it eliminates the need for manual parameter selection. A high-accuracy detection model can be developed by combining neural networks with labeled image datasets. In recent years, significant progress has been made in the recognition of ferrography wear debris images using neural networks, both domestically and internationally.
Cao and Xie applied wavelet transform to wear particle images, filtered noise and background, extracted wavelet-based feature vectors, and developed a BP neural network classifier for wear particle classification [
9]. Shi et al. utilized the YOLO V5S model to detect wear debris images, enhancing its ability to detect wear particles of various sizes [
10]. Jia et al. incorporated a self-attention residual module into YOLOv3 to improve detection of small- and multi-scale wear debris in ferrography images [
11]. Additionally, Jia et al. employed DenseNet (Densely Connected Convolutional Networks) as the base network and applied transfer learning to develop the FWDNet (Ferrography Wear Debris Networks) model, achieving 90% accuracy [
12]. The WPC-SS model, proposed by Fan et al., uses semantic segmentation and attention mechanisms to improve the multi-label classification of online wear particle images, surpassing standard classification methods in terms of accuracy [
13]. He et al. proposed CBAM-YOLOv5, an intelligent recognition algorithm for ferrography wear particles that addresses challenges such as image blurring, background complexity, overlapping particles, and low-light conditions, significantly improving detection accuracy and speed [
14]. Peng et al. introduced WP-DRnet for automatic ferrography image analysis [
15]. Liu et al. developed a DCNN model for semantic segmentation of multiple types of wear particles in ferrography images [
16]. Fan et al. proposed an improved YOLOv8-CGA-ASF-DBB method for multi-class wear debris recognition in online ferrography images, achieving a recognition accuracy of 94.53% with a processing time of 0.69 ms per image, thanks to enhanced feature extraction and recognition capabilities [
17].
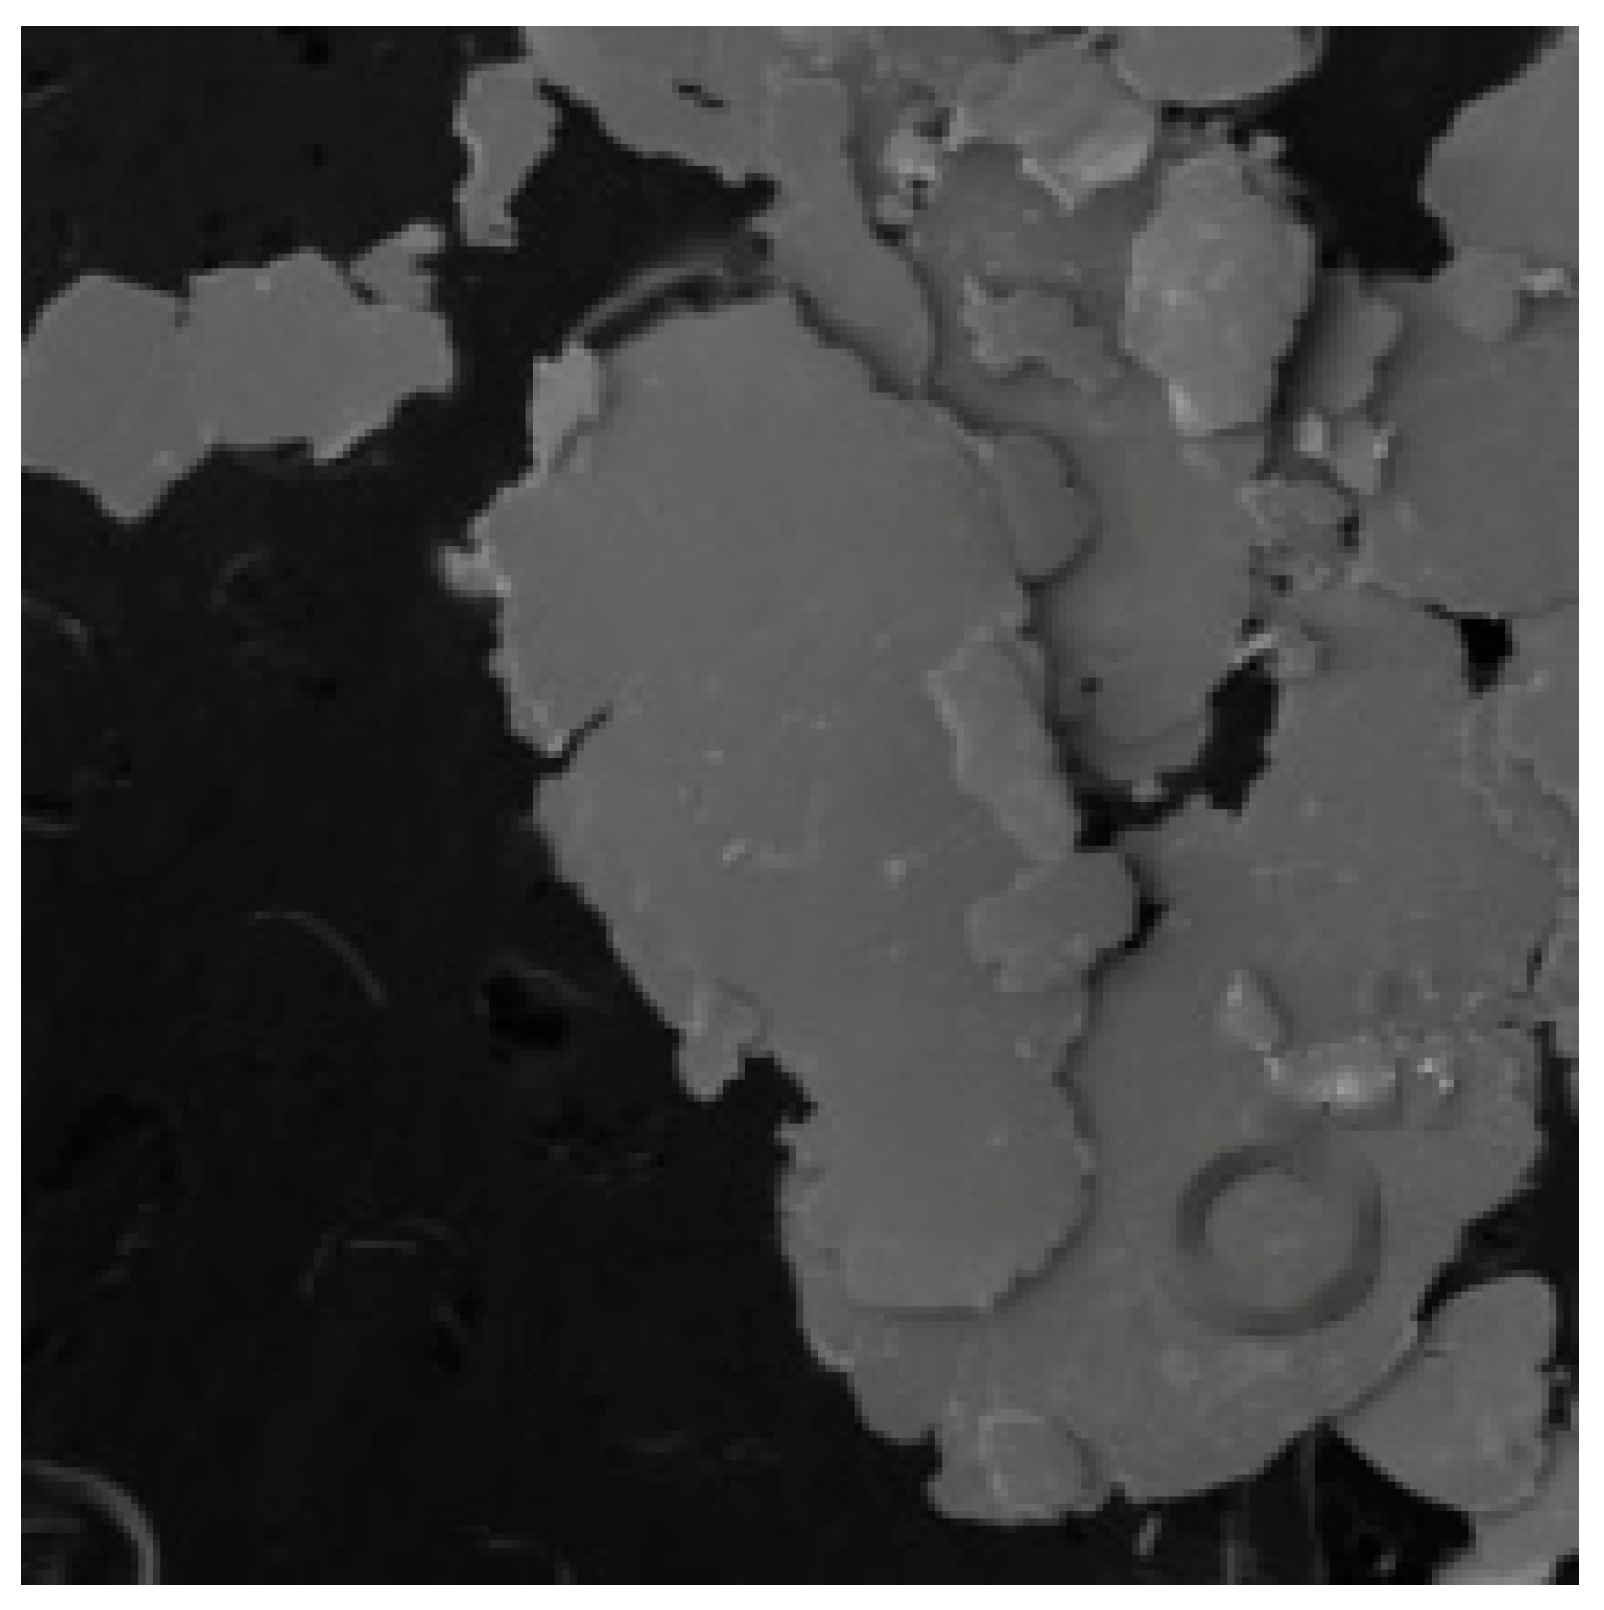
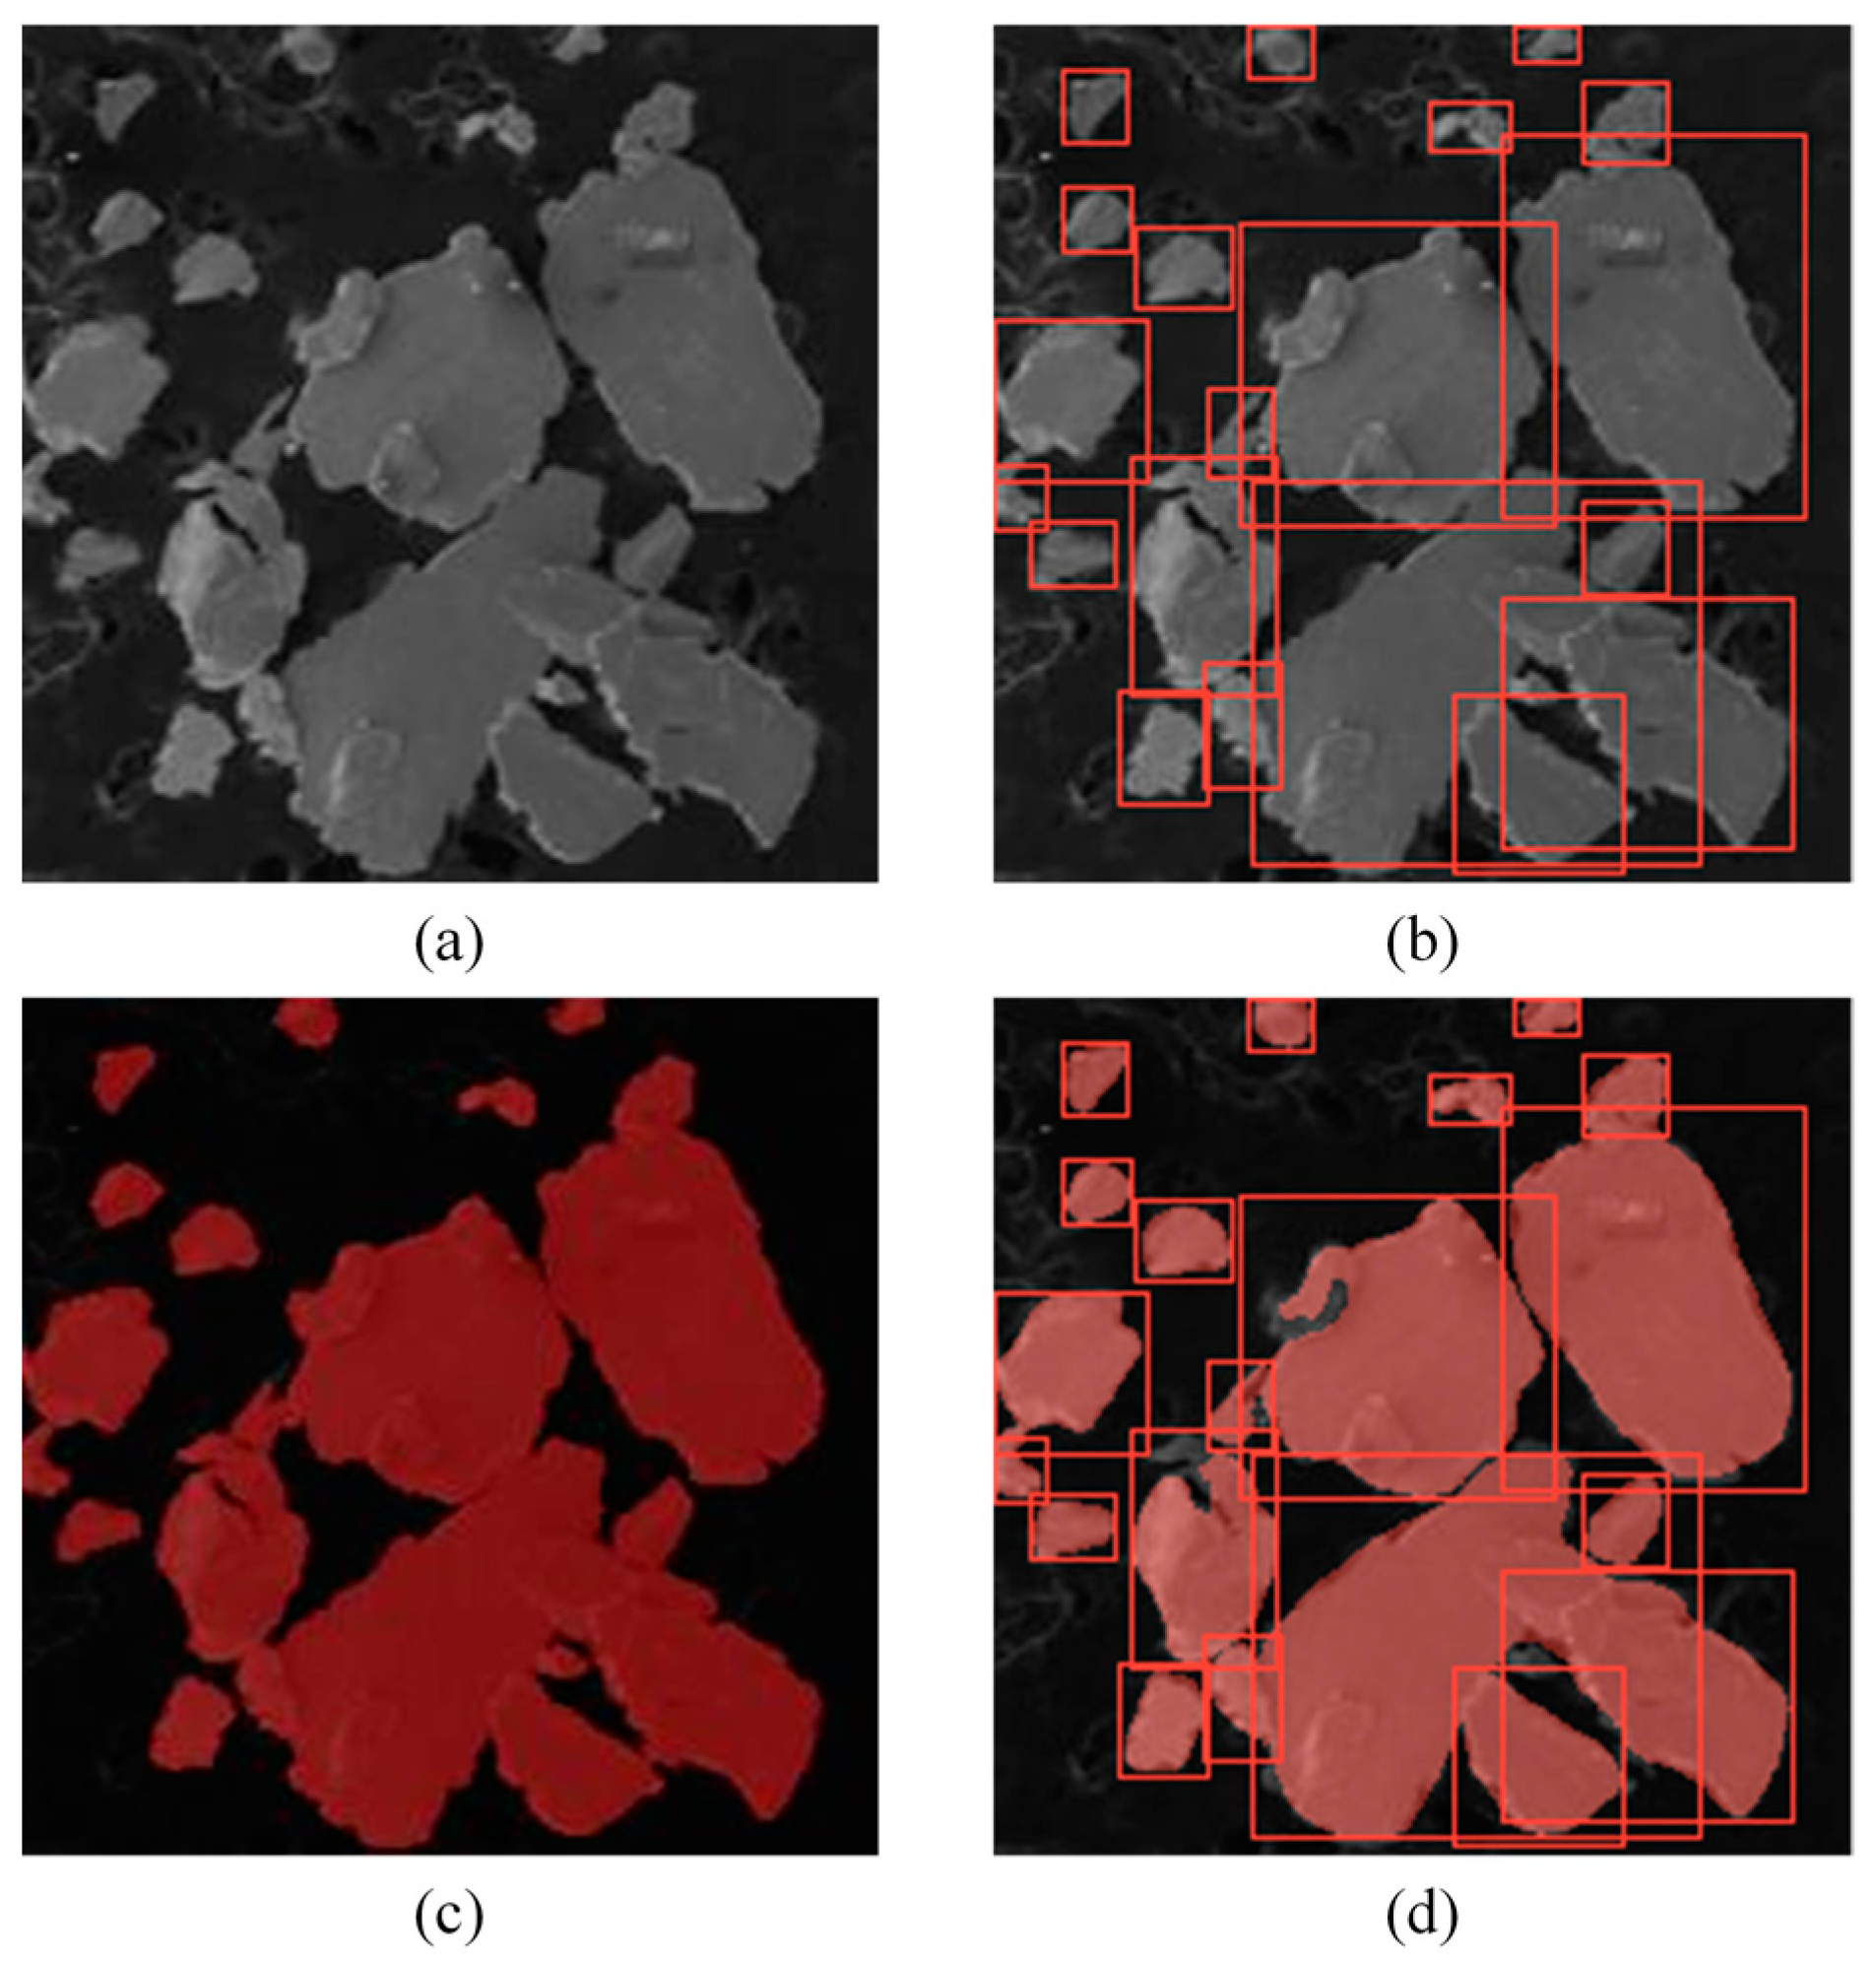
The aforementioned studies primarily utilized object detection or semantic segmentation techniques. While the object detection method localizes objects within a bounding box, the precise contours of the objects cannot be captured. Semantic segmentation method delineates the contours but struggles to distinguish adjacent objects. In the ferrography wear debris images, the adjacent wear debris particles are common, as shown in
Figure 3. Consequently, how to extract comprehensive information from these images remains a challenge.
He et al. proposed an instance segmentation method, Mask Region-based Convolutional Neural Networks (Mask R-CNN) [
18], which simultaneously performs both object detection and semantic segmentation. This method not only classifies objects at the pixel level but also distinguishes between different instances of similar objects. In the context of ferrography wear debris image recognition, the instance segmentation can be used to separate adjacent wear debris particles, enabling the calculation of size and shape characteristics for each individual debris particle. Examples of object detection, semantic segmentation, and instance segmentation are shown in
Figure 4.
To achieve more accurate segmentation of wear debris images, this paper proposed several enhanced Mask R-CNN methods with multi-feature fusion. The proposed methods incorporate two main improvements. The first involves enhancing the Feature Pyramid Network (FPN) by adding additional layers to the feature extraction network. The second strategy integrates some attention mechanisms including the Convolutional Block Attention Module (CBAM) [
19] to further improve feature extraction capabilities. The effectiveness of the enhanced networks are validated using a wear debris image dataset constructed specifically for this study.
The rest of this paper is organized as follows:
Section 2 introduces the research framework, including the construction of the debris dataset, segmentation model training, and debris quantitative analysis.
Section 3 provides a detailed description of the improvements made to the feature extraction network of Mask R-CNN.
Section 4 outlines the model training process, presents the experimental results, and discusses the findings. Finally,
Section 5 summarizes the conclusions.
2. Intelligent Recognition Method of Wear Debris Image Based on Improved Mask R-CNN and Wear Debris Area Calculation
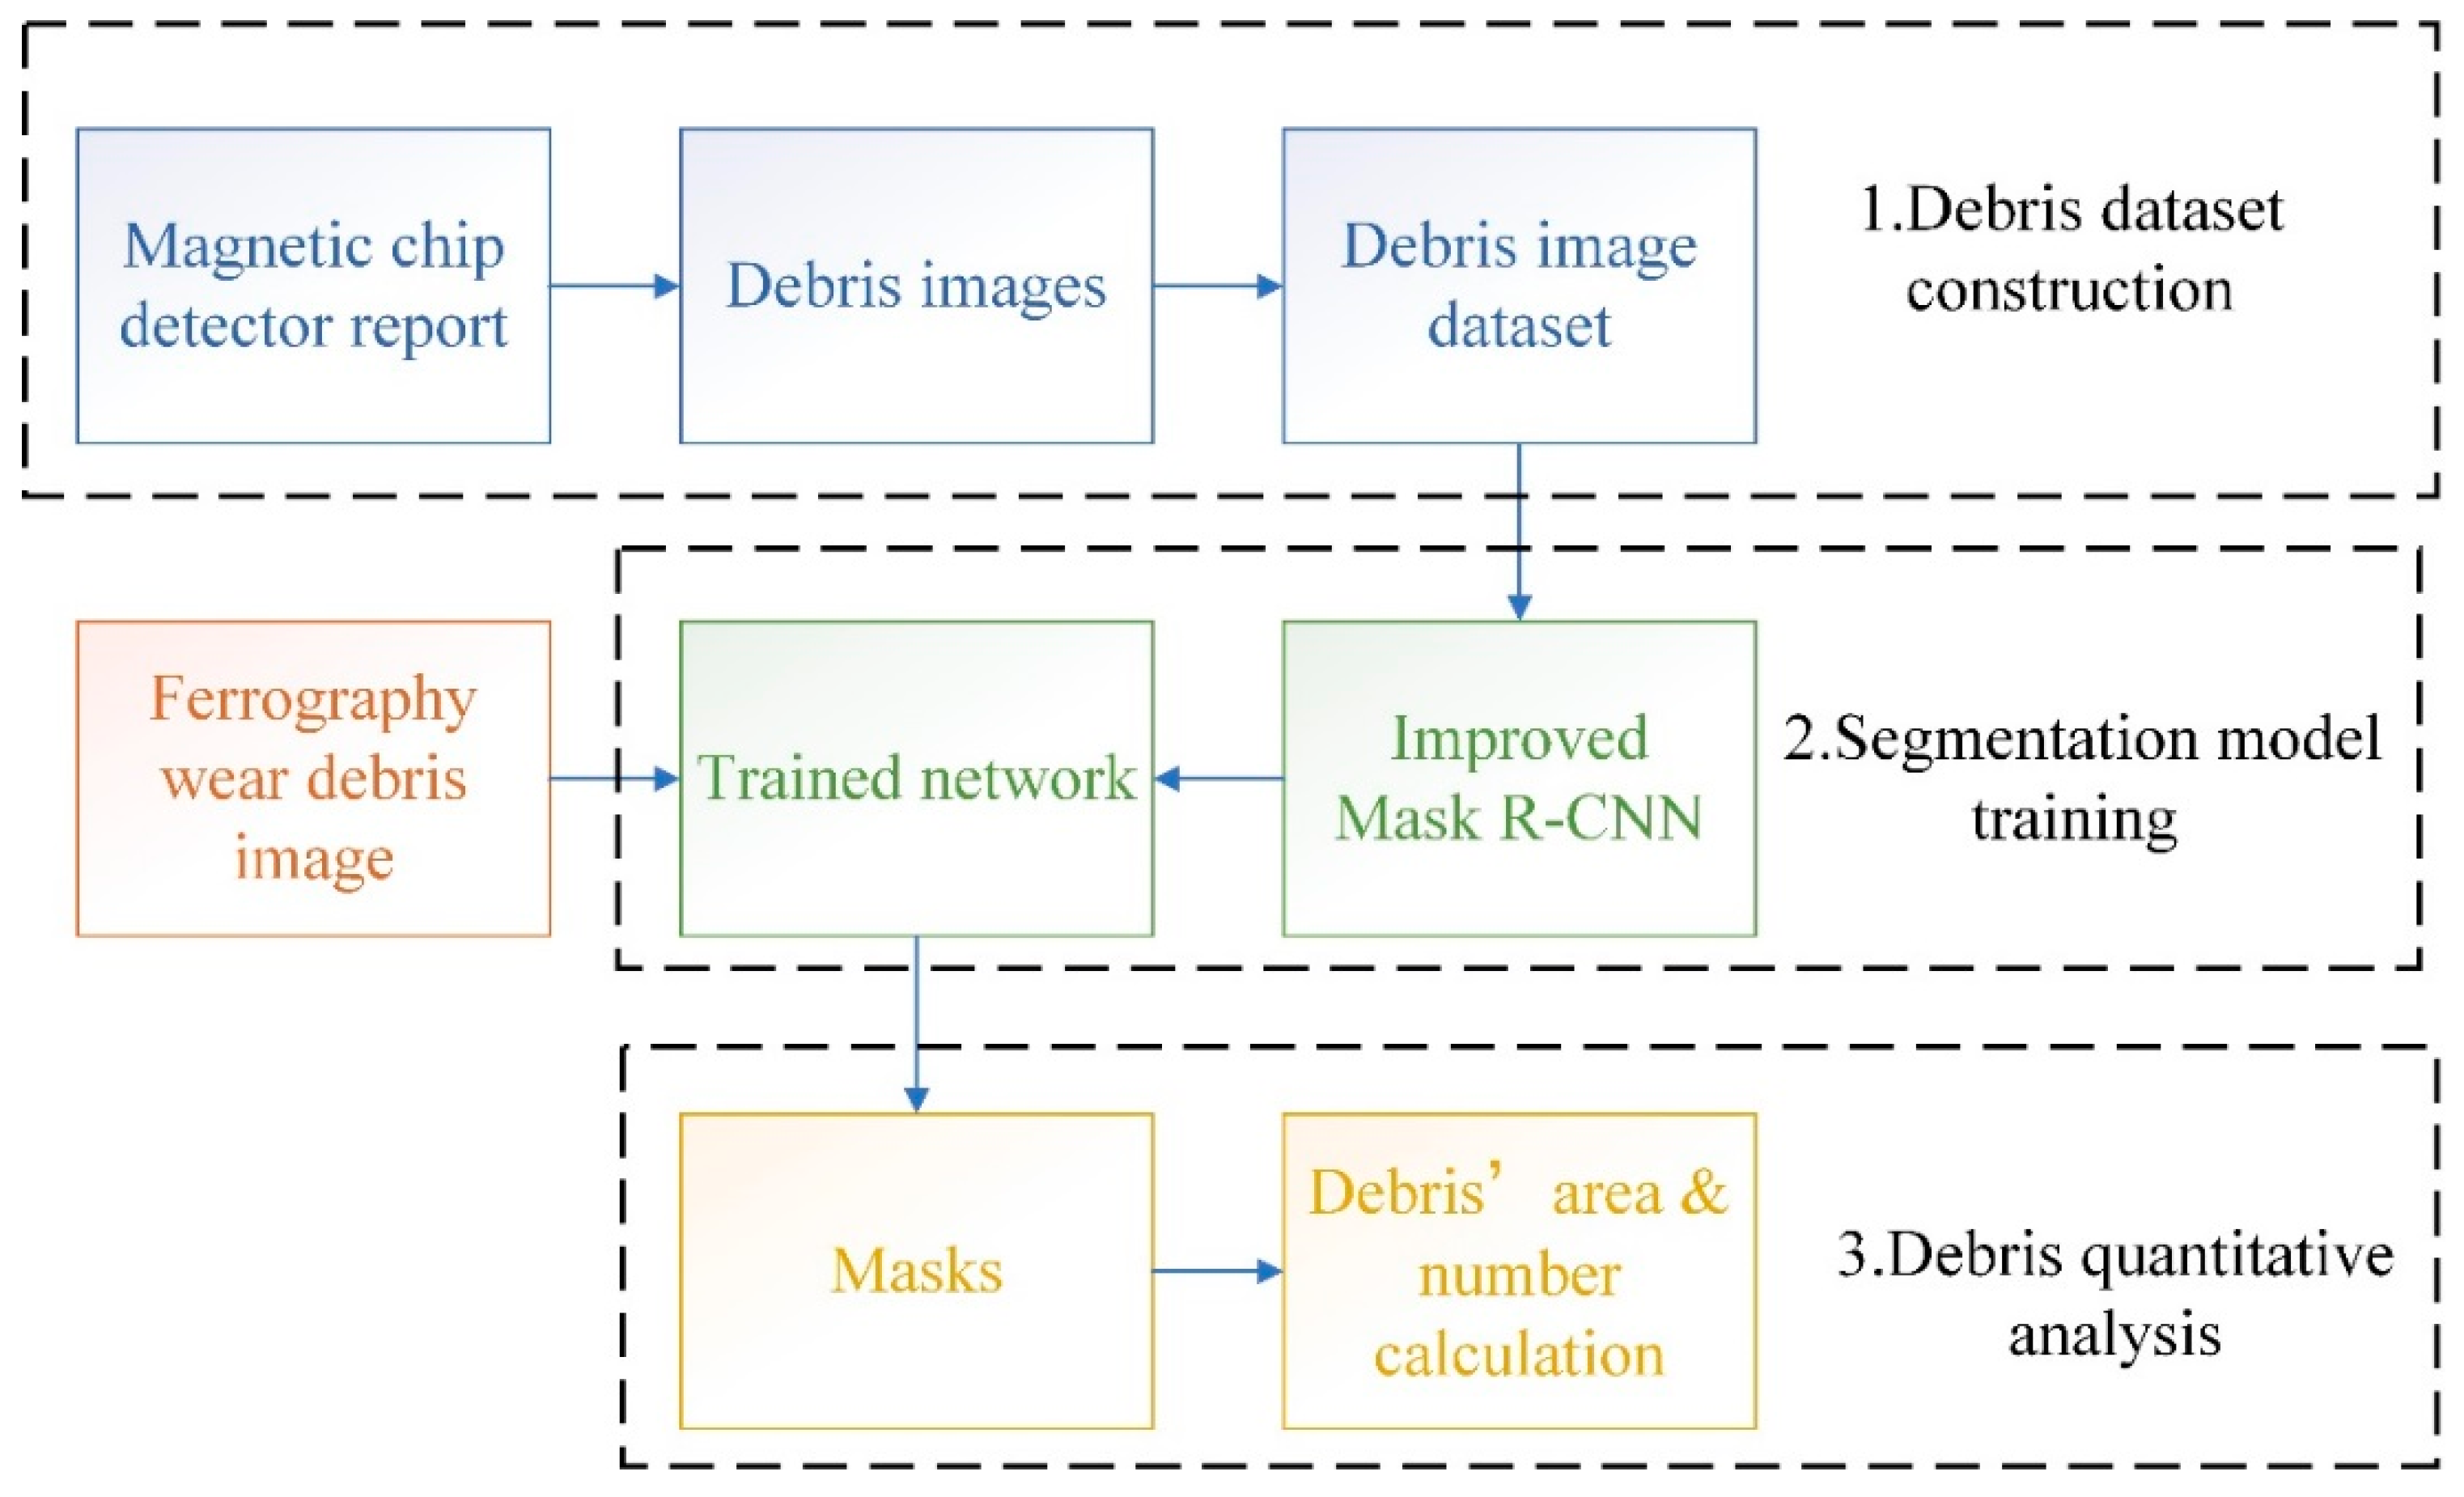
The intelligent recognition method for wear debris images proposed in this paper consists of three key steps: constructing the debris dataset, training the segmentation model, and quantitatively analyzing the wear debris images. The recognition process is illustrated in
Figure 5:
The detailed steps are listed as follows: Step 1 involves labeling wear debris images from Magnetic Chip Detector (MCD) reports to construct the debris image dataset. Step 2 entails using this dataset to train the neural network based on the improved Mask R-CNN. Step 3 focuses on recognizing wear debris images with the trained network and performing quantitative analysis by calculating the number and area of the debris.
For clarity, the structure of the improved Mask R-CNN and the process of quantitative debris analysis are described in the following subsections, respectively.
2.1. Improved Mask R-CNN Structure
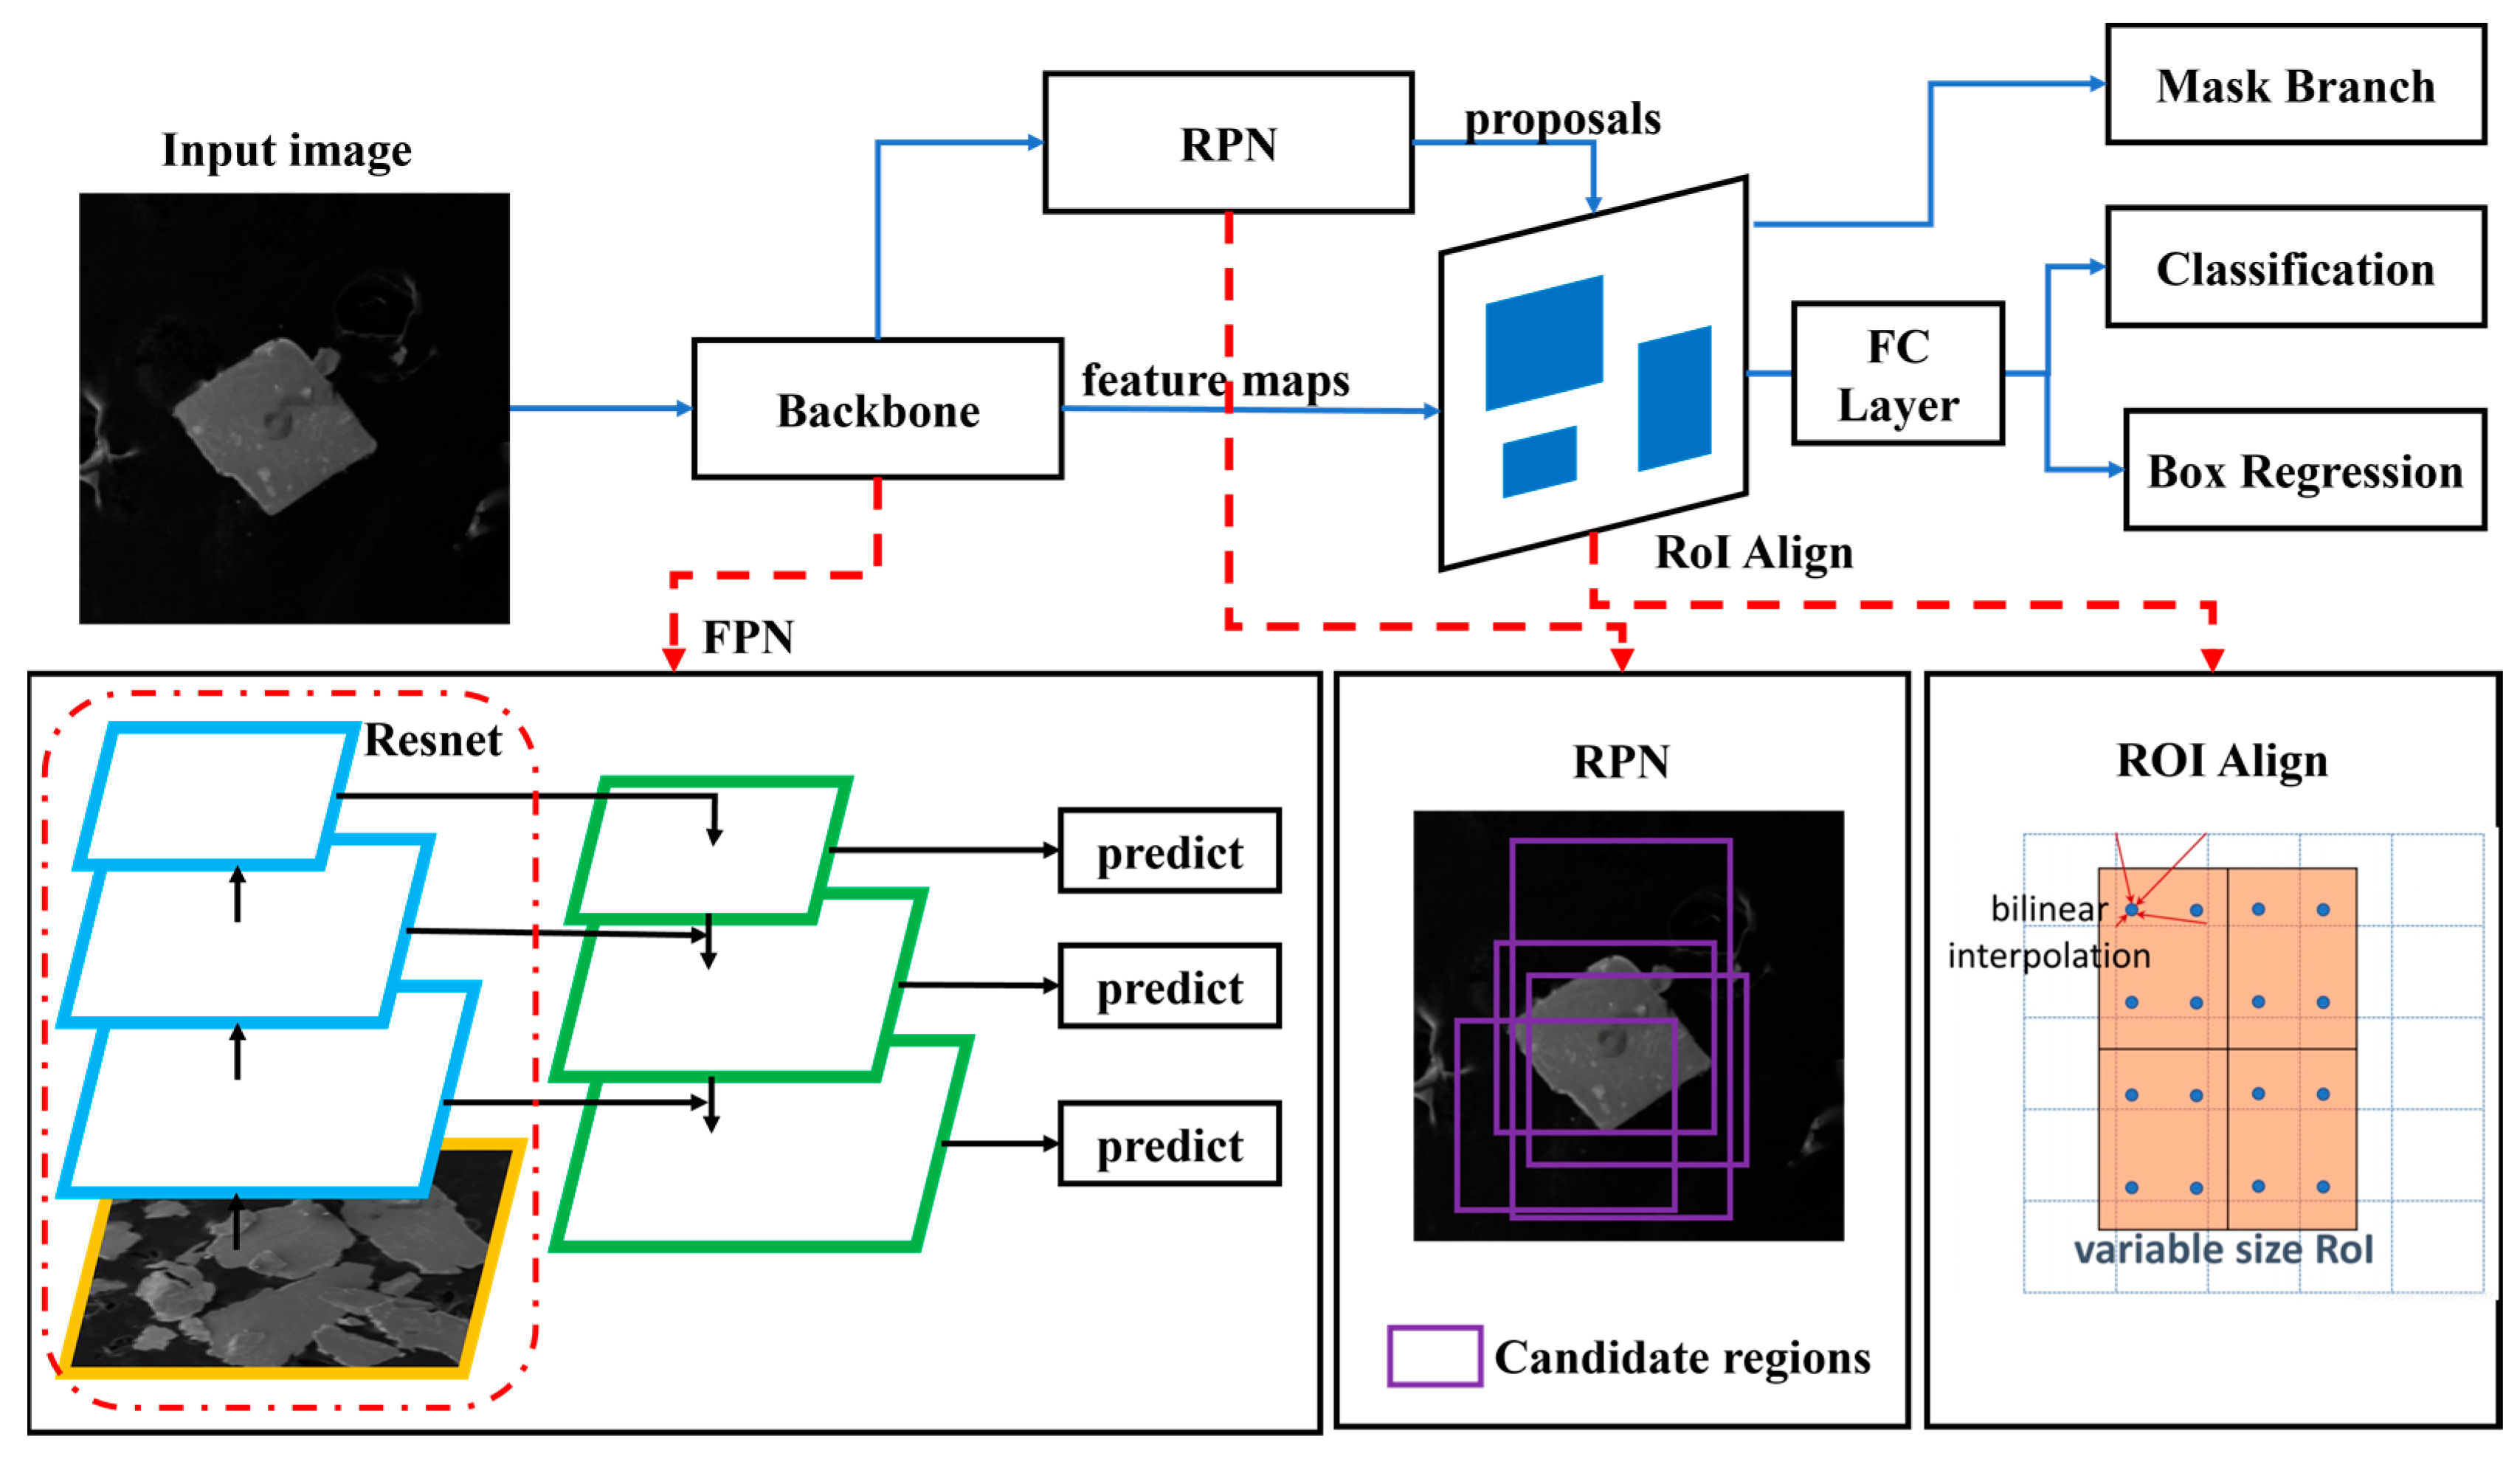
The network structure of Mask R-CNN, as shown in
Figure 6, primarily consists of three components: the backbone network, the Region Proposal Network (RPN), and the RoIAlign layer. The backbone network employs a Feature Pyramid Network (FPN) to extract feature information from the target image and generate multi-scale feature maps. The RPN generates candidate regions from the target image, which are then mapped onto the feature maps and passed into the Region of Interest Align (RoIAlign) layer. In RoIAlign, bilinear interpolation is used to obtain feature vectors with fixed dimensions. These feature vectors are then fed into the fully connected layer (FC Layer) for predicting the target’s bounding box offset (Box Regression) and classification. Simultaneously, the mask branch performs instance segmentation on the Region of Interest (ROI), determining whether each pixel in the region belongs to the target. This approach significantly improves the accuracy of pixel-level recognition and classification.
The Mask R-CNN model has powerful pixel-level classification capabilities, but it is typically trained on standard public datasets, which provide a sufficient amount of data for training and help avoid issues such as misdiagnosis or overfitting caused by insufficient data. However, in practice, acquiring ferrography wear debris images is challenging, making it difficult to obtain a large volume of labeled data. As a result, wear debris image segmentation is often treated as a small-sample learning task. To address the challenges of small-sample wear debris image segmentation, two main approaches are commonly employed: data augmentation and specialized algorithms.
In terms of data augmentation, this paper applied the Sobel operator to process wear debris images, enhancing the clarity of the debris edges (
Section 4.1). On the algorithm side, the backbone of the Mask R-CNN model has been improved to capture more detailed wear debris features, thereby enhancing detection accuracy (
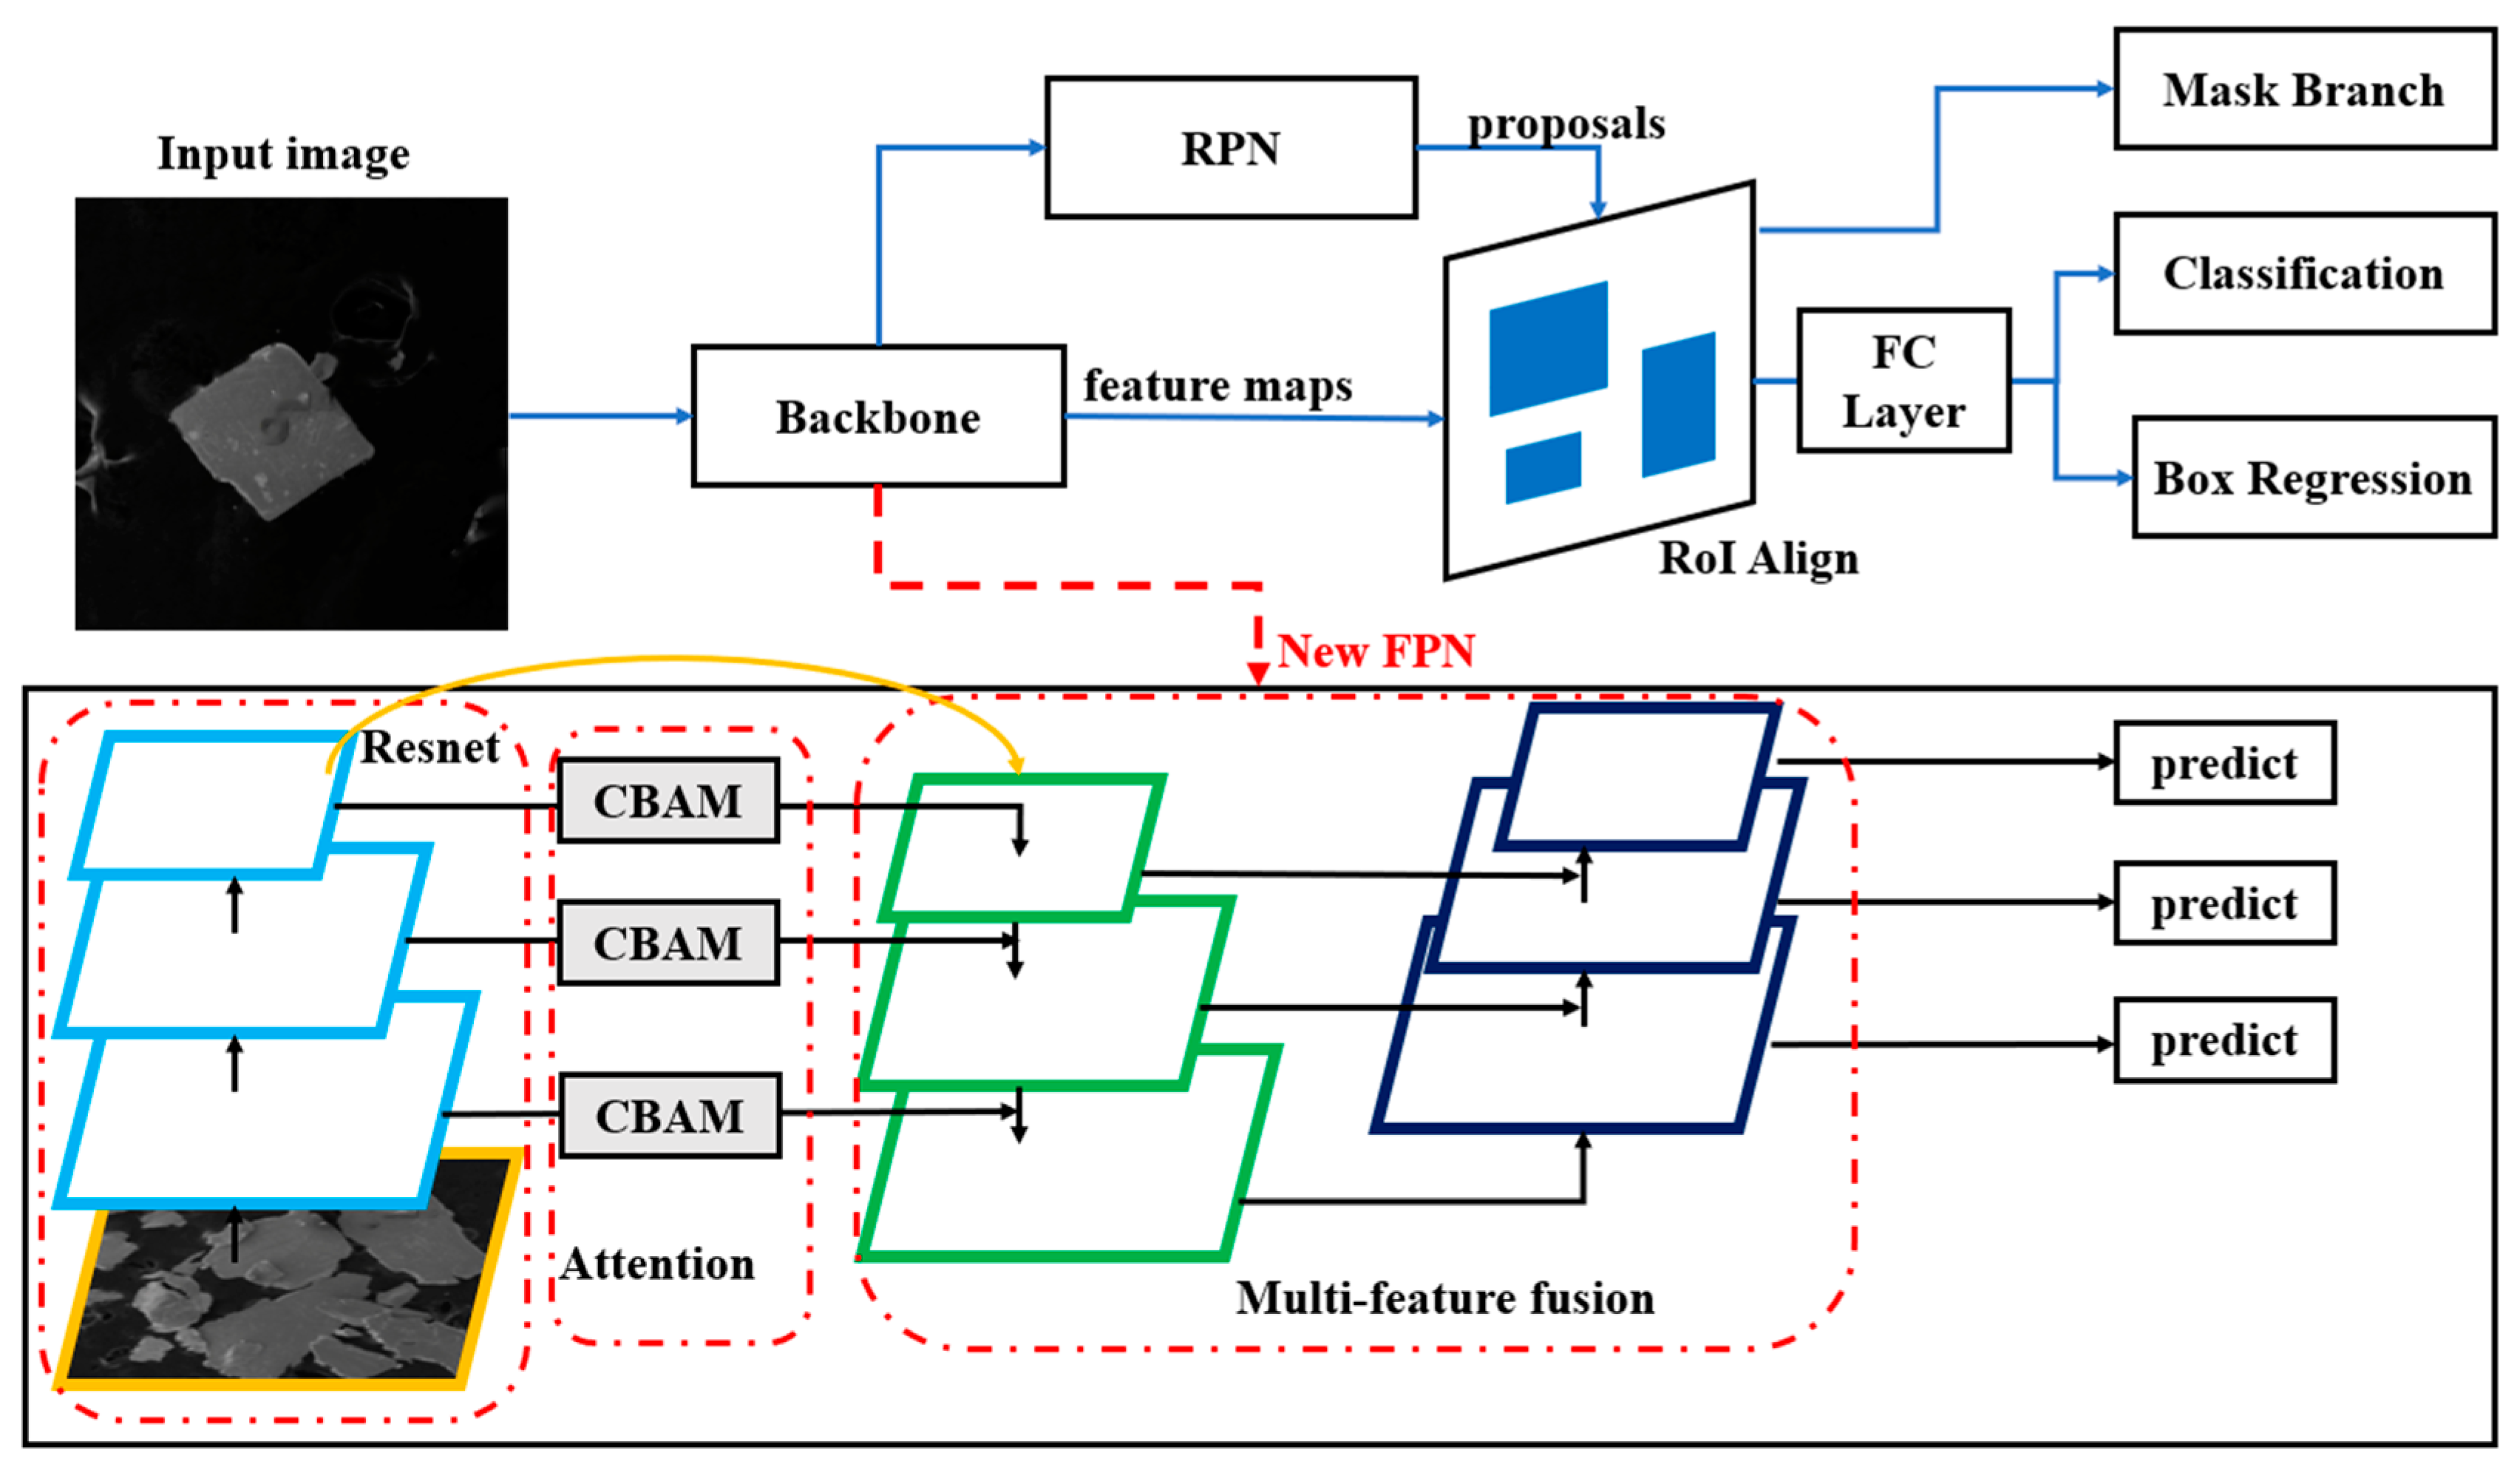
Section 3). The structure of the improved network is shown in
Figure 7. The specific improvements are as follows:
- (1)
The CBAM attention mechanisms are added after the Resnet network, allowing the model to better focus on the location and channel features of the debris region. This approach effectively reduces the required number of training epochs and enhances detection accuracy.
- (2)
Based on the concept of multi-layer feature fusion, an additional set of feature maps is stacked and fused on top of the original FPN network. The new FPN network further integrates the wear debris features extracted from multiple layers of convolution (Resnet) into multiple feature maps, enabling more accurate differentiation of debris edge contours.
2.2. Qualitative and Quantitative Analysis
The size, quantity, and concentration of debris are directly linked to the engine’s wear condition. To assess the engine’s wear status, a quantitative analysis of the debris is essential. The most intuitive quantitative parameter that can be derived from ferrography images is the debris coverage area [
20]. Therefore, quantifying wear severity can be achieved by detecting the coverage area of the debris.
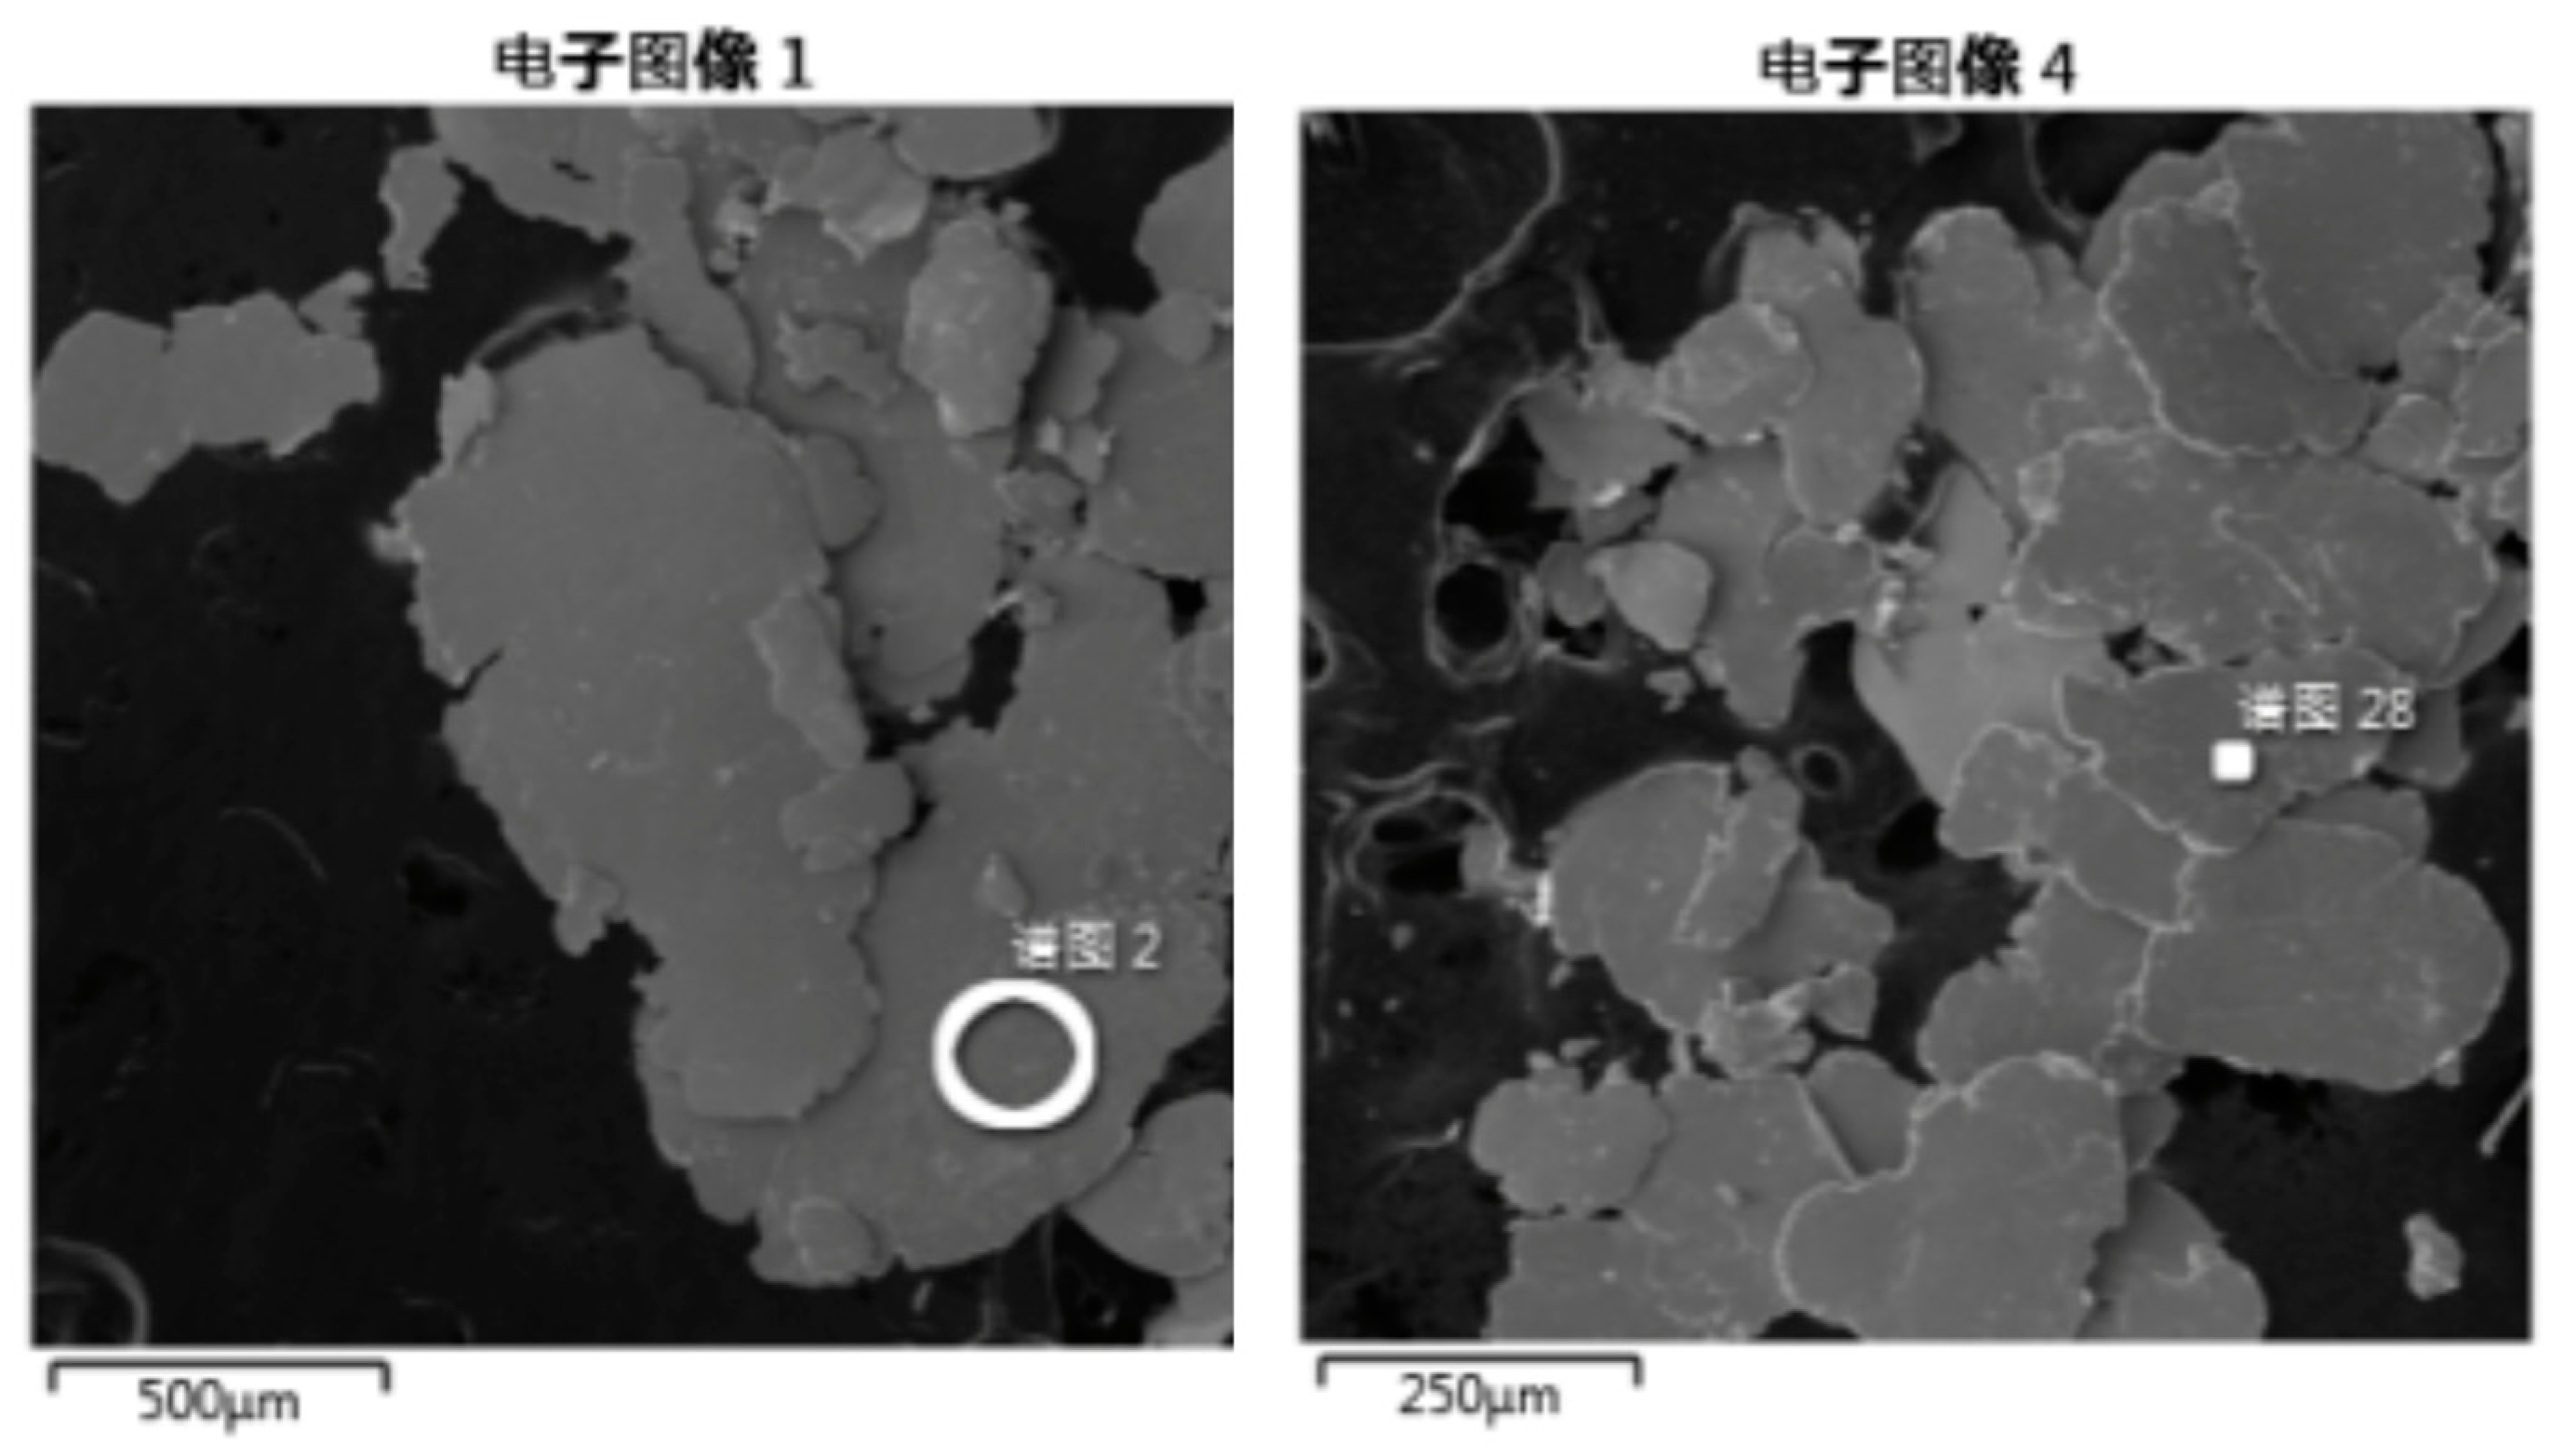
The traditional method for calculating the wear debris coverage area involves applying filtering and binarization techniques to ferrography wear debris images. This approach requires manual selection of an appropriate threshold, complicating automatic analysis and leading to reduced accuracy. Additionally, the scale of wear debris images is often non-uniform (see
Figure 8), making it difficult to automatically determine the actual coverage area of the wear debris.
When analyzing images with a computer, the images are composed of pixels, and image operations are therefore based on pixel manipulation. To automatically calculate the actual wear debris area, it is necessary to convert the pixel area of the debris into real-world dimensions. The process involves the following steps:
- (1)
The Improved Mask R-CNN is applied to segment the wear debris contours in the ferrography images.
- (2)
The pixel area of the wear debris is calculated, and a conversion relationship between pixel values and physical dimensions is established.
- (3)
The dimensions of the wear debris particles are then converted from pixel units to actual sizes.
- (4)
The external ellipses of the wear debris contours are computed, and the physical characteristics of the debris are described using the major and minor axes of the ellipses.
- (5)
The original image is annotated with the number of wear debris particles, their physical characteristics (Major Axis, Minor Axis, Aspect Ratio, and Area), and their types.
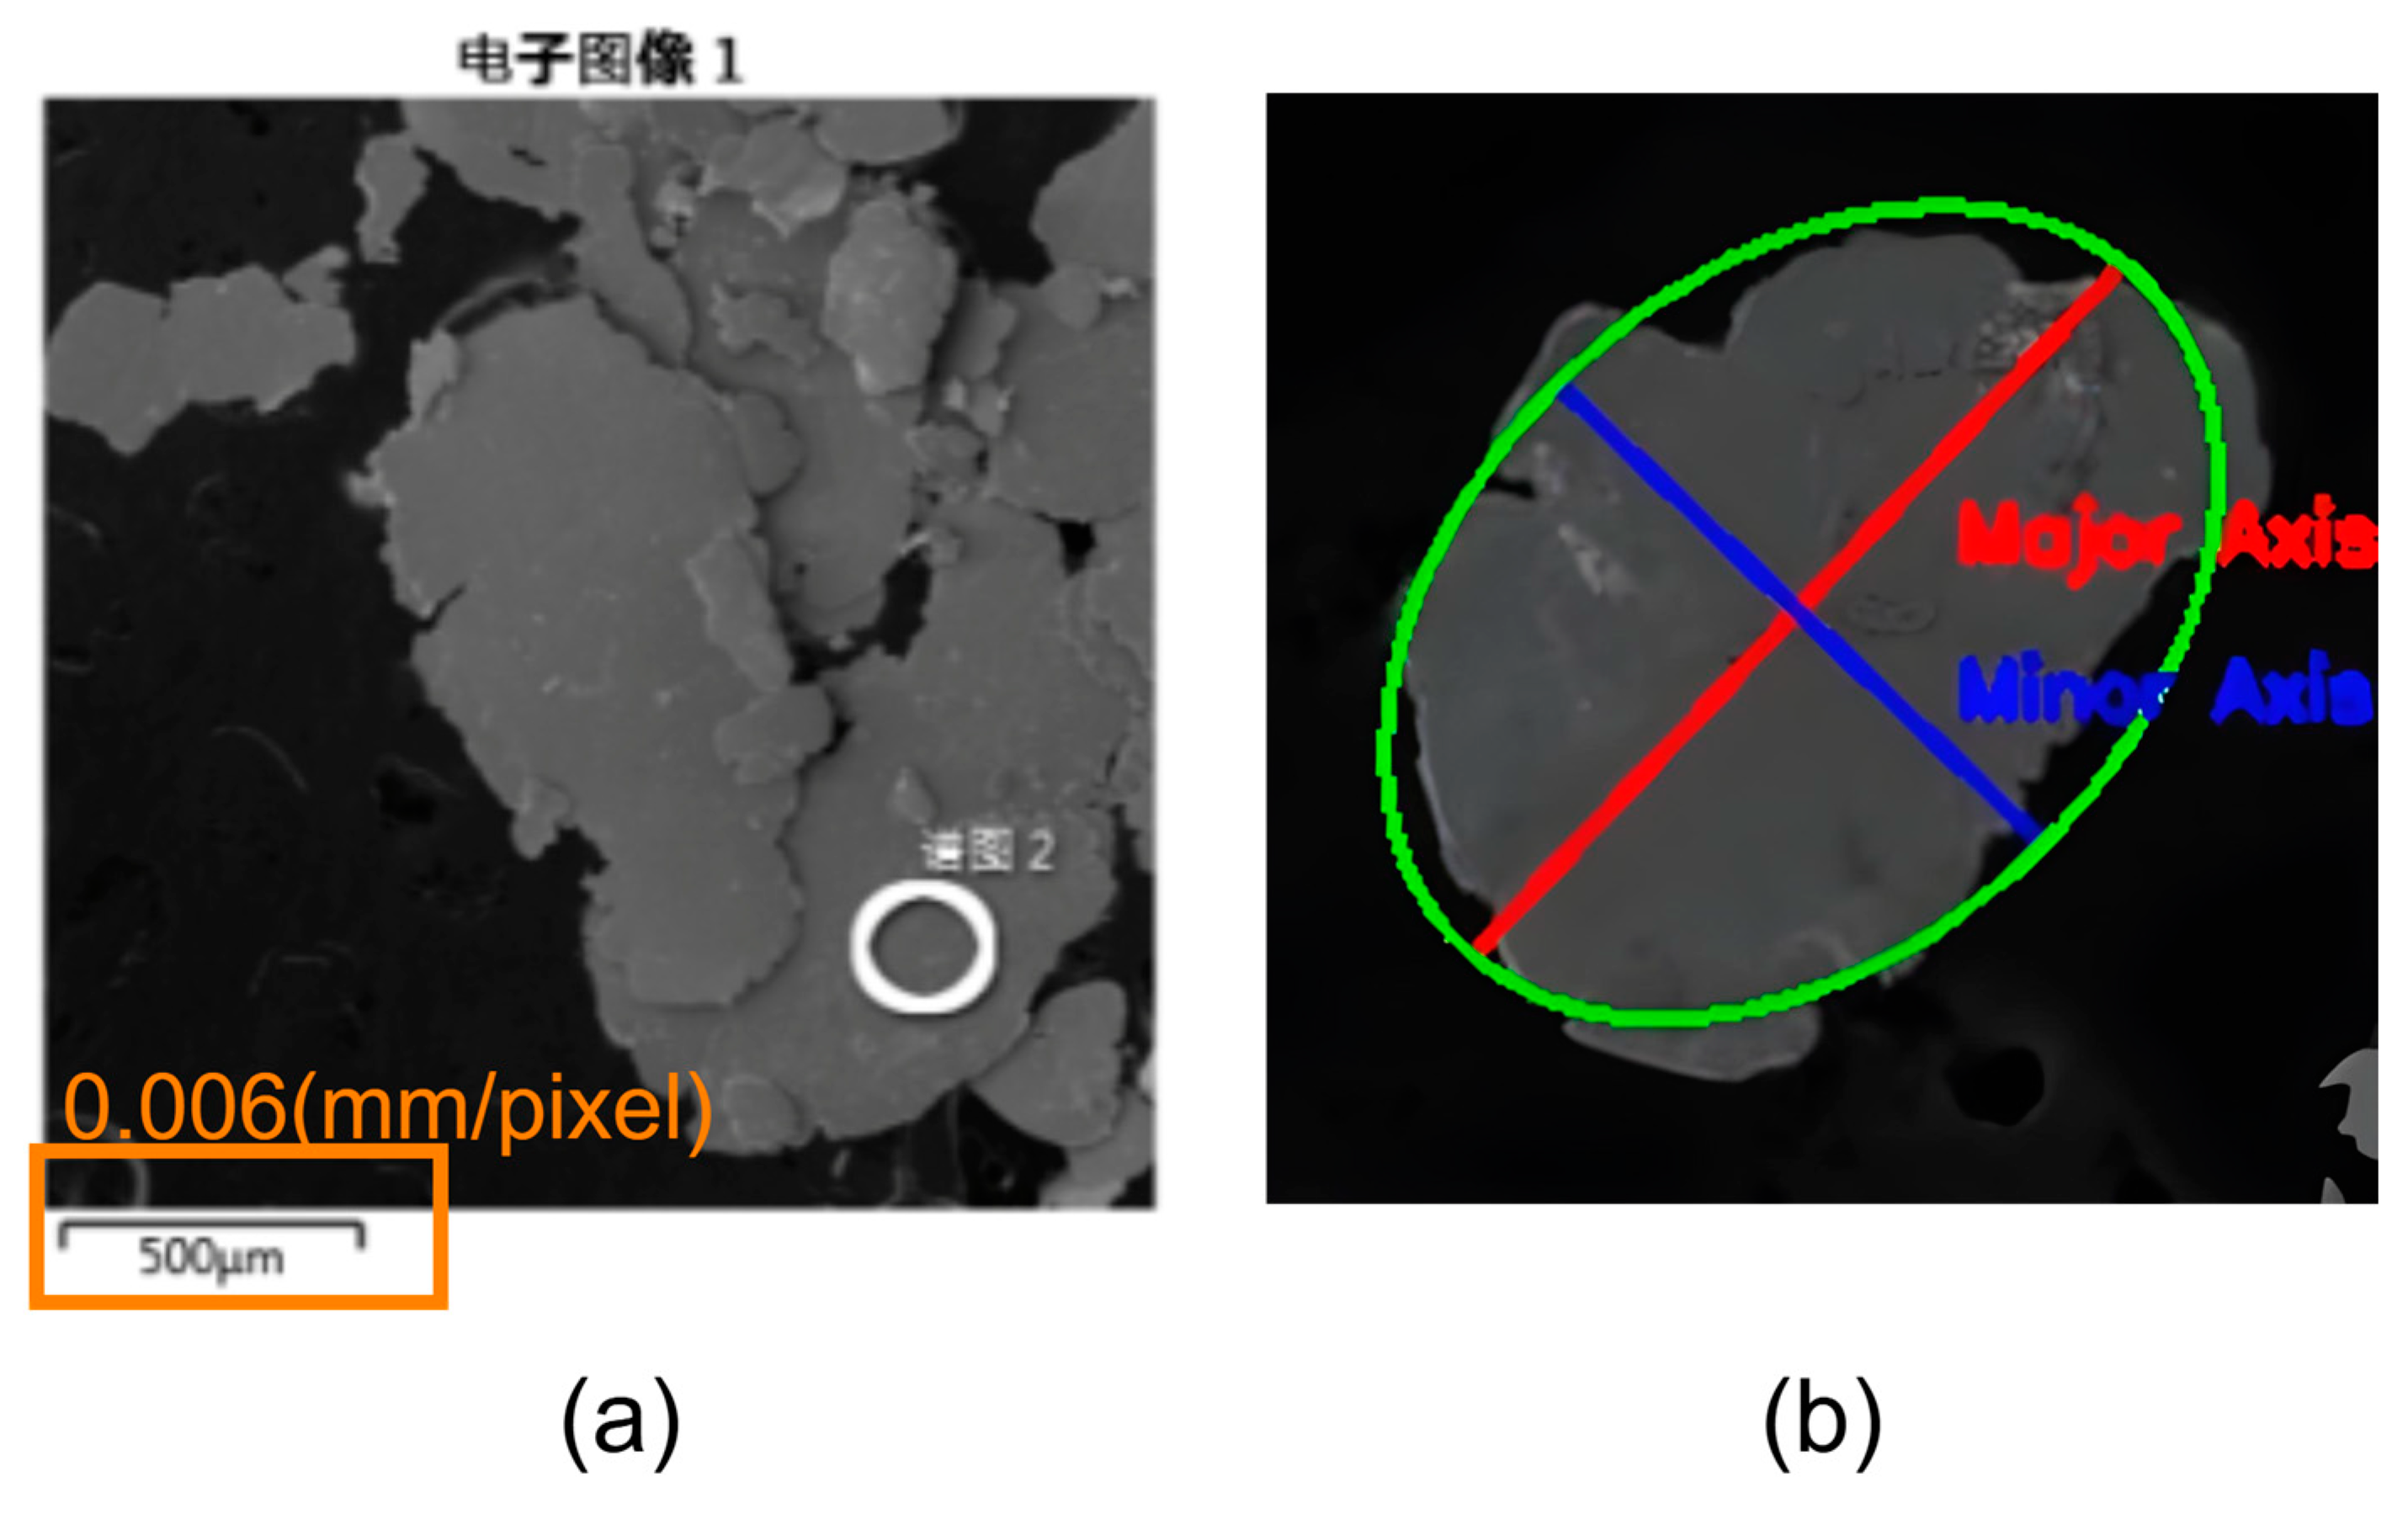
The conversion from pixel values to physical dimensions is illustrated in
Figure 9a. The OCR-recognized dimensions are standardized to millimeter (mm) units and then divided by the length of the scale bar. Additionally, since most wear debris contours are irregular, they are fitted with ellipses for easier qualitative analysis (
Figure 9b). The physical characteristics of the debris are described using three parameters: Major Axis, Minor Axis, and Aspect Ratio. Here, the major and minor axes correspond to the major and minor axes of the ellipse, and the Aspect Ratio is the ratio of the Major Axis to the Minor Axis. Based on these characteristics, it is possible to analyze the type of wear debris particles and perform qualitative analysis.
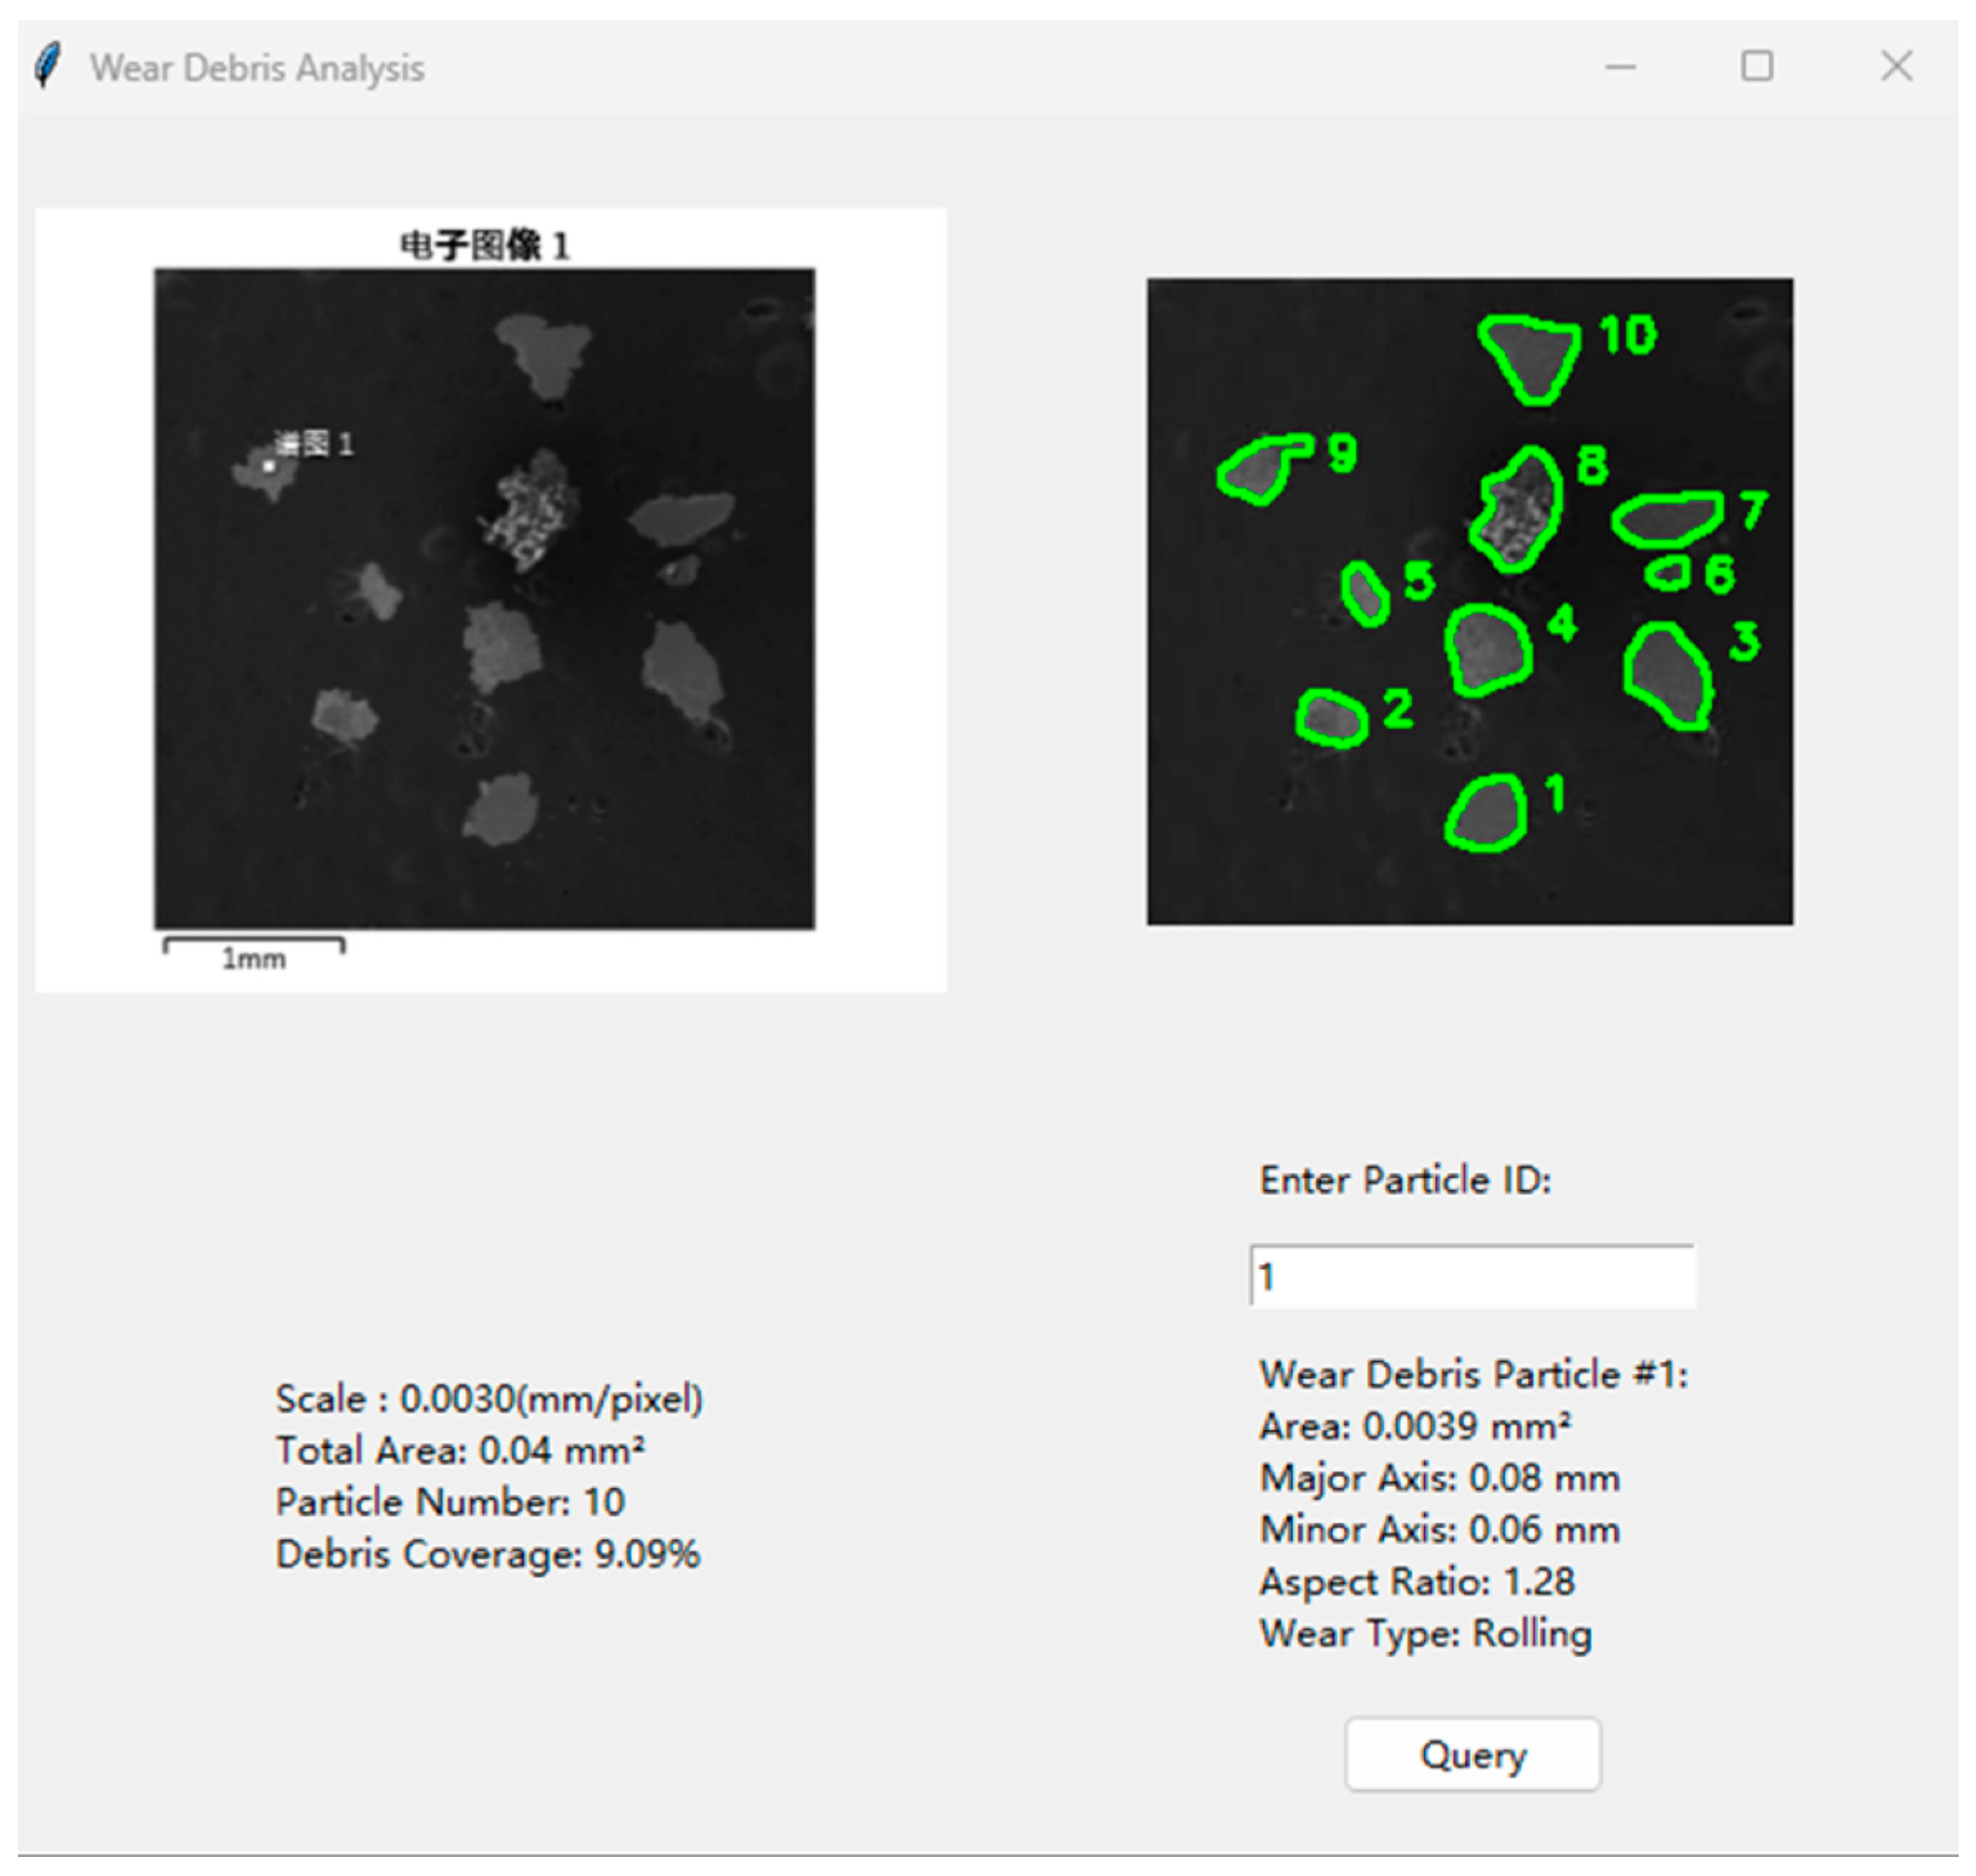
The actual coverage area of wear debris is calculated using the information obtained from the segmentation performed by the Improved Mask R-CNN model and the image calibration. This approach enables the automatic analysis of lubricating oil wear debris in ferrography images by automatically determining the coverage area of each wear debris particle. The test results are shown in
Figure 10.
3. Optimization of Image Segmentation for Lubricating Oil Wear Debris
3.1. FPN Structure Improvement
The backbone network of Mask R-CNN consists of ResNet101 and FPN. ResNet101, a widely used residual neural network, was developed to address the vanishing and exploding gradient issues that can arise with increasing model depth. The multi-scale feature maps from images are extracted through a series of convolutional and pooling layers. The features extracted from layers with fewer convolutions are referred to as shallow features, primarily representing the color characteristics of the image. In contrast, the features from deeper layers are known as deep features, which capture more abstract semantic information. The FPN processes feature maps with different sizes by normalizing them to a uniform size and fusing them to generate multi-scale features.
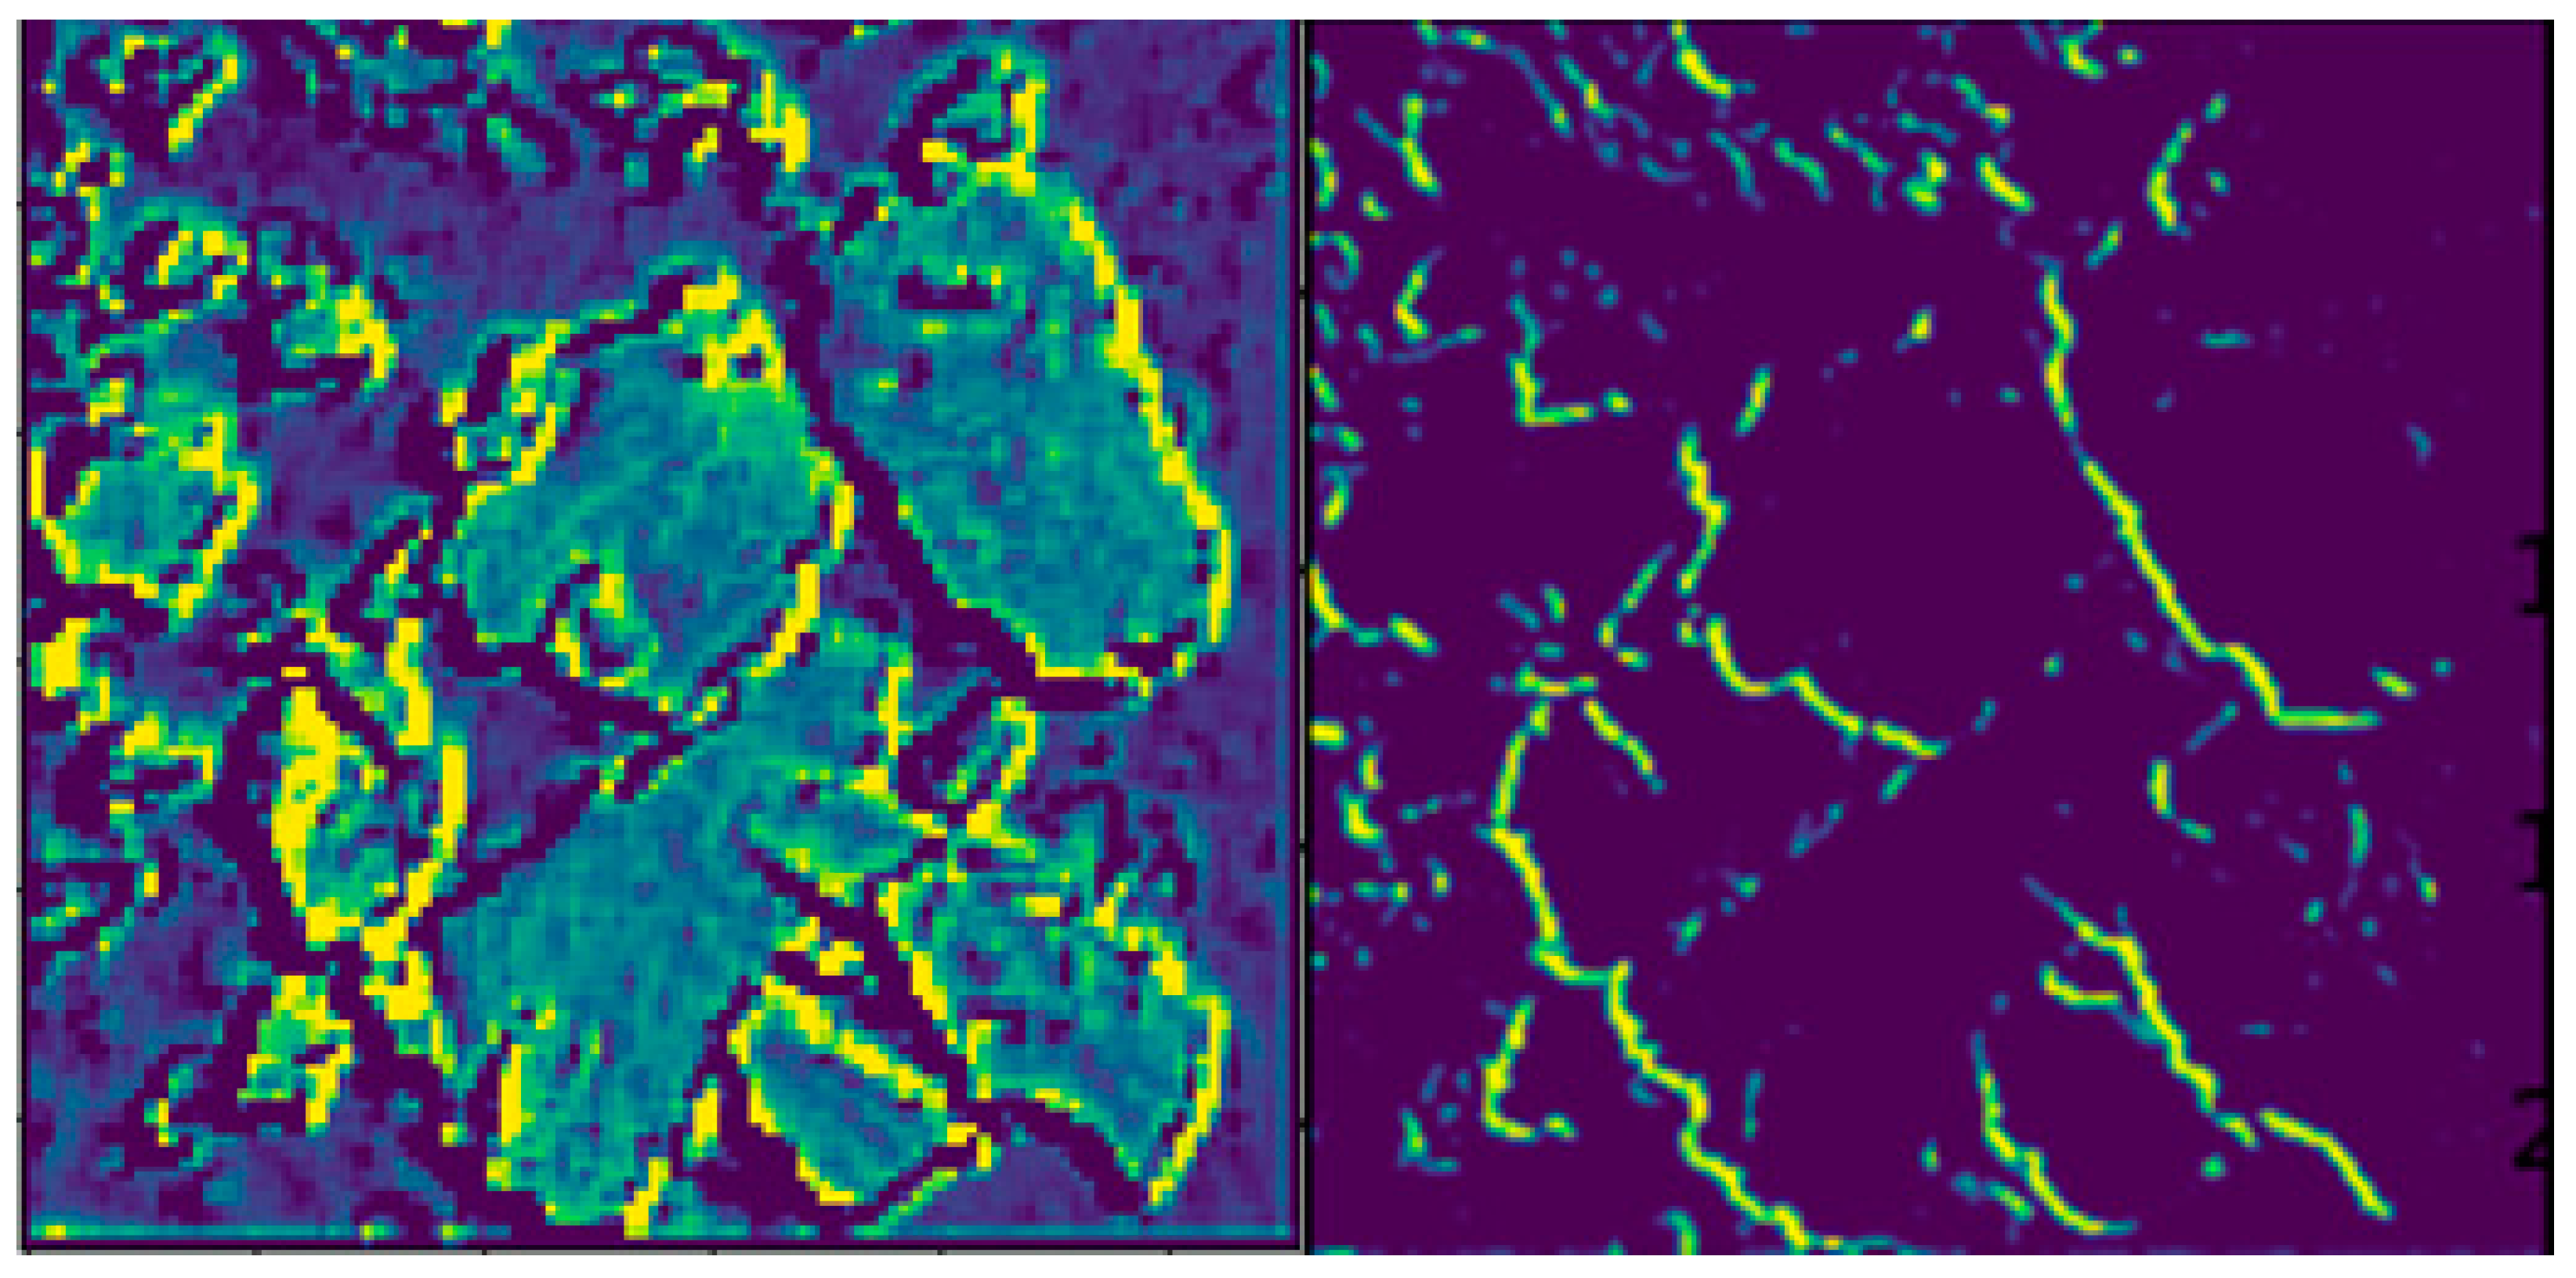
In the task of detecting wear debris in lubricating oil, the wear debris regions occupy a significant portion of the image, and the edges are often indistinct. As shown in
Figure 11, the shallow and deep features extracted from the processing of ferrography wear debris images by ResNet101 exhibit distinct characteristics. The shallow features primarily represent the color of the wear debris, while the deep features mainly capture the edges of the debris. However, in the shallow feature maps, the boundaries between adjacent debris particles are unclear, leading to a higher likelihood of misclassification. In contrast, the deep feature maps show incomplete debris edges. Therefore, to accurately identify the wear debris in the image, it is essential to deeply fuse both shallow and deep features.
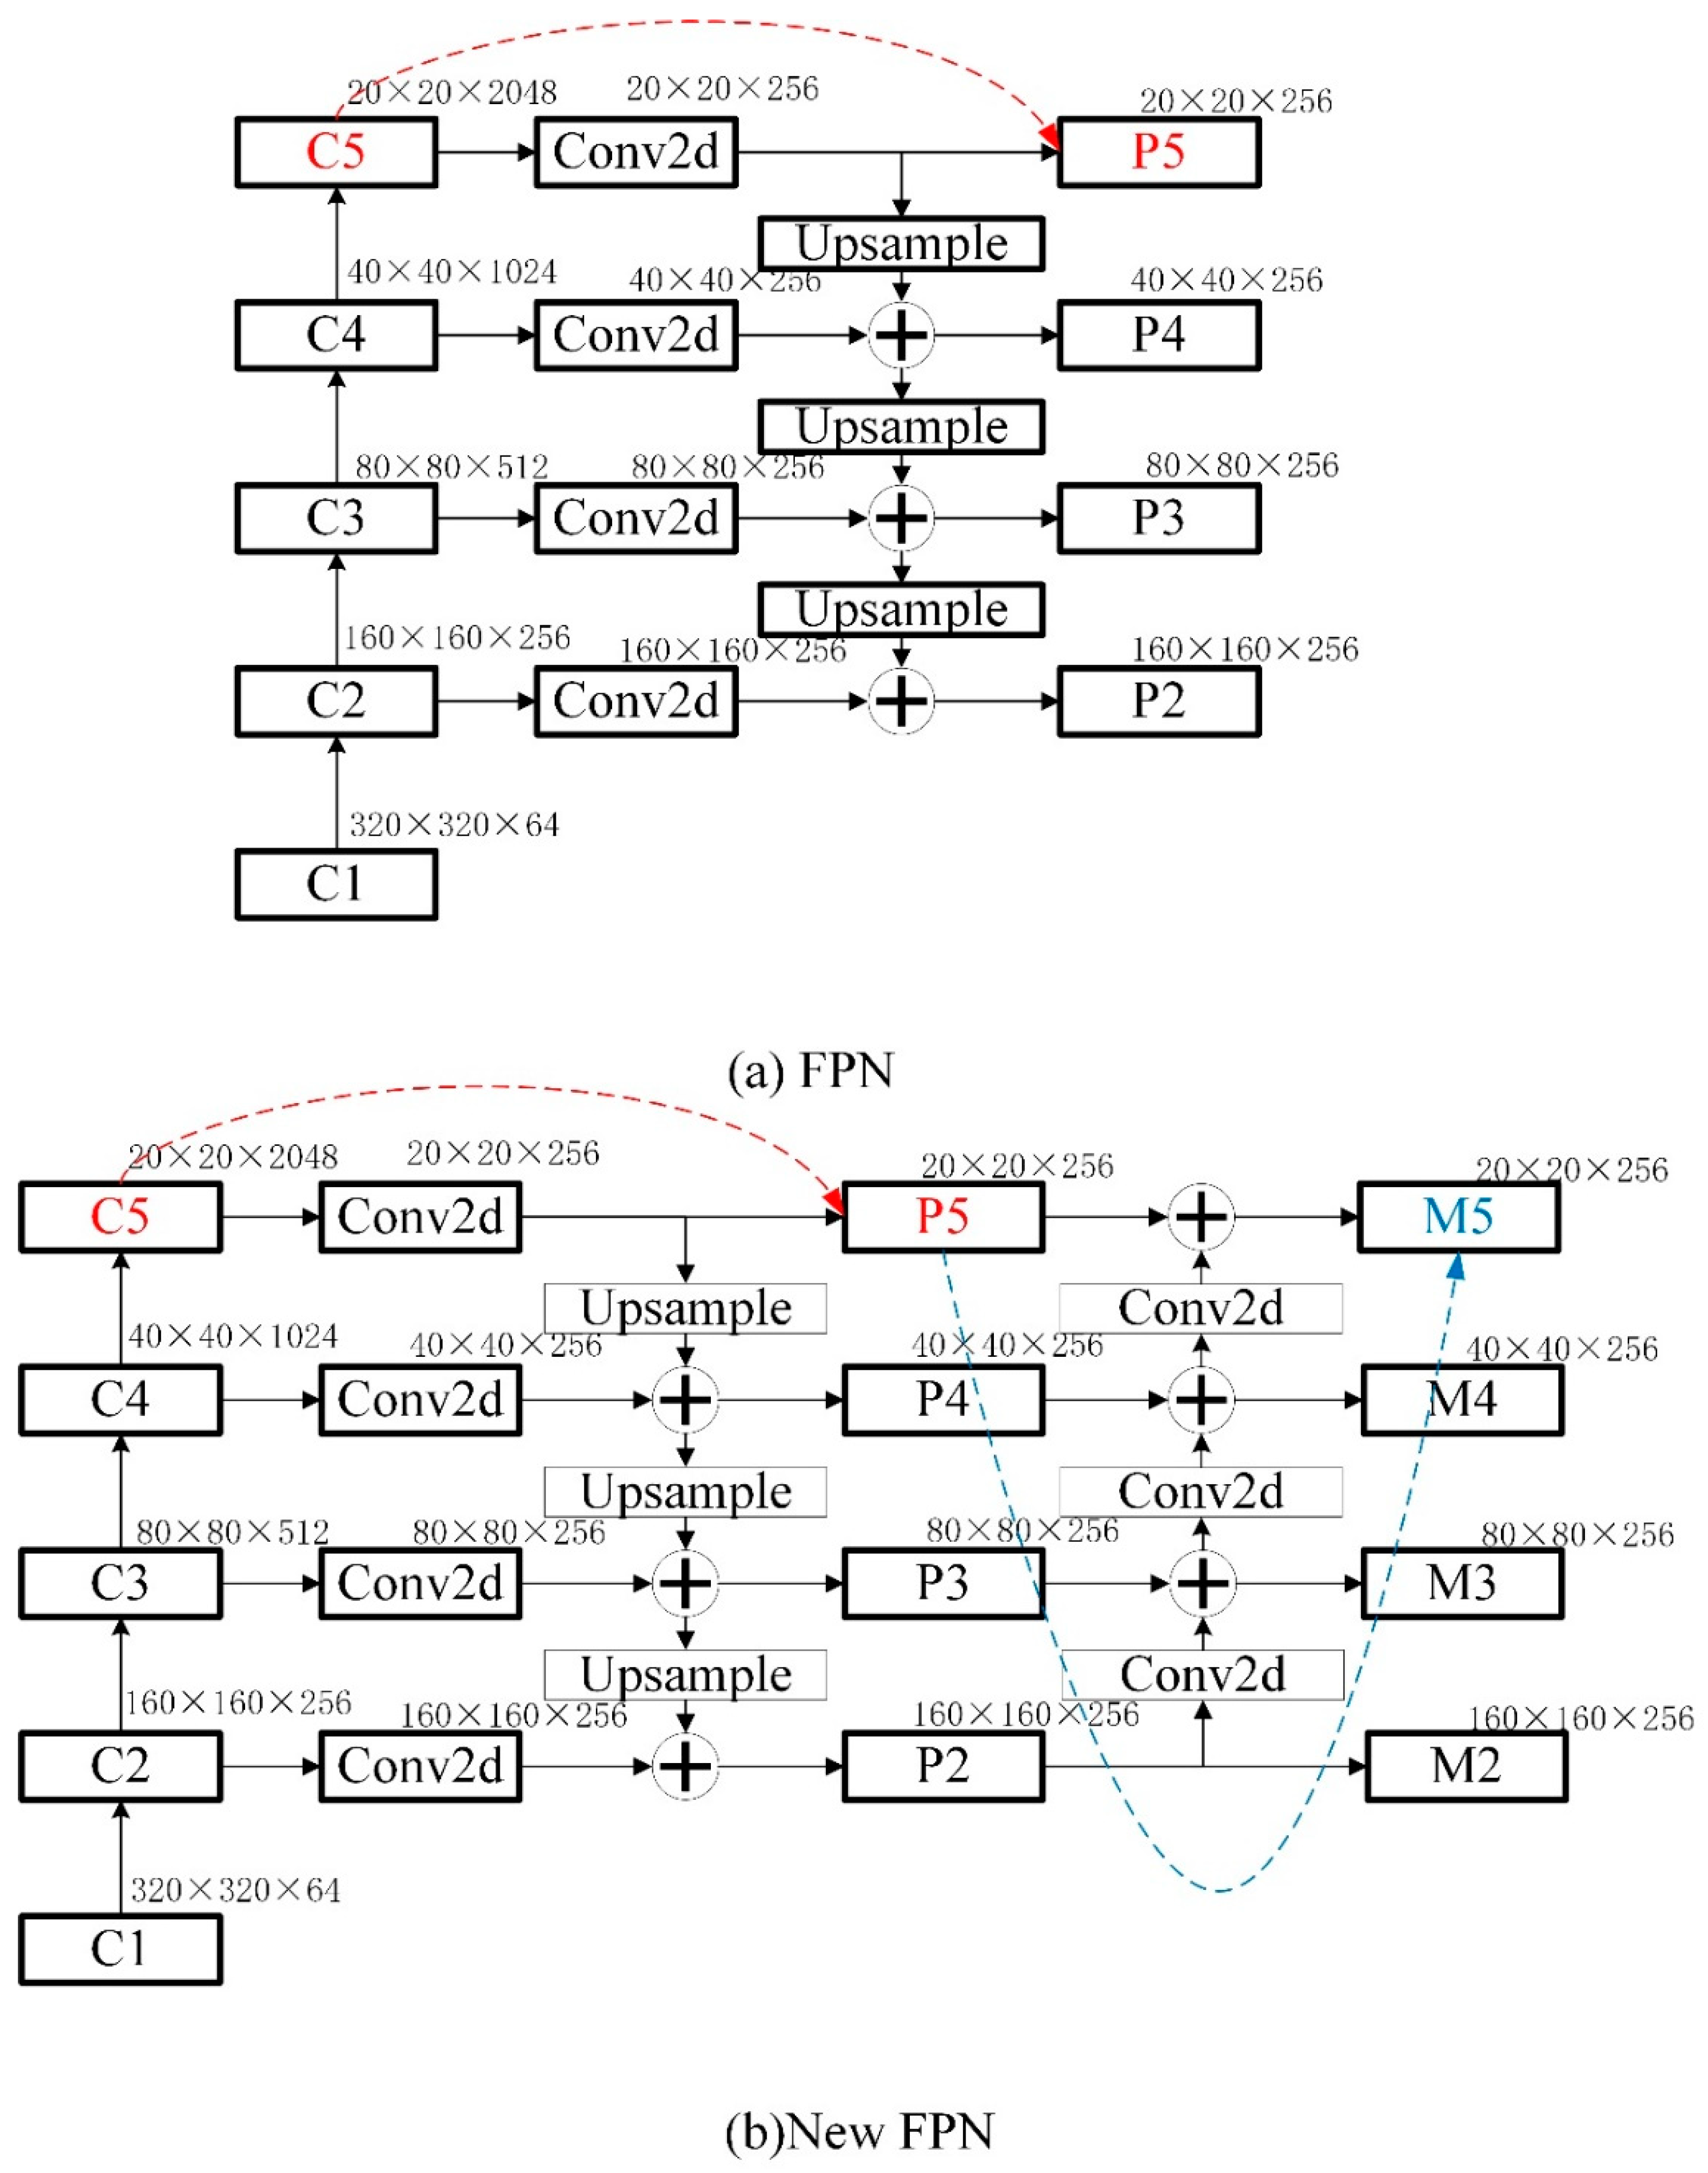
The structure of the FPN is illustrated in
Figure 12a. In the original FPN architecture, the deep feature layer P5 is derived solely from multiple convolutional layers of ResNet101, without integration with other feature layers. To address this, Liu et al. proposed adding a new FPN layer to deeply fuse high- and low-level feature layers of the image [
21]. In response, this study further integrates the four feature maps produced by the FPN. The shallow features undergo an additional 2D convolution and are then fused with adjacent feature maps. The newly formed feature maps, M2, M3, M4, and M5, offer a more comprehensive fusion of multi-scale features in the debris images. The revised FPN network structure is shown in
Figure 12b.
3.2. Attention Mechanism
Ferrography wear debris images are grayscale, with shallow features providing the primary information. To enhance the network’s feature extraction capability, an attention mechanism is integrated into the network. Prominent attention mechanisms in computer image processing include Squeeze-and-Excitation Networks (SENet) [
22], Efficient Channel Attention (ECA) [
23], CBAM [
19], and others.
SENet is a channel attention mechanism that performs global pooling on images, utilizes two fully connected layers to derive channel weights, and then multiplies these weights with the original image channels. ECANet improves upon SENet by replacing the two fully connected layers with 1D convolutional layers, adjusting the channel consideration for each weight based on the convolution kernel size. Despite these advancements, both SENet and ECANet primarily focus on channel attention mechanisms, which may not fully capture spatial information in images.
CBAM addresses this limitation by integrating both channel and spatial attention mechanisms. A study demonstrates that CBAM outperforms both SENet and ECANet [
19]. CBAM operates as a sequential combination of a channel attention module and a spatial attention module. The structure of CBAM is shown in
Figure 13.
The Convolutional Block Attention Module (CBAM) systematically enhances feature discriminability through a dual-attention mechanism, formally expressed as
where
: Input feature map (Height × Width × Channels);
: Channel attention map;
: Spatial attention map;
: Hadamard product (element-wise multiplication);
: Spatial height, width, and channel dimensions.
The specific formula for the attention mechanism is as follows:
- (a)
Channel Attention Submodule:
: (Channel-wise average pooling);
(Channel-wise max pooling);
: MLP weights with reduction ratio ;
: Sigmoid activation.
- (b)
Spatial Attention Submodule:
: (Spatial average pooling);
: (Spatial max pooling);
: 7 × 7 convolution with kernel weights ;
: Channel concatenation.
The attention mechanism is strategically embedded into Mask R-CNN’s feature hierarchy through these implementation phases, as shown in
Table 1:
4. Experimental Results
The program for recognizing ferrography wear debris images is implemented in Python (3.7) using TensorFlow-gpu (2.2.0) as the deep learning framework. The computer configuration used for this analysis includes an Intel Core i7-12700F CPU and an NVIDIA GeForce RTX 3060 12GB GPU.
To conserve computational resources and reduce training time, pre-trained weights and frozen training are utilized based on transfer learning principles. Improper configuration of the initial model parameters can significantly impact the model’s performance, leading to challenges in effectively extracting image features, prolonged training times, or even failure to converge. Research has shown that pre-trained models are generally effective across various datasets [
24]. The primary advantage of pre-trained weights is that they provide an efficient feature extraction network, which transforms images into computer-recognizable features. To preserve the integrity of the initial feature extraction network, frozen training is employed to lock the weights of this network. This approach not only reduces video memory usage but also enhances training efficiency. Once frozen training is completed, defrost training is performed to adjust the weights of the entire network.
4.1. Annotation and Construction of Lubricating Oil Wear Debris Dataset
A notable validity discrepancy exists in current tribological research data sources: While most laboratory studies employ electrically driven controlled wear simulators to generate particulate samples-standardized conditions, their energy conversion paradigm (electrical→mechanical) fundamentally differs from the thermodynamic cycle (Brayton cycle) governing aero-turbofan engines. In contrast, airline MCD reports capture native wear particles directly generated by critical tribopairs like high-pressure compressor bearings and turbine shaft seals through in-service oil monitoring. These particles form through authentic mechanisms (fretting/adhesive wear under TLA-dynamic conditions with combustion-driven thermal stresses), accurately reflecting material degradation in operational environments. Consequently, our research prioritizes extracting ferrography images from airline operational MCD reports to construct an aerodynamically relevant wear signature dataset with high operational fidelity.
In this paper, a total of 147 wear debris images were extracted from more than 50 MCD reports, with each image having a resolution of 332 × 258 pixels. The original images contain metadata such as image names, scales, and annotation information (e.g., the white annotations shown in the left figure of
Figure 11), which can negatively impact neural network training and detection performance. To address this, the original images were cropped to 213 × 213 pixels, and the ‘Inpaint’ function in OpenCV was used to remove redundant information and repair the images. The results of the cropping and repair process are shown in
Figure 14.
Due to insufficient pixel density and unclear details in the original images, image enhancement is necessary. To improve edge features and facilitate annotation, the Laplacian operator and Sobel operator are employed to sharpen the images. The Laplacian operator works based on the following principle: First, the image is converted to grayscale, resulting in a matrix
F with dimensions (Width:
w; Height:
h), where each element represents the pixel value at that point. The formula for Laplacian sharpening is given by (4):
In this context, denotes the value of the element located at row y and column x in matrix F, while represents the value of the element at row y and column x in matrix G. The sharpened image is obtained by converting matrix G into a grayscale image.
The Sobel operator is a template matching technique that uses a 3 × 3 kernel. This kernel is applied to a 3 × 3 window within the image, and the results are computed. The maximum value from these results is then output as the sharpening result for the central element of the window. Unlike the gradient-based Laplacian operator, the Sobel operator not only sharpens the image but also smooths out noise, offering improved performance. The Sobel operation is described by the Formulas (5) and (6):
Here, denotes the value of the element located at row y and column x in matrix G. Matrix A represents the grayscale version of the original image. The sharpening result is obtained by converting matrix G into a grayscale image.
To facilitate programming and simplify the calculation process, the square root is used to approximate the sum of absolute values, as illustrated in Equation (7):
The sharpening results of the images using the Laplacian and Sobel operators are presented in
Figure 15. It is evident that the Sobel operator produces superior sharpening results compared to the Laplacian operator. Therefore, the Sobel operator is used for image sharpening in this study.
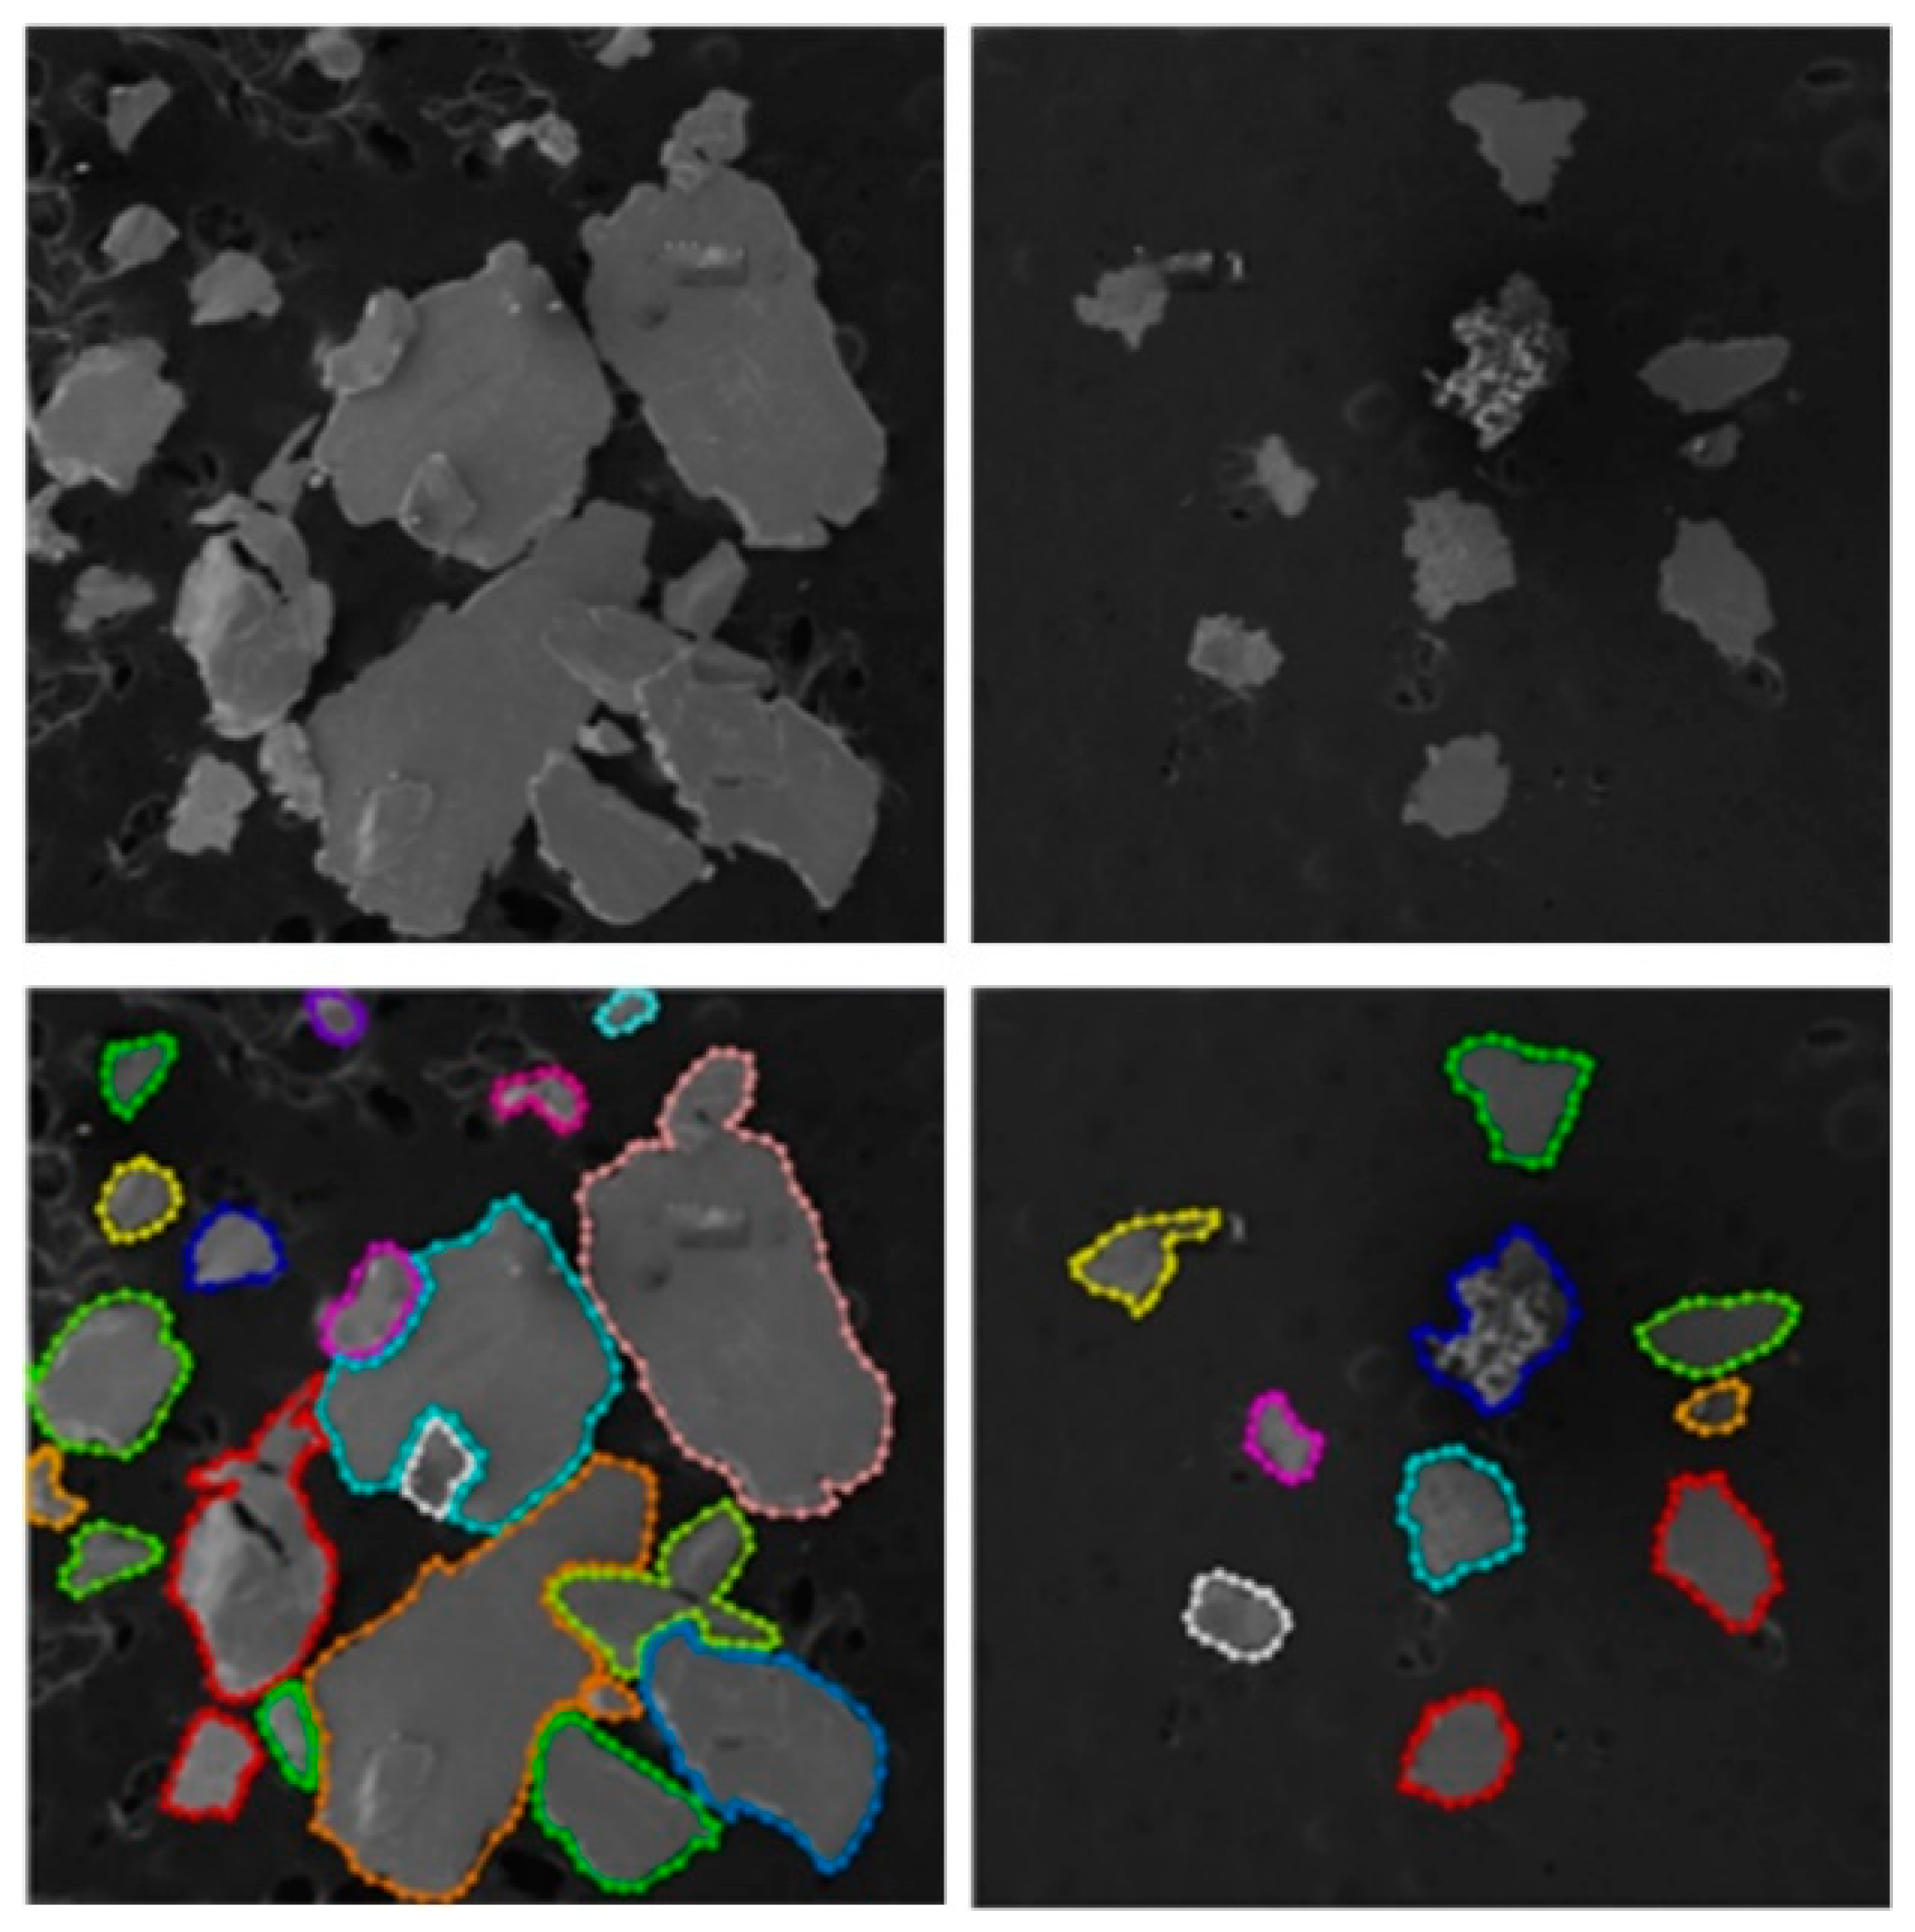
After image processing, the wear debris contours in the ferrography images were annotated under expert guidance to construct the dataset, as shown in
Figure 16.
The marked results of the annotated dataset reveal that 147 wear debris images collectively contain over 2500 individual wear particles, a quantity sufficient for preliminary neural network training. To enhance model robustness and mitigate overfitting risks, systematic data augmentation was implemented on the wear debris image dataset. The augmentation protocol included geometric transformations (random cropping and rotation) combined with noise injection operations, as schematically illustrated in
Figure 17. For each original image, one stochastic transformation was algorithmically selected to generate novel synthetic samples. This approach effectively expanded the training set by a factor of five, resulting in a final augmented dataset comprising 735 distinct wear particle images.
4.2. Evaluation Indicator
The performance evaluation of instance segmentation models requires a multidimensional metric system, given their dual functionality in object detection and semantic segmentation. Our proposed evaluation framework comprises the following core components:
1. Object Detection Metrics
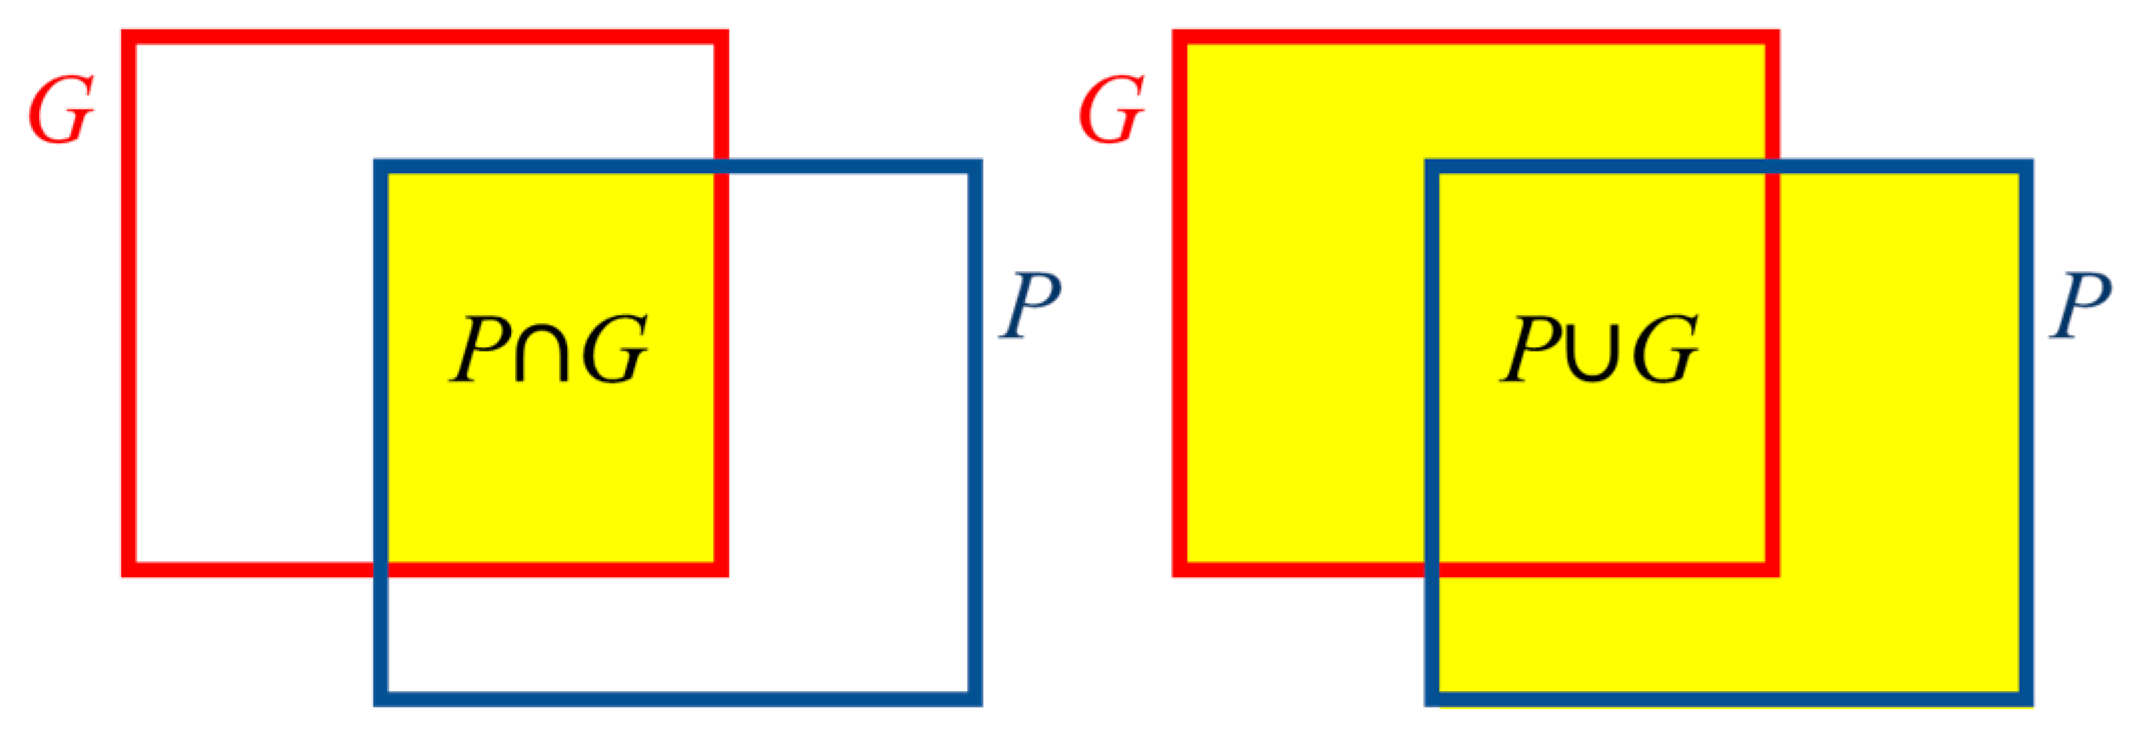
Mean Intersection over Union (MIoU): Quantifies spatial alignment between predicted and ground truth bounding boxes. The schematic diagrams of P∩G and P∪G are shown in
Figure 18,
where
denotes the
i-th predicted box,
denotes the corresponding ground genuine box, and
N denotes the total instances.
Average Precision (AP) and Average Recall (AR): AP represents the proportion of true positive samples among the predicted positive samples; AR represents the proportion of correctly detected samples among all actual positive samples.
where true positives (TPs) mean positive instances correctly classified as positive. False positives (FPs) mean negative instances misclassified as positive. False negatives (FNs) mean positive instances misclassified as negative.
2. Semantic Segmentation Metric
Mean Pixel Accuracy (MPA): MPA is the average of per-class pixel accuracy.
In the above formulas, the parameter k represents the number of target types to be detected. The true value is denoted as I, and the predicted value is denoted as j. Here, signifies that the i-th category is predicted as the j-th category.
4.3. Comparison of Experimental Results
To validate the effectiveness of the Improved Mask R-CNN models proposed in this paper, experiments were conducted on the ferrography wear debris image dataset. The specific training parameters are shown in
Table 2:
The detection performance of the improved network was compared with that of the original Mask R-CNN network and other instance segmentation methods, such as Yolact [
25], YOLOv8 [
26], and YOLOv11 [
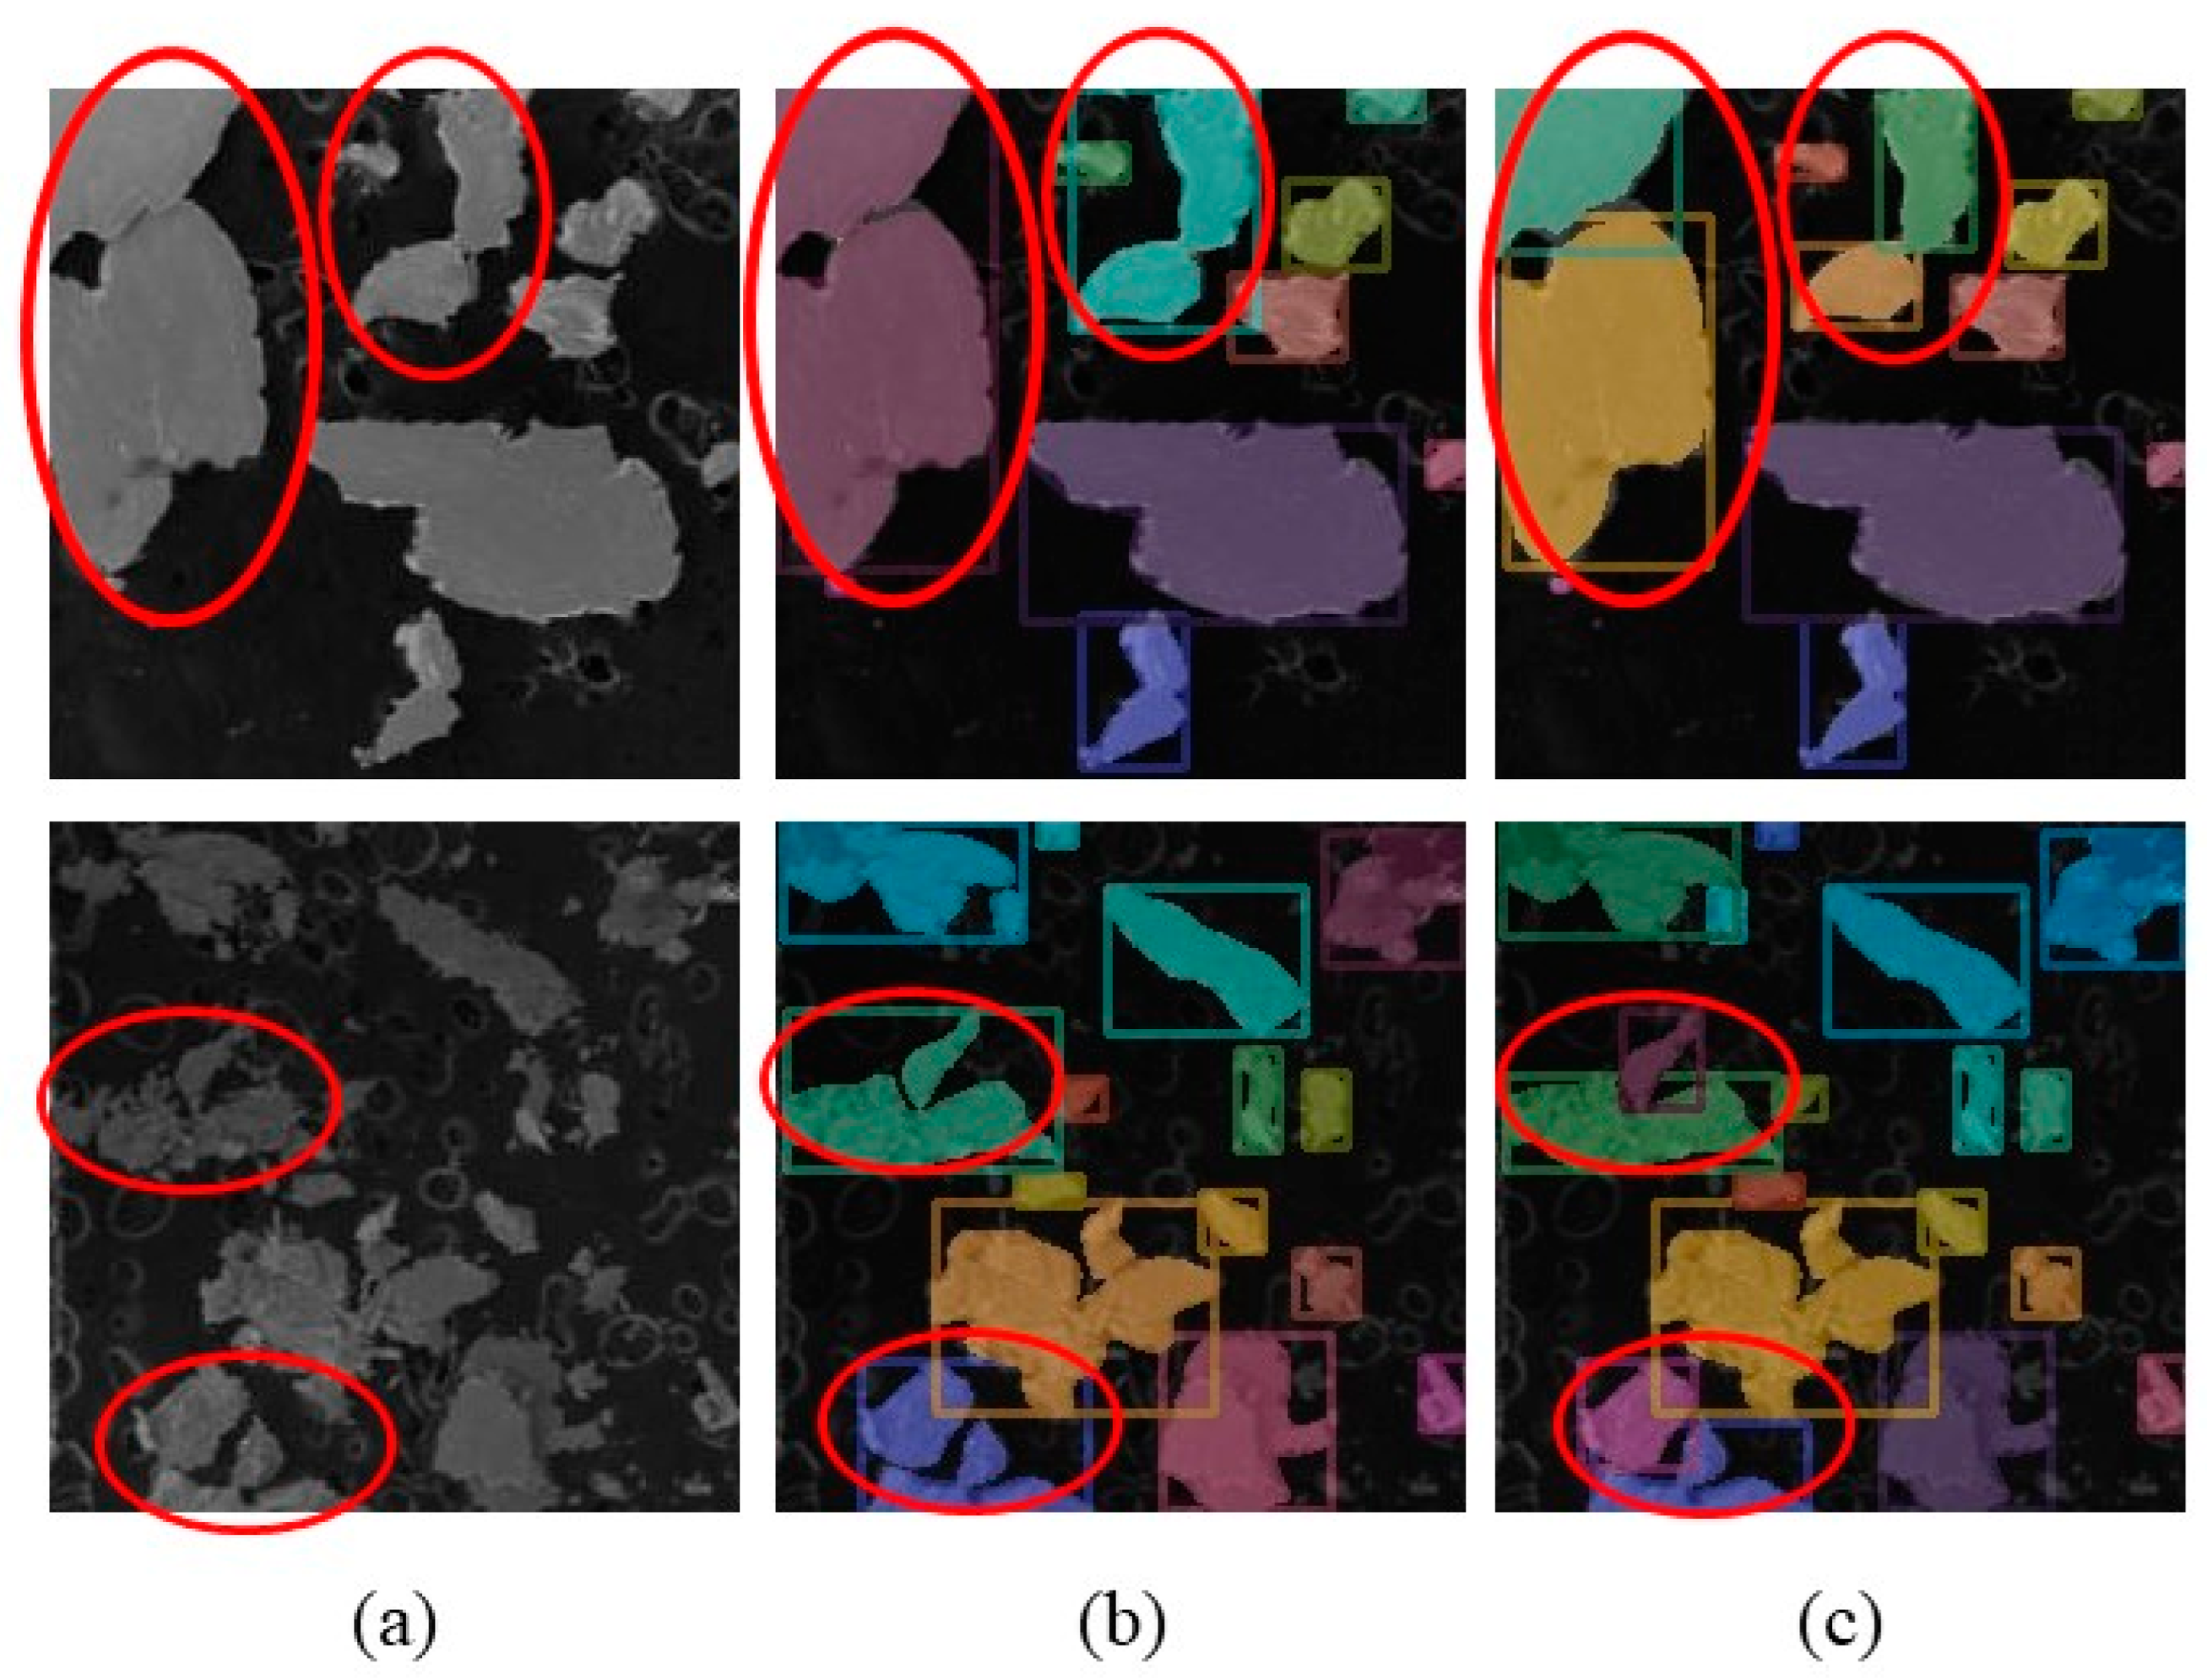
27]. The model’s accuracy was assessed using MIoU, PA, PR, and MPA metrics, while the detection speed was evaluated by the common index FPS (Frames Per Second). Additionally, the ablation experiments were conducted to determine the most suitable attention mechanism for wear debris image segmentation. The image segmentation results are shown in
Figure 19, and the performance evaluation results are summarized in
Table 3.
As shown in
Table 3, the improved neural network demonstrates higher detection accuracy compared to the original model, albeit with a slightly reduced detection speed. This decrease in speed can be attributed to the introduction of a bottom-up path augmentation in the FPN structure, which enhances the entire feature pyramid by incorporating precise localization signals from lower layers, thereby increasing the network’s depth.
Additionally, the Yolact network, a representative single-stage instance segmentation model, was tested for comparison. YOLO11 exhibited a significantly faster detection speed, reaching 88.3 FPS, which makes it suitable for real-time detection. However, the detection accuracy is noticeably lower than that of the two-stage Mask R-CNN network.
Wear debris image detection primarily serves as a technical foundation for ferrography analysis and is typically conducted offline. In this context, the segmentation accuracy is of paramount importance to accurately identify the parameters such as debris size, shape, and type, while the requirement for detection speed is comparatively lower. Thus, the Mask R-CNN model as the foundational network for wear debris detection provides notable advantages in terms of accuracy and reliability.
Additionally, the combination of the backbone network and the attention mechanism was optimized, with the Improved Mask R-CNN model integrated with CBAM achieving the best performance. The proposed configuration achieved an MIoU of 84.89% with a MAP of 87.63%.
Figure 19 demonstrates that the Improved Mask R-CNN model exhibits enhanced capability in distinguishing adjacent wear debris.
To assess the effectiveness of Sobel sharpening in wear debris detection, we first constructed two datasets containing pre-sharpened and post-sharpened debris images with identical mark data. Using the training parameters specified in
Table 2, we trained detection models on both datasets. The evaluation metrics employed in this study include MIoU, PA, PR, and MPA. The comparative results are presented in
Table 4.
These experimental results demonstrate that applying the Sobel operator to wear debris images significantly enhances the detection accuracy of Improved Mask R-CNN model with CBAM.
The evaluation metrics discussed above primarily assess the classification performance of neural networks. However, identifying the quantity of wear debris is also crucial for quantitative analysis. Therefore, additional evaluation metrics are introduced to measure the neural network’s ability to distinguish the number of wear debris particles. These metrics include precision rate (
PR), miss rate (
MR), and false rate (
FR). The calculation formulas for
PR,
MR, and
FR are provided in Equations (12), (13), and (14), respectively.
In the above equations, represents the total number of wear debris across all images; denotes the number of wear debris correctly detected; indicates the number of wear debris that were missed; refers to the number of wear debris that were incorrectly identified.
A total of 80 ferrography wear debris images were selected for detection, containing a total of 2398 debris particles. The detection results are presented in
Table 5.
Table 5 and
Figure 19 show that the original Mask R-CNN model exhibits a high miss rate and lacks sufficient capability to segment and identify adjacent wear debris. In contrast, the Improved Mask R-CNN model demonstrates a significant reduction in miss rate, with a precision rate reaching 97.70%, which is approximately 15% higher than that of the original model. Additionally, the improved model shows enhanced detection capability for adjacent wear debris.
4.4. Qualitative and Quantitative Analysis of Wear Debris
The relationship between wear debris types and their physical characteristics is shown in
Table 6 [
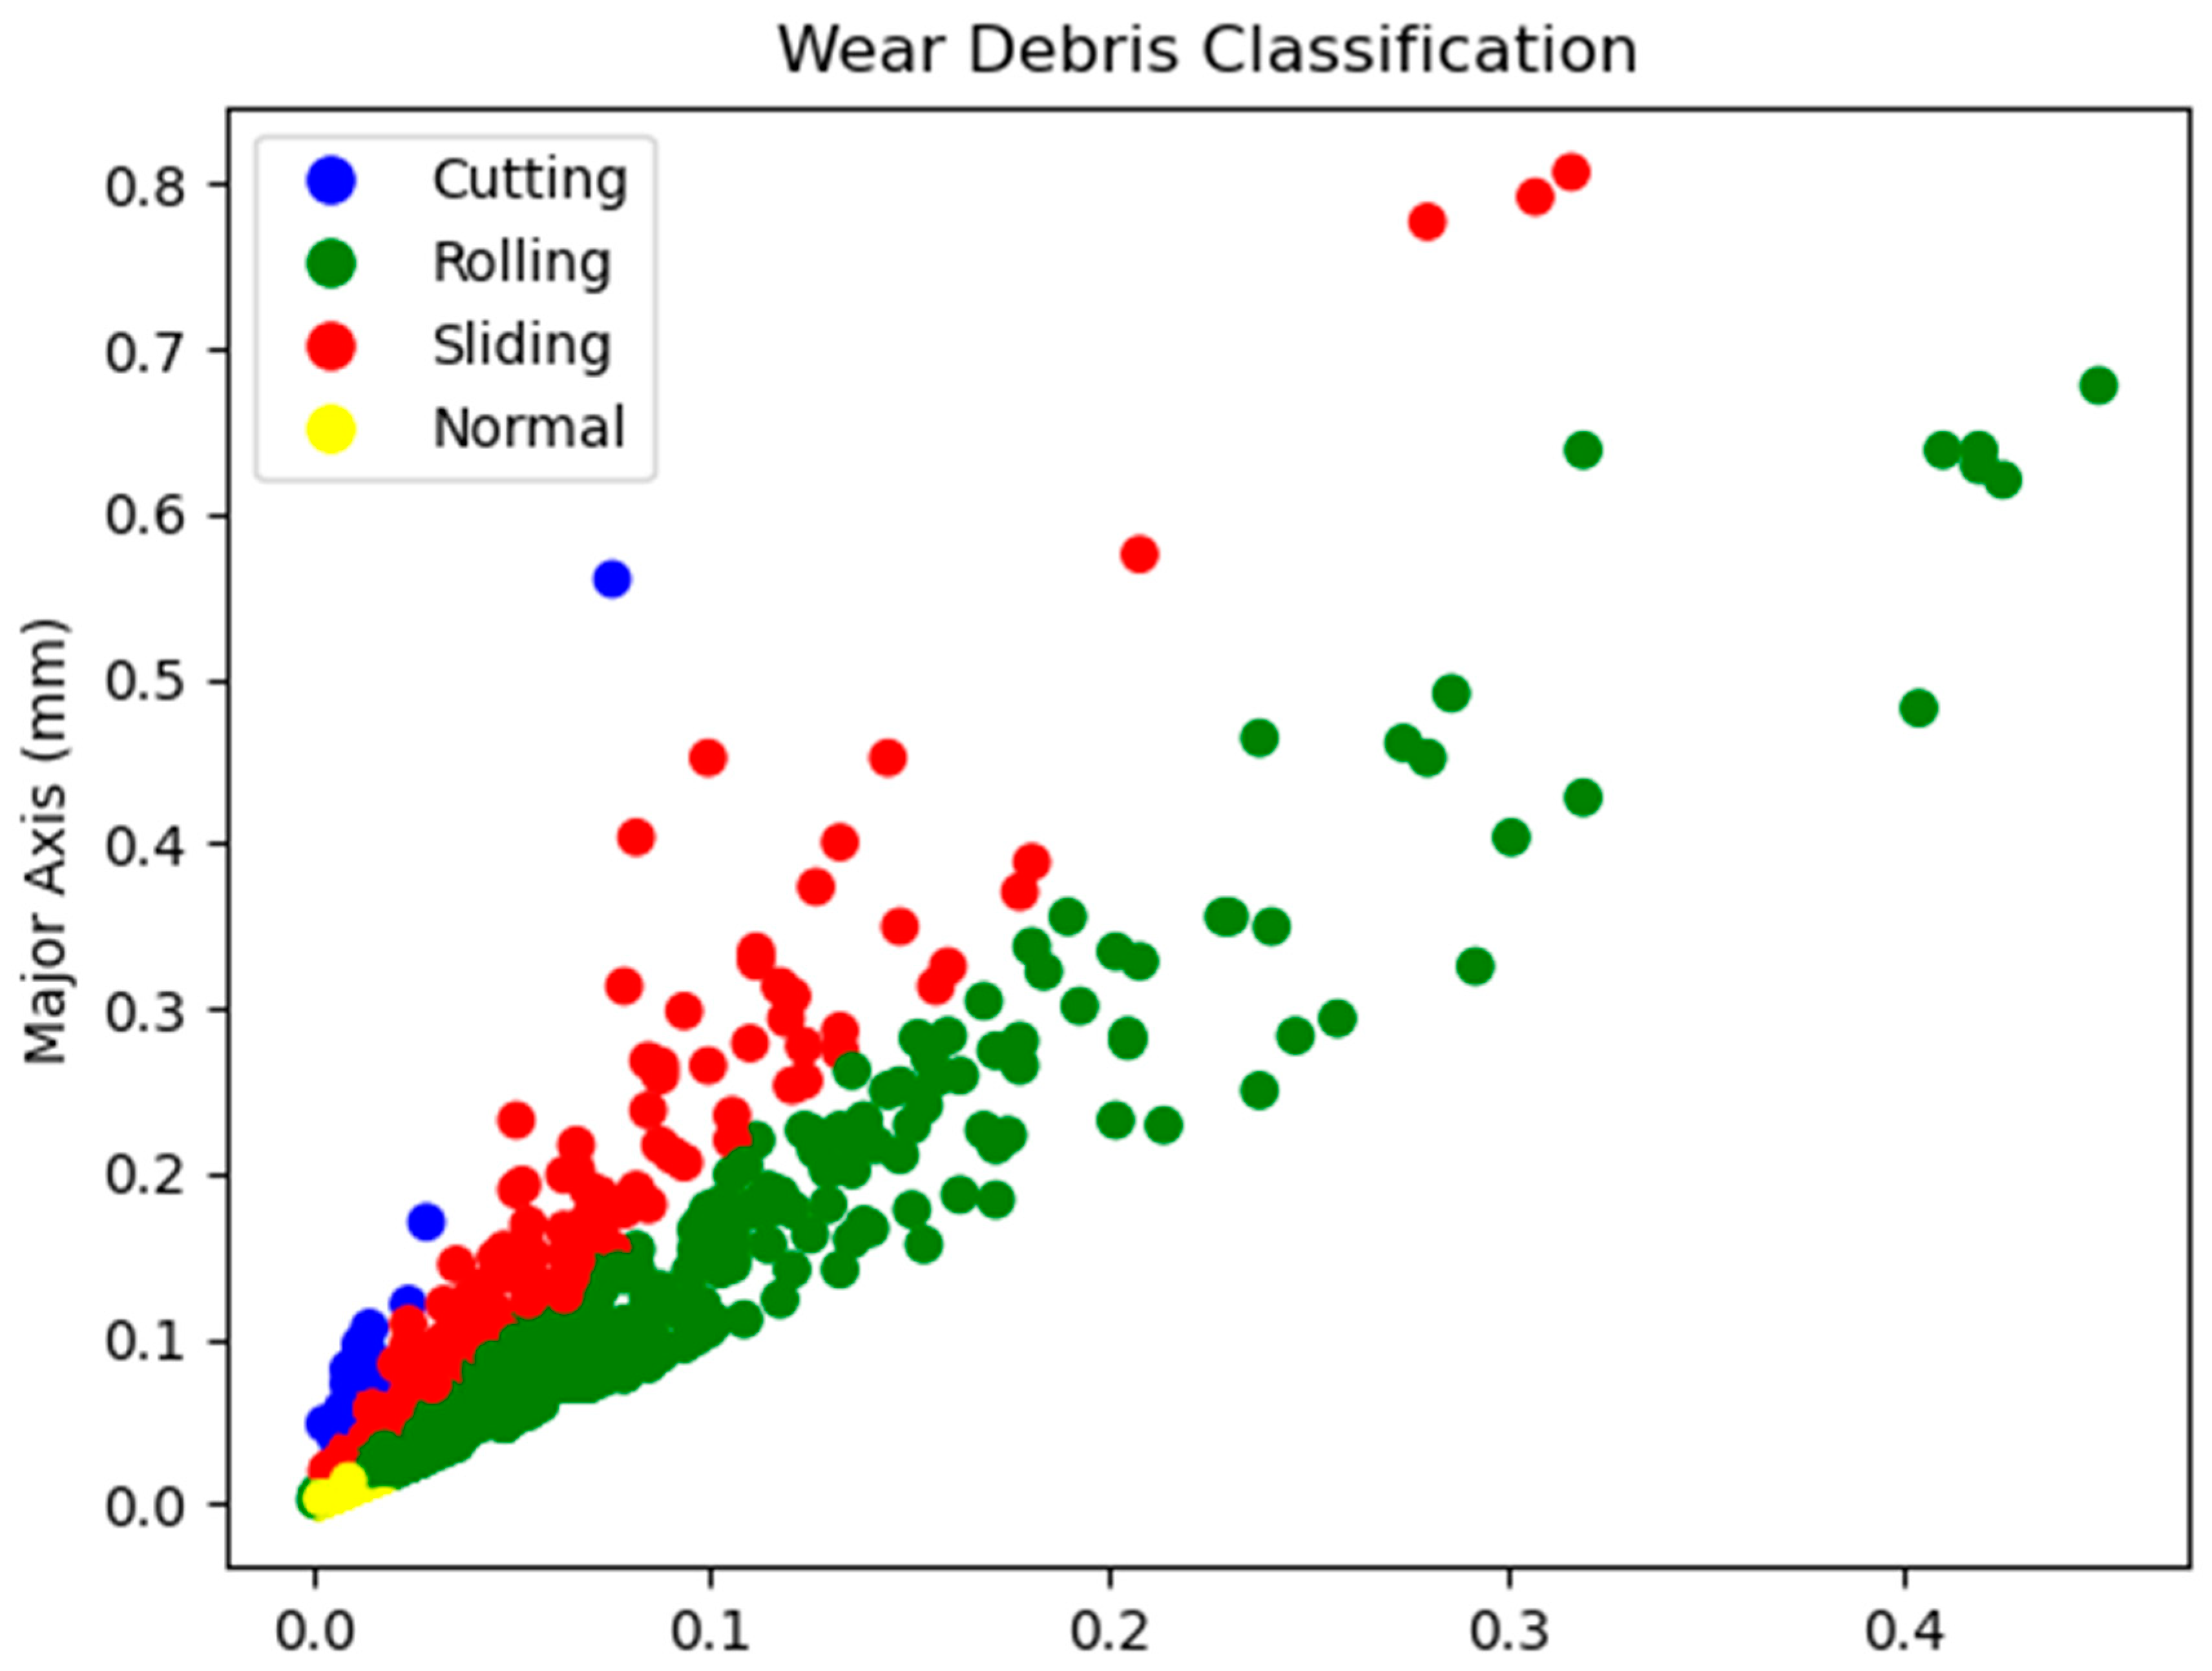
7]. It is well known that different types of wear debris exhibit distinct sizes and features. Moreover, due to the varying scales of ferrography images, debris with the same pixel size may differ in actual physical dimensions. While neural network methods can effectively segment wear debris contours, they are insufficient for accurate classification. Therefore, this study first employs neural network methods to segment the wear debris contours and then classifies them in terms of the characteristics listed in
Table 3. The classification results are shown in
Figure 20.
The classification accuracy achieved by the proposed wear debris detection method is 97.65%, which is close to the detection accuracy of debris quantity (
Table 5), indicating the reliability of this classification method.
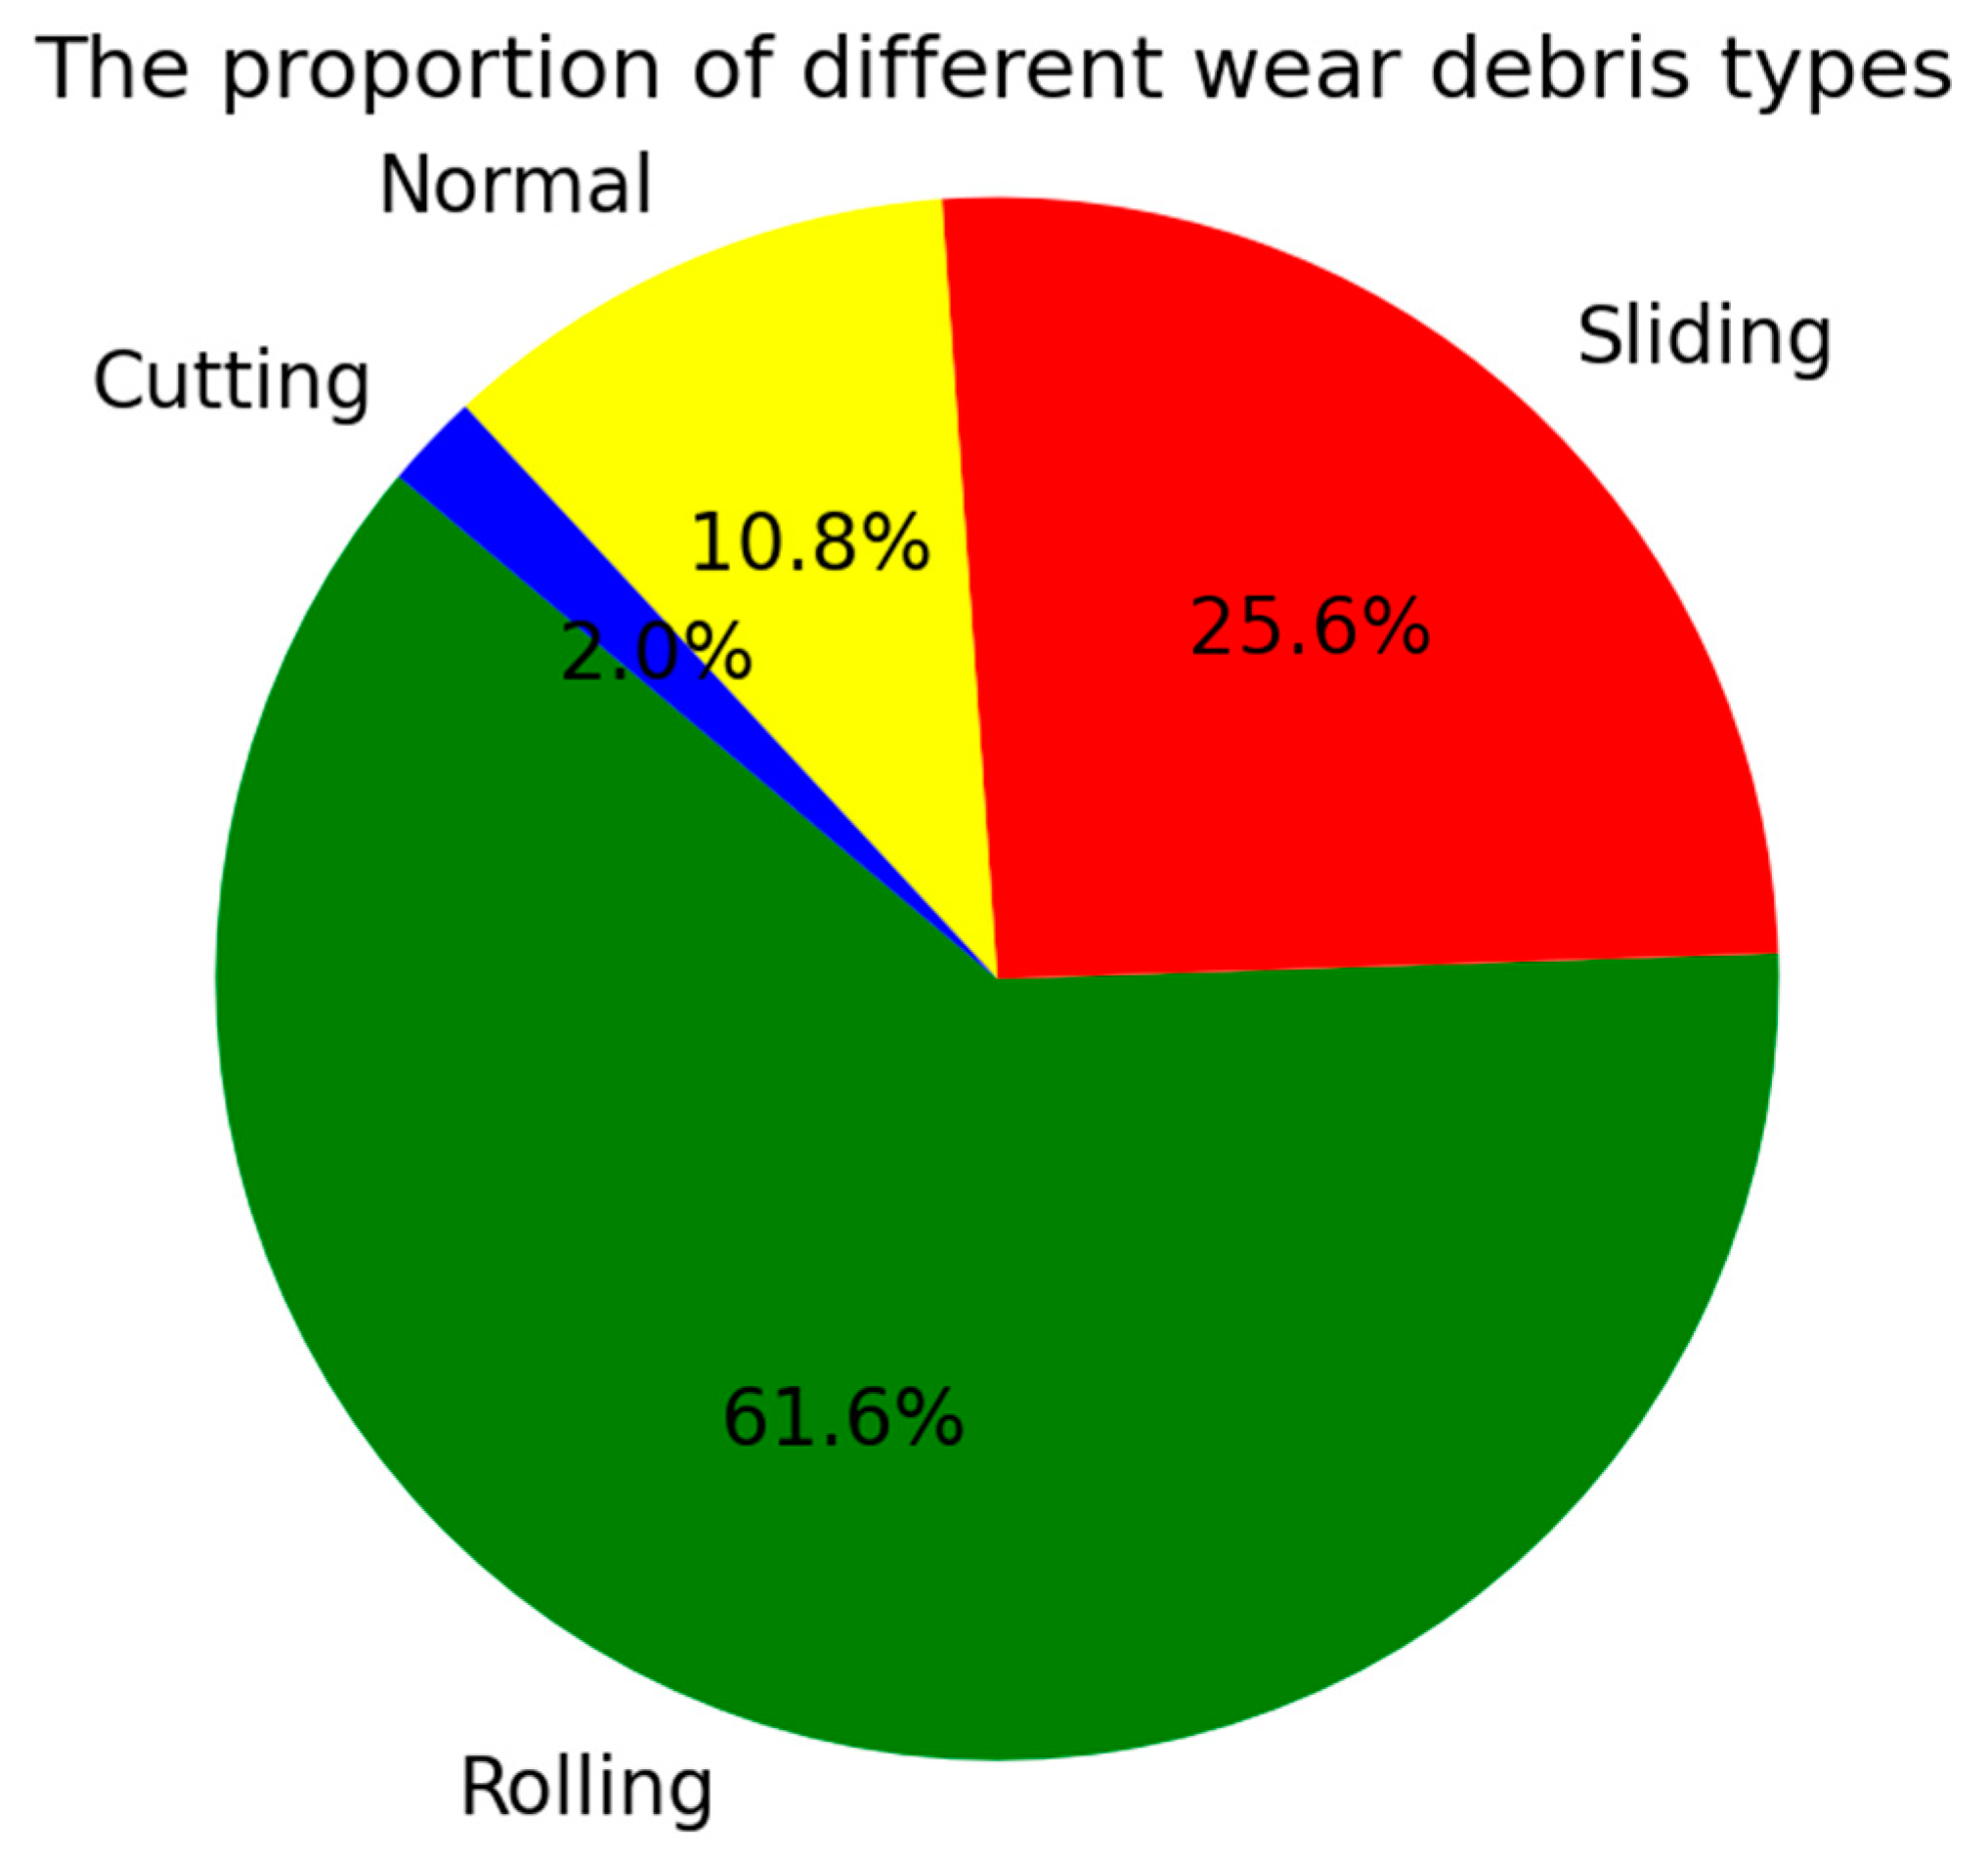
Figure 21 shows the proportion of various types of wear debris. The occurrence of different types of wear debris is closely related to specific damage mechanisms in the engine.
Rolling wear debris accounts for the largest proportion at 61.6%, possibly indicating high-load operating conditions of the engine bearings, which could result from prolonged operation or inadequate maintenance. Sliding wear debris represents 25.6%, a relatively high percentage, likely related to sliding friction under specific engine operating conditions. Cutting wear debris constitutes the smallest proportion at only 2.0%. The low presence of cutting wear debris suggests good manufacturing quality and operational status of the engine, though further analysis is needed to rule out potential material or design flaws.
Interestingly, under normal conditions, wear debris caused by normal wear should be the most abundant. However, in this study, they account for only 10.8%. This discrepancy is likely because the dataset originates from MCD reports, where the engines had already experienced significant wear, leading to a substantial increase in abnormal debris.
In conclusion, the proposed wear debris image detection method combined with neural network-based segmentation and threshold-based classification demonstrates excellent performances in accurately identifying the types and sizes of wear debris. Additionally, the proportions and size ranges of different wear debris provide valuable support for future experiments.
