Article

The Impact of Surface Roughness on the Friction and Wear Performance of GCr15 Bearing Steel

1
National United Engineering Laboratory for Advanced Bearing Tribology, Henan University of Science and Technology, Luoyang 471000, China
2
Collaborative Innovation Center of Nonferrous Metals, Henan University of Science and Technology, Luoyang 471023, China
*
Author to whom correspondence should be addressed.
Lubricants 2025, 13(4), 187; https://doi.org/10.3390/lubricants13040187
Submission received: 18 March 2025 / Revised: 2 April 2025 / Accepted: 17 April 2025 / Published: 18 April 2025

Abstract

:
Surface roughness plays a crucial role in determining surface quality, influencing factors such as vibration, noise, assembly precision, lubrication, and wear resistance in bearings. This research examines how surface roughness (Sa) affects the friction and wear characteristics of GCr15 steel under conditions with adequate oil lubrication while varying the applied load. The findings indicate that with an increase in Sa, the friction coefficient of GCr15 steel also increases. As the load rises from 15 N to 35 N, the friction coefficient remains relatively constant. However, higher loads lead to more severe wear of the microprotrusions on the surface of GCr15 steel. The wear area first decreases and then increases as Sa increases. The minimum wear area occurs when Sa is 0.5 μm. Additionally, a back propagation neural network (BPNN) model has been developed to predict the wear performance of GCr15 steel. Validation experiments show that the average prediction error for the BPNN model is 10.64%.

1. Introduction

Bearings are essential components in modern industrial applications. Their key benefits, such as low friction, corrosion resistance, and extended service life, make them indispensable across a wide range of industries, including machinery, agriculture, aerospace, and others [1,2,3,4,5]. The quality of a bearing’s surface is mainly determined by the methods used for surface machining and treatment. During machining, the microstructure and mechanical characteristics of the material undergo changes, which can have a significant impact on the bearing’s operational life, fatigue resistance, wear properties, and vibration behavior [6,7,8,9,10]. Surface quality generally refers to both the macroscopic and microscopic characteristics of the surface, including factors such as roughness, waviness, and residual stresses.
Surface roughness plays a critical role in the performance of bearings, directly influencing factors such as the friction coefficient and wear rate. A reduction in surface roughness can lower frictional resistance, minimize energy consumption and noise, and enhance the efficiency of mechanical systems [11,12,13,14,15]. Additionally, surface roughness significantly affects lubrication. When roughness exceeds a certain threshold, the lubricating film may fail to adequately cover the contact surfaces, leading to a decline in lubrication effectiveness and an increase in wear. Conversely, higher surface roughness may assist in trapping wear debris and lubricating oil, potentially reducing wear [16,17]. Moreover, surface roughness induces uneven stress distribution on the contact surfaces, causing localized stress concentrations that can lead to fatigue cracks and accelerate crack propagation, eventually contributing to fatigue spalling. Optimizing the surface morphology can improve lubrication and reduce wear. Therefore, choosing the appropriate surface roughness parameters, tailored to the operational environment and requirements, is key to enhancing the wear resistance and longevity of bearings.
Surface roughness plays a critical role in the wear and failure mechanisms of bearings. According to Xia et al. [18], the formation of fatigue cracks is influenced by surface morphology, lubrication conditions, stress distribution, and the evolution of the microstructure. Materials with smoother surfaces tend to exhibit longer fatigue lives due to their higher resistance to surface plastic deformation, even under favorable lubrication conditions. On the other hand, surfaces with higher roughness may form nanocrystalline layers with microcracks, which serve as additional sites for crack initiation, thereby accelerating crack propagation and reducing the rolling contact fatigue life. Shi et al. [19] introduced a numerical model to assess the dynamic performance, lubrication conditions, frictional heating, and surface stresses of aerospace ball bearings with varying surface roughness. Their findings indicated that high loads and low speeds increased the solid contact area, frictional temperature, and localized stress concentrations, which in turn led to poor lubrication. These factors can result in bearing wear and failures, including severe wear, scuffing, and micropitting. Feng et al. [20] explored the influence of contact wear, elastic deformation, and surface roughness on turbine ball bearings. Their research showed that excessive loads led to the rupture of the oil film between the rolling elements and the inner race, creating peak stress on asperity surfaces. When this stress exceeded the material’s yield strength, material failure occurred, resulting in an increased actual contact area. Commonly, the surface topography of the materials is characterized by using the surface roughness parameters, such as Sa (Arithmetic Mean Height), Ra (Arithmetic Mean Roughness), Sq (Root Mean Square Height), and Ssk (Skewness). However, Sa provides a more comprehensive evaluation of surface topography compared to the one-dimensional Ra, which is important for understanding contact mechanics and wear behavior. Meanwhile, Sa is less sensitive to outliers and measurement errors, ensuring more reliable surface roughness measurements. Additionally, Sa better captures the interaction between surfaces under contact, which is crucial for predicting performance in bearing applications. So, we use Sa to characterize the surface roughness of the GCr15 steel in our paper.
Tribological properties can be viewed as a complex nonlinear system that can be effectively studied using numerical simulation techniques. This makes it essential to apply such methods to explore the tribological behaviors of bearing materials. In recent years, neural network-based prediction models have gained significant attention due to their ability to overcome prediction limitations and reduce the time required for model development, positioning them as an effective tool for future tribological performance prediction studies. Singh et al. [21] examined the wear characteristics of WC-10Co4Cr and Stellite 6 coatings on SS 316L steel via HVOF thermal spraying. They investigated various factors, including stirring speed, time, suspension concentration, and impact angle. A variety of machine learning models, such as Ensemble Boosted Trees, Coarse Decision Tree, Ensemble Bagged Trees, Linear Regression, and Artificial Neural Networks (ANN), were developed. Among these, the ANN model proved to be the most efficient, providing accurate predictions and optimizing coating wear resistance. Sheikh et al. [22] explored the abrasive wear properties of TiC-reinforced ZA37 alloys using machine learning algorithms. Their findings indicated that the TiC particles significantly improved the material’s hardness and wear resistance, while altering its wear mechanisms. The decision tree model showed the highest accuracy in predicting wear rate, with a prediction accuracy of 91%. Chen et al. [23] utilized a back propagation neural network to predict the friction coefficient of bearing surfaces in bolted connections. They discovered a strong relationship between microtopography variations and friction behavior, noting that the friction coefficient decreased and then increased as a result of microstructural changes. Their model effectively predicted friction coefficients under different surface conditions and tightening torques.
Currently, GCr15 steel is a widely used high-carbon chromium bearing steel, which possesses high hardness, high wear resistance, and good fatigue strength, and is a widely used material for bearings. Despite the extensive use of GCr15 steel in bearing applications, there is a notable gap in the literature regarding the prediction of its wear resistance under varying surface roughness conditions. Current research often focuses on either experimental methods or computational models in isolation, but limited research exists on predicting the wear resistance of bearing steels under varying surface roughness using experimental and neural network approaches. Thus, this study systematically examines the impact of surface roughness on the friction and wear characteristics of GCr15 steel under different applied loads. Additionally, the wear mechanisms of GCr15 steel under various surface roughness levels are thoroughly analyzed. A back propagation neural network (BPNN) prediction model is developed to determine the wear behavior of GCr15 steel across different roughness and load scenarios. The findings offer valuable insights and theoretical support for bearing design, failure analysis, and fault diagnosis.

2. Experimental Methods

The experiments were conducted using annealed GCr15 steel with a diameter of 50 mm. Its chemical composition is listed in Table 1. Initially, the material was cut into discs measuring Φ50 mm × 7 mm using an electrical discharge wire cutting machine. The discs were then subjected to high-temperature quenching at 865 °C for 30 min, followed by low-temperature tempering at 160 °C for 3 h.
The heat-treated GCr15 steel specimens were sliced into circular discs with dimensions of Φ19 mm × 7 mm. Various machining processes were employed to generate different levels of surface roughness (Sa = 0.01 μm, 0.1 μm, 0.5 μm, 1 μm, and 1.5 μm) on the sample surfaces, as outlined in Table 2, which represented the arithmetic mean height of the three-dimensional surface roughness within a sampled area of a surface. Subsequent to machining, all the samples underwent ultrasonic cleaning using anhydrous ethanol. Afterward, the surfaces were air-dried and wiped with cotton balls to remove any residual metal debris.
The surface roughness of the processed sample and the surface after the friction testing were determined using a 3D surface profiler from Nanofocus AG (NanoFocus, Oberhausen, Germany). To analyze the surface morphology and wear characteristics of GCr15 steel, a scanning electron microscope model JSM-IT100 (JEOL Ltd., Tokyo, Japan) was employed, operating with an electron acceleration voltage of 20.0 kV. The elemental composition of the surfaces was evaluated using EDS.
The hardness of the sample with varying surface roughness was assessed using a HV-1000 microhardness tester (Laizhou Huayin Testing Instrument Co., Ltd., Laizhou City, China). A load of 500 g was applied during testing, with a dwell time of 15 s. To calculate the average microhardness, six individual indentation measurements were taken on different areas of the sample.
To investigate the wettability of GCr15 steel samples with different surface roughness, PAO-6 base oil was utilized in the experiments. The volume of each drop applied to the surface was approximately 14 μL. The wettability were measured using the Attension Theta Lite instrument (Biolin Scientific, Helsinki, Finland). The final contact angle was determined by averaging measurements from both the left and right sides of the droplet. Prior to testing, each sample was cleaned by immersing it in anhydrous ethanol for 3 min. Three samples with identical surface roughness were selected, and each sample was tested three times to minimize experimental error and obtain a reliable average.
The friction and wear behavior of the material was assessed using a ball-on-disk test with a UMT-2 tribometer (Center for Tribology Inc., Campbell, CA, USA). The applied loads during the test were 15 N, 25 N, and 35 N and the corresponding Hertzian contact pressures were 1.5 GPa, 1.8 GPa, and 2.1 GPa, respectively. The radius of rotation was set at 4 mm with a rotational speed of 400 rpm. The total wear time was maintained at 80 min. A GCr15 steel ball, with a diameter of 6.35 mm and a hardness of 62 HRC, was employed as the counterpart in the friction pair. PAO-6 polyalphaolefin synthetic base oil was used as the lubricant. The kinematic viscosity of PAO-6 oil at 40 °C was 25.5~31.0 mm2/s and the value was 5.7~6.8 mm2/s at 100 °C. The viscosity index was at a range of 135~145. The flash point of PAO-6 oil was above 225 °C and the specific gravity was about 0.827 g/cm3. Each test was repeated three times. The friction coefficient was automatically recorded by the UMT-2 tribometer. The 3D surface morphology and 2D cross-sectional profiles of the wear tracks were measured using a Nanofocus AG 3D surface profiler (NanoFocus, Oberhausen, Germany). Due to the minimal wear loss and the existence of surface asperities, the wear area was chosen as a parameter to characterize the wear degree of the GCr15 steel. Similar to the method introduced by Shi [12], the wear size was calculated and characterized by analyzing the wear area in samples with varying surface roughness. The schematic diagram in Figure 1 illustrates the calculation method for the wear area. The wear area was determined by integrating the surface profile curve of the GCr15 steel. The peak height of the surface asperities served as the reference, and the wear region beneath this reference line (the yellow region in Figure 1) was considered the integration area, which corresponds to the wear area of the GCr15 steel. The wear area was calculated by averaging the results from six different positions within the wear track. The worn surface was examined using a SEM model JSM-IT200 (JEOL Ltd., Tokyo, Japan), and the composition was analyzed through EDS.

3. Results and Discussion

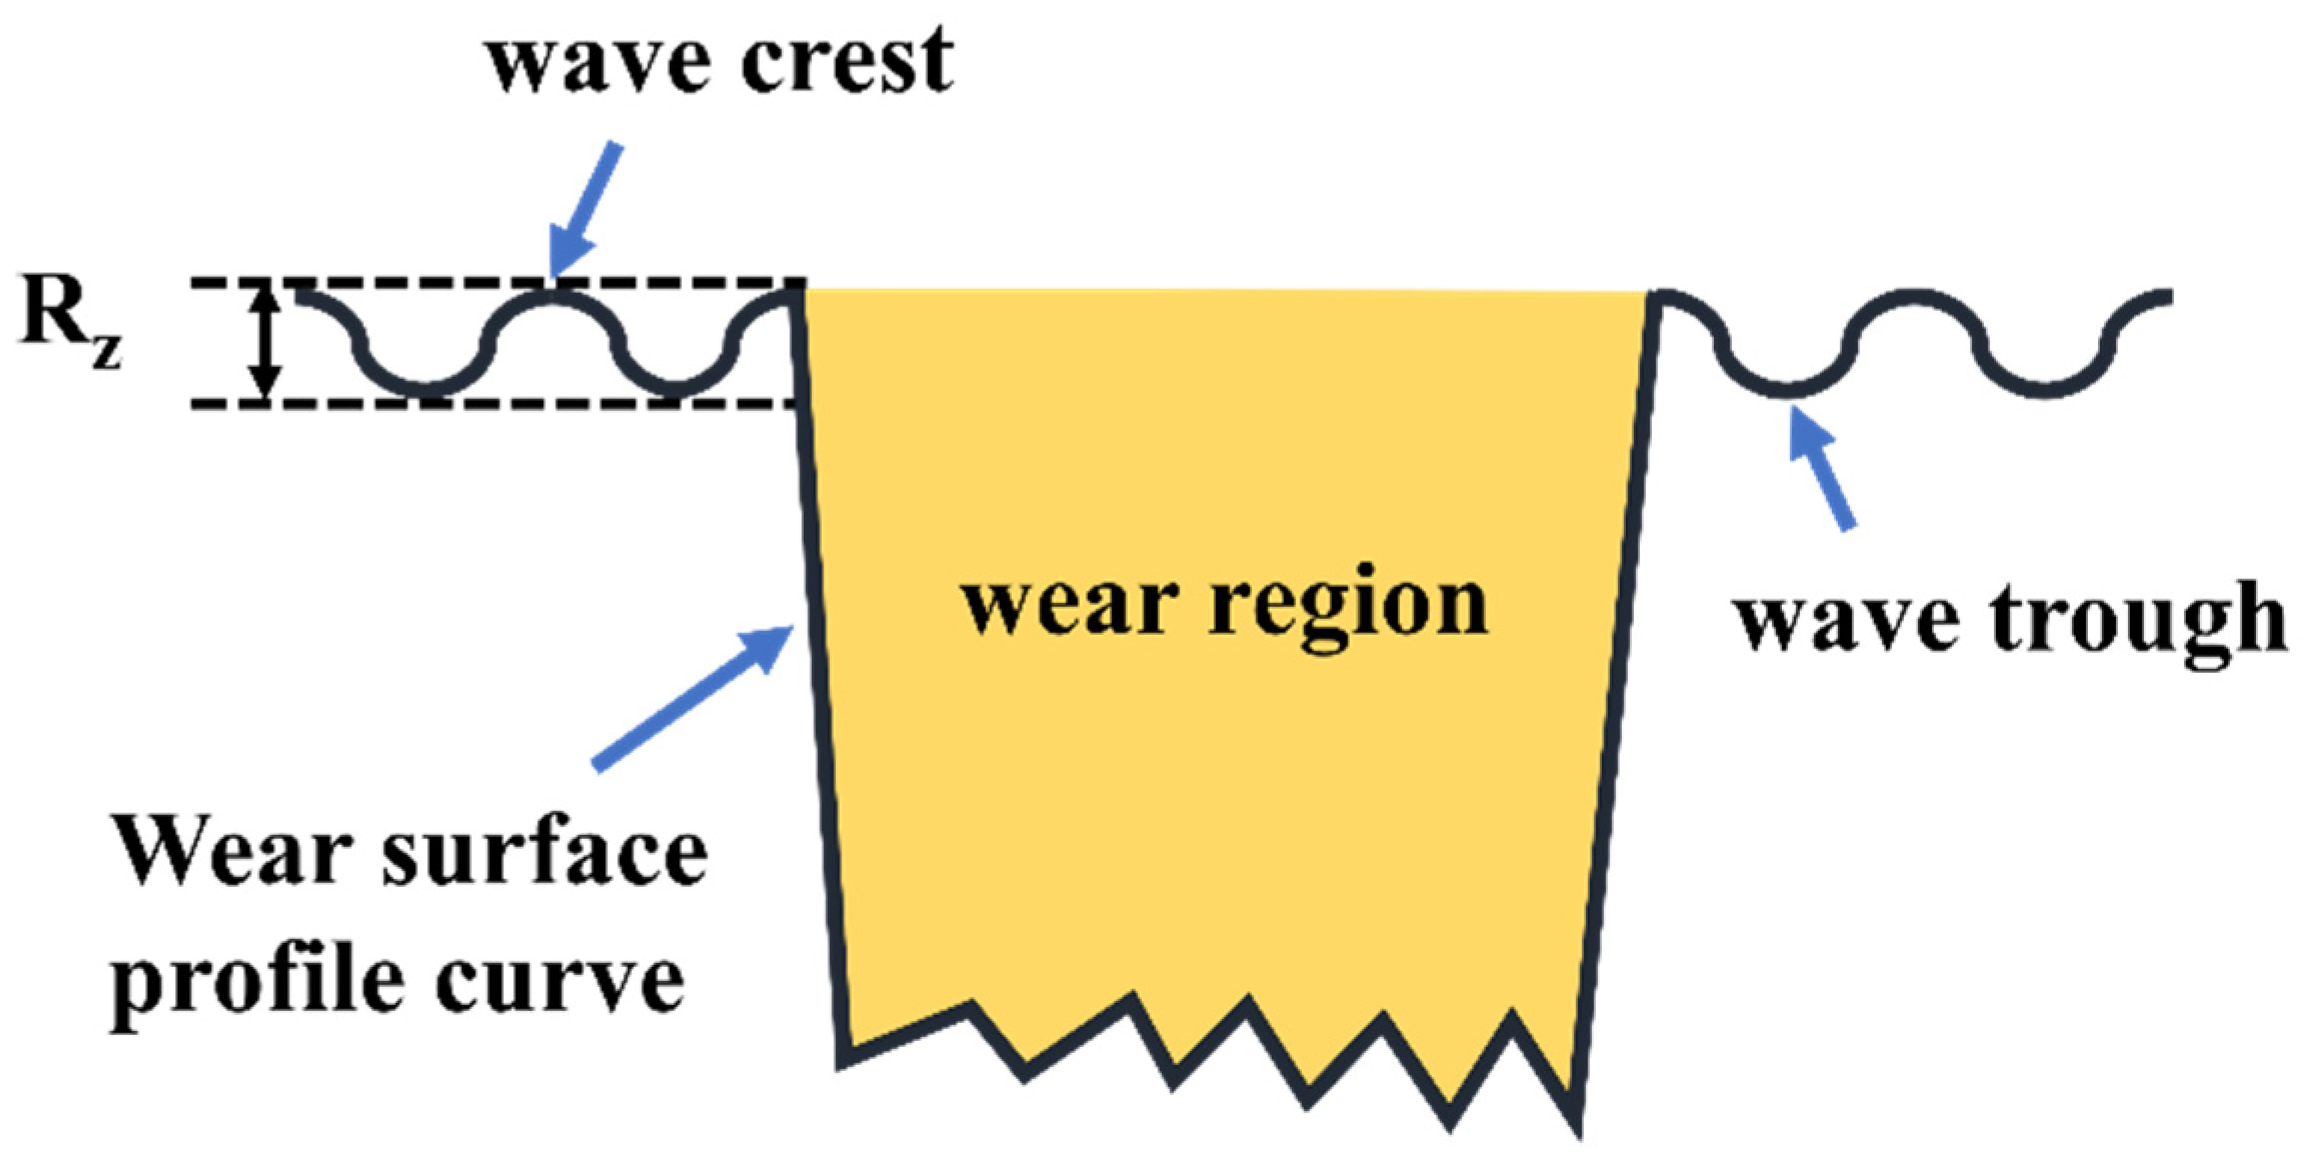
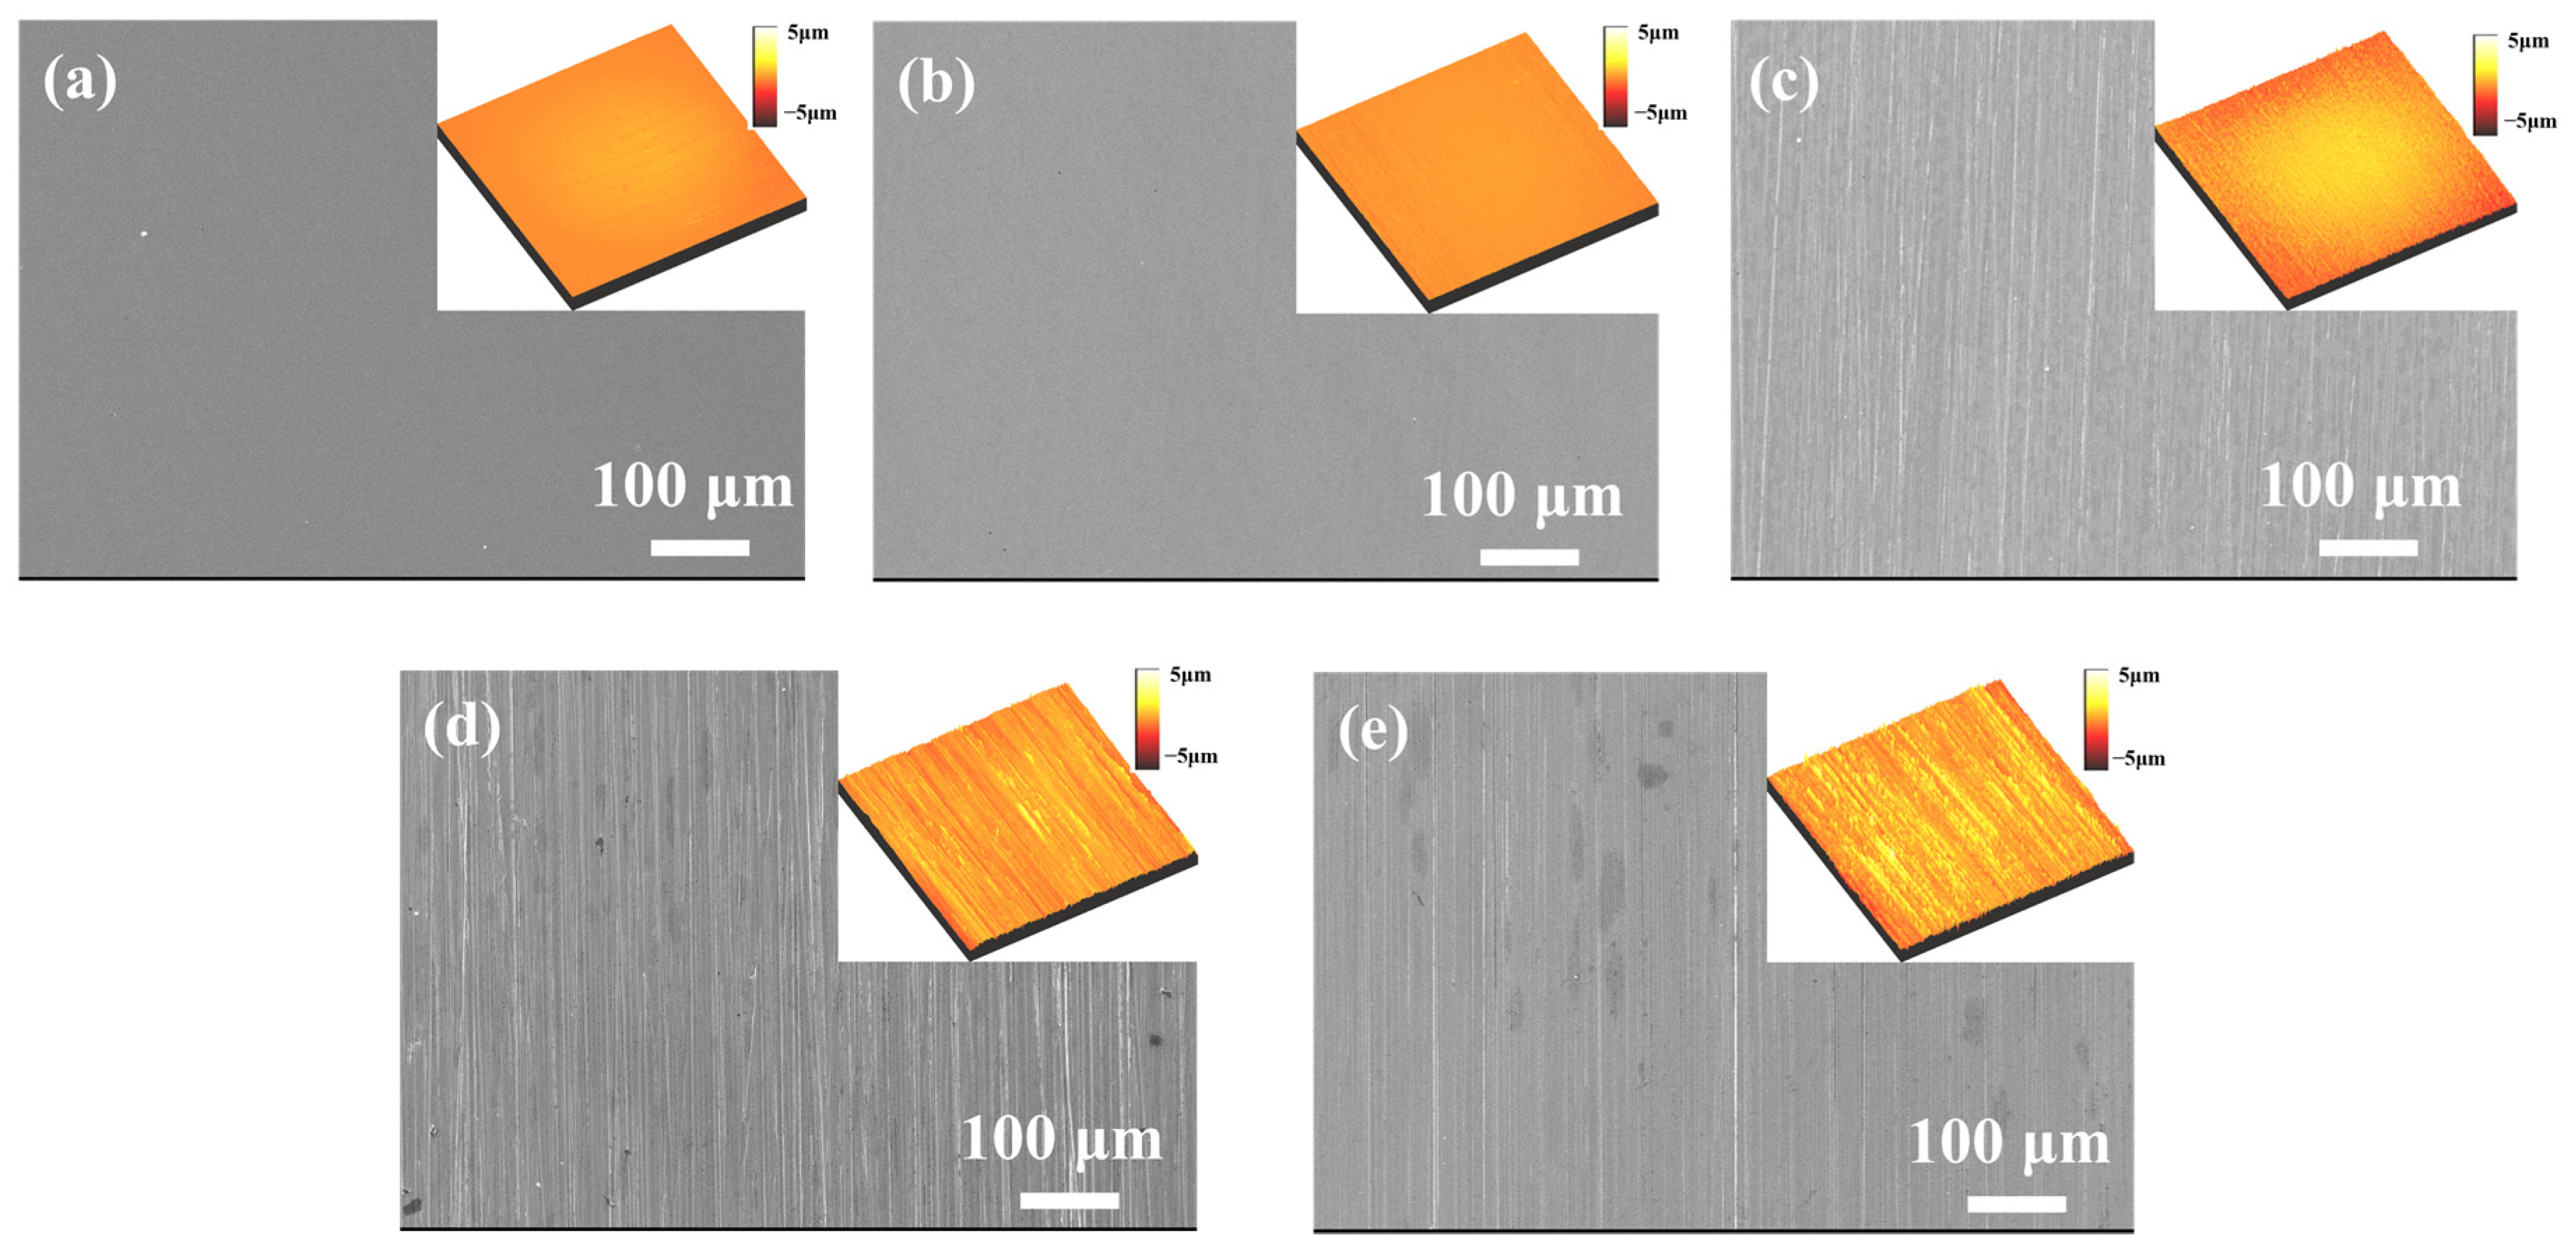
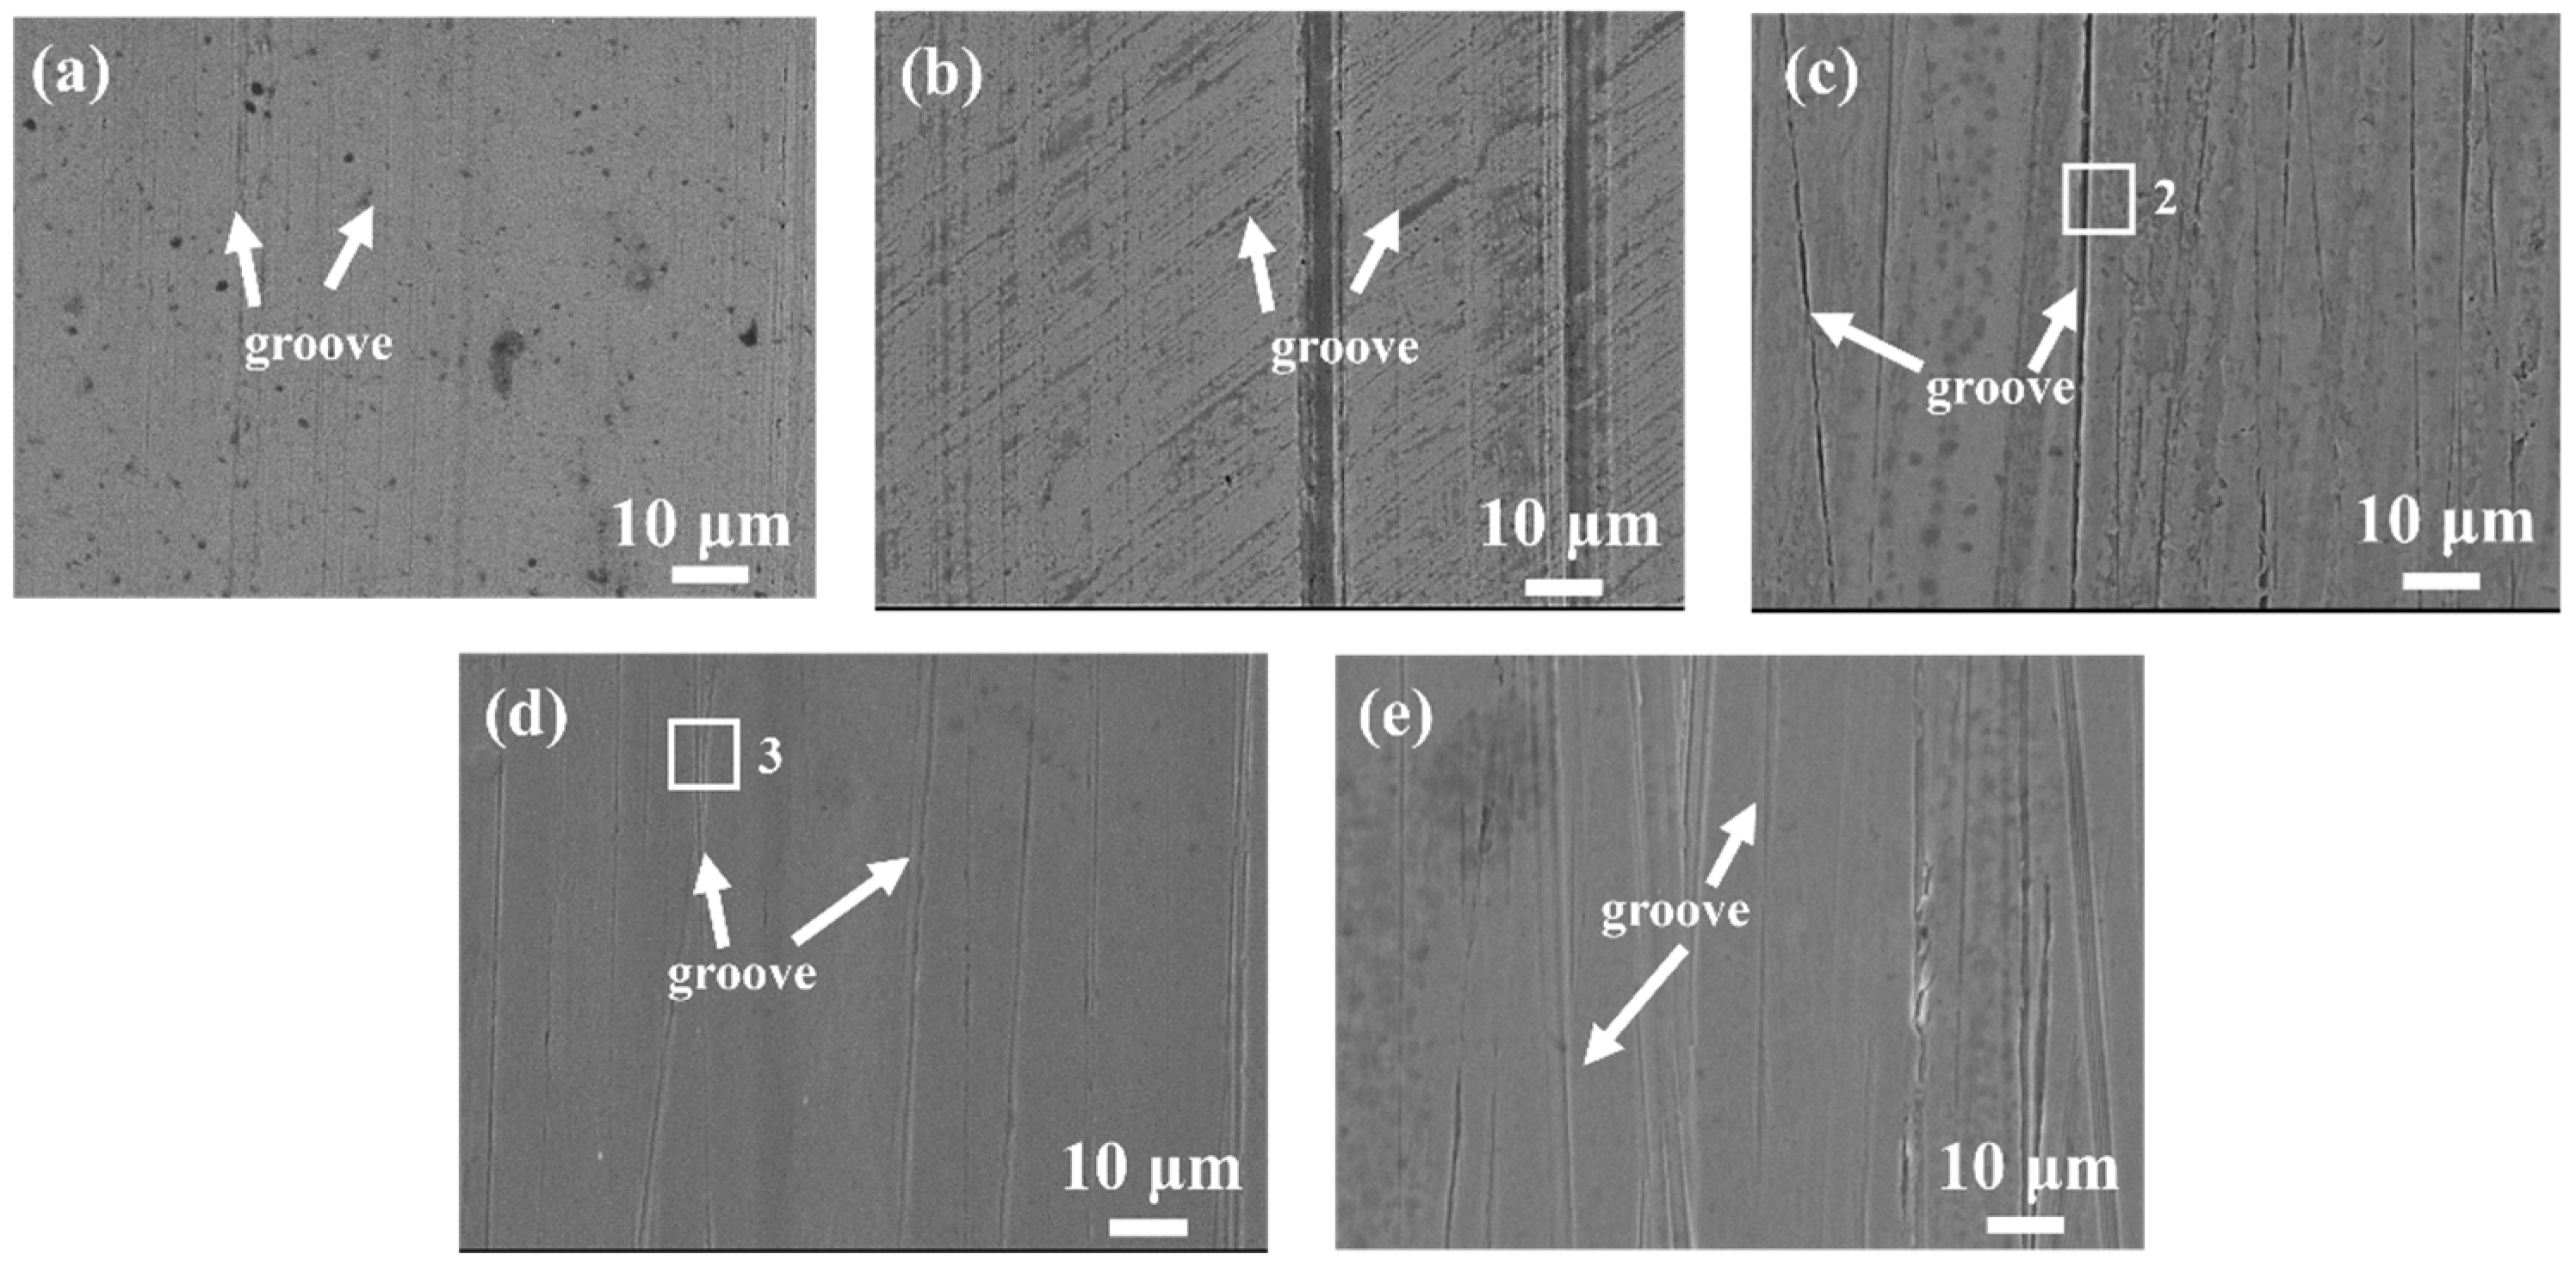
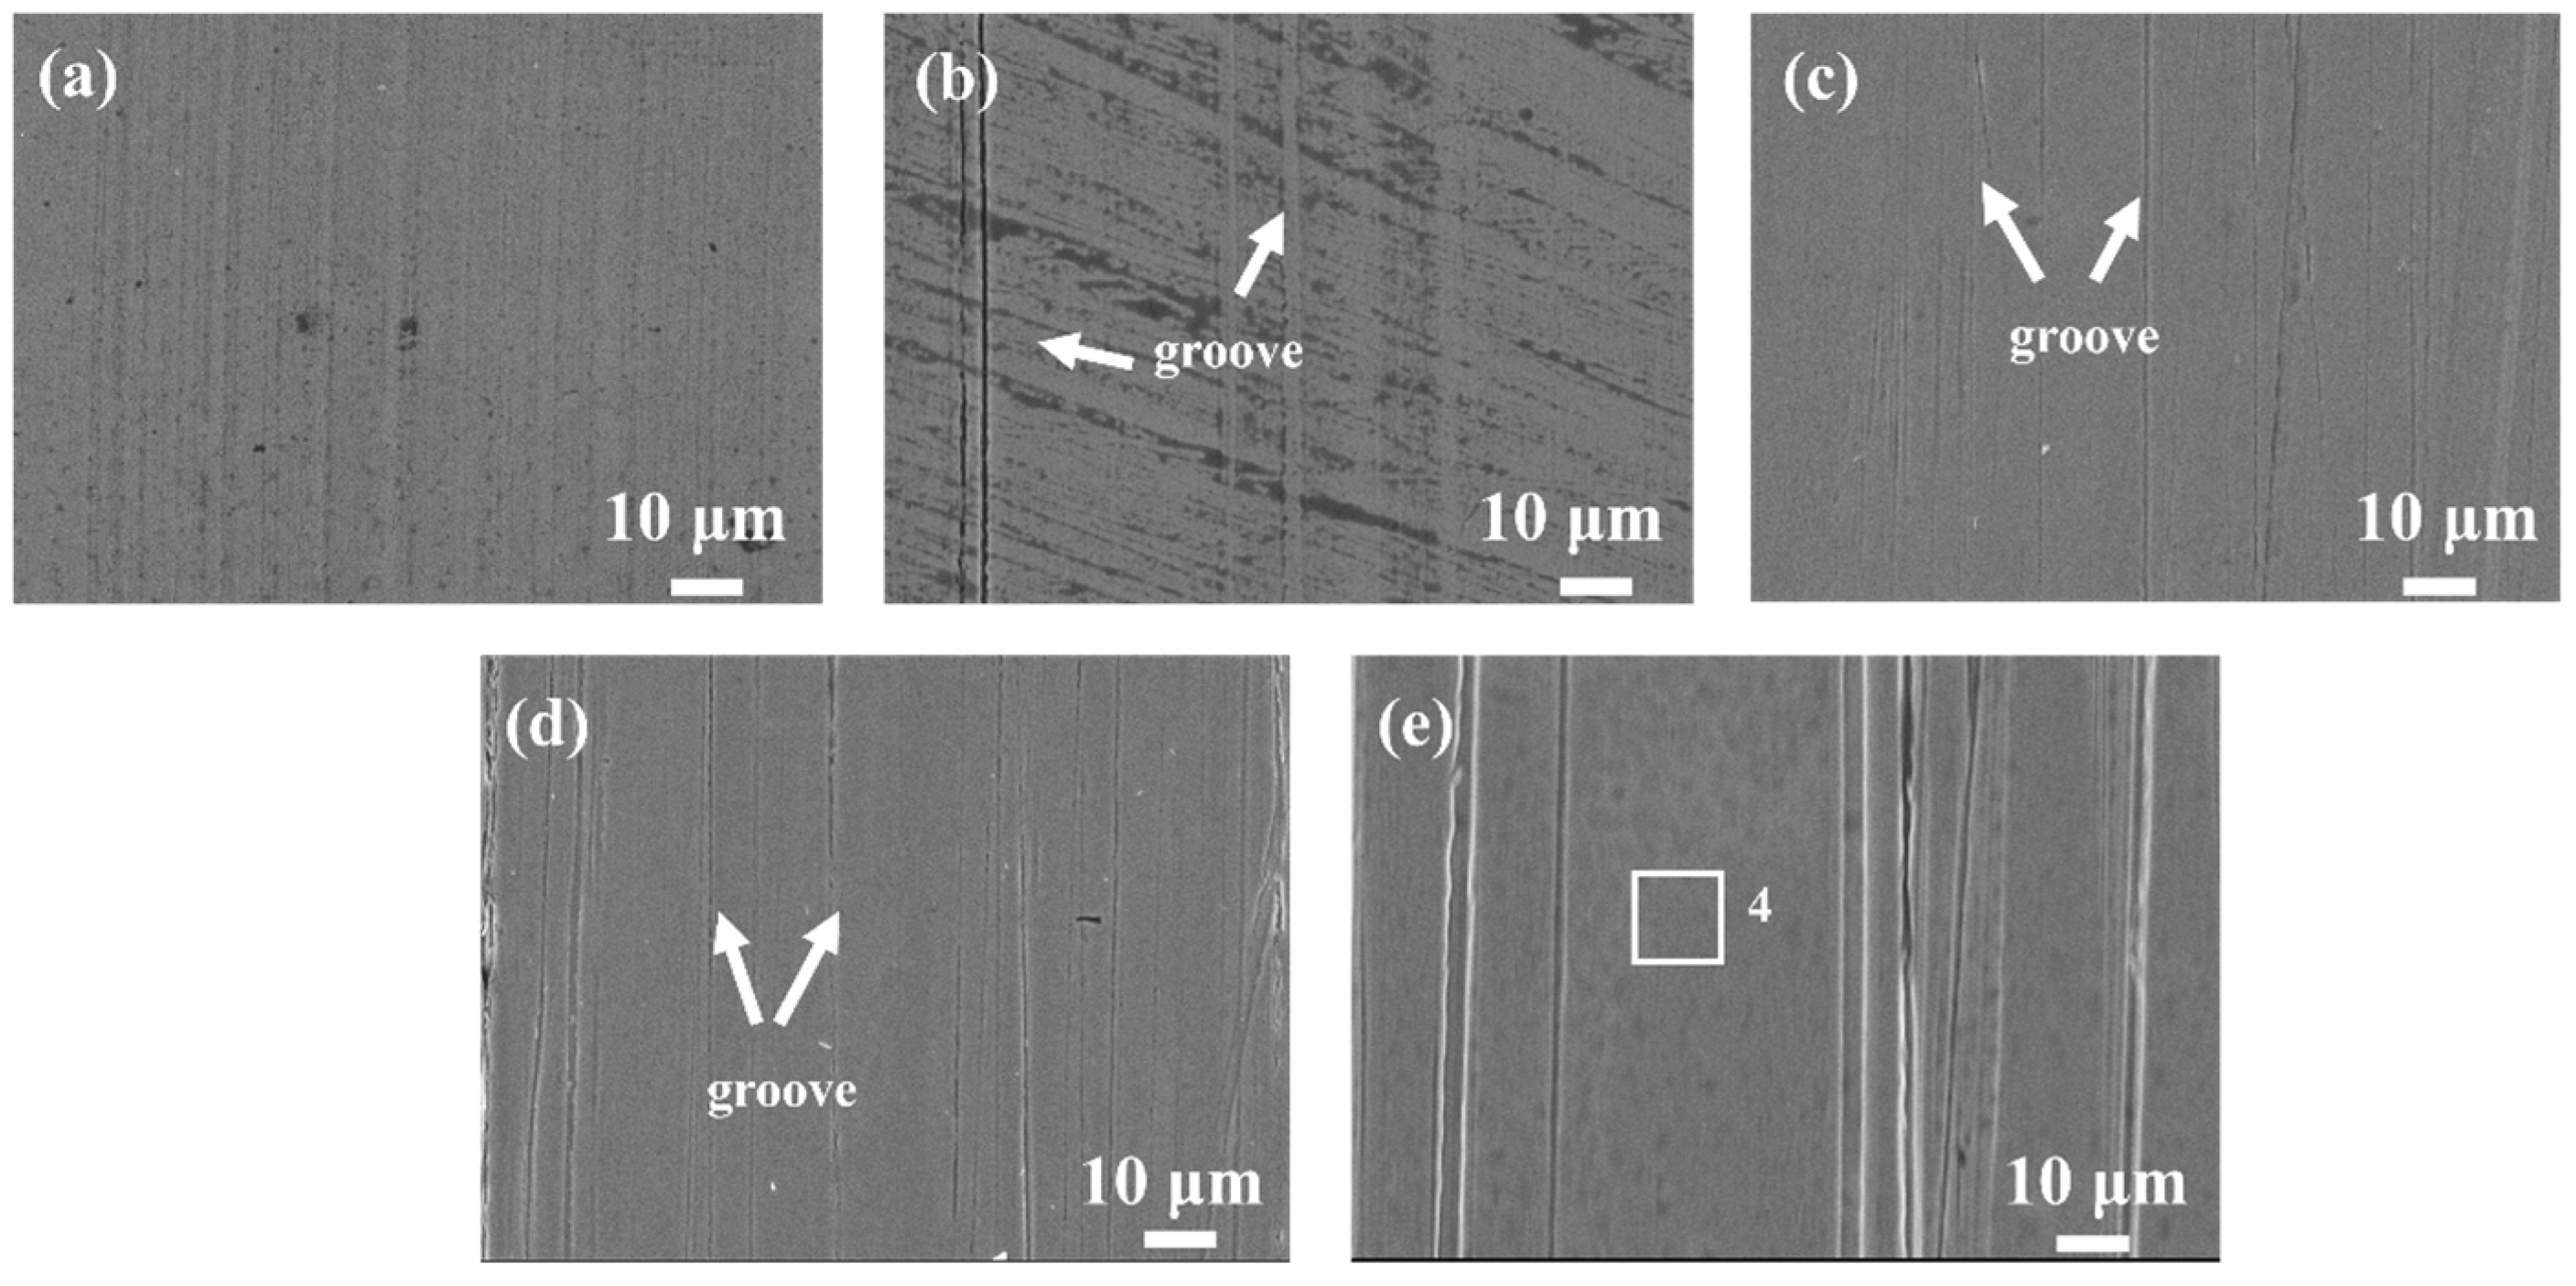
3.1. Microscopic Morphology

Figure 2 presents the surface morphology of GCr15 steel, highlighting variations in both surface elevation and asperity configuration. The roughness parameter, Sa, was determined by averaging measurements taken at five distinct positions, as detailed in Table 3. In Figure 2, surfaces exhibiting Sa values of 0.01 μm and 0.1 μm reveal no discernible scratches, resulting in notably even surfaces. When Sa increases to 0.5 μm, 1 μm, and 1.5 μm, the sample surfaces display a uniform distribution of peaks and valleys accompanied by only minimal scratch marks. Moreover, Figure 3 illustrates the surface profile curves of GCr15 steel under various Sa conditions. It is evident that a Sa of 0.01 μm yields the least variation in surface elevation, with the peak-to-valley distance reaching its maximum value (Rz, as shown in Figure 1) of 2.39 μm. As Sa rises to 0.1 μm and 0.5 μm, Rz correspondingly attains 3.62 μm and 4.91 μm. When Sa reaches 1 μm, Rz escalates to 6.51 μm, and a further increase to 1.5 μm results in the most pronounced surface height variation with an Rz of 8.25 μm. Figure 3 further confirms that with increasing Sa, the Rz grows, implying a reduction in the density of asperities per unit length.

3.2. Contact Angle

The wettability characteristics of GCr15 steel are depicted in Figure 4, with Figure 5 quantifying the average contact angle (θ) variations across specimens exhibiting distinct Sa parameters. Progressive elevation of Sa correlates with a systematic reduction in wetting angles for GCr15 steel. Experimental data demonstrate a significant θ decline from 27.75° to 13° as Sa increases within the 0.01–1.5 μm range. Surface wettability evaluation fundamentally relies on liquid-substrate contact angle analysis, where θ magnitudes are governed by a interfacial energy equilibrium between solid and liquid phases. Crucially, solid surface topography and three-phase interfacial interactions substantially modulate wetting behavior through their impact on contact line dynamics. A smoother and flatter surface results in an increased contact angle. The contact angle, which characterizes the wetting properties of the solid/liquid interface, affects the oil film thickness. Furthermore, the adhesion force required for lubricant molecules to form an adsorbed film on the friction surface is directly related to the surface wettability. A smaller contact angle signifies a higher adhesion force at the solid/liquid interface, which improves the liquid’s film-forming ability on the solid surface and leads to an increase in the minimum oil film thickness.

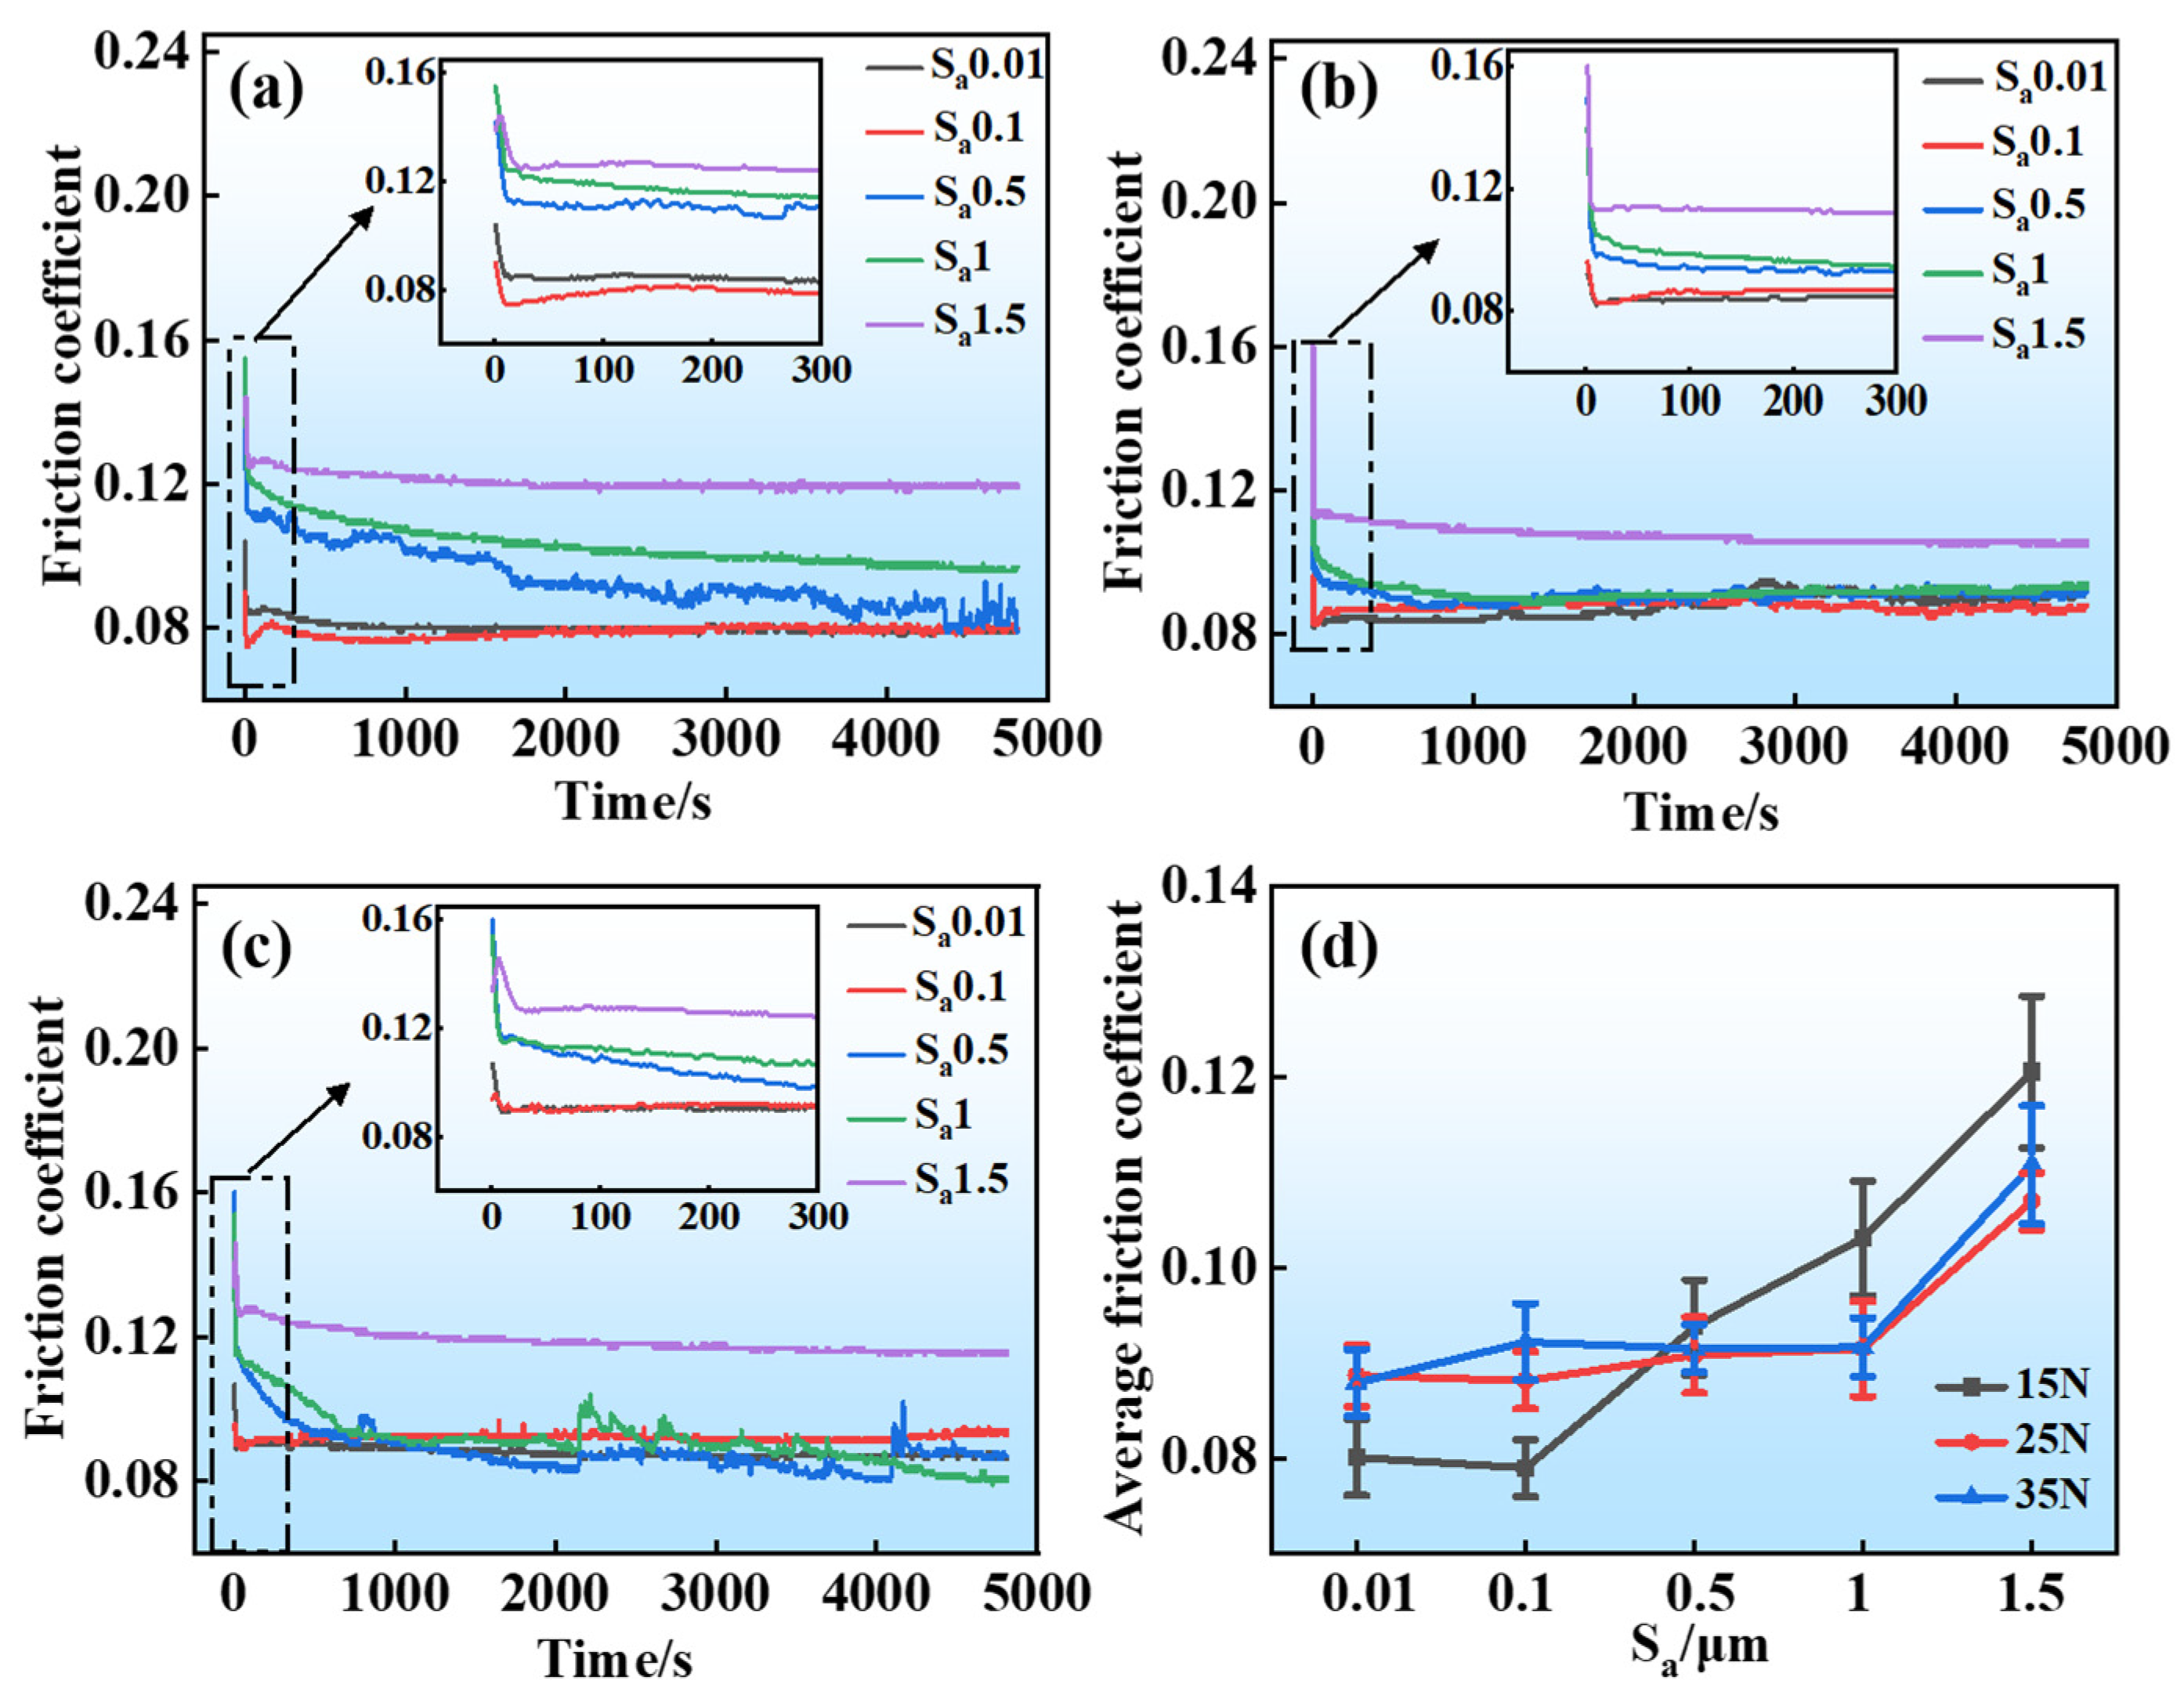
3.3. Friction and Wear Performance
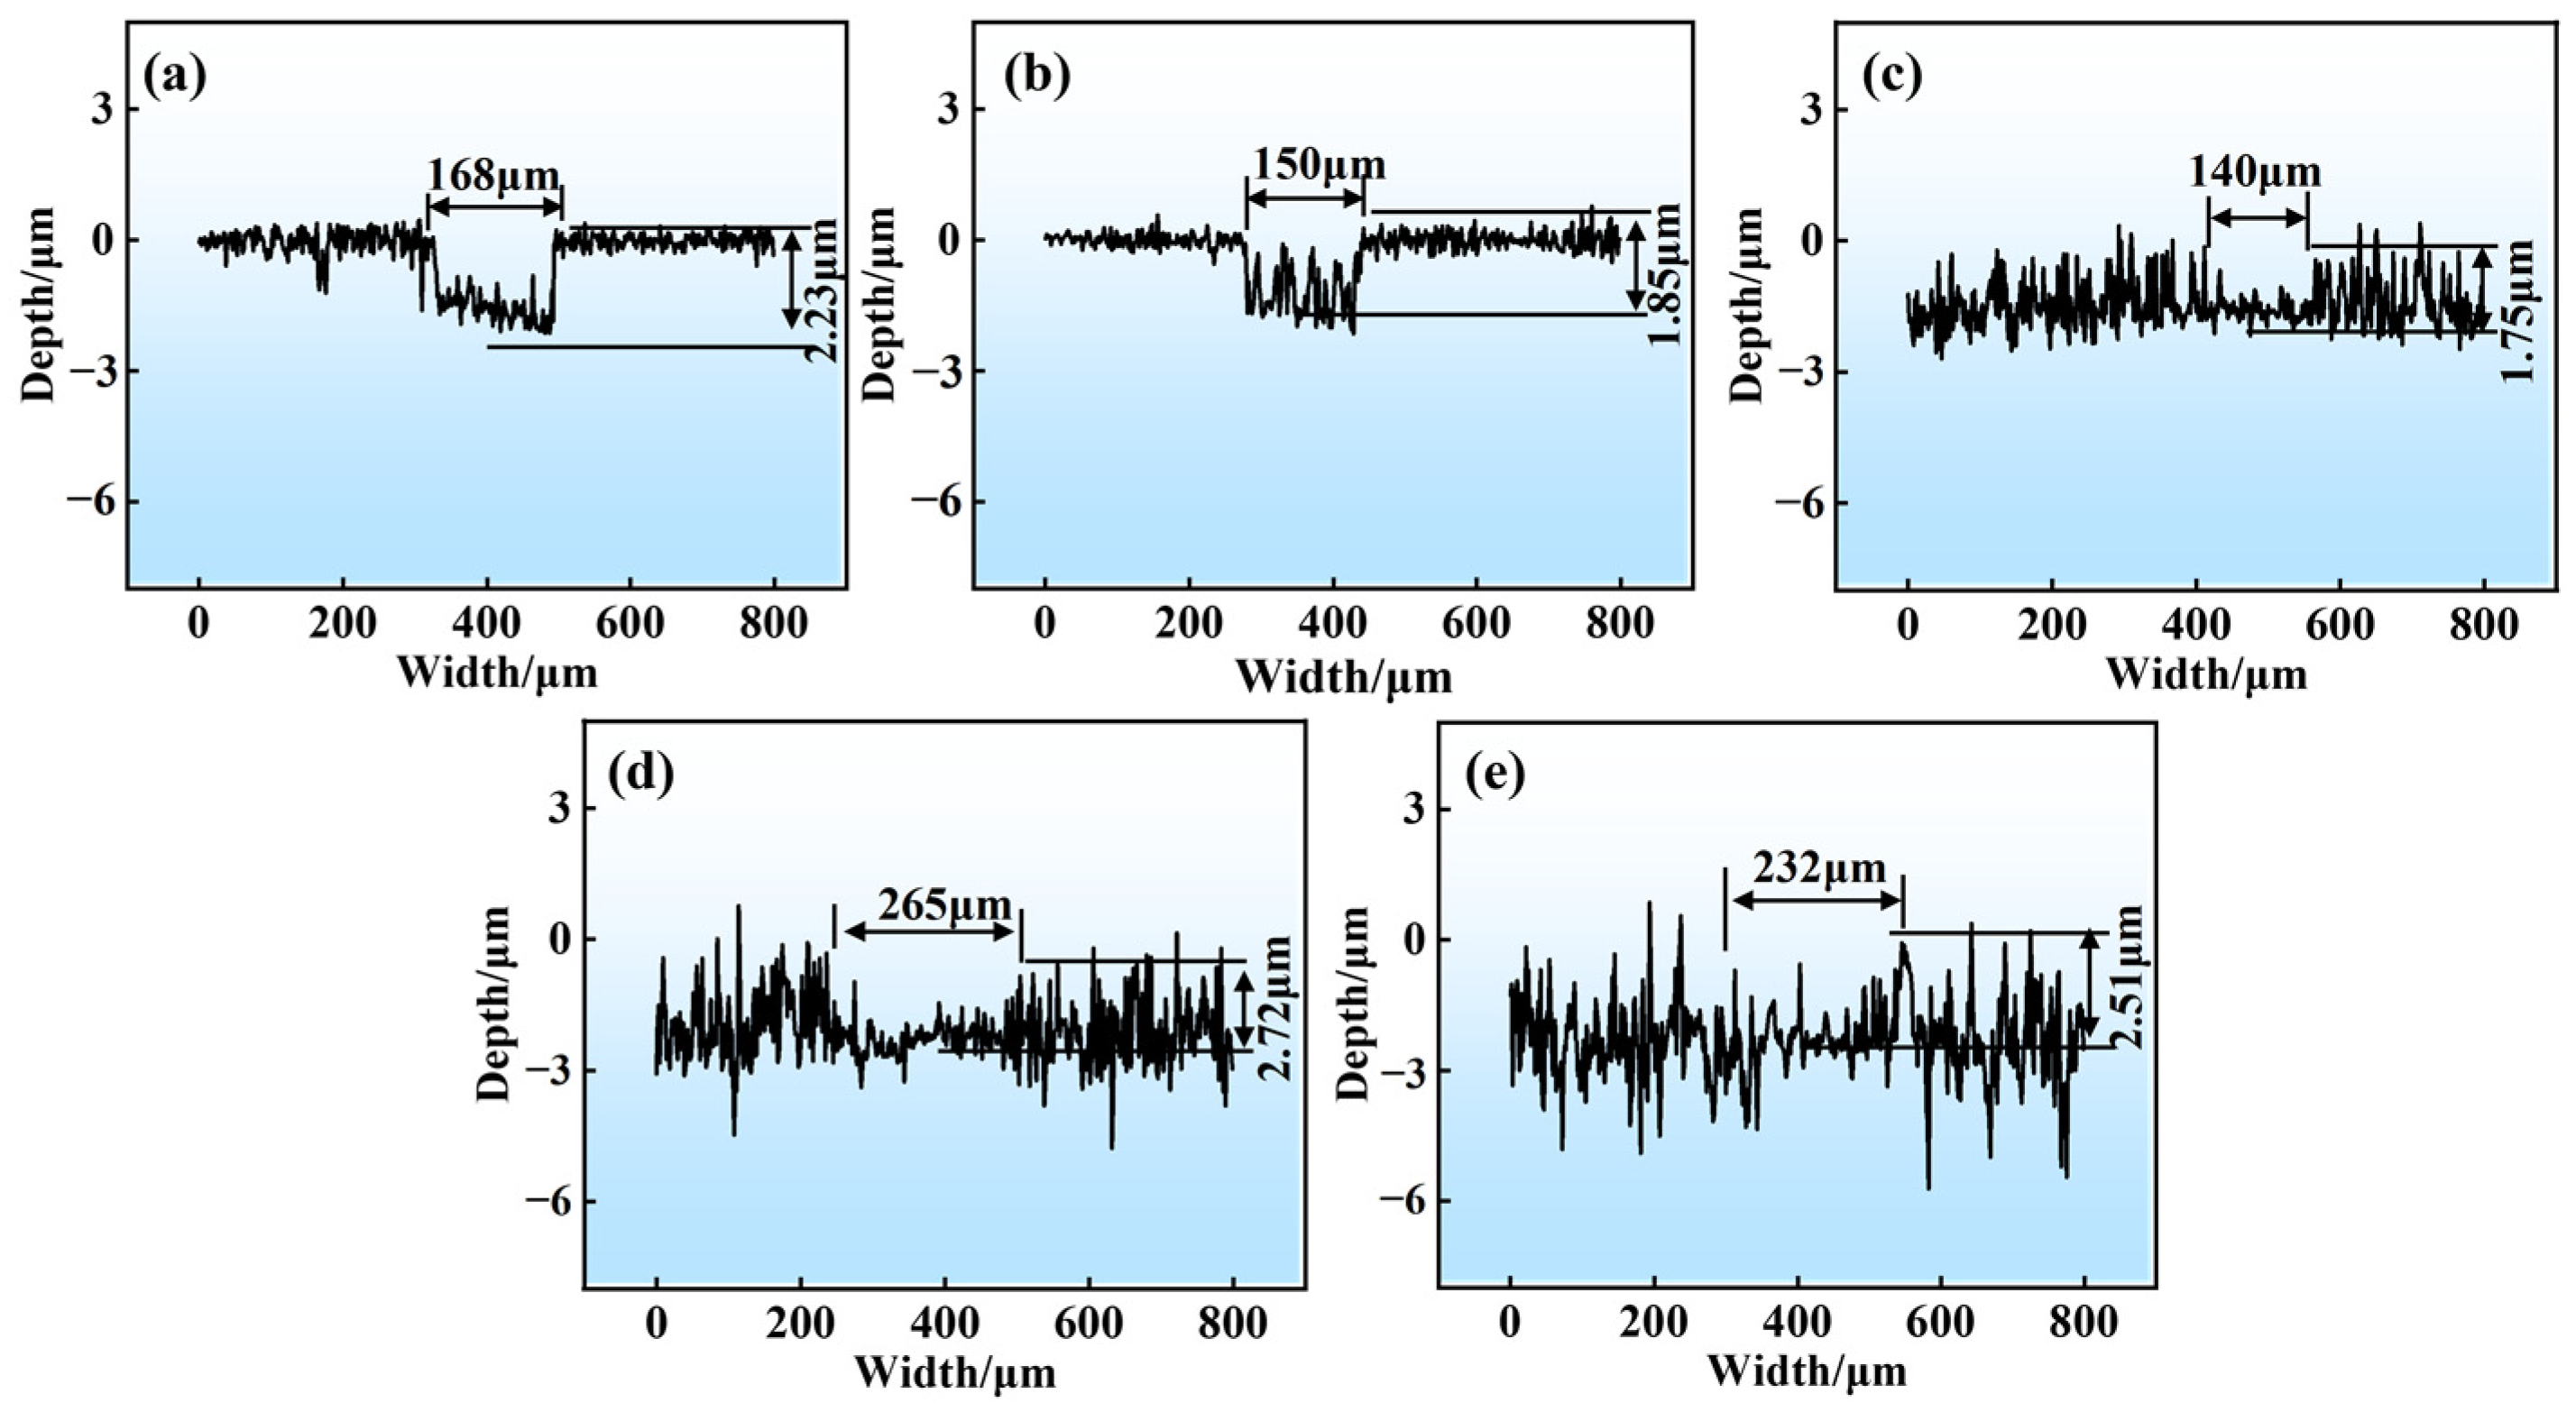
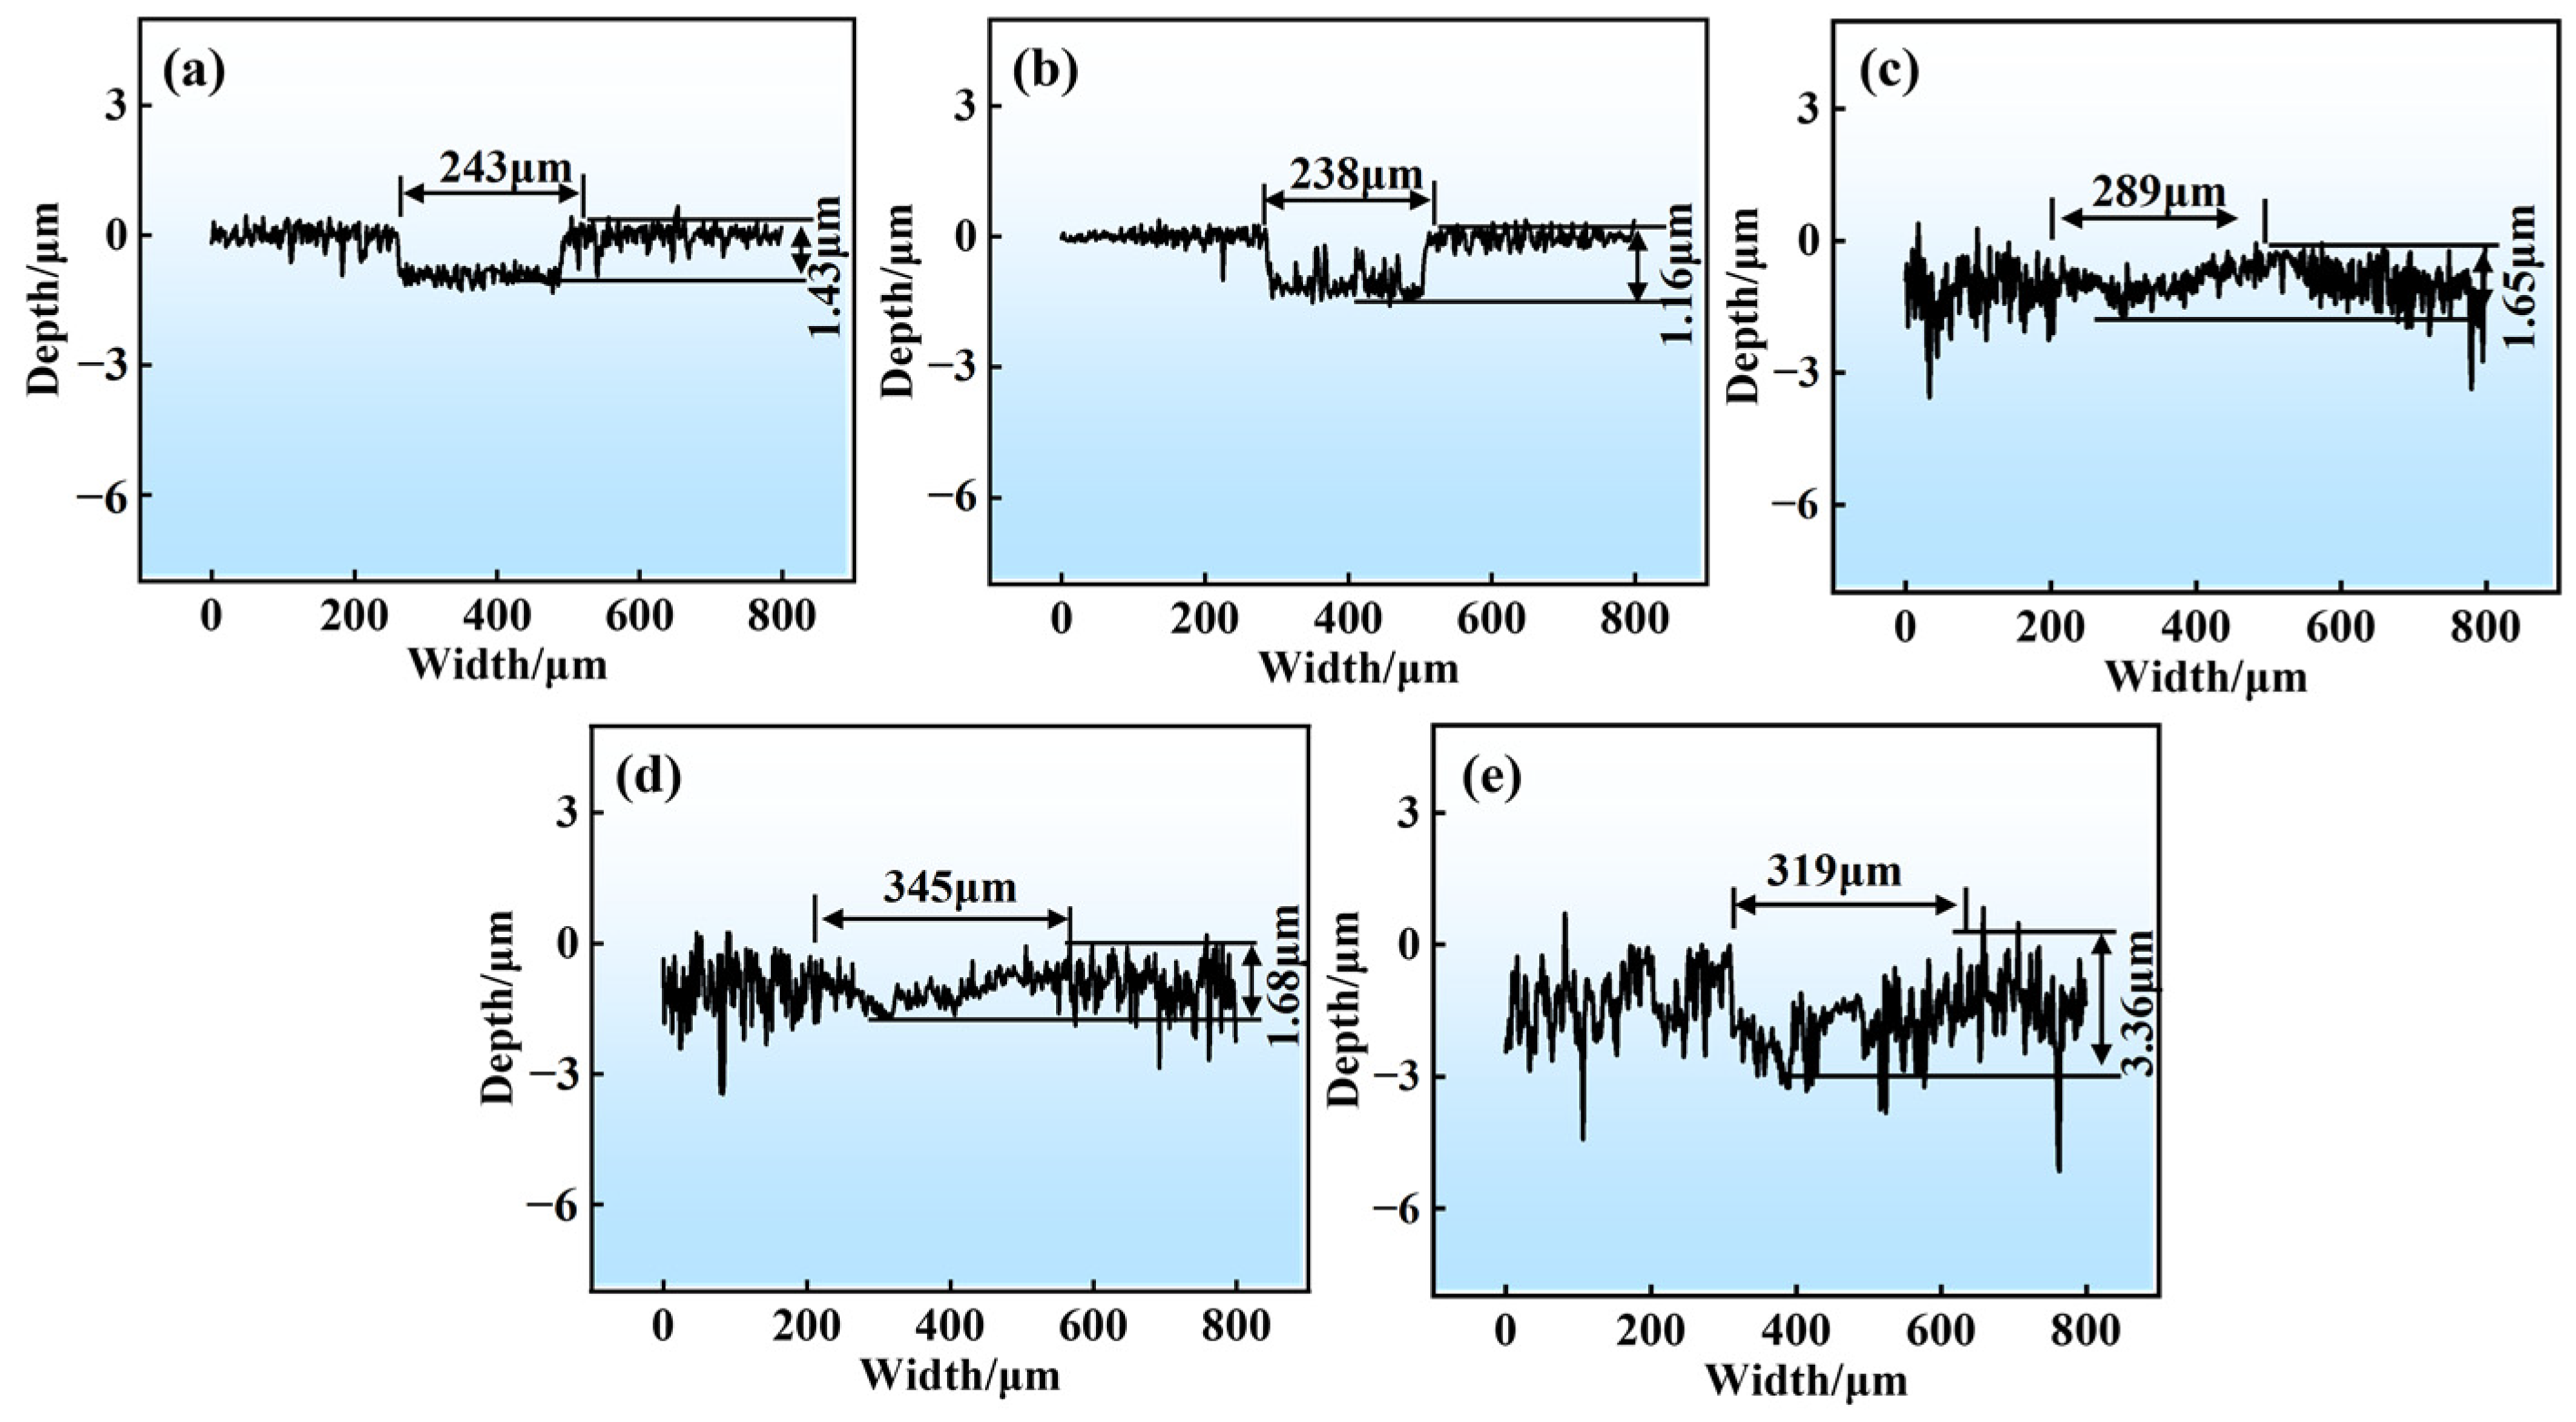
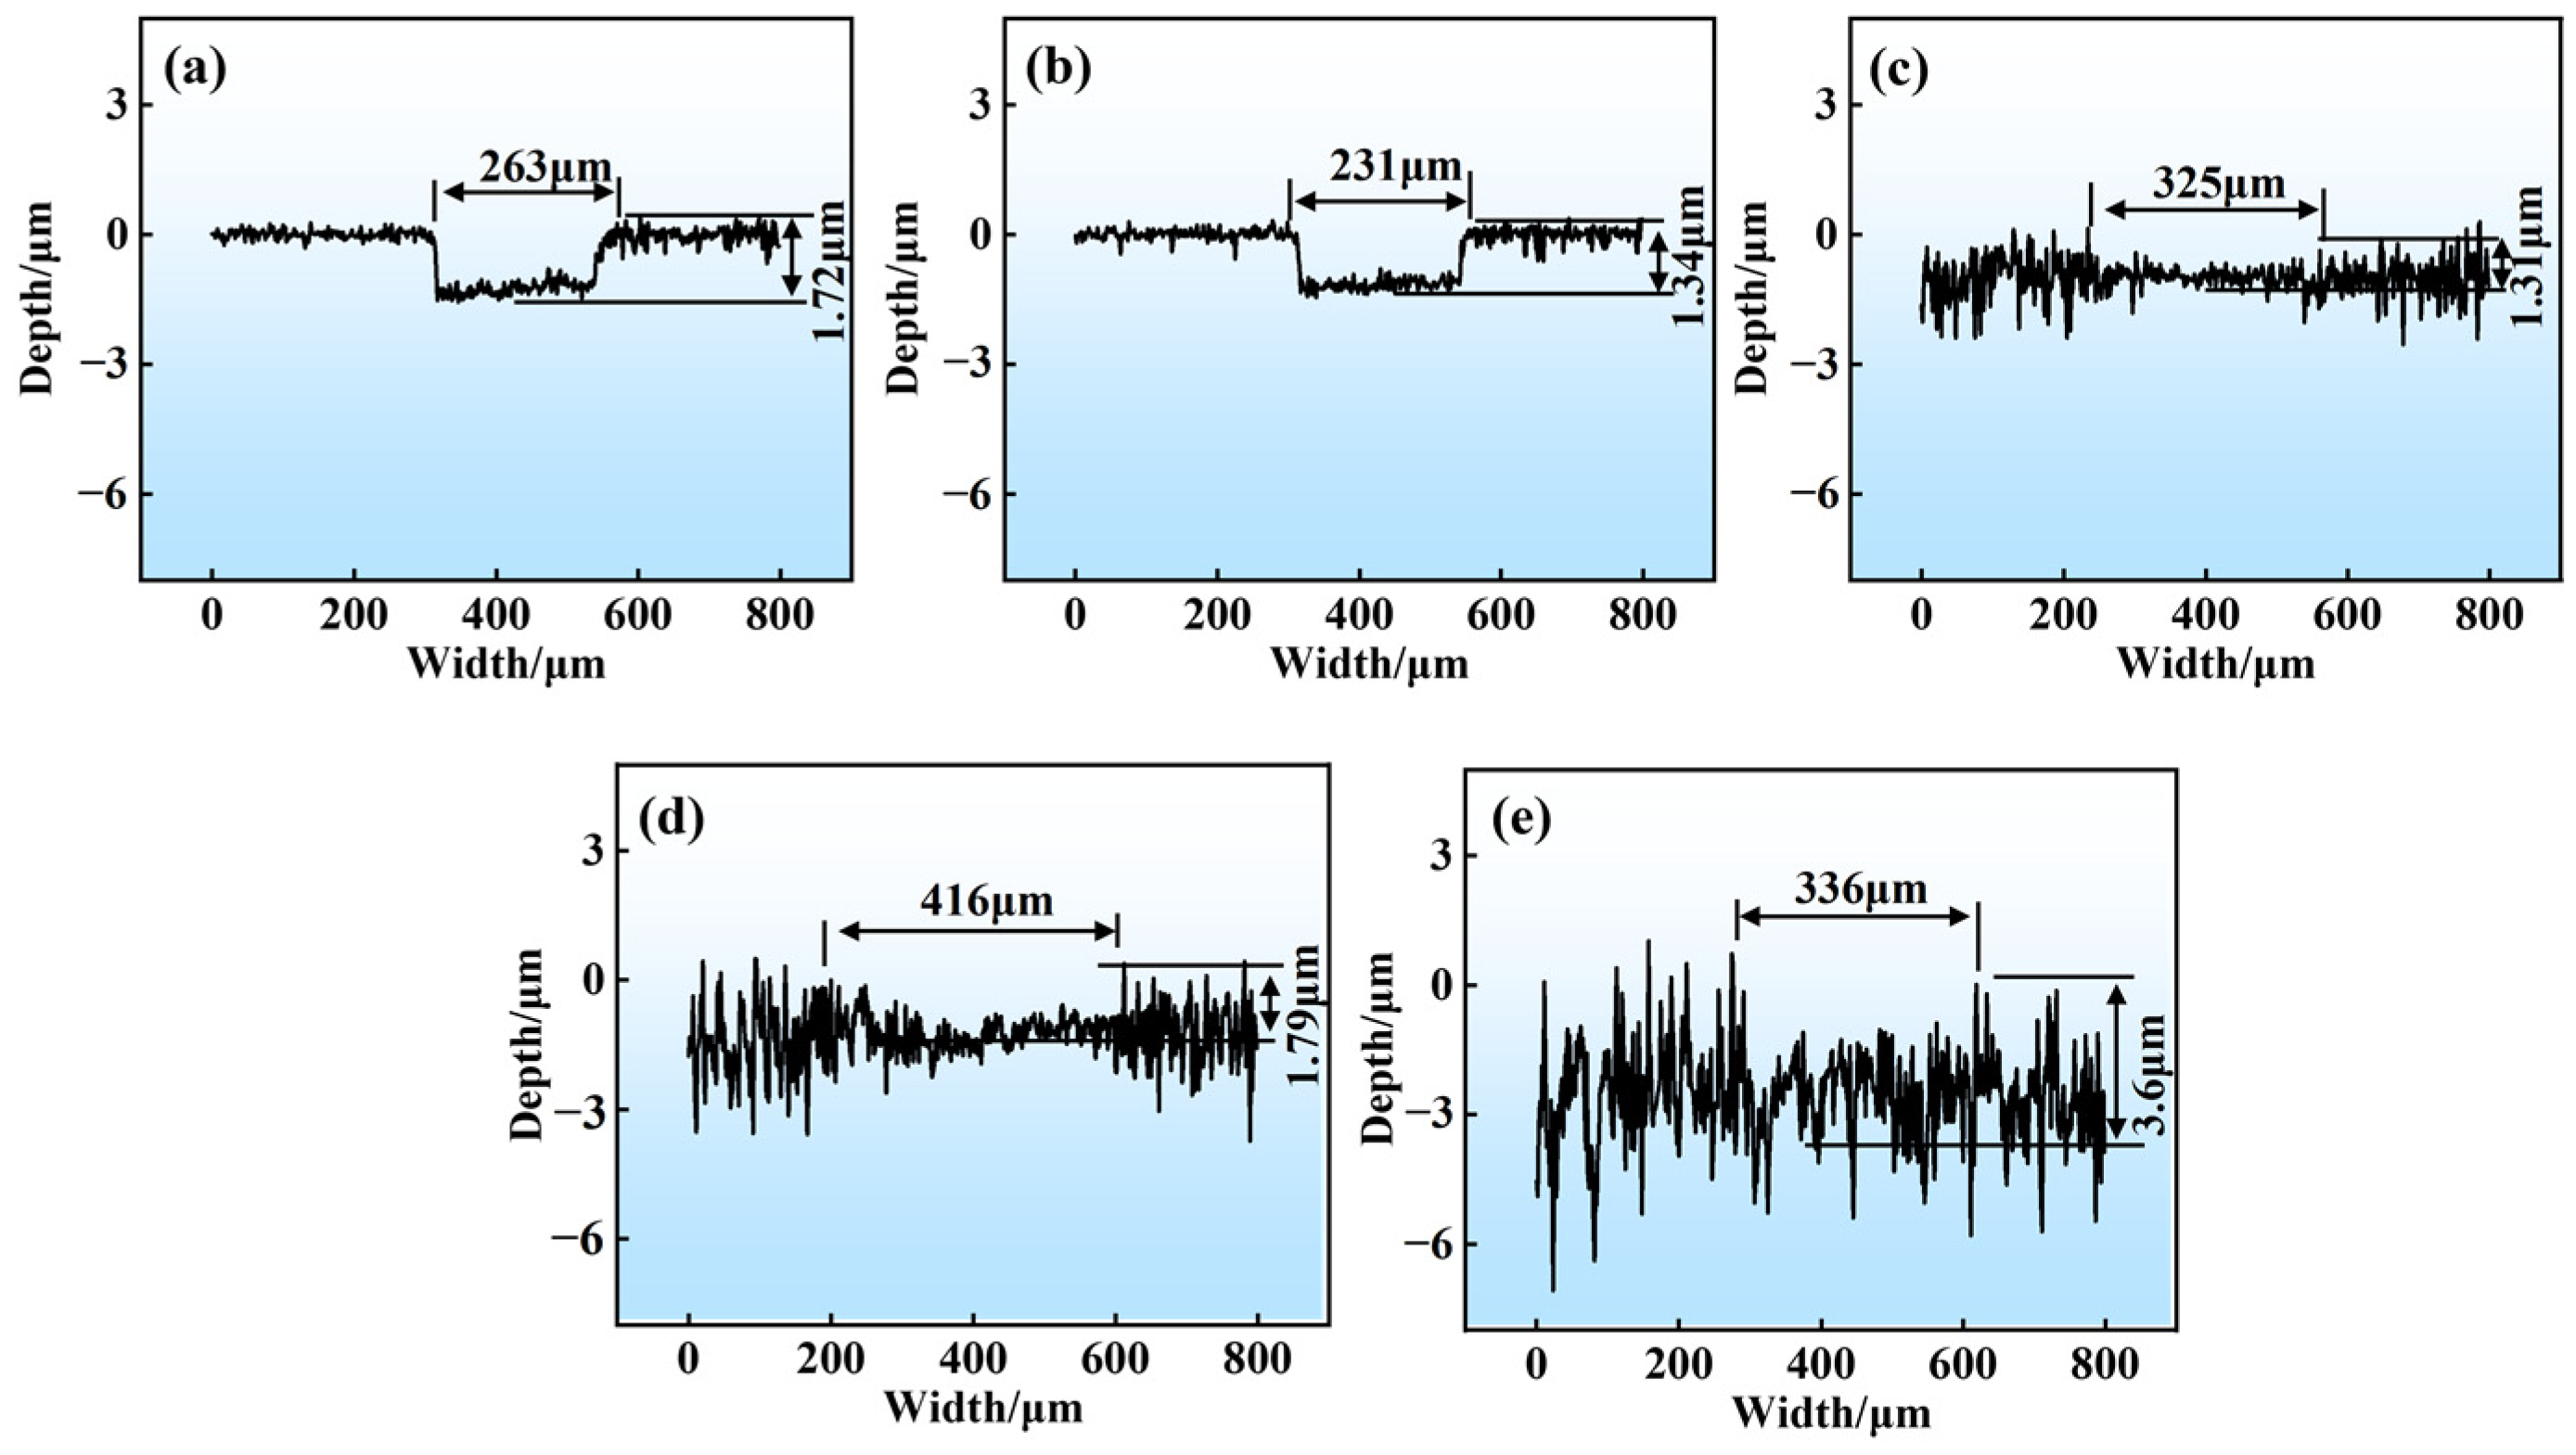
Figure 6 displays the friction coefficient curves for samples with different surface roughness under various loads. The enlarged views in Figure 6a–c indicate that during the friction and wear process, the friction coefficient initially undergoes a rapid running-in period and then gradually declines to a stable friction stage. Tribological analysis during initial wear stages reveals distinctive patterns correlating with surface roughness parameters. Specimens exhibiting reduced roughness (0.01 μm and 0.1 μm) demonstrate minimal friction coefficients, maintaining values near 0.1 throughout the running-in phase. Conversely, progressive Sa elevation to 0.5 μm, 1 μm, and 1.5 μm induces friction coefficient escalation to 0.16. Surface topography characteristics, particularly geometric features like roughness, critically govern frictional behavior during the early sliding stages (running-in period). Interfacial interactions between tribopairs involve alternating solid–solid and solid–liquid contact modes. Mechanical loading is imposed on GCr15 steel specimens via counterpart GCr15 spherical indenters. Heterogeneous surface micro-asperity distribution results in partial lubricant film formation at specific contact zones, while direct asperity interactions dominate at others. Thus, the lubrication regime is identified as mixed lubrication based on the typical value of friction coefficient of the Stribeck curve [24,25]. When the GCr15 steel ball exerts a load on the surfaces of samples with Sa values of 0.01 μm and 0.1 μm, the real contact area increases, thereby reducing the friction coefficient. In contrast, samples exhibiting higher surface roughness (Sa = 0.5 μm, 1 μm, and 1.5 μm) display a diminished real contact area, resulting in an elevated friction coefficient.
During the period of steady friction, a decline in the measured frictional parameter is observed relative to that during the initial break-in stage. The underlying reason is that once the GCr15 steel ball begins to show wear, the minute asperities on the surface are abraded, thereby enlarging the true contact region and progressively reducing the friction response. Under an applied load of 15 N, when the Sa of GCr15 steel varies from 0.01 μm to 1.5 μm, the recorded average friction values are 0.080, 0.078, 0.09, 0.103, and 0.120, respectively. These findings imply that an increase in Sa is correlated with a rise in the friction parameter, owing to a reduced real contact interface between the mating surfaces when Sa is higher. Moreover, as illustrated in Figure 6d, at higher loads of 25 N and 35 N, specimens with lower Sa values (0.01 μm, 0.1 μm, 0.5 μm, and 1 μm) exhibit nearly identical friction measurements of approximately 0.09. This behavior can be attributed to the fact that under elevated loads, material wear is intensified, effectively diminishing the influence of the original surface topography. Consequently, the differences in real contact area among the friction pairs become minimal, resulting in similar friction values. In contrast, specimens with a Sa of 1.5 μm, which are characterized by a larger Rz, continue to be influenced by their surface roughness under the same load, resulting in a smaller effective contact area and an increased friction parameter.
In addition, Figure 6d demonstrates that the specimen exhibiting a Sa value of 0.5 μm shows minimal sensitivity to load variations. This is mainly because an increase in the preexisting surface texture of GCr15 steel correlates with a decreased contact angle and the development of a thicker lubricant layer, which enhances lubrication performance and lowers the frictional response. However, if the preexisting surface texture is excessively pronounced, the resulting high-pressure conditions may precipitate the rupture of the lubricant layer, thus reducing its effectiveness. Considering the interplay of these variables, a Sa value of 0.5 μm for GCr15 steel appears to foster the formation of a more stable lubricant layer on the surface.
Figure 7, Figure 8 and Figure 9 illustrate the profile curves of GCr15 steel subjected to various loading conditions. Under a 15 N load, the sample with a Sa of 0.5 μm exhibits extensive removal of its micro-asperities, resulting in the narrowest wear scar of about 140 μm. When the Sa is increased to 1 μm, the corresponding wear scar width expands to approximately 365 μm. At a load of 25 N, the minimal scar width is observed in the specimen with a Sa of 0.1 μm, measuring roughly 238 μm; this width increases to nearly 345 μm as the Sa is raised to 1 μm. With a further increase in load to 35 N, the sample characterized by a Sa of 0.1 μm maintains the smallest scar width, close to 231 μm, whereas the width for the specimen with a Sa of 1 μm reaches around 416 μm. These profile curves clearly reveal the influence of the initial surface texture on both the width and depth of the wear scar during friction. A finer initial surface finish leads to a more homogeneous and smoother wear track, while a rougher initial surface produces a broader scar.
Figure 10 presents the wear area of GCr15 steel under a variety of loading conditions. The area was calculated by integrating the wear tracks depicted in Figure 7, Figure 8 and Figure 9. It is evident that increasing the applied load results in a steady expansion of the wear area, reflecting a more pronounced wear process. Moreover, the influence of the initial surface finish exhibits a non-monotonic trend, whereby the wear area initially diminishes and then enlarges with further increases in roughness. Under a 15 N load, the specimen with a Sa value of 0.5 μm has the smallest wear area at 763 μm2, while that with a Sa value of 1.5 μm reaches the highest value of 1590 μm2. At a 25 N load, the minimum area, 273 μm2, is observed for the sample with a Sa of 0.1 μm, whereas the one with a Sa of 1.5 μm exhibits a wear area of 912 μm2. When the load is raised to 35 N, the specimen with a Sa of 0.5 μm shows a wear area of 362 μm2, and that with a Sa of 1.5 μm increases to 921 μm2.
The stability of lubricating films is influenced by surface roughness and applied load [26,27,28]. The wear area of the samples exhibits an initial decrease followed by an increase as the Sa value rises. The sample with a Sa of 0.5 μm shows the minimal wear area, which can be attributed to the interplay between wear and the thickness of the lubricant film on the surface. This is mainly because an appropriate surface roughness can enhance the anchoring of the lubricant molecules, thereby improving film stability. However, when surface roughness is excessively high, it can lead to localized high-pressure conditions that may cause the lubricant layer to break down. This breakdown reduces the effectiveness of the lubricating film, diminishing the lubrication performance. Furthermore, under lubrication conditions, the micro-asperities on the surface are capable of trapping wear debris and lubricating oil, helping to reduce the impact of abrasive wear. The optimal surface roughness allows for the establishment of a more stable lubricant film and reduces the wear rate. Consequently, at loads of 15 N, 25 N, and 35 N, the GCr15 steel sample with a Sa of 0.5 μm demonstrates the smallest wear area and superior wear resistance. Meanwhile, the applied load also has a notable impact on the stability of the lubricating films. At moderate loads, the lubricating films are found to be relatively stable, providing effective separation of the contact surfaces. However, at excessively high loads, the films are more prone to rupture, leading to increased friction and wear, as seen from Figure 10.

3.4. Wear Mechanism

Figure 11, Figure 12 and Figure 13 illustrate the surface damage characteristics of GCr15 steel under various loading conditions. In Figure 11, when a 15 N load is applied, specimens with Sa values of 0.01 μm and 0.1 μm display distinct furrow patterns accompanied by minor adhesion-induced pits, indicating that both abrasive and adhesive mechanisms govern the wear process. In contrast, for specimens with Sa values of 0.5 μm, 1 μm, and 1.5 μm, the micro-asperities reveal different extents of deterioration, with the specimen having a Sa of 1.5 μm suffering from notably severe surface damage. Figure 12 presents the wear patterns under a 25 N load, where specimens with Sa values of 0.01 μm and 0.1 μm exhibit pronounced furrow-like features, along with adhesion-related pits, suggesting that abrasion and adhesion remain the dominant damage processes. For the specimen with a Sa of 1 μm, the surface asperities are entirely worn away, leading to the formation of pits, while the specimen with a Sa of 0.5 μm retains some asperities that are only partially worn. Owing to a larger Rz, the micro-asperities on the specimen with a Sa of 1.5 μm erode at a slower rate, preventing complete flattening. In Figure 13, under a 35 N load, specimens with Sa values of 0.01 μm and 0.1 μm feature a multitude of broad furrows along with minor adhesive pits, with abrasion serving as the chief wear mechanism. Additionally, for specimens with Sa values of 0.5 μm, 1 μm, and 1.5 μm, most of the surface asperities have been worn off, resulting in relatively smooth surfaces.
Table 4 shows that the wear surfaces of GCr15 steel under oil lubrication display some degree of oxidative wear. The lubricating oil facilitates the dissipation of frictional heat, leading to a reduction in the temperature of the contact surfaces [29]. As the applied load increases, the severity of wear on the GCr15 steel surfaces also escalates. For specimens with lower Sa values, abrasive wear becomes more pronounced, while those with higher Sa values experience more significant degradation on the surface asperities. In the presence of oil lubrication, abrasive wear is identified as the dominant wear mechanism for GCr15 steel, with the extent of wear being inversely related to the surface roughness. The surface valleys play a crucial role in accumulating wear debris and lubricating oil, which helps to enhance lubrication and mitigate the effect of abrasive wear. After wear, the surface of the sample with a Sa of 0.5 μm appears relatively smooth. By selecting an optimal surface roughness value, the wear resistance of GCr15 steel can be effectively improved.

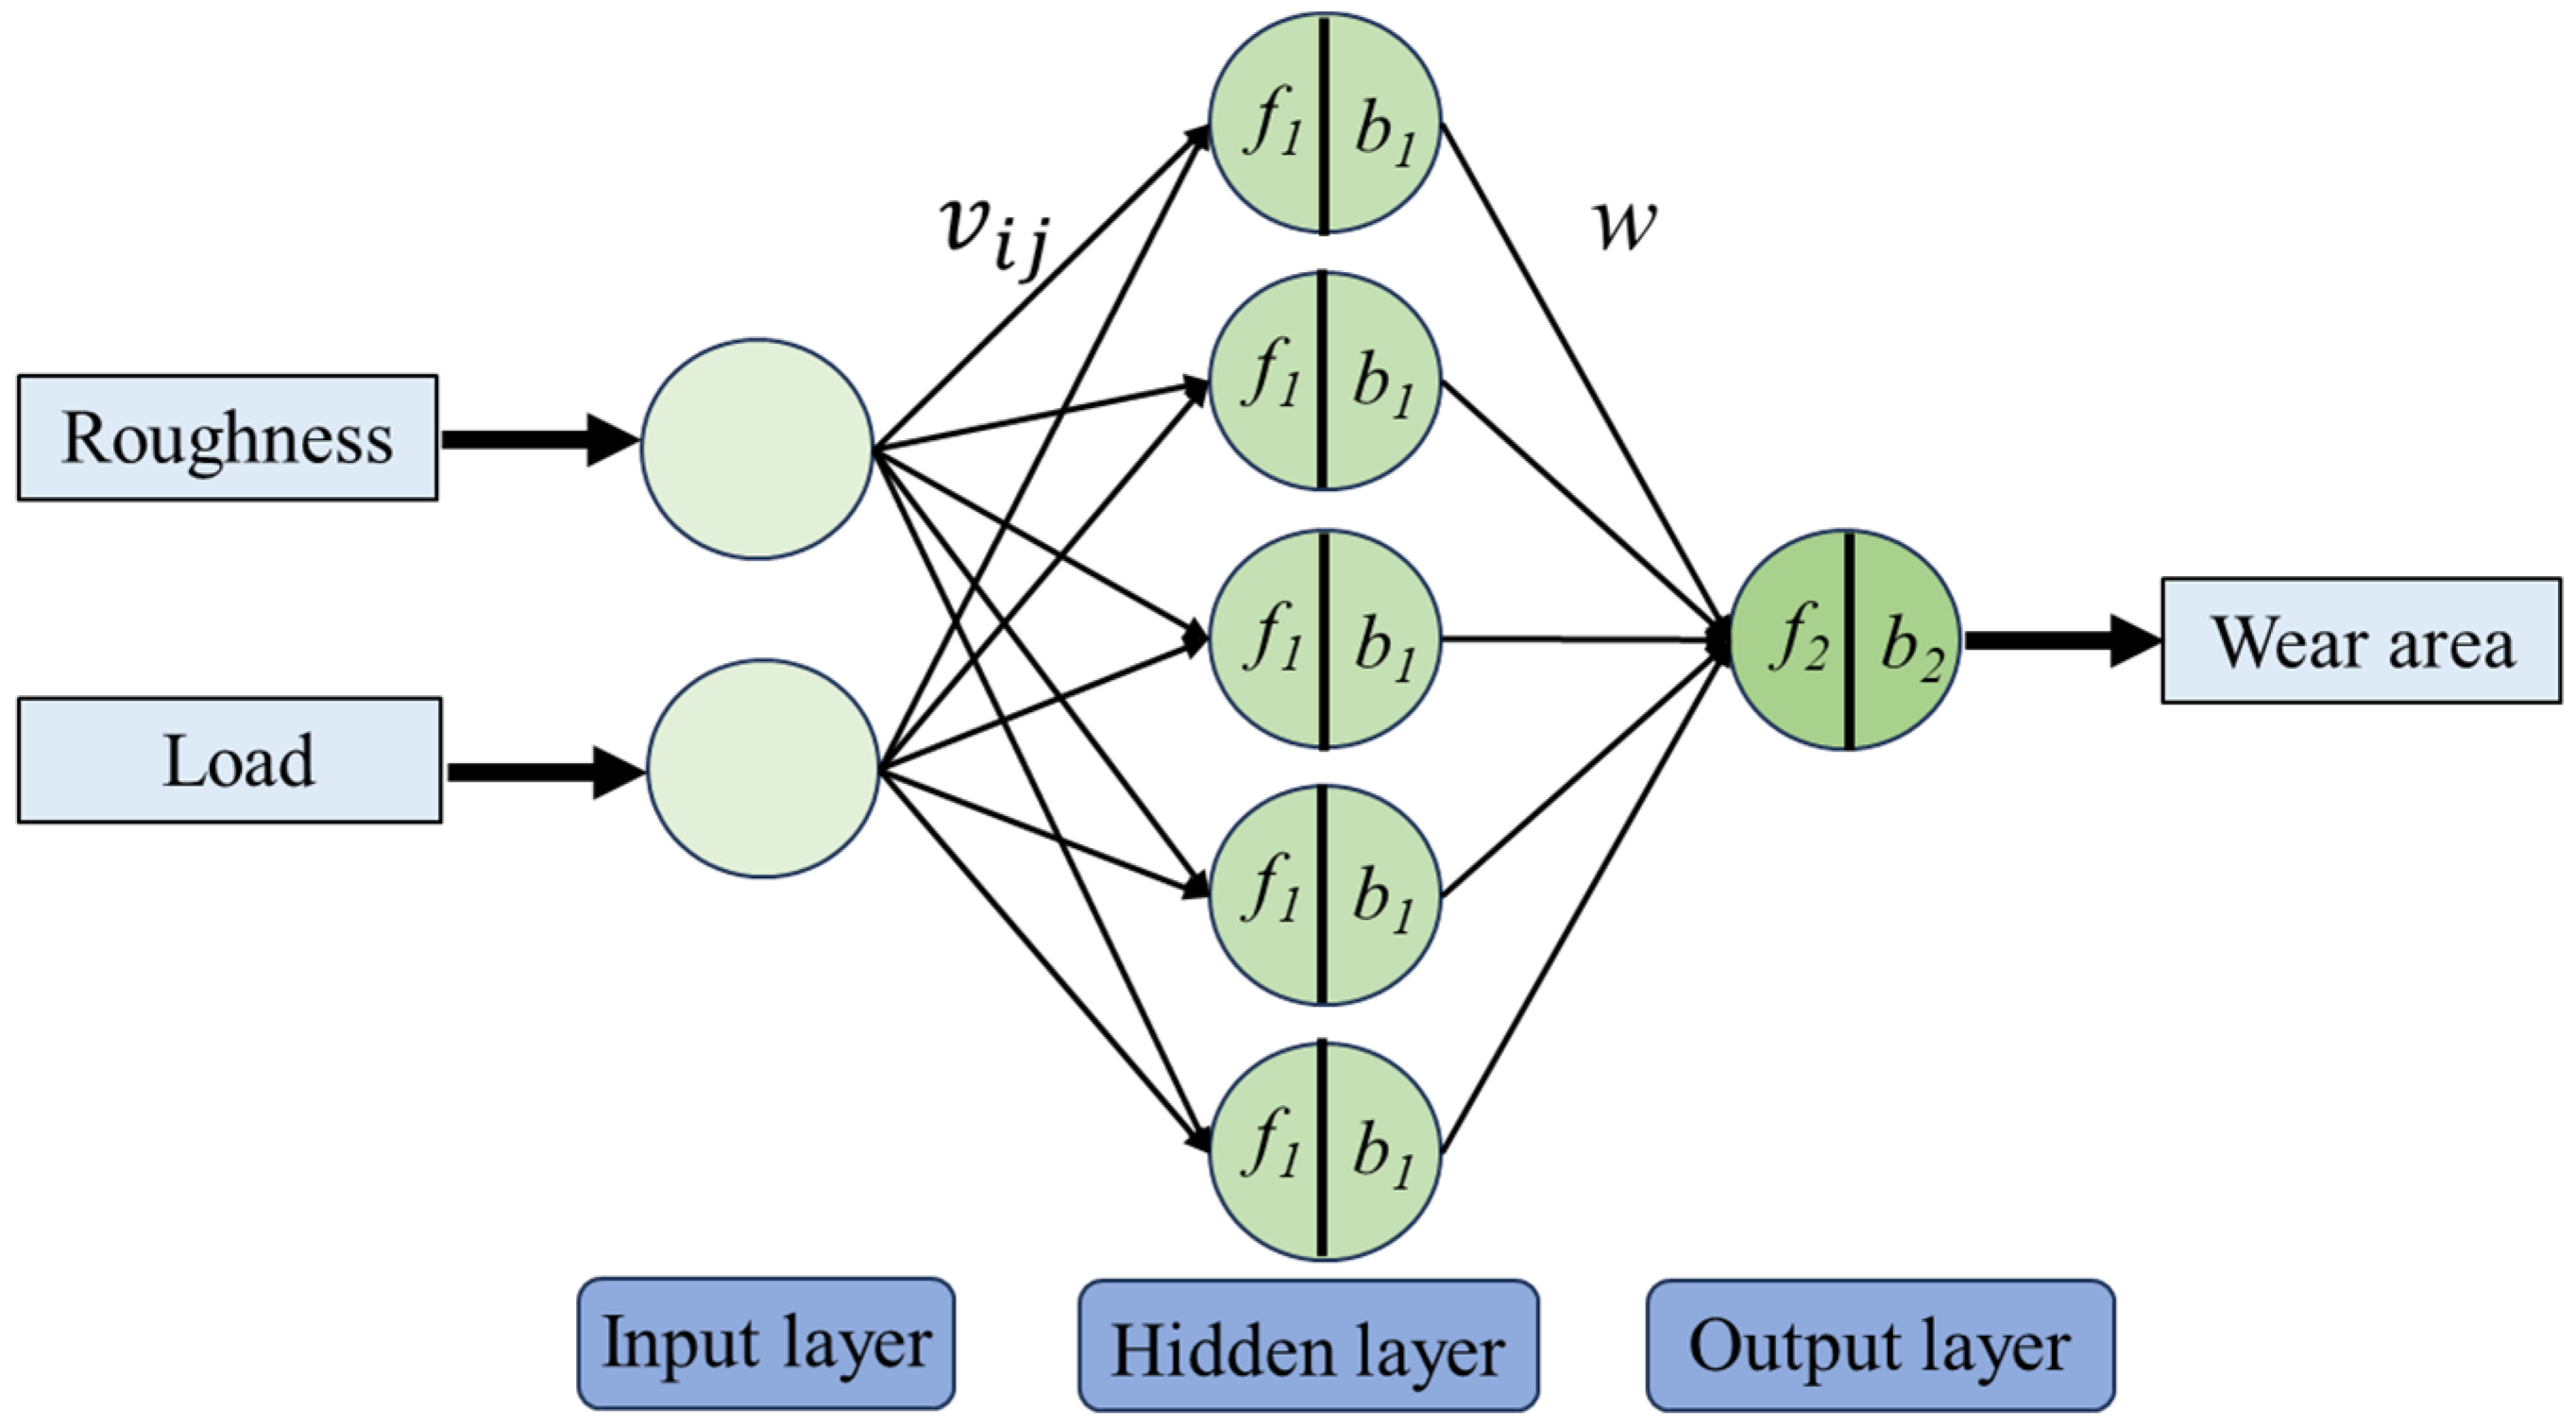
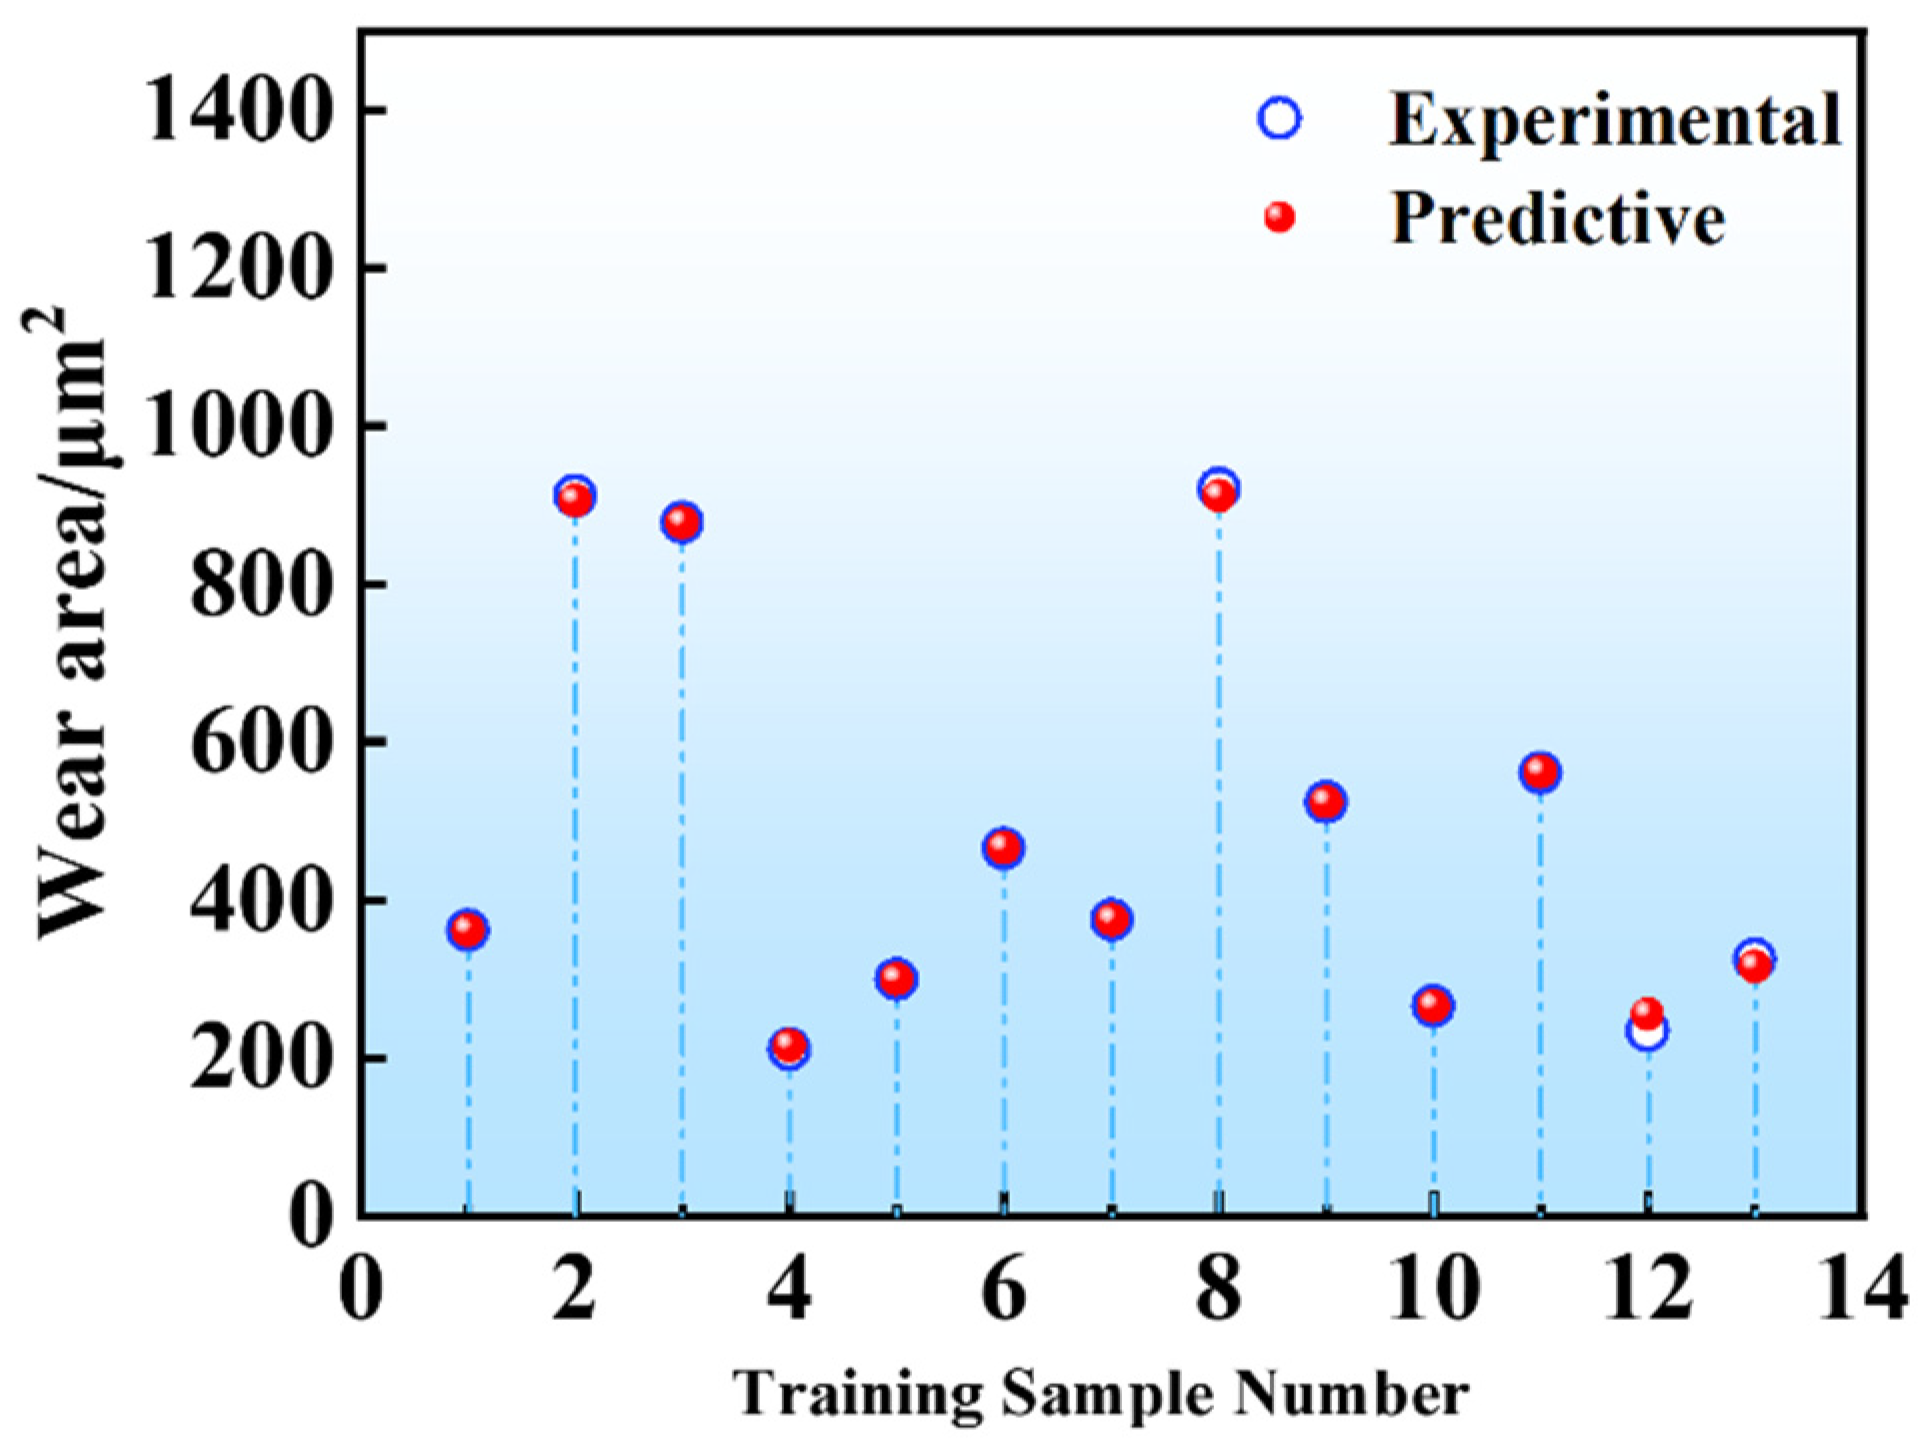
3.5. Wear Performance Prediction and Experimental Validation of GCr15 Bearing Steel

Following friction and wear tests, a back propagation neural network (BPNN) model is established with different Sa and loads and wear area as the output, with detailed results illustrated in Figure 14. In the process of the BPNN modeling, the Sigmoid function is a nonlinear function that can enhance the generalization ability of the neural network [30]. Therefore, both the hidden layer neurons and the output layer neurons adopt the Sigmoid function. After multiple experiments, it is found that when the number of hidden layer neurons is five, the relative error of the model reaches its minimum value.
Table 5 shows the data of the training set for establishing the BPNN model. The training set includes 12 numerical values of wear area corresponding to different Sa and loads. All data sets undergo normalization via Equation (1), with x denoting Sa, applied load, and wear area, xnorm indicating normalized values, xmin representing the data set’s minimum value, and xmax representing the data set’s maximum value.
x n o r m = x x min x max x min
Post-normalization, the normalized roughness Sanorm and normalized load Fnorm are assigned as the input layer III (Equation (2)), whereas the normalized wear area Wnorm serves as the output layer O (Equation (3)). The hidden layer H (Equation (4)) contains five neurons.
I = ( Sa norm , F norm ) T
H = ( h 1 , h 2 , h 3 , h 4 , h 5 ) T
O = ( W norm ) T
The activation functions f1 and f2 for the hidden and output layers utilize the Logistic Sigmoid operator (Equation (5)):
f 1 = f 2 = 1 1 + e x
The output layer O is computed via Equation (6):
O = ( o 1 ) T = f 2 ( W · f 1 ( V · I + b 1 ) + b 2 )
where V and W denote the weight matrices connecting the input-to-hidden and hidden-to-output layers, respectively, while b1 and b2 represent biases for the hidden and output layers.
Model accuracy is quantified using relative error δ (Equation (7)):
δ = X exp X pre X exp
where Xexp corresponds to experimental measurements, and Xpre denotes algorithm-derived predictions [31].
To analyze Sa’s influence on material wear resistance across varying loads, a BPNN correlates load, Sa, and wear area (Figure 14). Training data (Figure 10) are utilized for model construction.
After 60 training iterations, weight matrices V (input-to-hidden) and W (hidden-to-output), alongside biases b1 and b2, are derived as:
v = 6.631638 0.26327 2.37573 2.76119 0.314 0.88732 4.72662 1.851126 8.128088 1.589939 ,   b 1 = 5.02934 2.408243 0.05048 0.027865 0.024814 .
w = 9.582545 3.88853 0.42347 4.108766 6.09823 ,   b 2 = 2.967754 .
To evaluate the accuracy of the established model, a series of wear area measurements for GCr15 steel were obtained by inputting various Sa and load conditions into the model, as illustrated in Figure 15. From the prediction results of the training set in Figure 15, it can be seen that the model has a very high degree of fitting to the training set data, which strongly proves the excellent training performance of the model [32]. The predictive capability of the model was further assessed by using input values of Sa = 0.01 μm and F = 25 N, as well as Sa = 0.5 μm and F = 25 N, which yielded predicted wear areas of 365.51 μm² and 234.48 μm2, respectively. Under identical experimental conditions, the measured wear areas were 341 μm2 and 273 μm2, corresponding to prediction errors of 7.19% and 14.1% (Table 6), and resulting in an average relative error of 10.64%. The error analysis indicates that the BP neural network is capable of predicting the wear area of materials under varying conditions (i.e., different loads and Sa values), thereby providing an efficient and low-cost approach for forecasting the wear performance of bearings in industrial applications.

4. Conclusions

In this paper, the impact of surface roughness on the friction and wear characteristics of GCr15 steel under different loads were investigated systematically. A back propagation neural network (BPNN) prediction model was developed to determine the wear behavior of GCr15 steel. The following conclusions are drawn:
(1)
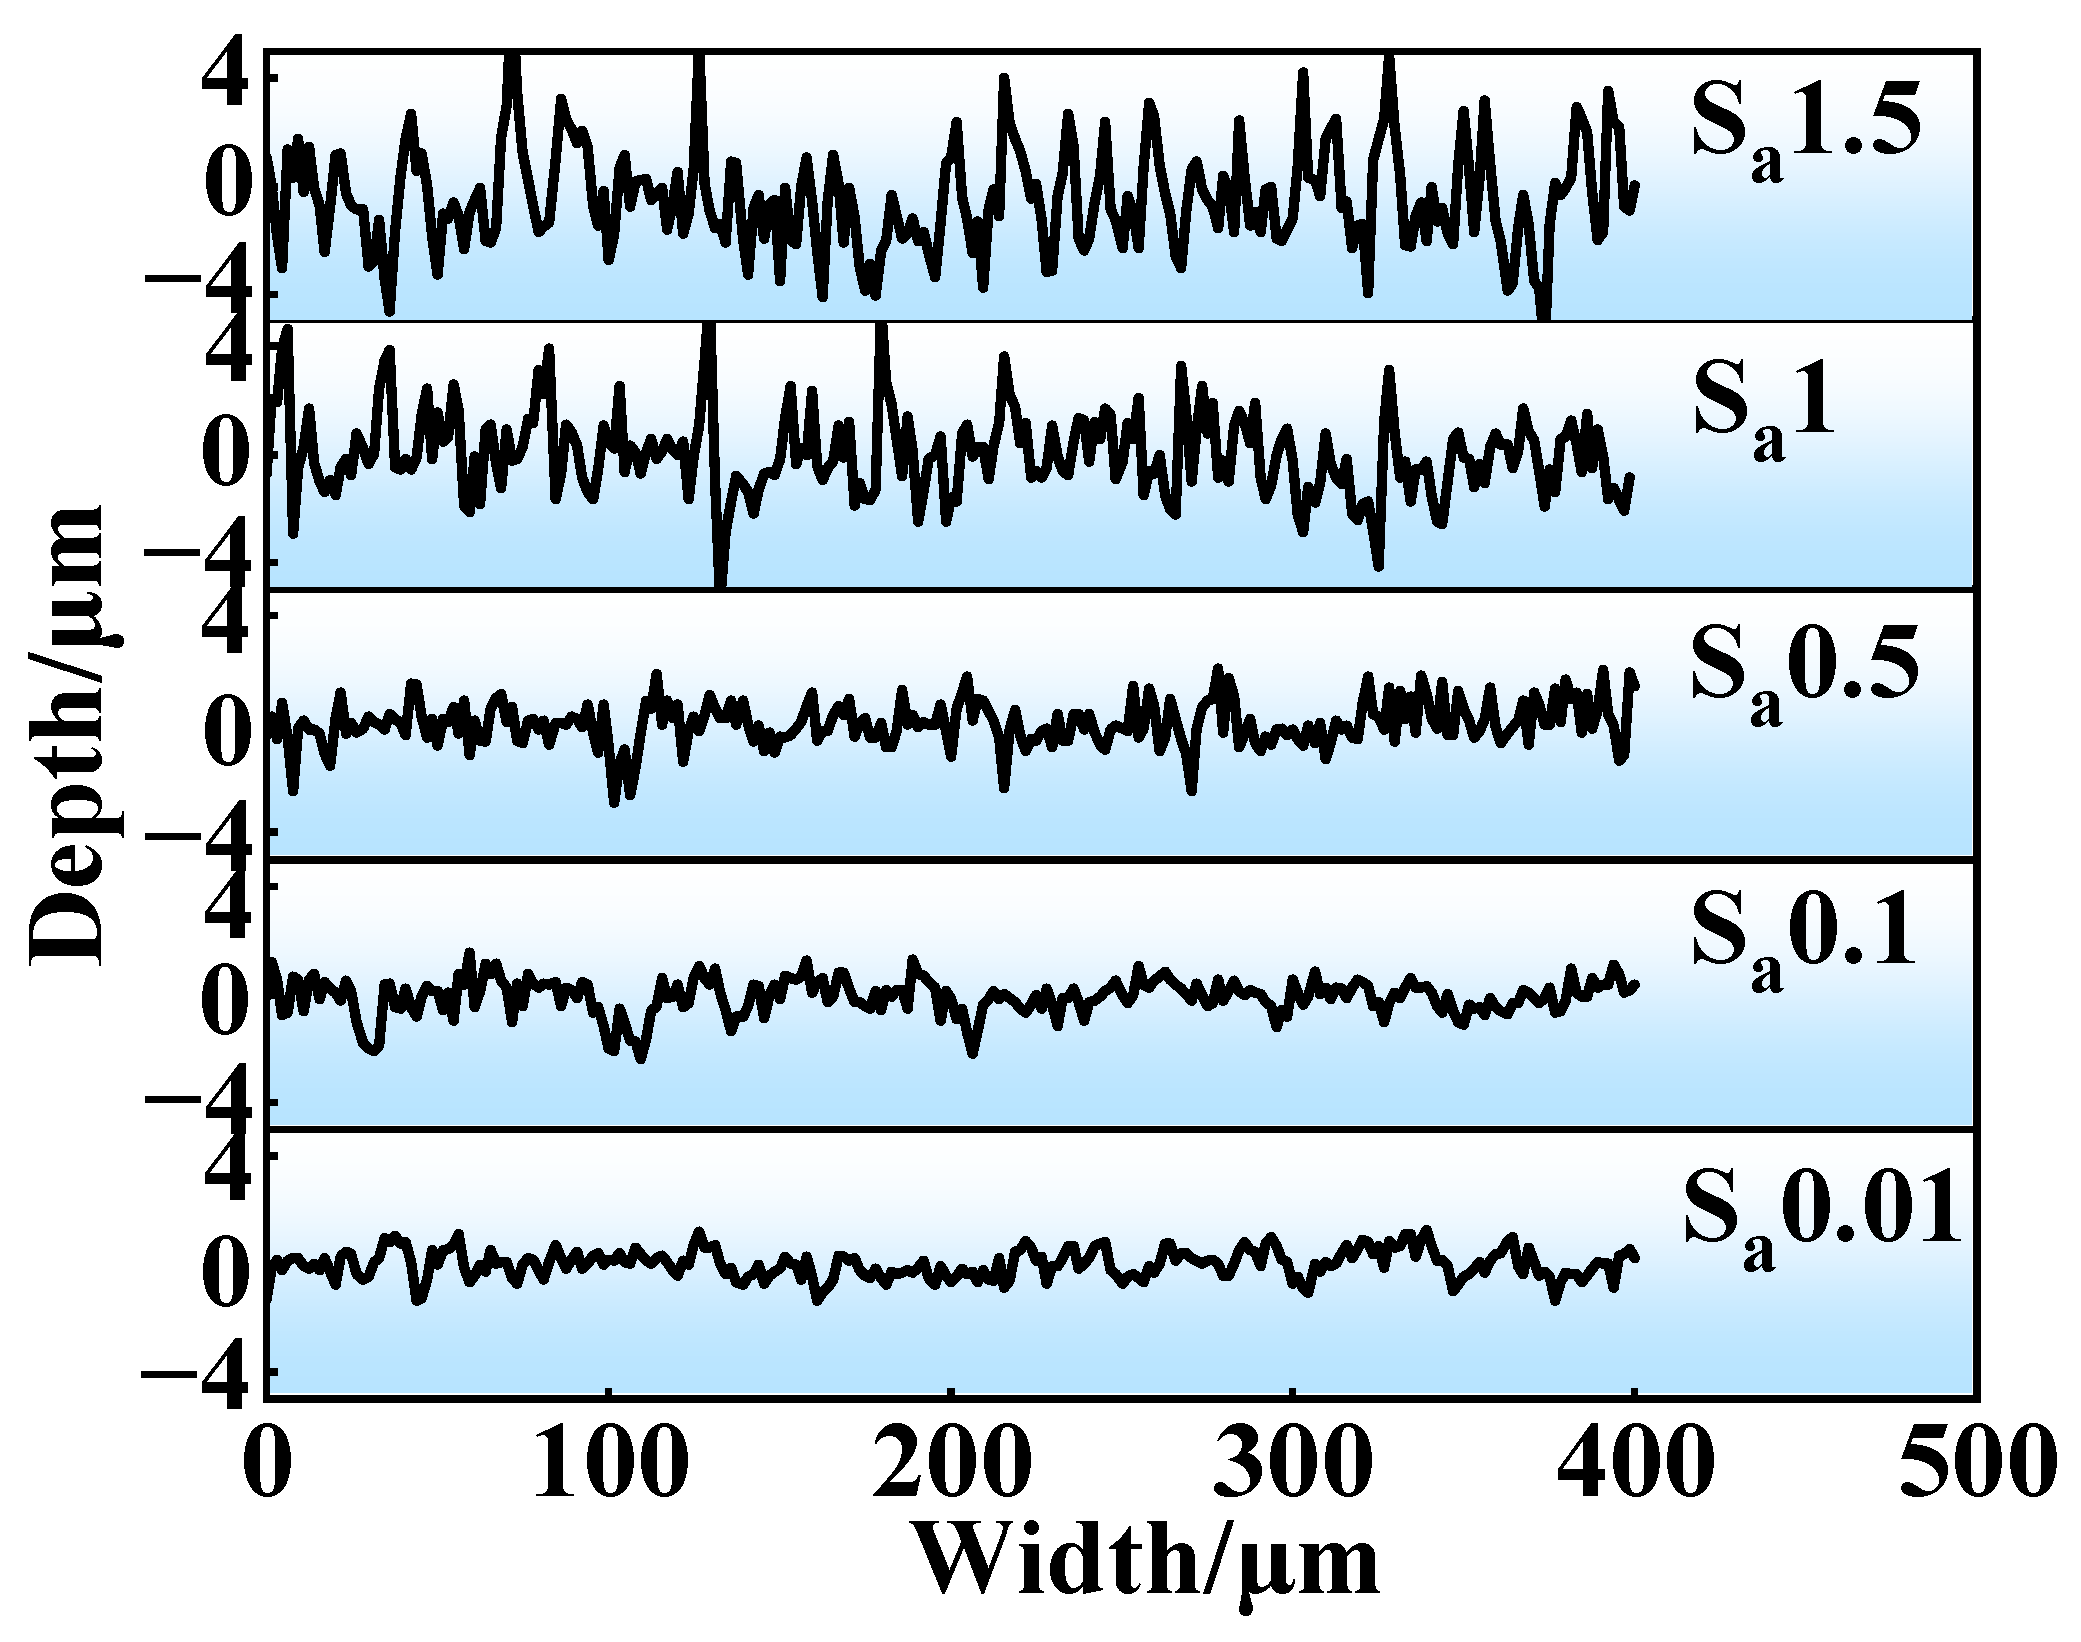
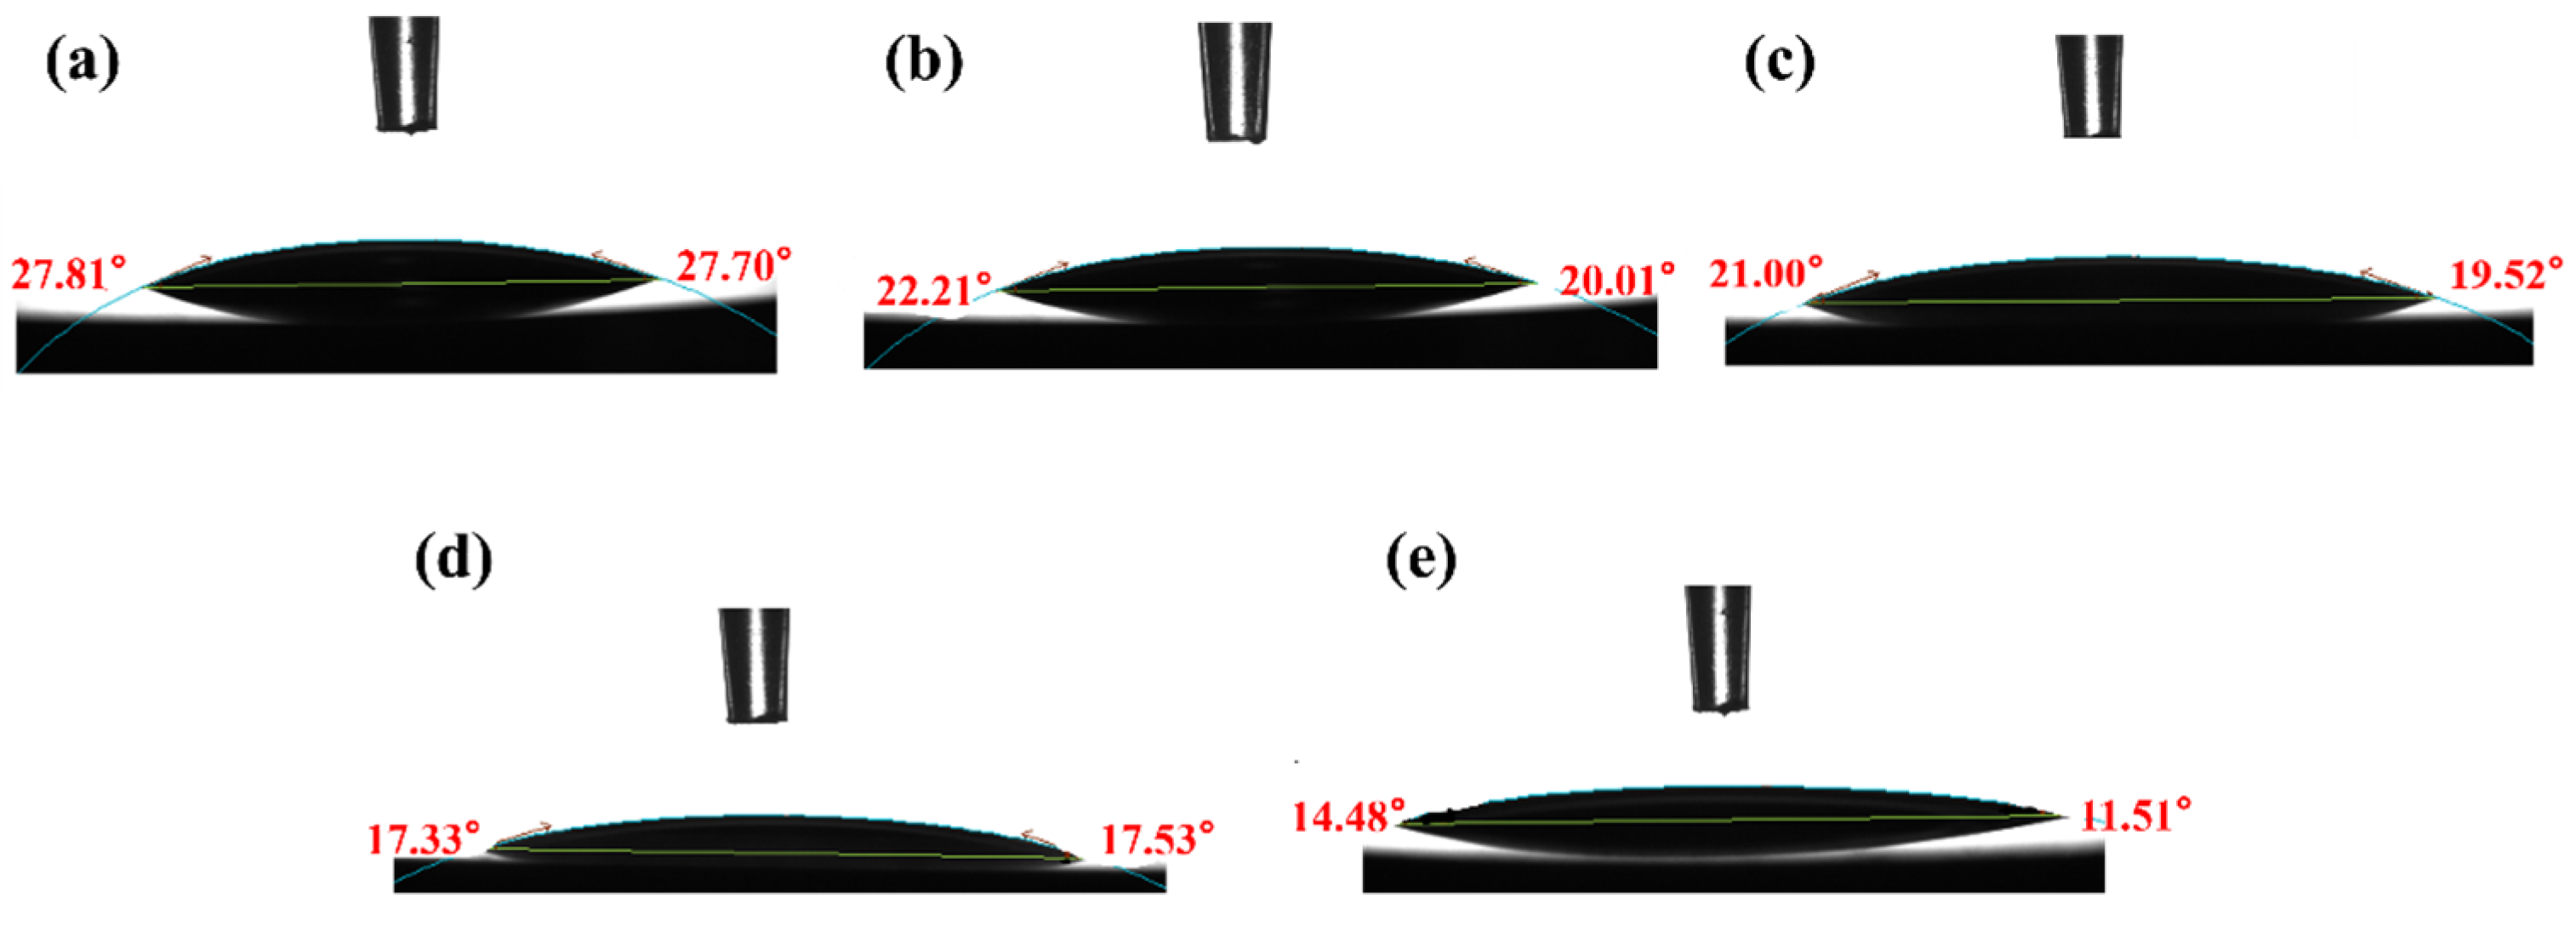
The surface asperities of GCr15 steel samples with various surface roughness values (Sa = 0.01 μm, 0.1 μm, 0.5 μm, 1 μm, and 1.5 μm) are uniformly distributed, with no intersecting or disordered scratches observed. As Sa increases from 0.01 μm to 1.5 μm, the Rz correspondingly increases, whereas the contact angle of the samples gradually decreases.
(2)
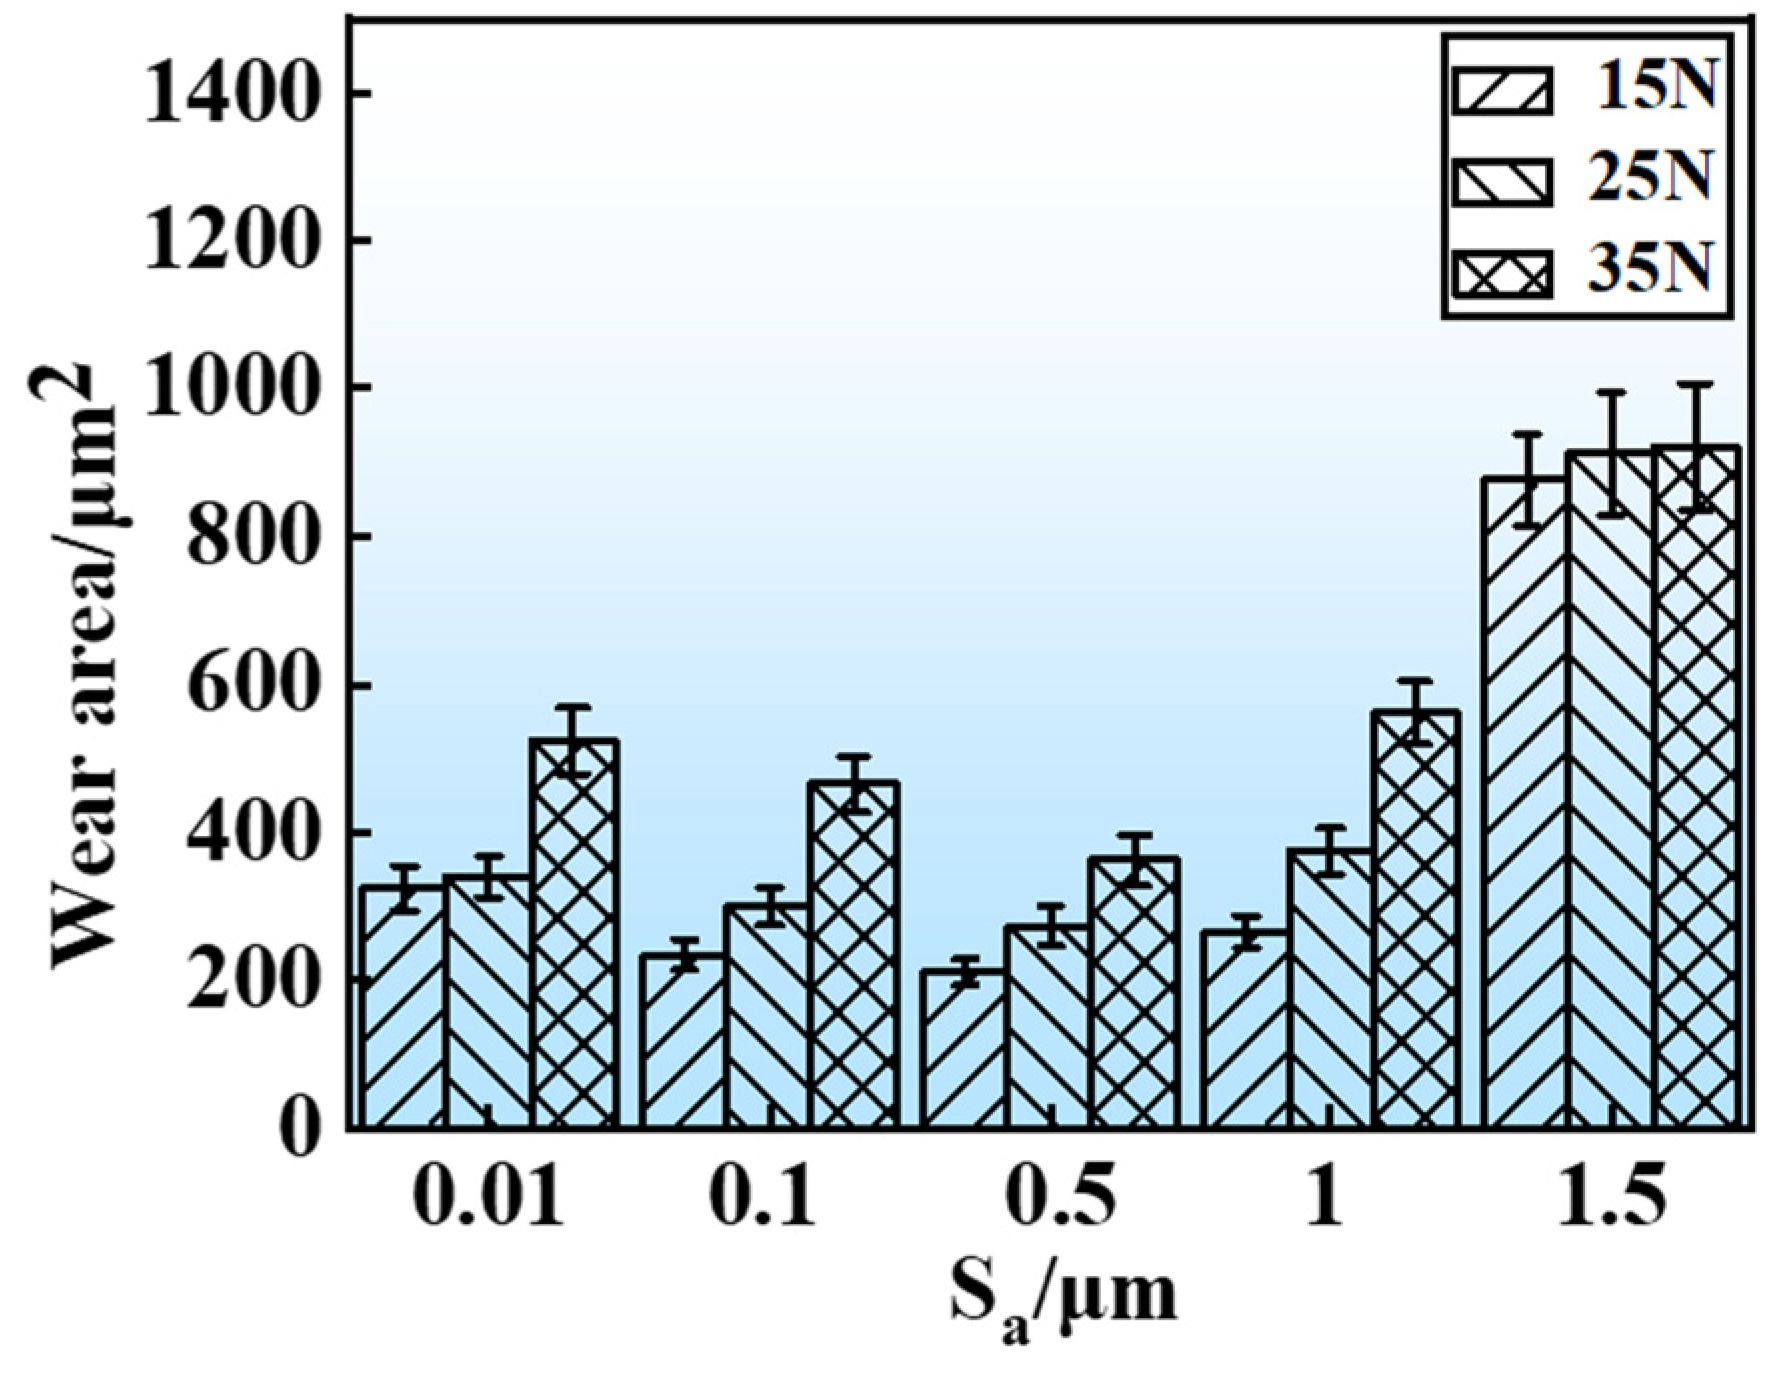
With increasing Sa, the mean friction coefficient of GCr15 steel gradually rises under oil-lubricated conditions, whereas the specimen’s wear area first decreases and then increases. Minimal wear area and optimal wear resistance are observed in the specimen at Sa = 0.5 μm. Additionally, higher loads lead to larger wear areas of the materials and abrasive wear is the main mechanism.
(3)
A BPNN model was developed to characterize the correlation between wear areas and experimental parameters (surface roughness Sa and applied load). Through independent validation tests, the mean predictive deviation of the proposed BPNN framework was determined to be 10.64%.

Author Contributions

T.H.: Conception, Writing—Original draft preparation, Methodology, Visualization, Supervision, and Funding acquisition. W.C. and Z.L.: Formal analysis, Methodology, Software, Validation, and Completion of experiment. Z.G.: Experimental design and Investigation. S.D. and Y.Z.: Manuscript modification, language proofing, and Writing—Reviewing and Editing. All authors have read and agreed to the published version of the manuscript.

Funding

The project was funded by Henan Provincial Science and Technology Research Project (252102220081) and the National Natural Science Foundation of China (51905153).

Data Availability Statement

The raw data supporting the conclusions of this article will be made available by the authors on request.

Conflicts of Interest

The authors declare that they have no known competing financial interests or personal relationships that could have appeared to influence the work reported in this paper.

References

  1. Li, Y.; Jiang, Z.; Li, L.; Wang, P.; Li, D.; Xue, W.; Duan, D. Wear behavior and damage characterization for AISI 52100 bearing steels: Effect of hardness and spherical carbides. J. Mater. Res. Technol. 2024, 30, 8359–8370. [Google Scholar] [CrossRef]
  2. Shi, W.; Sun, B.; Chen, L. Low friction and high load-carrying capacity of a slider bearing with an inhomogeneous surface affinity. J. Phys. Conf. Ser. 2020, 1654, 012035. [Google Scholar] [CrossRef]
  3. Cao, Z.X.; Liu, T.Q.; Yu, F.; Cao, W.; Zhang, X.; Weng, Y. Carburization induced extra-long rolling contact fatigue life of high carbon bearing steel. Int. J. Fatigue 2020, 131, 105351. [Google Scholar] [CrossRef]
  4. Zheng, X.; Zhang, Y.; Du, S. Preliminary research on response of GCr15 bearing steel under cyclic compression. Materials 2020, 13, 3443. [Google Scholar] [CrossRef]
  5. Wang, Z.; Chen, S.Y.; He, W.Z.; Wang, Z.; Xia, Z. Research for the bearing fit effect on the vibration characteristics of spindle rotor-bearing system. J. Mech. Sci. Technol. 2023, 37, 6257–6270. [Google Scholar] [CrossRef]
  6. Wang, X.M.; Meng, Q.L.; Zhang, T.X. Sensitivity analysis of rolling bearing fatigue life under cyclic loading. J. Mech. Sci. Technol. 2022, 36, 5689–5698. [Google Scholar] [CrossRef]
  7. Abd-Alsamieh, M. Ultrathin film formation under combined effect of surface roughness and surface force for elastohydrodynamic lubrication of point contact problems. Ind. Lubr. Tribol. 2022, 74, 597–608. [Google Scholar] [CrossRef]
  8. Kumar, S.; Charitatos, V. Influence of surface roughness on droplet evaporation and absorption: Insights into experiments from lubrication-theory-based models. Langmuir 2022, 38, 15889–15904. [Google Scholar] [CrossRef]
  9. Hu, L.; Pueh, L.H.; Wang, D.F.; Wang, Z. Fatigue failure of high precision spindle bearing under extreme service conditions. Eng. Fail. Anal. 2024, 158, 107951. [Google Scholar] [CrossRef]
  10. Yu, F.; Chen, X.P.; Xu, H.F.; Dong, H.; Weng, Y.; Cao, W. Current status of metallurgical quality and fatigue performance of rolling bearing steel and development direction of high-end bearing steel. Acta Met. Sin 2020, 56, 513–522. [Google Scholar]
  11. Wang, C.; Zhang, Y.B. Surface roughness effect in hydrodynamic thrust bearing with ultra low clearance. Int. J. Eng. Model. 2023, 36, 61–74. [Google Scholar]
  12. Sanchez Garrido, D.; Leventini, S.; Martini, A. Effect of temperature and surface roughness on the tribological behavior of electric motor greases for hybrid bearing materials. Lubricants 2021, 9, 59. [Google Scholar] [CrossRef]
  13. Mohd Yusof, N.F.; Ripin, Z.M. In-situ surface wear assessment using a bearing area curve technique. Tribol.-Mater. Surf. Interfaces 2022, 16, 235–244. [Google Scholar] [CrossRef]
  14. He, P.Y.; Lu, S.W.; Wang, Y.; Li, R.; Li, F. Analysis of the best roughness surface based on the bearing area curve theory. Proc. Inst. Mech. Eng. Part J J. Eng. Tribol. 2022, 236, 527–540. [Google Scholar] [CrossRef]
  15. Yuan, Z.; Jiang, Z.; Zhou, Z.; Wang, H.; Li, J.; Cai, Z.; Xing, Z.; Ding, C.; Piao, Z. Effect of surface roughness on friction and wear behavior of GCr15 bearing steel under different loads. Surf. Sci. Technol. 2024, 2, 28. [Google Scholar] [CrossRef]
  16. Zhao, Z.; Xie, X.C.; Tang, G.B.; Padhiar, M.A.; Xiao, J.; Liang, Z. Study on the effect of the strengthen grinding process surface coverage on the micro-morphology, micro-hardness, roughness, and residue stress of GCr15 bearing steels. J. Manuf. Process. 2023, 99, 362–372. [Google Scholar] [CrossRef]
  17. Byotra, D.; Sharma, S. Effect of texture shapes and additives in lubricants on the dynamic characteristics of the hydrodynamic journal bearing. Ind. Lubr. Tribol. 2023, 75, 1031–1044. [Google Scholar] [CrossRef]
  18. Xia, Z.F.; Wu, D.; Zhang, X.C.; Wang, J.; Han, E.-H. Rolling contact fatigue failure mechanism of bearing steel on different surface roughness levels under heavy load. Int. J. Fatigue 2024, 179, 108042. [Google Scholar] [CrossRef]
  19. Shi, X.J.; Lu, X.Q.; Feng, Y.; Qiu, Z. Tribo-dynamic analysis for aero ball bearing with 3D measured surface roughness. Eng. Fail. Anal. 2022, 131, 105848. [Google Scholar] [CrossRef]
  20. Feng, Y.; Qiu, Z.Y.; Shi, X.J.; Lu, X.; Sun, W.; Hua, D.; Sun, H. Coupling mechanism of wear and mixed lubrication for gas turbine ball bearing considering real rough surfaces. J. Mech. Eng. 2021, 59, 330–340. [Google Scholar]
  21. Singh, J.; Singh, S.; Vasudev, H.; Katiyar, J.K. Artificial neural network model for wear characteristic analysis of WC-10Co4Cr and Stellite 6 thermal spray coatings. Tribol. Int. 2024, 199, 109924. [Google Scholar] [CrossRef]
  22. Sheikh, K.A.; Khan, M.M. Predictive modeling of abrasive wear in in-situ TiC reinforced ZA37 alloy: A machine learning approach. Tribol. Int. 2025, 202, 110291. [Google Scholar] [CrossRef]
  23. Chen, W.; Li, Y.; Liu, Z.; Zhang, C.; Zhao, Y.; Yan, X. Prediction model for bearing surface friction coefficient in bolted joints based on GA-BP neural network and experimental data. Tribol. Int. 2025, 201, 110217. [Google Scholar] [CrossRef]
  24. Liu, Z.Y.; He, T.T.; Tian, J.; Jin, Z.; Song, G.; Du, S.; Zhang, Y. Investigation on the material damage and correlation analysis of GCr15SiMn bearing steel under unsteady lubrication based on poor information. Mater. Today Commun. 2025, 43, 111608. [Google Scholar] [CrossRef]
  25. He, T.T.; Song, G.A.; Shao, R.N.; Du, S.; Zhang, Y. Sliding friction and wear properties of GCr15 steel under different lubrication conditions. J. Mater. Eng. Perform. 2022, 31, 7653–7661. [Google Scholar] [CrossRef]
  26. Kumar, H.; Gupta, V.; Bharath, V.; Tiwari, M.; Paul, S.K.; Agrawal, L.; Singh, A.P.; Jain, A. Effect of surface roughness on the friction moment in a lubricated deep groove ball bearing. Lubricants 2024, 12, 443. [Google Scholar] [CrossRef]
  27. Kempepatil, R.S.; Al-Dossari, M.; Hiremath, A.G.; Patil, J.; Alqahtani, A.; Tawade, J.V.; Saydaxmetova, S.; Khan, M.I. Influence of roughness patterns and slip velocity on the lubrication of MHD-affected secant curved annular plates. Int. Commun. Heat Mass Transf. 2025, 160, 108401. [Google Scholar] [CrossRef]
  28. Khan, S.A.; Oliveira, J.; Ferreira, F.; Emami, N.; Ramalho, A. Surface roughness influence on tribological behavior of HiPIMS DLC coatings. Tribol. Trans. 2023, 66, 565–575. [Google Scholar] [CrossRef]
  29. Cai, L.; Wang, J.L.; Zheng, H.T. An experimental study on oil-air lubrication of sliding friction wlement. Appl. Mech. Mater. 2010, 34, 181–185. [Google Scholar] [CrossRef]
  30. Chen, Y.; Shen, L.; Li, R.; Xu, X.; Hong, H.; Lin, H.; Chen, J. Quantification of interfacial energies associated with membrane fouling in a membrane bioreactor by using BP and GRNN artificial neural networks. J. Colloid Interface Sci. 2020, 565, 1–10. [Google Scholar] [CrossRef]
  31. Song, C.; Liu, Z.; Zhang, Y.; Sun, C.; Liu, Z.; Zhang, Y. Generation conditions of rolling current-carrying associated arc on Cu-Cu pairs and the surface damage mechanisms. Eng. Fail. Anal. 2024, 159, 108103. [Google Scholar]
  32. Khalfallah, A.; Khalfallah, A.; Benzarti, Z. Identification of elastoplastic constitutive model of GaN thin films using instrumented nanoindentation and machine learning technique. Coatings 2024, 14, 683. [Google Scholar] [CrossRef]
Figure 1. The schematic diagram for calculating the wear area of the GCr15 steel.
Lubricants 13 00187 g001
Figure 2. The surface morphology of the GCr15 steel with different Sa: (a) 0.01 μm, (b) 0.1 μm, (c) 0.5 μm, (d) 1 μm, and (e) 1.5 μm.
Lubricants 13 00187 g002
Figure 3. Surface profile curve of GCr15 steel with different Sa.
Lubricants 13 00187 g003
Figure 4. Contact angle of GCr15 steel with different Sa: (a) 0.01 μm, (b) 0.1 μm, (c) 0.5 μm, (d) 1 μm, and (e) 1.5 μm.
Lubricants 13 00187 g004
Figure 5. Average contact angle of GCr15 steel surface with different Sa.
Lubricants 13 00187 g005
Figure 6. Friction coefficient of GCr15 steel with different Sa at different loads under oil lubrication: (a) 15 N, (b) 25 N, (c) 35 N, and (d) average friction coefficient.
Lubricants 13 00187 g006
Figure 7. Cross-sectional profiles of GCr15 steel with different Sa under the load of 15 N: (a) 0.01 μm, (b) 0.1 μm, (c) 0.5 μm, (d) 1 μm, and (e) 1.5 μm.
Lubricants 13 00187 g007
Figure 8. Cross-sectional profiles of GCr15 steel with different Sa under the load of 25 N: (a) 0.01 μm, (b) 0.1 μm, (c) 0.5 μm, (d) 1 μm, and (e) 1.5 μm.
Lubricants 13 00187 g008
Figure 9. Cross-sectional profiles of GCr15 steel with different Sa under the load of 35 N: (a) 0.01 μm, (b) 0.1 μm, (c) 0.5 μm, (d) 1 μm, and (e) 1.5 μm.
Lubricants 13 00187 g009
Figure 10. Wear area of GCr15 steel with different Sa.
Lubricants 13 00187 g010
Figure 11. Wear morphology of GCr15 steel with different Sa under the load of 15 N: (a) 0.01 μm, (b) 0.1 μm, (c) 0.5 μm, (d) 1 μm, and (e) 1.5 μm.
Lubricants 13 00187 g011
Figure 12. Wear morphology of GCr15 steel with different Sa under the load of 25 N: (a) 0.01 μm, (b) 0.1 μm, (c) 0.5 μm, (d) 1 μm, and (e) 1.5 μm.
Lubricants 13 00187 g012
Figure 13. Wear morphology of GCr15 steel with different Sa under the load of 35 N: (a) 0.01 μm, (b) 0.1 μm, (c) 0.5 μm, (d) 1 μm, and (e) 1.5 μm.
Lubricants 13 00187 g013
Figure 14. Back propagation neural network (BPNN) model design.
Lubricants 13 00187 g014
Figure 15. Prediction results of the wear area of the GCr15 steel by using the BPNN model.
Lubricants 13 00187 g015
Table 1. Chemical composition of the GCr15 bearing steel (mass fraction, %).
CMnSiPSCrCuNiMoTiFe
0.960.320.240.0080.0011.400.220.080.030.0024Bal.
Table 2. Machining processes of GCr15 Steel with different surface roughness (Sa).
Sa/μmMachining Process
0.01Grinding with the grits of 240, 400, 800, 1000, 1200, 1500, and 2000, respectively and then polishing sequentially with W 0.5 polishing diamond paste
0.1Grinding with the grits of 240, 400, 800, 1000, 1200, 1500, and 2000, respectively and then polishing sequentially with W 3.5 polishing diamond paste
0.5Grinding with the grits of 240, 400, 800, and 1000, respectively
1.0Grinding with the grits of 240, 400, and 800, respectively
1.5Grinding with the grits of 240 and 400, respectively
Table 3. The measured values of Sa of GCr15 steel.
NumberMeasured Surface Roughness Values (Sa/μm)Average Value (Sa/μm)
10.0150.0130.0090.0120.0090.01
20.130.110.080.130.090.1
30.540.480.450.530.510.5
40.980.911.150.920.961
51.351.71.651.461.411.5
Table 4. EDS analysis result corresponding to the positions (white boxes) in Figure 11, Figure 12 and Figure 13 (mass fraction, %).
Area FeCOCrSi
185.59.23.71.40.1
287.17.82.91.90.3
386.68.23.01.90.3
485.810.12.41.30.4
Table 5. The data of training set for BPNN model.
Training Sample NumberSa (μm)Load (N)Wear Area (μm2)
10.535362
21.525912
31.515877
40.515211
50.125299
60.135465
7125374
81.535921
90.0135524
10115265
11135561
120.115234
Table 6. Relative error between predictive data and experimental data in test set.
Testing DataSa (μm)Load (N)Experimental (μm2)Predictive (μm2)Relative Error
10.0125341365.517.19%
20.525273234.4814.1%
Average relative error10.64%
Disclaimer/Publisher’s Note: The statements, opinions and data contained in all publications are solely those of the individual author(s) and contributor(s) and not of MDPI and/or the editor(s). MDPI and/or the editor(s) disclaim responsibility for any injury to people or property resulting from any ideas, methods, instructions or products referred to in the content.

