Reducing the Friction Coefficient of Heavy-Load Spherical Bearings in Bridges Using Surface Texturing—A Numerical Study


Abstract
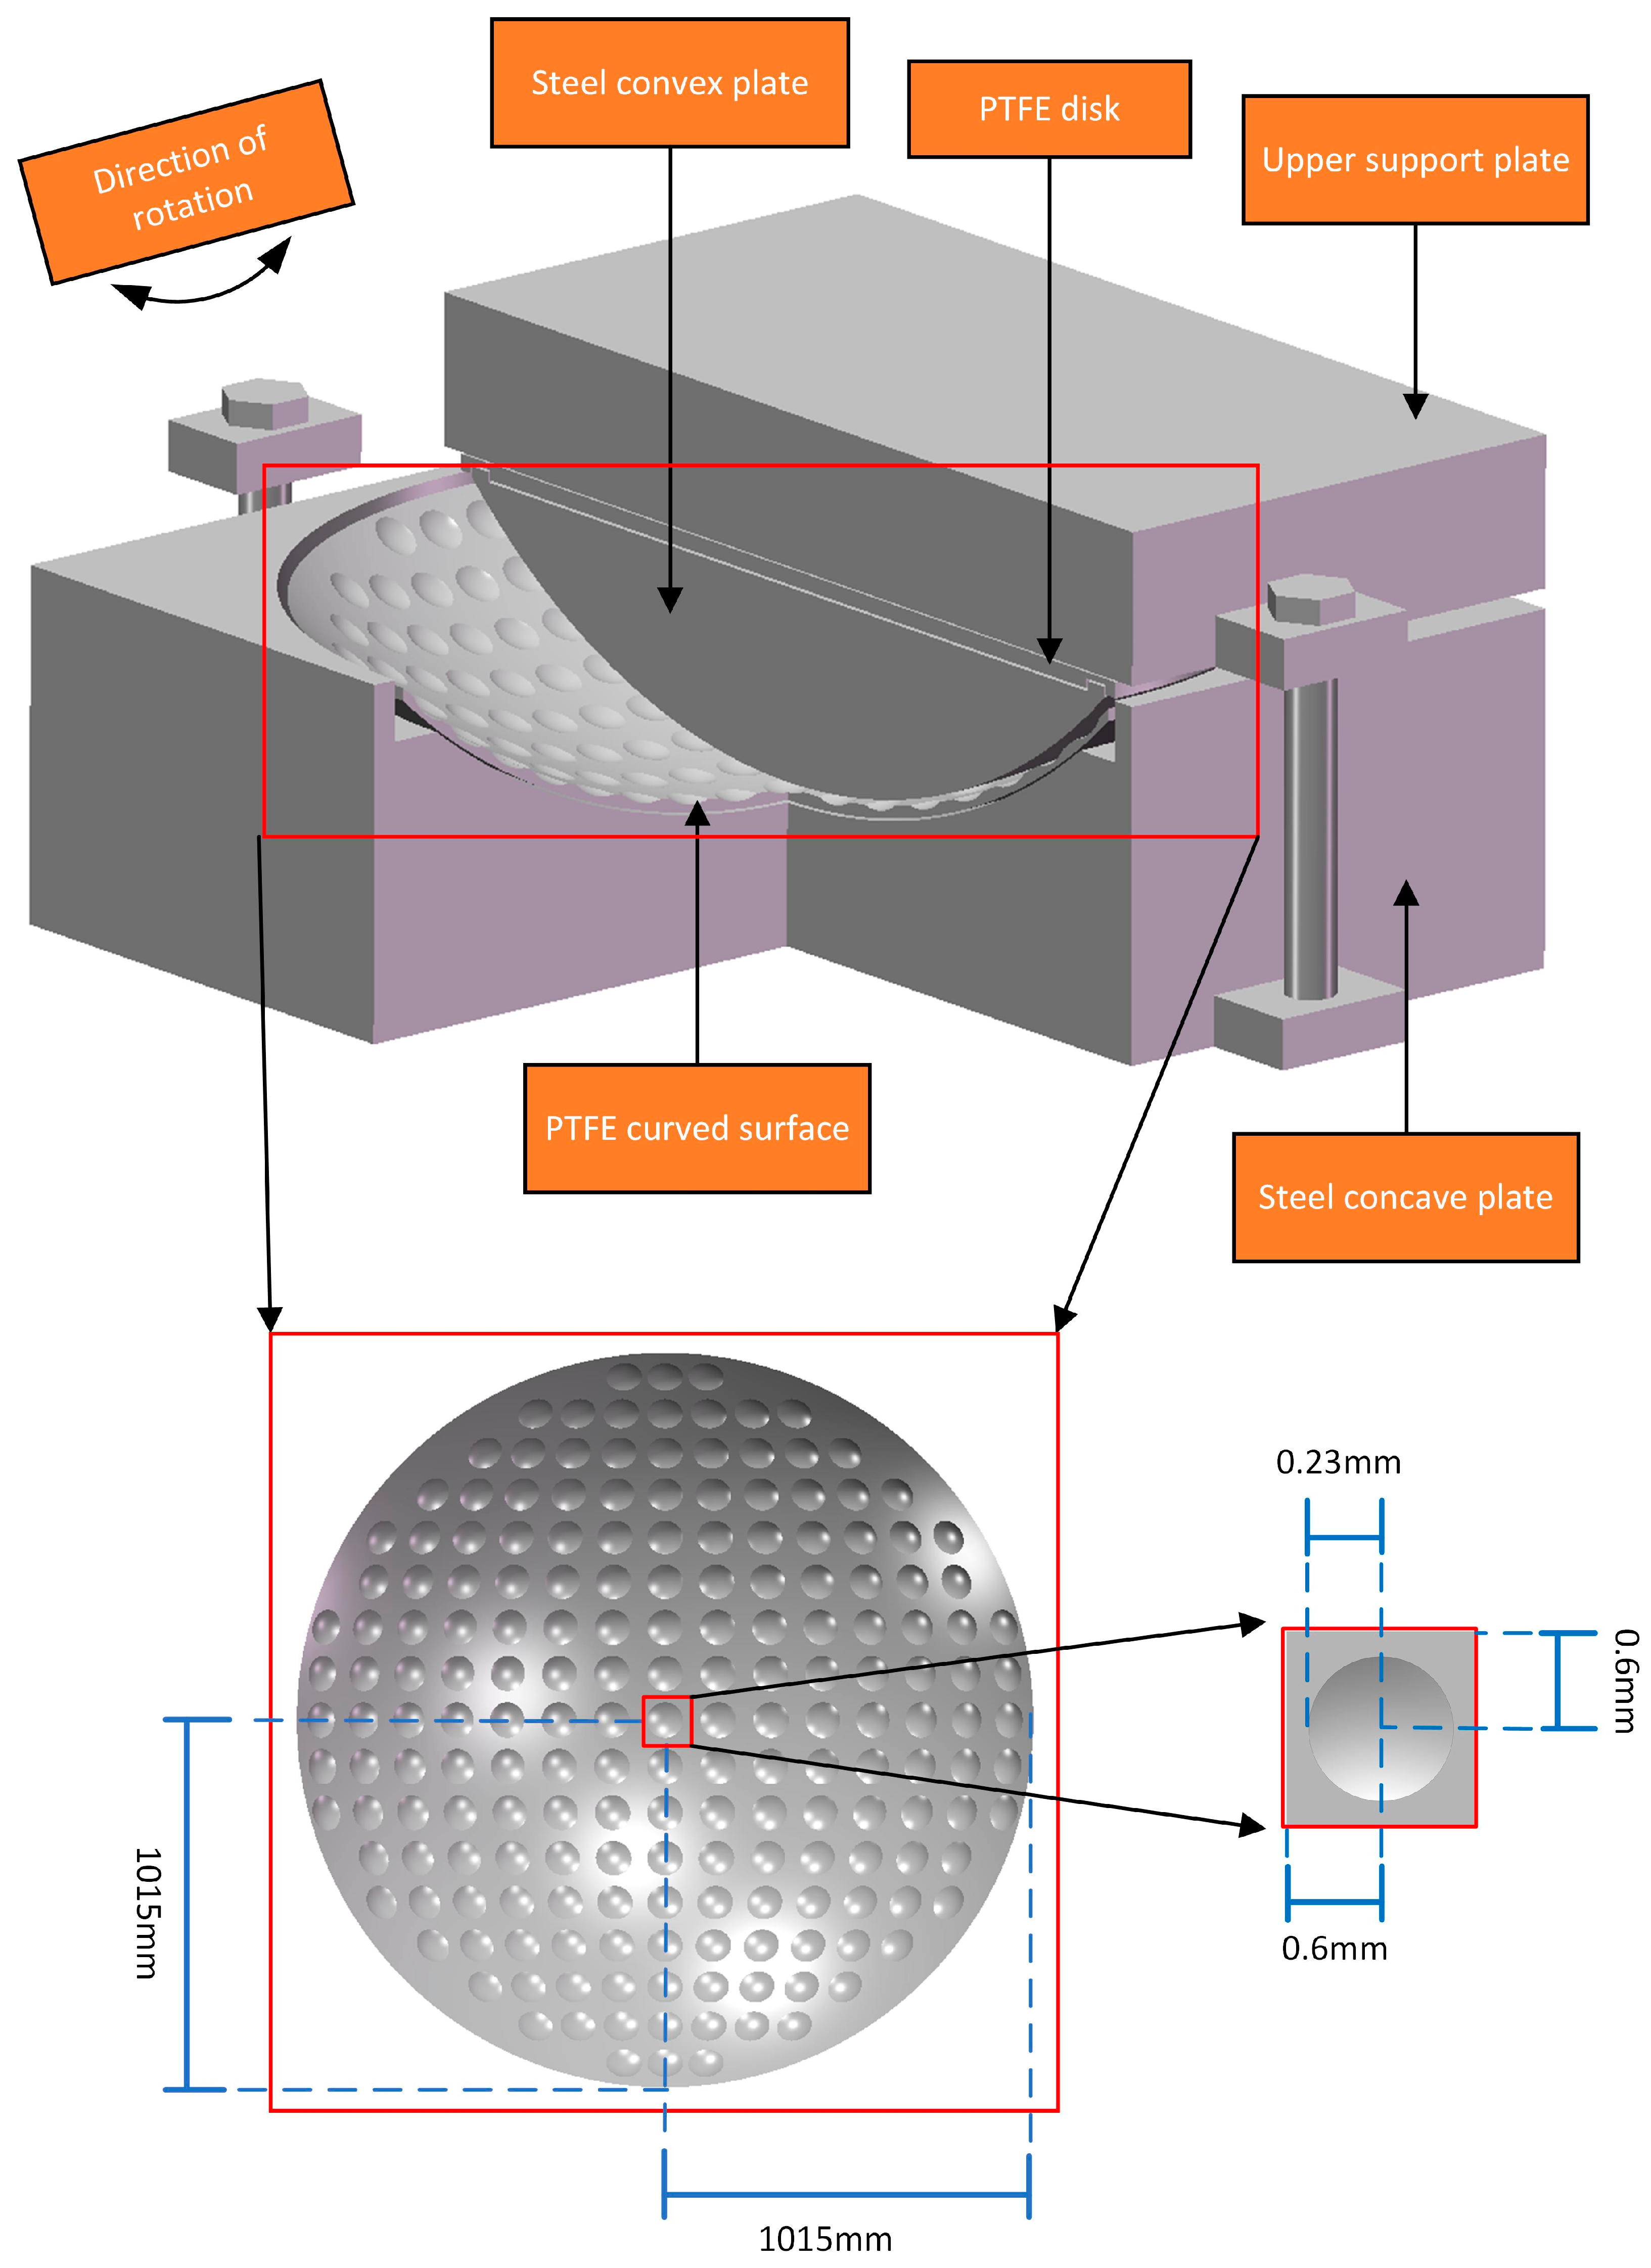
1. Introduction
2. Lubrication Model
2.1. Reynolds Equation Incorporating the JFO Boundary Condition
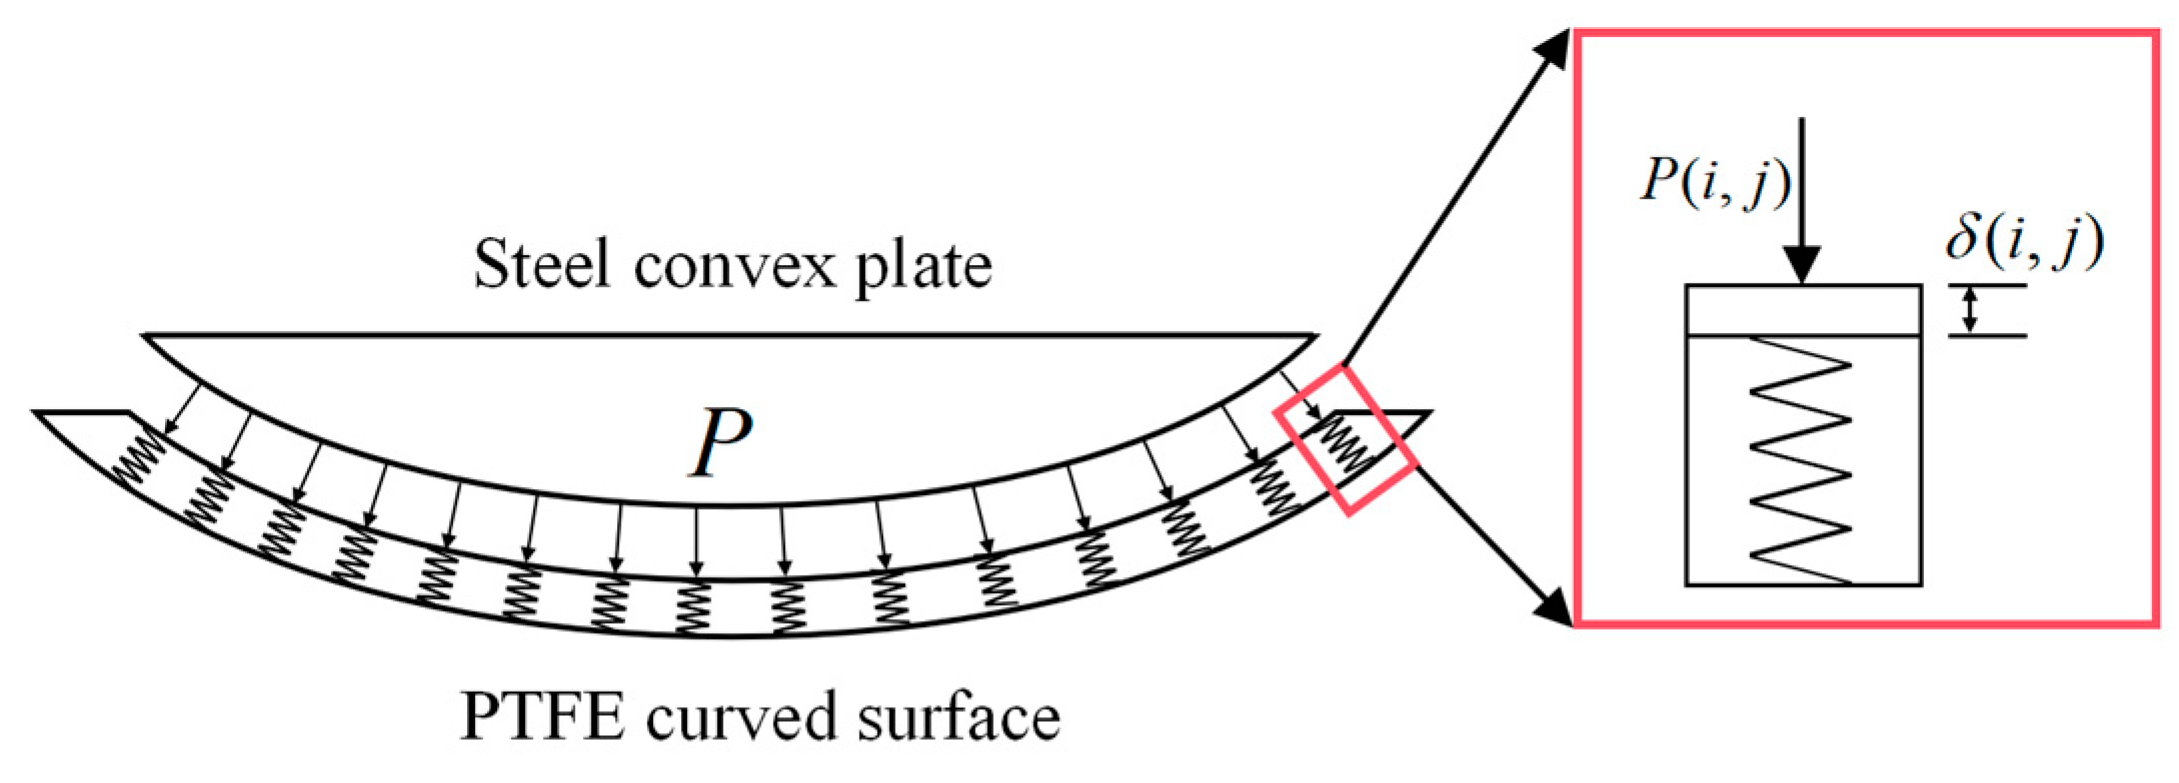
2.2. Lubricant Density and Viscosity, and Deformation of PTFE Surface
2.3. Computational Algorithm
2.4. Friction Coefficient
2.5. Numerical Implementation
3. Modeling of Surface Textures
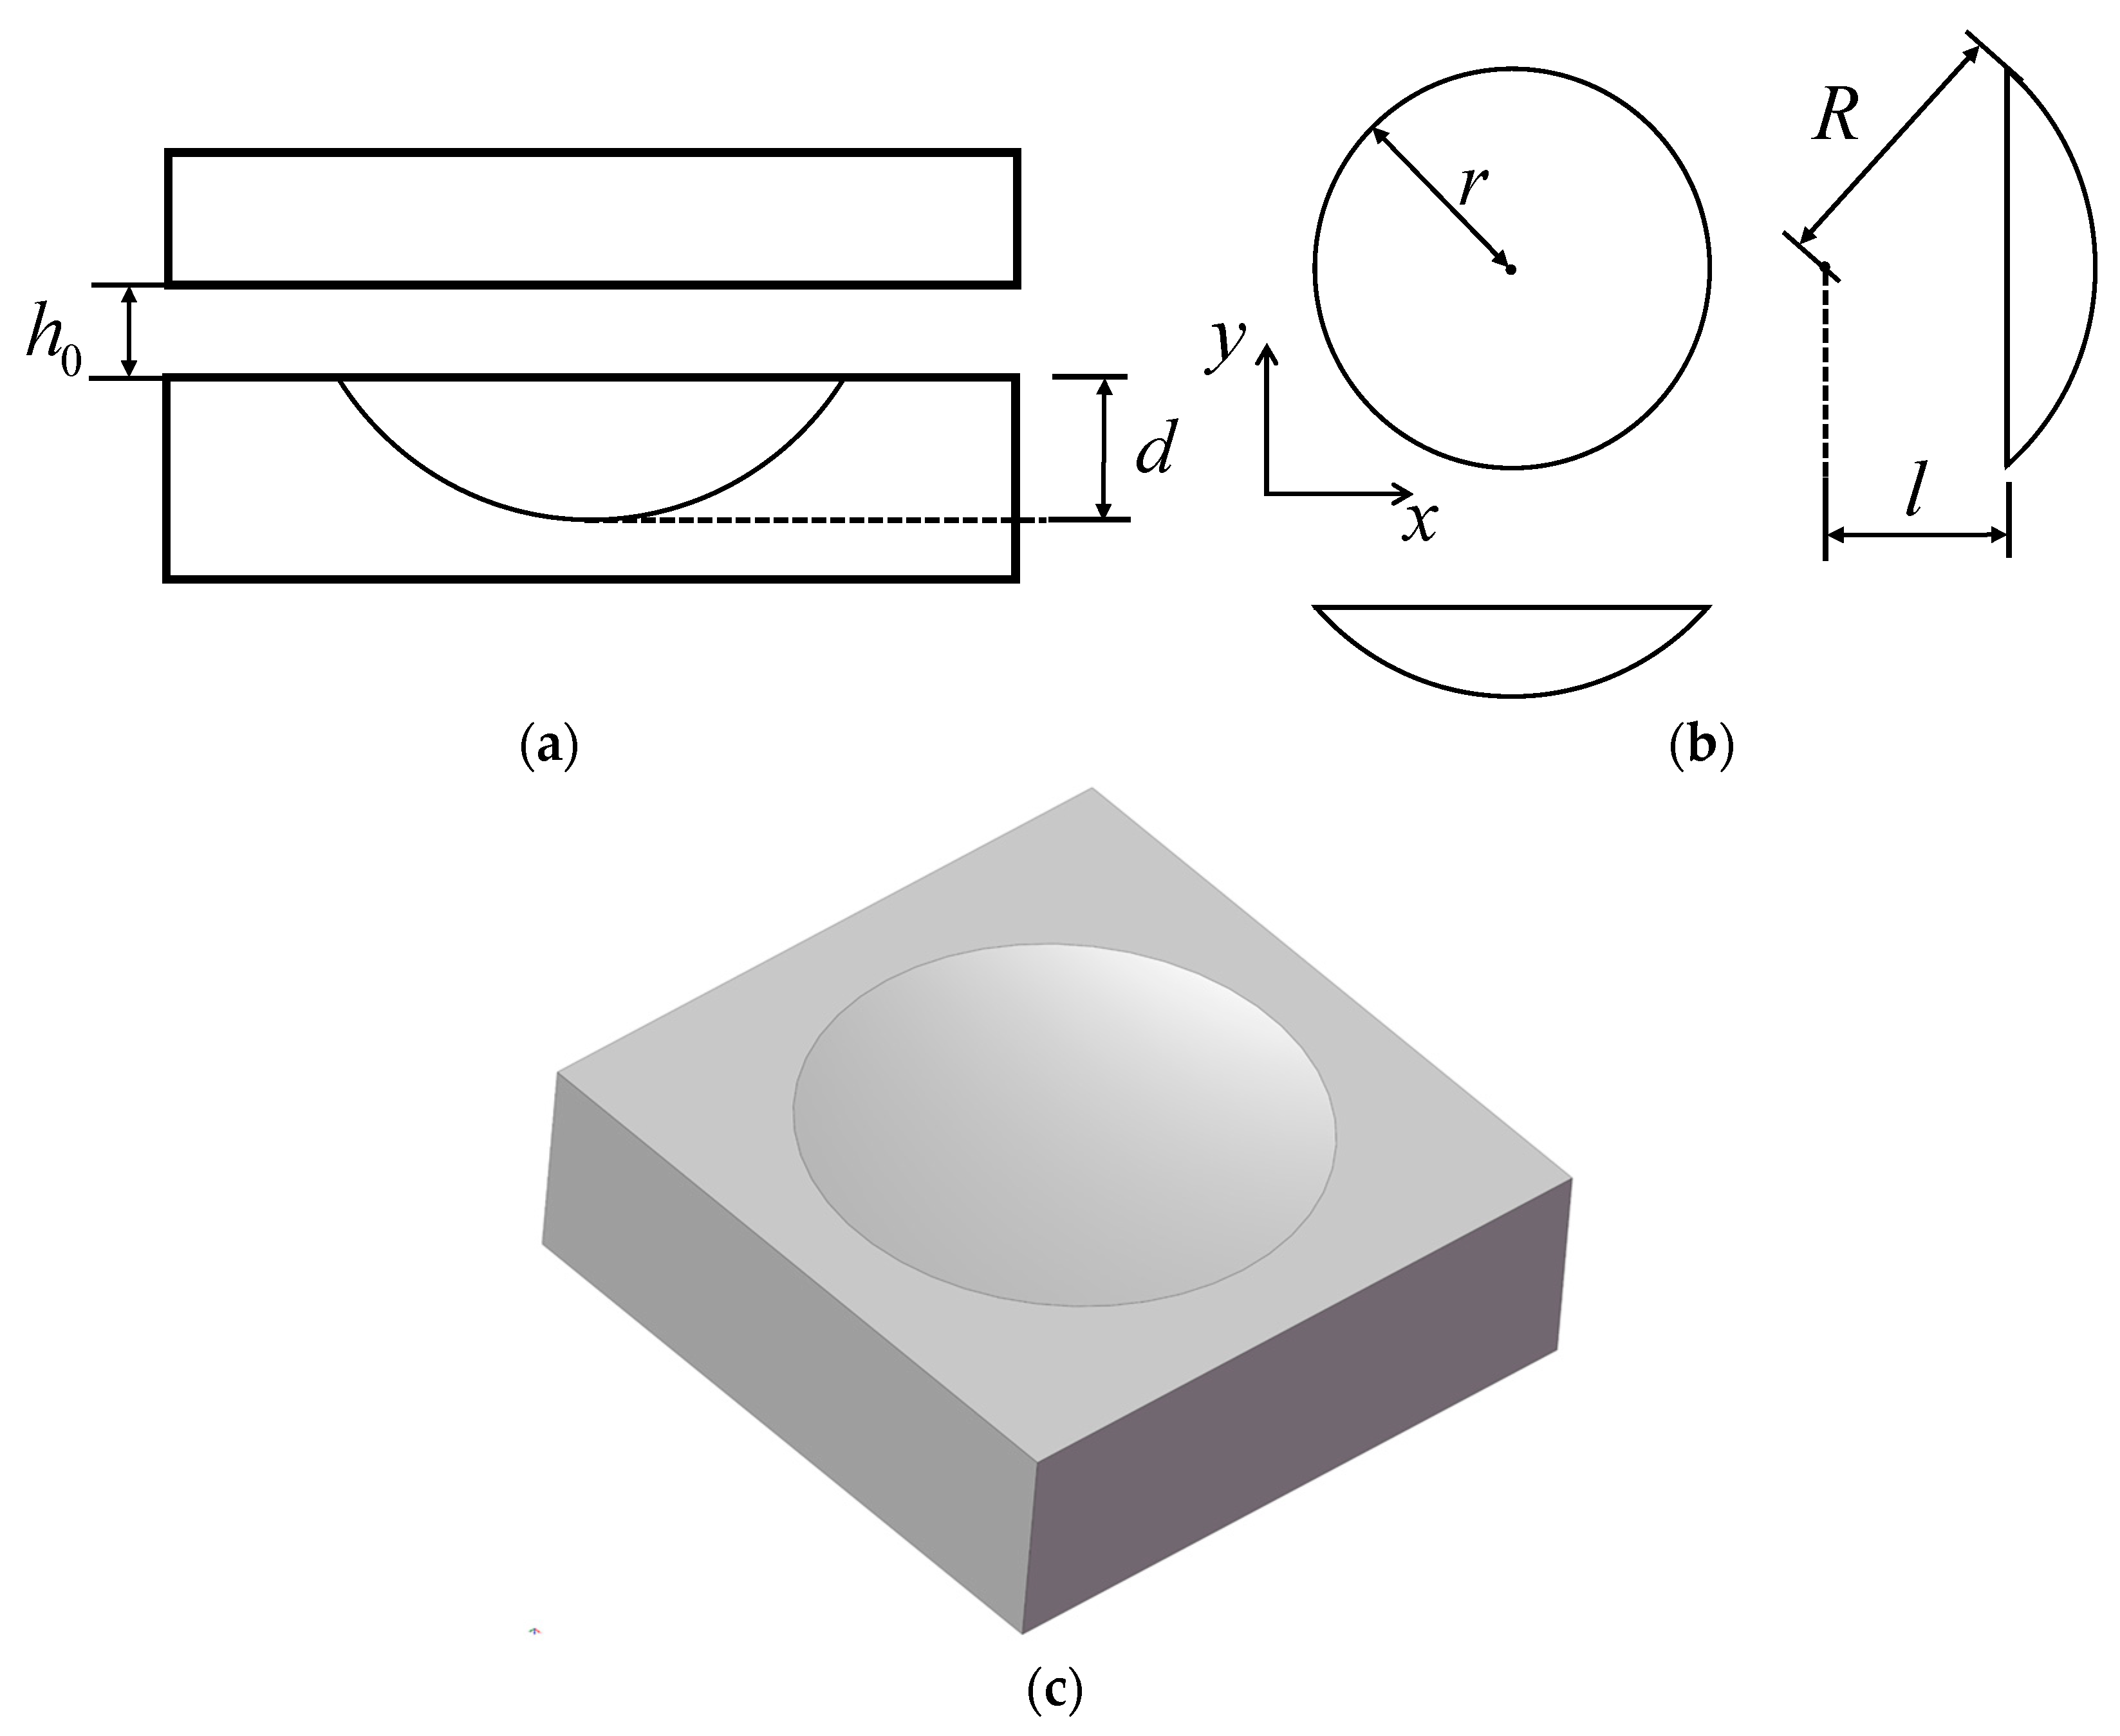
3.1. Texture Models
3.1.1. Spherical Cap
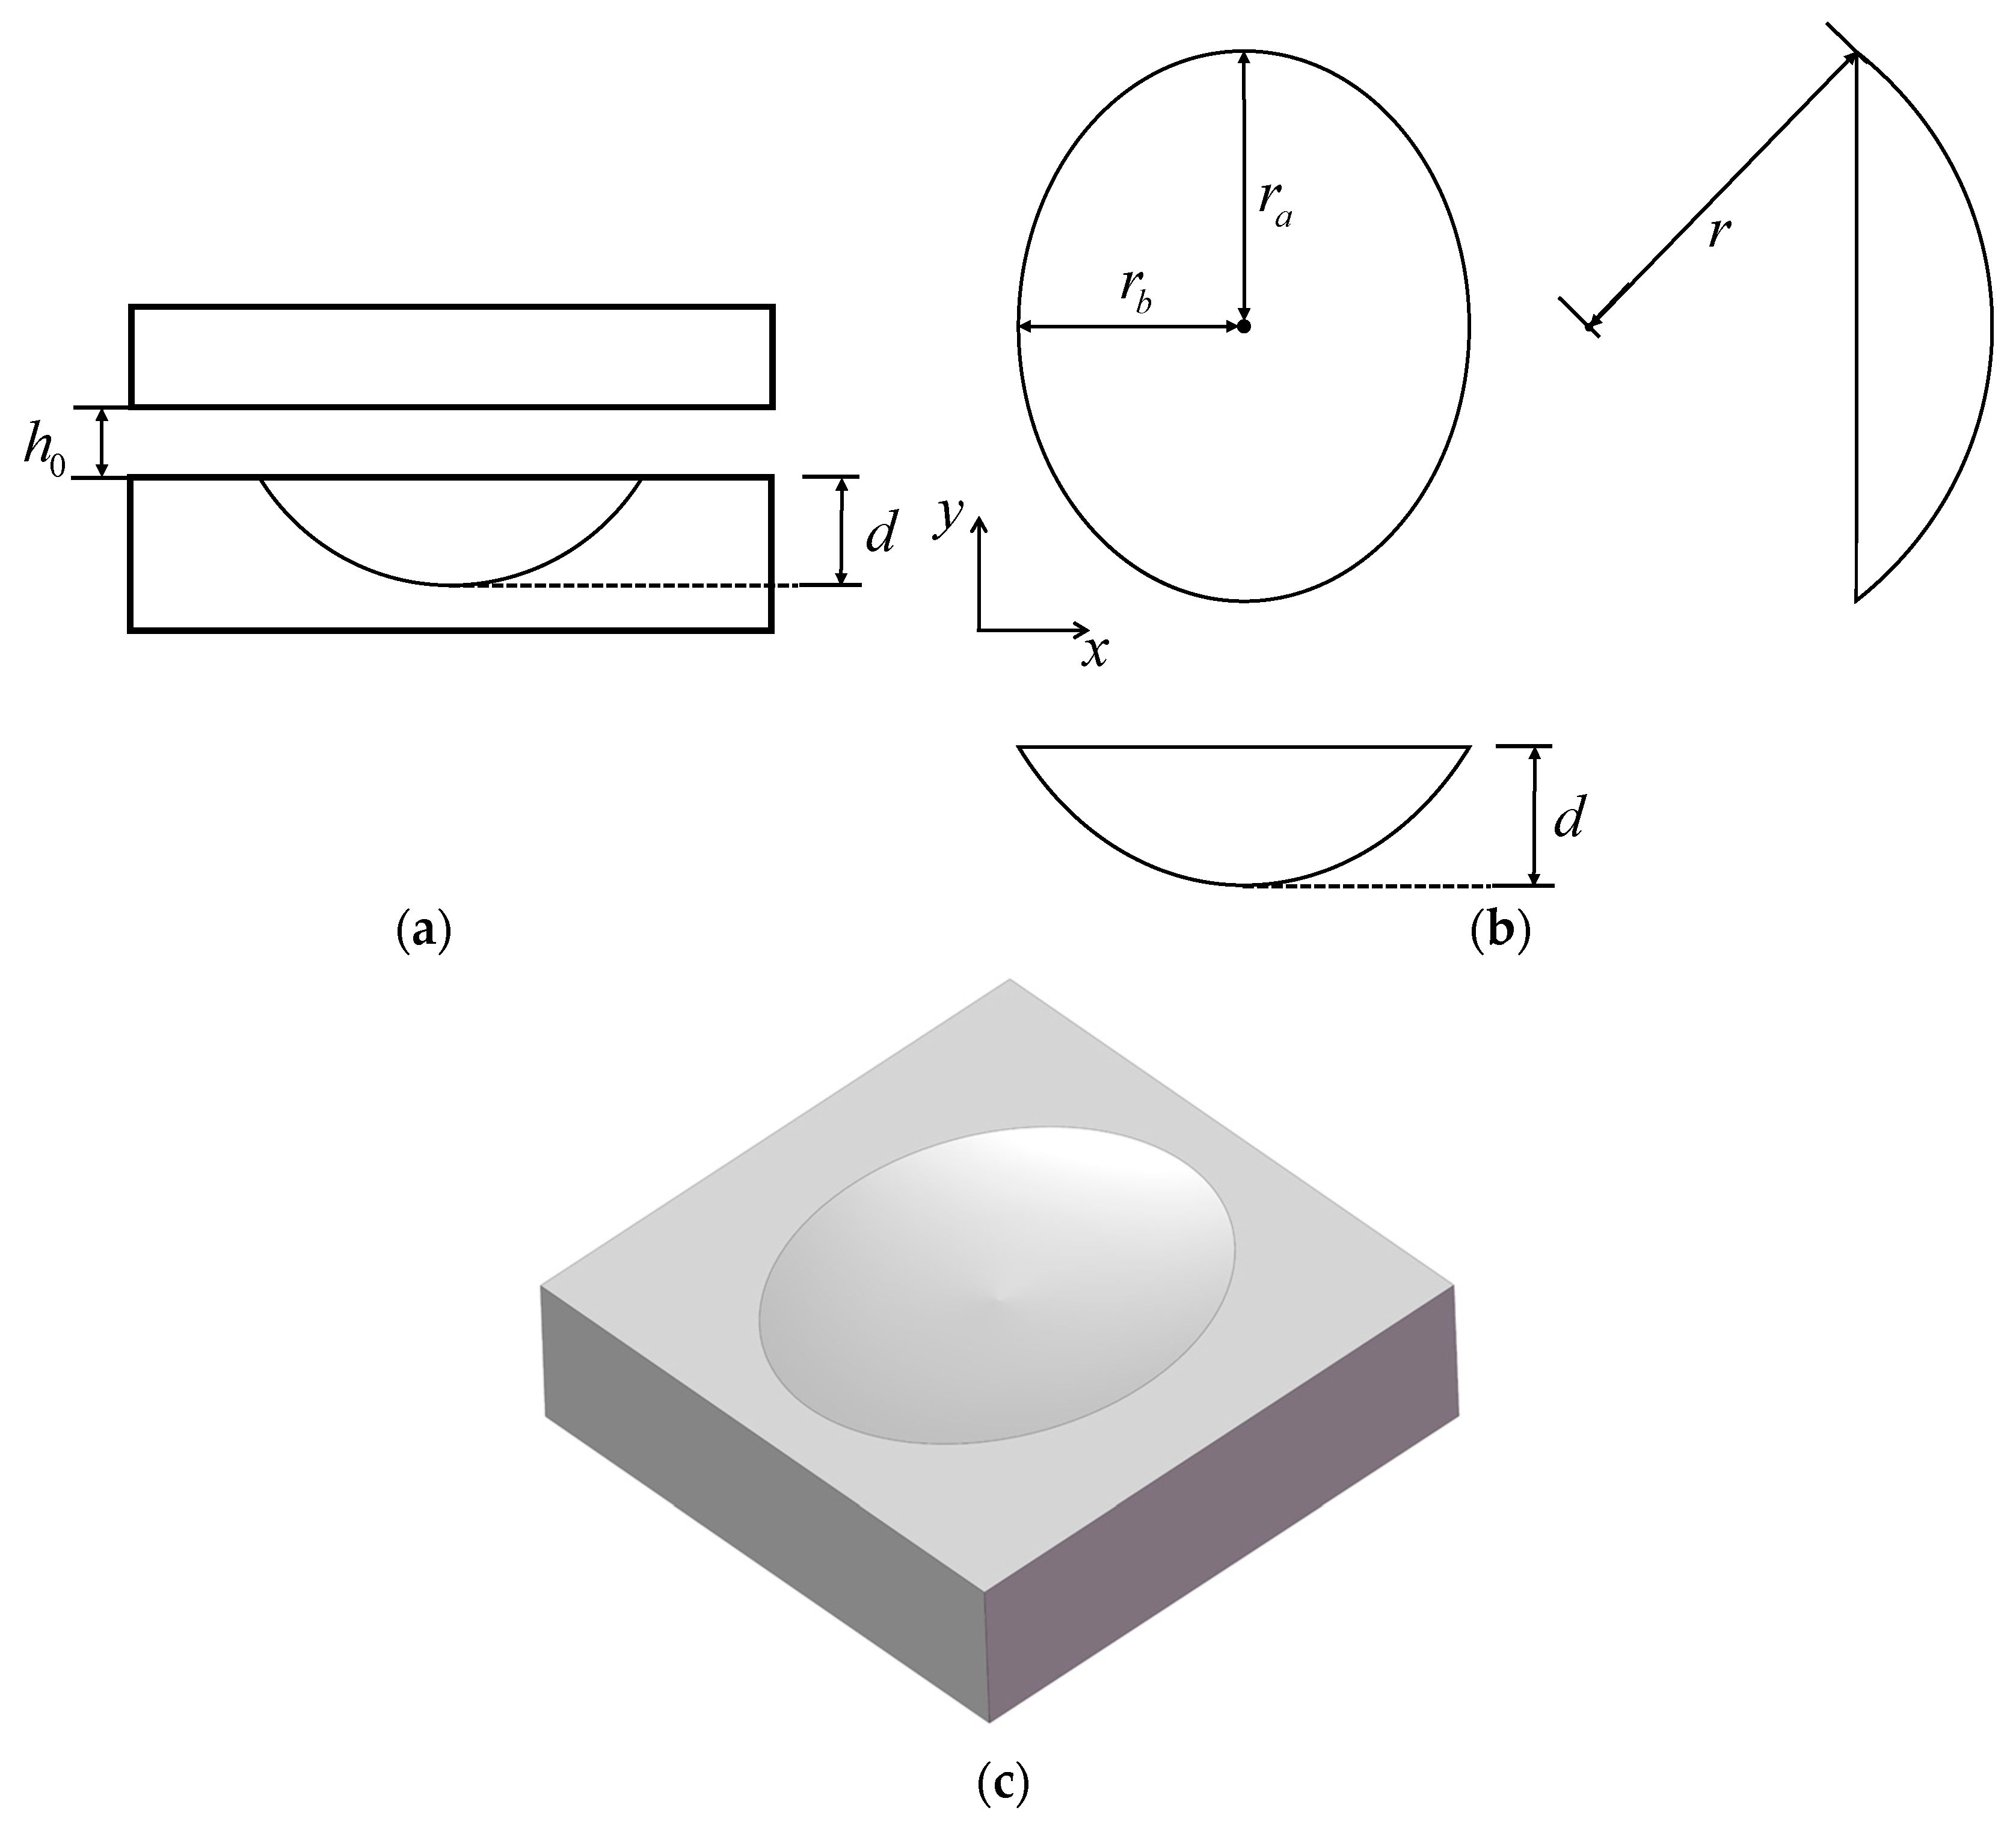
3.1.2. Ellipsoidal Cap
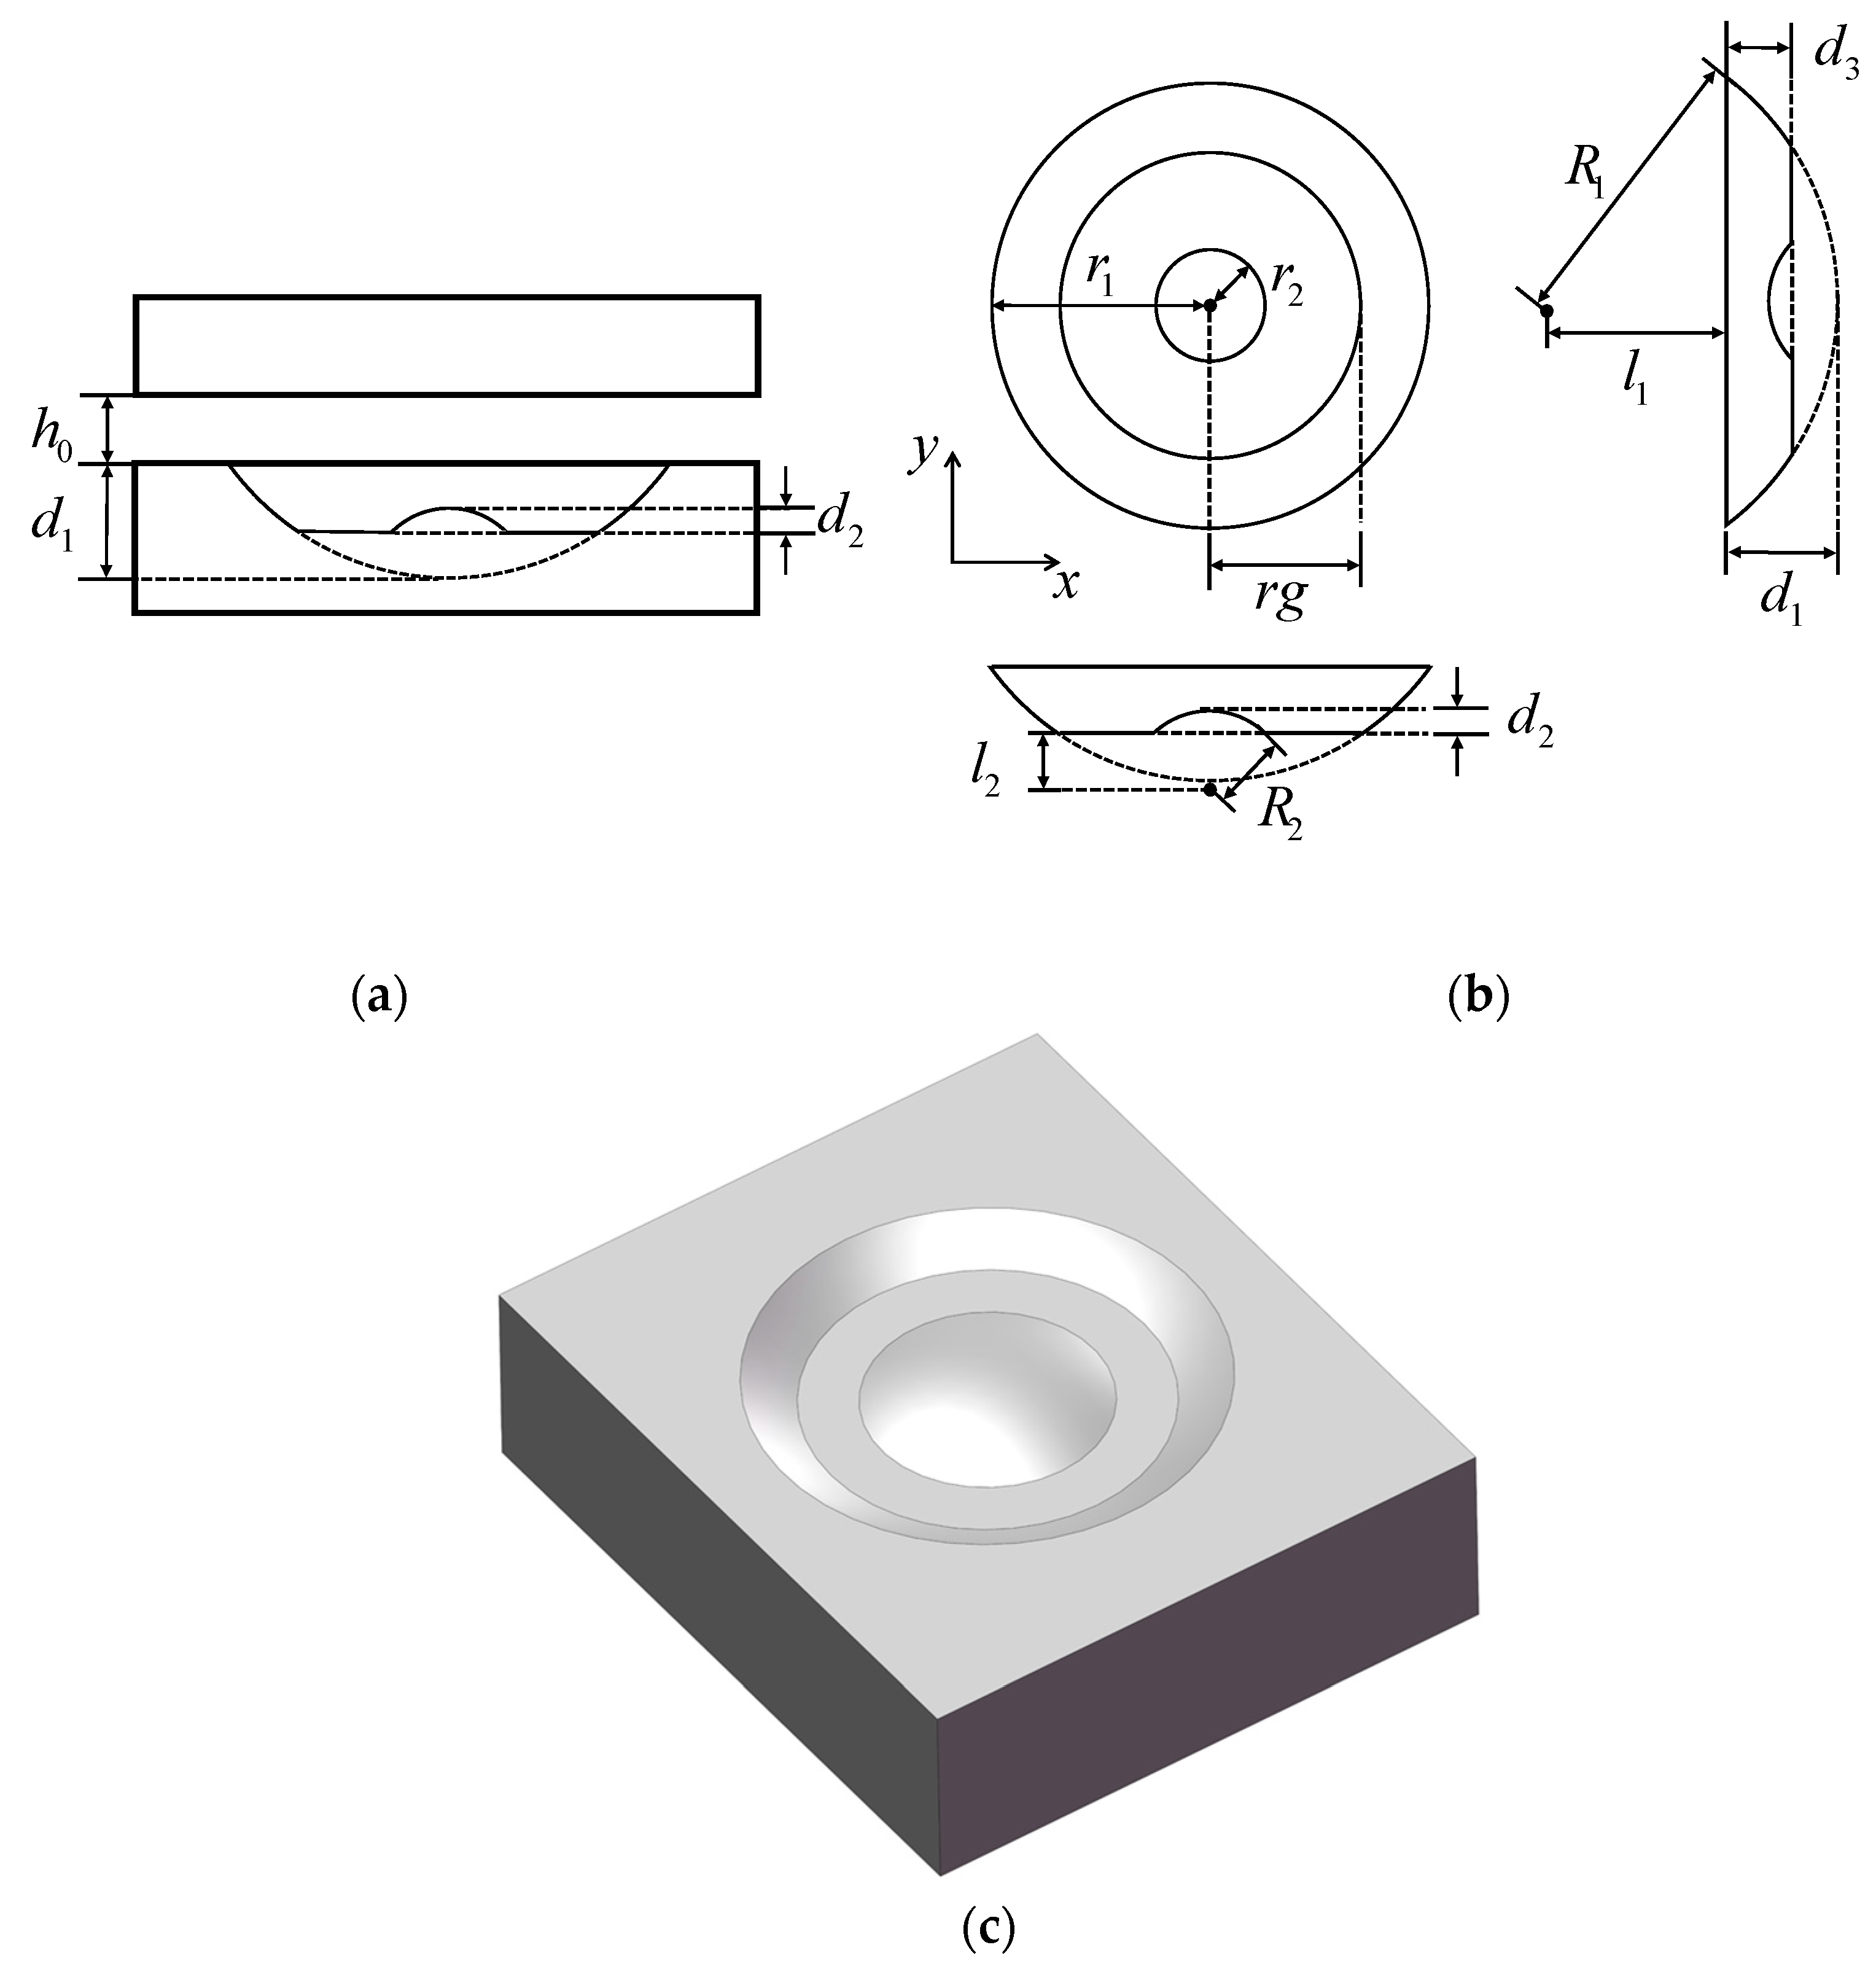
3.1.3. Double Spherical Cap
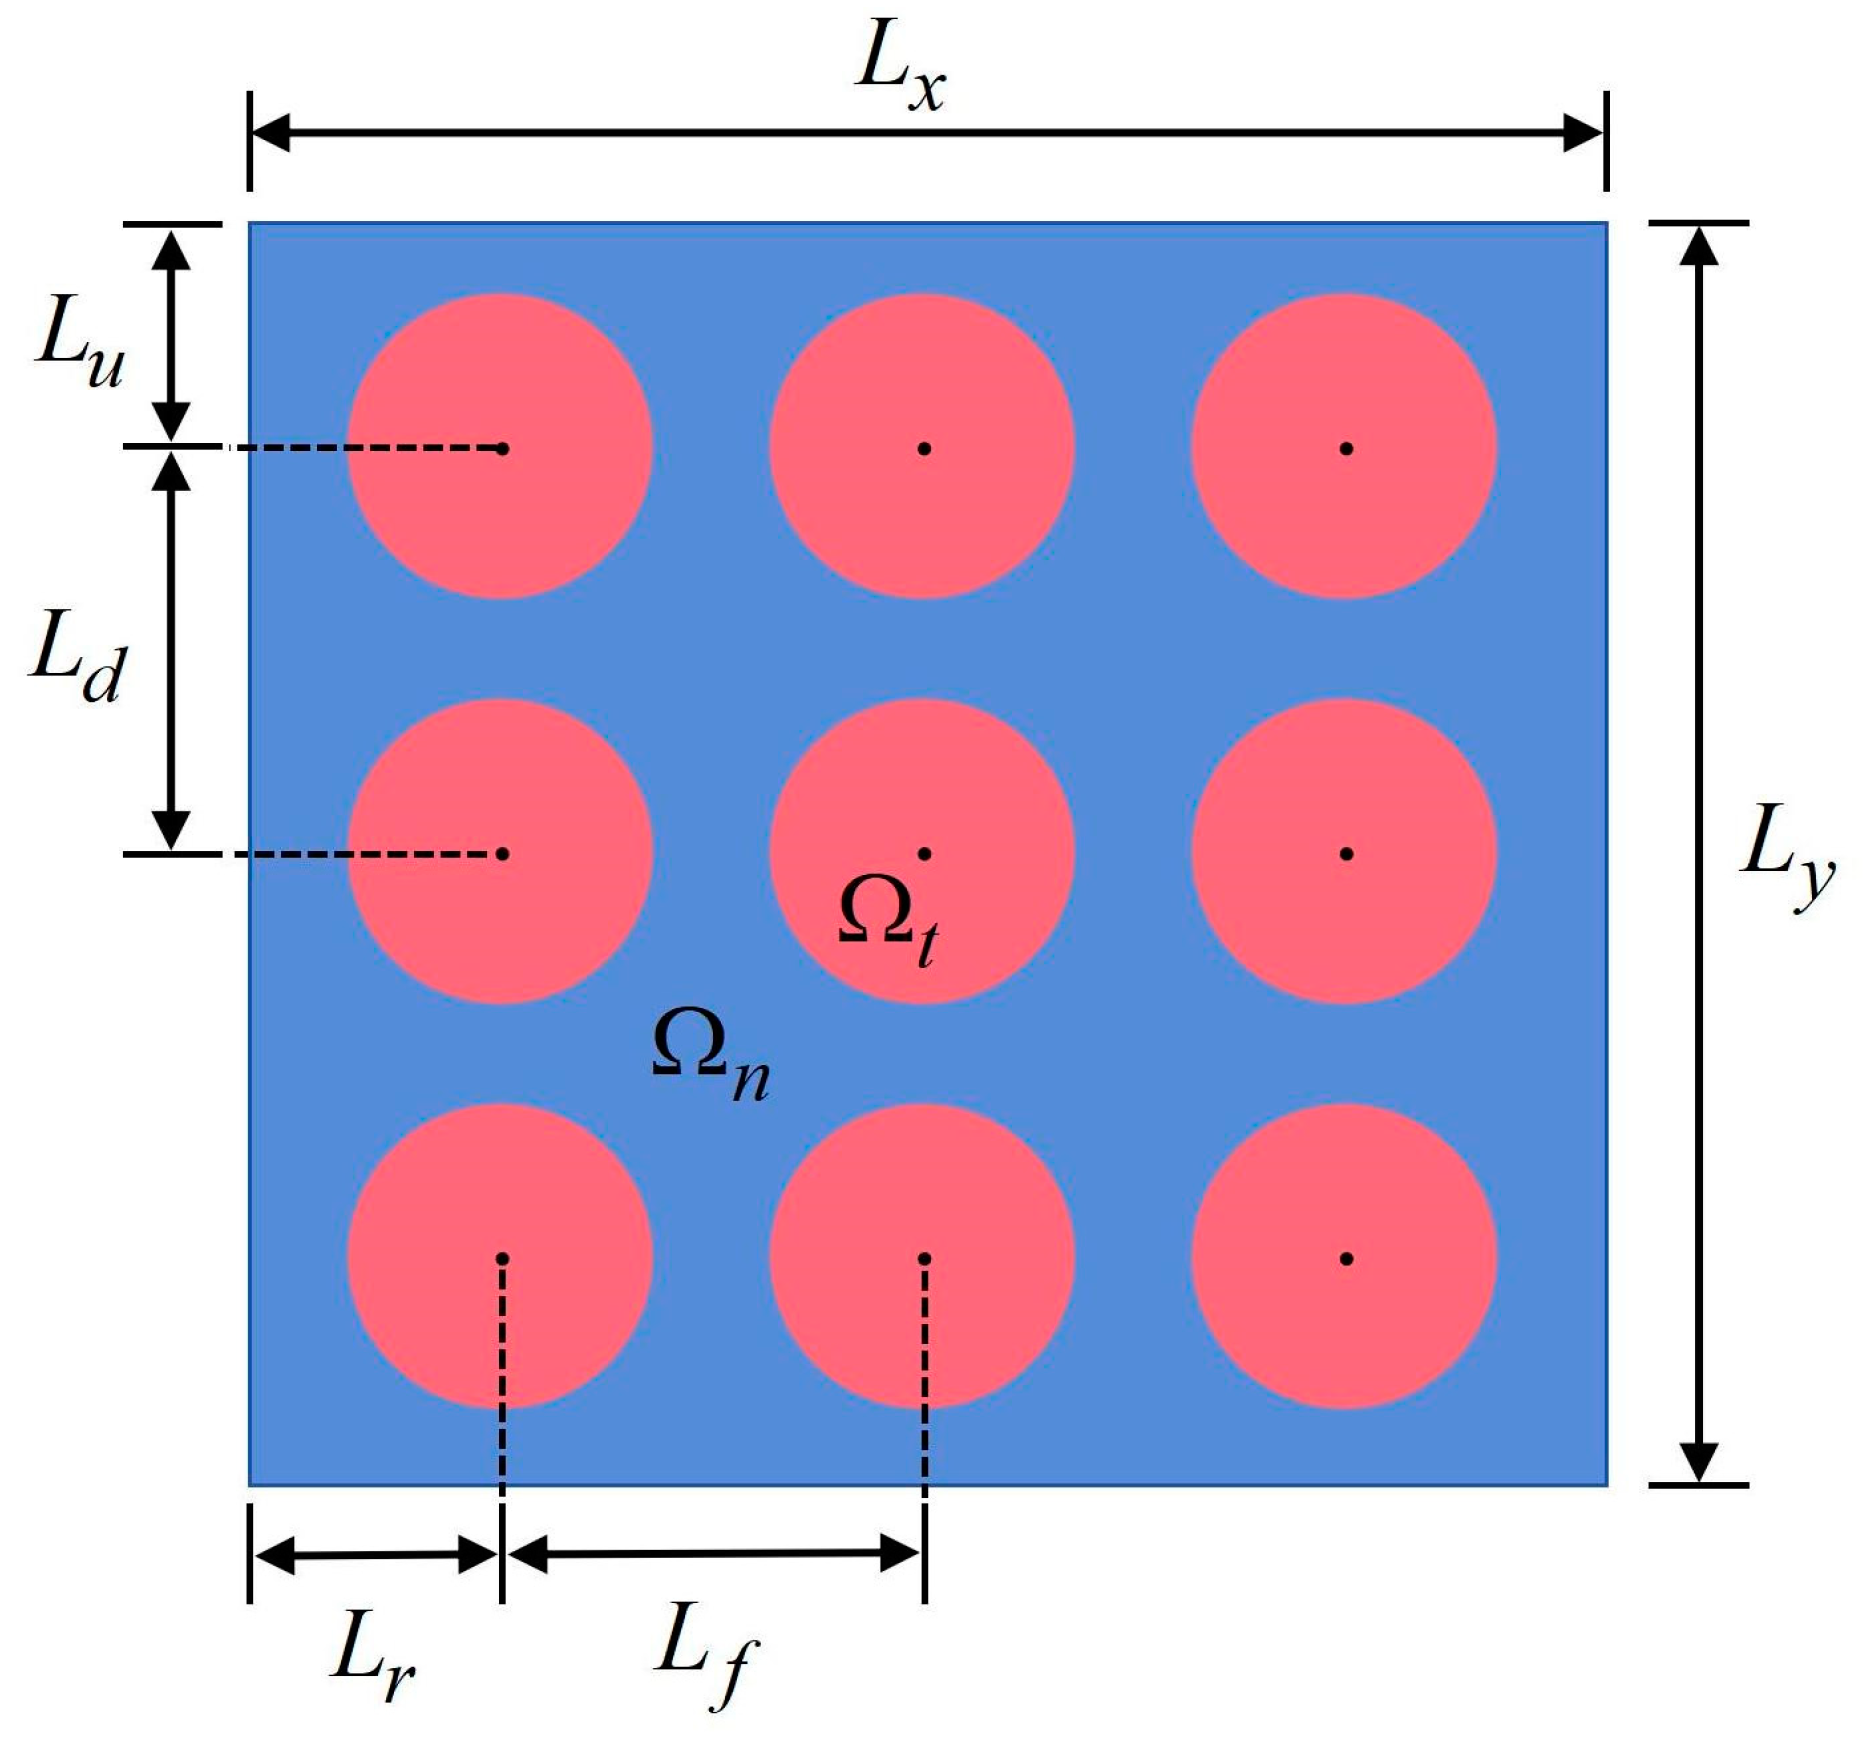
3.2. Arrangements of Numerical Simulations
4. Results and Discussion
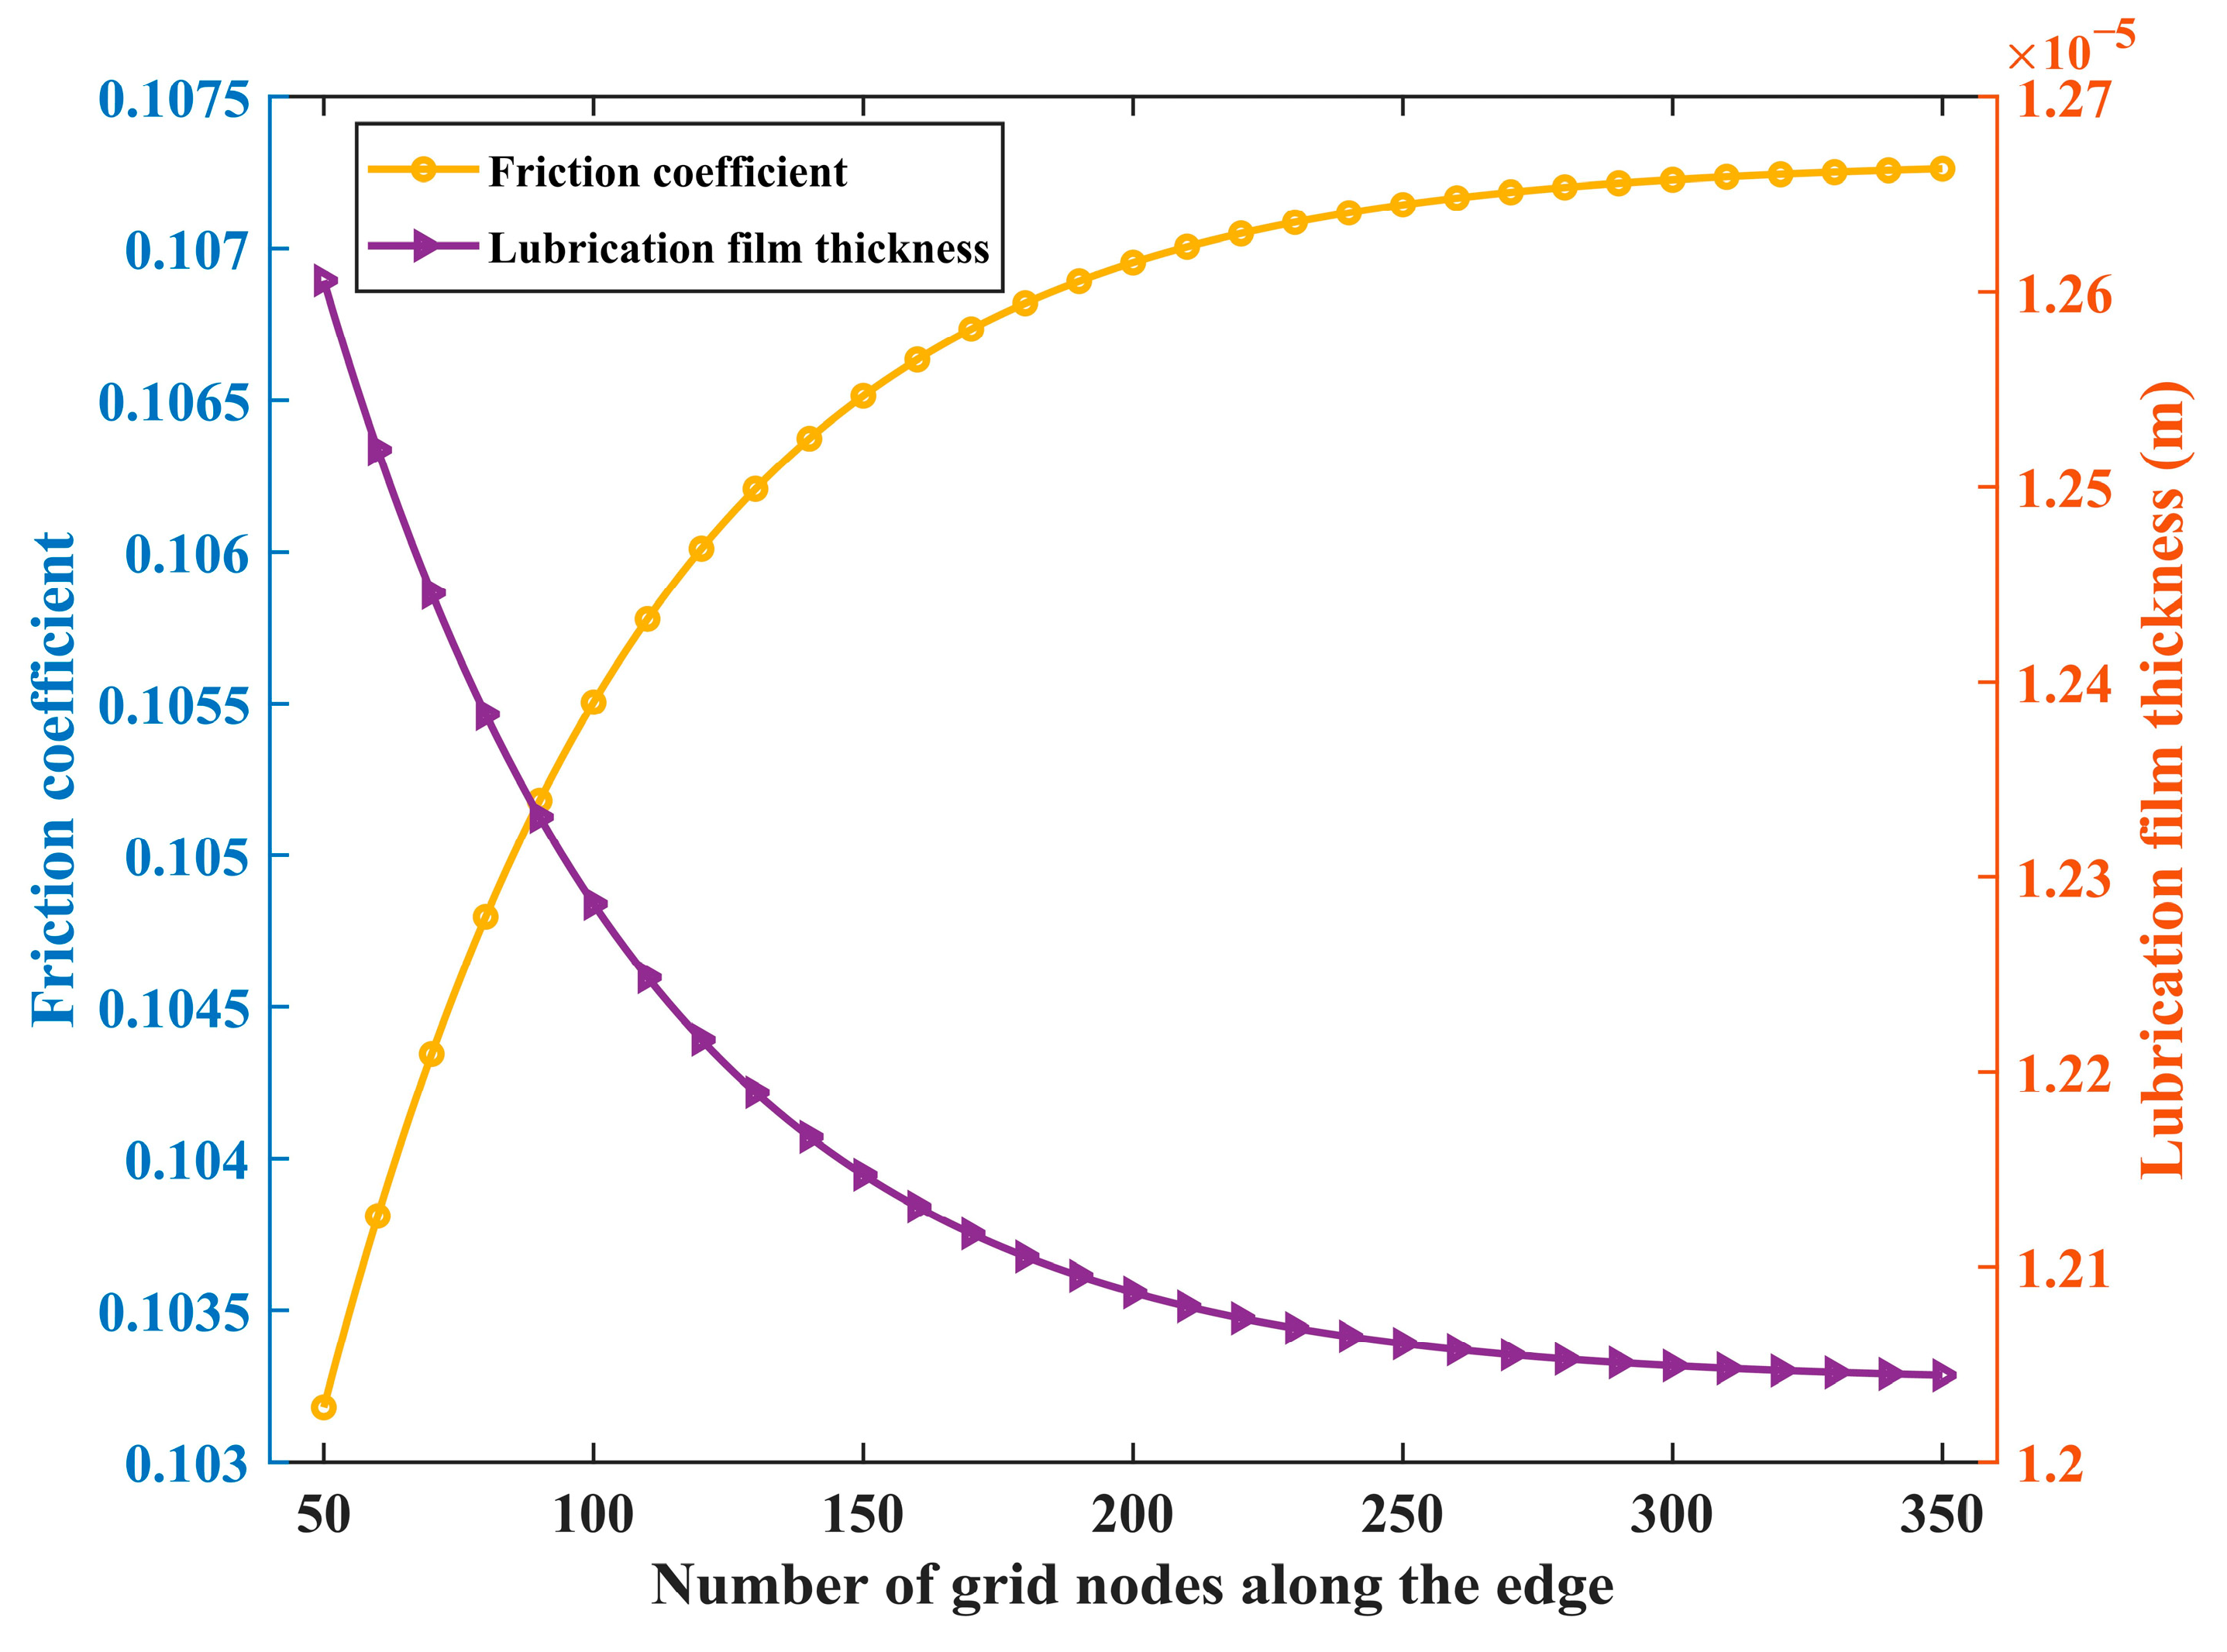
4.1. Verification of Convergence of Lubrication Model
4.2. Selection of Geometric Parameters
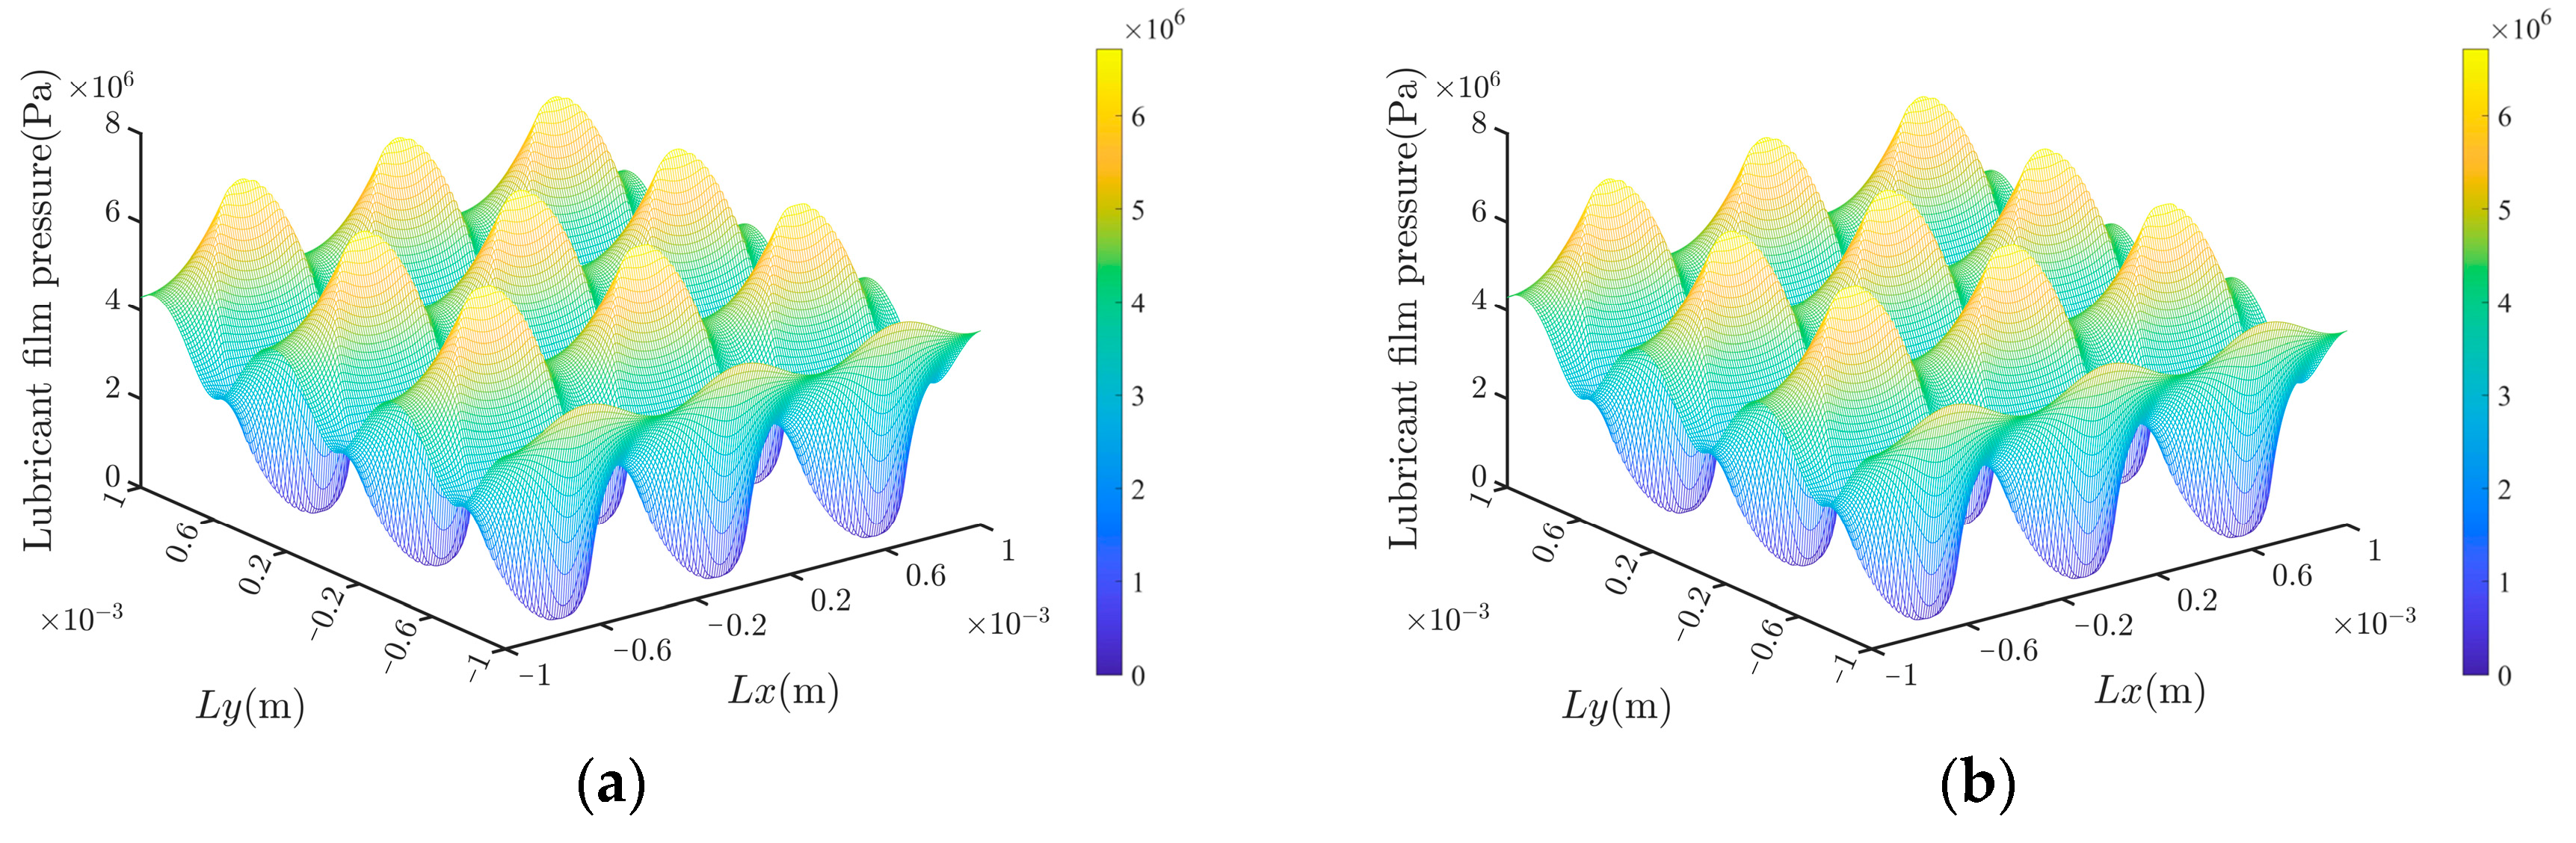
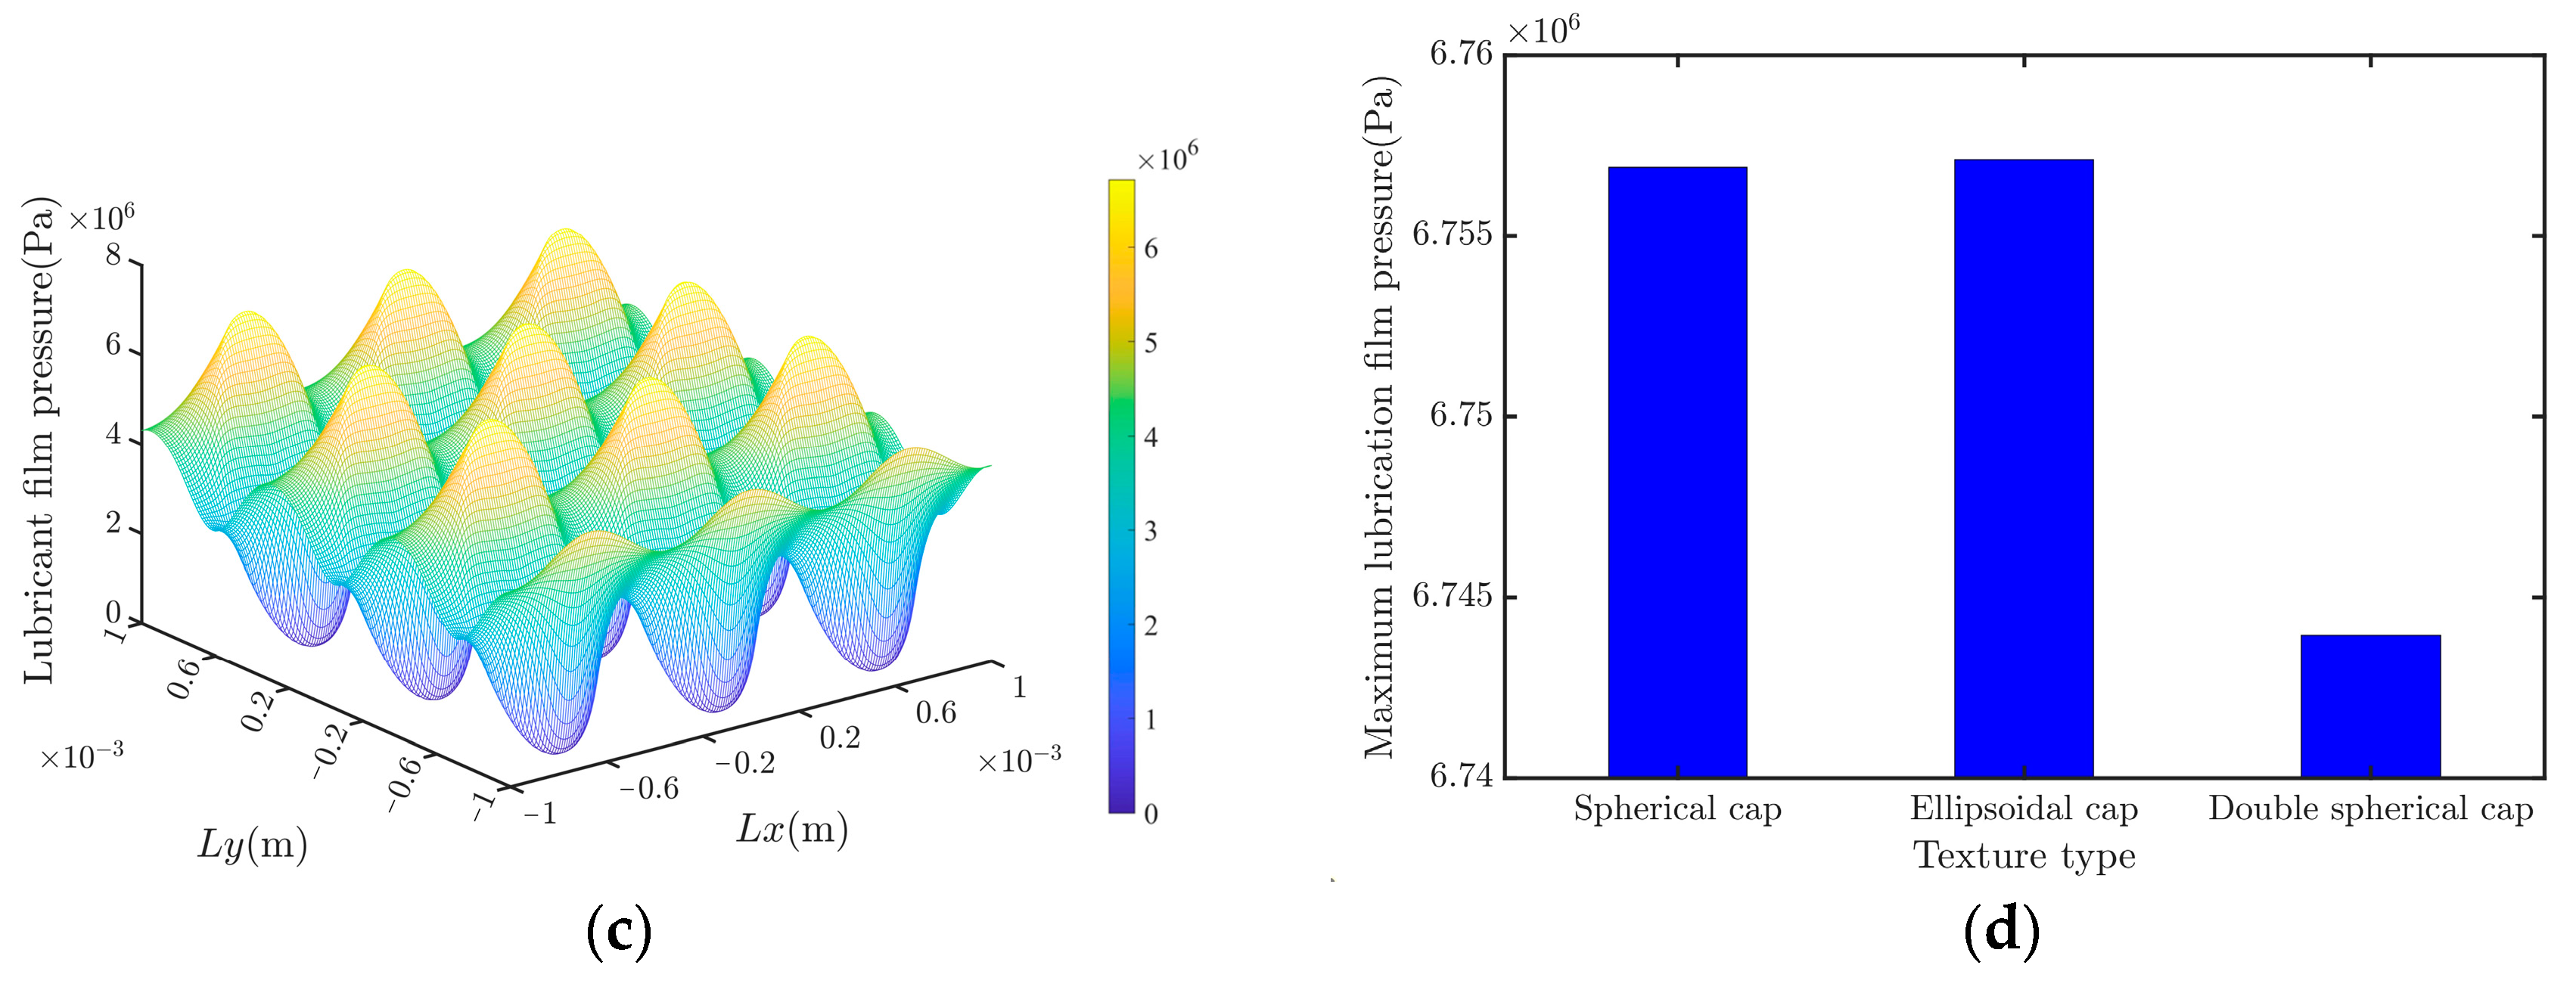
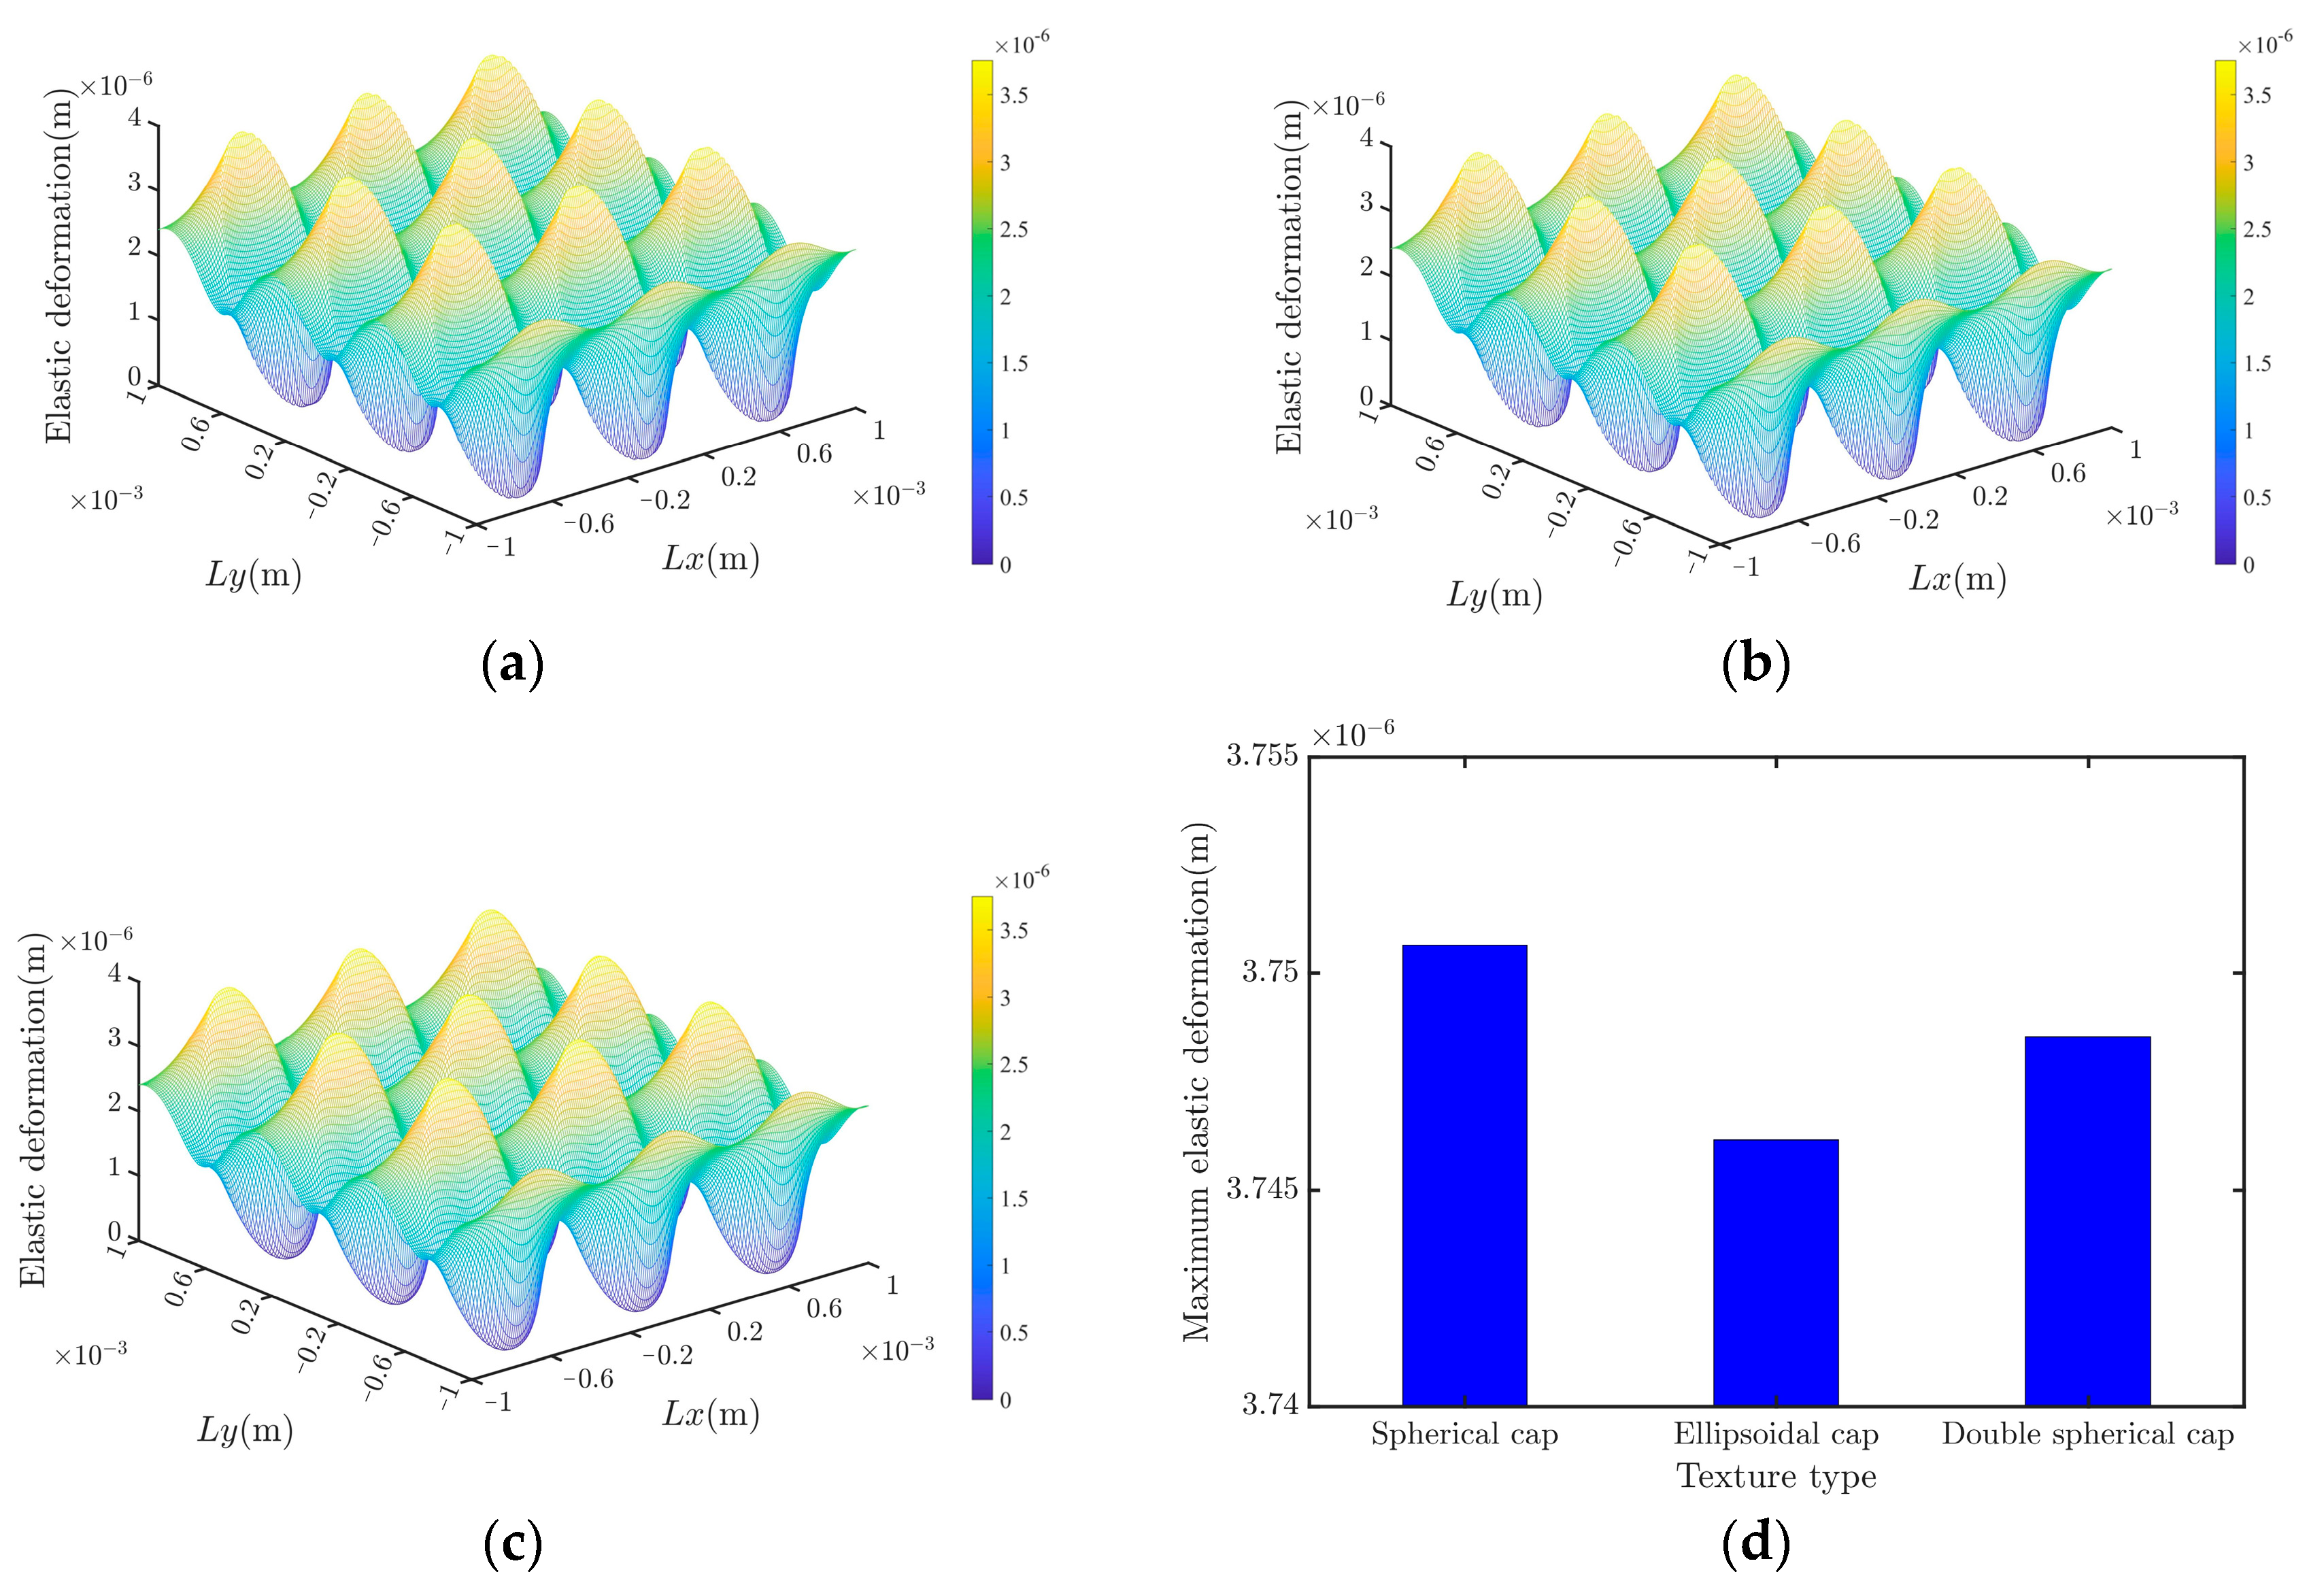
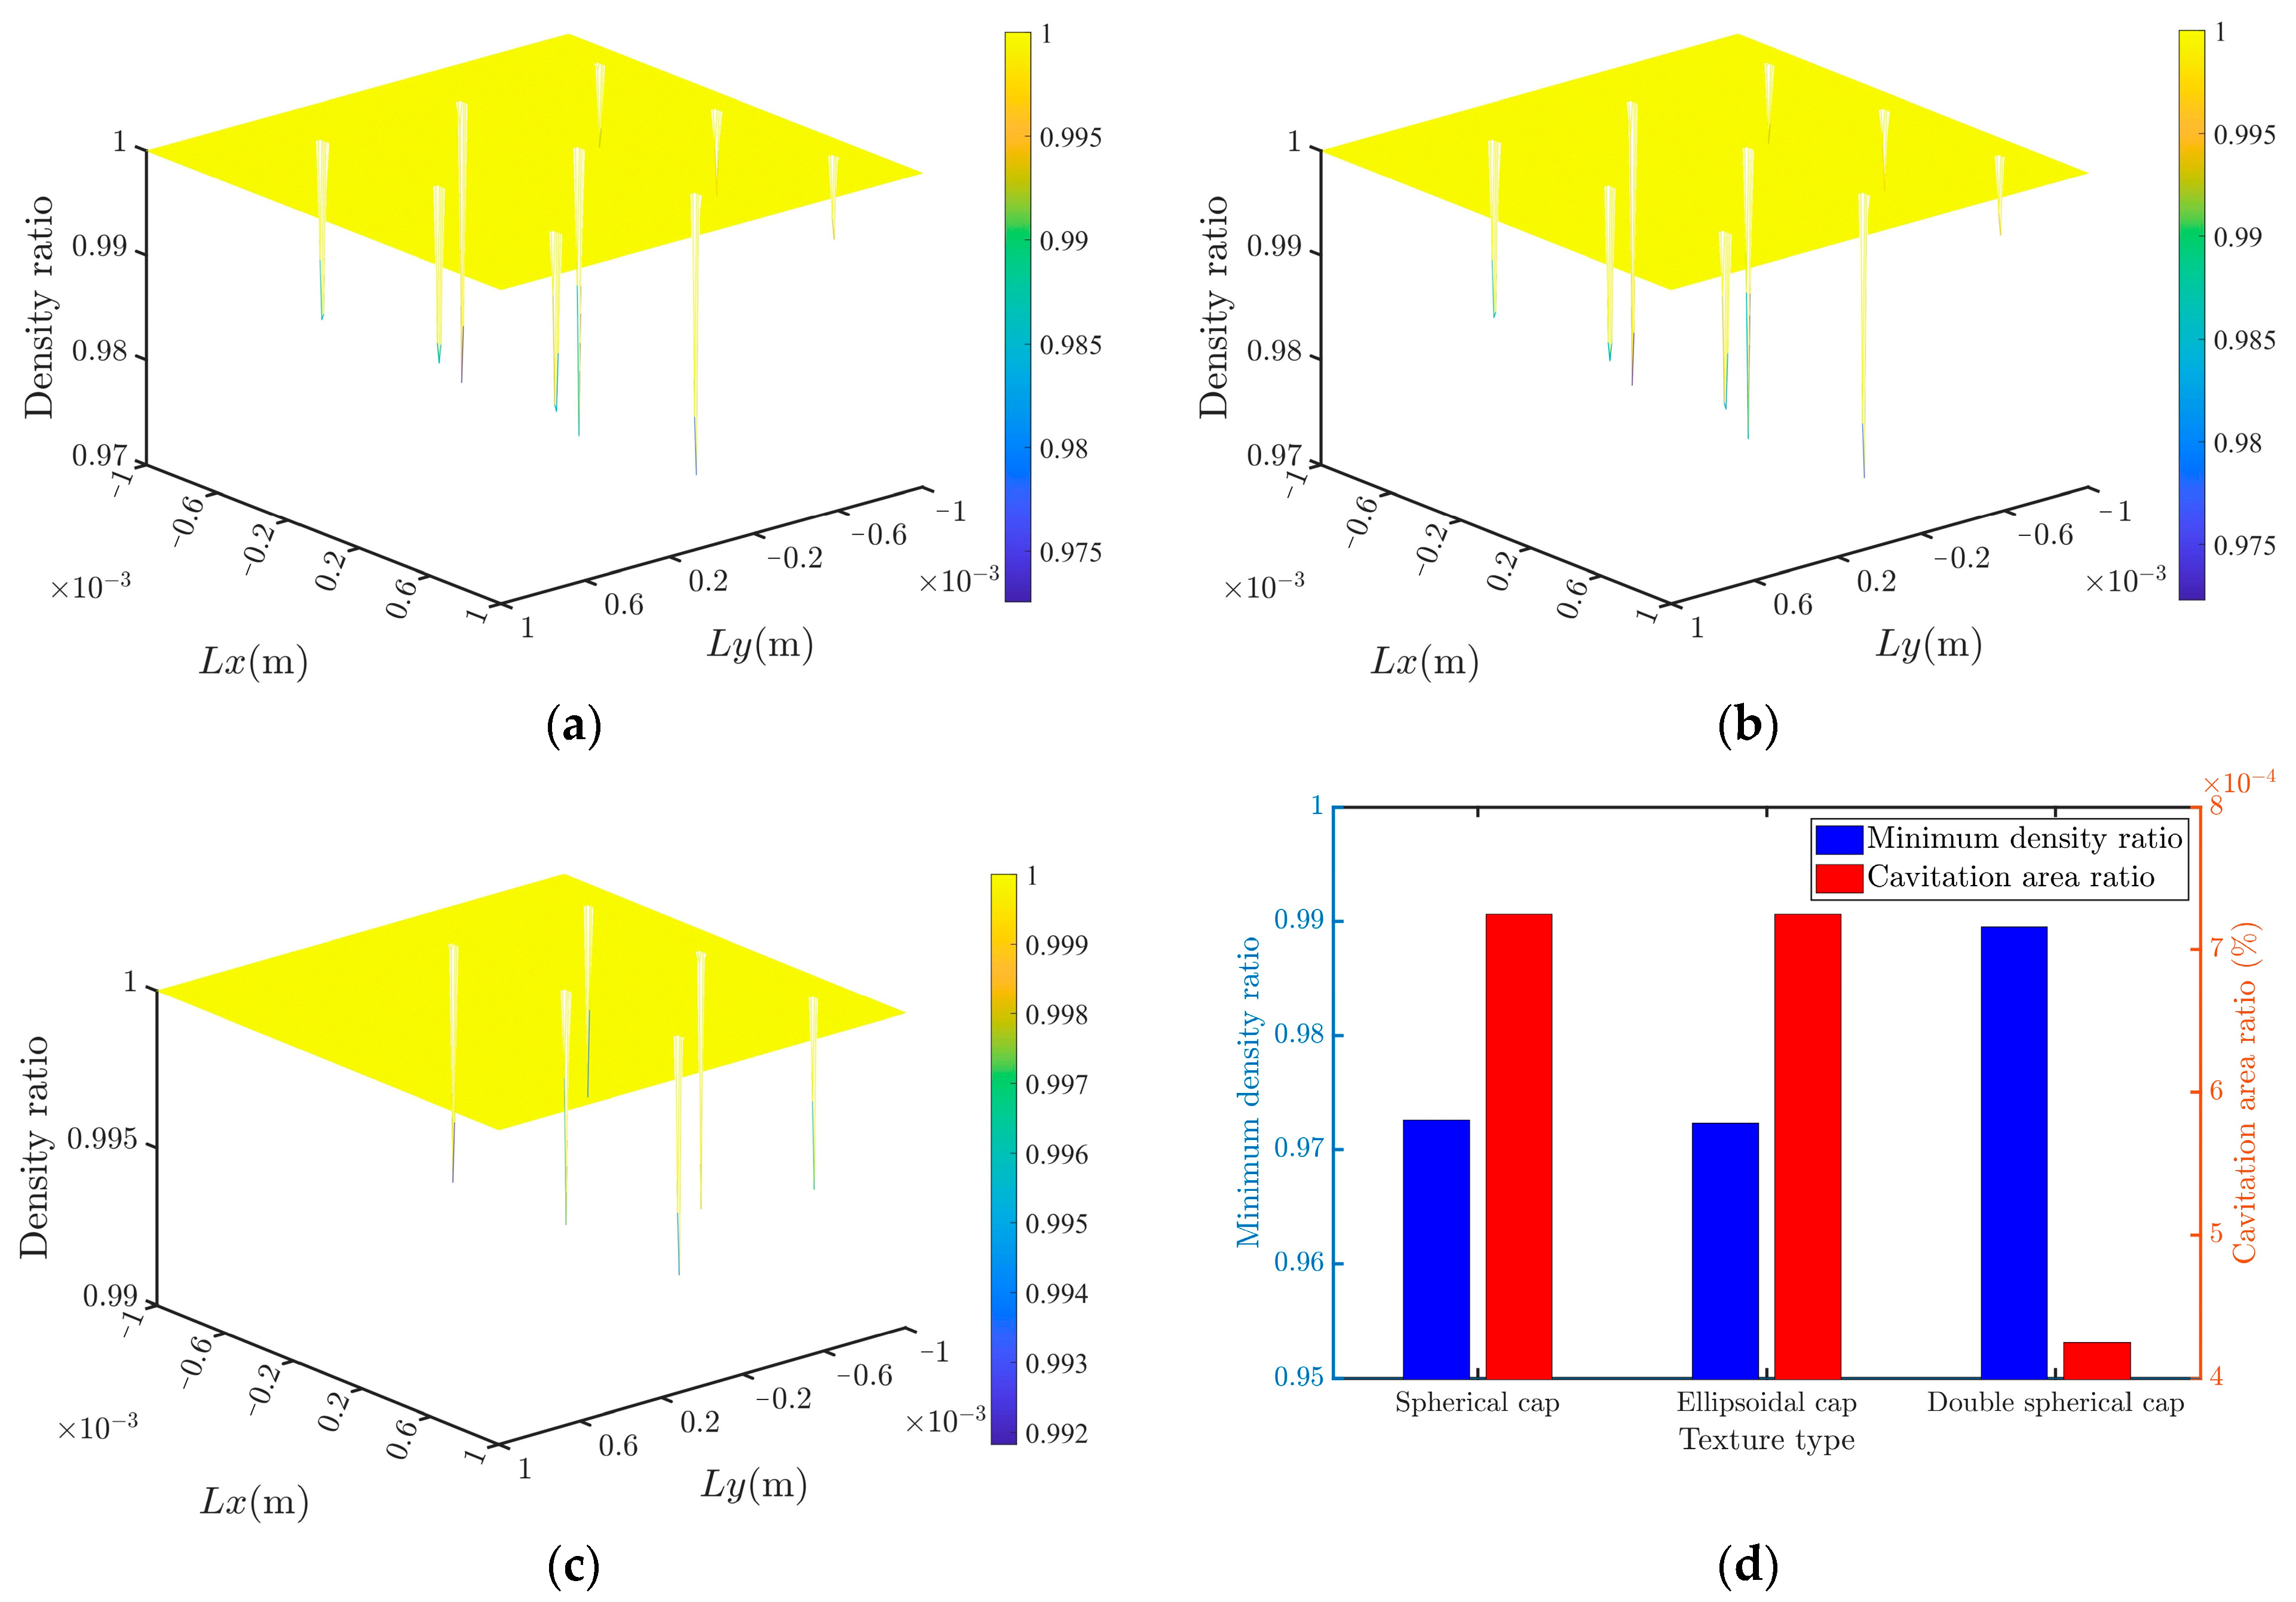
4.3. Comparison of the Rational Results of Different Textures
5. Conclusions
Author Contributions
Funding
Data Availability Statement
Conflicts of Interest
References
- GB/T 17955-2009; Spherical Bearings for Bridges. Standardization Administration of China: Beijing, China, 2009; p. 20.
- Huang, Y.; Zhao, C.; Liu, K. Research on the application of ceramic coating technology in friction pairs of bridge supports. Constr. Mach. Equip. 2024, 55, 29-35+8. [Google Scholar]
- Zhang, B. A High Stability Bridge Spherical Bearing. CN213804859U, 27 July 2021. [Google Scholar]
- Wang, L. The Tribological Property Design and Study of High-Speed Railway Bridge Isolation Spherical Bearings. Master’s Thesis, University of Jinan, Jinan, China, 2018. [Google Scholar]
- Feng, L. Design and performance analysis of steel damping and isolation bearings for railway bridge beams. Railw. Constr. Technol. 2023, 09, 51–54. [Google Scholar]
- Song, L. Research and development of a new type of seismic spherical support for rail transit. Highway 2018, 63, 76–79. [Google Scholar]
- Zhang, H.; Liu, Y.; Wang, W.; Qin, L.; Dong, G. Surface texture design and its tribological application. J. Mech. Eng. 2019, 55, 85–93. [Google Scholar]
- Dykha, O.; Dytyniuk, V.; Kovtun, O.; Fasolia, V.; Hetman, M. Improving the wear resistance of guides: Tribological analysis, surface texture and lubricants. Probl. Tribol. 2025, 30, 51–59. [Google Scholar] [CrossRef]
- Greiner, C.; Merz, T.; Braun, D.; Codrignani, A.; Magagnato, F. Optimum dimple diameter for friction reduction with laser surface texturing: The effect of velocity gradient. Surf. Topogr. Metrol. Prop. 2015, 3, 044001. [Google Scholar] [CrossRef]
- Chen, X.; Huang, Y.; Rong, Y.; Wu, C. Two-step laser processing of micro/nano-composite structures on PS-SiC surfaces for superior friction performance under water-lubrication. Ceram. Int. 2025. [Google Scholar] [CrossRef]
- Nakanishi, Y.; Fujiwara, Y.; Nakashima, Y.; Komohara, Y.; Hino, K.; Miura, H.; Higaki, H. Effects of Counterface Surface Texturing on Wear Behaviour of Ultra-High Molecular Weight Polyethylene Used in Artificial Joints. Tribol. Int. 2025, 207, 110638. [Google Scholar] [CrossRef]
- Lu, P.; Wood, R.J.; Gee, M.G.; Wang, L.; Pfleging, W. The friction reducing effect of square-shaped surface textures under lubricated line-contacts—An experimental study. Lubricants 2016, 4, 26. [Google Scholar] [CrossRef]
- Annadi, R.R.; Syed, I. Impact of multi-scaled surface textures on tribological performance of parallel sliding contact under lubricated condition. Tribol. Int. 2023, 183, 108415. [Google Scholar] [CrossRef]
- Guo, J.; Li, C.; Du, Q.; Liu, Y. Fabrication of superhydrophobic AlCrN coatings and their tribological properties under dry and starved lubrication conditions. Vacuum 2025, 238, 114276. [Google Scholar] [CrossRef]
- Liu, C.; Liu, C.; Hu, X.; Yuan, W. The effect of bionic scallop microtexture protrusions on the tribological performance of shot-peened 65Mn steel plow surface. Ind. Lubr. Tribol. 2025. [Google Scholar] [CrossRef]
- Gropper, D.; Wang, L.; Harvey, T.J. Hydrodynamic lubrication of textured surfaces: A review of modeling techniques and key findings. Tribol. Int. 2016, 94, 509–529. [Google Scholar] [CrossRef]
- Kovalchenko, A.; Ajayi, O.; Erdemir, A.; Fenske, G.; Etsion, I. The effect of laser texturing of steel surfaces and speed-load parameters on the transition of lubrication regime from boundary to hydrodynamic. Tribol. Trans. 2004, 47, 299–307. [Google Scholar] [CrossRef]
- Xie, Y.; Li, Y.; Wang, Y.; Suo, S.; Liu, X. An experimental investigation of tribological performance of triangular textures in water lubrication regime. Sci. China Phys. Mech. Astron. 2014, 57, 273–279. [Google Scholar] [CrossRef]
- Li, P.; Pei, Q.; Liu, Z.; Luo, S.; Zhou, L.; Li, J.; Chen, L. Parametric Optimization of Surface Textures in Oil-Lubricated Long-Life Aircraft Valves. Lubricants 2024, 12, 405. [Google Scholar] [CrossRef]
- Wang, Z.; Hu, S.; Zhang, H.; Ji, H.; Yang, J.; Liang, W. Effect of surface texturing parameters on the lubrication characteristics of an axial piston pump valve plate. Lubricants 2018, 6, 49. [Google Scholar] [CrossRef]
- Qiu, M.; Delic, A.; Raeymaekers, B. The effect of texture shape on the load-carrying capacity of gas-lubricated parallel slider bearings. Tribol. Lett. 2012, 48, 315–327. [Google Scholar] [CrossRef]
- Hu, S.; Zheng, L.; Guo, Q.; Ren, L. Influence of Cross-Grooved Texture Shape on Tribological Performance under Mixed Lubrication. Coatings 2022, 12, 305. [Google Scholar] [CrossRef]
- Shen, C.; Khonsari, M. Numerical optimization of texture shape for parallel surfaces under unidirectional and bidirectional sliding. Tribol. Int. 2015, 82, 1–11. [Google Scholar] [CrossRef]
- Shen, J.; Zhang, T.; Xu, J.; Liu, X.; Liu, K. Experimental study on friction coefficient and temperature rise of heavy-load grease-lubricated spherical plain bearings with surface texture. Ind. Lubr. Tribol. 2021, 73, 536–542. [Google Scholar] [CrossRef]
- Dang, G.; Zheng, C.; Xiong, C.; Ma, B.; Chen, M.; Luo, D. Influences of Surface Texture on the Friction Characteristics of Powder Metallurgy Clutch Disks. Tribol. Trans. 2024, 67, 857–874. [Google Scholar] [CrossRef]
- Tang, L.; Liu, Y. Influence of surface micro-texture on the tribological properties of heavy-duty gears. J. Tsinghua Univ. (Nat. Sci. Ed.) 2010, 50, 1009–1012. [Google Scholar]
- Liu, Y.; Zhang, H.; Dong, G. A Design of Partial Textured Surface on Gear Washers for Reducing Friction and Wear under Low Speed and Heavy Load Conditions. Materials 2021, 14, 4666. [Google Scholar] [CrossRef] [PubMed]
- Dong, B.; Liu, X.; Wang, J.; Liu, K. Effect of textured surface on the frictional property of 40Cr steel under high load and line contact. Tribology 2016, 36, 145–152. [Google Scholar]
- Marcus, B. Friction in Elastohydrodynamic Lubrication. Doctoral Dissertation, Luleå Tekniska Universitet, Luleå, Sweden, 2014. [Google Scholar]
- Wang, L.; Wang, W.; Wang, H.; Ma, T.; Hu, Y. Numerical analysis on the factors affecting the hydrodynamic performance for the parallel surfaces with microtextures. J. Tribol. 2014, 136, 021702. [Google Scholar] [CrossRef]
- Zhang, K.; Yagi, K. Refined Hydrodynamic Lubrication Model with a High-Accuracy Numerical Algorithm for Starved Lubrication with Free Surfaces. Tribol. Lett. 2023, 71, 122. [Google Scholar] [CrossRef]
- Lian, H.; Li, X.; Qu, Y.; Du, J.; Meng, Z.; Liu, J.; Chen, L. Bayesian uncertainty analysis for underwater 3D reconstruction with neural radiance fields. Appl. Math. Model. 2025, 138, 115806. [Google Scholar] [CrossRef]
- Chen, L.; Huo, R.; Lian, H.; Yu, B.; Zhang, M.; Natarajan, S.; Bordas, S.P.A. Uncertainty quantification of 3D acoustic shape sensitivities with generalized nth-order perturbation boundary element methods. Comput. Methods Appl. Mech. Eng. 2025, 433, 117464. [Google Scholar] [CrossRef]
- Chen, L.; Liu, C.; Lian, H.; Gu, W. Electromagnetic scattering sensitivity analysis for perfectly conducting objects in TM polarization with isogeometric BEM. Eng. Anal. Bound. Elem. 2025, 172, 106126. [Google Scholar] [CrossRef]
- Chen, L.; Lian, H.; Liu, C.; Li, Y.; Natarajan, S. Sensitivity analysis of transverse electric polarized electromagnetic scattering with isogeometric boundary elements accelerated by a fast multipole method. Appl. Math. Model. 2025, 141, 115956. [Google Scholar] [CrossRef]
- Chen, L.; Pei, Q.; Fei, Z.; Zhou, Z.; Hu, Z. Deep-neural-network-based framework for the accelerating uncertainty quantification of a structural–acoustic fully coupled system in a shallow sea. Eng. Anal. Bound. Elem. 2025, 171, 106112. [Google Scholar] [CrossRef]
- Chen, L.; Lian, H.; Pei, Q.; Meng, Z.; Jiang, S.; Dong, H.-W.; Yu, P. FEM-BEM analysis of acoustic interaction with submerged thin-shell structures under seabed reflection conditions. Ocean Eng. 2024, 309, 118554. [Google Scholar] [CrossRef]
- Zhang, Y.; Wang, M.; Gao, X.; Gao, P.; Yang, X.; Cui, X. Study on the Lubrication and Anti-Friction Characteristics of the Textured Raceway of the Ball Screws Based on Elastohydrodynamic Lubrication. Appl. Sci. 2025, 15, 3343. [Google Scholar] [CrossRef]
- Wen, A.; Zhang, Z.; Yu, S. Analysis of mixed elastohydrodynamic lubrication based on low speed heavy duty rack and pinion transmission mechanism. Mech. Des. Res. 2019, 35, 85–90+95. [Google Scholar]
- Li, P. Investigation of Multibody Systems with Clearance Joints Based on Coupling Dynamics with Tribology. Master’s Thesis, Xi’an Jiaotong University, Xi’an, China, 2015. [Google Scholar]
- Dorafshan, S.; Johnson, K.R.; Maguire, M.; Halling, M.W.; Barr, P.J.; Culmo, M. Friction coefficients for slide-in bridge construction using PTFE and steel sliding bearings. J. Bridge Eng. 2019, 24, 04019045. [Google Scholar] [CrossRef]


| Part | Convex Steel Plate | Curved PTFE Surface | |
|---|---|---|---|
| Materials | 022 Cr19Ni13Mo3 Stainless Steel | Polytetrafluoroethylene | |
| Mechanical properties | Elasticity modulus | 195 | 0.5 |
| Poisson ratio | 0.3 | 0.4 | |
| Tensile strength | 480 | 27.6 | |
| Yield strength | 177 | 23 | |
| Hardness | 187 | 58 | |
| Physical properties | Density | 7.98 | 2.2 |
| Tensile strength | 690 | 30 | |
| Elongation at break | 40 | 300 | |
| Frictional properties | Dry friction coefficient | 0.1 | 0.012 |
| Texture Parameters | Unit | Parameter Value |
|---|---|---|
| Load | N | 1.79 |
| Relative velocity between lubricated surfaces | 0.008 | |
| Lubricant viscosity η0 | 821 | |
| Lubricant density ρ0 | 3400 | |
| Pressure–viscosity coefficient | ||
| Clearance between surfaces | 10 | |
| Width of the modeled region | 700 | |
| Length of the modeled region | 700 | |
| Thickness of the elastic layer | μm | 1000 |
| Spherical cap radius | μm | 200 |
| Spherical cap depth | 15 |
| Texture Type | Geometric Parameter (μm) | Value |
|---|---|---|
| Spherical cap | 190, 200, 210, 220, 230 | |
| 9, 10, 11, 12, 13 | ||
| Ellipsoidal cap | 190, 200, 210, 220, 230 | |
| 190, 200, 210, 220, 230 | ||
| 600, 700, 800, 900, 1000 | ||
| 9, 10, 11, 12, 13 | ||
| Double spherical cap | 220, 230, 240 | |
| 70, 80, 90 | ||
| 11, 12, 13 | ||
| 3, 4, 5 | ||
| 6, 7, 8 |
| Underlying geometric parameters | |||||
| Geometric parameters | μ | Geometric parameters | μ | ||
| 190 | 9 | 0.12488 | 210 | 12 | 0.11099 |
| 10 | 0.12080 | 13 | 0.10848 | ||
| 11 | 0.11750 | 220 | 9 | 0.12067 | |
| 12 | 0.11476 | 10 | 0.11616 | ||
| 13 | 0.11246 | 11 | 0.11247 | ||
| 200 | 9 | 0.12325 | 12 | 0.10939 | |
| 10 | 0.11905 | 13 | 0.10677 | ||
| 11 | 0.11562 | 230 | 9 | 0.11969 | |
| 12 | 0.11278 | 10 | 0.11500 | ||
| 13 | 0.11038 | 11 | 0.11117 | ||
| 210 | 9 | 0.12186 | 12 | 0.10795 | |
| 10 | 0.11750 | 13 | 0.10520 | ||
| 11 | 0.11395 | ||||
| Expanded geometric parameters | |||||
| Geometric parameters | Geometric parameters | ||||
| 230 | 14 | 0.10284 | 230 | 30 | 0.08712 |
| 15 | 0.10077 | 31 | 0.08684 | ||
| 16 | 0.09895 | 32 | 0.08662 | ||
| 17 | 0.09735 | 33 | 0.08645 | ||
| 18 | 0.09592 | 34 | 0.08630 | ||
| 19 | 0.09464 | 35 | 0.08621 | ||
| 20 | 0.09350 | 36 | 0.08615 | ||
| 21 | 0.09248 | 37 | 0.08616 | ||
| 22 | 0.09156 | 38 | 0.08620 | ||
| 23 | 0.09074 | 39 | 0.08626 | ||
| 24 | 0.09002 | 40 | 0.08636 | ||
| 25 | 0.08936 | 41 | 0.08650 | ||
| 26 | 0.08879 | 42 | 0.08669 | ||
| 27 | 0.08828 | 43 | 0.08691 | ||
| 28 | 0.08783 | 44 | 0.08717 | ||
| 29 | 0.08745 | ||||
| Texture | Scheme | Friction Coefficient | |
|---|---|---|---|
| Dimension Parameters (μm) | Value | ||
| Spherical cap | 230 | 0.08615 | |
| d | 36 | ||
| Ellipsoidal cap | 230 | 0.08610 | |
| 230 | |||
| 600 | |||
| d | 36 | ||
| Double spherical cap | 230 | 0.11119 | |
| 70 | |||
| 13 | |||
| 3 | |||
| 8 | |||
Disclaimer/Publisher’s Note: The statements, opinions and data contained in all publications are solely those of the individual author(s) and contributor(s) and not of MDPI and/or the editor(s). MDPI and/or the editor(s) disclaim responsibility for any injury to people or property resulting from any ideas, methods, instructions or products referred to in the content. |
© 2025 by the authors. Licensee MDPI, Basel, Switzerland. This article is an open access article distributed under the terms and conditions of the Creative Commons Attribution (CC BY) license (https://creativecommons.org/licenses/by/4.0/).
Share and Cite
Hu, Q.; Pei, Q.; Li, P. Reducing the Friction Coefficient of Heavy-Load Spherical Bearings in Bridges Using Surface Texturing—A Numerical Study. Lubricants 2025, 13, 180. https://doi.org/10.3390/lubricants13040180
Hu Q, Pei Q, Li P. Reducing the Friction Coefficient of Heavy-Load Spherical Bearings in Bridges Using Surface Texturing—A Numerical Study. Lubricants. 2025; 13(4):180. https://doi.org/10.3390/lubricants13040180
Chicago/Turabian StyleHu, Qian, Qingxiang Pei, and Pei Li. 2025. "Reducing the Friction Coefficient of Heavy-Load Spherical Bearings in Bridges Using Surface Texturing—A Numerical Study" Lubricants 13, no. 4: 180. https://doi.org/10.3390/lubricants13040180
APA StyleHu, Q., Pei, Q., & Li, P. (2025). Reducing the Friction Coefficient of Heavy-Load Spherical Bearings in Bridges Using Surface Texturing—A Numerical Study. Lubricants, 13(4), 180. https://doi.org/10.3390/lubricants13040180