Abstract
In order to evaluate contact characteristics, a modified contact model was proposed considering the deformation characteristics of asperity bodies, and the variation rules of wear rate with fractal dimension, material property constant and debris probability were established. The results show that the actual contact area increases with an increase in load when the surface topography is constant, whereas the contact area decreases with an increase in characteristic scale coefficient if the fractal dimension or load is constant. For running-in wear, the wear rate increases with an increase in surface profile parameters under the same contact area. In addition, the wear rate increases with an increase in actual contact area when the surface profile parameter is constant. Regarding abrasive wear, the wear rate is the smallest when the fractal dimension is 1.6. The wear rate increases with an increase in contact area under the same characteristic scale coefficient, but decreases with an increase in the characteristic scale coefficient under the same contact area, and the smaller the material constant and the larger the probability constant, the higher the wear rate. The establishment of this model provides a basis for further study of the tribological properties of the contact surface.
1. Introduction
The bearing is an indispensable and important component in machinery; for example, it is needed to support compressors, steam turbines, centrifuges and other mechanical equipment in their formation of mechanical relative motion pairs [1,2,3]. Surface micro-morphology (referring to the micro-geometric characteristics of the surface) is an important index that can be used to measure the performance of products, which affects their tribological properties. Tribological properties can be effectively improved by altering the morphology of the surface with special processing methods [2,3,4]. Because of this, surface micro-morphology has attracted the attention of researchers and engineers nationally and internationally, and is also among the hot topics in the fields of surface engineering and tribology [5,6,7].
It is of great significance to establish a contact model of surface micro-morphology for analyzing friction, wear and heat transfer. The bearing surface is rough and composed of a series of irregular discrete peaks and valleys. In general, the contact between spindle and surface in a bearing takes place through a series of irregular discrete micro-asperity bodies. The contact only occurs on micro-asperity bodies with a higher surface area, so the available contact area is only a small part of the nominal contact area [8], which brings difficulties in the understanding of surface contact characteristics. The tribological properties of bearings (e.g., friction and wear) are also closely related to the micro-asperity bodies that come into contact with each other.
In recent years, a large number of studies have been carried out on the surface contact problems experienced during service [9,10,11], and the vast majority of research has qualitatively analyzed the variation in tribological properties during the motion of friction pairs, including through determinations of machining requirements and procedure, which have mostly been based on experience or were not optimal [12]. Therefore, Zhang et al. proposed a modified three-dimensional fractal model, and the results matched the experimental measured values well; in addition, the influence mechanisms of materials, pressure and surface morphology have been further studied [13].
The contact of asperity bodies can be divided into three deformation states during surface contact: elastic, elastic–plastic and plastic. An elastic–plastic fractal model considering friction was established, with the fractal dimension and roughness having a greater influence on the contact properties [14]. In addition, the effects of contact load, fractal dimension, fractal roughness and plastic index on surface contact stiffness and damping were studied [15,16,17]. On the other hand, for the relationships between the friction coefficient of contact surface and roughness, material properties and load, the friction behavior of the rough surface could be predicted well by the established contact model [18,19]. Previous works simplified asperity bodies into geometric shapes that were easier to study. Although the friction and wear of rough surfaces could be explained to a certain extent, the surface morphology was not static due to the simplicity of the model, which meant that the prediction results of previous research were not unique [20,21]. In particular, a significant error was exhibited between the experimental result and the predicted value of the models under medium- and high-load conditions, which made their application scope limited.
According to the above research results, a modified fractal model for evaluating the surface contact characteristics of the bearing was established in light of the deformation characteristics of micro-asperity bodies, the contact area distribution function and the traditional wear expression based on the fractal theory and contact mechanics. The effects of load and surface profile parameters on the real contact area and wear rate of the surfaces were obtained. The establishment of the model provides a foundation for further study on the tribological properties of the bearing surface.
2. The Establishment of the Contact Characteristic Model
2.1. Contact Characterization of Micro-Asperity Bodies
The contact state between bearing and spindle could be regarded as the contact between asperity bodies and a rigid surface according to the hypothesis of the M–B fractal model [22], as shown in Figure 1. The contact between two rough surfaces could be replaced by the contact between an equivalent rough surface and a rigid plane. For the convenience of analysis and solution, the assumptions were as follows: the equivalent rough surface satisfies isotropic fractal characteristics, there was no interaction between micro-asperity bodies and only the micro-asperity bodies were deformed during deformation. In addition, the contact hardening and hardness that changed with depth during the contact process were not considered, nor was friction.
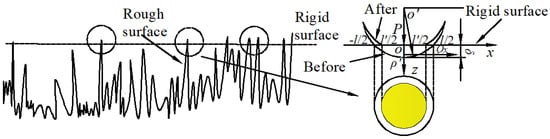
Figure 1.
Ensemble contact model of asperity bodies.
According to the Weierstrass–Mandelbrot fractal function, the contour of the rough surface approximately satisfied cosine waves within the range of [−l’/2, l’/2]. Thus, the undeformed micro-asperity bodies could be expressed as follows [23]:
where z(x) represents asperity body height, m; D represents fractal dimension; G represents characteristic scale coefficient; and l’ represents cross section width, m.
Based on Expression (1) and the curvature content, the curvature radius ρ’ of the micro-asperity body was calculated as follows:
Meanwhile, the actual area S0 of the contact model established was half of the geometric area S1 according to Ref. [21]. Then, the relationship between the deformation δ of the asperity bodies under external loads and the actual contact area S0 could be expressed as follows:
2.2. Contact Deformation of Micro-Asperity Bodies
Due to the variation in working conditions of the bearing surface, the contact deformation state of micro-asperity bodies might exhibit elastic and plastic deformation. Under the operation working condition, the relationship between the maximum contact pressure of micro-asperity bodies with full elastic deformation and the critical maximum contact pressure for yielding occurrence could be expressed as follows [24]:
where Ee represents elastic modulus, Ee = [(1-υ12)/E1e + (1 + υ22)/E2e]−1 (Pa); E1e and E2e represent elastic modulus of contact asperity bodies (Pa); v1 and v2 represent Poisson’s ratio; μ represents friction correction factor; and σy represents yield strength (Pa).
The relationship between friction correction factor μ and friction coefficient μf was expressed as follows [21]:
By combining Expressions (3) and (4), the critical elastic deformation of the yielding micro-asperity body can be shown as follows:
The deformation situation of the asperity body can be determined by the deformation δ and the critical elastic deformation δc. The state of the micro-asperity body was full elastic deformation, and c should be satisfied. Therefore, the critical contact area Sc of the micro-asperity body was shown as follows:
The expression indicates that the critical contact area Sc is related to fractal dimension D, friction correction factor μ and characteristic parameter ϕ, and also that it was independent of the shape and size of the micro-asperity bodies.
A deformation of the micro-asperity bodies was experienced, such that:
According to Expression (8), the micro-asperity bodies experienced plastic deformation or elastoplastic deformation when S0 ≤ Sc, and thus δ ≥ δc. Meanwhile, the micro-asperity bodies underwent elastic deformation when S0 > Sc, and thus δ < δc. In addition, the critical contact area Sc was higher than the actual contact area S0 once the micro-asperity bodies started to contact each other. Because of the smaller contact area and the curvature radius, the critical deformation δc was lower than the deformation δ. Therefore, plastic deformation was present on the contact surface. As time increased, the contact area S0 gradually exceeded the critical contact area Sc, and elastic deformation occurred.
A critical plastic contact area existed, with rough-surface micro-asperity bodies with plastic deformation or elastic–plastic deformation when δ ≥ δc. Then, the critical contact area Spc of the micro-asperity bodies undergoing elastoplastic deformation under friction could be expressed as follows:
Equation (9) for the critical plastic deformation contact area could be used to determine that the condition for full plastic deformation was S0 < Spc, while elastoplastic deformation would occur when Spc < S0 < Sc.
2.3. Actual Contact Area
The contact area distribution function of the micro-asperity bodies on a rough surface could be described as follows [25,26], according to the fractal theory.
where ψ was the fractal extension region coefficient, Sl was the maximum contact area (mm2) and Sr was the total actual contact area (mm2). Since Equation (10) was a transcendental equation, the relationship between the fractal dimension D and the fractal extension region coefficient ψ could therefore be described as follows [25]:
Expression (12) showed that the fractal extension region coefficient ψ gradually decreased with the increase in fractal dimension D (1 < D < 2), which helped to determine the selection of the fractal extension region coefficient ψ under the fractal dimension D. Because the fractal curve with an extremely small scale had infinitely fine structure, the total actual contact area Sr could be expressed as follows:
The total actual contact area Sr could be divided into plastic contact area Srp, elastoplastic contact area Sre and elastic contact area Se according to the critical contact area Sc of the micro-asperity bodies.
(1) If full plastic deformation (Sl < Spc) occurred at the contact point, the full plastic deformation area Srp could be described as follows:
(2) If elastoplastic deformation (Spc < Sl < Sc) occurred at the contact point, then the plastic deformation area Srp could be described as follows:
Additionally, the elastoplastic deformation area Sre could be described as follows:
(3) If elastic deformation (Sc < Sl) occurred at the contact point (that is, if there was a mixed state of elastic deformation, elastoplastic deformation and plastic deformation), then the elastic deformation area Se could be described as follows:
Additionally, the elastoplastic deformation area Sre was shown as follows:
The plastic deformation area Srp could also be shown as follows:
2.4. The Relationship Between Total Actual Contact Area and External Loads
The plastic contact load and elastic contact load should be taken into consideration in the calculation of contact load. When S0 > Sc, then δ < δc, and the elastic deformation could be presented; in addition, the elastic contact pressure satisfied the Hertz contact theory. Therefore, the relationship between the actual contact area S0 and the normal load Fe(S0) in the elastic deformation of the micro-asperity bodies was as follows:
The relationship between the actual contact area S0 and the normal load Fp(S0) in the plastic deformation of the micro-asperity bodies could be expressed as:
According to the conclusions of Equation (9), the micro-asperity bodies were in the stage of elastoplastic deformation when the contact area Spc < S0 < Sc, and the variation between the contact area and the normal load in this stage was relatively complicated. The relationship between actual contact area S0 and normal load Fep(S0) was established [21] as follows:
In the modified fractal model, the relationship between actual contact area and total load could be described as the following three situations when the surface roughness of the bearing was isotropic.
(1) If only full plastic deformation (Sl < Spc) occurred at all contact points on the surface, the total load Frp under full plastic deformation was the same as the actual total contact load Fc. The total contact load and actual total contact area were dimensionless under the plastic deformation state, and then:
where p* was the dimensionless normal load value, p c/SaEe。
(2) If elastoplastic deformation (Spc < Sl < Sc) occurred at all contact points on the surface, the deformation load could be divided into elastoplastic deformation load Fep and plastic deformation load Fp. The total contact load and actual total contact area were dimensionless under the elastoplastic deformation, and then:
where G* was the dimensionless characteristic dimension coefficient, G* = G/Sa; Sc* was the critical contact area of the dimensionless elastic deformation, Sc* = Sc/Sa; Spc* was the critical contact area of dimensionless plastic deformation, Spc* = Spc/Sa; and Sl* was the maximum contact area of dimensionless contact micro-asperity bodies, Sl = Sl*Sa.
(3) If elastic deformation (Sc < Sl) occurred at all contact points on the surface, the deformation load could be divided into elastic deformation load Fe, elastoplastic deformation load Fep and plastic deformation load Fp. The total contact load and actual total contact area were dimensionless under the elastic deformation state, and then:
2.5. Friction and Wear
2.5.1. Running-In Wear
Running-in wear is a stage that the bearing must experience. It is a continuous process, and its main purpose is to improve the adaptability of local structures or the whole system in operation and extended service life and compatibility during operation. In order to calculate wear rate in the running-in wear stage, the friction and wear area of the micro-asperity bodies after traversing any distance was as follows:
Thus, the wear rate of the bearing surface could be described as follows:
where γf is the simulated surface curve constant, Kre is the elastic contact coefficient, Krp is the elastoplastic contact coefficient and Krp is the plastic contact coefficient. Then, the wear rate of the bearing surface in the running-in wear stage can be shown as follows:
2.5.2. Abrasive Wear
Abrasive wear is a common wear mode that can cause equipment failure. It has been assumed that micro-asperity bodies bumping on the rough surface slide for a certain distance L, and the abrasive particles produced are expressed as T(x), where xl = S1/2. Then, the abrasive volume VH of the micro-asperity body and the passing distance L’ of the abrasive particles generated, respectively, can be shown as follows:
Thus, the wear rate of the bearings surface could be described as follows:
Equation (32) describes the friction and generation of abrasive particles between surface asperity body contact pairs. The wear rate of the bearing is described by the actual micro-asperity bodies with a wear probability ς. Let V* = V/Sa, Sr* = Sr/Sa, G* = G/Sa1/2 and M = 3.3μϕ/16, and then the wear rate of the dimensionless bearing surface can be shown as follows.
3. Results and Discussion
3.1. Model Results and Validation
To demonstrate the correctness of the modified fractal model, experimental data from Ref. [27] and the variables D = 1.49, φ = 0.05, G* = 1 × 10⁻¹⁰ were selected for model validation. The comparison between results of different contact models and experimental results is shown in Figure 2. As the figure shows, the calculation results of this work display the same trend as that of other models; that is, the dimensionless actual contact area Sr* increases with the increase in the dimensionless contact load p*. Figure 2 shows that the levels of the micro-asperity bodies were 24 (Figure 2a) and 8 (Figure 2b). The different fractal models could be in good agreement with the experimental results under a lower load, but at the medium load, the model in this work was in the best agreement with the experimental data, and the calculation results of the G–W model (Ref. [28]) and M–B model (Ref. [29]) were second. This was because of the significant influence between adjacent-contact micro-asperity bodies, which was considered by the M–B model and G–W model; Wei et al.’s (Ref. [21]) fractal model had a large deviation from the experimental data. Under the higher load, the model in this work was closest to the experimental data results, whereas the calculation results of other fractal models had larger errors. The reason for this was that other fractal models ignored the interaction between adjacent contacting micro-asperity bodies at medium to higher loads, which led to the occurrence of significant errors.
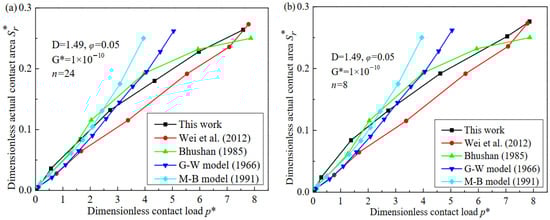
Figure 2.
The comparison of different contact models and experimental results. (a) Actual contact area with contact load (n = 24) (b) Actual contact area with contact load (n = 8).
Furthermore, the error comparison of different contact models and experimental results is shown in Table 1. As shown in the table, the absolute errors between this work’s model and the other models when n = 24 were 4.13, 1.13, 6.41 and 4.07, respectively. The absolute errors between this work’s model and other models when n = 8 were 4.65, 0.93, 4.93 and 5.01, respectively. In summary, whether n = 24 or n = 8, the absolute errors of this model and other models were relatively small, within 5%. This confirmed that the model presented in this paper could effectively demonstrate the variation in contact area with contact load.

Table 1.
The errors between different contact models and experimental results.
In order to further verify the accuracy of this model and ensure the accuracy of the experimental data, three bearing specimens were used for contact performance testing in each group of experiments. In this paper, the surface roughness measuring instrument (Mitutoyo, Tokyo, Japan) SJ-210 was used to measure the surface roughness, and the measurement parameters of the instrument included Ra, Rz, Rmax, Rt (Ry), etc. The surface profile of the bearing and the variation in contact pressure with deformation in the bearing contact performance experiment are shown in Figure 3a,b, respectively. According to the measured surface roughness and the conclusion of Ref. [30], the fractal dimension of the rough surface profile could be expressed as Ds = 1.528/Ra0.0419. Therefore, the fractal dimension of the rough surface was D = Ds + 1 [30]. In Figure 3a, the average roughness of the bearing surface was 1.1195 μm and its fractal dimension D = 2.0139. In Figure 3b, according to the surface morphology measurement results, the comparison of the contact pressure of the theoretical model and the experimental test with the deformation showed that the test results of each group for the bearings were stable, and the stability and accuracy of the entire experimental results were further confirmed. Moreover, the experimental results had the same variation with the theoretical results, which further confirmed the correctness of the model in this work.
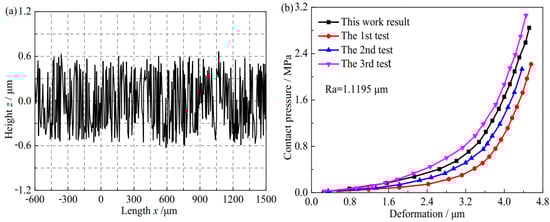
Figure 3.
The variation in two-dimensional surface profile and contact pressure with deformation. (a) Measurement results of bearing surface profile. (b) The variation in contact pressure with deformation.
3.2. The Variation in Contact Area with Load, Fractal Coefficient and Friction Coefficient
In order to explore the relationship between contact area and contact load under the operation conditions, a material characteristic coefficient of ϕ = 0.005 and friction correction coefficient of μ = 0.05 were selected to study the relationship between the contact area and the contact loads. As shown in Figure 4a, when the load and fractal dimension were constant, the smaller the characteristic scale coefficient, the more significant the increase in the actual contact area. Under the same loads and characteristic scale coefficients, the smaller the fractal dimension, the larger the actual contact area. Moreover, the actual contact area increased with the increase in load, and the better the roughness condition (larger D, smaller G*), the more significant the actual contact area increase. The reason for this was the gradual increase of the loads, which increased the number of contact micro-asperity bodies and the actual contact area.
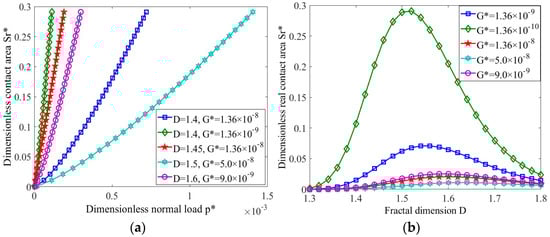
Figure 4.
The variation in actual contact area with loads and fractal dimension. (a) The variation in actual contact area Sr* with normal loads p*. (b) The variation in actual contact area Sr* with fractal dimension D.
The relationship between the fractal dimension and actual contact area under contact load p* = 1 × 10⁻⁵ is shown in Figure 4b. In Figure 4b, the larger the characteristic scale coefficient, the smaller the contact area under the same fractal dimension, and the contact area increased first and then decreased with the increase in fractal dimension. The reason for this was that when the fractal dimension of the bearing surface was smaller, the collection of micro-asperity bodies under the geometric contact area underwent plastic deformation. However, with the increase in fractal dimension, the collection of micro-asperity bodies in the plastic deformation state experienced plastic flow, which could cause some of the micro-asperity bodies in the collection to merge, increasing the contact area. When the contact area reached the maximum, the plastic flow state of the collection of micro-asperity bodies ended, with the surface micro-asperity bodies in elastoplastic/elastic contact. Then, the bearing capacity of the micro-asperity body set increased, and the crushing of micro-asperity bodies was less likely to occur under the action of external loads. Therefore, the contact area further decreased with the increase in fractal dimension.
The relationship between the friction correction coefficient, the characteristic scale coefficient and the actual contact area under contact load p* = 1 × 10⁻⁵ is shown in Figure 5. In Figure 5a, the larger the characteristic scale coefficient, the smaller the contact area under various fractal dimensions. When the fractal dimension and the contact load were constant, the larger the characteristic scale coefficient and the rougher the bearing surface, and there were a series of micro-asperity bodies with larger characteristic scales under the same contact area. This would cause a single micro-asperity body in the set to bear a smaller load, but also made it difficult for it to be crushed, which would further cause a decrease in elastic contact points and an increase in plastic contact points of the micro-asperity body. Therefore, the larger the characteristic scale coefficient, the smaller the actual contact area.
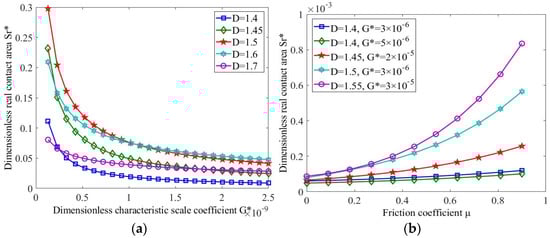
Figure 5.
The variation in actual contact area with characteristic scale coefficient and friction correction coefficient. (a) The variation in actual contact area Sr* with characteristic scale coefficient G*. (b) The variation in actual contact area Sr* with friction correction coefficient μ.
Furthermore, in Figure 5b, when the contact load, the fractal dimension and the characteristic scale coefficient were constant, the friction correction coefficient had almost no effect on the actual contact area, as the surface was rough (smaller D, larger G*). With an improvement in roughness (greater D, smaller G*), the friction correction coefficient was higher and the actual contact area larger. The reason for this was that the larger the friction correction coefficient, the more obvious the increase in friction, leading to an aggravation of the deformation of the micro-asperity body set, which then promoted an increase in the actual contact area.
3.3. The Variation in Wear Rate with Contact Area Under Running-In Wear Condition
In order to explore the variation in wear rate under the running-in wear condition, a material characteristic coefficient ϕ = 0.005, friction correction coefficient μ = 0.05, impact factor of shear stress on contact area γf = 8, elastic contact wear coefficient Kre = 10−7, elastoplastic contact wear coefficient Kep = 10−6 and plastic contact wear coefficient Kp = 10−5 were selected to study the relationship between the contact area and the wear rate, as shown in Figure 6. As seen in Figure 6a, the wear rate increased with the increase in the characteristic scale coefficient under the same contact area, but the wear rate increased with the increase in the actual contact area as the fractal dimension D = 1.8. The reason for this was that the characteristic scale coefficient was a reflection of the amplitude of the bearing surface profile. The larger the characteristic scale coefficient, the more significant the collection of micro-asperity bodies involved in friction, and the more obvious the participation of the contact area in friction, eventually leading to an increase in the wear rate of the bearing.
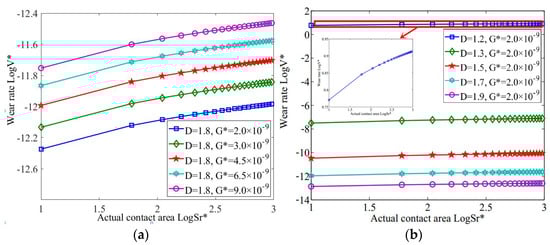
Figure 6.
The variation in wear rate with contact area under the same fractal dimension and characteristic scale coefficient. (a) The variation in wear rate with contact area under the same fractal dimension. (b) The variation in wear rate with contact area under the same characteristic scale coefficient.
As seen in Figure 6b, the wear rate increased with the increase in the contact area under the characteristic scale coefficient G* = 2 × 10⁻⁹, while the wear rate decreased with the fractal dimension under the same contact area. The reason for this was that the fractal dimension is another index that can be used to describe the bearing surface profile, and its size indicates the fine state, regularity and complexity of the bearing surface profile in space. The fractal dimension is a reflection of smoothness, and the actual contact area and characteristic scale coefficient were constant, and in addition, the fractal dimension was smaller, the bearing surface rougher and the corresponding wear rate greater.
The variation in wear rate with contact area under the various material characteristic coefficients and friction correction coefficients is shown in Figure 7. As seen in Figure 7a, the wear rate decreased with the increase in the material characteristic coefficient under the same contact area, while the wear rate increased with the increase in contact area when the material characteristic coefficient was constant. As seen in Figure 7b, the wear rate increased with the increase in the contact area under the same friction correction coefficient, and the greater the friction correction coefficient, the larger the wear rate of the bearing under the same contact area when the material characteristic coefficient ϕ = 0.005.
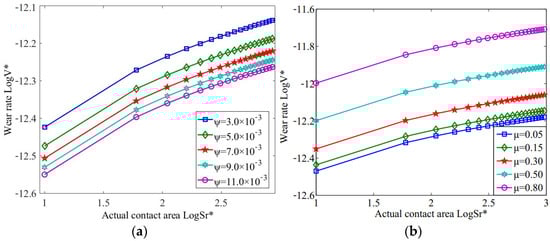
Figure 7.
The variation in wear rate with contact area under various material characteristic coefficients and friction correction coefficients. (a) The variation in wear rate with contact area various material characteristic coefficients. (b) The variation in wear rate with contact area under various friction correction coefficients.
3.4. The Variation in Wear Rate with Contact Area Under Abrasive Wear Condition
A material characteristic coefficient ϕ = 0.005, wear probability ς = 0.2 and the characteristic scale coefficient G* = 2 × 10⁻⁹ were selected to study the relationship between the contact area, the fractal dimension and the wear rate, as shown in Figure 8. As seen in Figure 8a, the wear rate decreased with the increase in fractal dimension (1.1 ≤ D < 1.6). However, the wear rate increased with the increase in fractal dimension (1.6 ≤ D < 1.9), and the increased rate became slower. In addition, the wear rate of the bearing surface was the smallest when the fractal dimension was 1.6, within the range of fractal dimension (1.1 ≤ D < 1.9). Thus, the bearing surface wear rate and wear state could be predicted according to the fractal dimension measured on the rough surface.
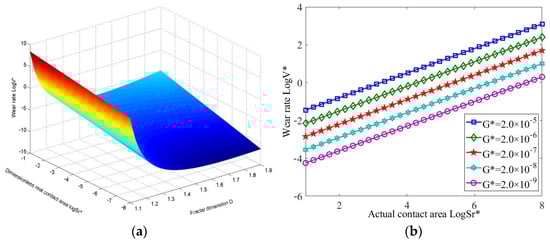
Figure 8.
The variation in abrasive wear rate under various constants. (a) The relationship between wear rate, contact area and fractal dimension. (b) The variation in wear rate with contact area under the same characteristic scale coefficient.
In Figure 8b, the wear rate increased linearly with the increase in the contact area under the same characteristic scale coefficient, and the wear rate increased with the increase in the characteristic scale coefficient under the same contact area. Since the characteristic scale coefficient is an expression of the amplitude of the surface profile, the larger the characteristic scale coefficient, the higher the peak height of the surface profile, and the greater the probability of contact collision and of wear during operation condition, as well, which eventually led to an increase in the wear rate of the bearing surface.
The relationship between wear rate, actual contact area and material performance constant is shown in Figure 9. As seen in Figure 9a, the larger the material performance constant, the smaller the wear rate. The material performance constant reflects the surface hardness of the bearing, and the greater the value, the less likely it is to experience wear. Generally speaking, the higher the hardness, the better the wear resistance and the lower the wear rate. In Figure 9b, with the decrease in the material performance constant, the wear rate of the bearing increased, showing a reversed relationship between the material performance constant and abrasive wear.
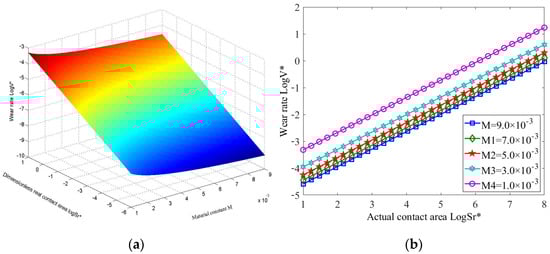
Figure 9.
The variation in abrasive wear rate with contact area and material constant. (a) The relationship between wear rate, contact area and material performance constant. (b) The variation in wear rate with contact area under the same material constant.
The relationship between the wear rate, wear probability constant and the actual contact area are as shown in Figure 10. As seen in Figure 10a, the larger the wear probability constant, the higher the wear rate. With the increase in the wear probability constant of the bearing, the friction and wear probability of the bulge part in the micro-asperity body set increased, eventually causing the wear rate of the bearing to become more and more significant. As seen in Figure 10b, the wear probability constant reflected the contact probability of the bulge part in the micro-asperity body sets. The higher the contact probability, the more obvious the chance of friction and significant wear of the bearing. Therefore, there was a positive correlation between the wear rate and the wear probability constant of the bearing surface.
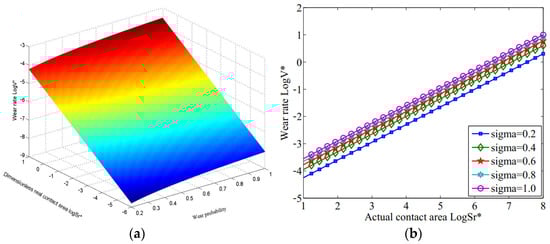
Figure 10.
The variation in abrasive wear rate with contact area and probability constant. (a) The relationship between wear rate, contact area and probability constant. (b) The variation in wear rate with contact area under various probability constants.
4. Conclusions
In this paper, the variations in contact area, running-in wear and abrasive wear with surface profile were obtained by using the modified bearing contact model and wear rate expressions. The relevant conclusions are as follows.
- (1)
- The actual contact area increased with the increase in external load when the surface morphology was constant. The actual contact area decreased with the increase in characteristic scale coefficient and increased first and then decreased with the increase in fractal dimension when the load was constant. Meanwhile, the actual contact area decreased with the increase in the characteristic scale coefficient when the fractal dimension was constant.
- (2)
- In running-in wear, the wear rate increases with the increase in surface profile parameters. However, the wear rate decreased with the increase in the fractal dimension or material characteristic coefficient under the same contact area. In abrasive wear, the wear rate was the smallest when the fractal dimension was 1.6, within the fractal dimension range (1.1 ≤ D < 1.9). Additionally, a linear relationship was present between the wear rate and the contact area. In addition, the larger the characteristic scale coefficient, the higher the wear rate; and the greater the probability constant, and the smaller the material constant, the higher the wear rate under the same contact area.
- (3)
- A modified evaluation contact model was proposed, considering the deformation characteristics of asperity bodies according to the fractal theory, which not only helped to analyze the deformation and wear conditions of the micro-asperity bodies, but also provided a theoretical basis for further study of the properties of the contact bearing (e.g., bearing design optimization, lubricant improvement, friction and wear reduction, etc.).
Author Contributions
Conceptualization, Y.M.; methodology, Y.M. and S.S.; software, Q.H. and Y.Y.; formal analysis, Q.H. and Y.Y.; investigation, S.S. and J.P.; resources, Z.L.; data curation, Y.M., L.W. and Z.L.; writing—original draft preparation, Y.M.; writing—review and editing, Y.M. and Q.H.; supervision, Y.Y.; project administration, S.S., J.P., L.W. and Z.L.; funding acquisition, Y.M. All authors have read and agreed to the published version of the manuscript.
Funding
This work was supported by Henan Provincial Department of Science and Technology Research Project (No. 242102220075) and Key Research Project for Higher Education of Henan (No. 24A460002).
Data Availability Statement
The data that support the findings of this study are available from the corresponding author.
Acknowledgments
The authors would also like to express their sincere thanks to the anonymous referees and the editor for their constructive comments.
Conflicts of Interest
The authors declare no conflicts of interest.
Nomenclature
| z(x) | represents asperity body height, m |
| D | represents fractal dimension |
| G | represents characteristic scale coefficient |
| l’ = 1/γn | represents cross section width (m) with frequency index n |
| Ee | represents elastic modulus, Pa |
| E1e and E2e | represent elastic modulus of contact asperity bodies, Pa |
| v1 and v2 | represent Poisson’s ratio |
| μ | represents friction correction factor; and σy represents yield strength, Pa |
| ψ | fractal extension region coefficient; Sl was the maximum contact area, mm2 |
| Sr | total actual contact area, mm2 |
| p* | dimensionless normal load value |
| G* | dimensionless characteristic dimension coefficient |
| Sc* | critical contact area of the dimensionless elastic deformation |
| Spc* | critical contact area of dimensionless plastic deformation |
| Sl* | maximum contact area of dimensionless contact micro-asperity bodies |
References
- Mao, Y.; Li, D.; Li, L.; Zheng, J. Effect of textured parameters on tribological properties of hydrodynamic journal bearing. Ind. Lubr. Tribol. 2024, 76, 107–109. [Google Scholar] [CrossRef]
- Mao, Y.Z.; Li, L.L.; Li, D.Q.; Zheng, J. Analysis of the turbulent lubrication of a textured hydrodynamic journal bearing. Lubricants 2023, 11, 362. [Google Scholar] [CrossRef]
- Mao, Y.Z.; Zhang, Y.X.; Shi, S.L.; Wang, L.; Li, Z.; Zheng, J. Study on laser textured surface machining and optimization of process parameters. Appl. Phys. B 2025, 131, 16. [Google Scholar] [CrossRef]
- Mao, Y.Z.; Yang, J.C.; Ji, J.C. Theoretical and experimental study of surface texturing with laser machining. Adv. Manuf. 2021, 9, 538–557. [Google Scholar] [CrossRef]
- Zhang, K.P.; Wu, C.H.; Shi, X.L.; Xue, Y.; Huang, Q. Investigations of tribological performance of slewing bearing raceway with bionic textured composite surface under grease lubrication. Tribol. Int. 2023, 184, 108469. [Google Scholar] [CrossRef]
- Bartkowiak, T.; Peta, K.; Królczyk, J.B.; Niesłony, P.; Bogdan-Chudy, M.; Przeszłowski, Ł.; Trych-Wildner, A.; Wojciechowska, N.; Królczyk, G.M.; Wieczorowski, M. Wetting properties of polymer additively manufactured surfaces—Multiscale and multi-technique study into the surface-measurement-function interactions. Tribol. Int. 2025, 202, 110394. [Google Scholar] [CrossRef]
- Marian, M.; Almqvist, A.; Rosenkranz, A.; Fillon, M. Numerical micro-texture optimization for lubricated contacts—A critical discussion. Friction 2022, 10, 1772–1774. [Google Scholar] [CrossRef]
- Peta, K.; Stemp, W.J.; Chen, R.; Love, G.; Brown, C.A. Multiscale characterizations of topographic measurements on lithic materials and microwear using a GelSight Max: Investigating potential archaeological applications. J. Archaeol. Sci. Rep. 2024, 57, 104637. [Google Scholar] [CrossRef]
- Shen, F.; Li, Y.H.; Ke, L.L. A novel fractal contact model based on size distribution law. Int. J. Mech. Sci. 2023, 249, 20–23. [Google Scholar] [CrossRef]
- Chen, J.; Zhang, W.; Wang, C.; Liu, D.; Zhu, L. An accurate solution of a hemisphere contact against a rigid flat under varying elastic moduli and yield strengths and comparison with previous model. J. Mech. Sci. Tech. 2022, 36, 4615–4624. [Google Scholar] [CrossRef]
- Schewe, M.; Wilbuer, H.; Menzel, A. Simulation of wear and effective friction properties of microstructured surfaces. Wear 2021, 464–465, 203491. [Google Scholar] [CrossRef]
- Bai, C.; Zhang, W.; Zhang, Z.; Zhao, Z.; Li, Y. Modeling of running-in wear based on fractal theory. Machinery 2016, 54, 28–31. [Google Scholar]
- Zhang, C.X.; Li, X.; He, J.L.; Cheng, Y.H.; Liu, Z.F.; Li, Y. Static friction coefficient model of joint surface based on the modified fractal model and experimental investigation. Int. J. Adv. Manuf. Technol. 2023, 12, 4415–4429. [Google Scholar] [CrossRef]
- Lan, W.B.; Fan, S.W.; Fan, S. A fractal model of elastic-plastic contact between rough surfaces for a low-velocity impact process. Int. J. Comput. Methods. 2021, 18, 2150039. [Google Scholar] [CrossRef]
- Lan, G.S.; Sun, W.; Zhang, X.L.; Chen, Y.; Tan, W.; Li, X. A three-dimensional fractal model of the normal contact characteristics of two contacting rough surfaces. AIP Adv. 2021, 11, 055023. [Google Scholar] [CrossRef]
- Cheng, Y.; Wang, Z.P.; Bu, Y.B. Normal contact model of fractal surfaces considering friction and asperity interactions. Int. J. Appl. Mech. 2024, 16, 2450057. [Google Scholar] [CrossRef]
- Feng, Y.; Yang, P.; Zhang, Y.Y. Fractal model of thermal elasto-plastic contact of rough surfaces. J. Cent. South Univ. (Engl. Ed.) 2022, 29, 1500–1509. [Google Scholar] [CrossRef]
- Liang, X.M.; Wang, G.F. A friction model of fractal rough surfaces accounting for size dependence at nanoscale. Acta Mech. 2022, 233, 69–81. [Google Scholar] [CrossRef]
- Wang, H.; Cui, J.; Wu, J.; Tan, J. A fractal friction model for nanoscale rough surface contact. J. Appl. Phys. 2022, 132, 015105. [Google Scholar] [CrossRef]
- Zhao, J.; Wang, Z.L.; Zhang, H.; Zhu, R. Fractal variation of three-dimensional surface topography during sliding wear under mixed elastohydrodynamic lubrication. Surf. Topogr. Metrol. Prop. 2021, 9, 045007. [Google Scholar] [CrossRef]
- Wei, L.; Liu, Q.H.; Zhang, P.G. Sliding friction surface contact mechanics model based on fractal theory. J. Mech. Eng. 2012, 18, 106–113. [Google Scholar] [CrossRef]
- Yu, X.; Sun, Y.Y.; Wu, S.J. Multi-stage contact model between fractal rough surfaces based on multi-scale asperity deformation. Appl. Math. Modell. 2022, 109, 229–250. [Google Scholar] [CrossRef]
- Jeng, L.L.; Jen, F.L. A modified fractal microcontact model developed for asperity heights with variable morphology parameters. Wear 2010, 268, 134–144. [Google Scholar]
- Monti, J.M.; Pastewka, L.; Robbins, M.O. Fractal geometry of contacting patches in rough elastic contacts. J. Mech. Phys. Solids. 2022, 160, 104797. [Google Scholar] [CrossRef]
- Ding, X.X.; Yan, R.Q.; Jia, Y.L. Construction and analysis of fractal contact mechanics model for rough surface based on base length. Tribol. 2014, 34, 341–347. [Google Scholar]
- Yu, X.; Sun, Y.Y.; Zhao, D.; Wu, S. A revised contact stiffness model of rough curved surfaces based on the length scale. Tribol. Int. 2021, 164, 107206. [Google Scholar] [CrossRef]
- Bhushan, B. The real area of contact in polymeric magnetic media -Ⅱ: Experimental data analysis. ASLE Trans. 1985, 28, 181–197. [Google Scholar] [CrossRef]
- Greenwood, J.A.; Williamson, J.B.P. contact of nominally flat surfaces. Proc. R. Soc. 1966, A295, 300–319. [Google Scholar]
- Majumdar, A.; Bhushan, B. Fractal model of elasticplastic contact between rough surfaces. ASME J. Tribol. 1991, 113, 1–11. [Google Scholar] [CrossRef]
- Yu, Y.; Cheng, Y.; Zhang, J. Fractal based elastoplastic mechanics model for contact with rough surface and its experimental verification. Eng. Mech. 2018, 35, 209–221. [Google Scholar]
Disclaimer/Publisher’s Note: The statements, opinions and data contained in all publications are solely those of the individual author(s) and contributor(s) and not of MDPI and/or the editor(s). MDPI and/or the editor(s) disclaim responsibility for any injury to people or property resulting from any ideas, methods, instructions or products referred to in the content. |
© 2025 by the authors. Licensee MDPI, Basel, Switzerland. This article is an open access article distributed under the terms and conditions of the Creative Commons Attribution (CC BY) license (https://creativecommons.org/licenses/by/4.0/).