Article

Vibration-Based Wear Evolution Characterisation of Lubricated Rolling-Sliding Contact

1
School of Automation and Software Engineering, Shanxi University, Taiyuan 030006, China
2
Engineering Research Center Heavy Machinery Ministry of Education, Taiyuan University of Science and Technology, Taiyuan 030006, China
3
Key Laboratory of Education Ministry for Modern Design and Rotor-Bearing System, Xi’an Jiaotong University, Xi’an 710049, China
*
Authors to whom correspondence should be addressed.
Lubricants 2025, 13(2), 78; https://doi.org/10.3390/lubricants13020078
Submission received: 14 January 2025 / Revised: 6 February 2025 / Accepted: 10 February 2025 / Published: 11 February 2025

Abstract

:
This paper presents a comprehensive study on the vibration-based wear evolution characterisation by coupling the dynamic behaviour, surface roughness, and lubrication effects under rolling-sliding contact. Initially, a dynamic model is developed to examine the contact vibration characteristics induced by a randomly rough surface. A contact resonance frequency (CRF) can be obtained, and it is only positively correlated with the load, while the amplitude of CRF (CRFA) negatively correlates with the load and positively correlates with the velocity and surface profile height. Thereafter, a mixed-EHL model is employed to simulate the wear and lubrication progression of rolling-sliding contact. The surface roughness, contact load ratio (CLR), and contact area ratio (CAR) within this process are assigned specific physical interpretations and incorporated into the dynamic model. Given the nonlinear and coupled interactions of these three factors, the CRF and CRFA can distinguish the normal wear and severe wear stages. When the tribo-pair is in a normal wear stage, the CRF and CRFA show an increasing trend with the increase in surface roughness. Upon reaching a severe wear stage, the CRF gradually stabilises while the CRFA exhibits noticeable irregular fluctuations as the roughness increases. Finally, experiments are conducted to demonstrate the effectiveness of this method.

1. Introduction

Skidding of cylindrical roller bearings is a frequent phenomenon in high-speed and heavy-load rotating machinery. The rolling-sliding contact can lead to the rupture of lubricant oil film, local temperature rise, unexpected vibrations, and additional wear, which is considered a primary cause of early bearing failures [1,2]. Therefore, it is essential to monitor this tribological degradation process. Vibration analysis has become one of the most commonly used approaches for bearing health monitoring, due to its practical simplicity in non-destructive monitoring and the availability of advanced signal processing methods [3,4]. However, existing vibration analysis methods primarily focus on the bearing fault identification with less emphasis on wear status, owning to the complex tribo-dynamic behaviour of lubricated rolling-sliding contact [5]. As a result, it remains challenging to develop wear-related vibration indicators specifically for wear monitoring and characterisation.
By using various signal processing techniques, researchers aim to extract feature parameters from vibration signals to characterise different wear stages, wear failure modes, and surface wear degrees. The most common method to describe the wear stages of tribo-pairs is to extract some statistical parameters, including root mean square value, kurtosis and kurtosis factor, among others [6]. In addition, Venkata et al. [7] applied neural networks to establish the mapping relationship between these statistical parameters and different wear stages. Moreover, Zhou et al. [8] studied the chaotic characteristics of the tribo-system evolution and proposed a chaotic attractor to represent the wear evolution process. These methods rely on identifying the wear stages using the vibration signal “energy”, which is susceptible to interference from the external environment. Therefore, these feature parameters have limited efficacy in monitoring microscopic wear in industrial applications.
Multiple indicators have been proposed based on the vibration signals of tribo-pairs to identify typical wear failure modes. For example, Tian et al. [9] applied the multifractal dimension to identify surface cracks, peeling, pitting, and other types of damage in wheel-rail contacts. Feng et al. [10] proposed the cyclostationarity indicator to differentiate two common wear mechanisms of gears and track the wear evolution. Silaev et al. [11] used the spectral peak to predict the pitting corrosion and its progression in roller bearings in aircraft engines. Furthermore, Sun et al. [12] investigated a vibration feature K by the harmonic wavelet packet transform (HWPT) method, and its relationship to different wear mechanisms was established. The above methods are essentially noise reduction and filtering of vibration signals, without establishing a direct correlation between vibration features and typical failures. In addition, due to the uncertainty and randomness of surface failure modes, the repeatability of experimental results cannot be guaranteed.
To evaluate the degree of surface wear, kurtosis-based methods have been extensively investigated in earlier years. For instance, Amarnath et al. [6] extracted the kurtosis indicator by empirical mode decomposition technologies to characterise the fatigue wear of gears. Immovilli et al. [13] employed statistical methods to identify the characteristic frequency bands induced by frictional contacts, and the spectral kurtosis energy was utilized to evaluate the overall surface roughness of rolling bearings. In contrast, the kurtosis indicators employed for impulsive detection are merely available to stationary signals. In rotating machines, vibration signals typically combine pulses and repeated energy release, exhibiting both cyclostationarity and nonstationarity [14]. In response to the cyclostationarity of the friction vibration signals, Yang et al. [15] identified a positive correlation between surface wear degree and a CS2 index. However, a later investigation revealed that this connection is more complex, particularly when considering a broader range of surface profile heights and a longer test duration [16]. At present, there is no sufficient conclusion to demonstrate the outstanding advantage of cyclostationary features of vibration signals in wear analysis.
In summary, it is evident that most published works have aimed at validating the ability of vibration signals to characterise in relation to wear stages, wear failure modes, and surface wear degree, while research on the induction mechanism of wear on vibration signals remains limited. Soom et al. [17,18] first investigated the contact resonance spectrum excited by surface waviness using digital simulation technology to simulate surface irregular waves and linearising the Hertz contact stiffness. Based on this, Sudeep et al. [19,20] modelled the generic point contact as a single degree of freedom system to examine the contact resonance frequency (CRF) of various textured surfaces. While a CRF induced by the rough surface was identified in these studies, no further research was conducted. For example, the correlation between surface roughness and CRF remains unexplored.
Inspired by the findings presented in [17,18,19,20], a vibration-based approach is established in this work to characterise the wear evolution of rolling-sliding contact by integrating the dynamic behaviour, surface roughness, and lubrication oil effects. The structure of this paper is as follows. Section 2 presents the modelling and solution process of rolling-sliding contact vibration. A mixed-EHL model is applied to simulate the wear and lubrication evolution of rolling-sliding contact, and a wear evolution characterisation method based on contact vibration is proposed in Section 3. Section 4 details the experimental verification methods and results. Conclusions are presented in Section 5.

2. Rolling-Sliding Contact Vibration Model

A spring-damping system is established in this section to reveal the rolling-sliding contact vibration characteristics. A Gaussian white noise signal is used to simulate the rough surface. By using the fifth-order Runge–Kutta algorithm to solve the dynamic equation, a CRF is obtained for wear characterisation analysis. Subsequently, the influence of load, velocity, and surface profile height on the CRF is explored.

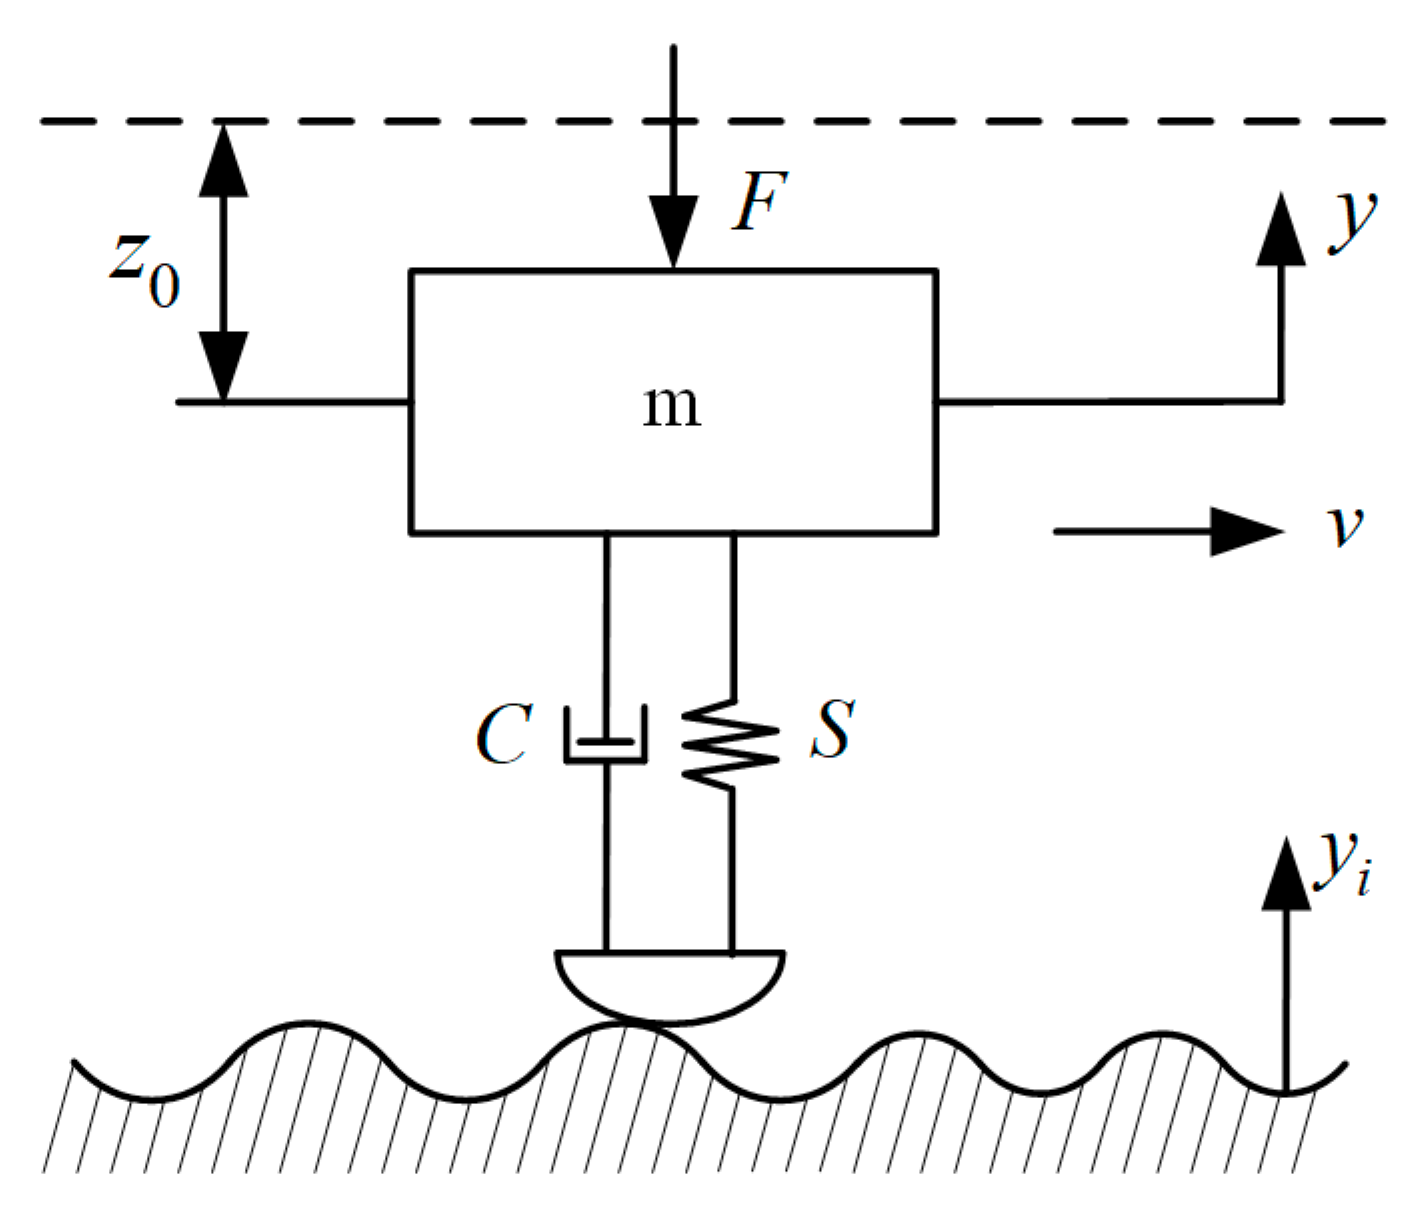
2.1. Dynamic Model Establishment

The dynamic behaviour of a rolling-sliding contact is simplified as a spring-damping system. The mass block m slides along the rough plane at a constant velocity v , as shown in Figure 1. Based on the spring force, damping force, and external load acting on the mass block, the motion equation of this system can be obtained as:
m y ¨ = C ( y i ˙ y ˙ ) + S ( y i y + z 0 ) 1.5 F
where y i and y are the system input and output, respectively, and y i represents the rough surface profile. C is the damping coefficient, and S is the Hertz contact stiffness. z 0 is the static spring compression, and ( y i y + z 0 ) is the instantaneous spring compression, the spring restoring force is directly proportional to ( y i y + z 0 ) 1.5 , and F is the external load.
Due to the complex coupling mechanism between the oil film distribution, asperity contact, and surface roughness at the rolling-sliding contact interface, the effect of the oil film distribution is ignored in the current dynamic model, and it will be discussed in detail in Section 3.
The Hertz contact stiffness is linearised here to solve the system vibration response. Under the conditions of a constant load F 0 and a small amplitude vibration, the nonlinear spring force can be replaced by a linear spring force, and the elastic coefficient is the incremental stiffness S 0 , as illustrated in Figure 2. It should be noted that, for large deformation or large waviness surfaces, it will inevitably lead to unstable contact loads and large amplitude vibrations, and this method may no longer be applicable.
Each contact point, where the mass block slides along the rough plane, can be considered as the contact between a sphere and a smooth plane. According to Hertz’s contact theory, when the contact spring is in an equilibrium position under the external load, its static compression z 0 is:
z 0 = 9 F 2 16 E 2 R 1 3
where E is the equivalent modulus of elasticity, and R is the equivalent contact radius.
By taking the derivative of Equation (2), the incremental stiffness can be obtained as:
S 0 = 1.5 16 R 9 1 3 1 E 2 3 F 1 3
then, the theoretical CRF can be expressed as:
ω s = 1 2 π S 0 m
For contact dynamics problems, the damping coefficient is usually expressed using the measured damping ratio in tests, with values ranging from 0.01 to 0.1. The lower value is appropriate for metal contact without lubrication, while the higher value is suitable for boundary lubrication, which aims to inhibit the nonlinear behaviour and delay the contact loss. As the lubrication condition has not been taken into account in this dynamic model, the damping ratio is 0.02. The damping coefficient can be obtained as:
C = 2 ω s m ζ
where ζ is the damping ratio. Thus, Equation (1) can be simplified as:
m y ¨ = C ( y i ˙ y ˙ ) + S 0 ( y i y )

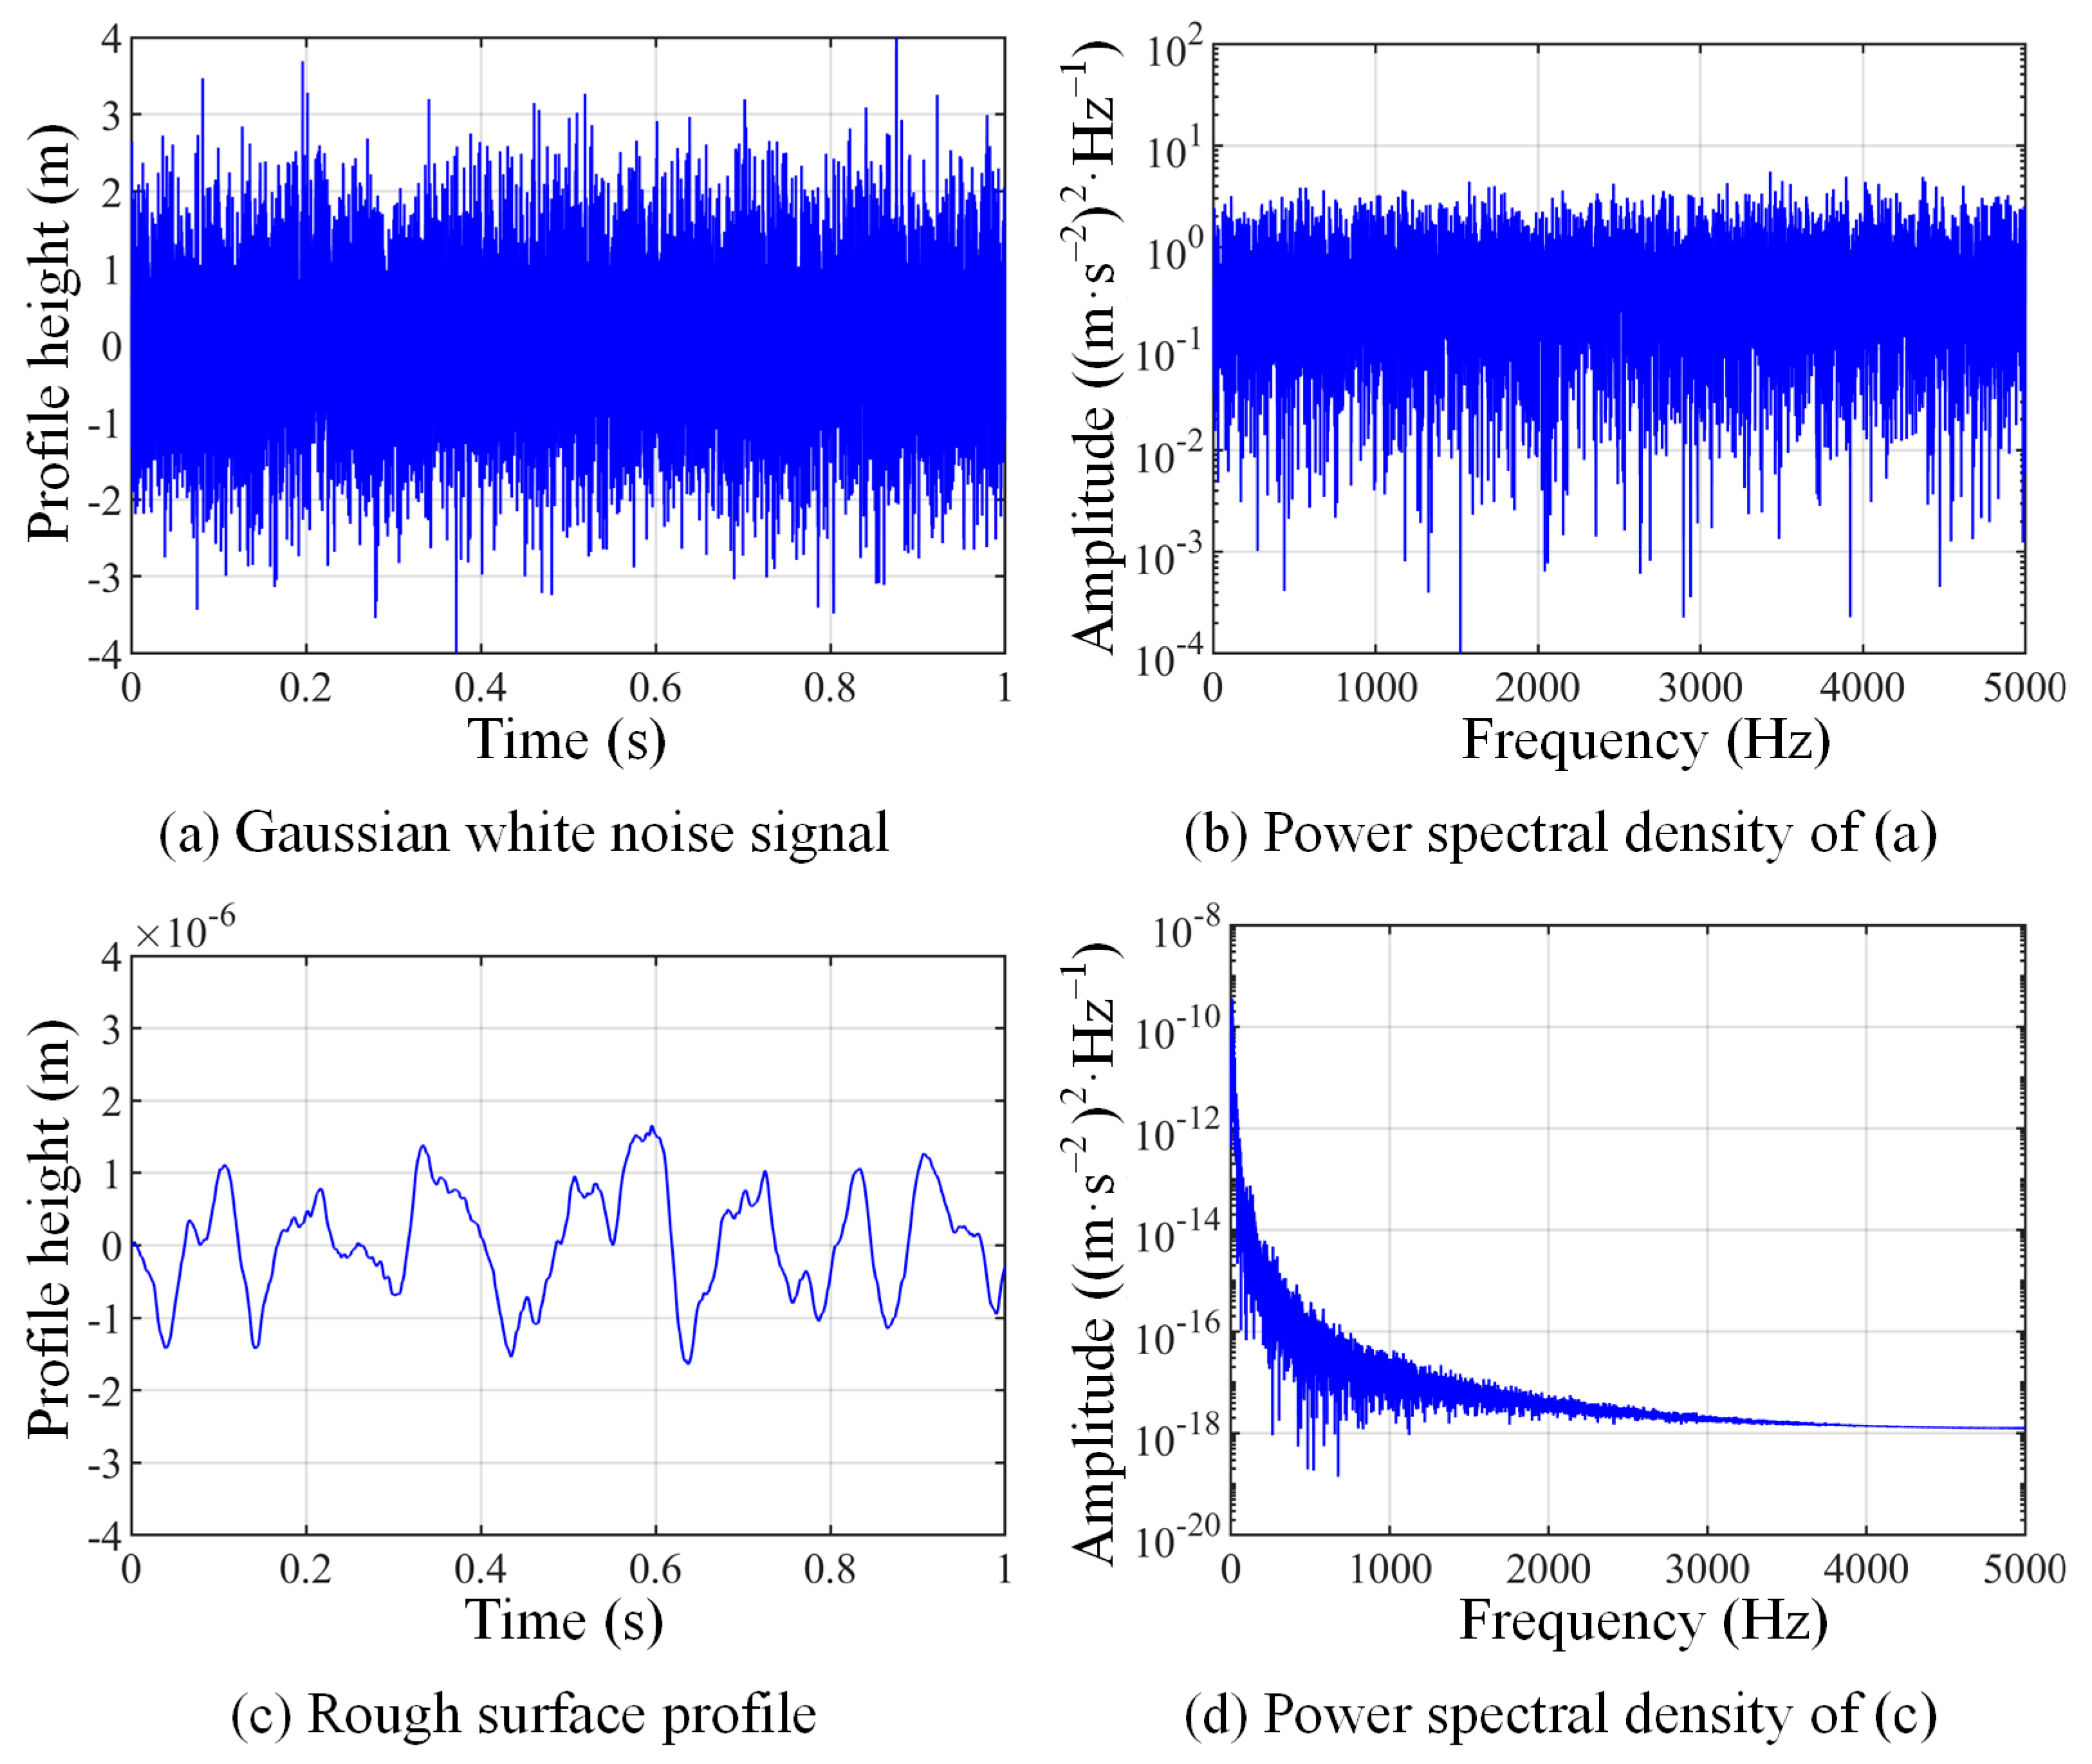
2.2. Rough Surface Simulation

Gaussian white noise is used to simulate the rough surface, and the simulation process is depicted in Figure 3. Figure 3a demonstrates the original Gaussian white noise sampled at a frequency of 10 kHz and with its height unit assumed to be in meters. Its power spectral density function remains constant, as shown in Figure 3b. A low-pass filter is applied on the noise signal, which is then transformed into a rough surface profile on the order of μm by multiplying a corresponding coefficient, as shown in Figure 3c. Its power spectral density function becomes a smooth curve, as shown in Figure 3d. This filtering process converts the two-dimensional surface profile from the spatial domain into the displacement input per unit time in the time domain. Therefore, altering the amplitude is equivalent to modifying the surface profile height, and adjusting the cut-off frequency of the filter corresponds to changing the sliding velocity.
The low-pass filter plays two roles in this study. First, it transforms the noise signal into a rough surface profile on the order of μm. Second, it converts the two-dimensional surface profile from the spatial domain into the displacement input per unit time in the time domain. However, because the cut-off frequency affects both the surface profile height and sliding velocity, when it is necessary to simultaneously adjust these two factors, the cut-off frequency must be adjusted first to determine the sliding velocity, and then the amplitude is adjusted to determine the surface profile height.

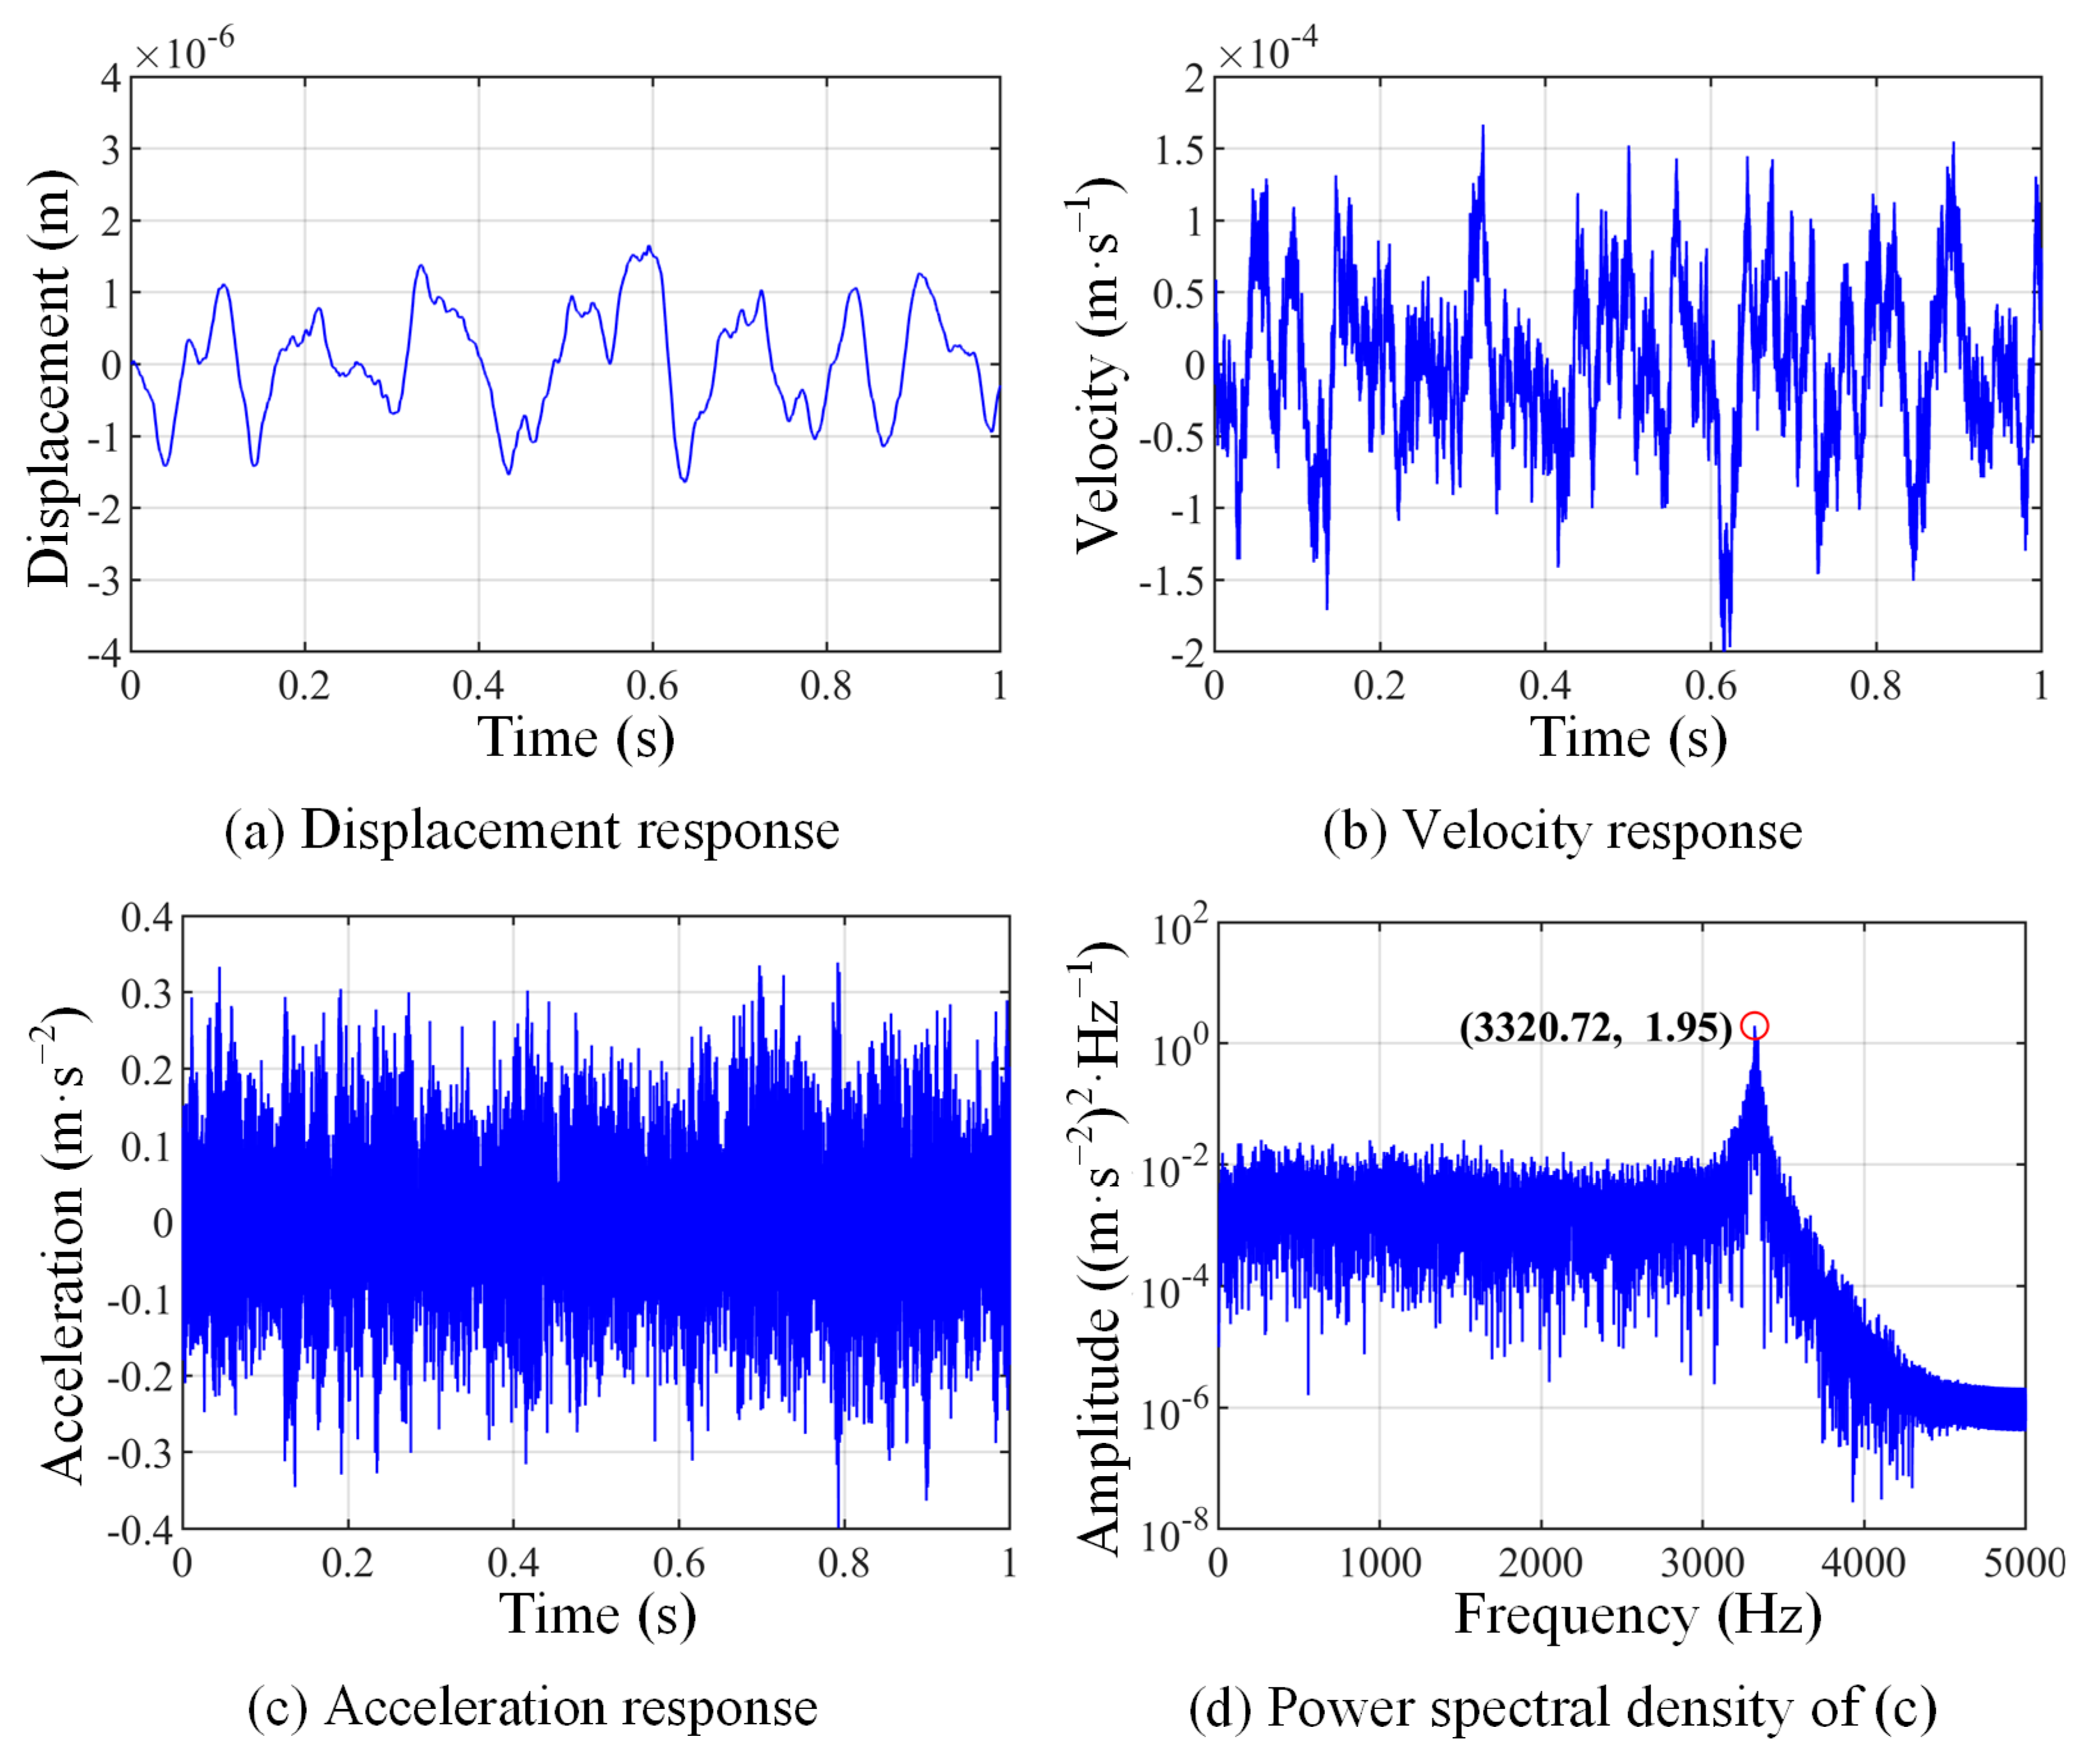
2.3. Dynamic Equation Solving

The fifth-order Runge–Kutta algorithm is utilized to solve the dynamic equation, with the results presented in Figure 4. Based on the tribo-pair structure used in subsequent experiments, a mass of 0.1 kg and a constant load of 200 N are assigned to the model, the equivalent elastic modulus is 219.78 GPa, and the equivalent contact radius is 5.4 mm. Figure 4a and Figure 4c show the displacement, velocity, and acceleration responses, respectively. Figure 4d illustrates the power spectral density of the acceleration response, and a characteristic frequency (3320.72, 1.95) is observed. This frequency is consistent with the theoretical CRF calculated by Equation (4), thereby confirming the validity of the dynamic model.

2.4. Influencing Factors Analysis

The influence of load, velocity, and surface profile height on the CRF is explored using the single-variable method. When the cut-off frequency is set to 30 Hz and the filtered rough surface profile height is 2 μm, different external loads (100, 200, 300, and 400 N) are applied sequentially. When the load is 200 N and the cut-off frequency is 30 Hz, various rough surface profile heights (1, 2, 3, and 4 μm) are considered. When the load is 200 N and the filtered rough surface profile height is 2 μm, different cut-off frequencies (10, 20, 30, and 40 Hz) are applied sequentially. The resulting CRF and the amplitude of contact resonance frequency (CRFA) are shown in Table 1.
As observed in Table 1, with the increase in load, the CRF gradually increases while the CRFA gradually decreases. With the increase in velocity, the CRF remains constant while the CRFA increases gradually. Similarly, as the surface profile height increases, the CRF remains constant while the CRFA increases gradually. Therefore, the CRF is only positively correlated with the load, while the CRFA is negatively correlated with the load and is positively correlated with both speed and surface profile height.

3. Wear Evolution Characterisation Based on Contact Vibration

In this section, various roughness surfaces are input into a mixed-EHL model to simulate the wear evolution process of lubricated rolling-sliding contact. According to the contact load ratio (CLR) and contact area ratio (CAR) in Hertz contact areas, a wear evolution characterisation method using contact vibration is proposed.

3.1. Basic Equations of Mixed-EHL Model

The mixed-EHL model is a hybrid lubrication calculation method based on real surface digitisation, capable of solving both hydrodynamic lubrication and rough surface contact problems [21]. The distribution of lubricant film thickness, pressure, interface deformation, friction, flash temperature, and subsurface stress can be predicted by numerically solving the complete mixed elastohydrodynamic lubrication equation. Additionally, the model simulates the interaction of engineered rough surfaces under various working conditions [22]. The basic equations of the model are given below.
A unified deterministic mixed-EHL simulation model is applied to deal with both “lubrication” and “contact” simultaneously in a mixed-EHL system [23]. The pressure (including both the hydrodynamic pressure and contact pressure) within the entire domain is governed by the Reynolds equation below:
x ρ h 3 12 η * p x + y ρ h 3 12 η * p y = U ( ρ h ) x + ( ρ h ) t
where the x -coordinate aligns with the direction of motion, and p represents the pressure in the contact zone. ρ denotes the density of the lubricant, which can be expressed as [24]:
ρ = ρ 0 1 + 0.6 × 10 9 p 1 + 1.7 × 10 9 p
where ρ 0 is the initial lubricant density. η * is the effective viscosity considering the non-Newtonian behaviour, which can be expressed as [25]:
1 η * = 1 η τ 0 τ 1 s i n h τ 1 τ 0
where τ 0 denotes a shear stress for reference, and τ 1 represents the shear stress of the lower surface. The viscosity η can be calculated following the Barus equation [26]:
η = η 0 e α p
where η 0 is the initial lubricant viscosity, and α is a pressure–viscosity exponent.
The gap h between surfaces 1 and 2 can be calculated by:
h = h 0 ( t ) + x 2 2 R x + v ( x , y , t ) + δ 1 ( x , y , t ) + δ 2 ( x , y , t )
where R x is the curvature radius, and δ 1 and δ 2 represent the roughness values of two contact surfaces. The surface elastic deformation v is computed through the Boussinesq integral [27]:
v ( x , y , t ) = 2 π E Ω p ( ξ , ς ) ( x ξ ) 2 + ( y ς ) 2 d ξ d ς
where E is the equivalent elastic modulus, and Ω refers to the entire solution domain.
The load balance equation can be expressed as:
w ( t ) = Ω p ( x , y , t ) d x d y
The total friction in mixed lubrication conditions consists of the hydrodynamic friction and asperity contact friction. In the hydrodynamic region, the shear stress is computed according to the Bair–Winer model [28]:
γ = τ G τ L η ln 1 τ τ L
where τ L and G are the limiting shear stress and limiting elastic modulus, respectively, which are functions of temperature and pressure which can be estimated empirically. The flash temperature is calculated as follows:
T 1 ( ζ ) = T b 1 + ( 1 π ρ 1 C 1 u 1 k 1 ) 0.5 x ζ k f h T 2 ( ξ ) T 1 ( ξ ) + q ( ξ ) 2 d ξ ζ ξ 0.5
T 2 ( ζ ) = T b 2 + ( 1 π ρ 2 C 2 u 2 k 2 ) 0.5 x ζ k f h T 1 ( ξ ) T 2 ( ξ ) + q ( ξ ) 2 d ξ ζ ξ 0.5
where q is the heat generated by either the lubricant shear in the hydrodynamic areas or the boundary friction in the asperity contact areas. Readers are referred to [29] for details. In the asperity contact region, the shear stress can be expressed as:
τ = f b p
where f b is the friction coefficient.

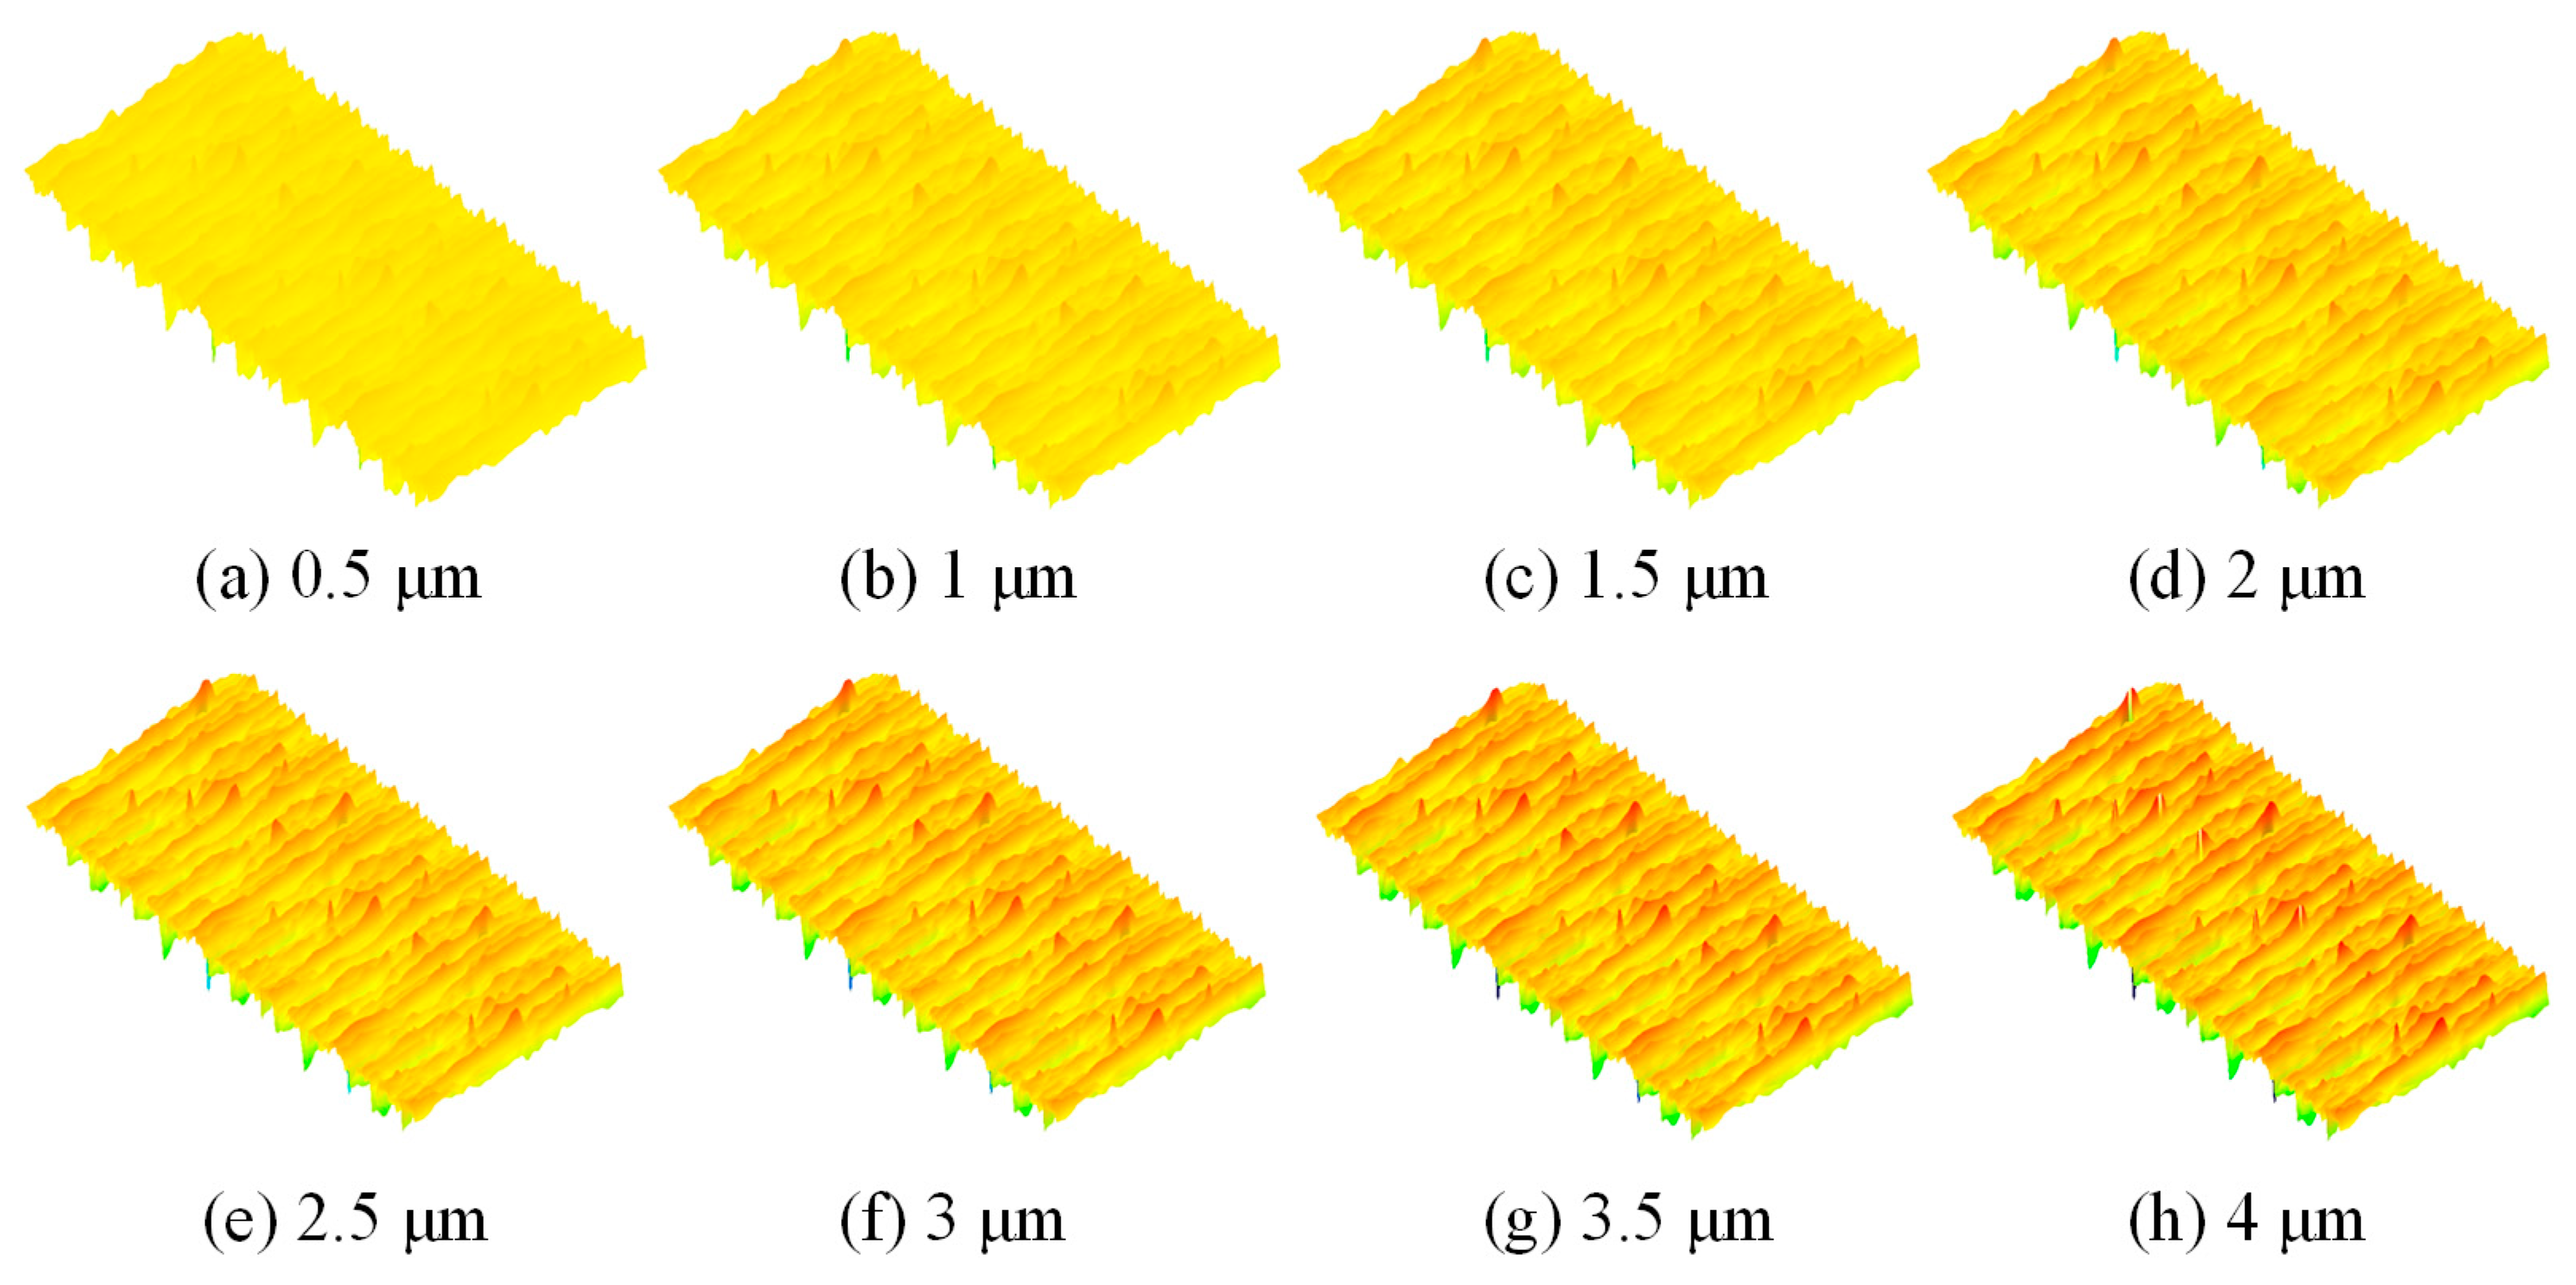
3.2. Wear and Lubrication Evolution Simulation

Based on the mixed-EHL model, a line contact model is established according to the tribo-pair structure used in later experiments in order to analyse the state of contact of the tribo-pair surfaces during the wear evolution. The material of the tribo-pair is 45 steel, the contact length is 10 mm, and the frictional coefficient of the surface asperity contact is 0.15. A common mineral oil is used as a lubricant. In the model, a constant load of 500 N and a constant relative sliding velocity of 2 m/s are applied, and the comprehensive surface roughness of the tribo-pair is taken as the only independent variable to simulate various wear states. The specific input parameters for wear evolution simulation are listed in Table 2. Eight rough surfaces with different surface roughness (Sq, in μm) are shown in Figure 5. In the mixed-EHL solver, the finite difference method is used to solve the Reynolds equation, and a progressive mesh densification (PMD) method is used to determine the grid mesh. In this study, the contact area is divided into a 256 × 256 grid of cells. The solution domains are −1.9a to 1.9a in the x-direction and −1.6b to 1.6b in the y-direction. The parameters “a” and “b” are the two semi-axes of the Hertzian contact ellipse in the x and y directions, respectively.
Figure 6 illustrates the contact states corresponding to the above-eight rough surfaces during the wear evolution process. The regions in red are areas fully filled with lubricating oil, and the yellow areas indicate asperity contacts. From Figure 6a–e, it can be observed that when the surface roughness is 0.5 μm, the CAR of asperities is only 5.57%. As the surface roughness increases to 2.5 μm, the CAR reaches 59.22%. Subsequently, the CAR gradually increases and reaches a saturation state, as shown in Figure 6f–h. This is primarily due to the fact that, during early wear, as the surface profile height changes, the oil film is compressed and ruptured, resulting in an increasing number of asperities coming into contact. However, when the surface profile height increases to about 3 μm, the tribo-pair material reaches the stress limit, making it difficult to undergo elastic deformation. Therefore, the CAR tends to stabilise.
According to the results presented in Section 2.4, the load is the significant factor determining the CRF of rolling-sliding contact vibration signals. Therefore, by using the load balance Equation (13), the ratios of the load borne by asperity contacts to the total load (CLR) under different wear states are obtained and compared with the corresponding CAR [5]. The results are shown in Figure 7.
It is evident that, when the surface roughness is 0.5 μm, the CAR and CLR are minimal, indicating the tribo-pair is in a favourable lubrication condition. As the surface roughness increases, more asperity contact occurs and leads to a higher CAR and CLR, indicating a progression to a normal wear stage. Subsequently, the CAR tends to stabilise when the surface roughness is approximately 2.5 μm, while the CLR reaches a stable state when the surface roughness is about 4 μm. This is mainly because the load borne by the oil film decreases after the oil film ruptures in localised areas, and the load borne by the asperity contact increases with the increasing contact area. As the surface profile height continues to increase, the CAR reaches a stable value due to the stress limit of the tribo-pair material, requiring the asperity contact to bear a greater load. It can be inferred that the tribo-pair is in a serious sliding wear stage.

3.3. Contact Vibration Analysis Method

The contact vibration model established in Section 2 assumes that the tribo-pair operates under dry friction conditions, and the external load is entirely borne by the asperity contact. In the case of the lubricated rolling-sliding contact, the external load is shared by the oil film and asperity contact. The nonlinear variations of CLR and CAR during wear evolution become key factors in exciting contact vibration. Therefore, the above variables caused by surface wear under lubricating conditions are assigned corresponding physical meanings and incorporated into the contact vibration model for qualitative wear analysis.
  • Surface roughness corresponds to the surface profile height in the contact vibration model;
  • Assuming a constant external load, the CLR is used to calculate the incremental stiffness and damping coefficient in different wear states;
  • In the contact vibration model, the cut-off frequency reflects the sliding velocity, which is equivalent to the number of asperities swept by the mass block per unit of time. The CAR reflects the proportion of the asperity contact in the Hertz contact area and therefore corresponds to the cut-off frequency in the contact vibration model.

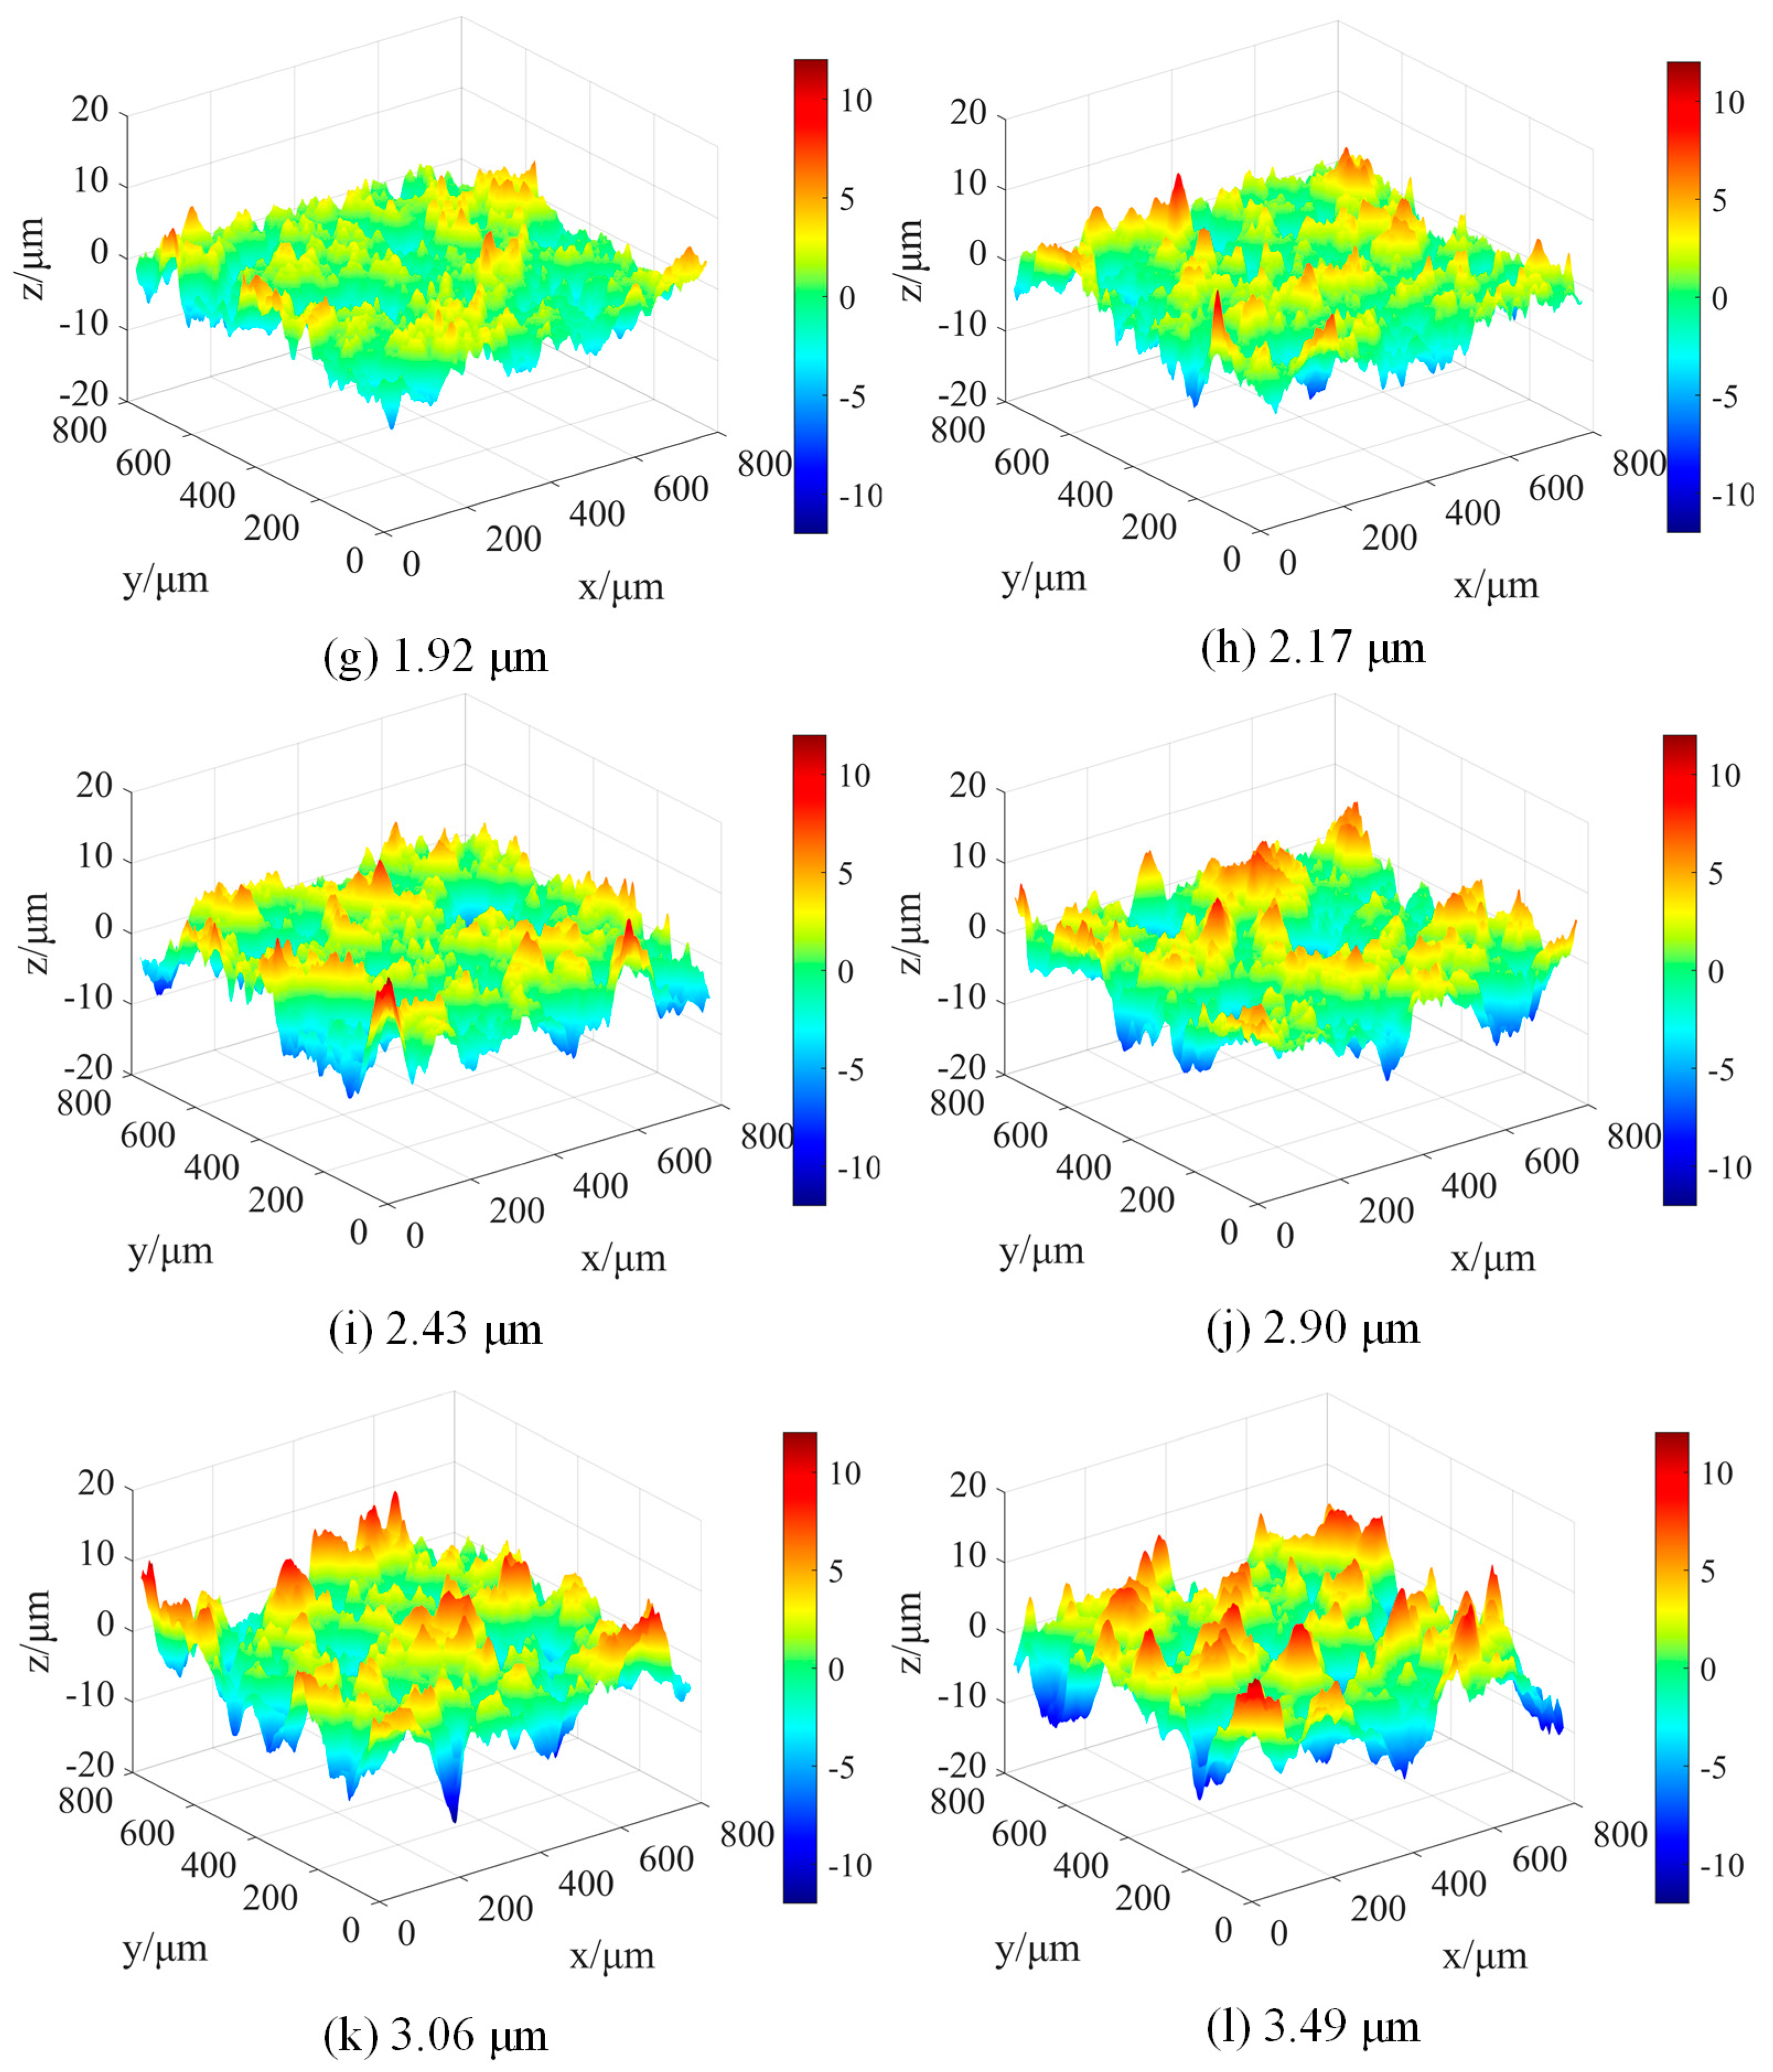
3.4. Wear Evolution Characterisation

Five rough surfaces are randomly generated in the mixed-EHL model for wear evolution simulations of lubricated rolling-sliding contacts, with the surface roughness ranging from 0.5 μm to 4 μm (in intervals of 0.1 μm). All the input parameters remain the same as the simulation in Section 3.1. The surface roughness, the obtained CLR, and CAR under different wear states are subsequently substituted into the contact vibration model to extract the CRF features. The results are shown in Figure 8.
Since the CRF is only correlated with the load, its evolution trend follows that of the CLR in Figure 7. The CRFA is negatively correlated with the load and is positively correlated with the sliding velocity and surface roughness, making it challenging to directly determine its evolution mechanism. Therefore, the CRFA is qualitatively analysed by matching the two wear stages inferred in Figure 7, and the splitting point in Figure 8 also occurs close to 2.5 μm.
In the normal wear stage, the CRFA is influenced by all three factors. The CLR and CAR increase at a close rate, with opposing effects on the CRFA, which can be considered to offset each other. Thus, the CRFA is mainly influenced by the surface roughness and increases linearly within a small range. At this stage, there may be slight abrasions on the tribo-pair surface caused by abrasive wear mechanisms [30]. In the severe wear stage, the CAR gradually reaches a stable state with an increase in surface roughness, and the CLR continues to increase. Due to the nonlinear variations of the three factors and their coupling effects, the CRFA shows an increasing trend overall, accompanied by noticeable irregular fluctuations. In addition, due to the surface roughness reaching nearly 4 μm, it may be considered a wear fault in the engineering application of high-precision rolling bearings. Severe scratches and pits caused by sliding wear mechanisms may appear on the tribo-pair surface [30]. Therefore, the irregular fluctuations of the CRFA may also be caused by these wear faults.

4. Experimental Verification

A rolling-sliding test rig was employed for wear evolution experiments. Tribo-pair samples with different rough surfaces were fabricated to replicate various wear conditions. The vibration signals were collected and examined through power spectral density analysis, and the CRF was extracted to characterise wear evolution.

4.1. Experimental Method

Figure 9 shows the experimental apparatus employed in this study. The 12 mm roller is driven by a high-speed electric spindle, and a 108 mm ring is fixed on a low-speed electric spindle. By adjusting the drive speeds, rolling-sliding motions are achieved. Both parts are constructed from 45 steel, with a density of 7800 kg/m3. They have a Young’s modulus of 207 GPa and a Poisson’s ratio of 0.3. Additionally, a vertical load can be applied on the roller via the loading system. The lubricating oil is driven by a pump to lubricate the tribo-pair through an oil pipe and subsequently circulates back to the oil tank. An accelerometer, with a measurement range of ±50 g, sensitivity of 100 mV/g, and a frequency response range of 0.5 Hz to 10 kHz, is mounted on the load block above the roller shaft to detect vertical vibrations.
A total of 12 ring samples were employed to replicate different wear conditions of the tribo-pair, as displayed in Figure 10. Sample 1 is a new ring, while sample 2 is a worn ring that underwent 10 h of wear, and samples 3 to 12 were fabricated using the sandblasting technique. A three-dimensional morphology analysis system [31] was used to measure their surface roughness ( S q , in μm), which are as follows: sample 1: 0.54 ± 0.10, sample 2: 0.87 ± 0.08, sample 3: 1.25 ± 0.05, sample 4: 1.31 ± 0.05, sample 5: 1.64 ± 0.10, sample 6: 1.68 ± 0.06, sample 7: 1.92 ± 0.10, sample 8: 2.17 ± 0.08, sample 9: 2.43 ± 0.05, sample 10: 2.90 ± 0.05, sample 11: 3.06 ± 0.10, and sample 12: 3.49 ± 0.06. Furthermore, new rollers, with S q of 0.30 ± 0.10 μm, were utilized in all experiments. Corresponding height maps were also generated to further illustrate the surface topography, as shown in Figure 11. It is evident that as surface roughness increases, the ring surface exhibits more pronounced asperities.
All experiments were performed under a constant load of 500 N. Two different spindle speeds are set, 300 r/min for the roller and 3375 r/min for the ring, achieving a relative sliding velocity of 2 m/s. A standard mineral oil, with a viscosity of 0.096 Pa·s and density of 0.88 g/cm3, was used as a lubricant. Each test lasted 300 s. Vibration signals were acquired with a sampling frequency of 20 kHz. To ensure the reliability of the results, each test was repeated five times.

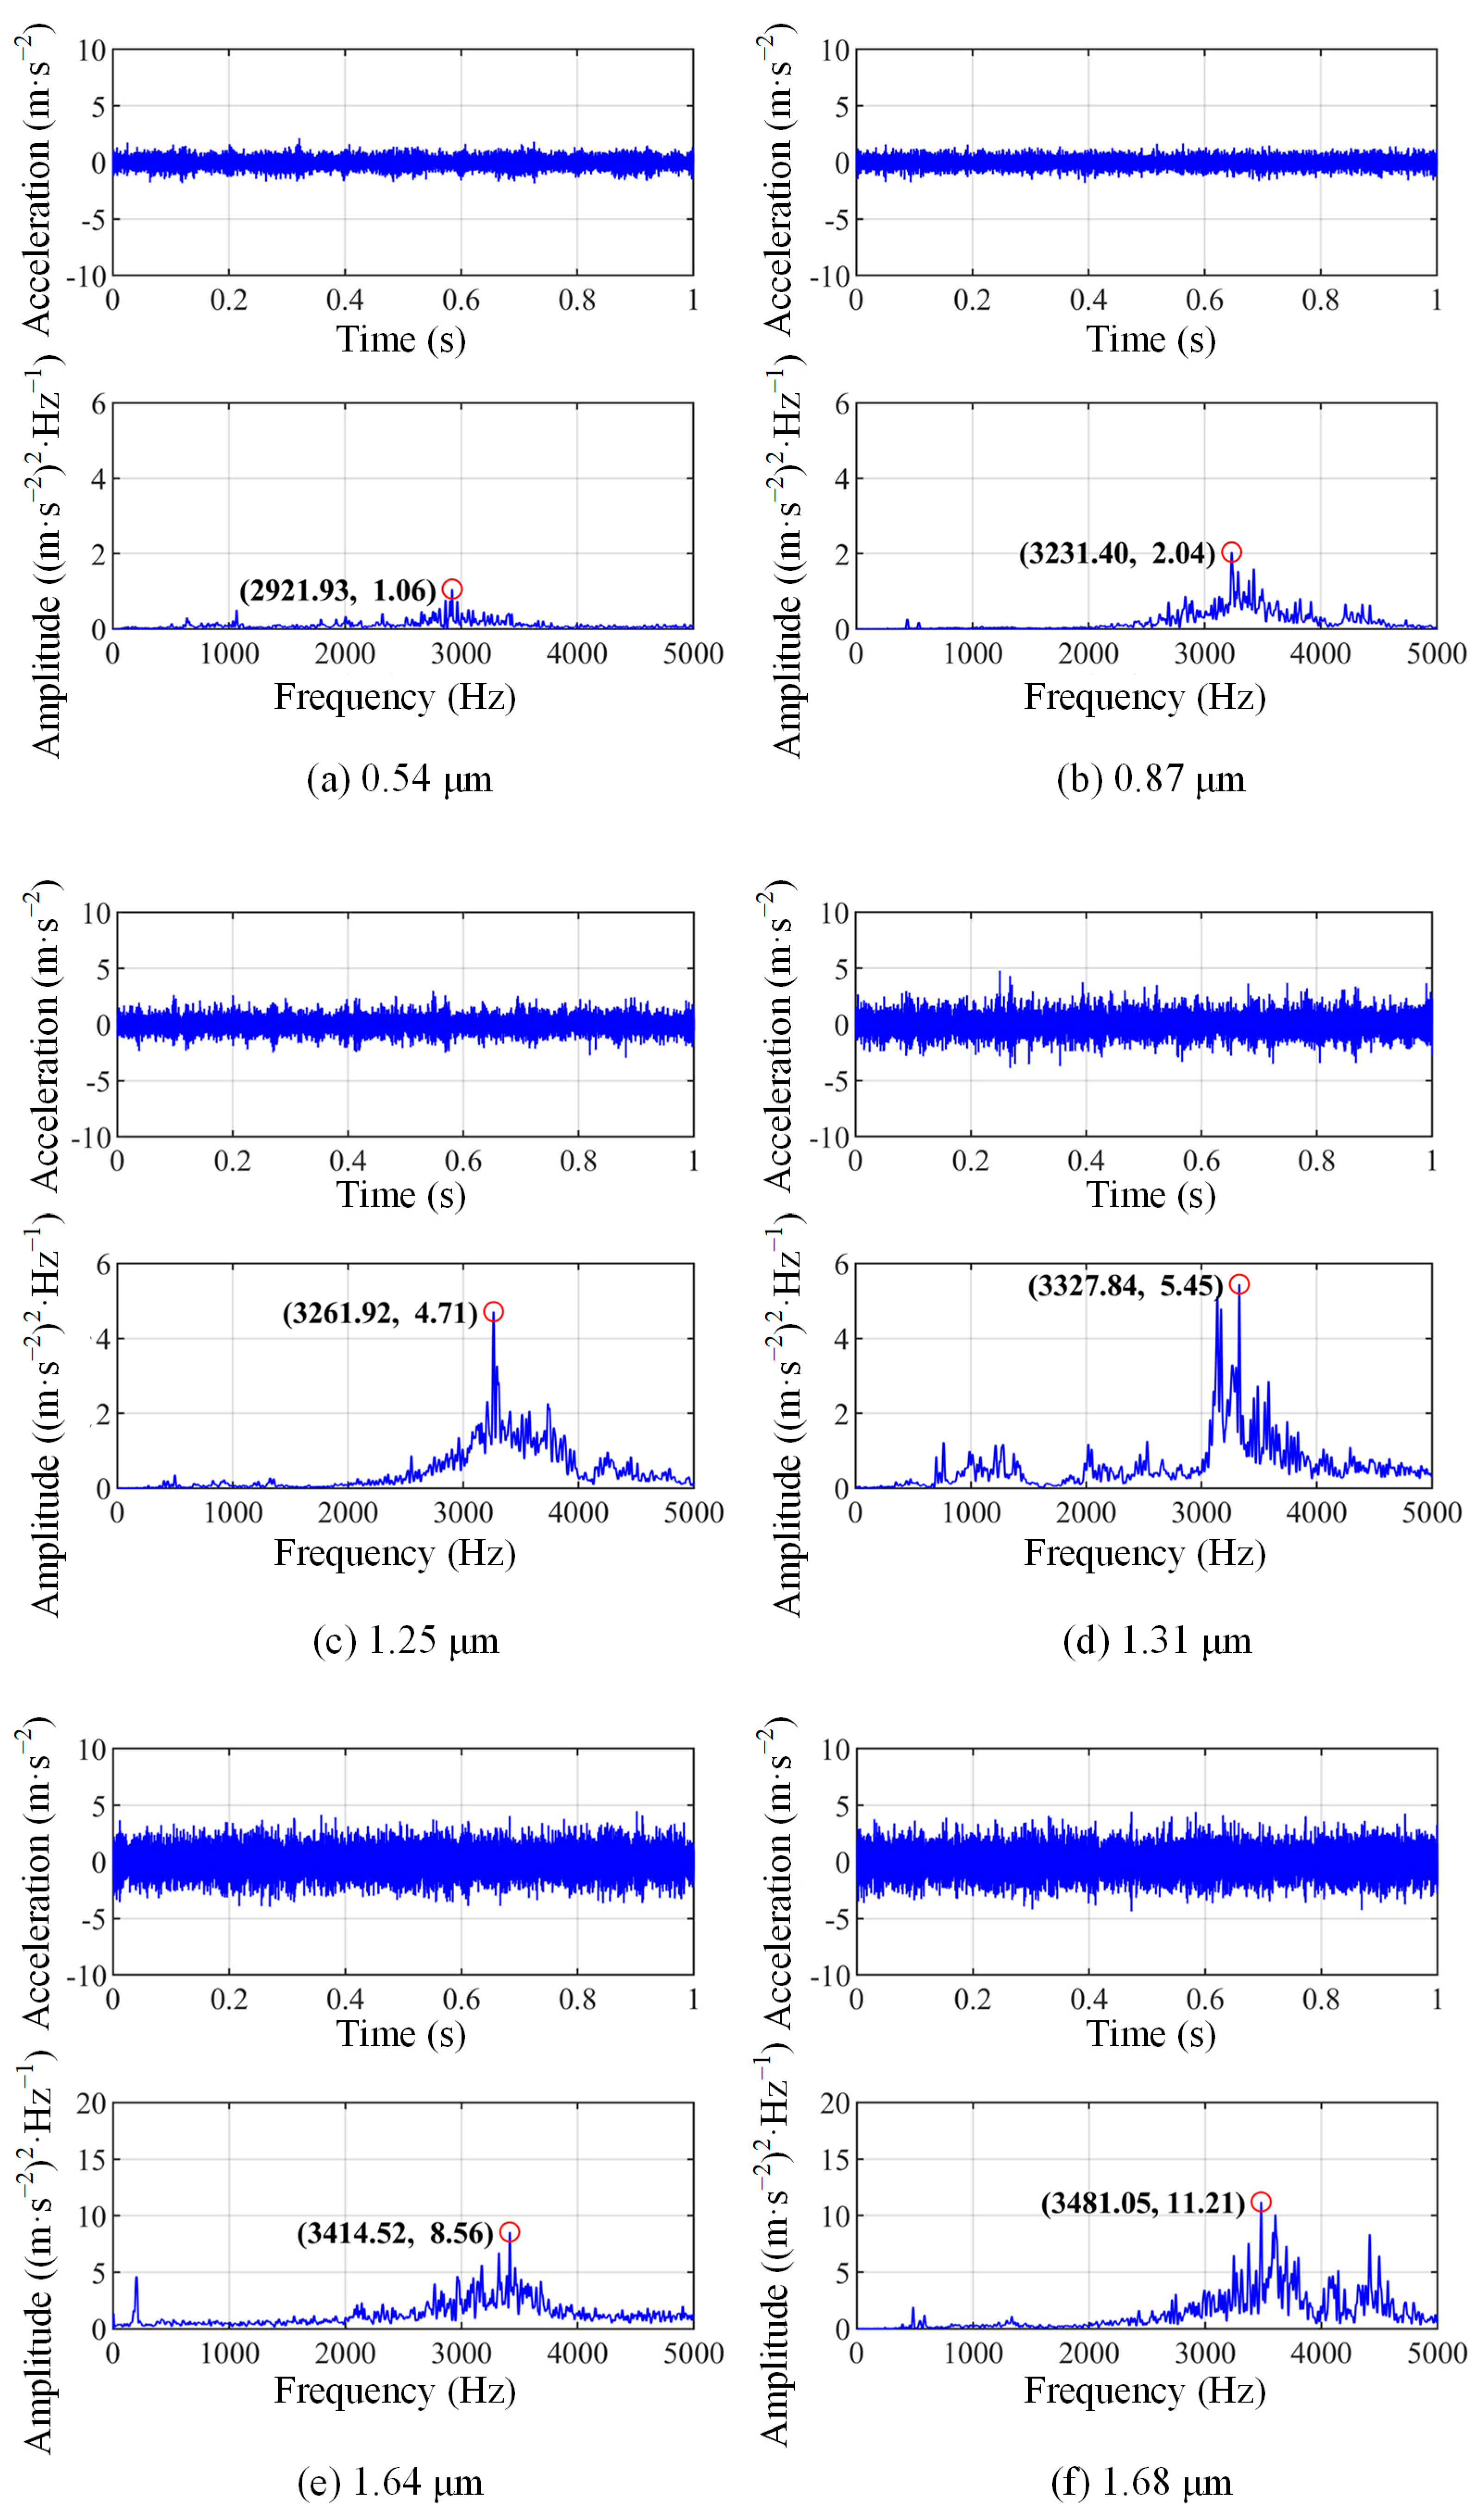
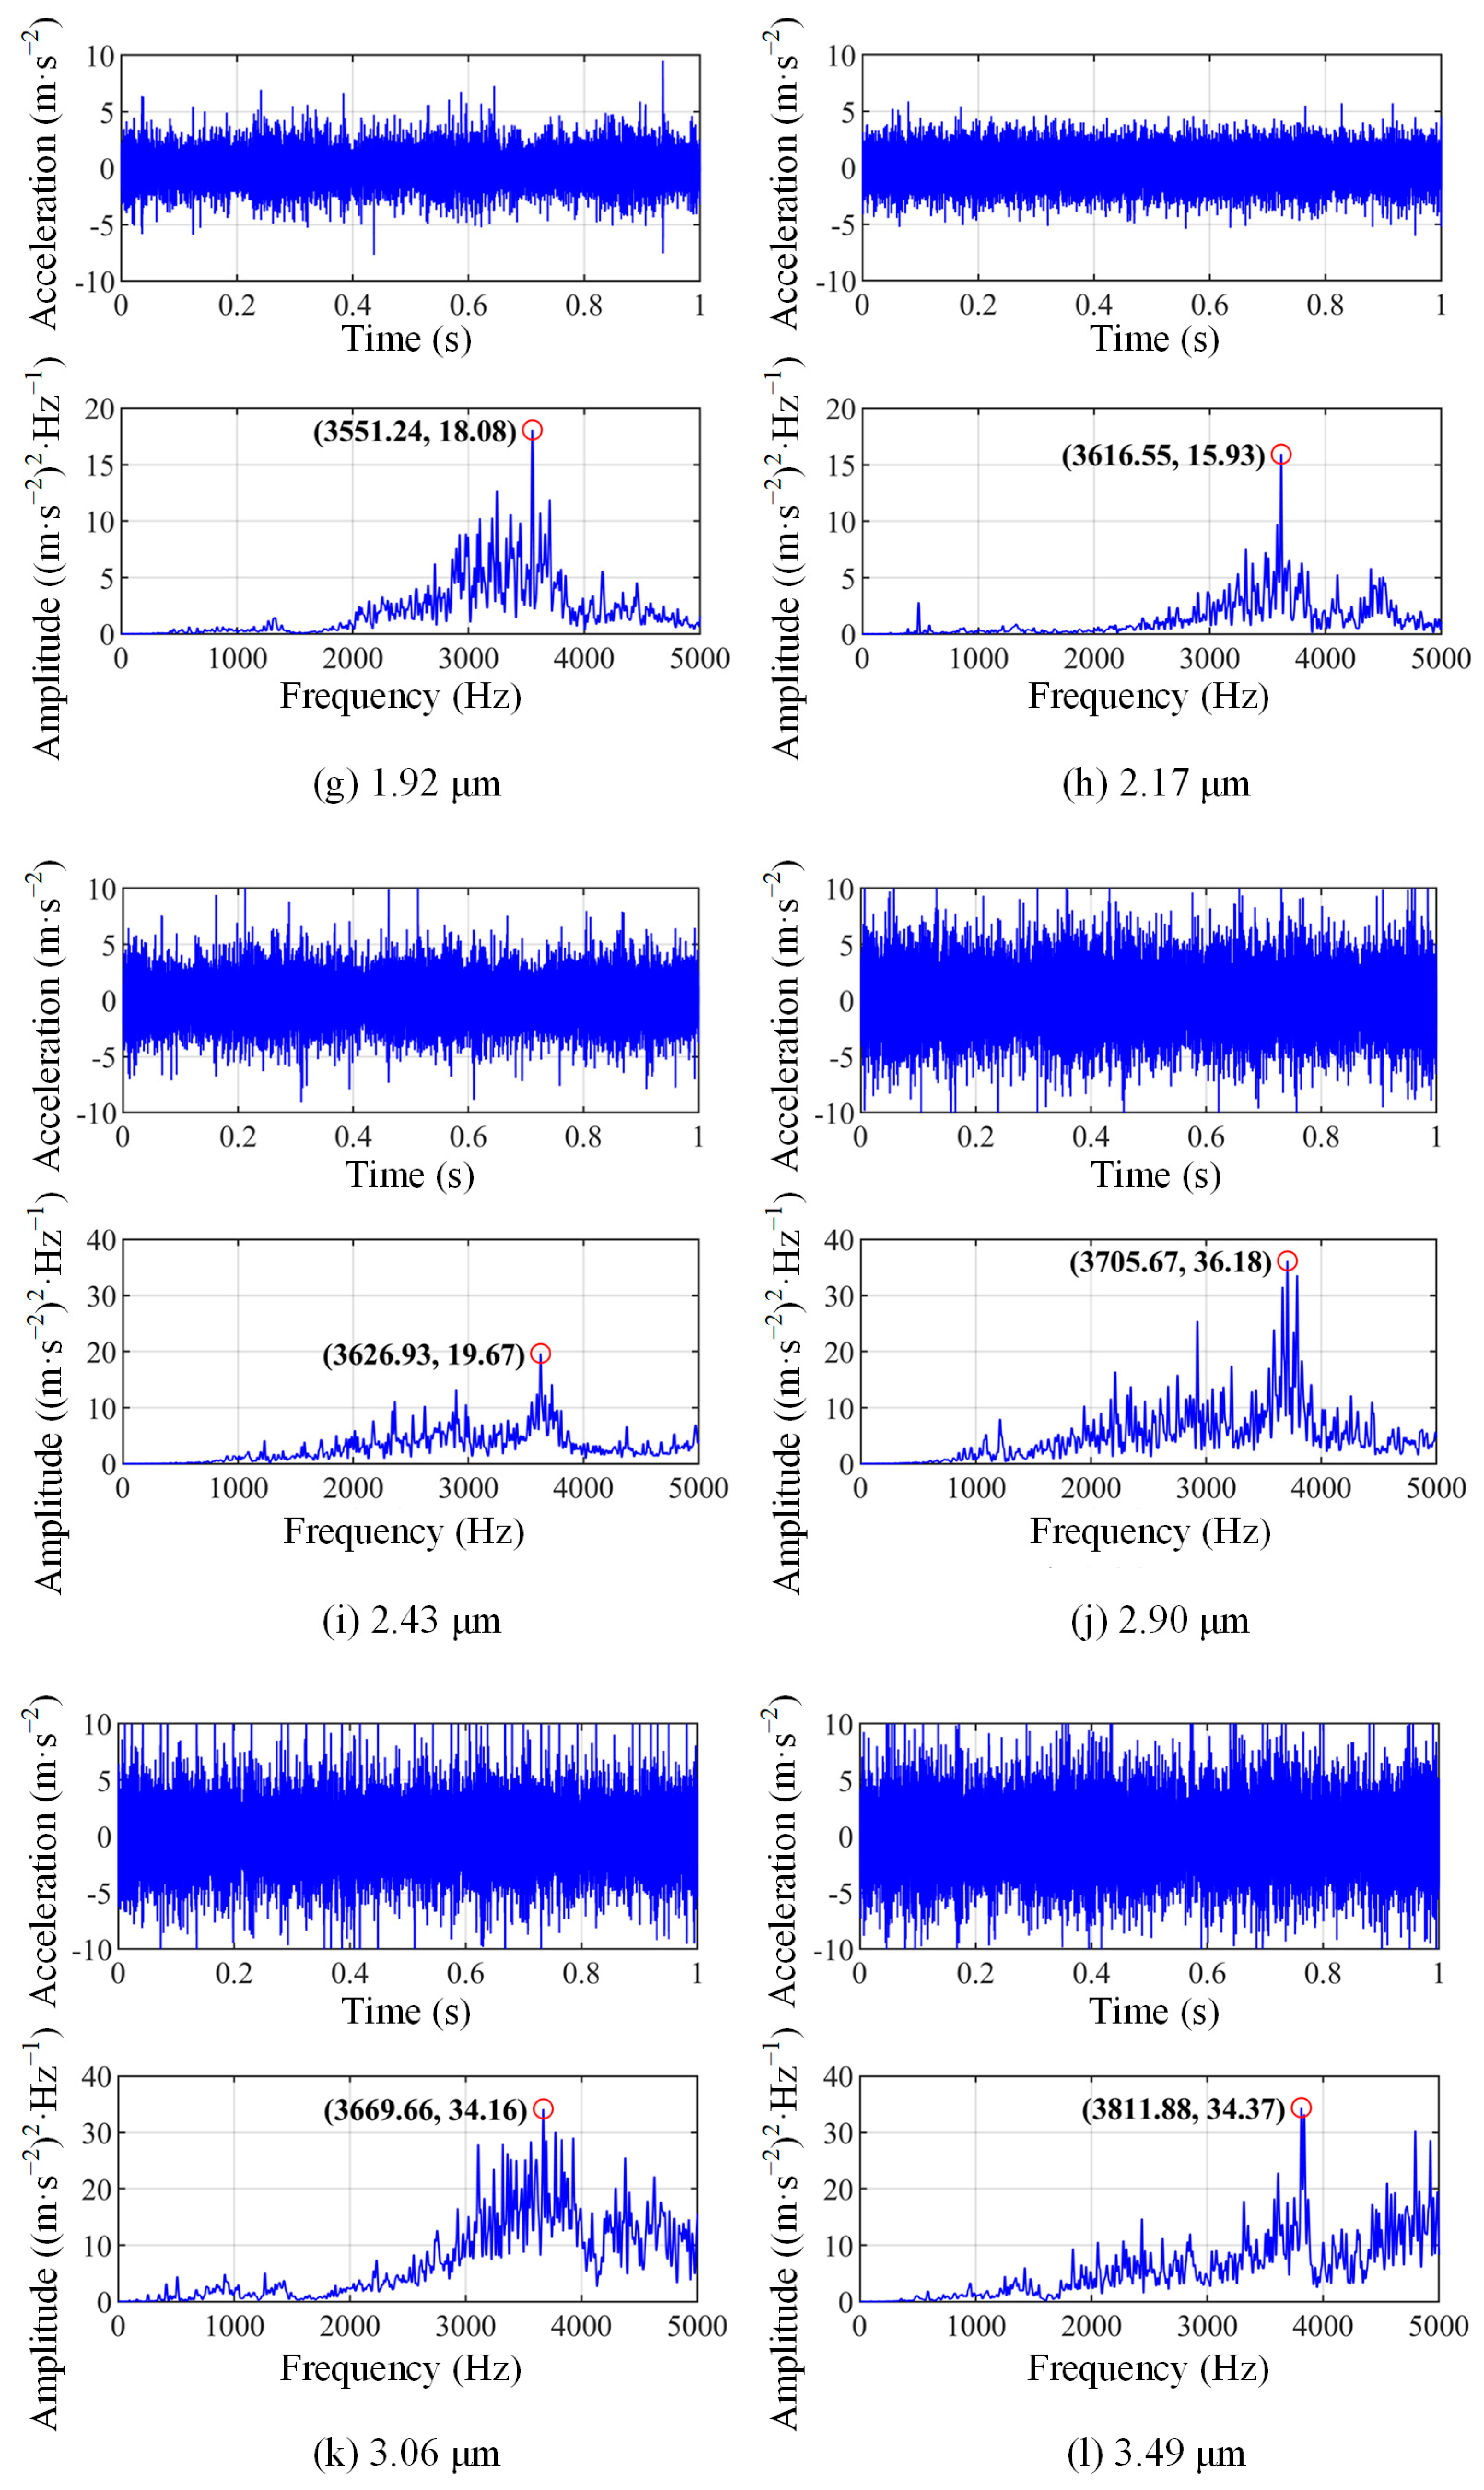
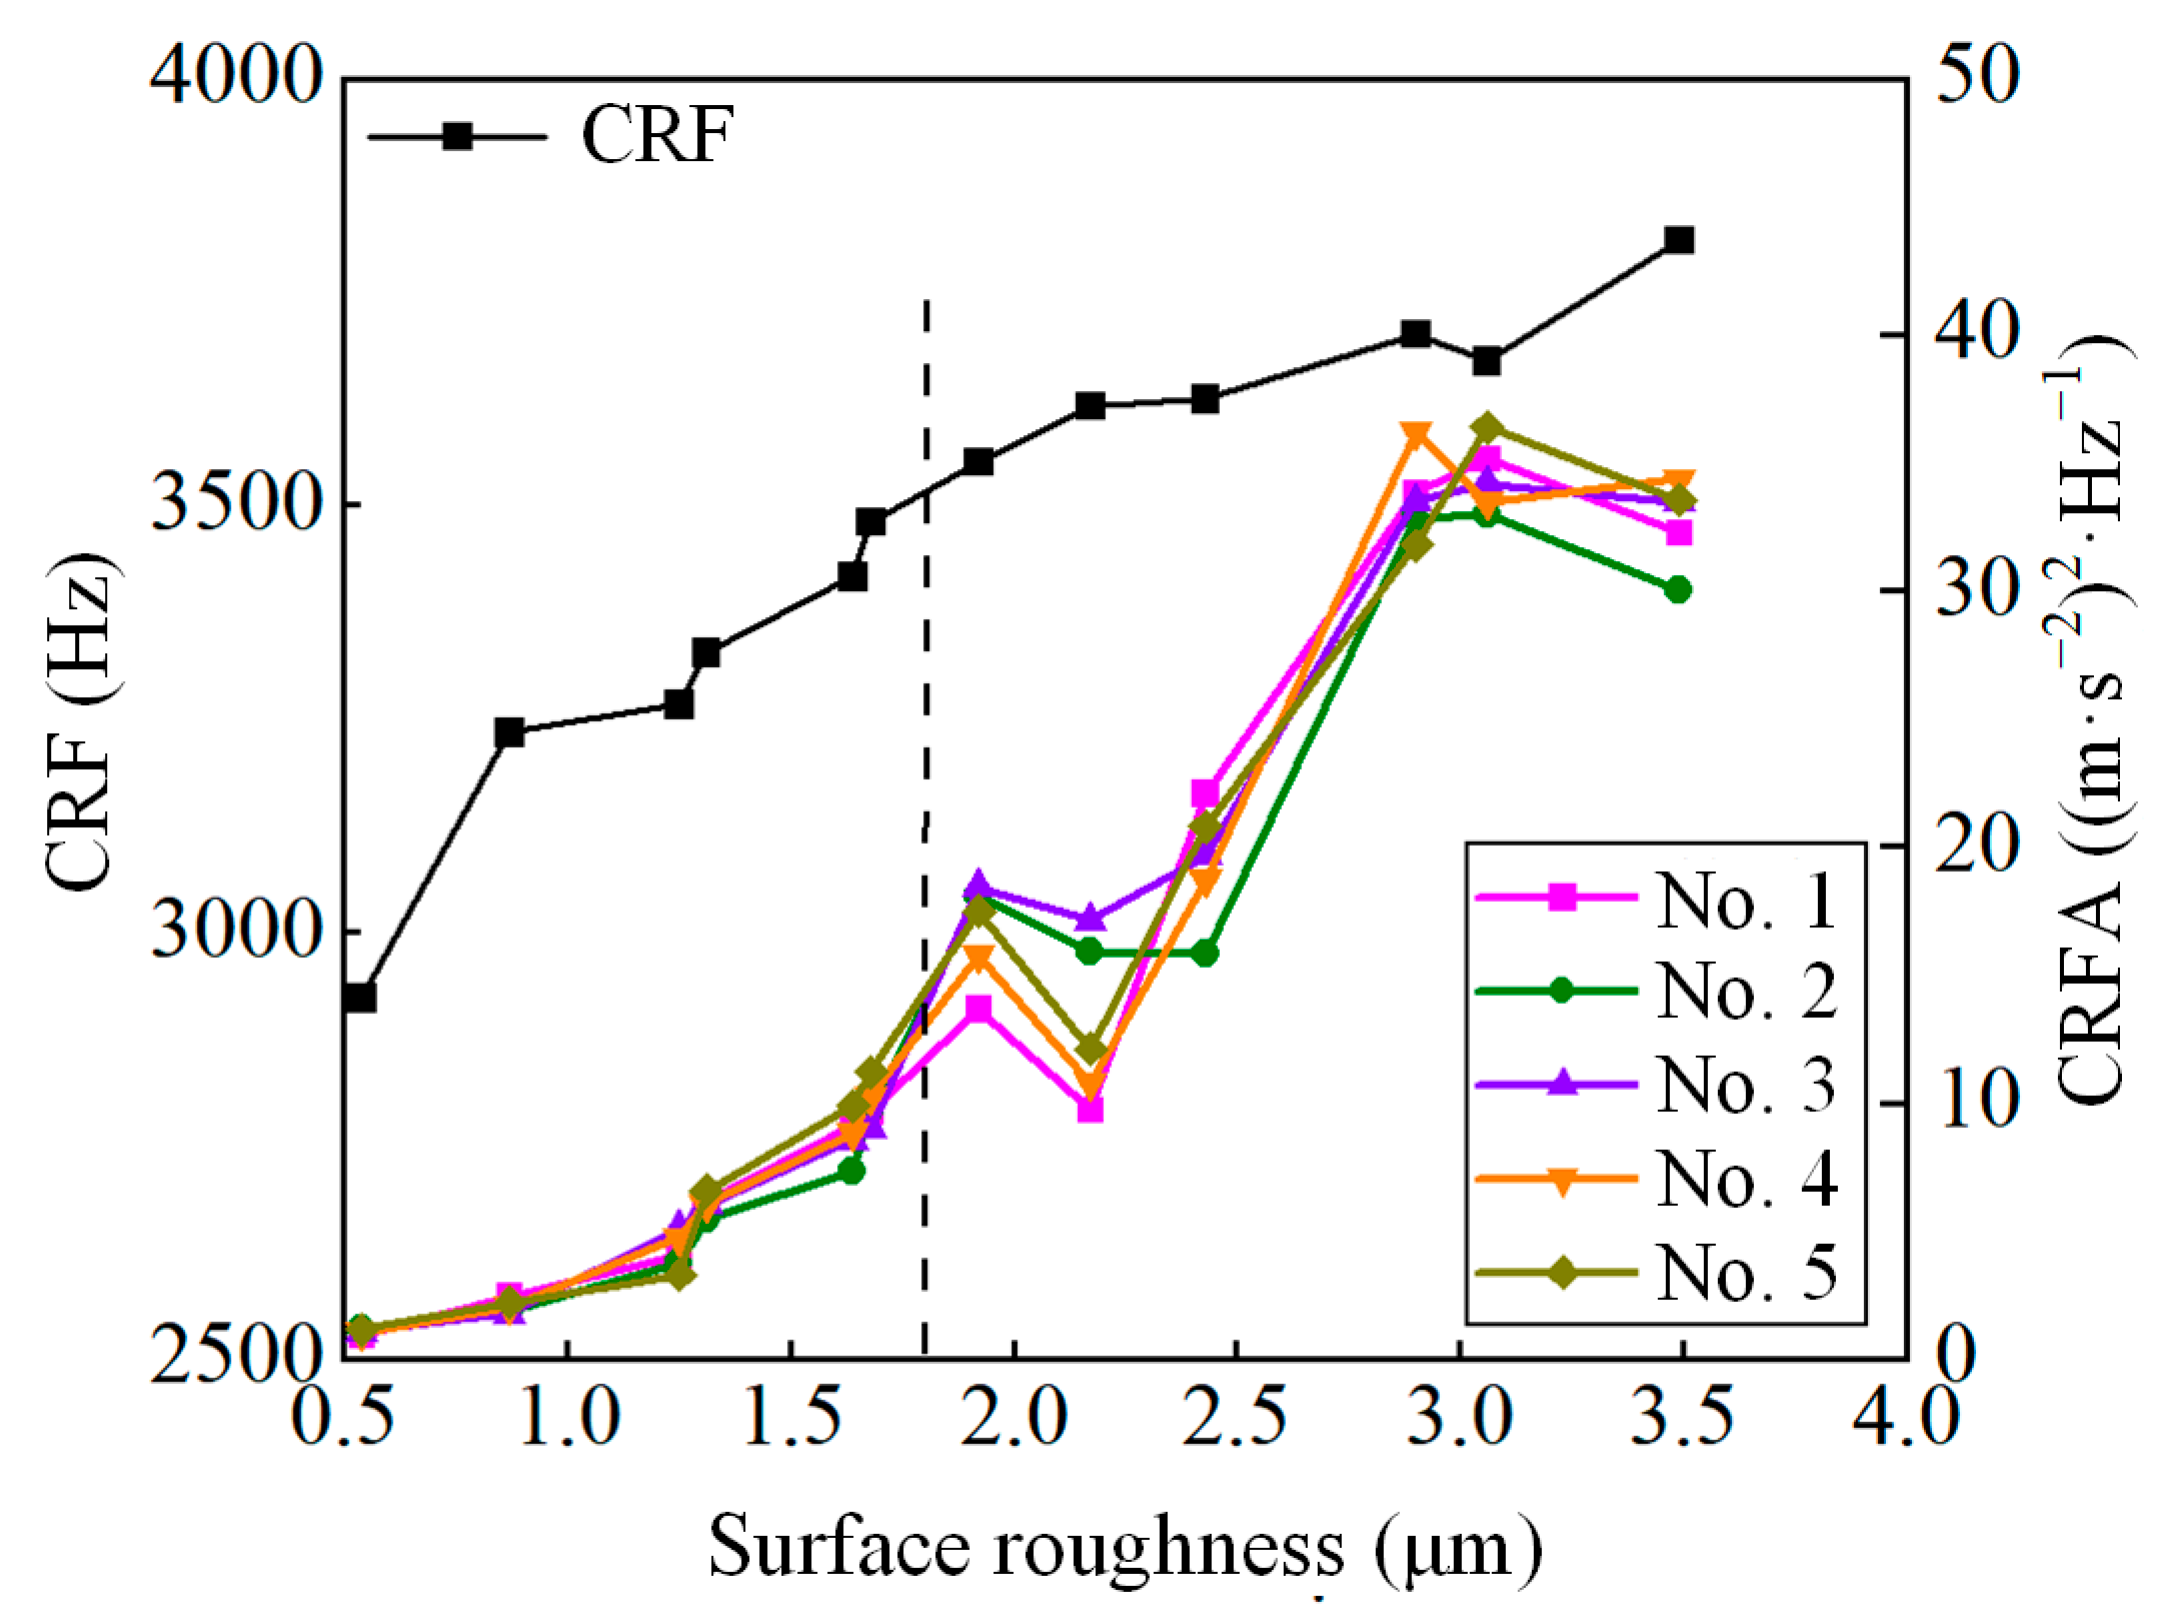
4.2. Result Analysis

Time-domain and power spectral density analyses were performed on the vibration signals obtained from the above experiments, and the results are shown in Figure 12. The CRFs under different surface roughness and a constant load of 500 N range from 2921.93 Hz to 3811.88 Hz. Due to different surface roughness and lubricating oil film distribution, the actual loads borne by asperity contacts did not reach 500 N. Therefore, the experimental CRF values are smaller than the calculated CRF under a constant load of 500N. This also validates the validity of the dynamic model.
To eliminate the influence of the interference signals, a five-point triple smoothing method was applied to preprocess each power spectral density signal. The highest point was selected as the CRF for wear evolution analysis. For statistical analysis, the CRF and CRFA values were extracted from the vibration signals of the five groups of tests carried out on each inner ring, and their evolution patterns are depicted in Figure 13. Among them, the CRF is expressed as an average value.
It can be seen from Figure 13, the CRF increases rapidly with the increase in surface roughness and then gradually stabilises. The CRFA shows an overall increasing trend but exhibits large irregular fluctuations as the roughness increases. Based on the influence mechanism of the CAR, CLR, and surface roughness on the CRF and CRFA during the wear evolution process, it can be roughly inferred that the tribo-pair is in a normal wear stage before 1.68 μm, and after 1.92 μm, it enters a serious wear stage. The experimental results align with the simulation data shown in Figure 8, thereby confirming the validity of the method presented in this paper.

5. Conclusions

A comprehensive study is presented to characterise the wear evolution of lubricated rolling-sliding contact using contact vibration indicators. A dynamic model is initially established to examine the contact vibration response induced by the random rough surface. Next, a mixed-EHL model is applied to simulate the wear and lubrication evolution of rolling-sliding contact. The surface roughness, CLR, and CAR during this process are incorporated into the dynamic model, and a wear evolution characterisation method based on the CRF is proposed. Finally, rolling-sliding experiments are conducted for verification. The main conclusions are summarized as follows:
  • A CRF can be obtained by the established contact vibration model. Power spectral density analysis results indicate that the CRF is only positively correlated with the load, while the CRFA negatively correlates with the load and positively correlates with the velocity and surface profile height.
  • The complex dynamic behaviour of lubricated rolling-sliding contact can be reflected by the evolution of contact conditions. When the tribo-pair is in a normal wear stage, the CAR and CLR increase with the surface roughness. Upon reaching a severe wear stage, the CAR tends to stabilise while the CLR continues to increase.
  • The vibration-based wear evolution characterisation of lubricated rolling-sliding contact depends on the nonlinear changes in the surface roughness, CAR and CLR and their coupling effects. The CRF and CRFA can be utilised to distinguish the normal wear and severe wear stages.

Author Contributions

Methodology, C.X.; software, C.X.; validation, C.X. and Y.T.; investigation, C.X.; writing—original draft preparation, C.X., Q.F. and Q.Z.; writing—review and editing, C.X., Q.F. and T.W.; visualization, C.X. and Y.T.; supervision, C.X. and Q.Z.; project administration, C.X.; funding acquisition, C.X., Q.F., Y.T. and S.W. All authors have read and agreed to the published version of the manuscript.

Funding

The authors appreciate the financial support from the Supported by Fundamental Research Program of Shanxi Province (Grant No. 202303021222036 and 202303021222165), the Shanxi Province Science and Technology Cooperation Exchange Project: Key National Science and Technology Cooperation Project (Grant No. 202304041101007), and the National Science Foundation of China (Grant No. 52475163).

Data Availability Statement

The original contributions presented in this study are included in the article; further inquiries can be directed to the corresponding authors.

Conflicts of Interest

The authors declare no conflicts of interest.

Abbreviations

The following abbreviations are used in this manuscript:
CLRContact load ratio
CARContact area ratio
CRFContact resonance frequency
CRFAAmplitude of contact resonance frequency

References

  1. Atef, M.M.; Khair-Eldeen, W.; Yan, J.; Nassef, M.G.A. A nonlinear dynamic analysis of skidding behavior in rolling bearings using lubricant traction coefficients and cage flexibility. Tribol. Int. 2024, 197, 109756. [Google Scholar] [CrossRef]
  2. Hu, L.; Wang, Z.; Wang, J.; Wang, Y. Derivative analysis and evaluation of roll-slip fretting wear mechanism of ultra-thin-walled bearings under high service. Wear 2024, 562, 205630. [Google Scholar] [CrossRef]
  3. Nirwan, N.W.; Ramani, H.B. Condition monitoring and fault detection in roller bearing used in rolling mill by acoustic emission and vibration analysis. Mater. Today Proc. 2021, 51, 344–354. [Google Scholar] [CrossRef]
  4. Becker-Dombrowsky, F.M.; Koplin, Q.S.; Kirchner, E. Individual Feature Selection of Rolling Bearing Impedance Signals for Early Failure Detection. Lubricants 2023, 11, 304. [Google Scholar] [CrossRef]
  5. Xu, C.; Li, B.; Wu, T. Wear characterization under sliding-rolling contact using friction-induced vibration features. Proc. Inst. Mech. Eng. Part J J. Eng. Tribol. 2022, 236, 634–647. [Google Scholar] [CrossRef]
  6. Amarnath, M.; Krishna, I.R.P. Detection and diagnosis of surface wear failure in a spur geared system using EEMD based vibration signal analysis. Tribol. Int. 2013, 61, 224–234. [Google Scholar] [CrossRef]
  7. Venkata Rao, K.; Murthy, B.S.N.; Mohan Rao, N. Prediction of cutting tool wear, surface roughness and vibration of work piece in boring of AISI 316 steel with artificial neural network. Meas. J. Int. Meas. Confed. 2014, 51, 63–70. [Google Scholar] [CrossRef]
  8. Zhou, Y.; Zuo, X.; Zhu, H. Application of chaos theory to optimize the running-in parameters by using a running-in attractor. Wear 2019, 420–421, 1–8. [Google Scholar] [CrossRef]
  9. Tian, Y.; He, C.G.; Zhang, J.; Liu, Q.Y.; Wang, W.J. Experimental study on the vibration characteristic responses on the surface damage of wheel materials. Proc. Inst. Mech. Eng. Part J J. Eng. Tribol. 2018, 232, 1160–1168. [Google Scholar] [CrossRef]
  10. Feng, K.; Smith, W.A.; Borghesani, P.; Randall, R.B.; Peng, Z. Use of cyclostationary properties of vibration signals to identify gear wear mechanisms and track wear evolution. Mech. Syst. Signal Process. 2021, 150, 107258. [Google Scholar] [CrossRef]
  11. Silaev, B.M.; Barmanov, I.S.; Danilenko, P.A. Predicting the propagation of damage in roller bearings of aircraft engines by vibration analysis. J. Frict. Wear 2016, 37, 389–394. [Google Scholar] [CrossRef]
  12. Sun, D.; Li, G.; Wei, H.; Liao, H.; Liu, T. Investigation on Frictional Vibration Behavior of Tribological Pairs under Different Wear States. J. Tribol. 2015, 137, 021606. [Google Scholar] [CrossRef]
  13. Immovilli, F.; Cocconcelli, M.; Bellini, A.; Rubini, R. Detection of generalized-roughness bearing fault by spectral-kurtosis energy of vibration or current signals. IEEE Trans. Ind. Electron. 2009, 56, 4710–4717. [Google Scholar] [CrossRef]
  14. Kilundu, B.; Chiementin, X.; Duez, J.; Mba, D. Cyclostationarity of Acoustic Emissions (AE) for monitoring bearing defects. Mech. Syst. Signal Process. 2011, 25, 2061–2072. [Google Scholar] [CrossRef]
  15. Yang, Y.; Smith, W.A.; Borghesani, P.; Peng, Z.; Randall, R.B. Detecting changes in gear surface roughness using vibration signals. In Proceedings of the Acoustics 2015, Hunter Valley, NSW, Australia, 15–18 November 2015; pp. 1–10. [Google Scholar]
  16. Zhang, X.; Smith, W.A.; Borghesani, P.; Peng, Z.; Randall, R.B. Use of cyclostationarity to detect changes in gear surface roughness using vibration measurements. In Lecture Notes in Mechanical Engineering; Springer International Publishing: Cham, Switzerland, 2019. [Google Scholar] [CrossRef]
  17. Soom, A.; Chen, J.W. Simulation of random surface roughness-induced contact vibrations at hertzian contacts during steady sliding. J. Tribol. 1986, 108, 123–127. [Google Scholar] [CrossRef]
  18. Hess, D.P.; Soom, A.; Kim, C.H. Normal vibrations and friction at a hertzian contact under random excitation: Theory and experiments. J. Sound Vib. 1992, 153, 491–508. [Google Scholar] [CrossRef]
  19. Sudeep, U.; Tandon, N.; Pandey, R.K. Vibration studies of lubricated textured point contacts of bearing steels due to surface topographies: Simulations and experiments. Tribol. Int. 2016, 102, 265–274. [Google Scholar] [CrossRef]
  20. Sudeep, U.; Tandon, N.; Pandey, R.K. Comparisons of tribological and vibration behaviors of textured point contacts of bearing steel lubricated with oil and grease under starved conditions. J. Tribol. 2016, 138, 031504. [Google Scholar] [CrossRef]
  21. Zhu, D.; Hu, Y.Z. A computer program package for the prediction of ehl and mixed lubrication characteristics, friction, subsurface stresses and flash temperatures based on measured 3-d surface roughness. Tribol. Trans. 2001, 44, 383–390. [Google Scholar] [CrossRef]
  22. Wang, J.; Zhu, D. Interfacial Mechanics: Theories and Methods for Contact and Lubrication, 1st ed.; CRC Press: Boca Raton, FL, USA, 2019. [Google Scholar] [CrossRef]
  23. Zhu, D.; Wang, J.; Wang, Q.J. On the Stribeck Curves for Lubricated Counterformal Contacts of Rough Surfaces. J. Tribol. 2015, 137, 021501. [Google Scholar] [CrossRef]
  24. Dowson, D.; Higginson, G.R.; Whitaker, A.V. Elasto-hydrodynamic lubrication: A survey of isothermal solutions. ARCHIVE J. Mech. Eng. Sci. 1962, 4, 121–126. [Google Scholar] [CrossRef]
  25. Peiran, Y.; Shizhu, W. A Generalized Reynolds Equation for Non-Newtonian Thermal Elastohydrodynamic Lubrication. J. Tribol. 1990, 112, 631–636. [Google Scholar] [CrossRef]
  26. Barus, C. Isothermals, isopiestics and isometrics relative to viscosity. Am. J. Sci. 1893, 3, 87–96. [Google Scholar] [CrossRef]
  27. Principles of Tribology. Mechanical Engineering-CIME VO—134 2012, 12, 56. Available online: http://stat.lib.xjtu.edu.cn/go?url=http://search.ebscohost.com/login.aspx?direct=true&db=edsgbe&AN=edsgcl.310867796&lang=zh-cn&site=eds-live (accessed on 1 January 2020).
  28. Bair, S.; Winer, W.O. A rheological model for elastohydrodynamic contacts based on primary laboratory data. J. Tribol. 1979, 101, 258–264. [Google Scholar] [CrossRef]
  29. Pu, W.; Zhu, D.; Wang, J.; Wang, Q.J. Rolling-sliding contact fatigue of surfaces with sinusoidal roughness. Int. J. Fatigue 2016, 90, 57–68. [Google Scholar] [CrossRef]
  30. Xie, X.; Xu, J.; Luo, J. Analysis of skid damage to cylindrical roller bearing of mainshaft of aeroengine. J. Mech. Sci. Technol. 2020, 34, 3239–3247. [Google Scholar] [CrossRef]
  31. Xu, C.; Wu, T.; Huo, Y.; Yang, H. In-situ characterization of three dimensional worn surface under sliding-rolling contact. Wear 2019, 426–427, 1781–1787. [Google Scholar] [CrossRef]
Figure 1. The dynamic model of rolling-sliding contact [17].
Lubricants 13 00078 g001
Figure 2. The linearisation method of Hertz contact stiffness [17].
Lubricants 13 00078 g002
Figure 3. Simulation of rough surface based on Gaussian white noise.
Lubricants 13 00078 g003
Figure 4. Solution results of the dynamic equation by the fifth-order Runge–Kutta algorithm.
Lubricants 13 00078 g004
Figure 5. Different wear states simulated by eight rough surfaces.
Lubricants 13 00078 g005
Figure 6. The contact states during the wear evolution process.
Lubricants 13 00078 g006
Figure 7. The CLR and CAR during the wear evolution process.
Lubricants 13 00078 g007
Figure 8. The CRF features during the wear evolution process.
Lubricants 13 00078 g008
Figure 9. The structure schematic diagram of the rolling-sliding test rig [31].
Lubricants 13 00078 g009
Figure 10. The fabricated ring samples with different S q .
Lubricants 13 00078 g010
Figure 11. The surface height map of the ring with different roughness.
Lubricants 13 00078 g011aLubricants 13 00078 g011b
Figure 12. Time domain and power spectral density plots of vibration signals excited by different rough surfaces.
Lubricants 13 00078 g012aLubricants 13 00078 g012b
Figure 13. The CRF features excited by different rough surfaces.
Lubricants 13 00078 g013
Table 1. The CRF for different load, velocity, and surface profile height.
Cut-Off Frequency (Hz)Surface Profile Height (μm)Load (N)CRF (Hz)CRFA ((m·s−2)2·Hz−1)
3021002965.452.05
3022003322.550.64
3023003573.430.31
3024003742.520.25
3012003322.550.16
3022003322.550.64
3032003322.551.45
3042003322.552.58
1022003322.550.01
2022003322.550.13
3022003322.550.64
4022003322.552.04
Table 2. The input parameters for wear and lubrication evolution simulation.
ParametersValuesParametersValues
Radius of curvature (mm)5.4Lubricant Viscosity (Pa·s)0.096
Contact length (mm)10Load (N)500
Equivalent elastic modulus (GPa)219.78Slip ratio0.2
Poisson’s ratio0.3Relative sliding velocity (m·s−1)2
Frictional coefficient0.15Comprehensive surface roughness (μm)
(with an interval of 0.1 μm)
0.5~4
Lubricant density (g·cm−3)0.88
Disclaimer/Publisher’s Note: The statements, opinions and data contained in all publications are solely those of the individual author(s) and contributor(s) and not of MDPI and/or the editor(s). MDPI and/or the editor(s) disclaim responsibility for any injury to people or property resulting from any ideas, methods, instructions or products referred to in the content.

