Article

Primary Prediction of Oil Film Cavitation Between Rotating Friction Pairs with Various Types of Surface Textures

1
School of Mechanical Engineering, Northwestern Polytechnical University, Xi’an 710072, China
2
Shaanxi Fast Auto Drive Group Co., Ltd., Xi’an 710119, China
3
College of Mechanical and Electronic Engineering, Northwest A&F University, Yangling 712100, China
*
Author to whom correspondence should be addressed.
Lubricants 2025, 13(12), 513; https://doi.org/10.3390/lubricants13120513
Submission received: 29 October 2025 / Revised: 18 November 2025 / Accepted: 21 November 2025 / Published: 25 November 2025

Abstract

Oil film cavitation in the friction pairs of wet clutches significantly compromises transmission stability and component durability. This study investigates the cavitation evolution across three microtexture types—hexahedral, cylindrical, and hemispherical—with texture ratios ranging from 3.205% to 12.917% and a constant depth of 0.0564 mm, under a 6000 rpm operating condition. A finite element model of the oil film was established to analyze the cavitation volume fraction, pressure field, and gas-phase mass transfer rate. The numerical simulations were complemented by visualization experiments, where high-speed imaging (550–1050 rpm) captured the cavitation bubble dynamics, and the transmitted torque was measured. The results indicate that microtexture parameters profoundly influence cavitation intensity. Hemispherical textures with a 6.41% texture ratio yielded the highest cavitation volume fraction (0.020215), substantially exceeding that of hexahedral textures (0.0015197). Cavitation initiates within the texture dimples, with hemispherical geometries facilitating its diffusion into non-textured regions. A threshold effect of the texture ratio was identified, where cavitation intensity peaks at 6.41% but diminishes at 12.917%, attributable to flow homogenization. Optimized designs can effectively suppress cavitation: either increasing the texture depth or adopting a high texture ratio (>45%) with hexahedral or cylindrical geometries reduces the pressure drop in low-pressure zones by over 30%. Experimental validation confirmed that an increased texture ratio reduces torque by 20%, correlating with the shrinkage of the oil film at the outer diameter. High-speed imaging revealed a periodic cavitation evolution, with the collapse of sheet-to-cloud cavitation occupying 15.2% of the cycle, which aligns with the simulated peak in mass transfer at t = 0.003 s. In conclusion, cavitation can be effectively controlled by optimizing the texture ratio, depth, and geometry to maintain a stable oil film pressure gradient. This study provides a theoretical foundation for the microtexture design of wet clutches, thereby enhancing their reliability in power-shift applications.

1. Introduction

In modern high power-density transmission systems, such as the power-shift transmissions found in construction machinery and heavy-duty vehicles, wet clutches play a critical role in torque transmission and shift quality control. Their performance is highly dependent on the stability and load-carrying capacity of the micron-scale lubricating oil film between the friction pairs [1,2]. However, under high-speed and high-differential-speed operating conditions, the fluid dynamics within the oil film become exceptionally complex. Among these phenomena, oil film cavitation stands out as a primary source of transmission instability, vibration and noise, and even erosive damage to component surfaces [3,4]. Cavitation is essentially a phase transition process of the liquid in localized low-pressure regions. The resulting bubbles collapse rapidly upon entering high-pressure zones, releasing immense shock energy [5,6]. This severely compromises the integrity of the oil film and leads to drastic fluctuations in torque transmission, becoming a major technical bottleneck that limits the reliability of wet clutches at high rotational speeds.
To enhance oil film stability and suppress detrimental cavitation, surface micro-texturing technology is regarded as a highly promising solution. By fabricating micron-scale dimples of specific geometries on the friction pair surfaces, a significant hydrodynamic pressure effect can be generated, thereby improving the film’s load-carrying capacity and providing space for trapping wear debris [7,8]. Numerous studies have confirmed that texture parameters, such as depth and area density, are key factors influencing their hydrodynamic lubrication performance [9,10]. Theoretically, an enhanced hydrodynamic effect should help maintain oil film pressure, thus suppressing the onset of cavitation.
However, the effect of surface textures on the flow field is a double-edged sword. While texture dimples generate hydrodynamic pressure, their geometric boundaries can also disturb the high-speed fluid flow, creating localized low-pressure zones in the divergent section and downstream of the dimple. This, in turn, can induce or exacerbate cavitation. Existing research has largely focused on confirming the positive effects of textures on enhancing load-carrying capacity and reducing friction [11,12], or has only conducted preliminary observations of cavitation for a single texture shape [13]. Currently, there is a significant lack of comparative studies in the field that systematically investigate how different texture geometries (e.g., hexahedral, cylindrical, spherical) and their key parameters (e.g., area ratio, depth) affect the inception, evolution, and intensity of cavitation. In other words, the critical scientific question-“What texture design can maximize the hydrodynamic effect while minimizing induced cavitation?”-has not yet been fully answered. This knowledge gap leads to texture designs that are often empirical, making it difficult to achieve an optimal balance between suppressing cavitation and maintaining load-carrying capacity. This, in turn, limits the reliable application of micro-texturing technology in high-performance transmission systems. As pointed out in recent reviews, flow field instability is the direct cause of cavitation, and the complex control mechanism of textures on the flow field still requires in-depth exploration [14,15].
To fill the aforementioned research gap and provide a theoretical basis for the anti-cavitation texture design of high-performance wet clutches, this study systematically conducts the following work using a combined approach of numerical simulation and experimental visualization:
(1)
Comparatively investigating the influence of three typical micro-texture shapes—hexahedral, cylindrical, and hemispherical—at different area ratios on the evolution process of oil film cavitation.
(2)
Elucidating the underlying physical mechanisms connecting key texture parameters (geometry, area ratio, and depth) with the inception location, development pattern, and final intensity of cavitation.
(3)
Proposing an optimized design strategy for textures aimed at suppressing cavitation while ensuring a sufficient hydrodynamic pressure effect, based on the analysis of the flow and pressure fields.
(4)
Validating the effectiveness of the simulation results through high-speed photography and torque measurement experiments and revealing the actual impact of texturing on torque transmission characteristics.

2. Materials and Methods

2.1. Surface Texture Design

To clarify the working mechanism of surface textures in friction pairs, both non-textured and textured friction pairs were designed as part of this study. The non-textured pair serves as a reference sample with no artificial dimples, maintaining only the basic machining roughness and presenting a macroscopically flat surface (Figure 1a). Three types of dimpled surface textures—hexagonal prism, cylindrical, and hemispherical—were designed as counterparts to the smooth surface (Figure 1b–d). The hexagonal prism dimples feature distinct edges and corners, demonstrating outstanding performance in capturing and accommodating wear debris. This design effectively isolates abrasive particles, reducing three-body wear. Their straight sidewalls and sharp edges enhance local oil film retention, providing fundamental oil reservoir functionality. Cylindrical dimples offer optimal comprehensive performance and manufacturing economy. Their straight-wall structure provides a stable oil reservoir space and an excellent capability for capturing wear debris. The smooth sidewalls reduce flow resistance while generating moderate hydrodynamic pressure effects. The cylindrical geometry effectively distributes contact stress, avoiding issues associated with sharp edges. Hemispherical dimples maximize hydrodynamic effects through their smooth, continuous curvature. They significantly improve oil film load-bearing capacity under high-speed conditions and demonstrate optimal stress distribution uniformity, completely eliminating edge stress concentration. This design substantially extends fatigue life while promoting efficient lubricant release through its curved structure, simultaneously minimizing the retention of debris.

2.2. Operating Mechanism of Hydrodynamic Lubrication in Rotational Friction Interfaces

The working principle of oil film transmission between rotating friction pairs is based on the viscous shear effect and hydrodynamic lubrication characteristics of the oil film. It achieves power transmission between two relatively rotating components through the oil film while avoiding direct surface contact to reduce wear.
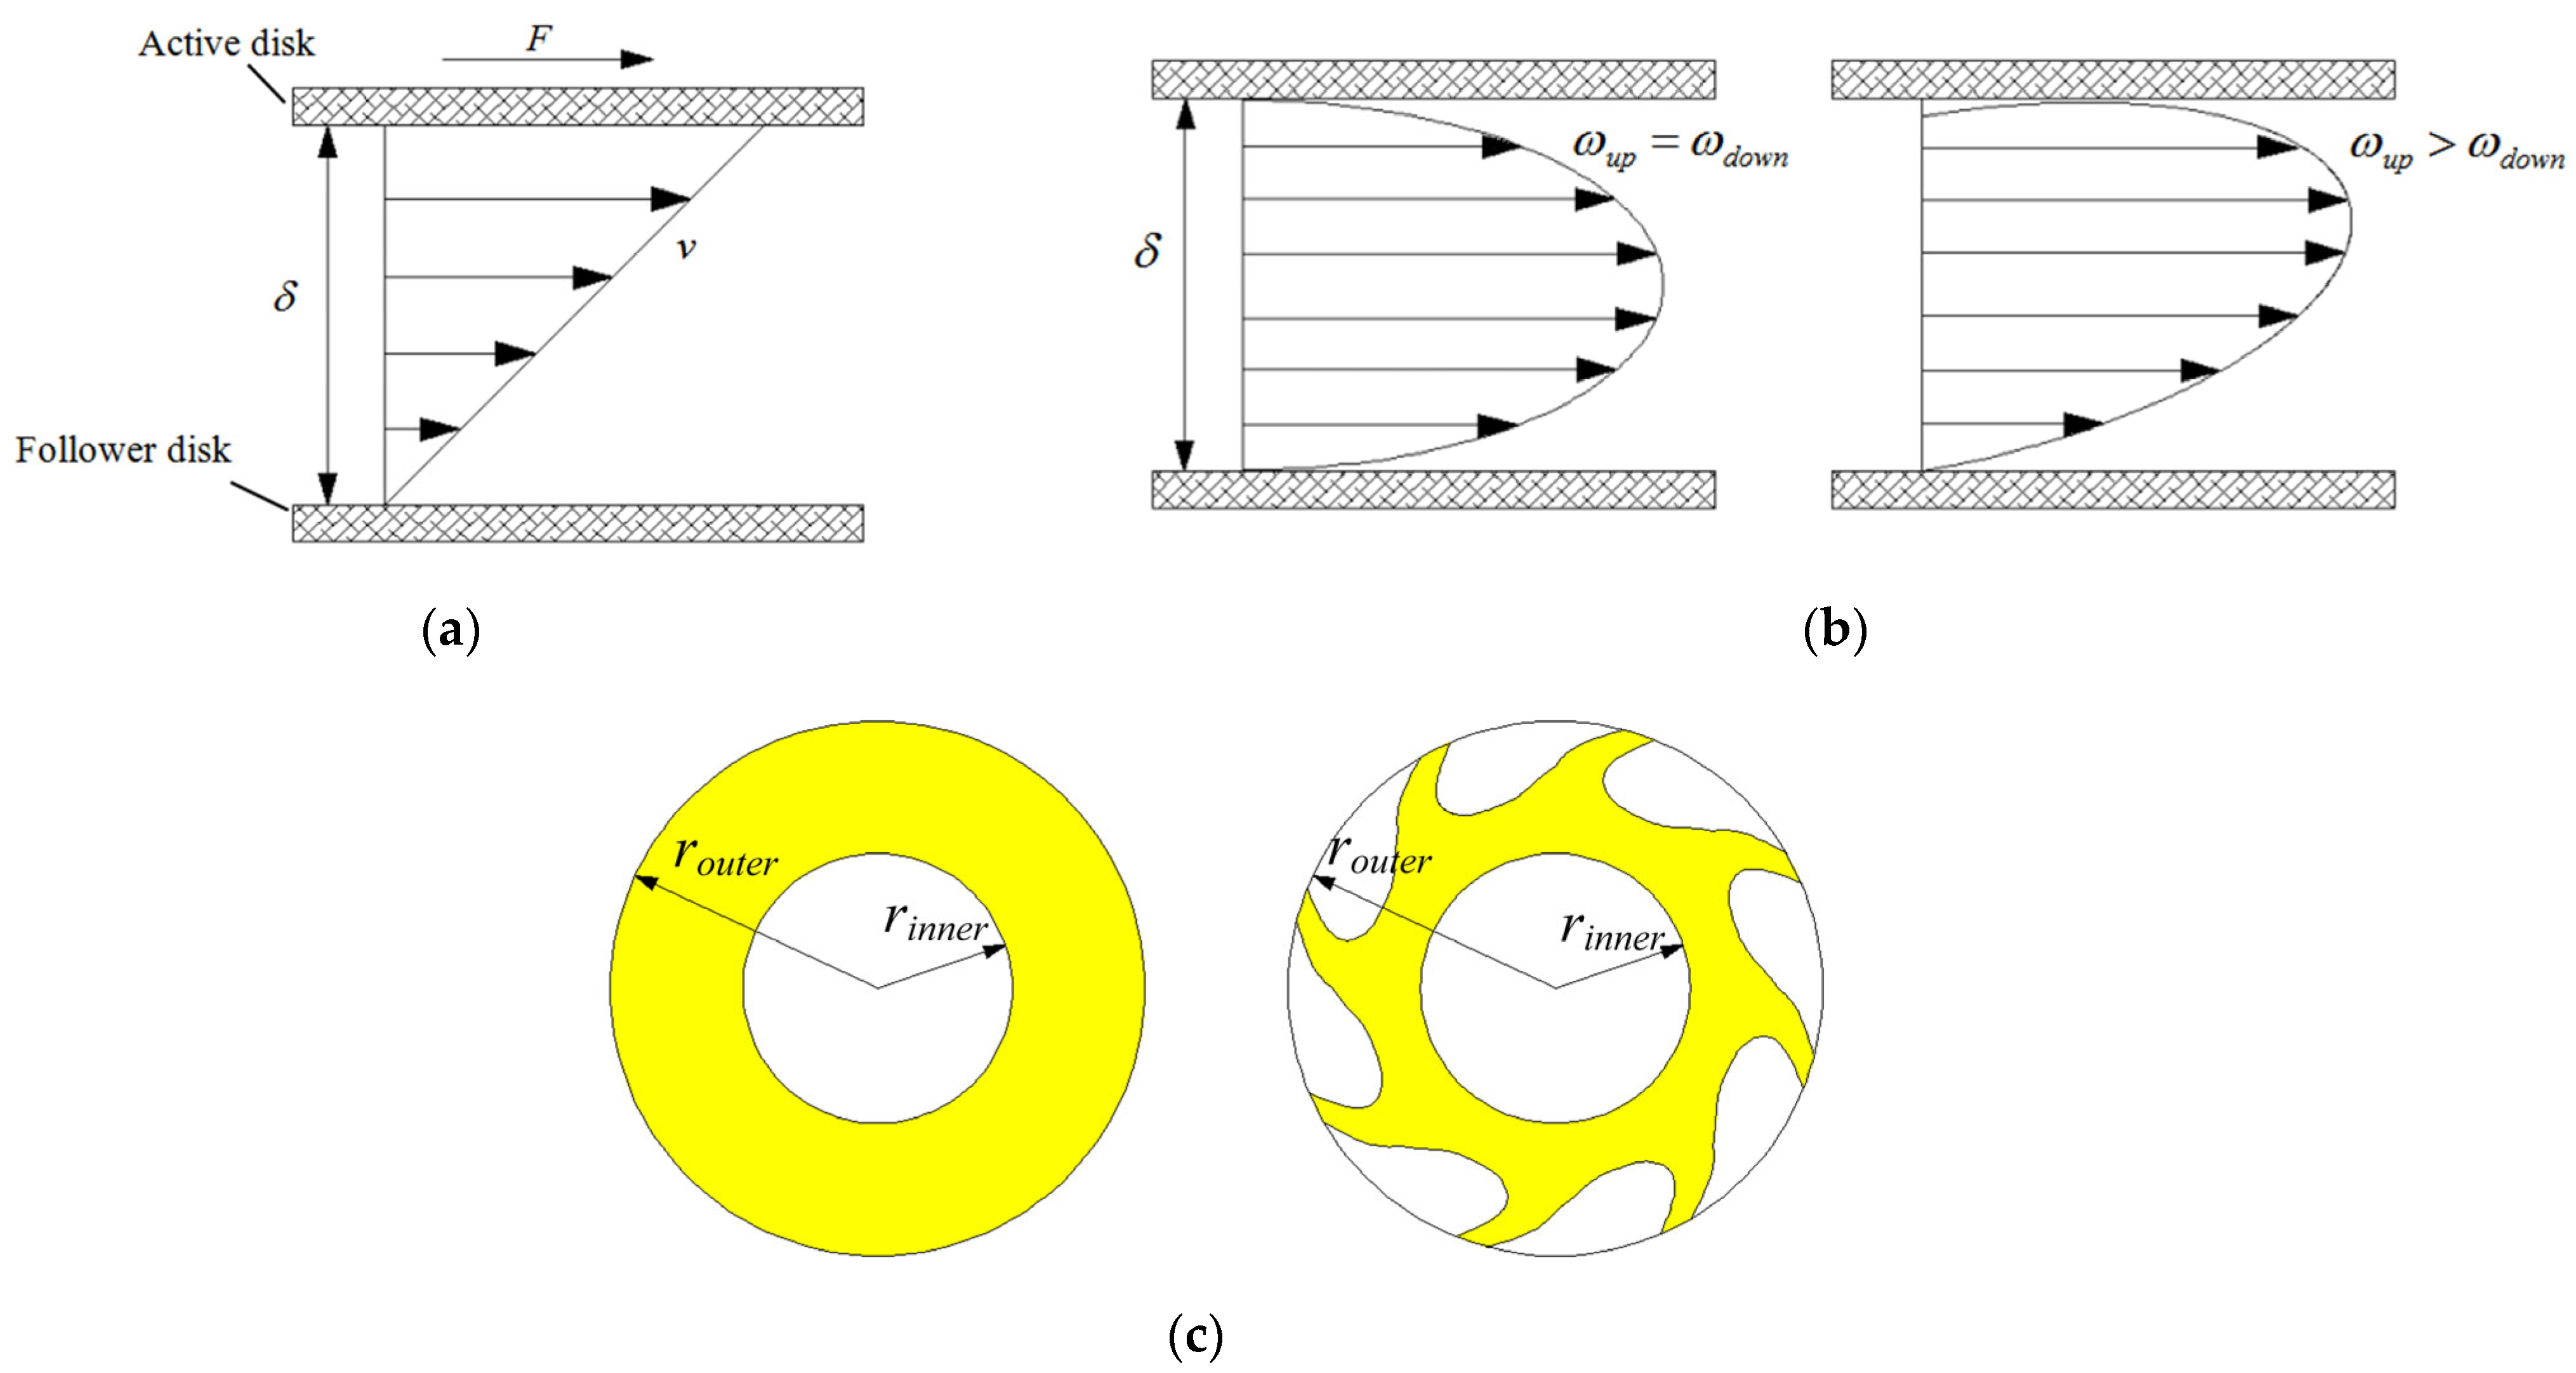
When only the driving plate is in motion, the oil, as a viscous fluid, moves with the plate, with its motion direction mainly consisting of circumferential and radial movements. In the circumferential direction, the fluid flow follows Couette flow, as shown in Figure 2a, where the axial velocity decreases linearly along the oil film thickness δ. The fluid velocity v reaches its maximum near the wall of the driving plate and approaches zero near the wall of the driven plate.
In the radial direction, secondary flow occurs during rotation. Unlike secondary flow in non-circular cross-sections, the oil is not constrained by walls at the inner and outer diameters. Instead, it is only subjected to transverse pressure applied by the inner walls of the driving and driven plates, similar to Poiseuille flow. This results in fewer vortex structures along the oil film thickness, while the radial velocity distribution follows a parabolic pattern along the oil film thickness δ. When the rotational speed of the driving plate equals that of the driven plate (ω1 = ω2), the peak velocity occurs at the middle layer of the oil film. When the driving plate speed exceeds the driven plate speed (ω1 > ω2), the maximum radial velocity shifts toward the driving plate side, as shown in Figure 2b.
As the rotational speed of the driving plate and the oil film thickness increase, oil film contraction and rupture occur at the outermost diameter of the disk, as shown in Figure 2c. This is due to gas backflow and oil film cavitation at high speeds at the outer diameter. The magnitude of the rotational speed directly affects the stability of the flow field.

2.3. The Primary Mechanism and Critical Conditions of Cavitation

Cavitation commonly occurs in rotating machinery with liquid media. It has negative effects, such as noise and transmission instability. The essence of cavitation is phase change in liquids. The three essential factors for cavitation are as follows: cavitation nuclei, low pressure, and sufficient duration of low-pressure action. Cavitation only occurs when liquid containing cavitation nuclei is subjected to sufficiently prolonged low-pressure conditions; all three factors are indispensable.
At the microscopic level, the inception of cavitation is the process by which liquid molecules with higher kinetic energy overcome surface tension and escape the liquid surface. The key factor enabling cavitation is the presence of cavitation nuclei. Cavitation only occurs when these nuclei experience sufficiently prolonged low-pressure conditions. Thomas proposed using a dimensionless number to describe cavitation phenomena, namely the cavitation number [16]:
σ = p p v 1 2 ρ u 2
Here, p represents the static pressure of the undisturbed reference cross-section (Pa); u is the flow velocity of the undisturbed reference cross-section (m/s); ρ is the fluid density (kg/m3); and pv is the saturated vapor pressure of the fluid (Pa).
The cavitation number can quantitatively describe cavitation phenomena. As can be seen from Equation (1), the cavitation number is primarily determined by pressure and flow velocity and is also related to material parameters.
Equation (2) represents the fundamental Rayleigh–Plesset equation for bubble dynamics:
R R ¨ + 3 2 R ˙ 2 = 1 ρ p g + p v p ( t ) 2 τ R 4 μ R ˙ R
where R is the bubble radius (m); pg is the gas pressure inside the bubble (Pa); τ is the liquid surface tension coefficient (N/m); and μ is the liquid viscosity (Pa·s).
Equation (3) is a non-homogeneous second-order ordinary differential equation. By setting R ˙ = R ¨ = 0, we can solve for the critical radius R* for bubble instability growth:
R = R 0 3 R 0 2 τ ( p 0 p v + 2 τ R 0 )
where R0 is the initial bubble radius (m); and p0 is the liquid pressure at initial radius R0 (Pa). For a single bubble, cavitation occurs when the bubble radius RR*.
The cavitation number σ is significant as it provides a quantitative description of cavitation phenomena. Let σcrit be the critical cavitation number when cavitation begins or disappears: When σ > σcrit, no cavitation occurs; when σ = σcrit, cavitation is about to start or disappear; when σ < σcrit, cavitation develops; and when σ << σcrit, cavitation is fully developed, potentially leading to supercavitation.
In Equation (1), p and u represent the pressure and velocity of the undisturbed far-field reference cross-section. Introducing the local pressure px and local velocity ux at the point of interest produces the pressure coefficient Cp(x) [17]:
C p ( x ) = p x p 1 2 ρ u 2 x
where px is the flow field pressure at the point of interest (Pa); and ux is the local velocity (m/s). Let pxp = Δp, where Δp is the pressure difference between the point of interest and the reference position (Pa).
Comparing the expressions for cavitation number σ and pressure coefficient Cp(x) shows that σ = −Cp(x). When the pressure at position x in the flow field reaches its minimum (px = pmin), cavitation first occurs at this position. The relationship between the incipient cavitation number and critical pressure coefficient is then as follows: σi = −Cpmin.

2.4. Simulation Test Method

2.4.1. Finite Element Modeling of Oil Film

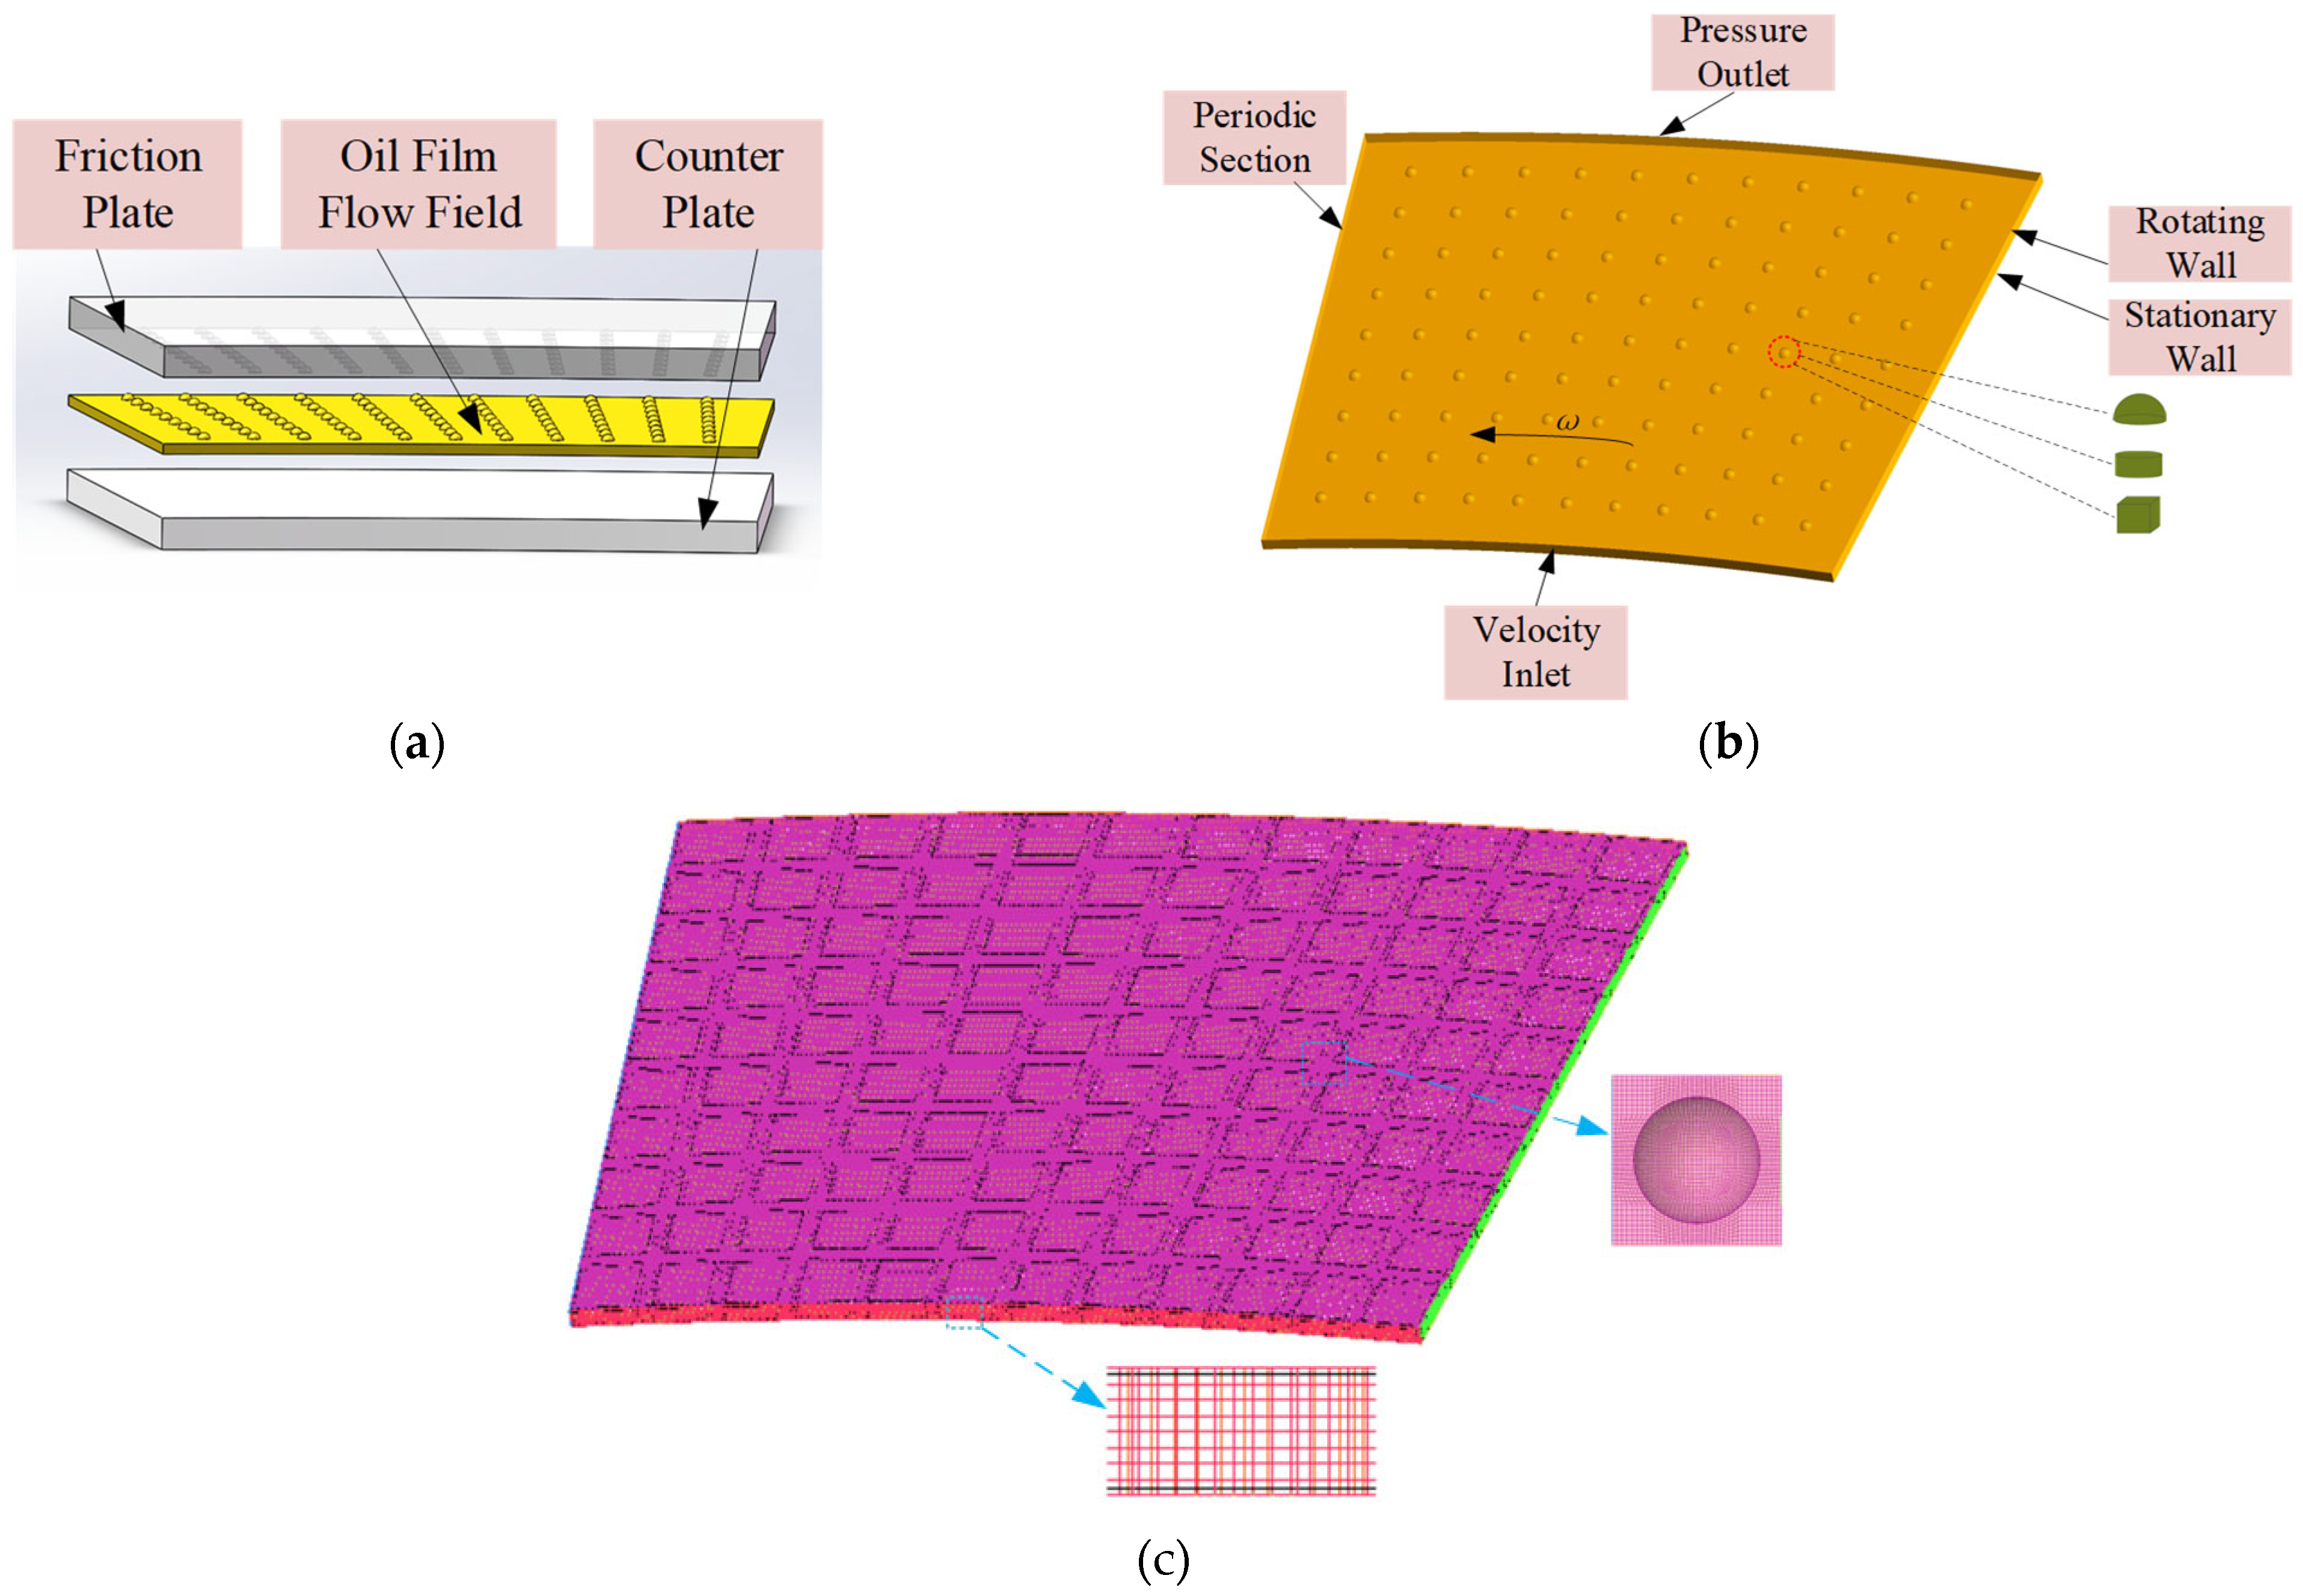
The oil film exhibits rotational periodicity. To reduce computation time, a 12° sector (1/30 of the full oil film) was selected as the periodic unit for study, with an inner radius of r1 = 27 mm, outer radius of r2 = 32 mm, default film thickness of h0 = 0.1 mm, and default texture depth of h0 = 0.1 mm. The driving plate is textured, and the oil film flow field model is shown in Figure 3a.
Figure 3b shows the oil film boundary conditions. Since cavitation mainly occurs at high rotational speeds, default parameters were selected: rotational speed n = 6000 rpm, inlet pressure p0 = 0.08 MPa, and initial oil temperature T0 = 293 K.
The properties of the oil and its vapor are listed in Table 1. Given the significant influence of temperature on oil viscosity, a linear interpolation function was used in ANSYS CFX 18.0 software to define the relationship between oil viscosity and temperature [18]:
μ ( T ) = μ x exp 400 ln μ 40 μ x ( 1 T + 95 0.001140098 )
where μx = 0.18 × 10⁻³ Pa·s; T is the temperature (°C); and μ40 is the dynamic viscosity of oil at 40 °C (Pa·s).
Mesh generation is a critical factor in CFD simulation. Therefore, ICEM CFD 18.0 (ANSYS, Inc., Canonsburg, PA, United States) was used to perform structured meshing of the oil film flow field. Since the textured oil film exhibited hemispherical micro-protrusions, hexahedral meshes and O-grids were employed for the textured regions to obtain high-quality mesh models, as shown in Figure 3c, the meshes are marked in red and indicated with blue arrows. This study simulates the rotational motion of the friction pair by setting a Rotating Frame of Reference in ANSYS CFX 18.0 (ANSYS, Inc., Canonsburg, PA, United States), which enables the automatic incorporation of inertial forces due to coordinate system rotation into the momentum equations, thereby accurately capturing the impact of rotational effects on the flow field.

2.4.2. Simulation and Experimental Study of Oil Films with Different Types of Surface Textures

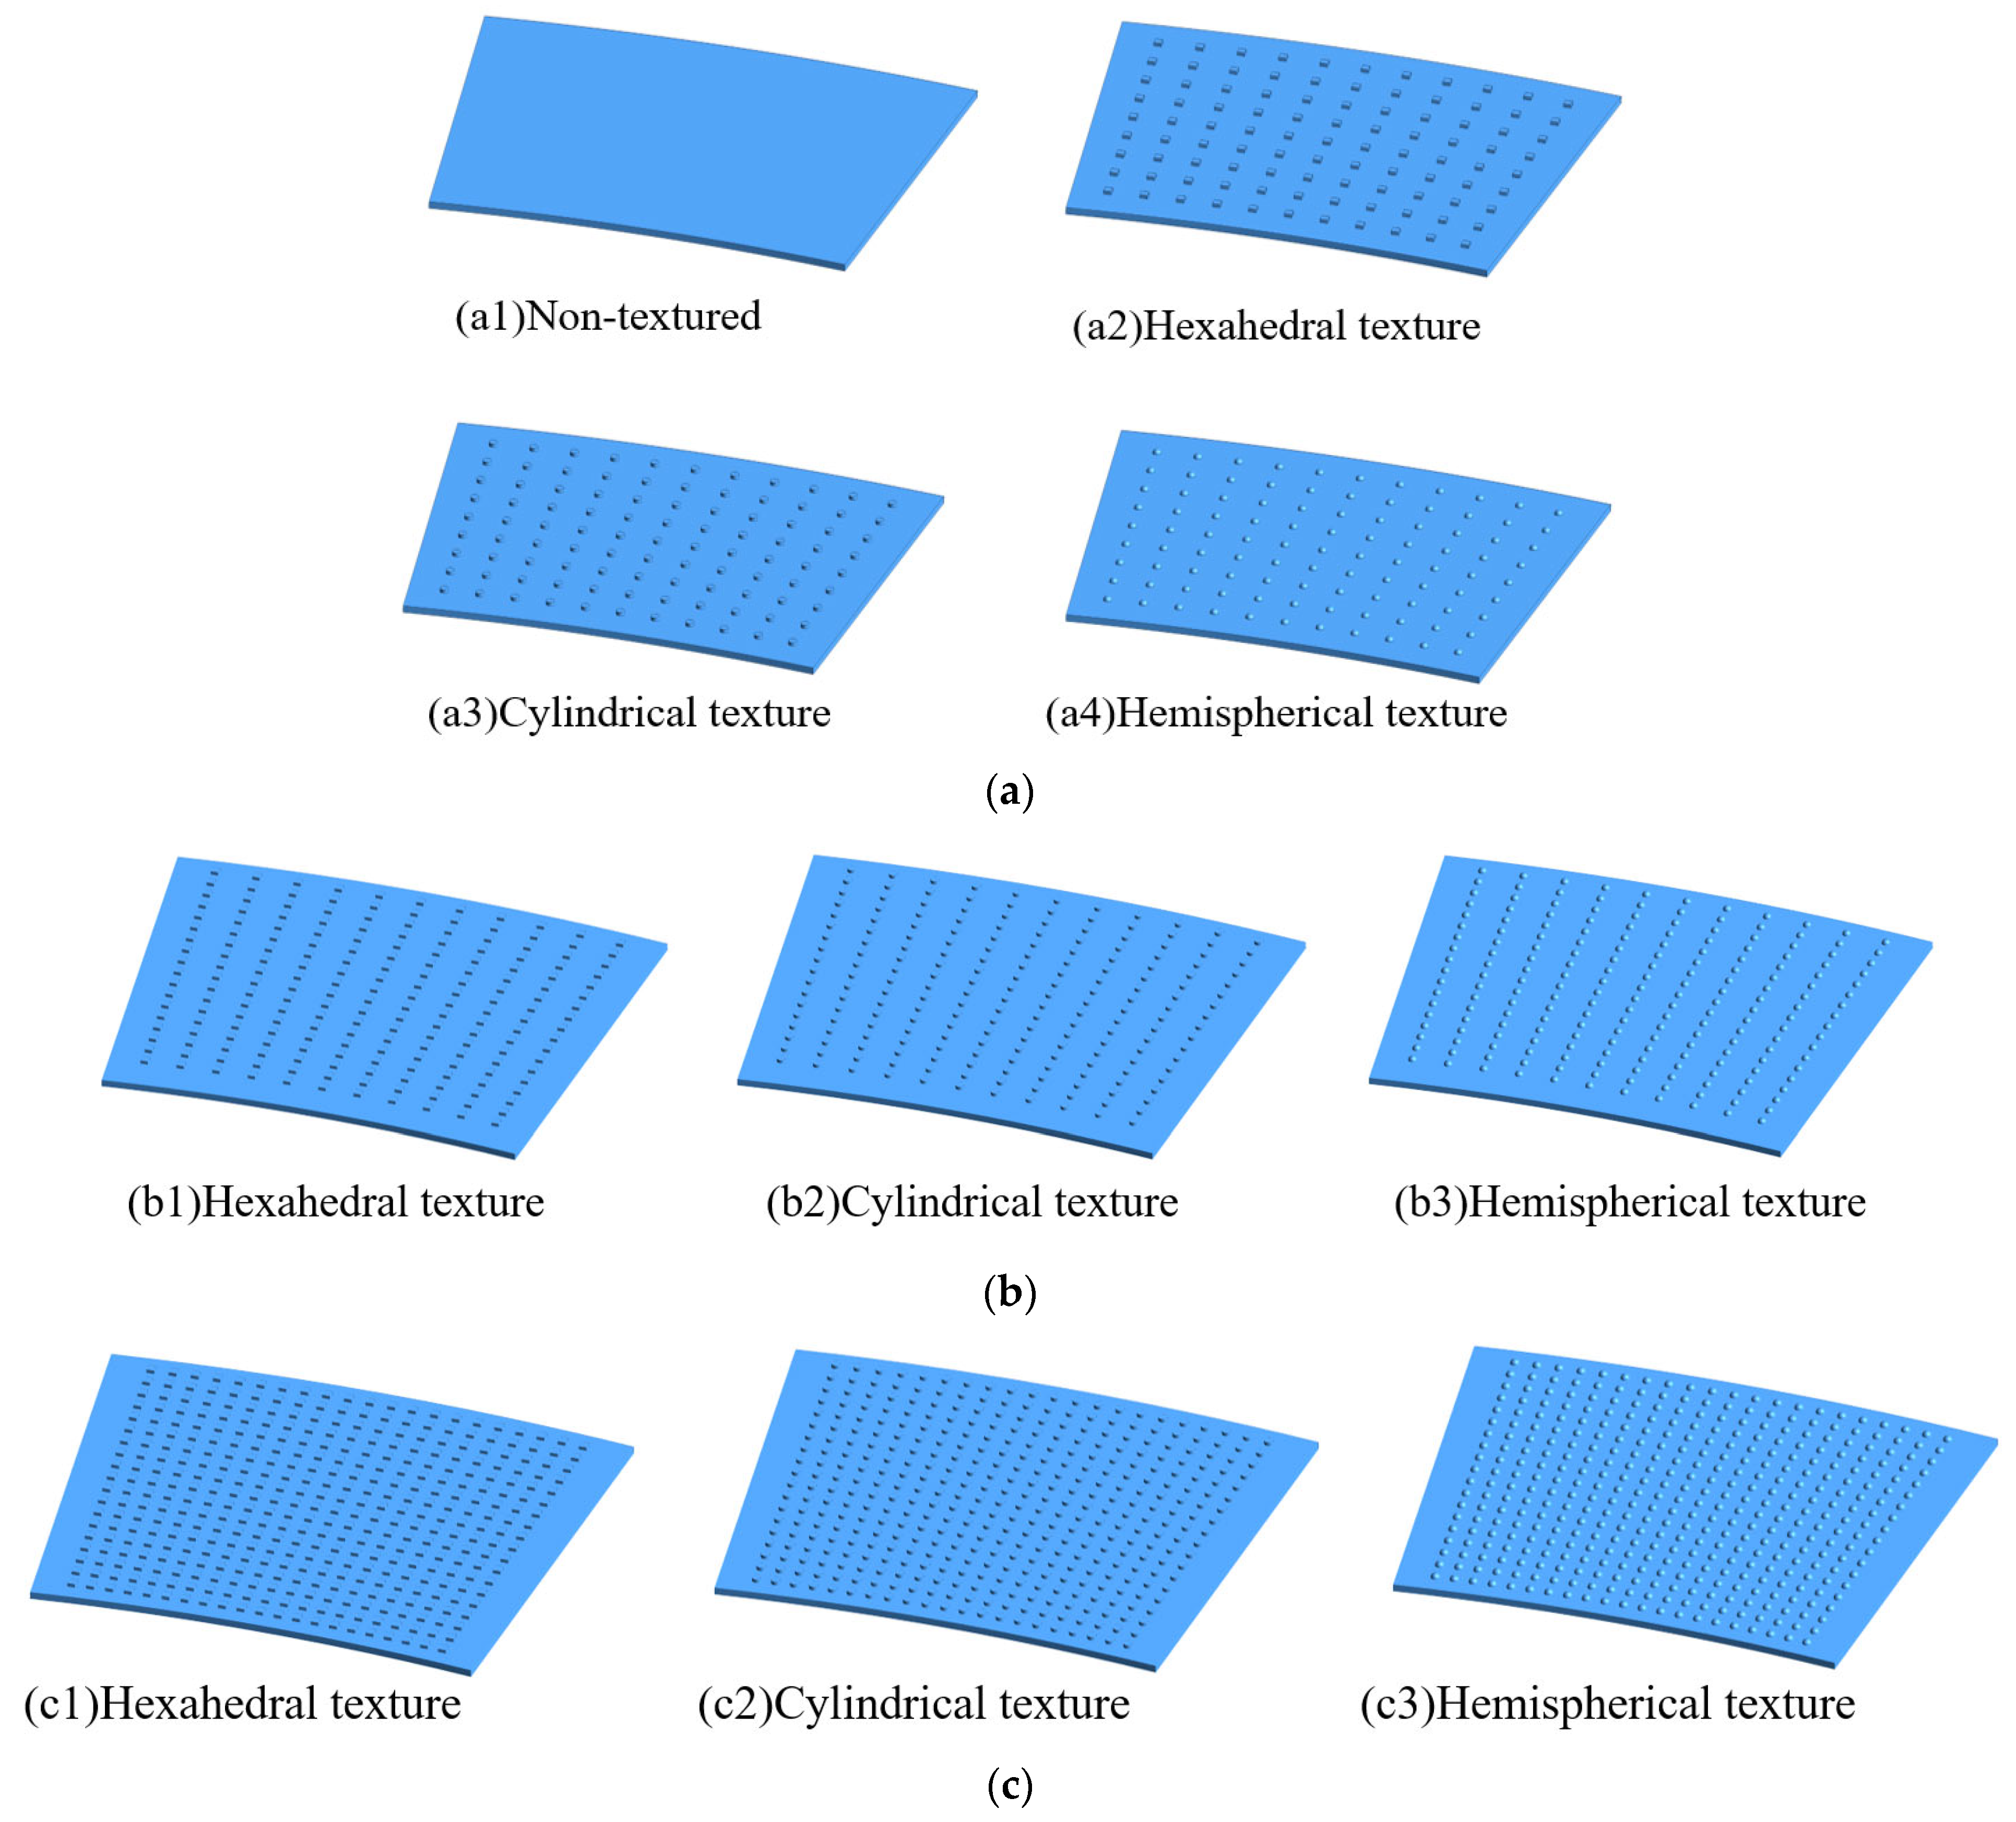
To evaluate the operational performance of three textured oil films (hexahedral, cylindrical, and hemispherical), a simulation comparison test was designed against non-textured oil films, analyzing the evolution of their cavitation morphology, as shown in Figure 4a. The textures were uniformly distributed with an identical texture ratio (3.205%), radial center-to-center spacing of 0.5 mm, and circumferential angular spacing of 1°. The three operating conditions were set as follows: rotational speed n = 6000 rpm, supply pressure p0 = 0.08 MPa, oil temperature T0 = 293 K, and film thickness h0 = 0.1 mm. To further investigate the influence of the texture shape and ratio on oil film shear cavitation, three textured oil films (hexahedral, cylindrical, hemispherical) were designed with texture ratios of 6.41% and 12.917% under identical conditions, as shown in Figure 4b,c.

2.5. Experimental Validation

The experimental platform used in this study is a modified SAE#2 standard wet clutch test rig, which consists of a hydraulic system, a data acquisition system, and a transparent main unit, as shown by the schematic in Figure 5a. The transparent main unit serves as the primary component for power input/output and oil film observation, comprising a three-phase induction motor, a frequency converter to precisely control the input RPM, and the main housing unit (Figure 5b).
To study oil film flow patterns and the effects of textures on shear cavitation, a specific friction pair was utilized. It consisted of a stationary steel separator plate and a rotating paper-based friction plate. The outer and inner diameters of both plates are 120 mm and 90 mm, respectively, remaining consistent with the simulation model. All micro-textures were fabricated on the surface of the steel separator plate (an example of which is shown in Figure 5d) using a pico-second laser ablation system. This technique ensures high precision of the texture dimensions and a minimal heat-affected zone (HAZ). The key parameters for the laser processing were: a wavelength of 1064 nm, a pulse width of ~10 ps, and a scanning speed of 500 mm/s. For the cavitation visualization experiments, the steel separator plate was replaced with a high-strength optical quartz glass plate of the same dimensions and texture, whose high transparency allows for direct observation of the flow phenomena within the oil film.
To capture the transient cavitation phenomena, we established a high-resolution visualization system. A Photron FASTCAM SA-Z high-speed camera (Photron, Yonezawa City, Yamagata Prefecture, Japan)was employed with the following key settings: a frame rate of 20,000 fps to ensure clear capture of the bubble dynamics; an image resolution of 1024 × 1024 pixels; and a shutter speed of 1/40,000 s to eliminate motion blur from the high-speed rotation (6000 rpm). A high-power LED cold light source was used as auxiliary lighting to directly illuminate the flow field, enhancing visibility without altering the oil’s physical properties.
To validate the effect of texturing on torque transmission, real-time monitoring of the transmitted torque was performed. As depicted in Figure 5b, an HBM T40B dynamic torque sensor (range: 0–200 Nm) was installed on the passive end (output shaft). The torque signal was processed by the data acquisition system (Figure 5c) and recorded at a sampling frequency of 10 kHz to capture minute torque fluctuations.
Each experiment strictly followed the procedure outlined below: The fabricated textured separator plate (steel or quartz glass) and the paper-based friction plate were installed on the test rig’s main spindle, and the oil film clearance was set to 0.2 mm. The oil pump was activated to circulate ATF Dexron-VI Automatic Transmission Fluid through the system. An external temperature control unit maintained the oil inlet temperature constant at 80 ± 2 °C, and the oil supply rate was held constant at 5 L/min. The main spindle motor was started, and the friction plate’s rotational speed was smoothly ramped up from 0 to the target speed of 6000 rpm. The system was operated continuously at 6000 rpm for 60 s to ensure the flow and temperature fields reached a steady state. During the steady-state operation, the high-speed camera and the torque acquisition system were triggered simultaneously to continuously record 2 s of dynamic data. For each set of texture parameters (shape, area ratio, etc.), the experiment was repeated three times. The results presented in the manuscript are either the average of three valid runs or a typical representative case.

3. Results and Discussion

3.1. Simulation Results of Different Surface Textures

3.1.1. Evolution Process of Cavitation Morphology

Based on the pattern of variation for the total cavitation volume fraction, the development process of oil film shear cavitation can be divided into three stages: rapid growth, slow growth, and stabilization. The cavitation volume fractions for non-textured surfaces and texture ratios of 3.205%, 6.41%, and 12.917% are shown in Figure 6.
At a texture ratio of 3.205%, the hexahedral-textured oil film exhibits the highest cavitation volume fraction, while the cylindrical-textured oil film shows lower cavitation levels. When the friction surface has no microtextures, there are no pressure disturbances in the flow field, and no cavitation in the non-textured oil film.
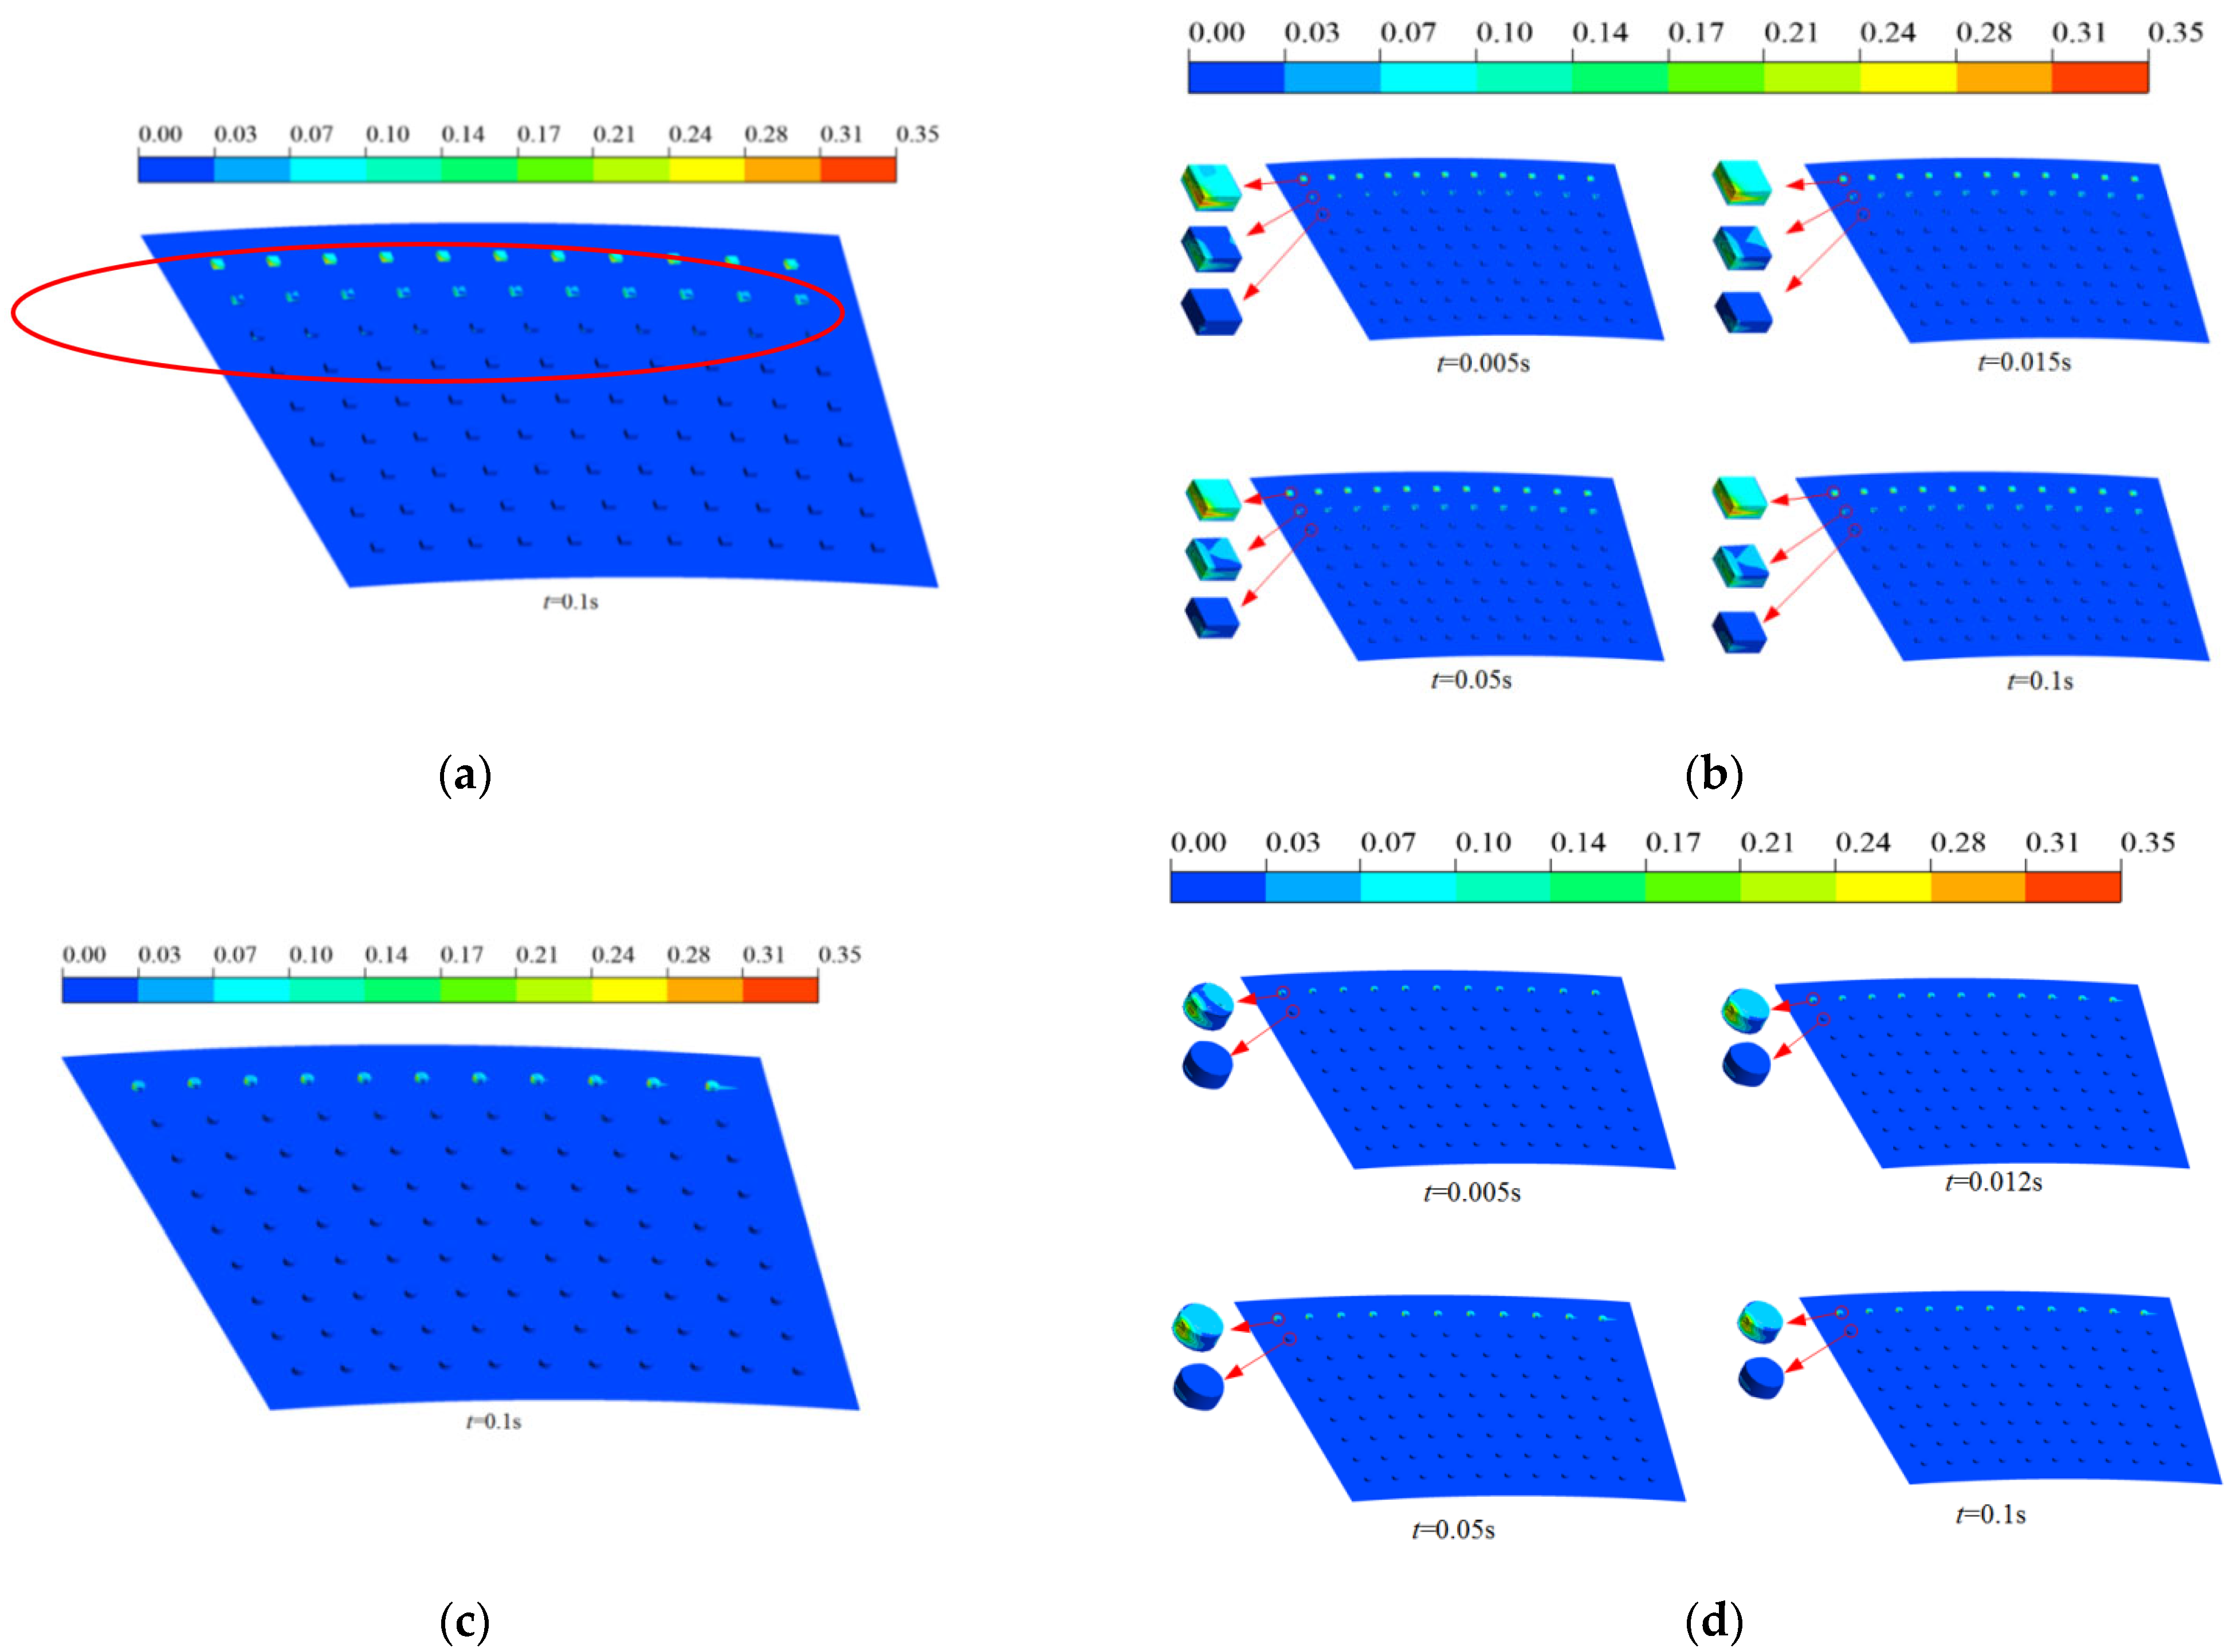
Hexahedral-textured oil film: Cavitation occurs exclusively within texture dimples. During t = 0~0.005 s, the cavitation volume fraction rapidly increases to 0.0008134 (concept); during t = 0.005~0.015 s, cavitation develops slowly, reaching 0.00096273. At t ≥ 0.016 s, the total cavitation volume fraction reaches 0.00096581 and remains stable. Figure 7a shows the stable cavitation volume state of the hexahedral texture at a ratio of 3.205%, and Figure 7b shows the temporal evolution of the oil film shear’s cavitation morphology within 0.1 s.
Cylindrical-textured oil film: Cavitation mainly occurs within texture dimples. During t = 0~0.005 s, cavitation develops rapidly with a volume fraction of 0.00032609. At t = 0.005~0.012 s, the cavitation volume fraction slowly increases to 0.00043395, and at t ≥ 0.013 s, the cavitation volume fraction stabilizes at 0.00043964. Figure 7c shows the stable cavitation state of the cylindrical texture at a ratio of 3.205%, and Figure 7d shows the temporal evolution of the oil film shear’s cavitation morphology within 0.1 s.
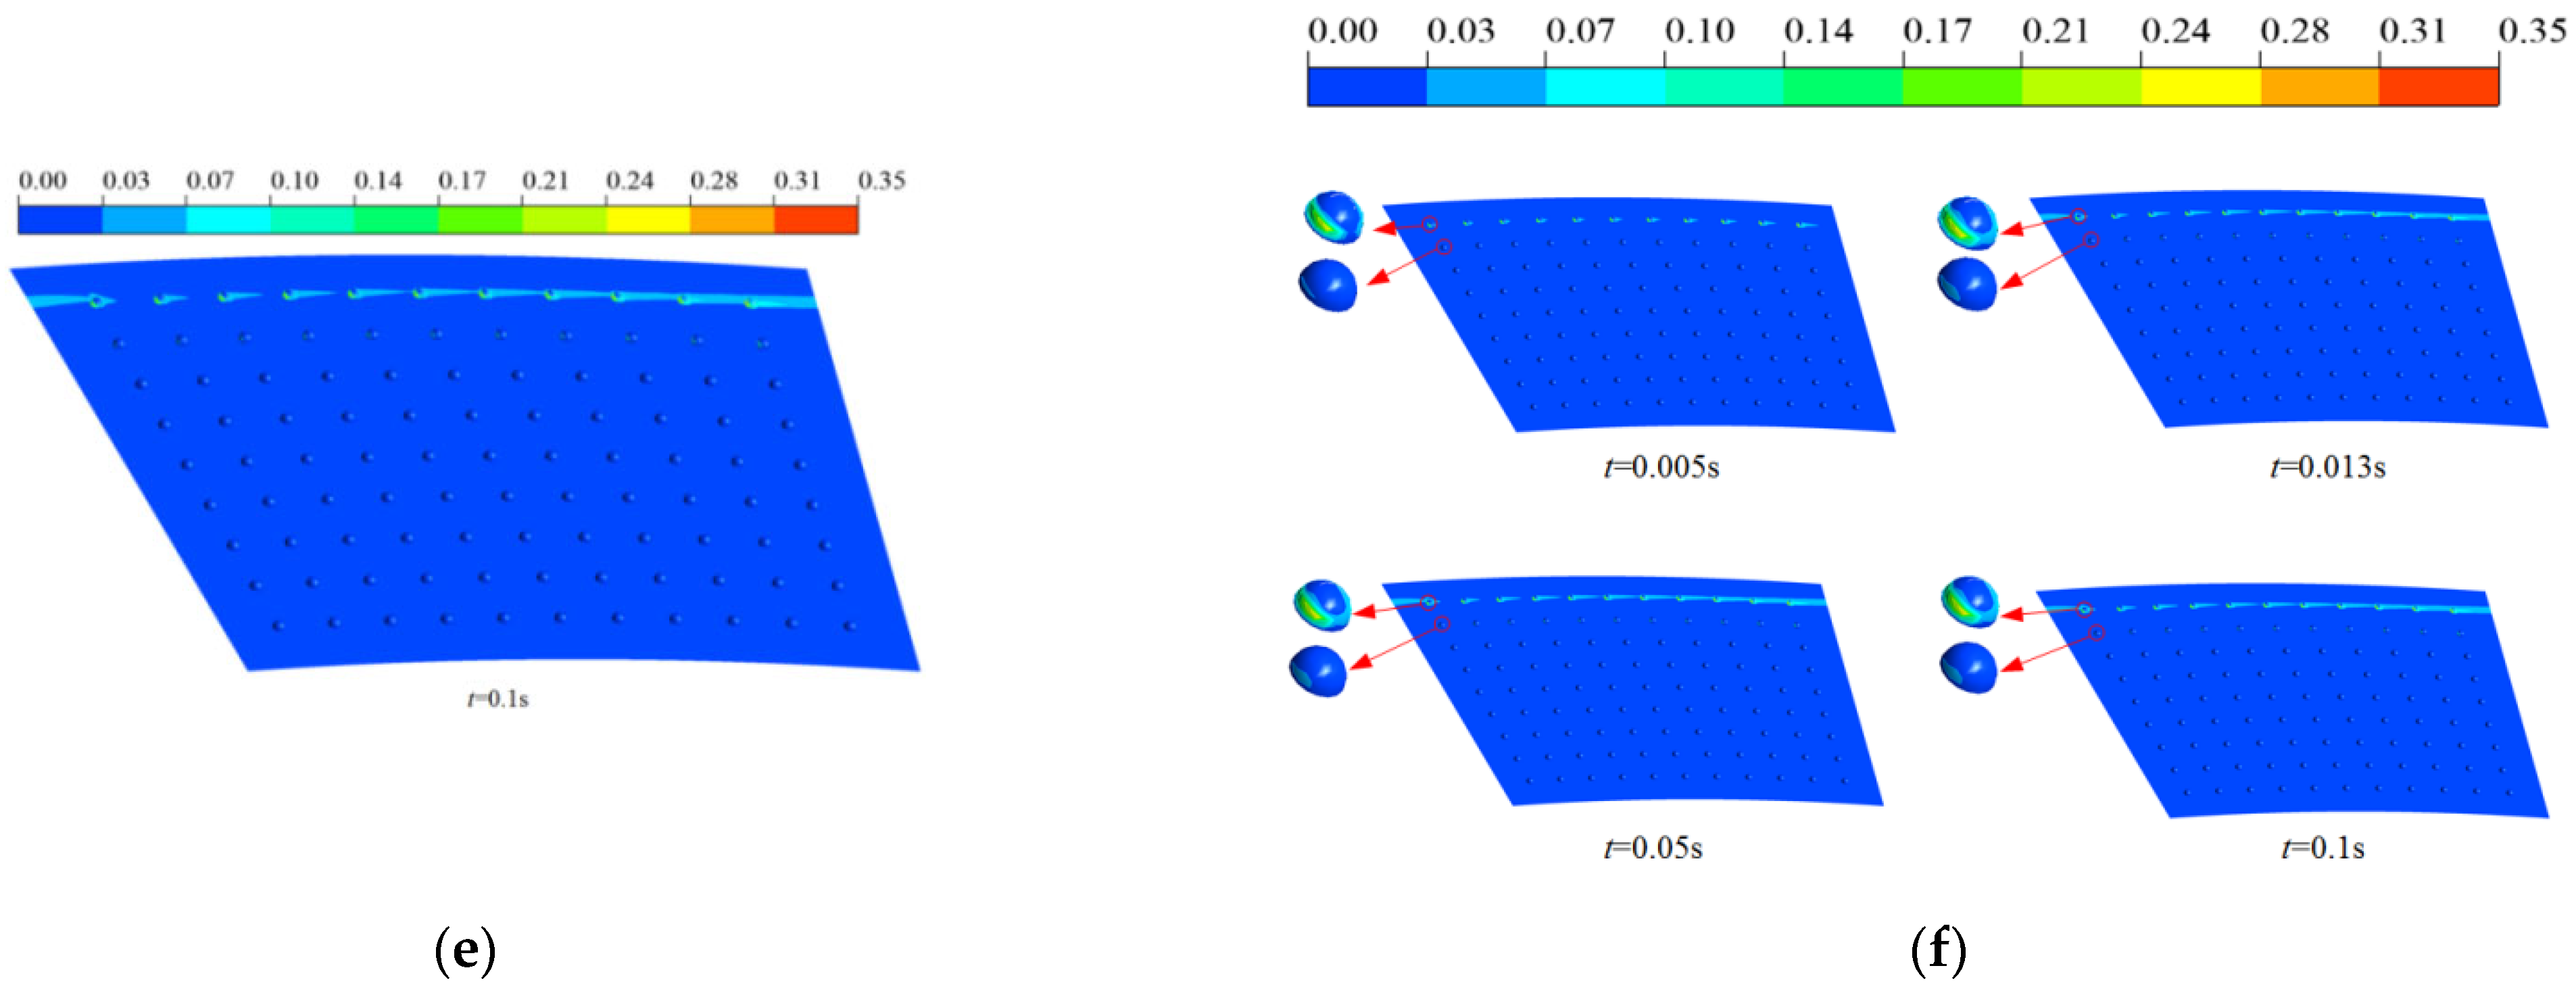
Hemispherical-textured oil film: Cavitation spreads from texture dimples to non-textured regions. During 0~0.013 s, cavitation develops rapidly with a volume fraction of 0.00063409. During t ≥ 14 s, the total cavitation volume fraction stabilizes at 0.00064191. Figure 7e shows the stable cavitation volume state of the hemispherical texture at a ratio of 3.205%, and Figure 7f shows the temporal evolution of the oil film shear’s cavitation morphology within 0.1 s under this condition.
When the texture ratio increases to 6.41%, the hemispherical-textured oil film exhibits the maximum cavitation volume, while the hexahedral-textured oil film has the minimum cavitation volume fraction.
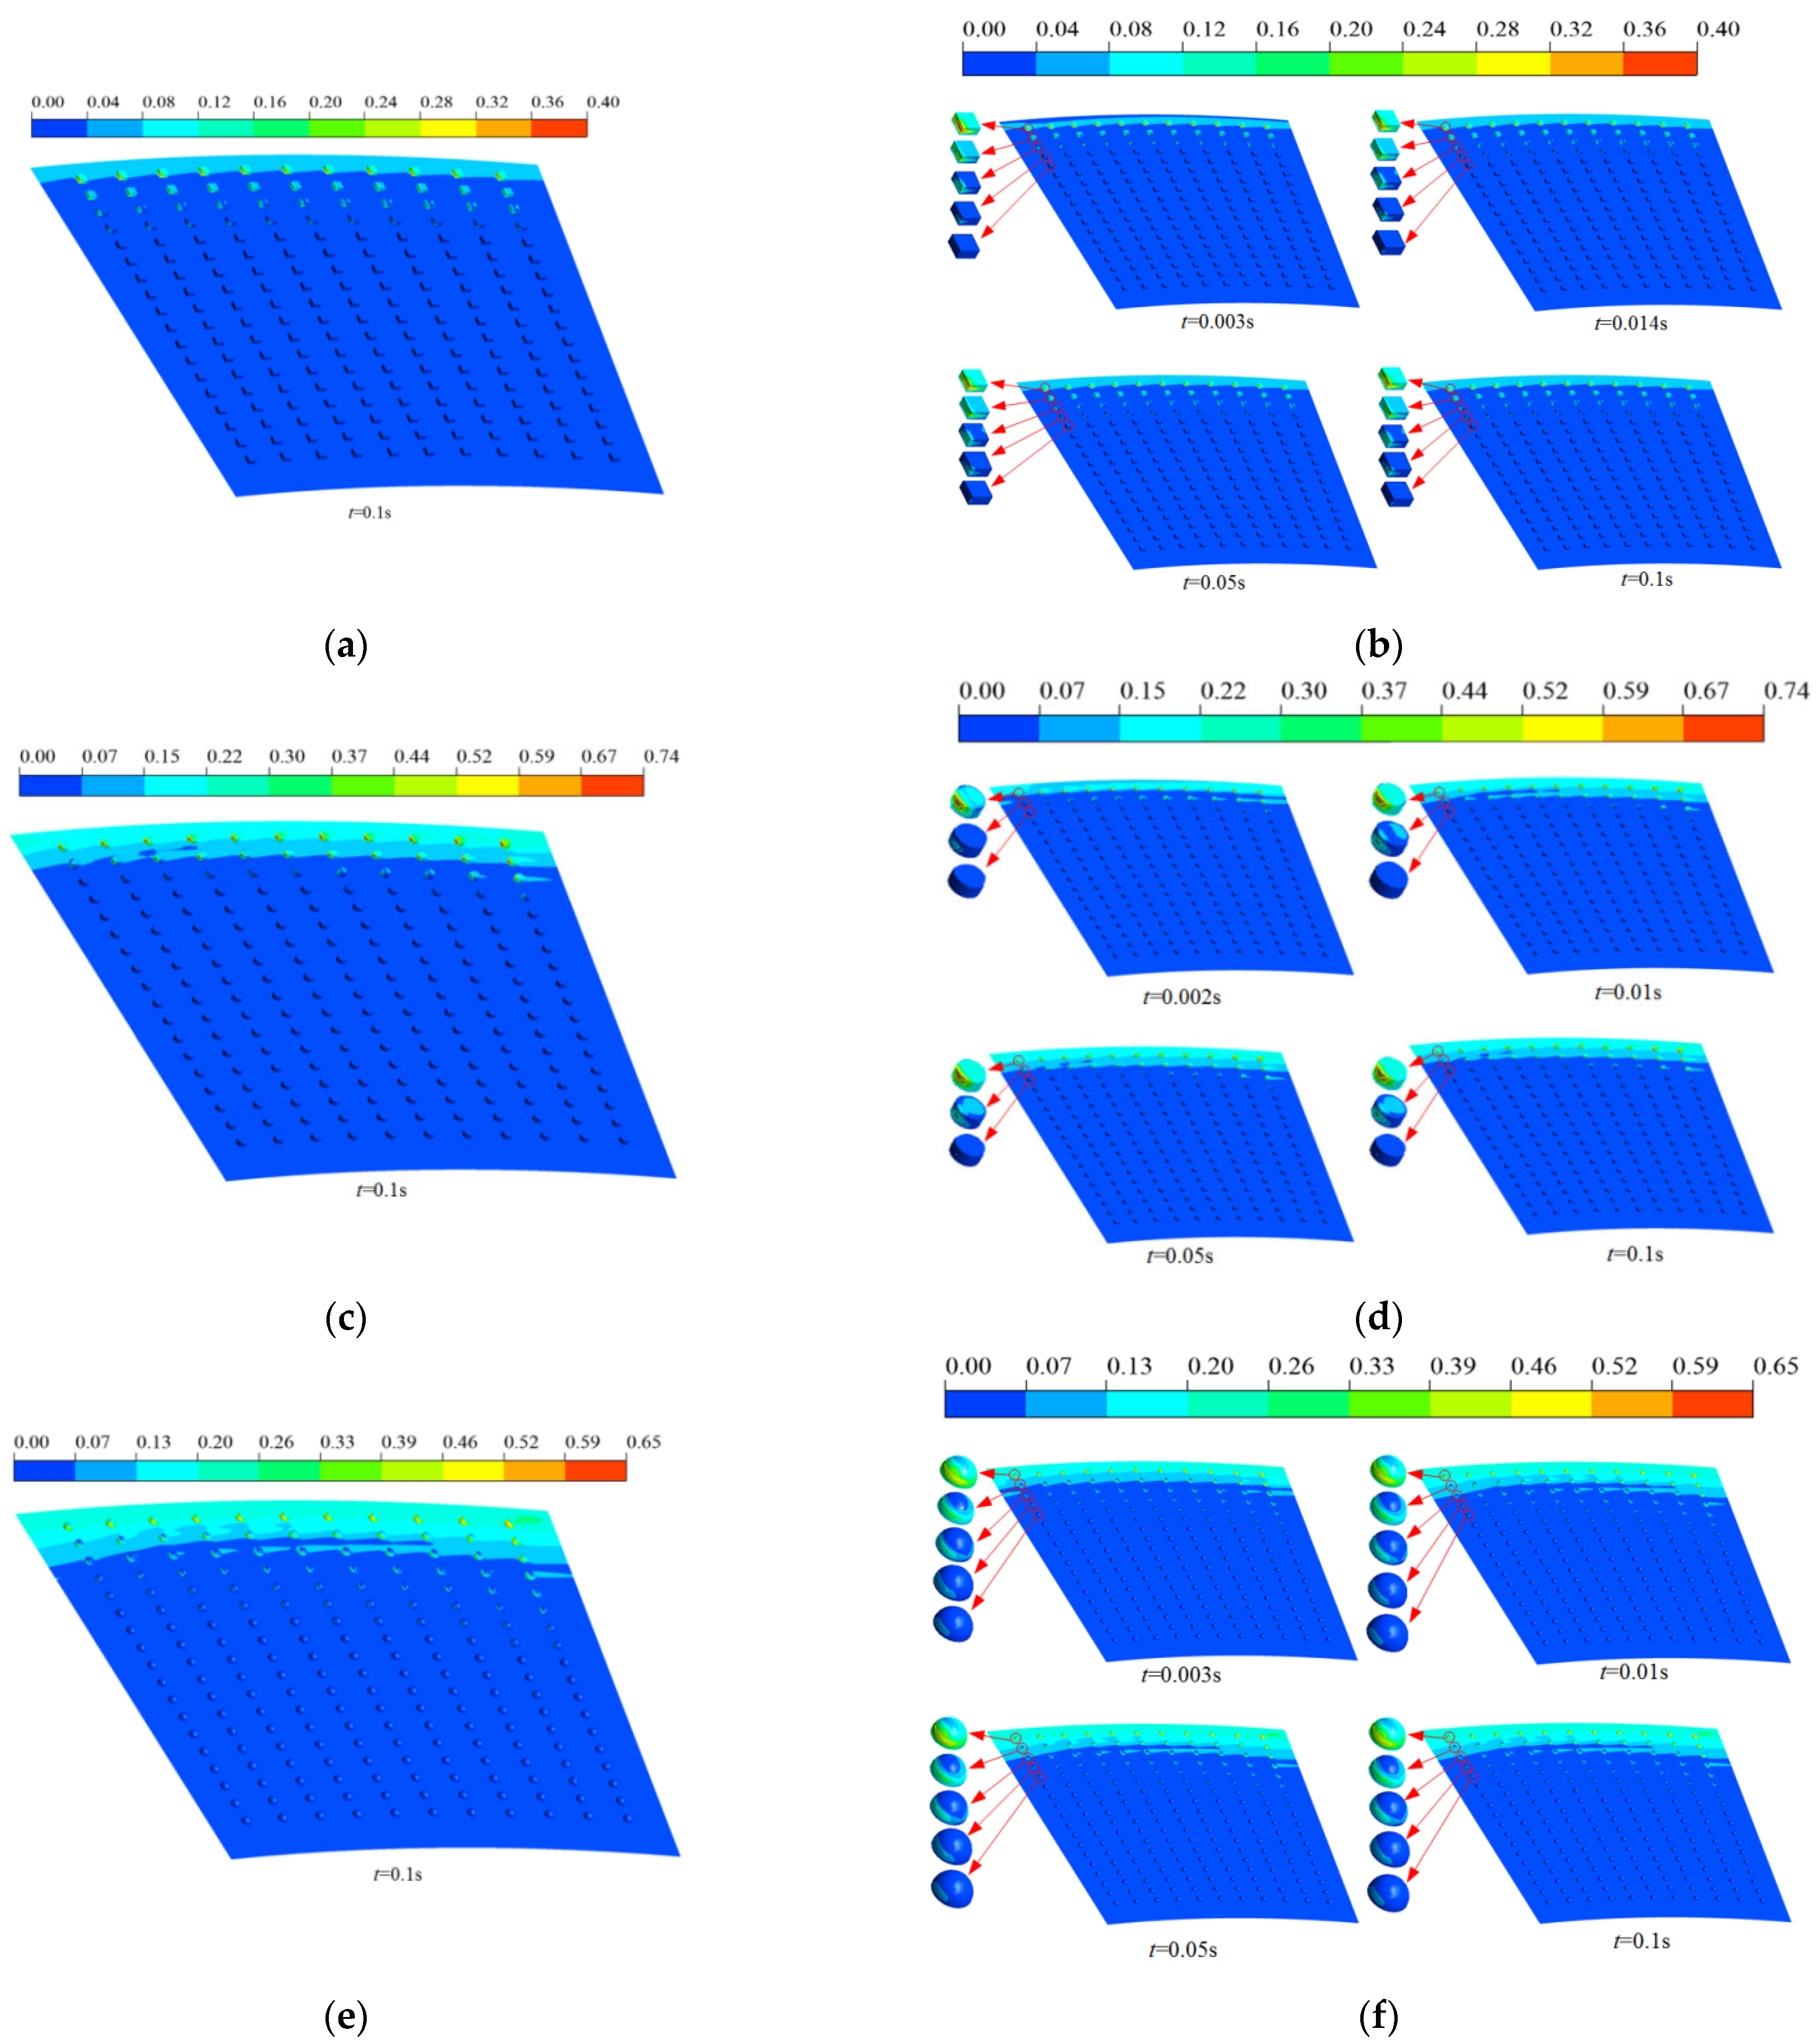
Hexahedral-textured oil film: Cavitation occurs inside texture dimples with severe cavitation at the outer diameter. At a time of t = 0~0.003 s, the cavitation volume fraction increases to 0.0012915. At a time of t = 0.003~0.014 s, the cavitation growth rate slows down, reaching 0.0015185, and at time t = 0.014 s, the total cavitation volume fraction stabilizes at 0.0015197. Figure 8a shows the stable cavitation state of the hexahedral texture, and Figure 8b shows the temporal evolution of the oil film shear’s cavitation morphology within 0.1 s.
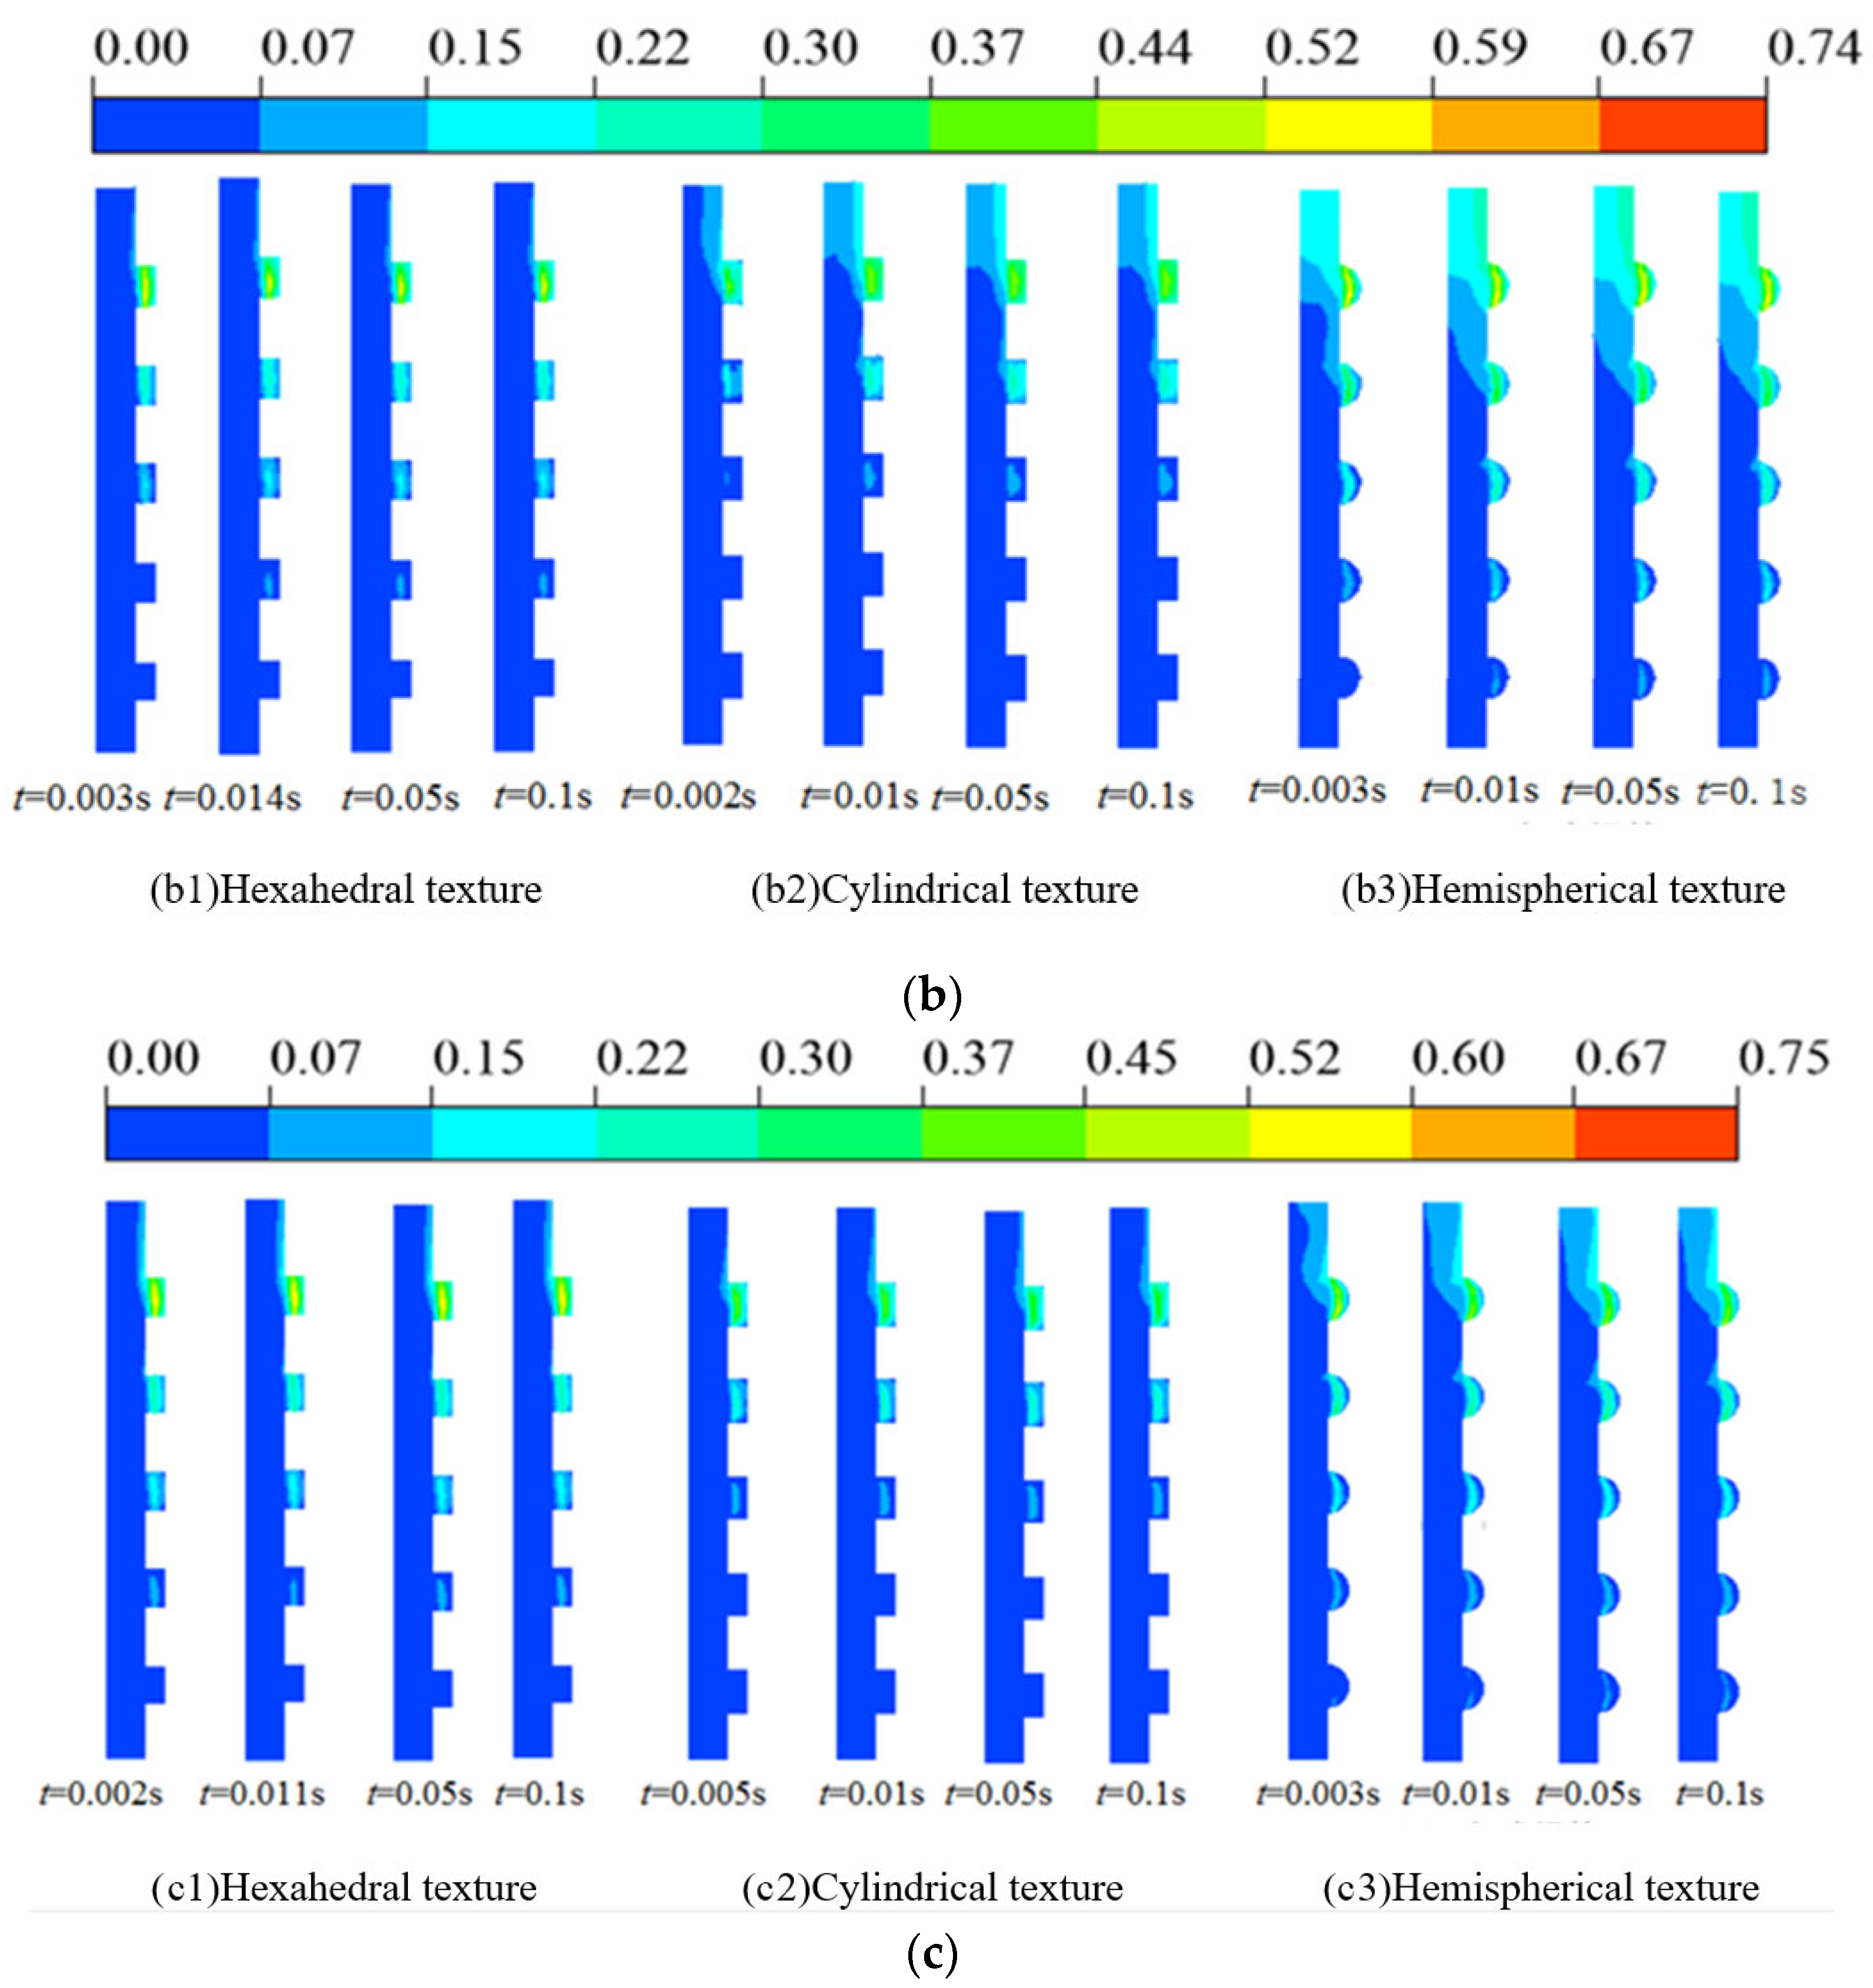
Cylindrical-textured oil film: Severe cavitation occurs at the outer diameter. At time t = 0~0.002 s, the cavitation volume fraction grows to 0.0064334; at time t = 0.002~0.01 s, the development of cavitation slows down, reaching 0.010009; and at time t ≥ 0.01 s, the total cavitation volume fraction stabilizes at 0.010953. Figure 8c shows the stable cavitation state for the cylindrical texture, and Figure 8d shows the temporal evolution of the oil film shear’s cavitation morphology within 0.1 s.
Hemispherical-textured oil film: Severe cavitation occurs at the outer diameter. At time t = 0~0.003 s, the cavitation volume fraction rapidly increases to 0.014822; at time t = 0.003~0.01 s, cavitation development slows down, reaching 0.019132; and at time t ≥ 0.01 s, the total cavitation volume fraction stabilizes at 0.020215. Figure 8e shows the stable cavitation state for the hemispherical texture, and Figure 8f shows the temporal evolution of the oil film shear’s cavitation morphology within 0.1 s.
At a texture ratio of 12.917%, the hemispherical-textured oil film demonstrated the maximum cavitation volume, while the hexahedral-textured oil film exhibited the minimum cavitation volume fraction.
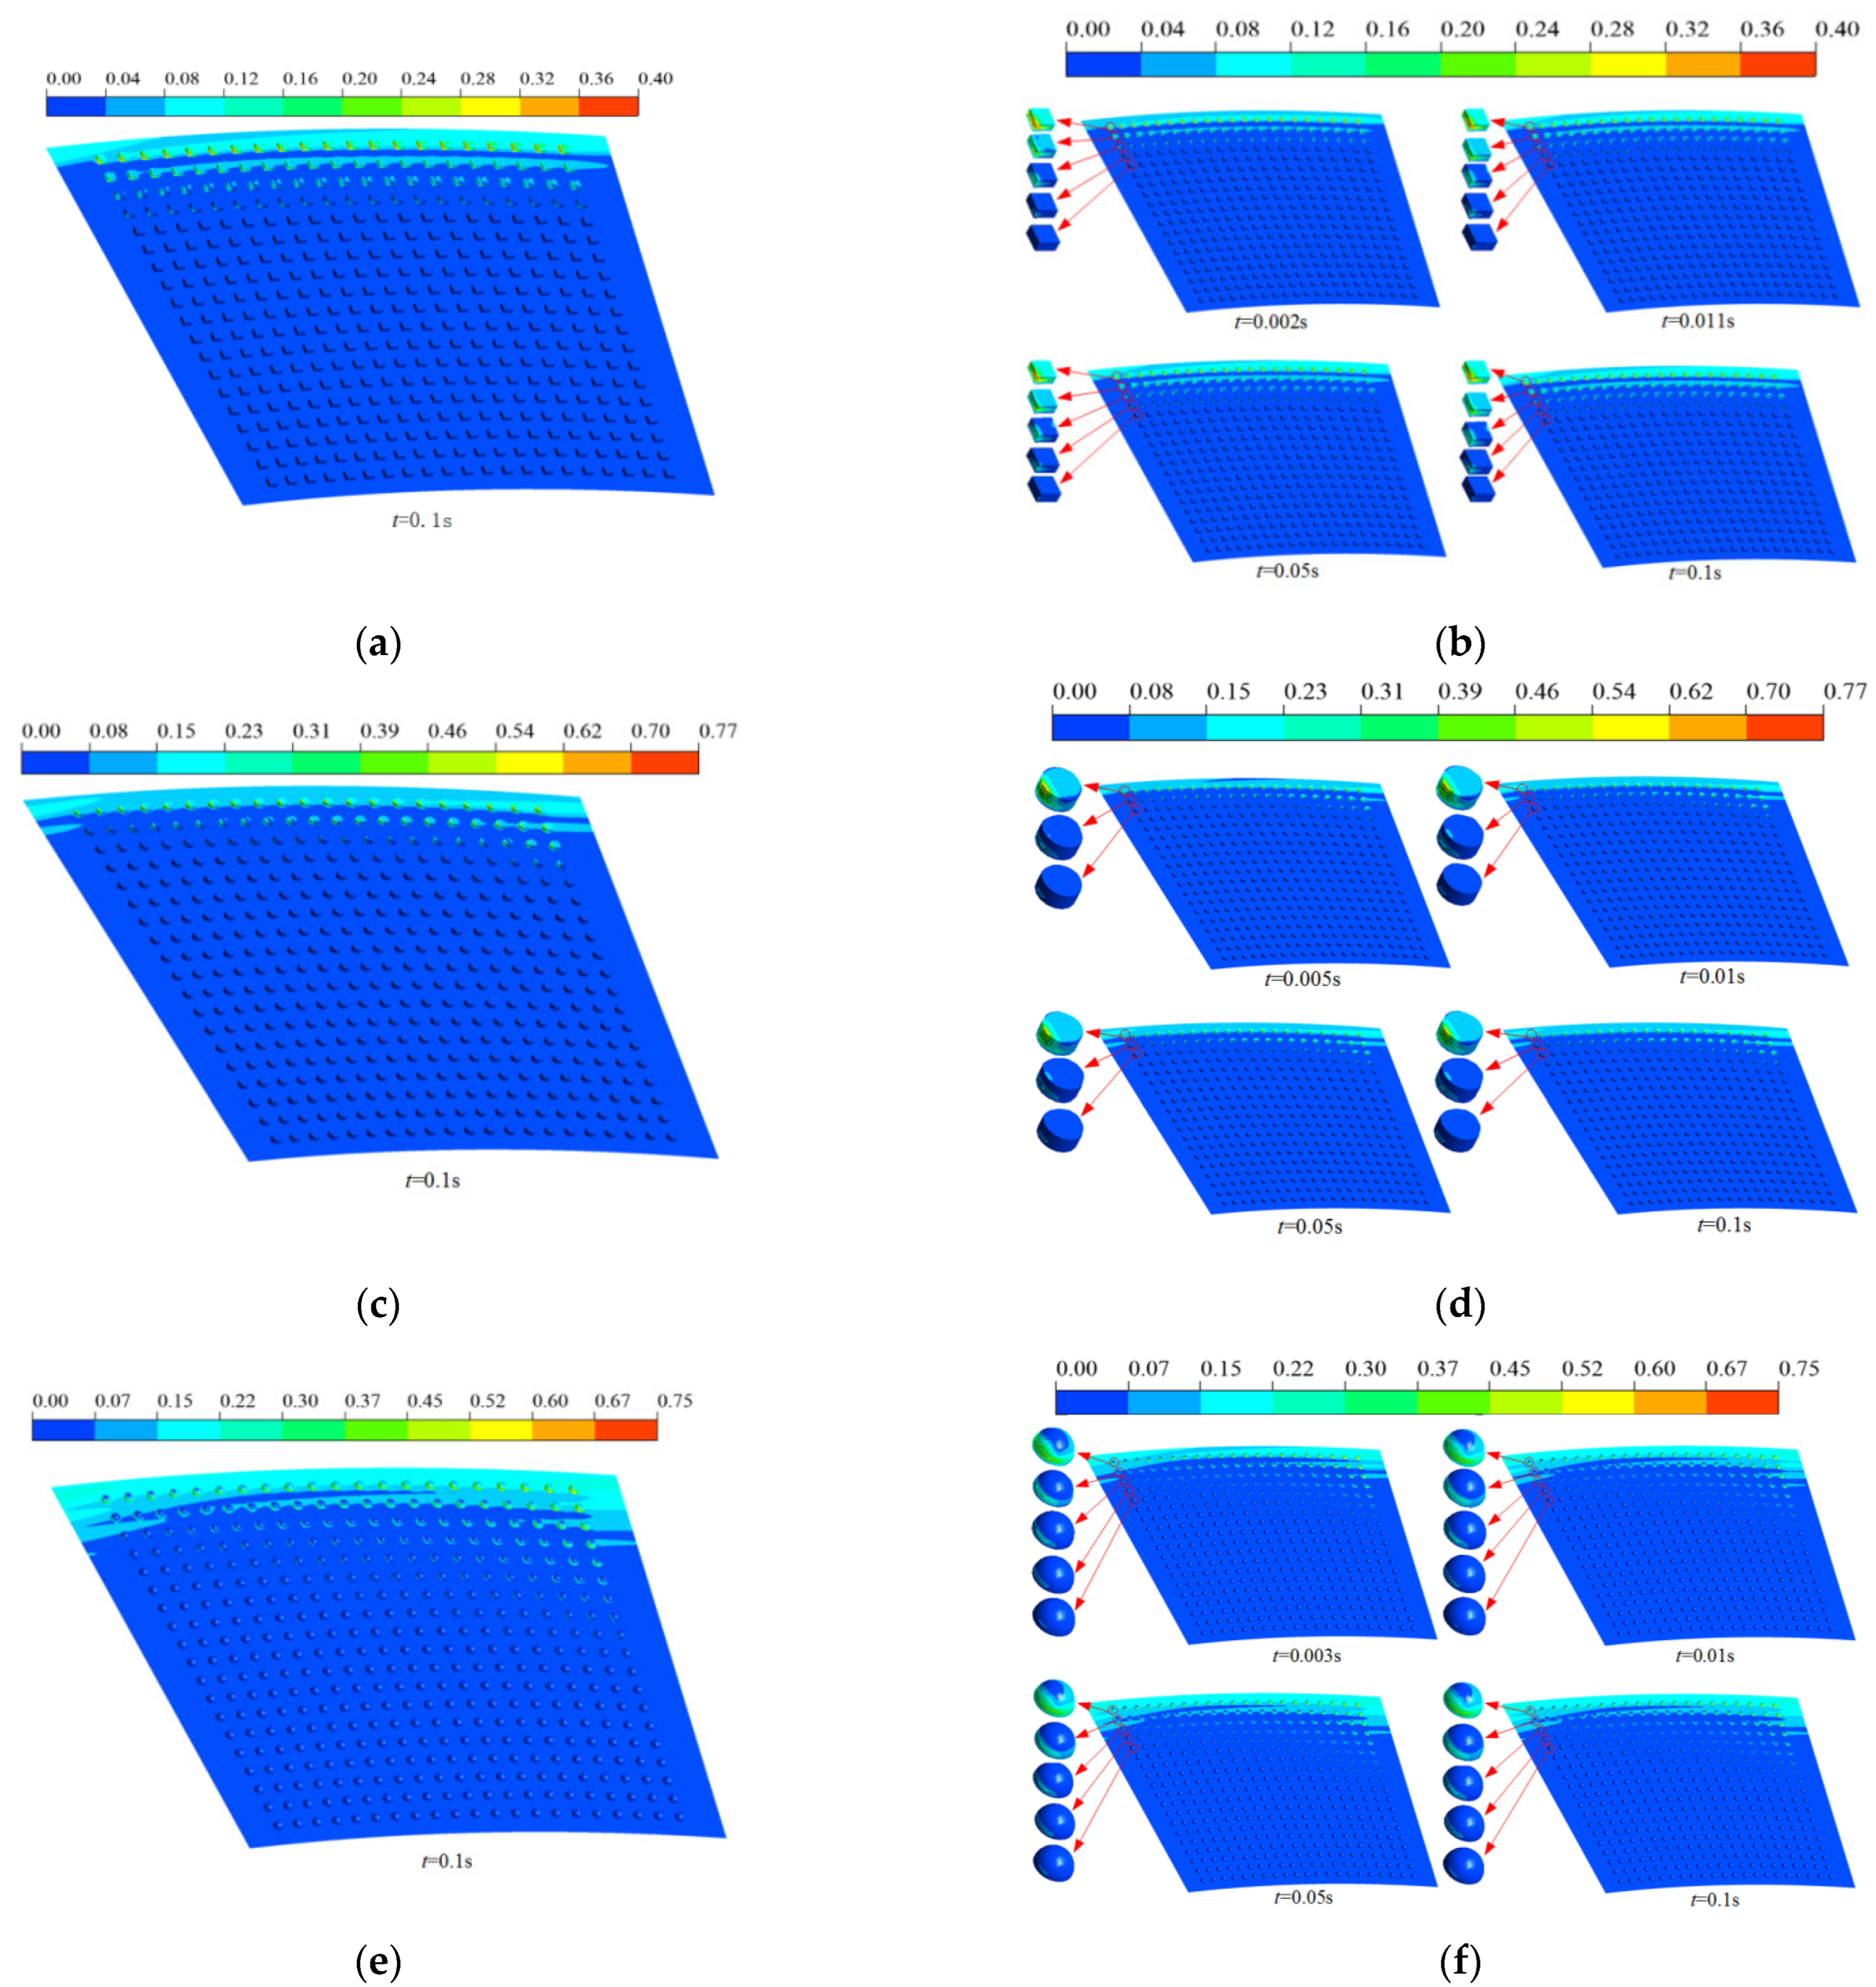
The hexahedral-textured oil film: During t = 0~0.002 s, the cavitation volume fraction rapidly increases to 0.0024556. During t = 0.002~0.011 s, the cavitation growth rate decreases, reaching 0.002917. At time t ≥ 0.011 s, the total cavitation volume fraction stabilizes at 0.0029695. Figure 9a shows the stable cavitation state for the hexahedral texture at a ratio of 12.917% ratio, and Figure 9b shows the temporal evolution of the oil film shear’s cavitation morphology over 0.1 s.
The cylindrical-textured oil film: During t = 0~0.005 s, the cavitation volume fraction rapidly increases to 0.0040138. At t = 0.005~0.01 s, the cavitation growth rate decreases, reaching 0.0047958. At time t ≥ 0.01 s, the total cavitation volume fraction stabilizes at 0.0051048. Figure 9c shows the stable cavitation state of cylindrical texture at a ratio of 12.917%, and Figure 9d shows the temporal evolution of the oil film shear’s cavitation morphology over 0.1 s.
The hemispherical-textured oil film: During t = 0~0.003 s, the cavitation volume fraction rapidly increases to 0.010912. During t = 0.003~0.01 s, the cavitation growth rate decreases, reaching 0.01315. At time t ≥ 0.01 s, the total cavitation volume fraction stabilizes at 0.014098. Figure 9e shows the stable cavitation state of the hemispherical texture at a ratio of 12.917% and Figure 9f shows the temporal evolution of the oil film shear’s cavitation morphology over 0.1 s.
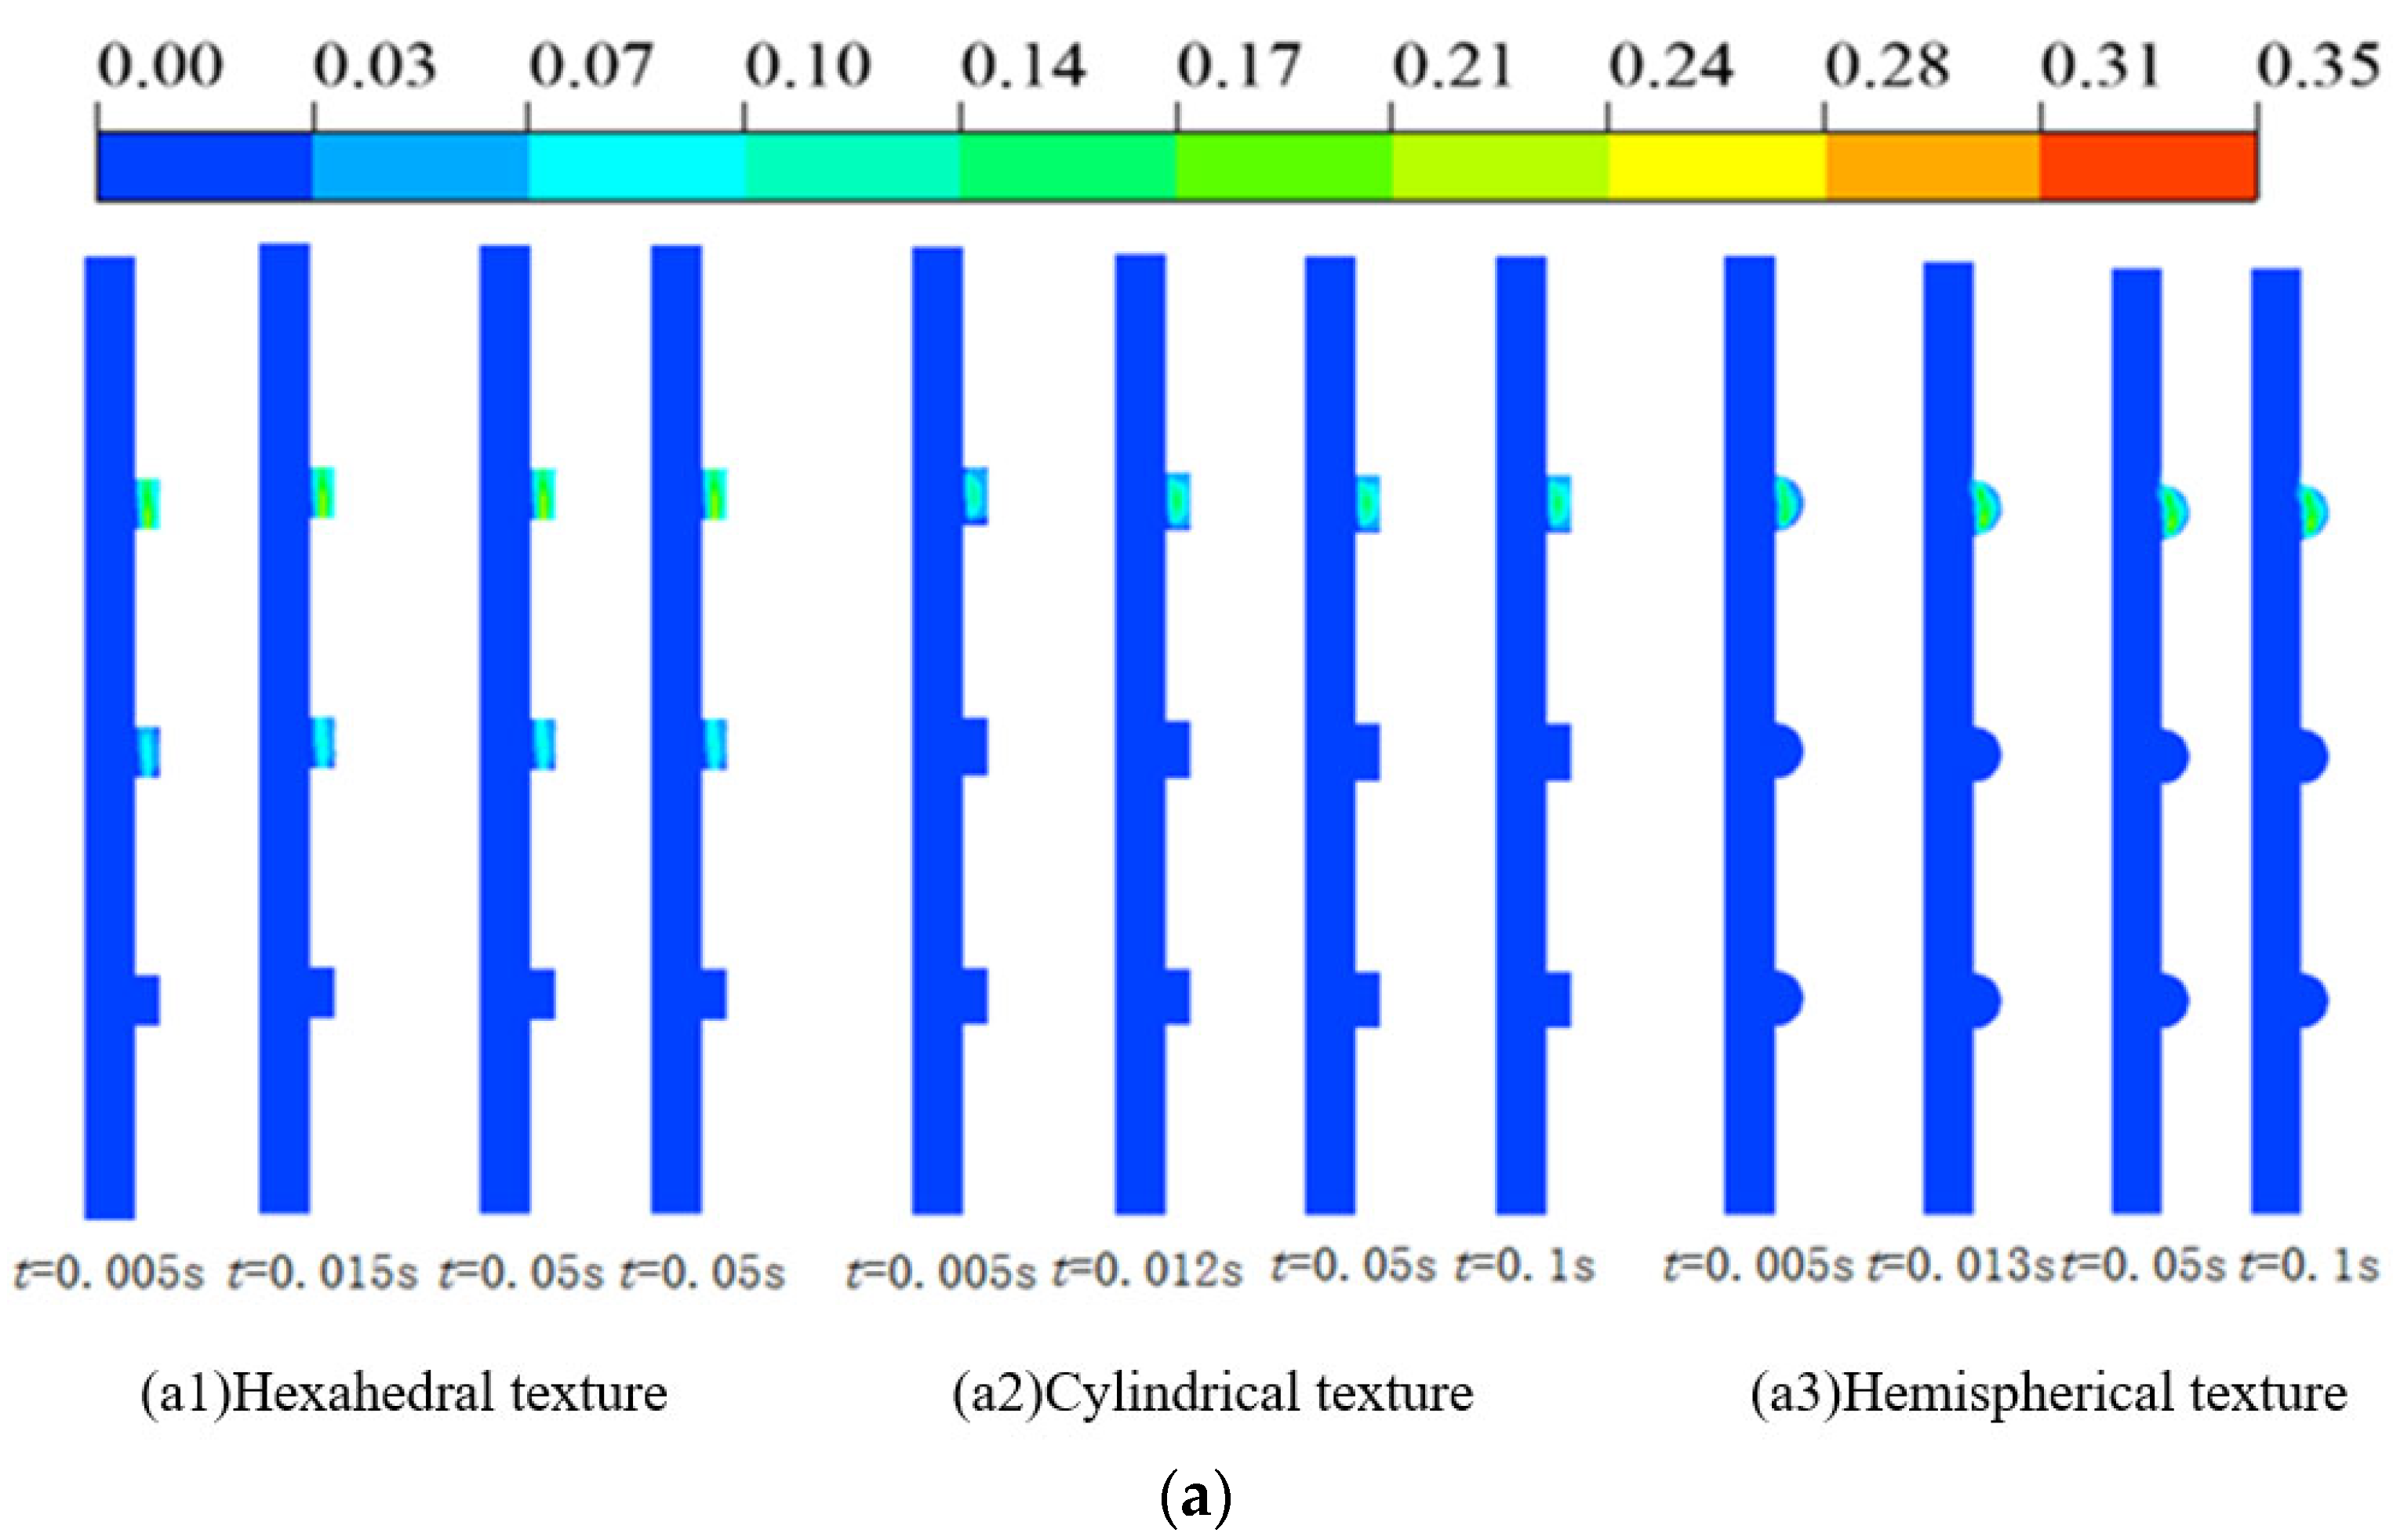
Figure 10a shows the temporal evolution of the oil film shear’s cavitation morphology for hexahedral, cylindrical, and hemispherical textures at r = 30.0, 5–32 mm, and θ = 0° under n = 6000 rpm conditions. The results demonstrate that cavitation gas primarily concentrates within the asperities near the outer diameter of the driving plate, indicating that this location is the initial site for oil film shear cavitation. Combined with the observations in Figure 7, cavitation in hexahedral- and cylindrical-textured oil films occurs mainly within the asperities; by contrast the hemispherical texture shows diffusion of cavitation into non-textured regions, forming cavitation tail wings.
Figure 10b presents the evolution of the cavitation morphology for 6.41% textured ratio samples (hexahedral/cylindrical/hemispherical) at r = 30.72, 55–32 mm, and θ = 0° under n = 6000 rpm. Compared with Figure 10a, cavitation gas primarily accumulates in the outer diameter asperities, with cavitation-inducing dimples extending toward the inner diameter. Over time, cavitation expands from the driving plate surface toward the driven plate surface, which is particularly evident in cylindrical and hemispherical textures where gas–liquid mixing zones appear at the outer diameter, compromising the oil film’s integrity.
Figure 10c illustrates the evolution of cavitation for 12.917% textured ratio samples at r = 30.72, 55–32 mm, and θ = 0° under identical conditions. A comparative analysis with Figure 10b reveals reduced cavitation propagation toward the driven plate surface at this higher texture ratio, which maintains the oil film with better integrity. Simulation results confirm that cavitation primarily occurs at the outer diameter, which is consistent with theoretical predictions.
For the oil film with hemispherical textures, cavitation propagates from the dimples into the non-textured regions, while for hexahedral/cylindrical textures, cavitation is mainly confined within the dimples. The fundamental reason for this phenomenon lies in the distinctly different flow separation and vortex structures induced by the edges of different texture geometries, which in turn determine the shape and extent of the low-pressure zones. For hexahedral/cylindrical textures, which confine cavitation, their sharp edges and steep sidewalls cause an abrupt flow separation as the fluid enters the dimple. This leads to the formation of a stable and strong closed vortex within the dimple. The core of this vortex represents the point of minimum pressure. Consequently, cavitation nucleates within this vortex core and is effectively “trapped” and “confined” inside the dimple, making it difficult to diffuse into the main flow region.
In contrast, for hemispherical textures, which allow cavitation to diffuse, their smooth, continuous curved surfaces lead to a much gentler flow separation. This flow condition is incapable of forming a strong, closed vortex to “trap” the cavitation bubbles. Instead, as the fluid flows out of the dimple, it forms a broader low-pressure wake region downstream. Therefore, cavitation bubbles generated within the dimple are immediately swept by the main flow into this low-pressure wake region, where they continue to develop. This manifests as the observed phenomenon of cavitation “diffusing” from the dimple into the non-textured area.

3.1.2. Oil Flow Velocity Field Analysis

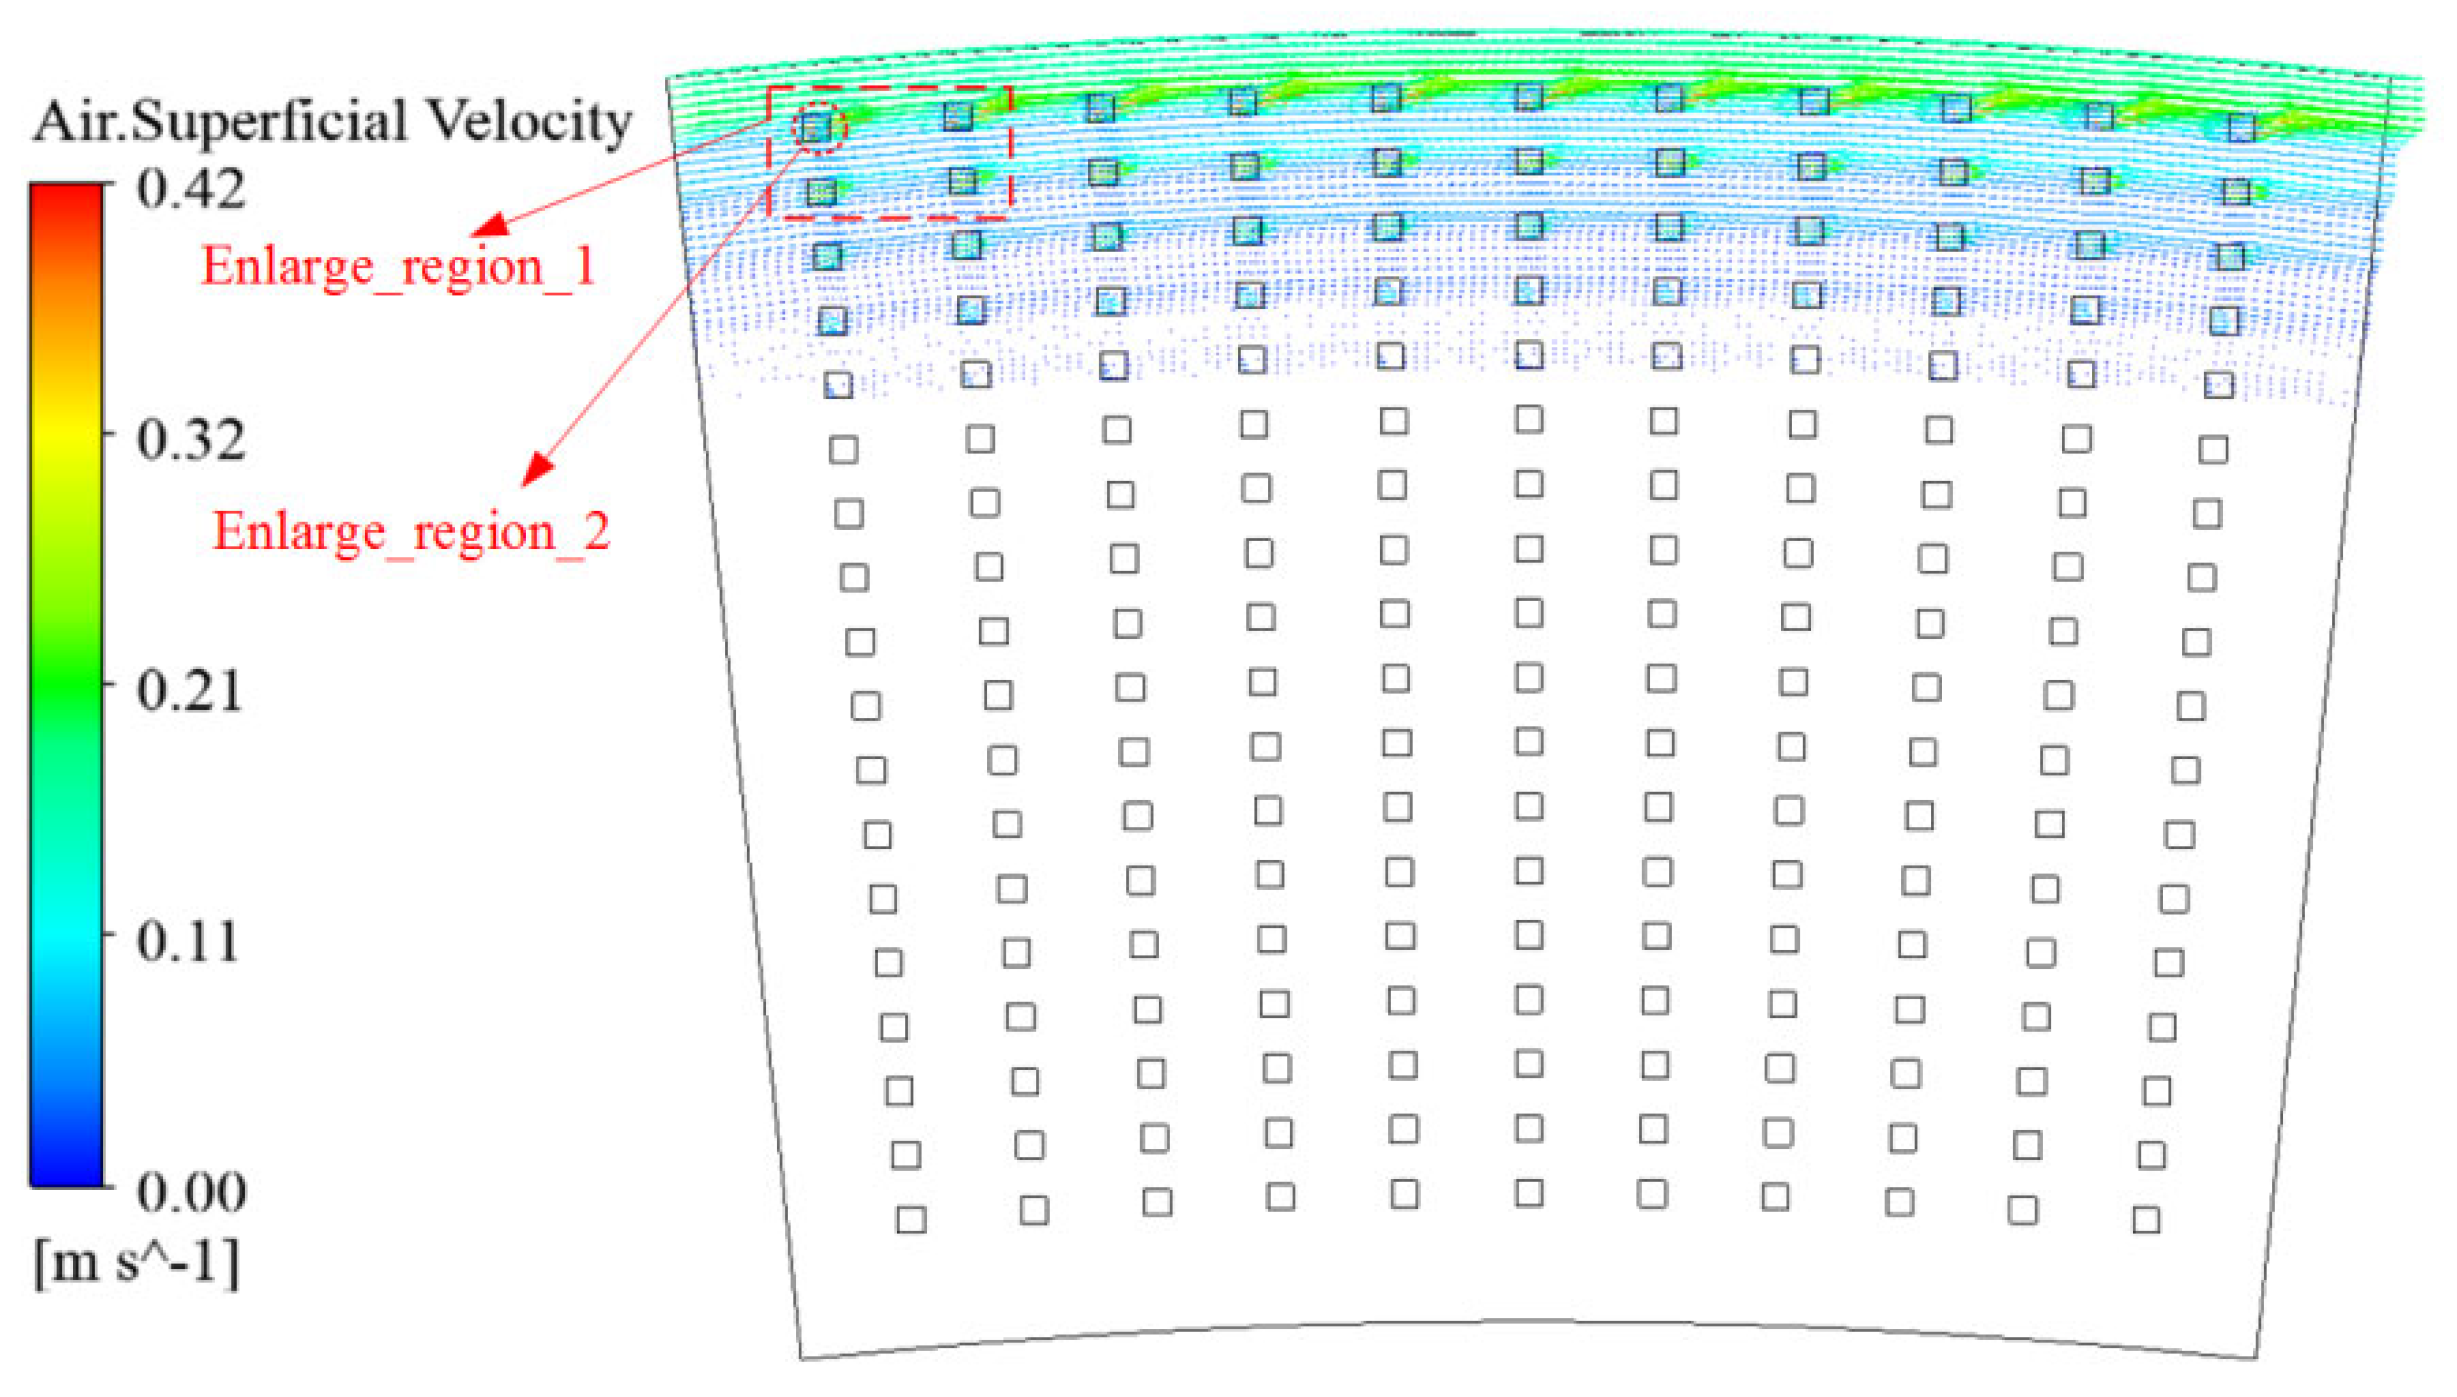
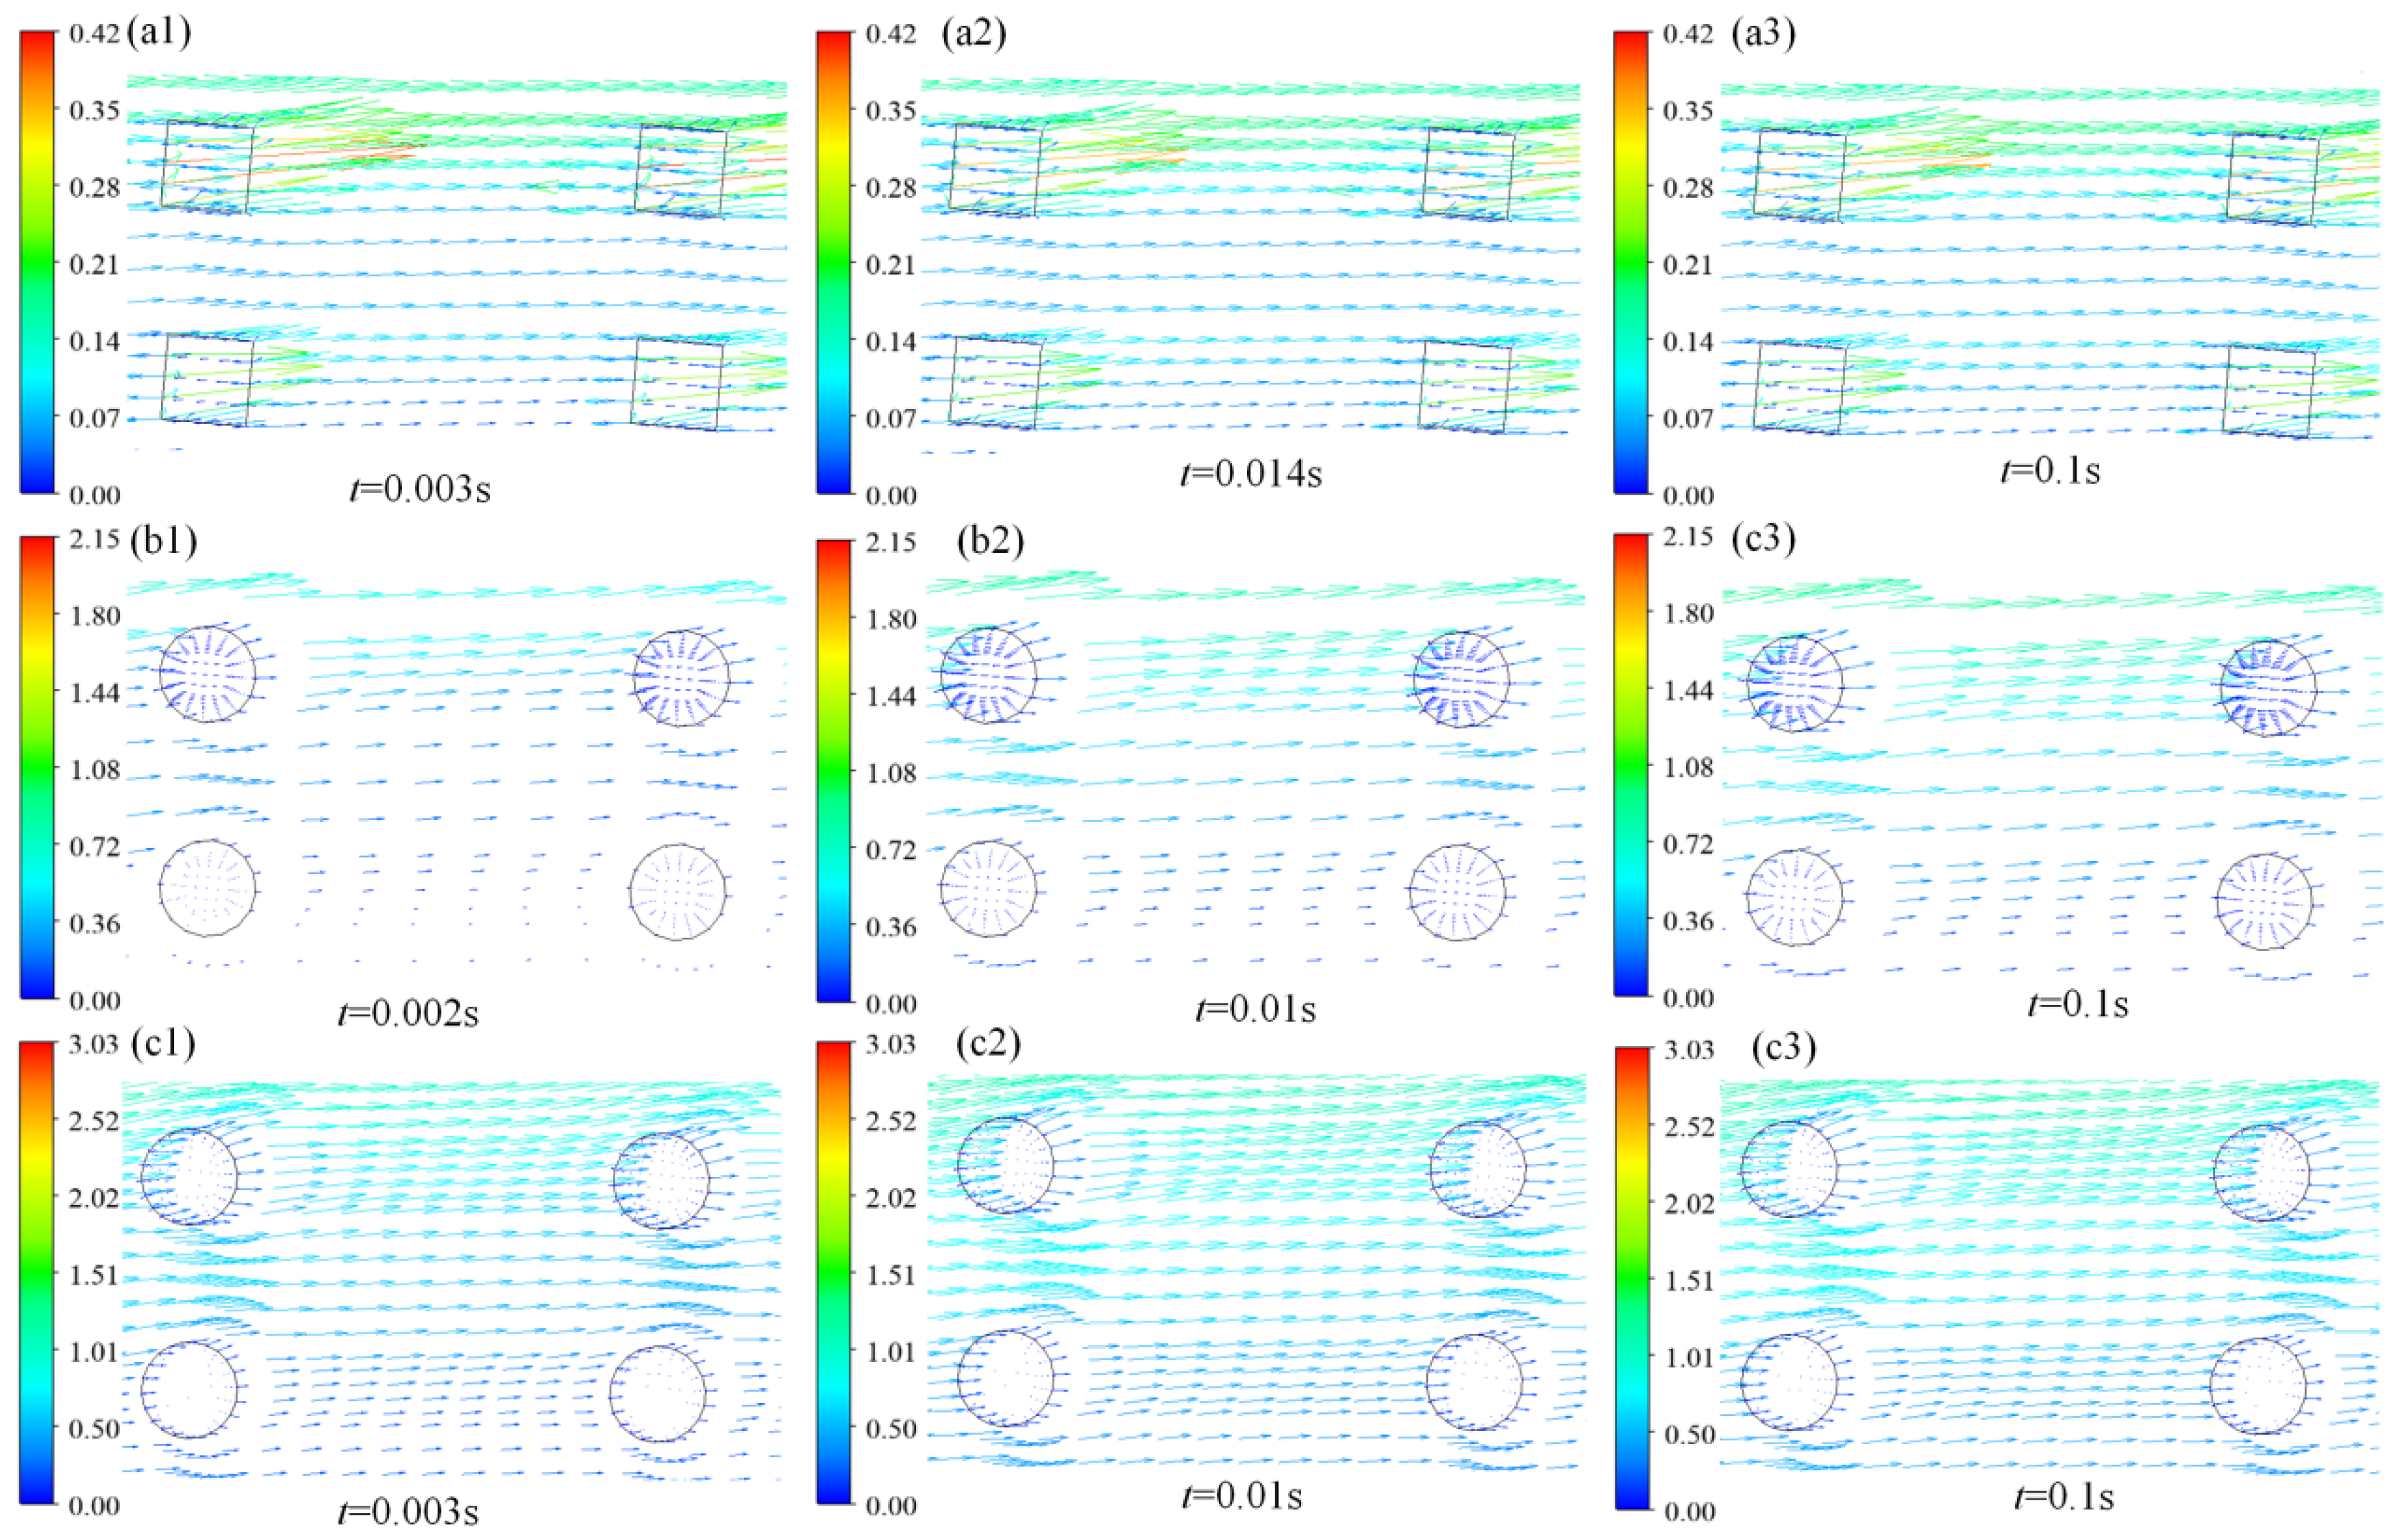
Using the clockwise-rotating driving plate as a reference (6000 rpm; oil film thickness of 0.1 mm), with the textured surface defined as the upper boundary, we analyzed instantaneous relative velocities of oil and cavitation vapor at (1) the upper surface and (2) the cross-section within texture dimples (h = 0.12 mm). Figure 11 shows the velocity vector field of a hexahedral-textured oil film (6.41% texture ratio) at t = 0.1 s. To study lubricant flow within texture dimples, zoomed-in analysis was performed for “Enlarge region 1” and “Enlarge region 2”.
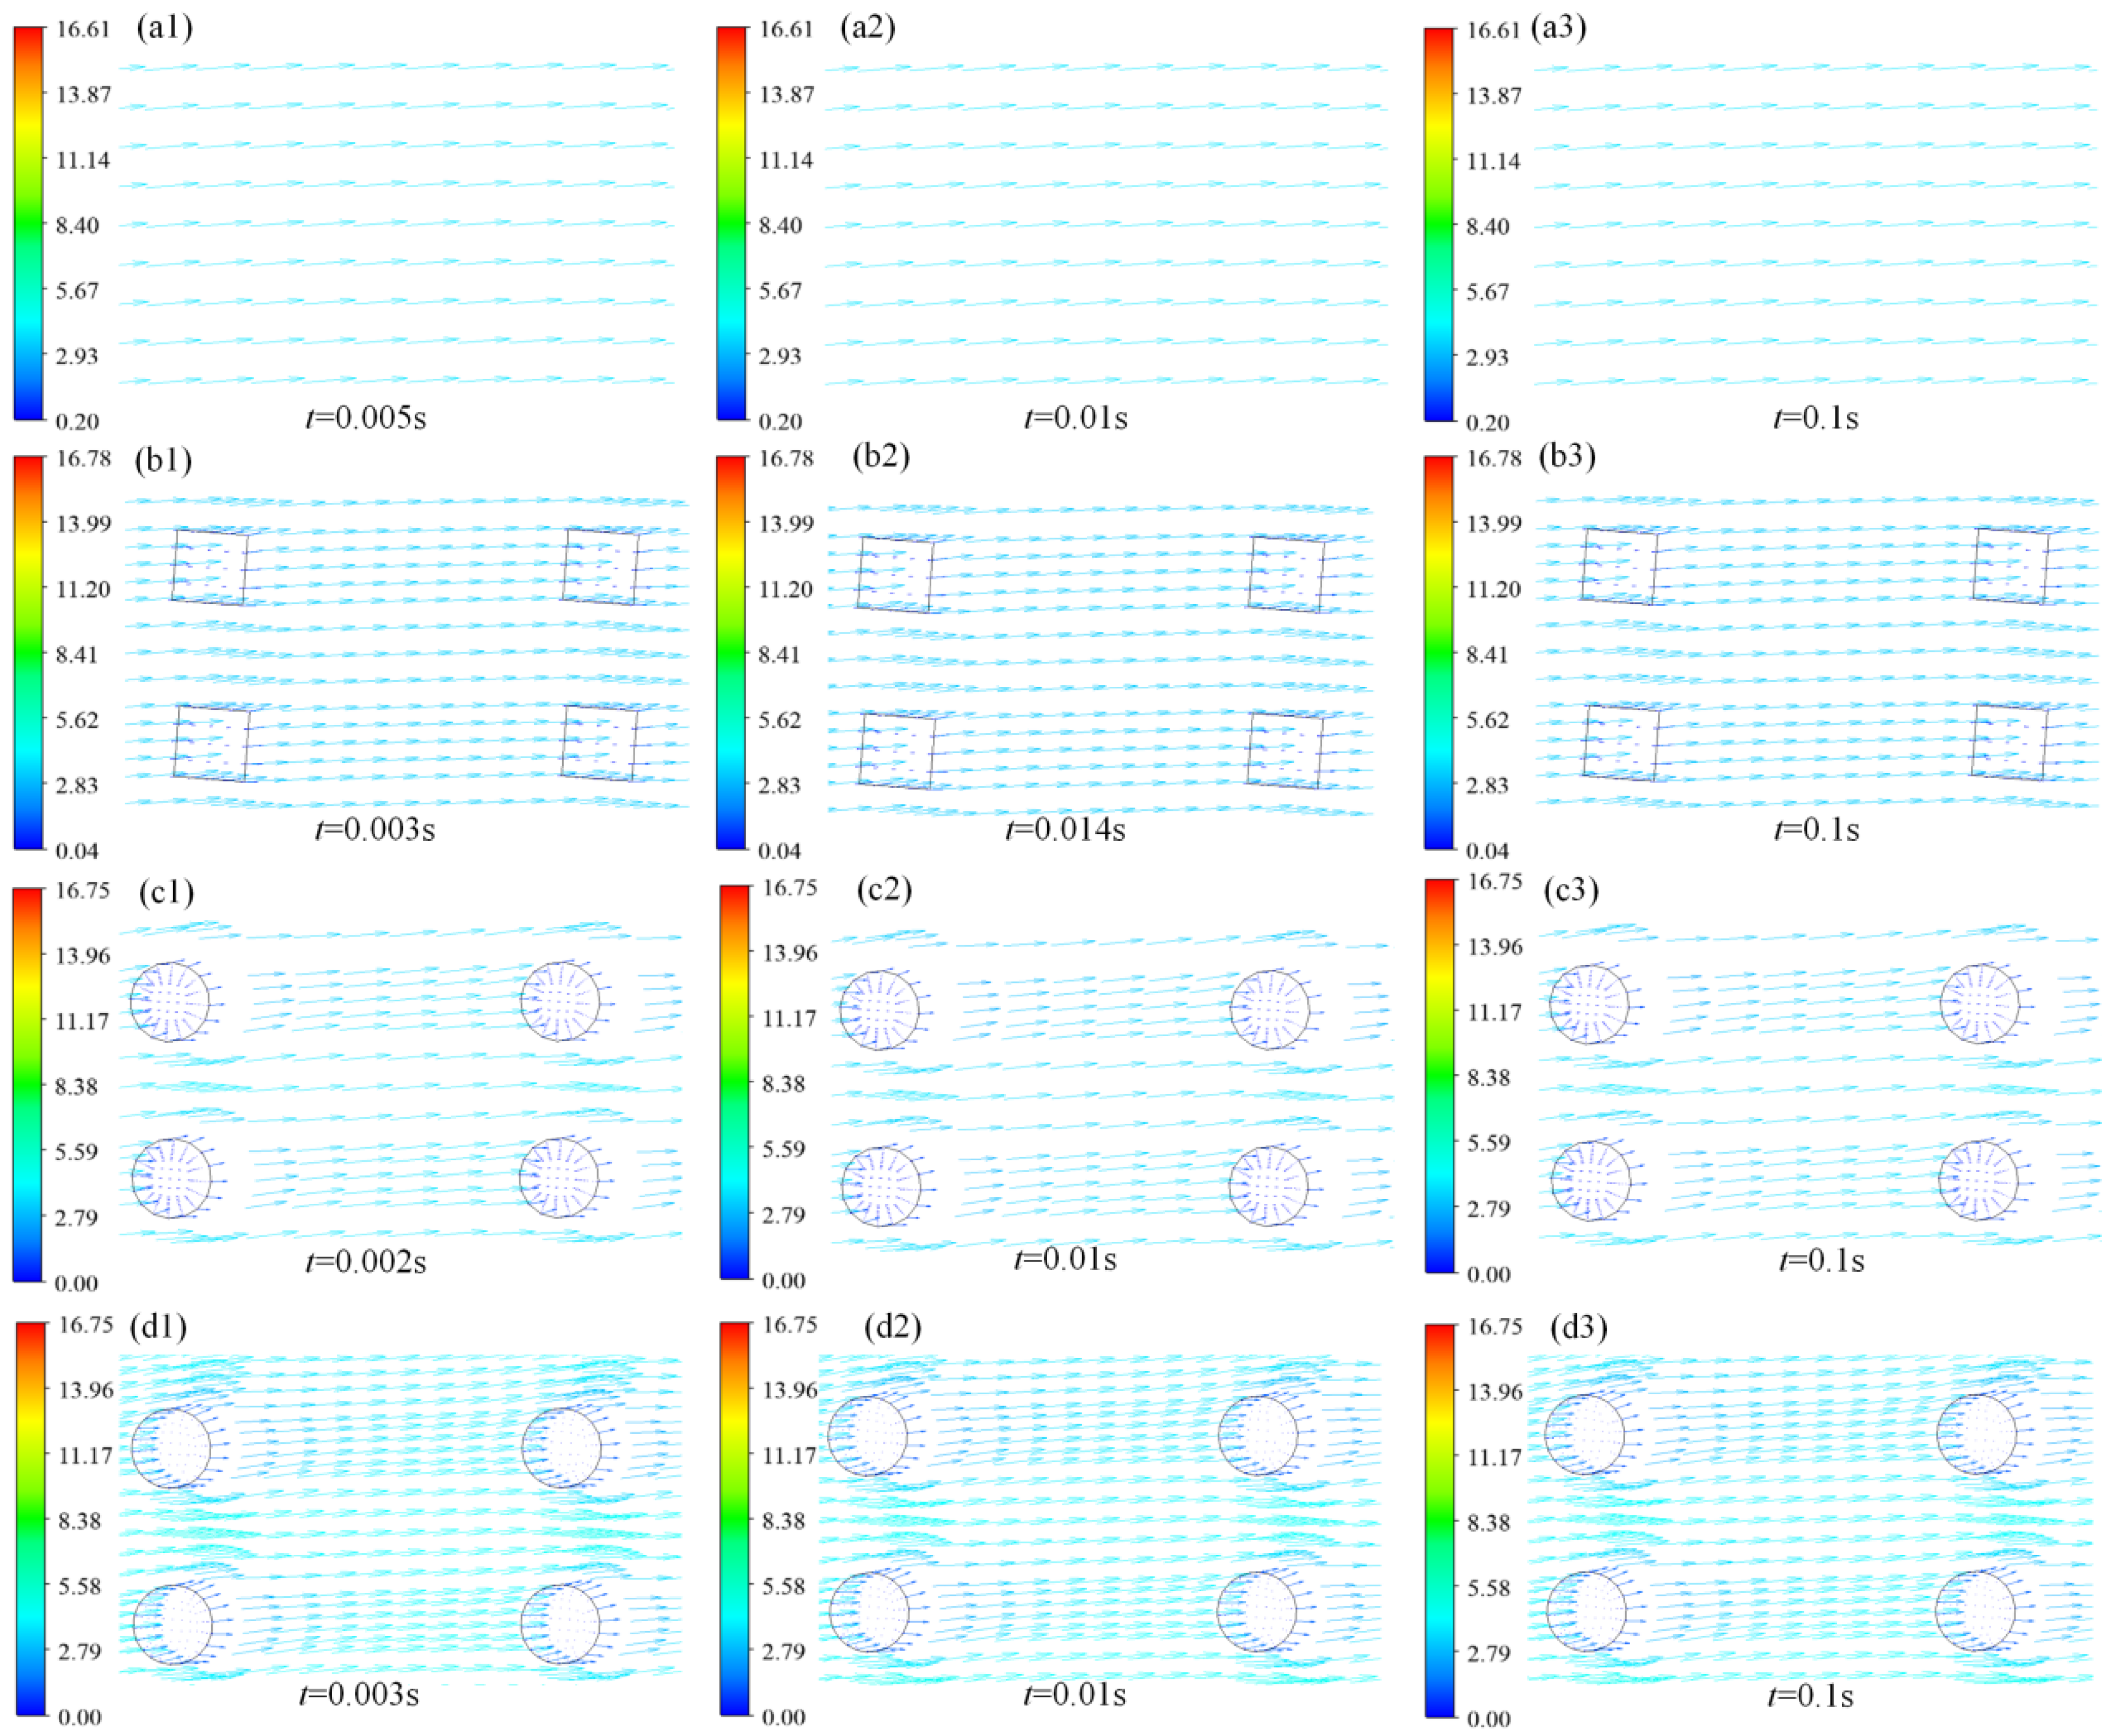
Figure 12 shows enlarged views of “Enlarge region 1” for different texture types, and Figure 13 presents enlarged views of “Enlarge region 2” for the h = 0.12 mm plane (mid-plane within texture dimples). Oil velocity vectors are displayed, where “Front” indicates the top view and “Side” indicates the side view at the same position. Figure 12(a1–a3) show non-textured oil film velocity vectors at different times. The oil mainly exhibits centrifugal flow with stable motion due to the absence of surface textures. The hexahedral-textured oil film flow is shown in Figure 12(b1–b3). Similarly to the non-textured case, the flow remains stable with minimal disturbance near dimples. Figure 13(a1–a3) show internal flow within hexahedral dimples (left-to-right along the arrows). As previously analyzed, a 6.41% hexahedral texture has a minimal cavitation volume fraction, maintaining a higher quantity of oil in the dimples. The flow velocity increases from 0.003 s to 0.1 s. Figure 12(c1–c3) display cylindrical-textured oil film velocity vectors. Significant flow disturbances occur near cylindrical dimples but remain stable elsewhere. Combined with Figure 13(b1), oil enters from the right and exits left at the h = 0.12 mm plane, suggesting vortex formation within dimples. Figure 12(d1–d3) show hemispherical-textured oil film velocity vectors. Similarly to the cylindrical case, flow disturbance occurs near the dimples. Figure 13(c1–c3) show increasing velocity over time for the h = 0.12 mm plane, with oil entering from the plane surface and exiting at the far right, indicating minimal vortex generation due to the dimple geometry’s weak flow confinement.

3.1.3. Gas Velocity Field Analysis

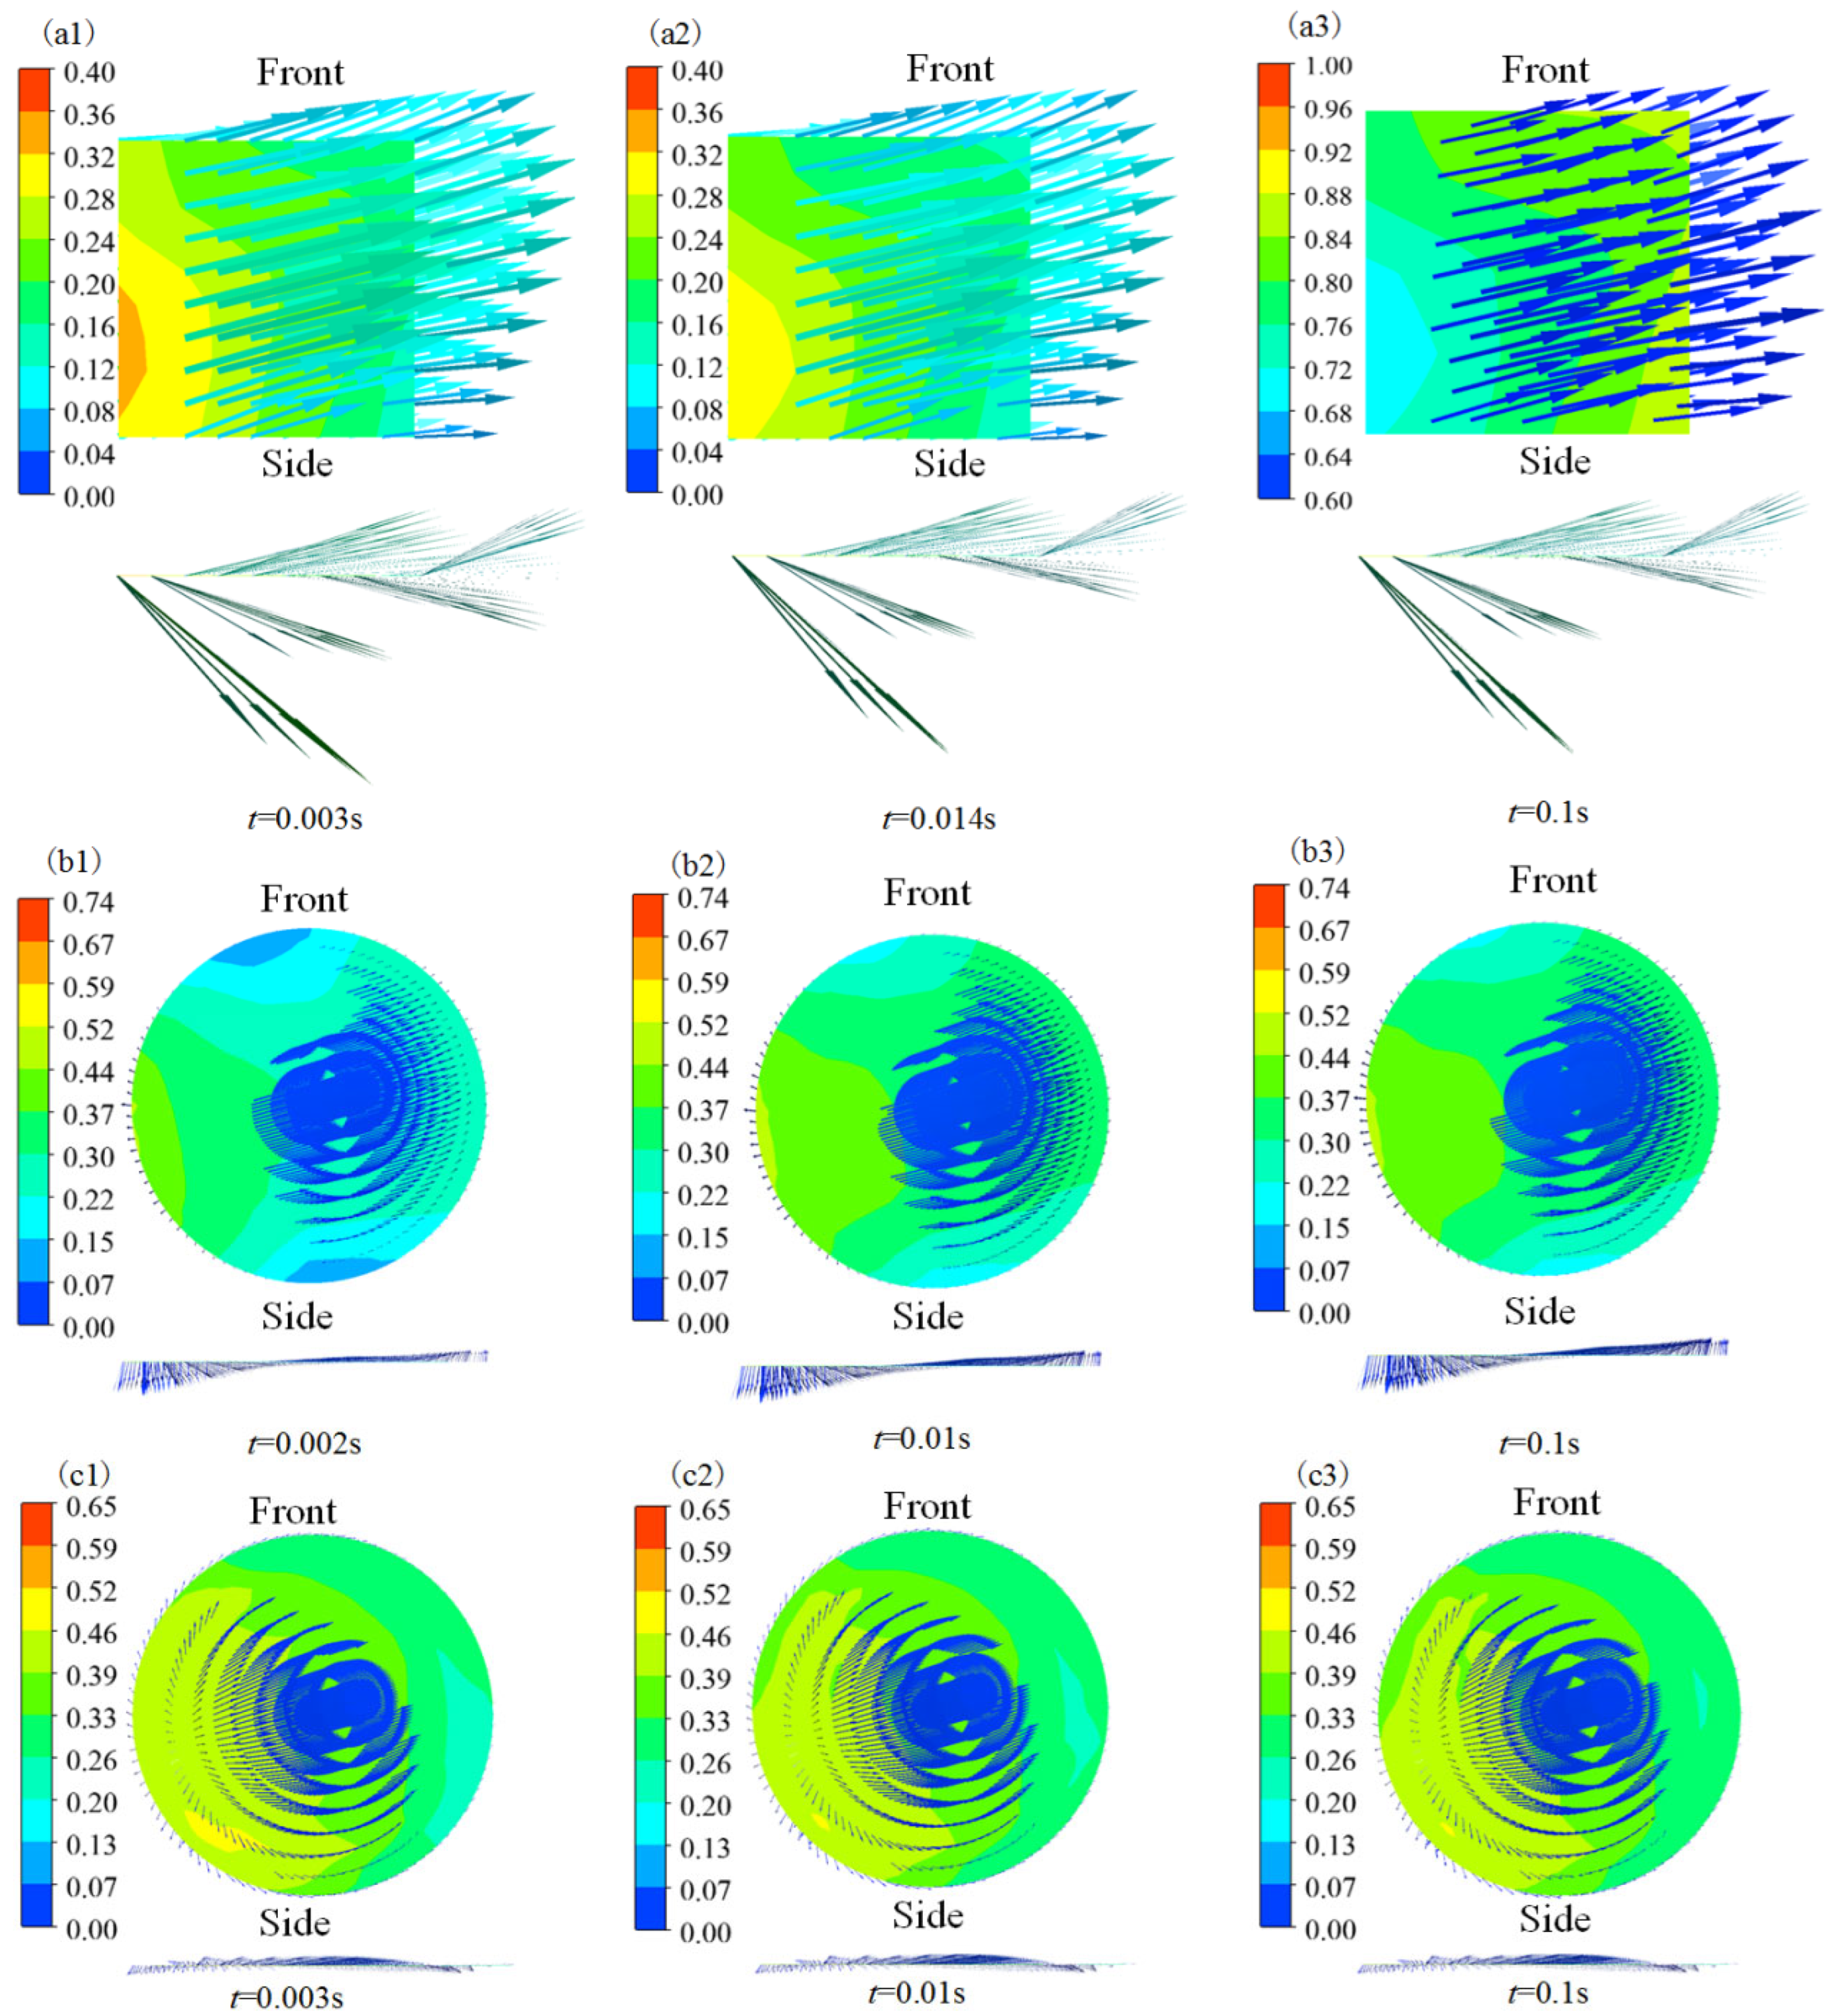
Figure 14 shows the cavitation gas velocity vector field in a hexahedral-textured oil film (6.41% texture ratio) at t = 0.1 s. The velocity vectors appear at the outer diameter and match the cavitation volume distribution shown previously. Similar cavitation patterns occurred in cylindrical- and hemispherical-textured oil films; thus, these are not displayed separately. To analyze the gas motion within various texture dimples, zoomed-in views of “Enlarge region 1” and “Enlarge region 2” were examined.
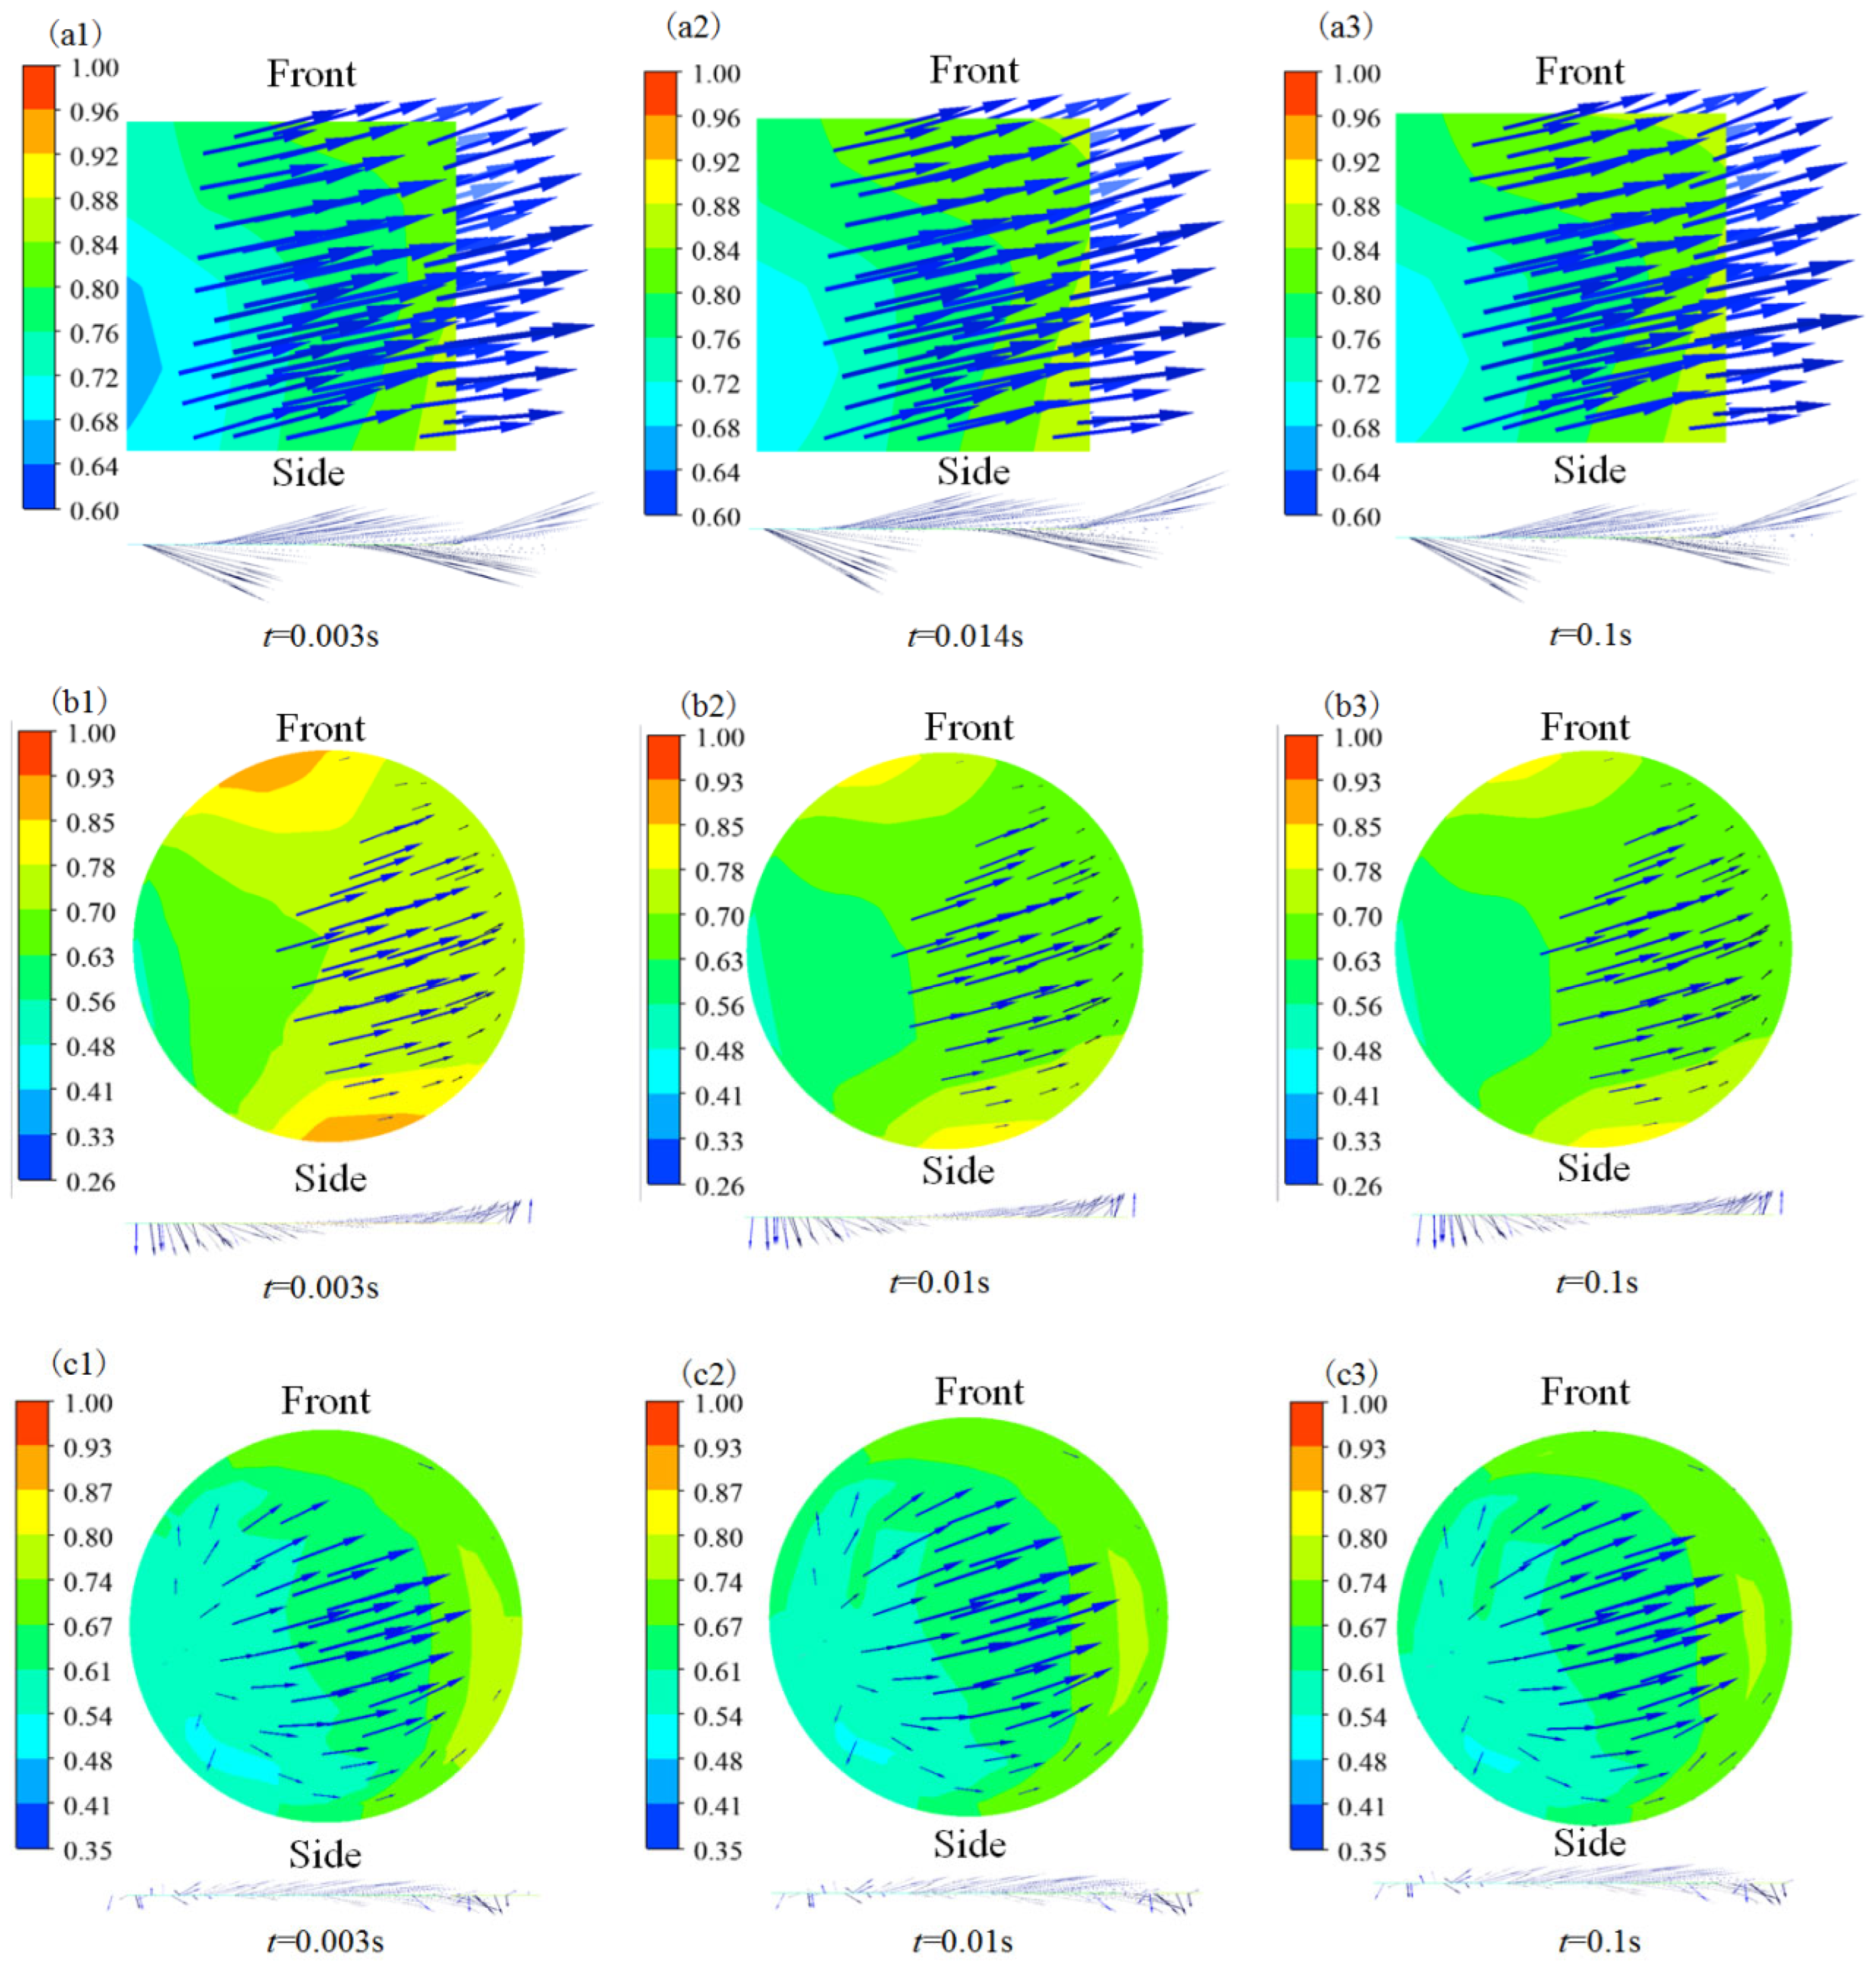
Figure 15 shows enlarged views of “Enlarge region 1” from Figure 14 for different texture types, while Figure 16 presents magnified details of “Enlarge region 2” at the h = 0.12 mm mid-plane within texture dimples. Cavitation gas velocity vectors are displayed with “Front” showing the top view and “Side” showing the corresponding side view of vectors at the same location. The hexahedral-textured oil film in Figure 15(a1–a3) demonstrates the rapid growth of the cavitation gas volume over time with a minimal increase in velocity, where maximum velocities occur within texture dimples. A comparative analysis of Figure 12, Figure 13, Figure 15 and Figure 16 reveals consistent directional alignment between oil flow and cavitation gas movement, with gas following oil flow patterns at lower velocities than the liquid phase. Figure 14’s absence of gas backflow at the outlet boundary confirms that the observed gas results from a shear cavitation-induced phase change (liquid-to-vapor conversion) rather than external sources, demonstrating that cavitation bubbles originate through localized phase transition and are transported by bulk oil flow while maintaining consistent velocity influenced by the texture geometry.

3.1.4. Streamline Diagrams of Oil Flow and Cavitation Gas

Figure 17a,b present streamline diagrams of oil flow and cavitation gas flow on vertical cross-sections within texture dimples at the “Enlarge region 2” position in Figure 14. This includes hexahedral-, cylindrical-, and hemispherical-textured oil films. The diagrams illustrate the distinct flow patterns of both liquid and vapor phases within different texture geometries.
Comparative analysis reveals consistent oil flow and cavitation gas patterns across different time points within texture dimples, confirming previous findings that cavitation gas originates from the liquid-to-vapor phase transition induced by oil film shear cavitation. The streamlined diagrams in Figure 17a,b(a1–a3) demonstrate that oil entering hexahedral dimples forms two major vortices with low-pressure cores, where gas nuclei are drawn into the shear layer and rapidly grow into cavitation bubbles at t = 0.003 s. Corresponding velocity vector directions shown in the “Side” views of Figure 13(a1–a3) and Figure 16(a1–a3) are caused by vortices generated at the h = 0.12 mm plane. While cylindrical and hemispherical textures exhibit similar mechanisms, the following key differences emerge: the gradual spatial variation (compared to abrupt hexahedral/cylindrical geometries) of hemispherical dimples reduces the oil retention capability, resulting in weaker vortex formation. Therefore, hexahedral and cylindrical textures produce more pronounced vortices due to stronger fluid trapping effects, whereas the smooth contours of hemispherical textures generate minimal vortical structures.

3.1.5. Cavitation Pressure Field Analysis

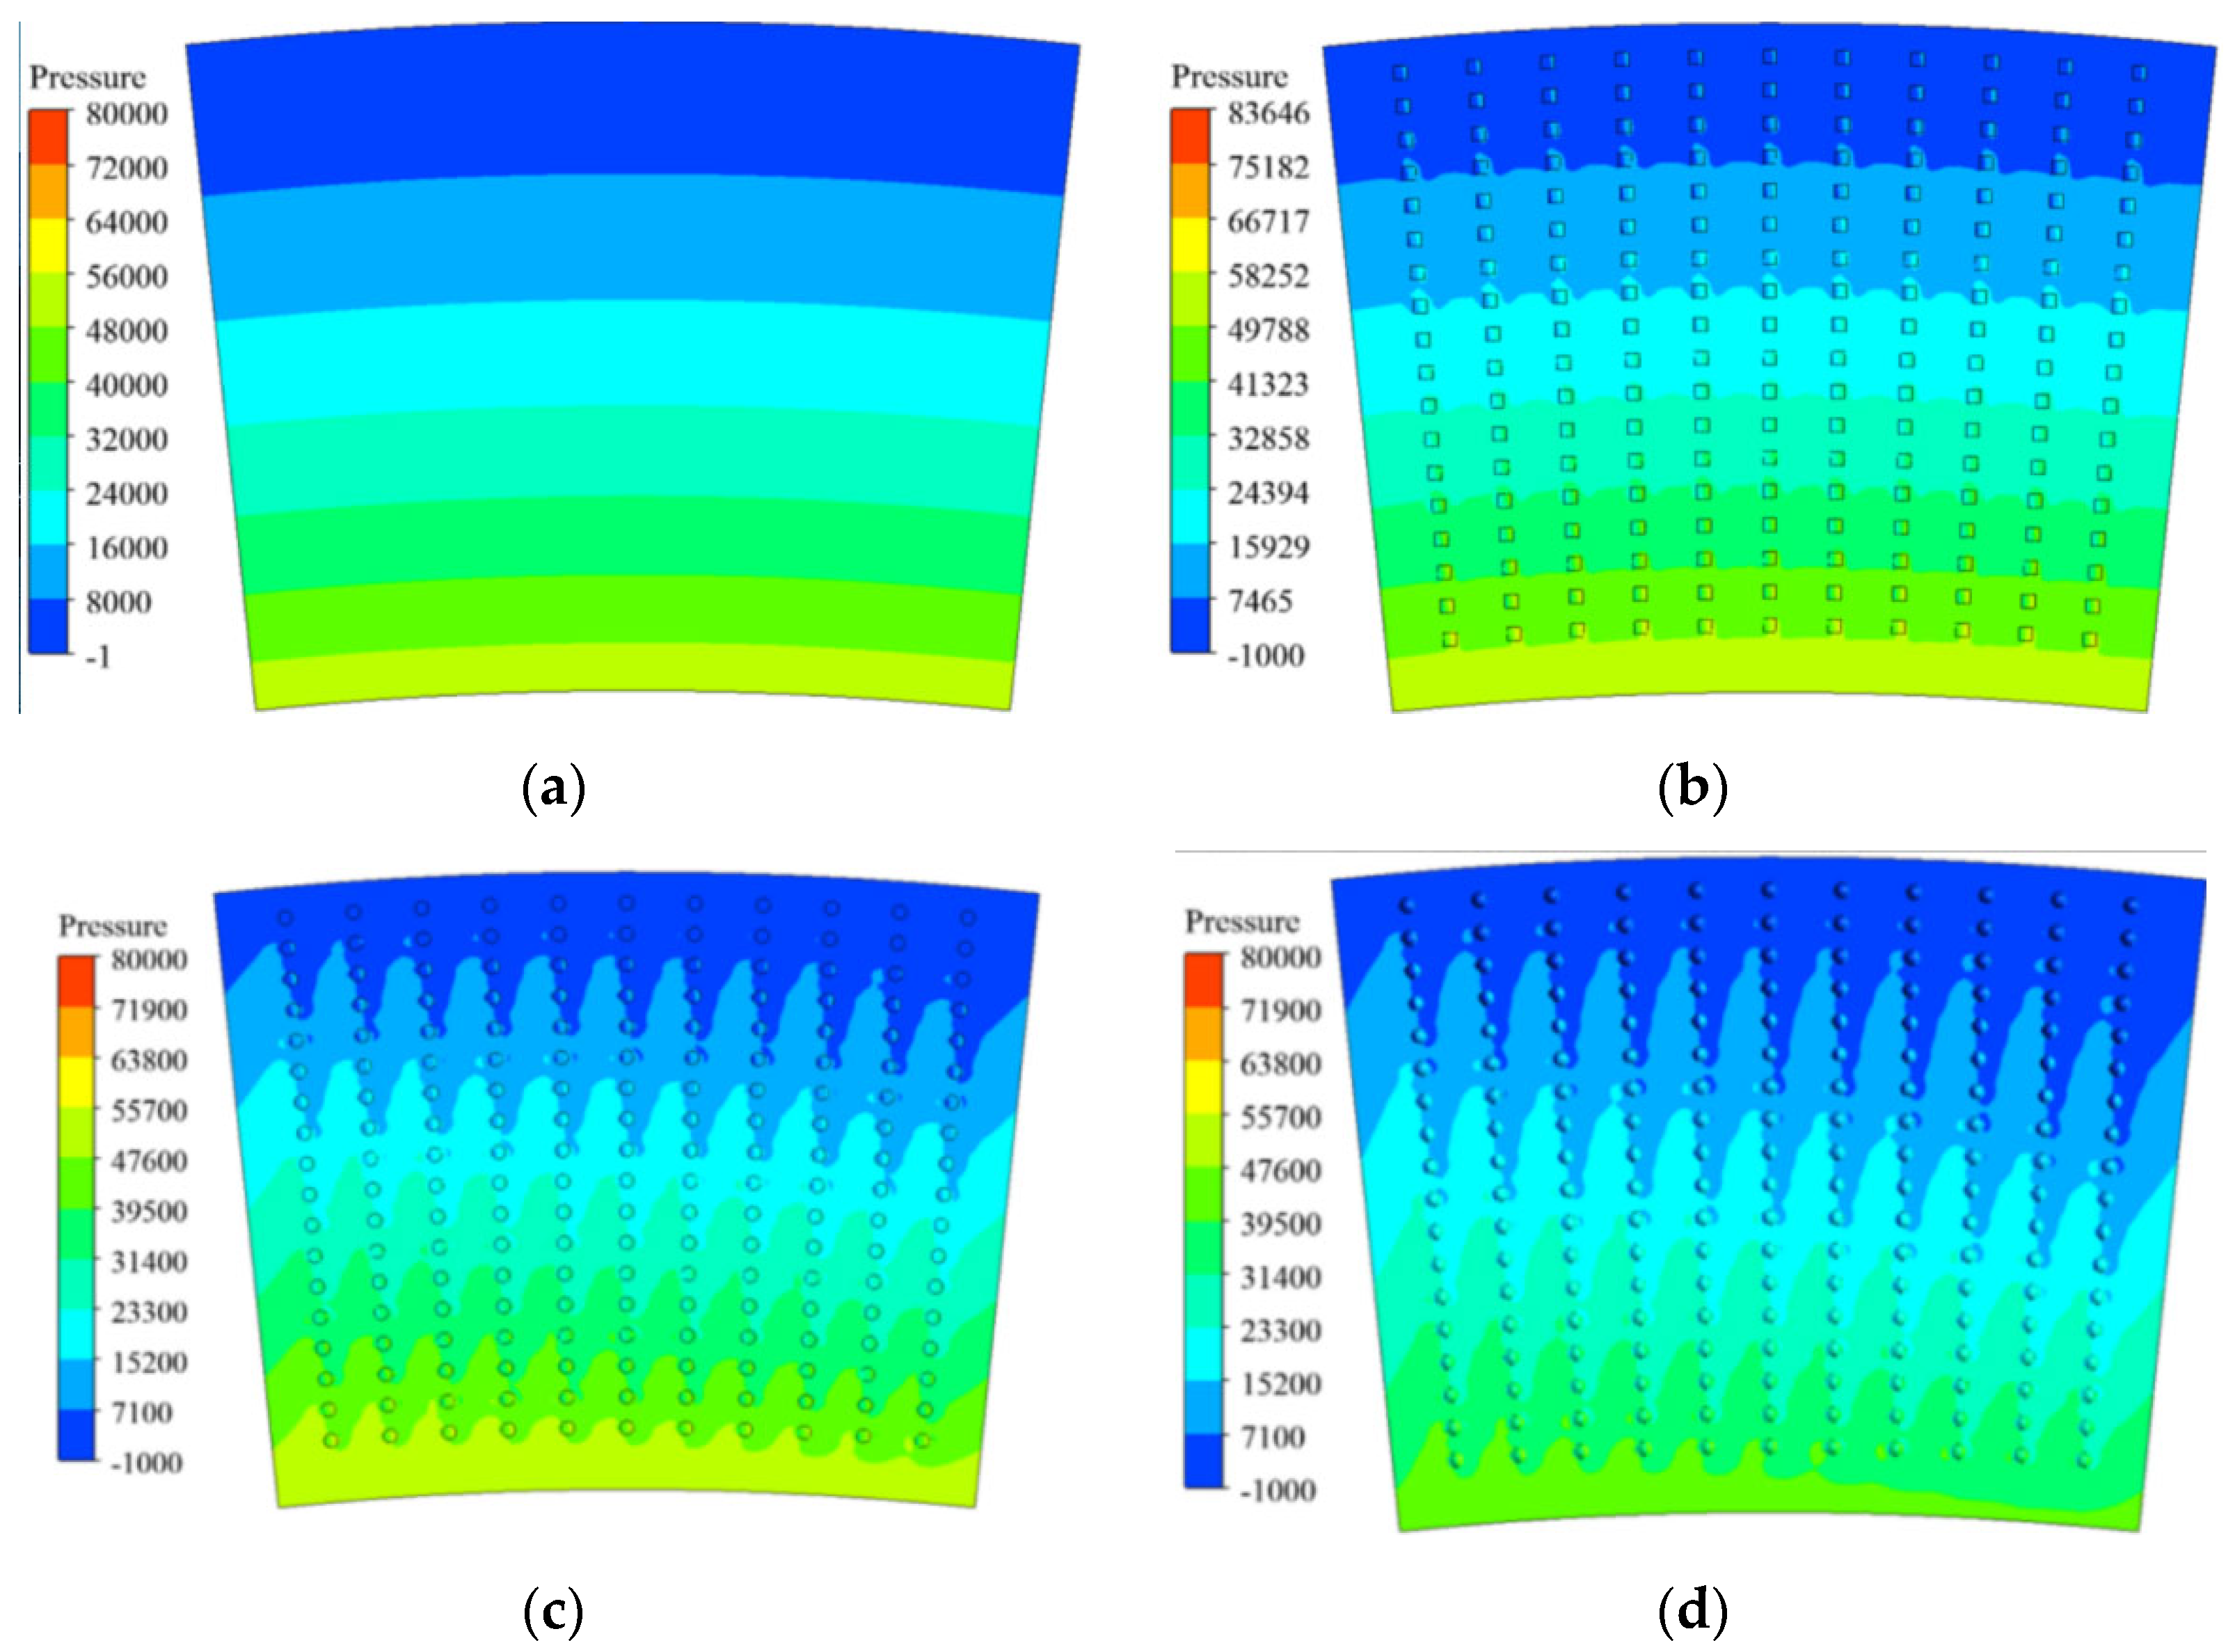
Figure 18 presents the pressure contour plots for different textured oil films, where Figure 18a–d correspond to non-textured, hexahedral-textured, cylindrical-textured, and hemispherical-textured oil films, respectively. All textures had an identical 6.41% texture ratio and distribution patterns. Comparative analysis reveals that while texture dimples alter local pressure distributions, the overall pressure field remains consistent outside immediate dimple regions. The hemispherical-textured oil film exhibits both the highest cavitation volume fraction and the most extensive low-pressure zone, with cavitation gas locations precisely coinciding with these low-pressure regions.
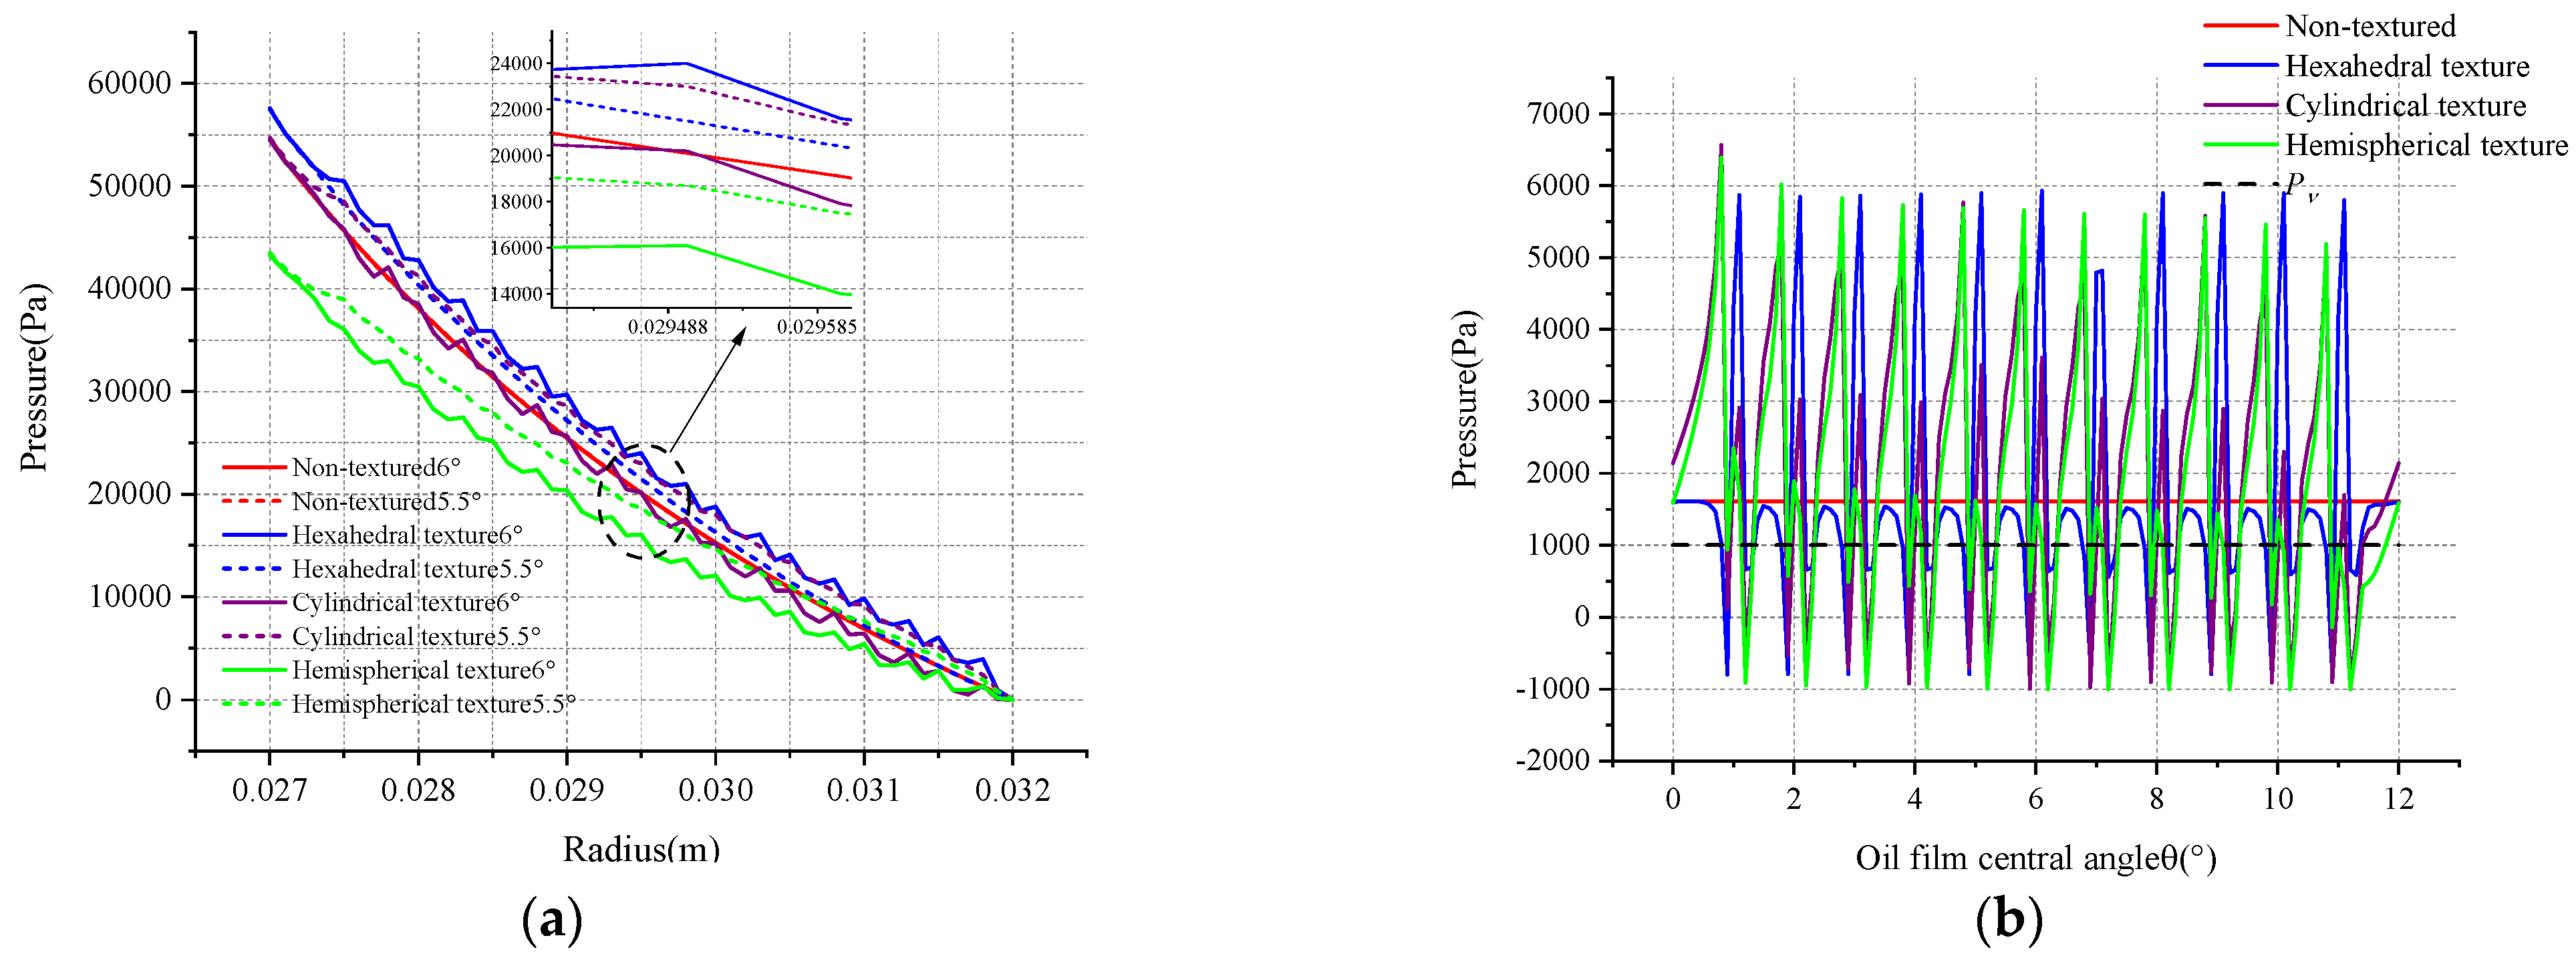
The oil film model has a circumferential angle θ of 12°, with θ = 6° positioned along the radial centerline of texture dimples. As shown in Figure 19a, the solid line represents the radial pressure distribution along the texture centers at a 6° azimuth, and the dashed line shows the pressure profile at 5.5° (non-textured region). Both curves demonstrate radially decreasing pressure, which is consistent with previous analysis results showing radial flow driven by inlet pressure and centrifugal force. Here, increasing the velocity along the radius creates an inverse pressure–velocity relationship as per Bernoulli’s principle. The two pressure curves for the non-textured oil film remain consistent throughout. For the three textured types, pressure declines smoothly in non-textured regions but exhibits fluctuations when entering dimples. Figure 19b displays axial pressure distributions at r = 31.75 mm for different textures. As established earlier, non-textured films maintain pressure above vapor pressure (Pv) without cavitation and experience constant axial pressure due to the absence of texture-induced hydrodynamic effects. Hexahedral- and hemispherical-textured films exhibit pressures below Pv for dimples at the outer diameter where cavitation occurs.
Figure 20a shows the pressure distribution of oil within different types of dimples at the “Enlarge region 2” position. Due to the shear effect of the friction pair and the blocking effect of texture boundaries on the oil flow, the pressure increases significantly near the texture boundaries under strong compression. This indicates that the textures generate effective hydrodynamic pressure effects, which enhance the load-carrying capacity of the oil film. The cylindrical texture has the greatest influence on the flow field pressure, followed by the hexahedral texture, while the hemispherical texture has the least impact. This difference arises because the edges and internal shapes of the dimples vary-the spatial convergence and divergence at the edges of cylindrical and hexahedral dimples are more pronounced than in hemispherical dimples, resulting in higher pressure peaks. With identical texture ratios and distribution patterns in the oil film model, the cylindrical texture’s larger corresponding central angle makes it the most significant.
Figure 20b displays the pressure distribution at different time points within a hemispherical texture dimple at “Enlarge region 2”, corresponding to previously analyzed cavitation development stages. The pressure distribution changes as shear cavitation progresses (0.9–1.1° represents textured regions, while 0.8–0.9° and 1.1–1.2° are non-textured regions). A local low-pressure zone develops below vapor pressure (Pv) downstream of the texture, causing cavitation, while a local high-pressure zone forms upstream, with a gradually decreasing peak over time.
Figure 20c presents the circumferential pressure distribution at t = 0.1 s on the upper surface of a hemispherical-textured oil film at various radial positions (r = 28, 29, 30, and 31 mm). The pressure only falls below Pv at r = 31, while at r < 30 mm, the pressure remains above Pv with identical distribution patterns.
Figure 21a illustrates the pressure variation with rotational speed within hexahedral-, cylindrical-, and hemispherical-textured dimples, considering cavitation effects. The pressure distribution trends in different texture dimples remain generally consistent; at lower speeds, high-pressure and low-pressure zones are symmetrically distributed. As the speed increases, the hydrodynamic effect strengthens, with peak low-pressure values decreasing significantly, while peak high-pressure values increase. Figure 21b presents the corresponding pressure variations when cavitation effects are neglected. A comparison with Figure 21a reveals that while pressure distribution patterns remain similar whether cavitation is considered or not, the peak high-pressure values show smaller increases with speed when cavitation is neglected, and peak low-pressure values decrease more dramatically. This demonstrates that cavitation effects mitigate the increase in hydrodynamic pressure.

3.1.6. Cavitation Mass Transfer Rate Analysis

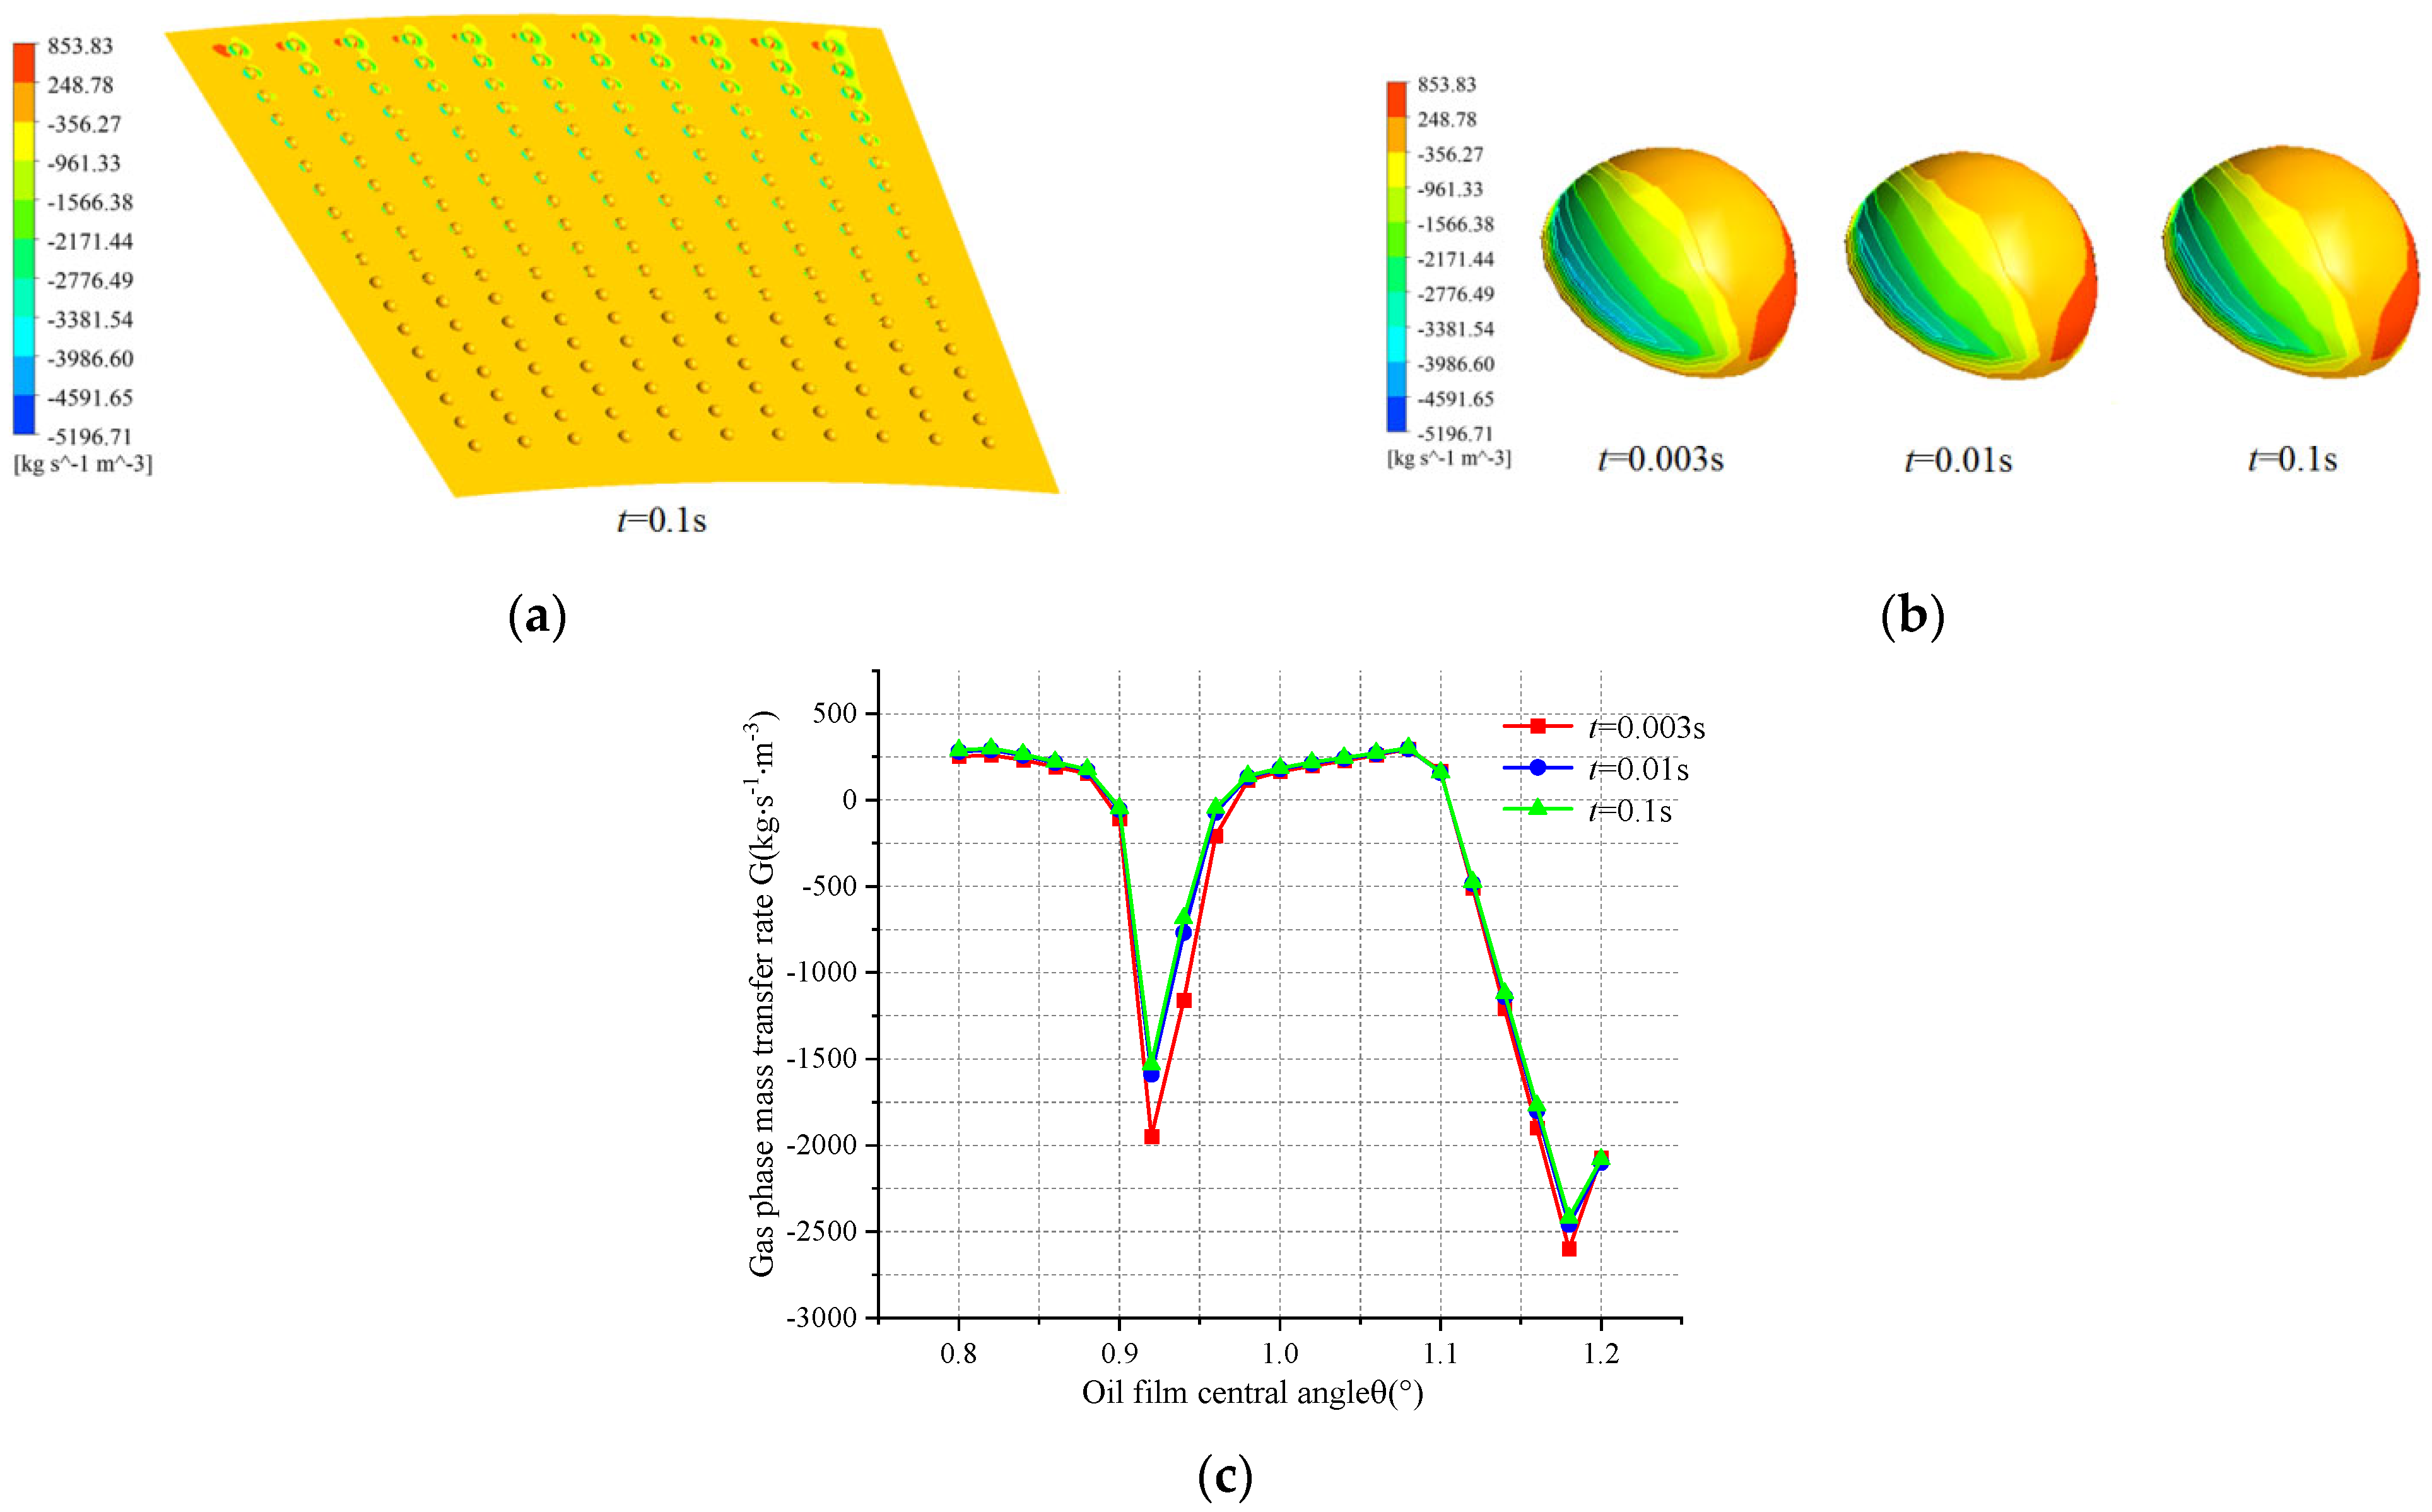
Based on previous analysis, cavitation occurs when pressure within texture dimples falls below the saturated vapor pressure, and cavitation bubbles collapse when pressure rises. Since all three texture types exhibit similar cavitation effects and pressure distribution trends, the hemispherical texture is taken as an example to analyze gas–liquid mass transfer during cavitation. Figure 22a shows the instantaneous gas-phase mass transfer rate distribution on the hemispherical-textured oil film surface at t = 0.1 s (when cavitation volume fraction stabilizes), where negative values indicate gas generation and positive values represent gas disappearance. Significant mass transfer is observed in cavitation zones. Cross-referencing this with Figure 8e and Figure 21a, cavitation is shown to occur only in the outer diameter region (30.5 mm < r< 32 mm) with a zero cavitation volume fraction in 27 mm < r< 30.5 mm. Nevertheless, small negative mass transfer rates appear at 28.75 mm < r< 30.5 mm, indicating minor gas generation at the downstream edges of surface asperities near non-textured boundaries.
Figure 22b presents the gas-phase mass transfer rate contours within a hemispherical dimple for “Enlarge region 2”, and Figure 22c shows corresponding rate curves at key time points for cavitation development. Cavitation develops rapidly at t = 0~0.01 s, peaking at t = 0.003 s, with a maximum gas generation rate before gradually declining. By contrast, gas disappearance rates remain relatively constant. This demonstrates that simultaneous gas generation and collapse occur during cavitation development, with smaller peak disappearance rates than generation rates, resulting in the progressive expansion of cavitation zones over time.

3.2. Experimental Results of Friction Pairs

3.2.1. Effect of Surface Texturing on Cavitation

Initial tests were conducted using non-textured smooth friction plates as specimens, with motor speeds adjusted to 350 rpm, 550 rpm, and 1050 rpm via a frequency converter. The flow field patterns are shown in Figure 23a. Throughout the three-stage testing process, with the speed increasing from 350 rpm to 1050 rpm, the oil film remained intact without any evidence of cavitation. As cavitation requires three essential factors-nuclei, low pressure, and sufficient duration-the uniform pressure distribution in non-textured friction pairs ensured that the oil pressure was maintained above the saturated vapor pressure, preventing cavitation.
Figure 23b demonstrates the influence that textured surfaces have on flow fields at identical rotational speeds. At 350 rpm, the oil film remained cavitation-free. When speed increased to 550 rpm, enhanced circumferential velocity induced distinct cavitation, forming two elongated arc-shaped bubble zones due to the combination of wall adhesion and shear effects. A further increase in speed to 1050 rpm expanded bubble dimensions and quantity compared to 550 rpm speed, with cavitation zones enlarging at outer diameters and radially shifting inwards.

3.2.2. Analysis of Oil Film Shear Cavitation Process

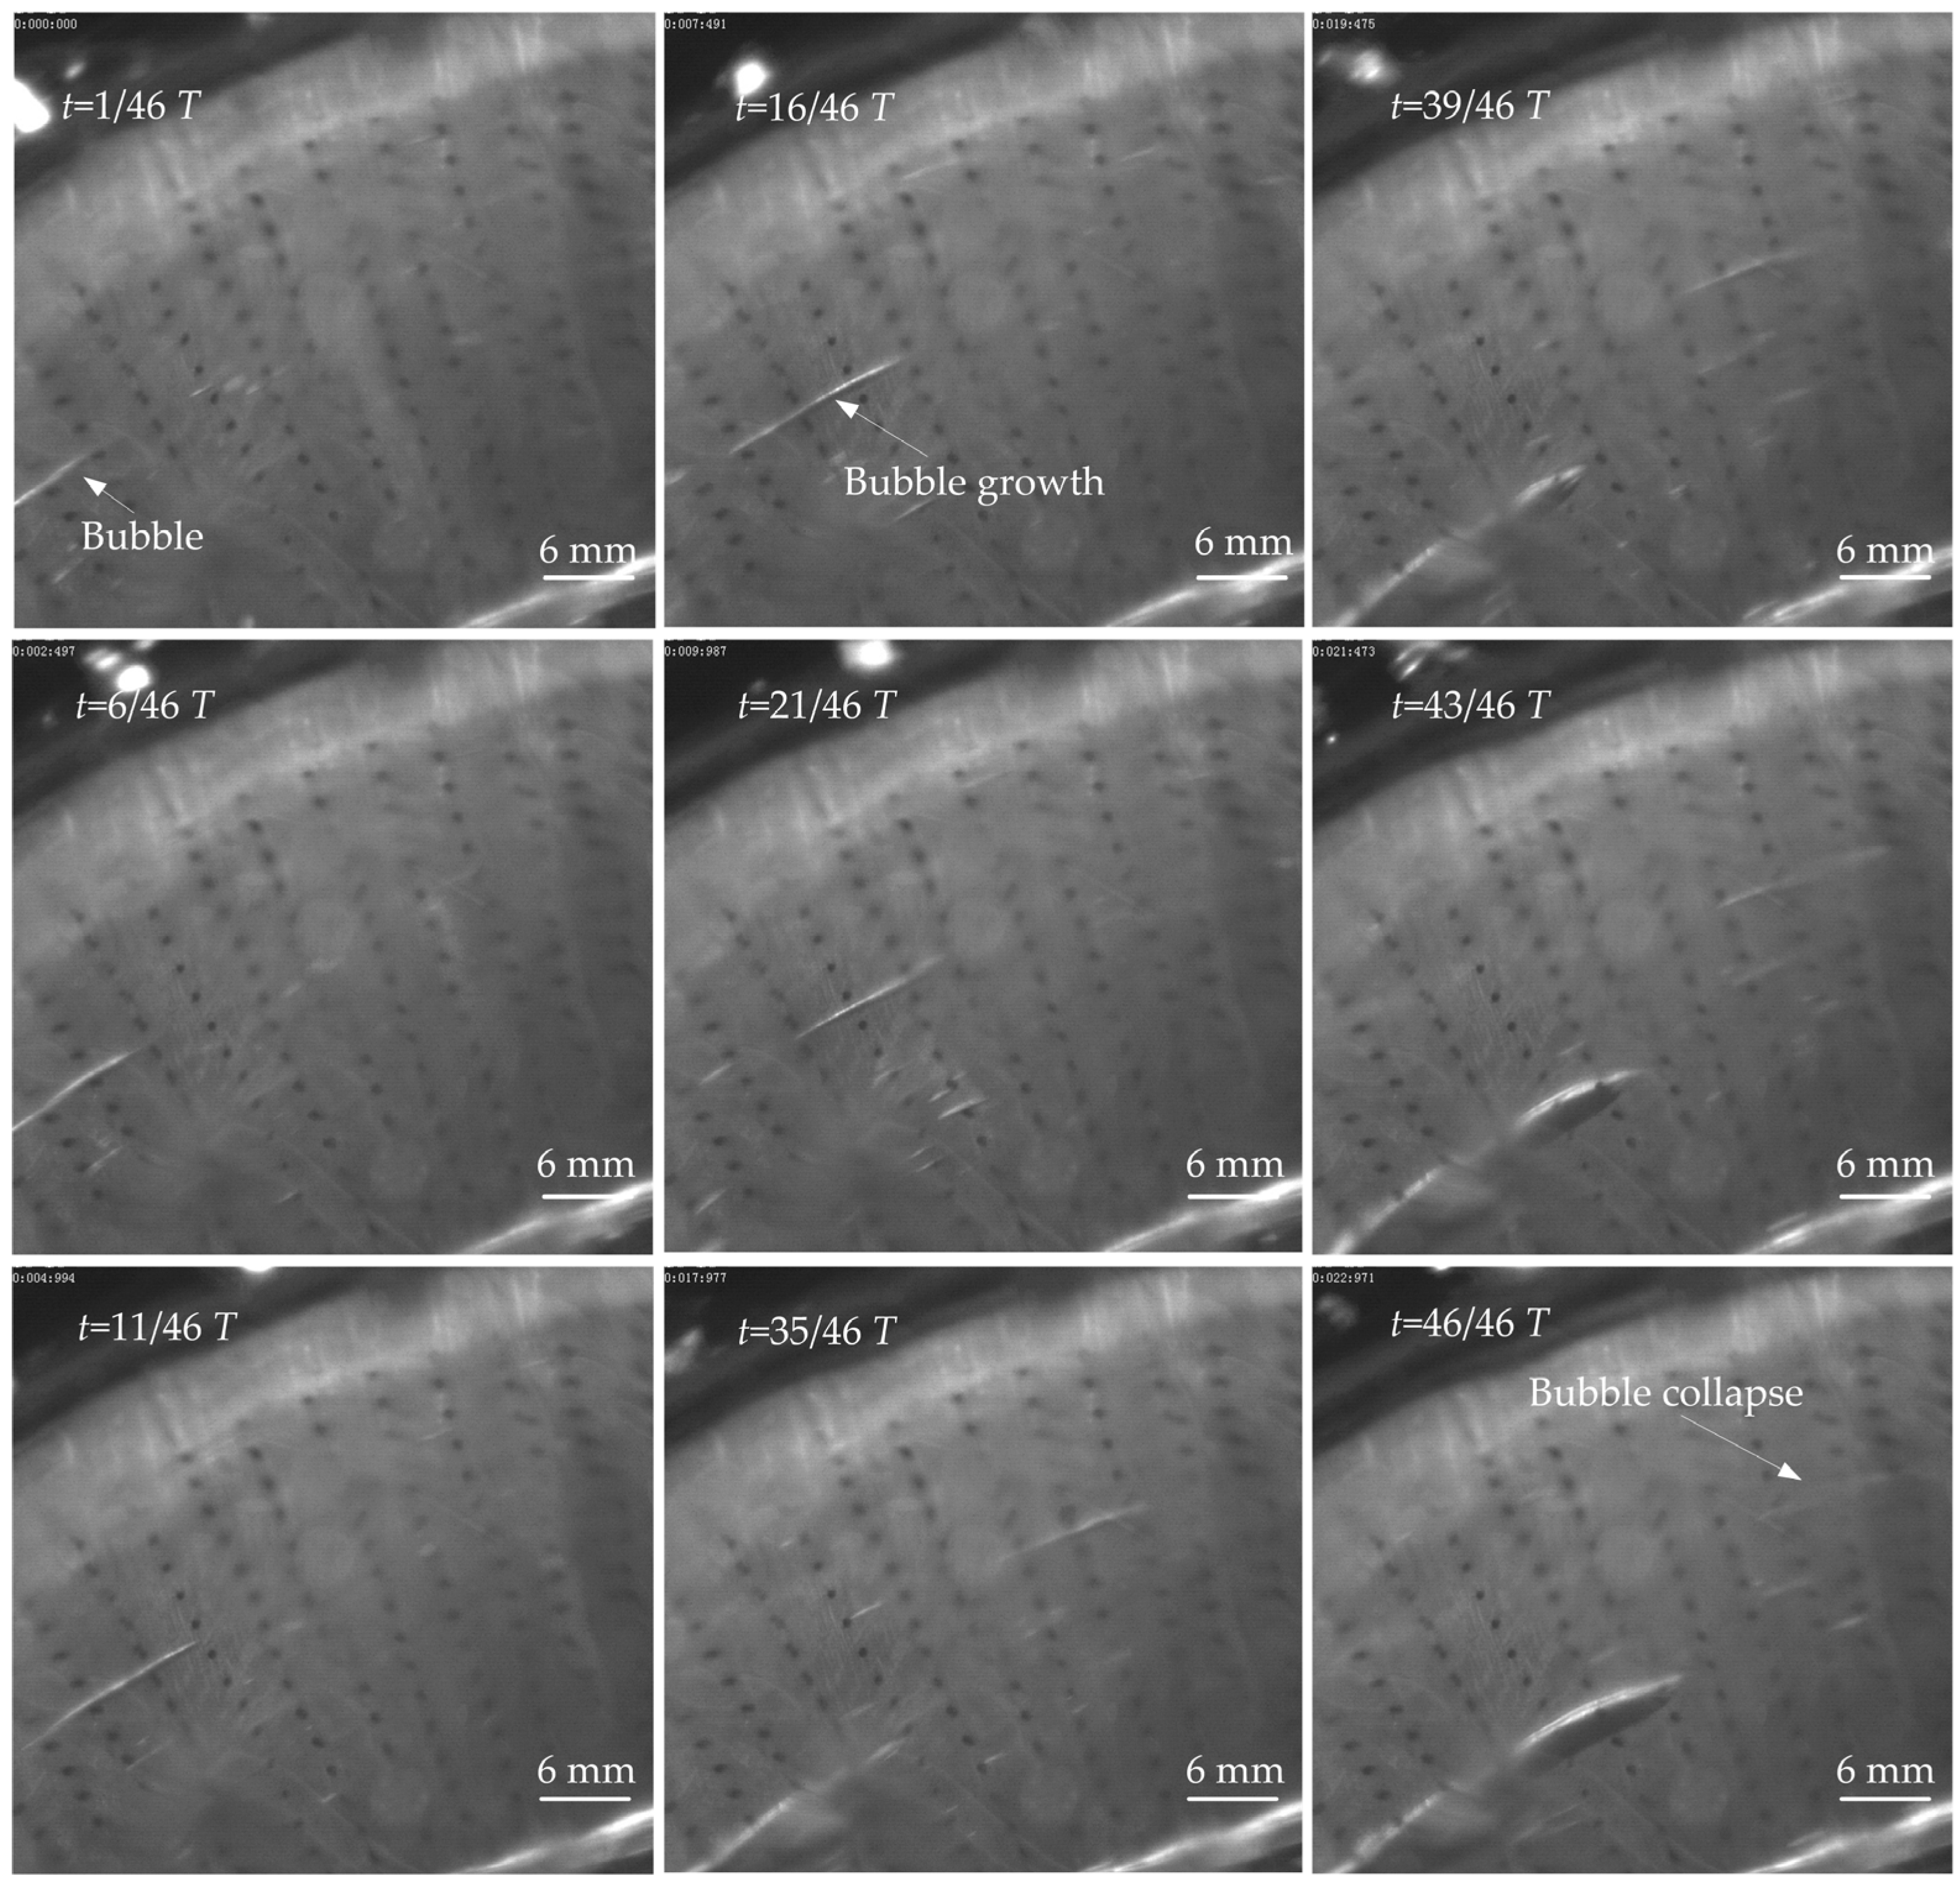
The experimental results from the previous section indicate that noticeable cavitation occurs at 550 rpm. Using high-speed photography, 3218 images were captured. A complete cycle, T, includes bubble nucleation, growth, and collapse to regeneration. A total of 46 images were recorded for each cycle, and cavitation evolution patterns are shown in Figure 24.
Figure 24 demonstrates that at t = 1/46 T, sheet cavitation occurs, with distinct elongated arc-shaped boundaries attached to the friction surface. During t = 1/46 T ~35/46 T, bubbles move clockwise with the oil flow toward the outer diameter and gradually expand in length. The maximum spanwise width (perpendicular to the flow direction and parallel to the surface) occurs at t = 35/46 T. At t = 39/46 T, the bubble’s leading edge collapses first due to the compression of the negative pressure gradient, transforming cavitation from the sheet to cloud type at the front while sheet cavitation is maintained at the rear. The transition from sheet to cloud cavitation progresses from the front to the rear during t = 39/46 T ~43/46 T, with boundaries becoming blurred until completion at t = 46/46 T. The collapse process, occupying 7/46 of the cycles, appears prolonged, likely due to the viscosity of the hydraulic oil.
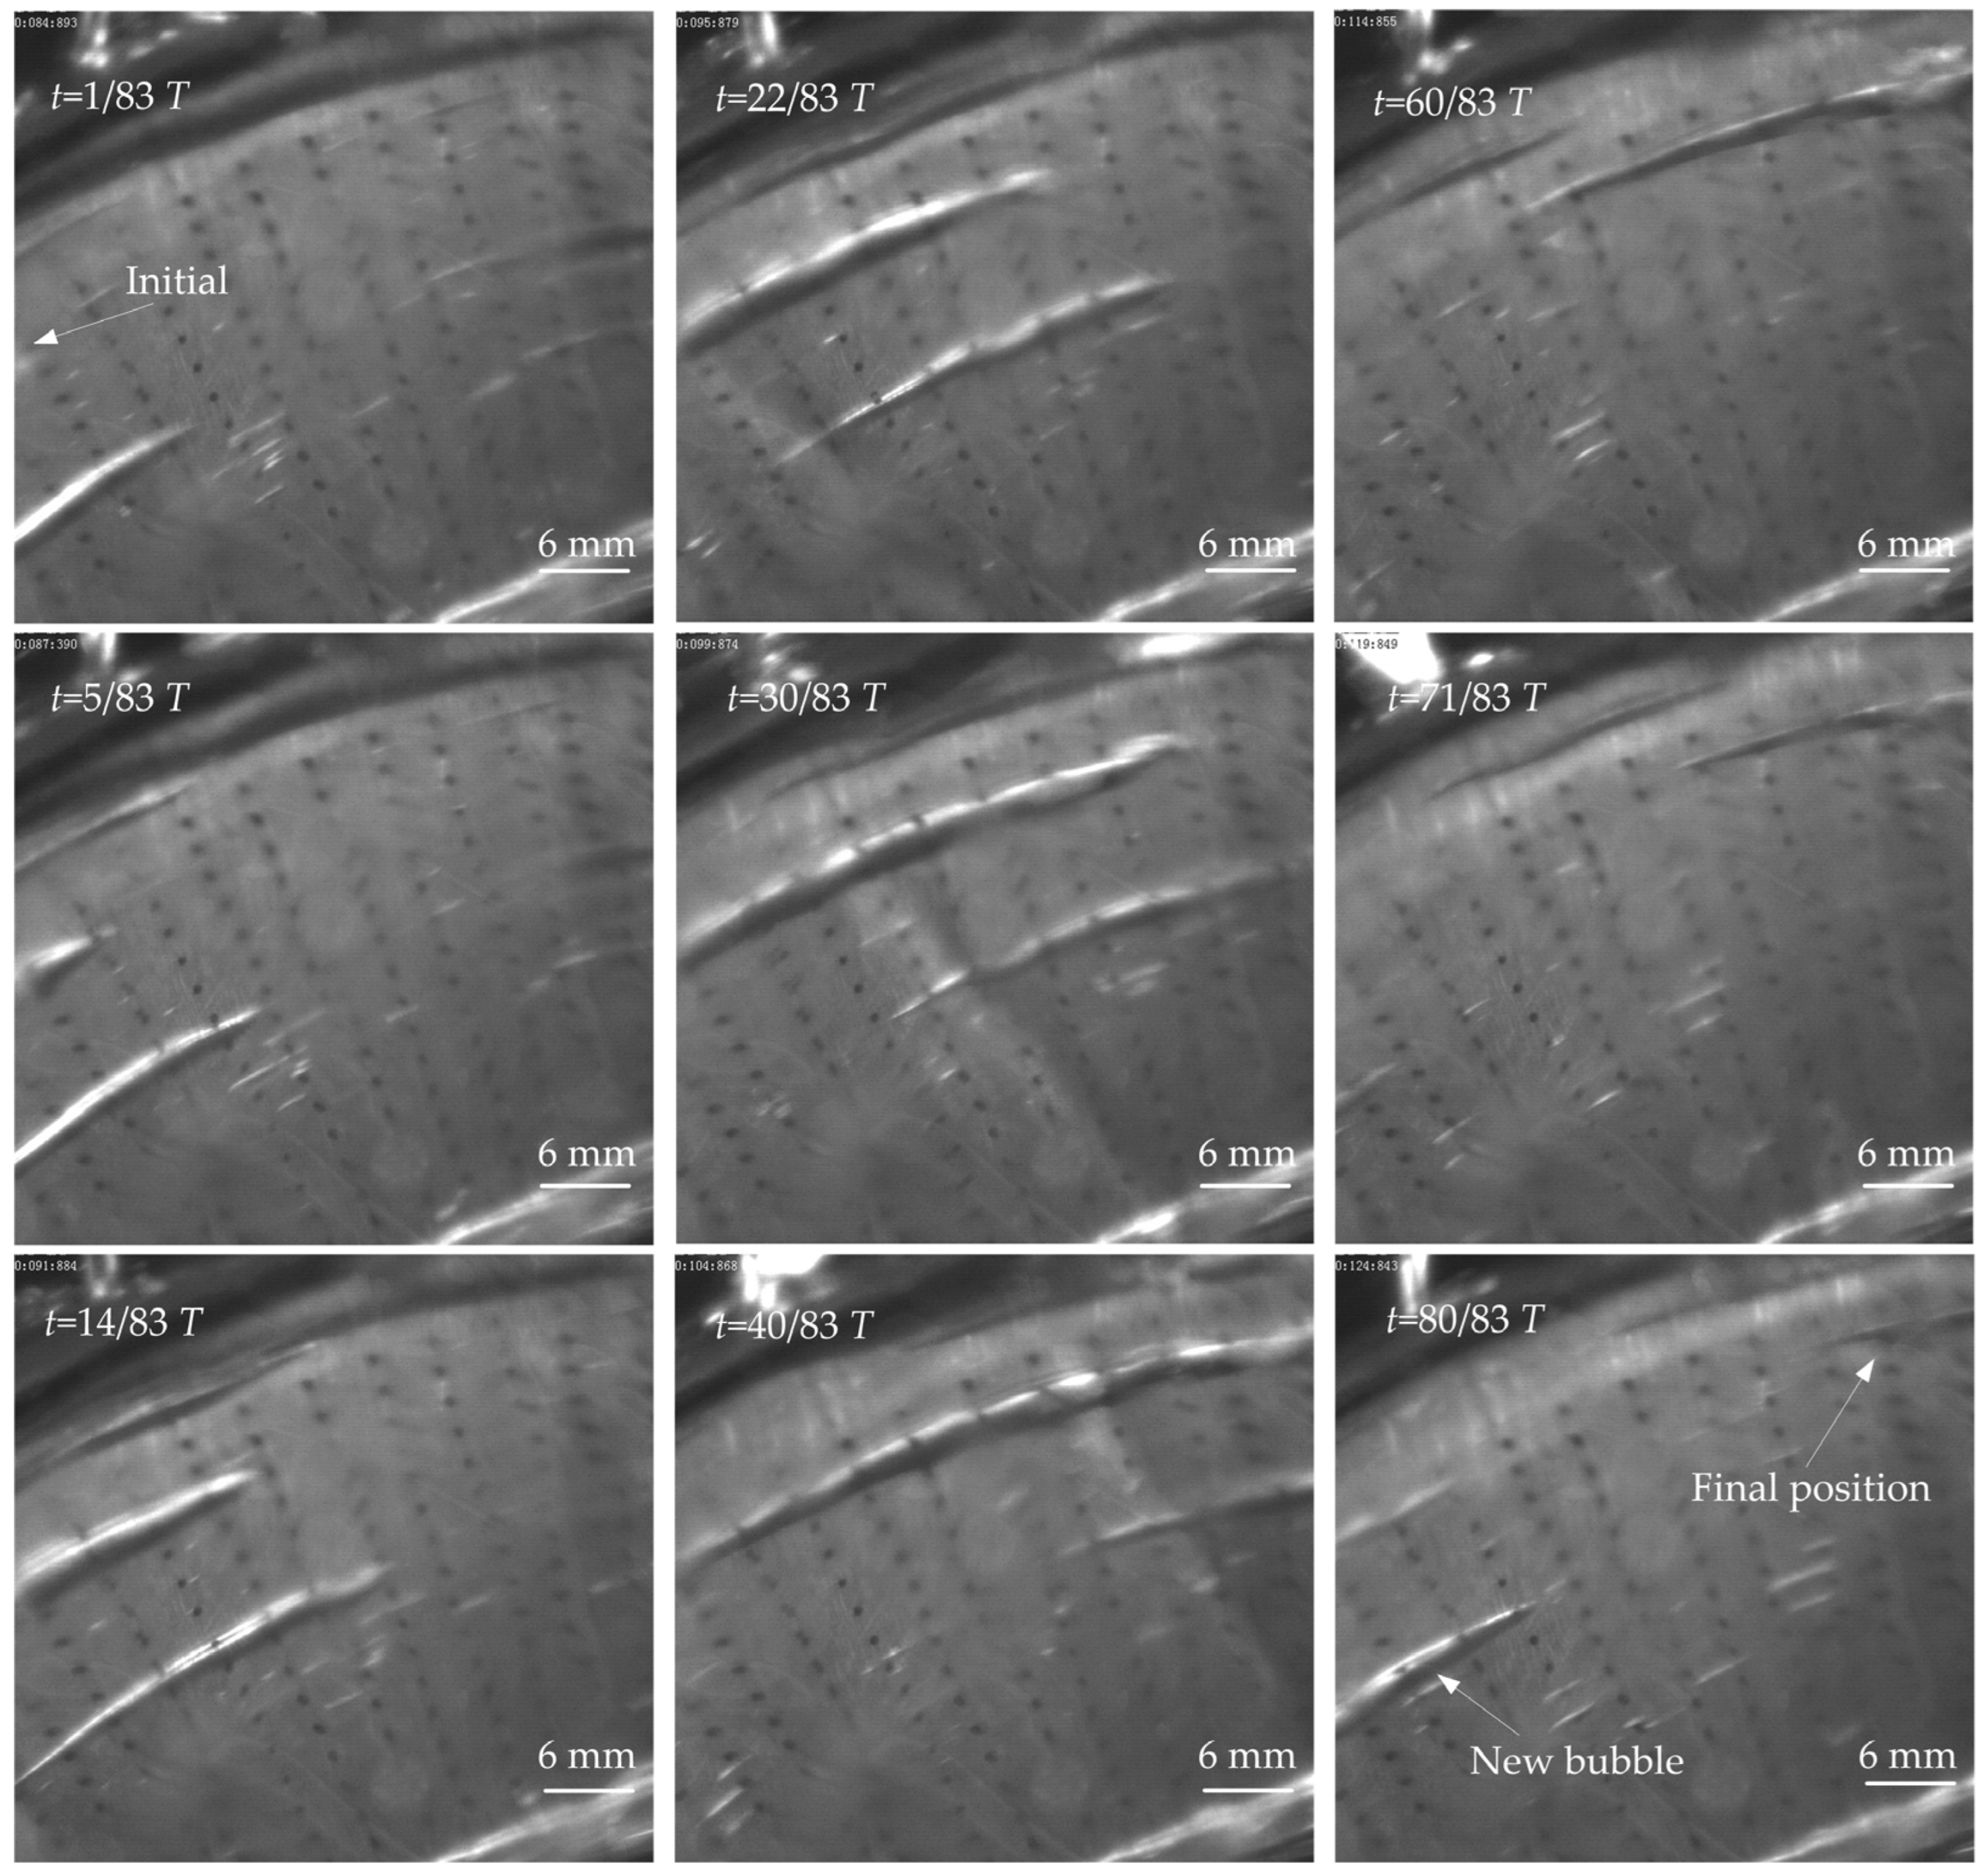
At 550 rpm, another large cavitation bubble was identified in 83 images (Figure 25), showing different behaviors. It survived the entire observation window without completely collapsing. The bubble reached maximum spanwise width before shrinking and exiting from view. It initially appeared at t = 1/83 T, and developed into supercavitation (with length-matching characteristic surface dimensions) by t = 30/83 T. It peaked in size at t = 40/83 T when its front disintegrated into micro-bubbles. From t = 40/83 T~71/83 T, it then migrated toward the outer diameter with continuous shedding, followed by the emergence of a new bubble at t = 80/83 T. Compared to Figure 24, larger bubbles exhibit a longer lifespan and higher collapse resistance.
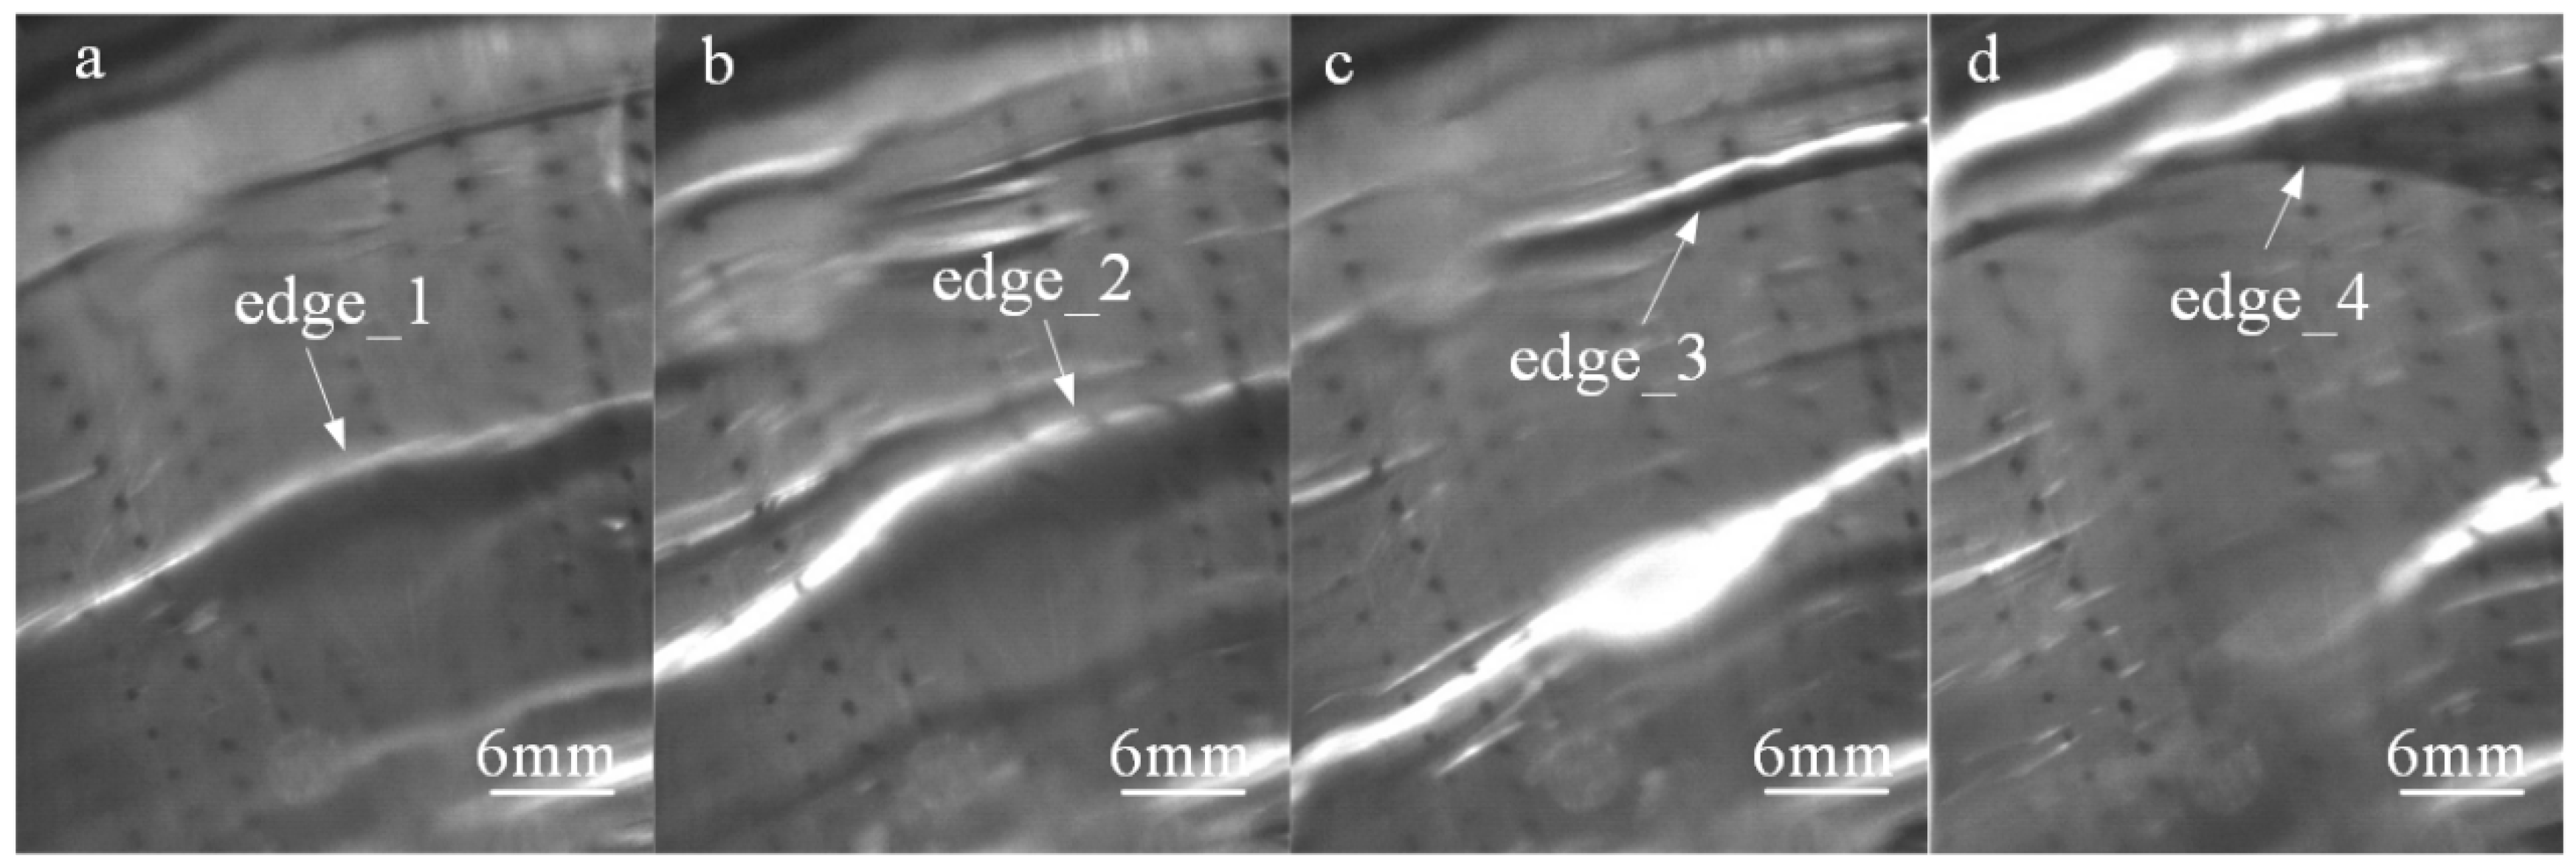
At 1050 rpm, intensified cavitation follows similar lifecycle patterns (which are not repeated here). Figure 26 reveals how periodic oil film contractions propagate outward in line with bubble nucleation/growth. Notably, collapse triggers new contraction cycles. Notably, a gas–liquid two-phase flow region forms at the outer diameter, which is characterized by alternating cavitation development and oil film reformation dynamics that maintain the self-sustaining cavitation process. The interaction between the film contraction and bubble dynamics demonstrates how surface textures modulate both spatial and temporal characteristics of shear-induced cavitation.

3.2.3. Comparison Between Simulation and Experiment

Since achieving a precise morphological match for complex cavitation patterns between simulation and experiment is challenging—with simulation better suited to capturing overall trends and affected regions—we will focus on a quantitative validation of drag torque. Cavitation not only alters the flow field but also significantly impacts the clutch’s drag torque and its stability. Therefore, a quantitative comparison of torque is a critical step in validating the model’s accuracy. We will introduce a new table (presented below as Table 2) to quantitatively compare the drag torque calculated from the simulation with the values measured in the experiments.
Our preliminary data show that under the 6000 rpm operating condition, the relative error between the simulation predictions and experimental measurements is consistently within 10%. For CFD simulations involving complex multiphase flow and turbulence models, this margin of error is considered highly acceptable and affirms the model’s accuracy in predicting macroscopic mechanical performance. Furthermore, the severity of cavitation is directly correlated with torque stability. We will also compare the amplitude of torque fluctuations (or standard deviation) from the simulation with those measured experimentally. The results will demonstrate that the hemispherical texture (which induces the most severe cavitation) corresponds to the largest torque fluctuations, whereas the untextured or cavitation-confining textures result in a more stable torque. This proves that our model can not only predict mean values but also effectively capture the system instability induced by cavitation.

3.2.4. Torque Transmission Tests Under Different Texture Ratios

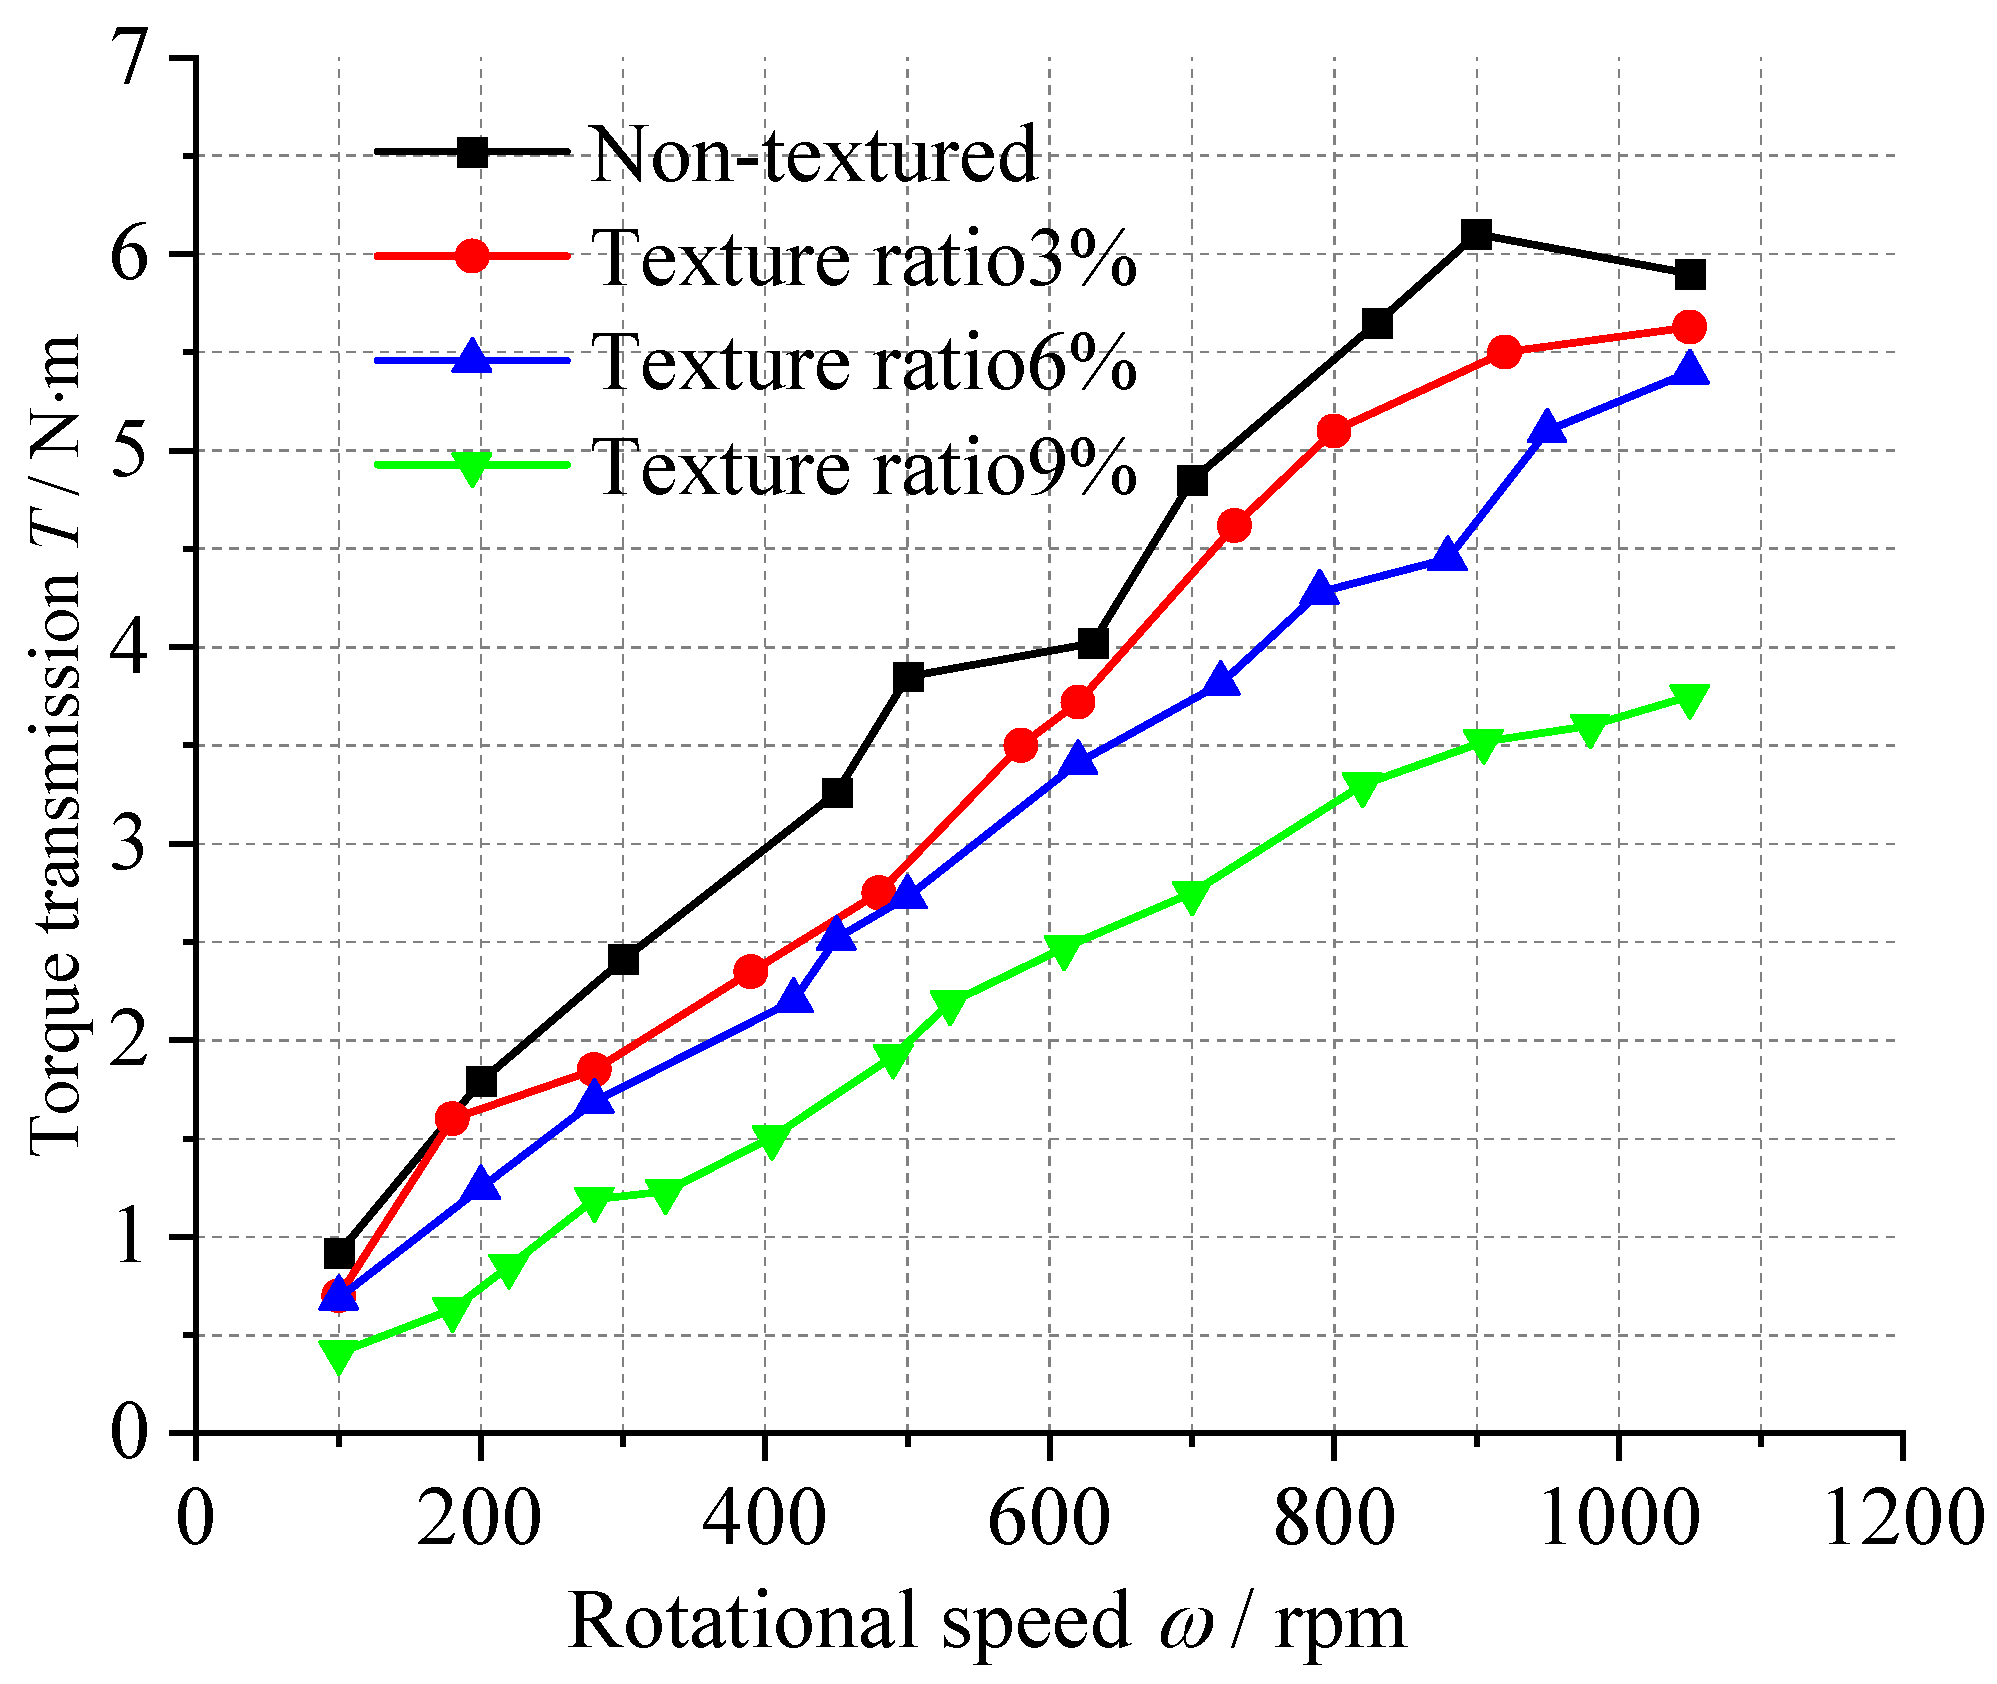
Figure 27 presents experimental torque transmission values under various texture ratios, showing that non-textured surfaces yield the highest torque, while increasing texture ratios lead to a reduction in torque. The torque increases with rotational speed, which is consistent with theoretical predictions. Flow pattern analysis reveals that higher texture ratios intensify cavitation, causing the oil film to contract at the outer diameter, which compromises film integrity and consequently reduces torque transmission.

3.2.5. Torque Transmission Tests Under Different Texture Depths

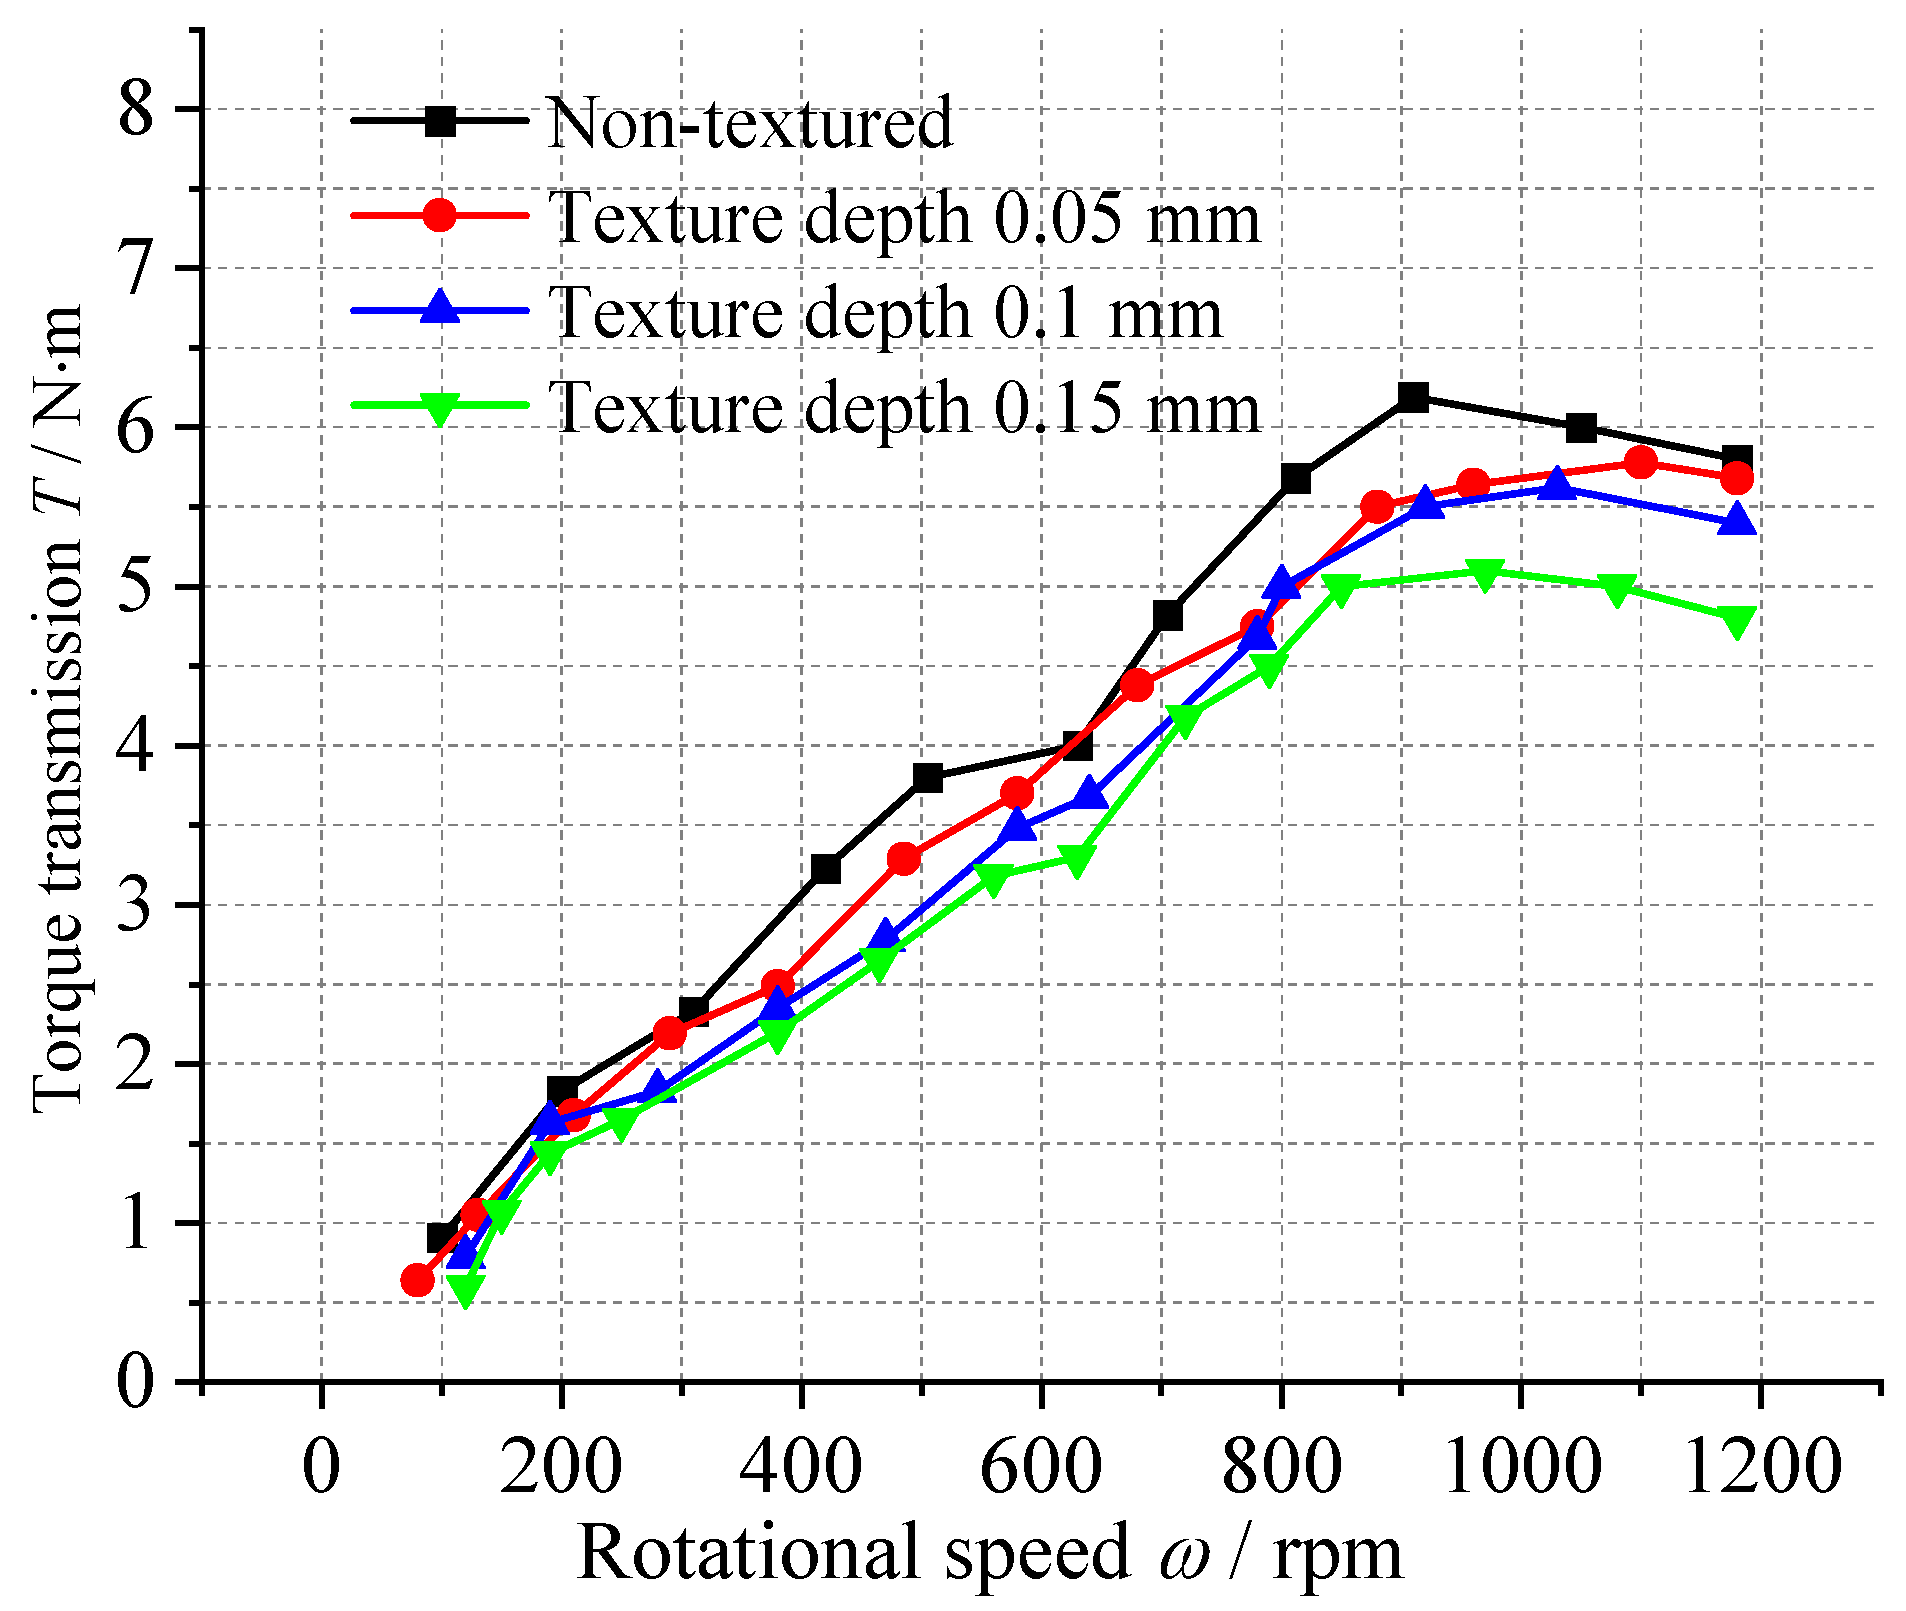
Figure 28 demonstrates the influence of the texture depth on torque transmission, showing a slight decrease in transmitted torque with increasing texture depth. While the experimental results generally align with simulation analysis, discrepancies exist regarding the specific trend. Simulations predicted an initial increase in torque followed by a decrease at greater depths, whereas our tests showed a consistent reduction in torque. This variance likely stems from idealized simulation conditions versus real-world test factors, including machining tolerances, assembly precision, and measurement errors in the experimental setup.

4. Conclusions

This study demonstrates that the morphology and distribution parameters of surface textures, as well as the operational conditions, systematically influence oil film cavitation behavior in wet clutch friction pairs. The main conclusions are as follows:
(1)
Texture morphology is the dominant factor in determining cavitation intensity. Under an identical texture ratio of 6.41%, different morphologies exhibited significant differences in cavitation performance: the hemispherical texture resulted in the highest cavitation volume fraction (0.020215), while the hexahedral texture yielded the lowest (0.0015197)—a difference of more than an order of magnitude. Hexahedral textures demonstrated the most effective flow field stability and cavitation suppression capabilities.
(2)
An optimal design range exists for texture parameters. The effect of the texture ratio on cavitation is nonlinear, with cavitation intensity peaking at a ratio of approximately 6.41%. As the texture ratio increases to 12.917%, cavitation is mitigated due to the homogenization of flow field disturbances. Furthermore, increasing texture depth effectively reduces fluid shear stress within the dimples, thereby significantly suppressing cavitation development.
(3)
Among the operational parameters, rotational speed has the most significant impact on cavitation. At a high speed of 6000 rpm, the cavitation volume fraction increases substantially. Conversely, increasing the inlet pressure effectively suppresses cavitation by enhancing radial flow. A greater oil film thickness exacerbates cavitation, while variations in oil temperature primarily affect the time required for cavitation to stabilize.
(4)
The study proposes a design criterion based on a multi-objective balance. To achieve an optimal equilibrium between hydrodynamic pressure effects and cavitation suppression, employing a high texture ratio (exceeding 45%) with either hexahedral or cylindrical textures is recommended. This approach can reduce the pressure drop in the low-pressure zone by more than 30%, providing a crucial theoretical basis and engineering guidance for the development of high-reliability wet clutch surface textures.

Author Contributions

Conceptualization, methodology, software, writing—original draft preparation, H.Q. and H.C.; validation, H.C. and F.S.; writing—review and editing, S.W. All authors have read and agreed to the published version of the manuscript.

Funding

This work was financially supported by the Development and Application of High-Horsepower, High-Efficiency, and Intelligent Tractor Platforms [grant number 2021YFD2000300].

Data Availability Statement

The original contributions presented in this study are included in the article. Further inquiries can be directed to the corresponding author.

Conflicts of Interest

The authors declare that they have no known competing financial interests or personal relationships that could have appeared to influence the work reported in this paper.

References

  1. Bao, H.; Xu, T.; Jin, G.; Huang, W. Analysis of Dynamic Engaged Characteristics of Wet Clutch in Variable Speed Transmission of a Helicopter. Processes 2020, 8, 1474. [Google Scholar] [CrossRef]
  2. Zhao, J.; Xiao, M.H.; Bartos, P.; Bohata, A. Dynamic engagement characteristics of wet clutch based on hydro-mechanical continuously variable transmission. J. Cent. South Univ. 2021, 28, 1377–1389. [Google Scholar] [CrossRef]
  3. Brotchie, A.; Grieser, F.; Ashokkumar, M. Characterization of acoustic cavitation bubbles in different sound fields. J. Phys. Chem. B 2010, 114, 11010–11016. [Google Scholar] [CrossRef] [PubMed]
  4. Sun, X.; Jia, X.; Liu, J.; Wang, G.; Zhao, S.; Ji, L.; Yoon, J.Y.; Chen, S. Investigation on the characteristics of an advanced rotational hydrodynamic cavitation reactor for water treatment-ScienceDirect. Sep. Purif. Technol. 2020, 251, 117252. [Google Scholar] [CrossRef]
  5. Yusvika, M.; Prabowo, A.R.; Baek, S.J.; Tjahjana, D.D.D.P. Achievements in Observation and Prediction of Cavitation: Effect and Damage on the Ship Propellers. Procedia Struct. Integr. 2020, 27, 109–116. [Google Scholar] [CrossRef]
  6. Abreu, M.; Sundberg, J.; Elfsberg, J.; Jonsson, S. Morphology and mechanisms of cavitation damage on lamellar gray iron surfaces. Wear 2020, 456–457, 203324. [Google Scholar] [CrossRef]
  7. Mizuki, K.; Ryo, T.; Shinya, S. A Study on In-situ Observation of the Micro Flow of Lubricant on the Textured Surface. Procedia Eng. 2013, 68, 12–18. [Google Scholar] [CrossRef]
  8. Ibatan, T.; Uddin, M.S.; Chowdhury, M.A.K. Recent development on surface texturing in enhancing tribological performance of bearing sliders. Surf. Coat. Technol. 2015, 272, 102–120. [Google Scholar] [CrossRef]
  9. Mo, F.; Shen, C.; Zhou, J.; Khonsari, M.M. Statistical Analysis of Surface Texture Performance with Provisions with Uncertainty in Texture Dimensions. IEEE Access 2017, 5, 5388–5398. [Google Scholar] [CrossRef]
  10. Wos, S.; Koszela, W.; Pawlus, P.; Drabik, J.; Rogos, E. Effects of surface texturing and kind of lubricant on the coefficient of friction at ambient and elevated temperatures. Tribol. Int. 2018, 117, 174–179. [Google Scholar] [CrossRef]
  11. Liu, W.; Ni, H.; Wang, P.; Chen, H. Investigation on the Tribological Performance of Micro-dimples Textured Surface Combined with Longitudinal or Transverse Vibration under Hydrodynamic Lubrication. Int. J. Mech. Sci. 2020, 174, 105474. [Google Scholar] [CrossRef]
  12. Cui, J.; Tang, H. A review on flow instability in hydro-viscous drive. Phys. Fluids 2024, 36, 041301. [Google Scholar] [CrossRef]
  13. Sun, J.; Chen, L.; Zhang, B.; Huang, H.; Qian, P. Cavitation Morphology Study between Hemispherical Textured Rotating Friction Pairs. Lubricants 2022, 10, 249. [Google Scholar] [CrossRef]
  14. Meng, Y.; Xu, J.; Ma, L.; Jin, Z.; Prakash, B.; Ma, T.; Wang, W. A review of advances in tribology in 2020–2021. Friction 2022, 10, 1443–1595. [Google Scholar] [CrossRef] [PubMed Central]
  15. Sun, J.; Chen, L.; Huang, H.; Zhang, B.; Qian, P. Comprehensive Investigations on Fluid Flow and Cavitation Characteristics in Rotating Disk System. Appl. Sci. 2022, 12, 12303. [Google Scholar] [CrossRef]
  16. Pan, S.; Peng, X. Cavitation Mechanisms; National Defense Industry Press: Arlington, VA, USA, 2013. [Google Scholar]
  17. Jia, C. Numerical Analysis of Flow Field Around a Body of Revolution; Northwestern Polytechnical University: Xi’an, China, 2002. [Google Scholar]
  18. Cao, Z. Research on Wear State Assessment and Life Prediction of Compound Planetary Gearbox Based on Multi-Source Information Fusion; Xi’an Technological University: Xi’an, China, 2024. [Google Scholar] [CrossRef]
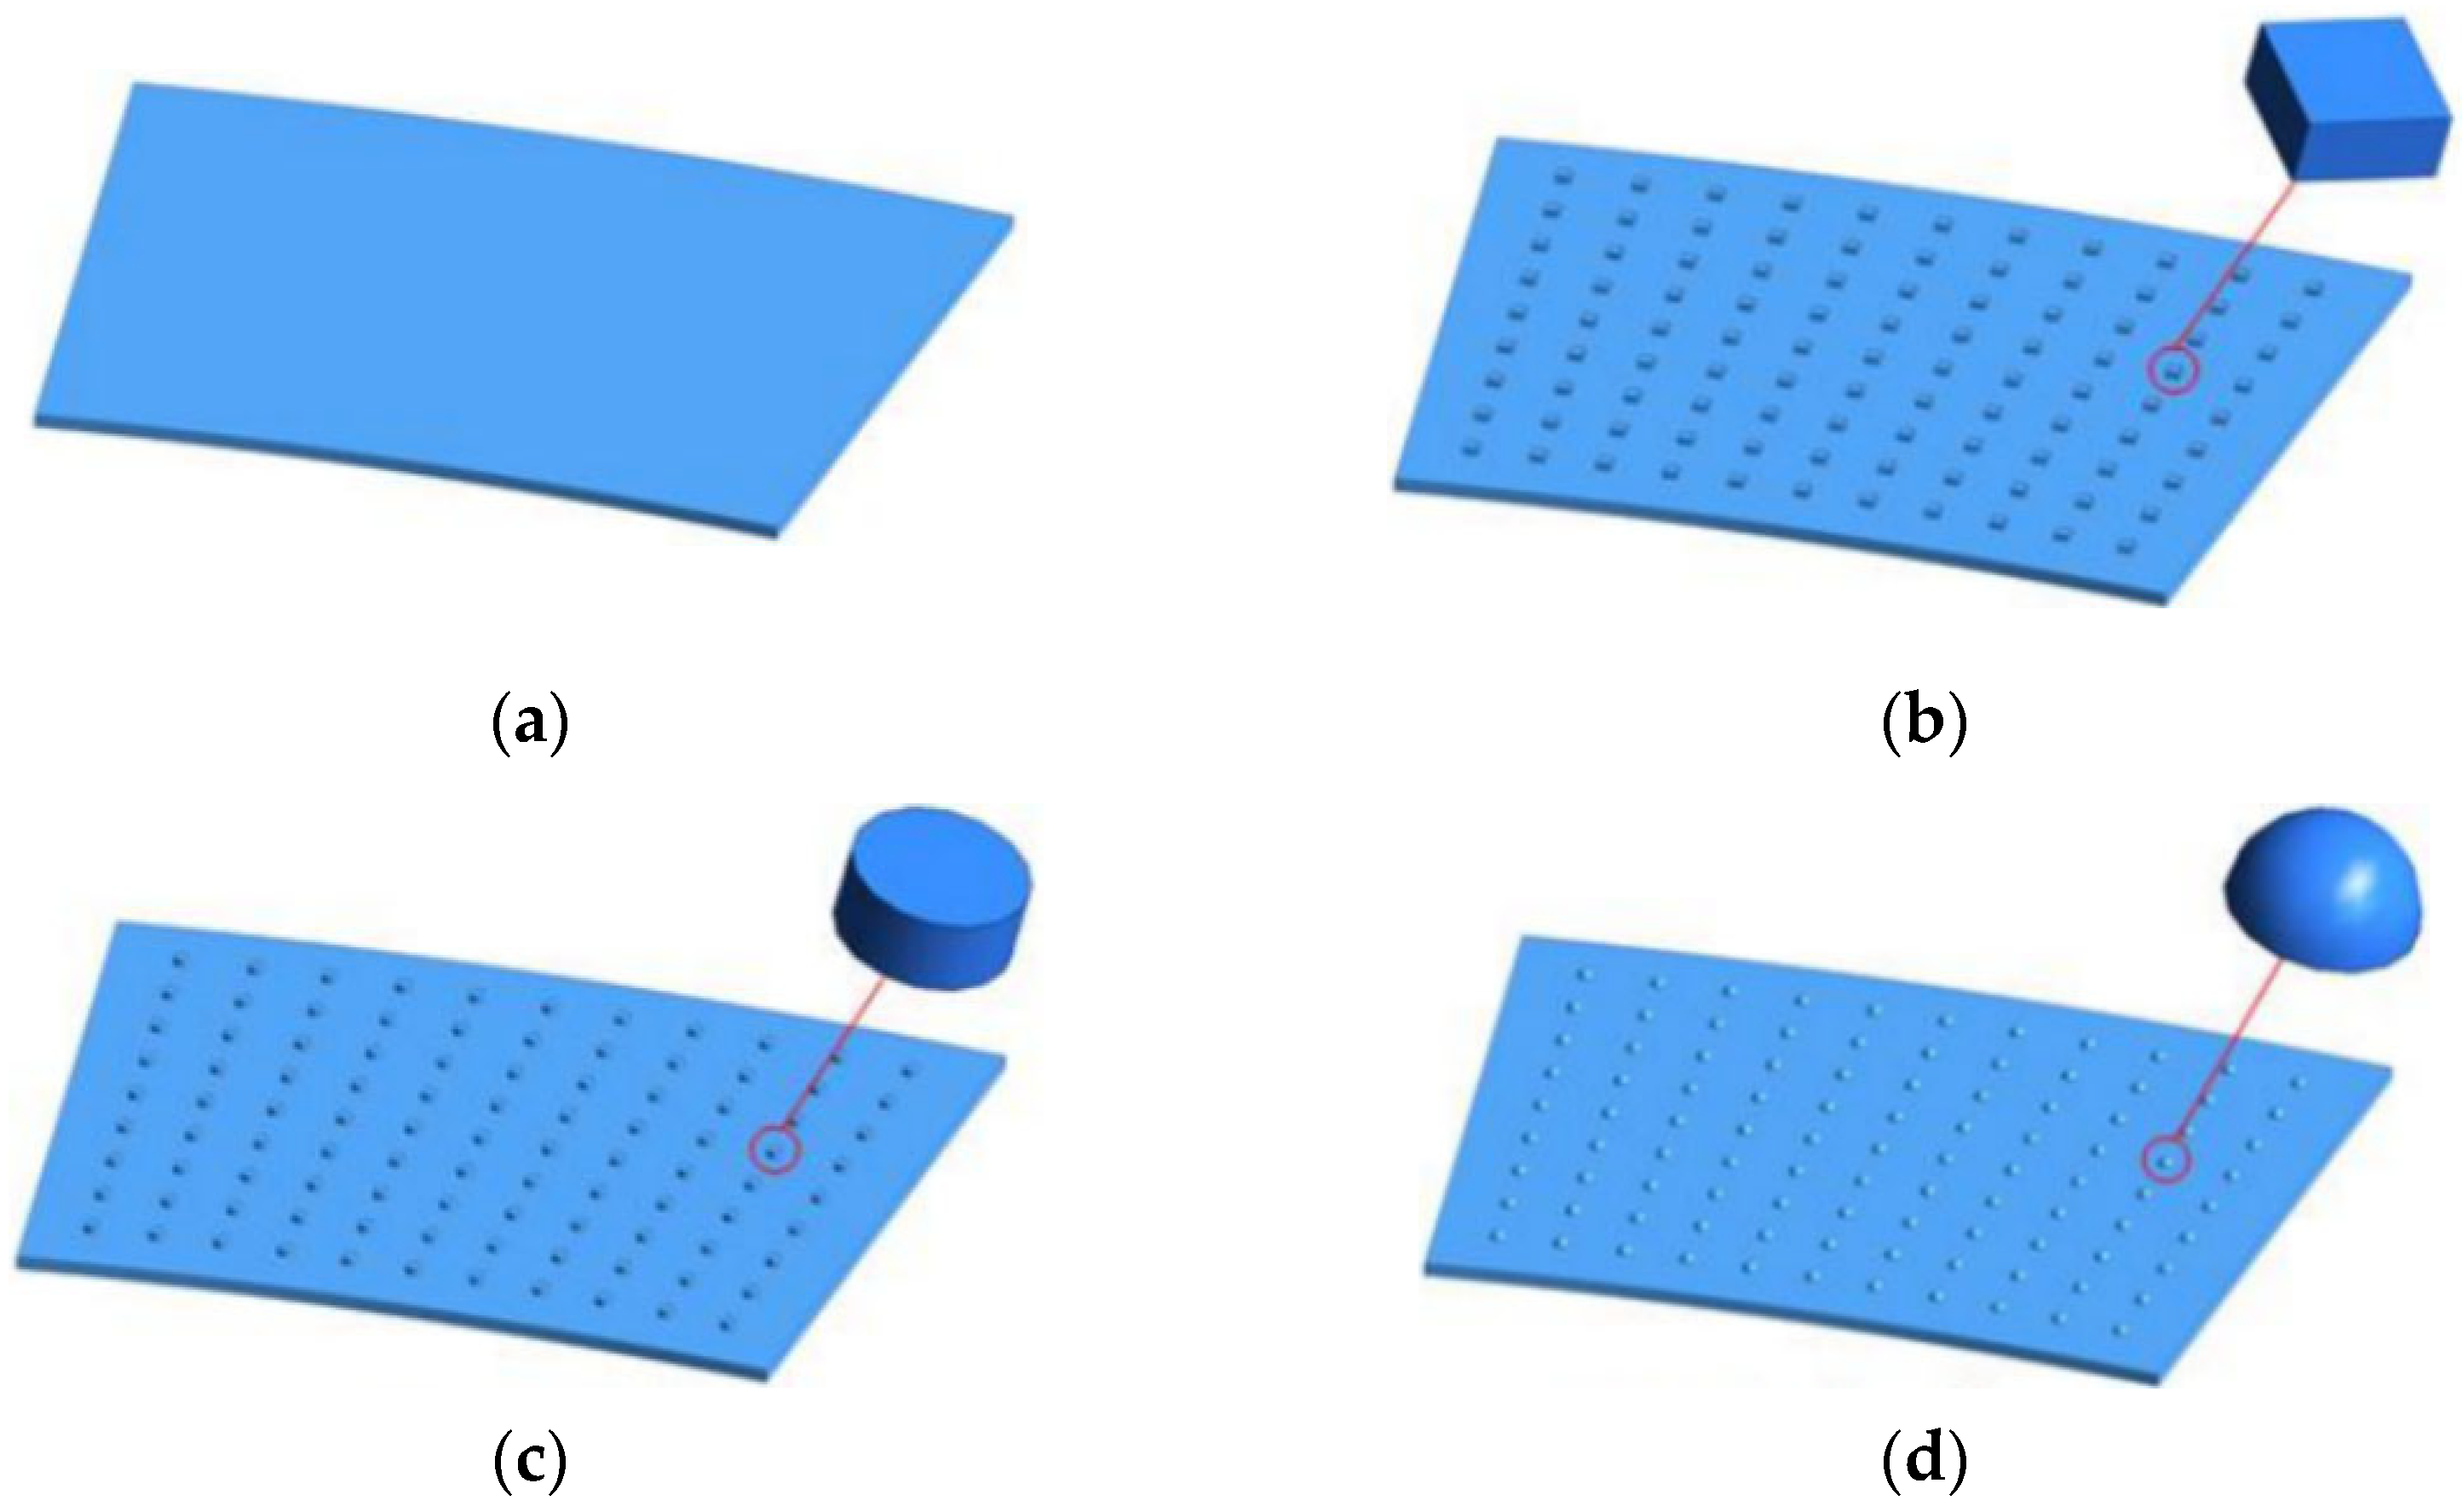
Figure 1. Schematic diagram of friction pair structure. (a) Non-textured structure; (b) hexahedral texture; (c) cylindrical texture; (d) hemispherical texture. All three types of textures are indicated and labeled with red circles in the figure.
Lubricants 13 00513 g001
Figure 2. Schematic diagram of transmission mechanism. (a) Circumferential flow; (b) radial velocity distribution of lubricant; (c) oil film contraction.
Lubricants 13 00513 g002
Figure 3. Construction of finite element simulation model. (a) Oil films with various texture types; (b) oil film boundary conditions; (c) structural mesh generation of oil film.
Lubricants 13 00513 g003
Figure 4. Oil film models with various texture types and texture ratios. (a) Texture ratios of 3.205%; (b) 6.41%; and (c) 12.917%.
Lubricants 13 00513 g004
Figure 5. Experimental study of friction pairs. (a) Schematic diagram of visualization test rig; (b) visualization experimental platform; (c) data acquisition system; (d) textured friction disc. 1. Frequency Converter; 2. Motor; 3. Main Unit; 4. Filter; 5. Gear Pump; 6. Liquid Level Gauge; 7. Check Valve; 8. Flow Meter; 9. Pressure Gauge; 10. Flow Control Valve; 11. Relief Valve; 12. Shut-off Valve; 13. Filter; 14. Double Helical Pump; 15. Supplementary Light; 16. Locking Device; 17. Torque Sensor; 18. Camera; 19. Computer.
Lubricants 13 00513 g005
Figure 6. Oil Film Cavitation Volume Fraction. (a) Texture ratios of 3.205%; (b) texture ratios of 6.41%; (c) texture ratios of 12.917%.
Lubricants 13 00513 g006
Figure 7. A texture ratio of 3.205%. (a) Stable-state shear cavitation in hexahedral-textured oil film; (b) morphological evolution of shear cavitation in hexahedral-textured oil film; (c) stable-state shear cavitation in cylindrical-textured oil film; (d) morphological evolution of shear cavitation in cylindrical-textured oil film; (e) stable-state shear cavitation in hemispherical-textured oil film; (f) morphological evolution of shear cavitation in hemispherical-textured oil film.
Lubricants 13 00513 g007aLubricants 13 00513 g007b
Figure 8. A texture ratio of 6.41%. (a) Stable-state shear cavitation in hexahedral-textured oil film; (b) morphological evolution of shear cavitation in hexahedral-textured oil film; (c) stable-state shear cavitation in cylindrical-textured oil film; (d) morphological evolution of shear cavitation in cylindrical-textured oil film; (e) stable-state shear cavitation in hemispherical-textured oil film; (f) morphological evolution of shear cavitation in hemispherical-textured oil film.
Lubricants 13 00513 g008
Figure 9. A texture ratio of 12.917%. (a) Stable-state shear cavitation in hexahedral-textured oil film; (b) morphological evolution of shear cavitation in hexahedral-textured oil film; (c) stable-state shear cavitation in cylindrical-textured oil film; (d) morphological evolution of shear cavitation in cylindrical-textured oil film; (e) stable-state shear cavitation in hemispherical-textured oil film; (f) morphological evolution of shear cavitation in hemispherical-textured oil film.
Lubricants 13 00513 g009
Figure 10. Temporal evolution of oil film shear’s cavitation morphology. (a) Texture ratios of 3.205%; (b) 6.41%; and (c) 12.917%.
Lubricants 13 00513 g010aLubricants 13 00513 g010b
Figure 11. Oil velocity vector diagram of the hexahedral-textured oil film with a texture rate of 6.41%.
Lubricants 13 00513 g011
Figure 12. Vector diagram of the local oil flow velocity in oil films with various texture types.
Lubricants 13 00513 g012
Figure 13. Velocity vector diagram of the oil flow overlaid by the contours of the oil volume fraction in an oil film on a h = 0.12 mm plane in pits of various textures.
Lubricants 13 00513 g013
Figure 14. Velocity vector diagram of cavitation gas in hexahedral-textured oil film with texture rate of 6.41%.
Lubricants 13 00513 g014
Figure 15. Velocity vectors of cavitation gas in the local oil film for various texture types.
Lubricants 13 00513 g015
Figure 16. Velocity vector diagram of cavitation gas overlaid by the contours of the oil volume fraction for oil film on a h = 0.12 mm plane in pits of various textures.
Lubricants 13 00513 g016
Figure 17. Streamline plot. (a) Streamline diagrams of oil flow velocity for vertical cross-sections within surface asperities of various textured oil films; (b) streamline diagrams of cavitation gas flow velocity for vertical cross-sections within surface asperities of various textured oil films.
Lubricants 13 00513 g017
Figure 18. Pressure contour of oil film with various texture types. (a) Non-textured oil film; (b) hexahedral-textured oil film; (c) cylindrical-textured oil film; (d) hemispherical-textured oil film.
Lubricants 13 00513 g018
Figure 19. Radial and circumferential pressure distribution plots. (a) Radial pressure distribution of oil films with various texture types; (b) circumferential pressure distribution of oil films with various texture types.
Lubricants 13 00513 g019
Figure 20. Pressure distribution diagram. (a) Pressure distribution within various textured dimples; (b) temporal pressure evolution in a single hemispherical dimple; (c) circumferential pressure profiles at varying radial positions.
Lubricants 13 00513 g020
Figure 21. Pressure distribution with/without cavitation. (a) Pressure distribution within textured dimples under varying rotational speeds (with cavitation effects); (b) pressure distribution within textured dimples under varying rotational speeds (without cavitation effects).
Lubricants 13 00513 g021
Figure 22. Rate analysis diagram. (a) Instantaneous gas-phase mass transfer rate on oil film upper surface at t = 0.1 s; (b) contour plot of instantaneous gas-phase mass transfer rate within a single hemispherical texture dimple; (c) time–history curve of instantaneous gas-phase mass transfer rate for a single hemispherical texture dimple.
Lubricants 13 00513 g022
Figure 23. Cavitation morphology. (a) Shear cavitation morphology in non-textured oil film; (b) shear cavitation morphology in textured oil film.
Lubricants 13 00513 g023
Figure 24. Growth and collapse of cavitation bubbles (direction: clockwise).
Lubricants 13 00513 g024
Figure 25. Shedding and regeneration of cavitation bubbles (direction: clockwise).
Lubricants 13 00513 g025
Figure 26. Shrinkage of oil film at 1050 r/min.
Lubricants 13 00513 g026
Figure 27. Experimentally measured torque for different texture rates.
Lubricants 13 00513 g027
Figure 28. Experimentally measured torque for different texture depths.
Lubricants 13 00513 g028
Table 1. The flow field medium parameters.
Parameter NameLiquid OilVapor
Density ρ (kg/m3)8650.023
Specific Heat c (J/kg·K−1)2093.51911.6
Thermal Conductivity w (m·K)0.120.0185
Dynamic Viscosity μ (Pa·s)Interpolation function9.86 × 10−6
Saturation Vapor Pressure Pv (Pa)10001000
Table 2. Comparison of Mean Drag Torque between Simulation Predictions and Experimental Measurements under Different Texture Conditions.
Texture TypeSimulated Mean Torque (N m)Experimental Mean Torque (N m)Relative Error (%)
Untextured12.513.57.4%
Hexahedral10.811.88.5%
Hemispherical11.212.49.7%
Disclaimer/Publisher’s Note: The statements, opinions and data contained in all publications are solely those of the individual author(s) and contributor(s) and not of MDPI and/or the editor(s). MDPI and/or the editor(s) disclaim responsibility for any injury to people or property resulting from any ideas, methods, instructions or products referred to in the content.