Article

Microstructure and Tribological Properties of Fe40Mn19Cr20Ni20Mo1 High-Entropy Alloy Composite-Infiltrated by Aluminum–Nitrogen


1
College of Materials Science and Engineering, Taiyuan University of Technology, Taiyuan 030024, China
2
College of New Energy and Materials Engineering, Shanxi University of Electronic Science and Technology, Linfen 041000, China
3
Key Laboratory of Interface Science and Engineering in Advanced Materials, Ministry of Education, Taiyuan University of Technology, Taiyuan 030024, China
*
Authors to whom correspondence should be addressed.
Lubricants 2025, 13(12), 509; https://doi.org/10.3390/lubricants13120509
Submission received: 25 September 2025 / Revised: 18 November 2025 / Accepted: 20 November 2025 / Published: 21 November 2025

Abstract

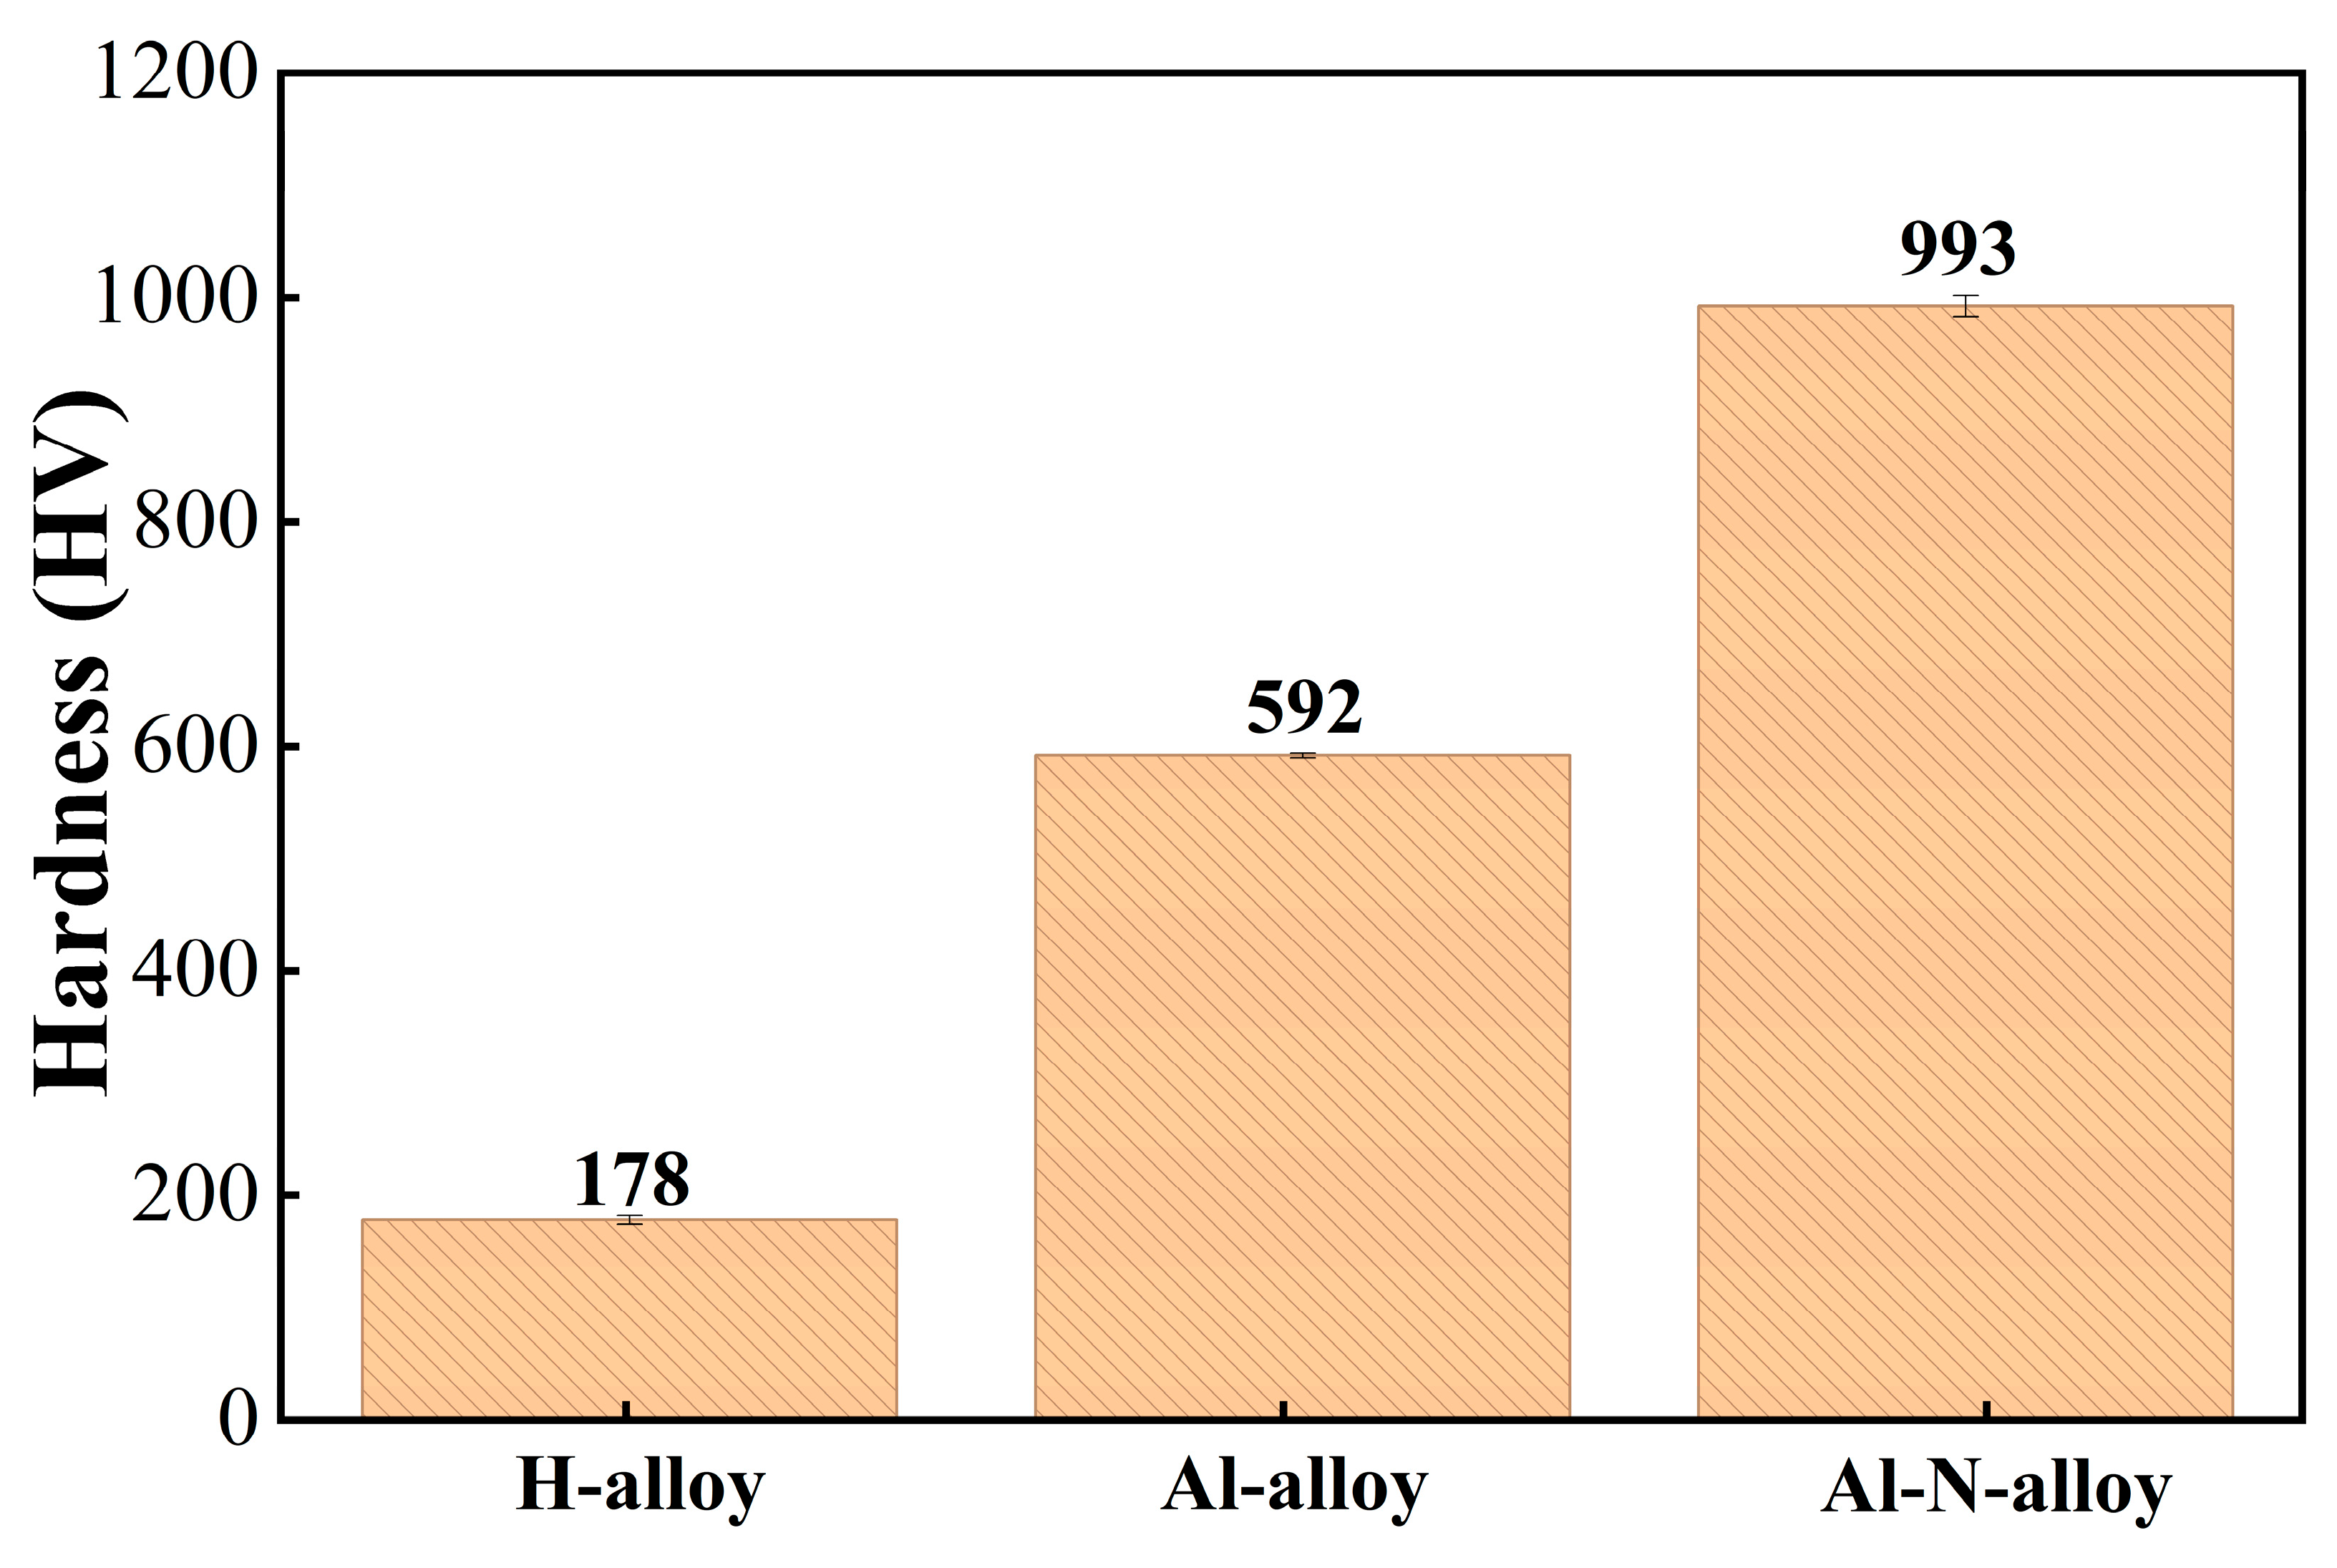
In the manufacturing sector, energy loss often stems mainly from wear. By improving the surface characteristics of alloys, we can substantially cut down on this kind of loss, which in turn boosts the efficiency of energy use. In this study, Fe40Mn19Cr20Ni20Mo1 high-entropy alloy (HEA) with a face-centered cubic (FCC) structure was subjected to aluminum–nitrogen co-infiltration treatment via pack aluminizing and plasma nitriding, forming an aluminum–nitrogen co-infiltrated layer with a thickness of approximately 17 μm. An analysis was carried out on the microstructure, growth dynamics, and tribological behavior of the Al-N co-infiltrated layer across a broad temperature spectrum. The results showed that the surface hardness of the samples treated by aluminizing and Al-N co-infiltration reached 592 HV and 993 HV, respectively, which were significantly higher than that of the hot-rolled alloy (178 HV). The Al-N co-infiltrated HEA exhibited a low and stable friction coefficient as well as wear rate over a wide temperature range (20–500 °C), which was attributed to the formation of the Al-N co-infiltrated layer composed of AlN, CrN, and FeN phases. This study demonstrates that Al-N co-infiltration treatment is an effective surface modification technique, which can significantly enhance the hardness and tribological properties of high-entropy alloys over a wide temperature range.

1. Introduction

High-entropy alloys (HEAs) represent a significant breakthrough in the field of materials science in the 21st century. Since the concept was first proposed by Cantor et al. [1] and Yeh et al. [2] in 2004, HEAs have attracted extensive attention in the materials community due to their four unique core effects [3,4,5]. Compared with the traditional alloys, HEAs not only exhibit excellent mechanical properties, corrosion resistance, and radiation resistance but also demonstrate good high-temperature stability [6,7,8,9,10], thus holding great potential for applications in extreme environments [11,12,13].
However, HEAs still face challenges in tribological applications. Especially under extreme conditions such as high temperature and high pressure, surface wear has become a prominent issue that limits the further extension of their service life and the stable exertion of their performance [14,15,16]. Statistics show that approximately 23% of global energy consumption is attributed to friction and wear. By adopting protection measures for mechanical equipment (e.g., lubrication), the energy loss caused by friction and wear is expected to be reduced by 40% [17]. Therefore, improving the wear resistance of materials through surface modification technologies has become a current research focus [18,19,20].
Surface modification technologies such as aluminizing, nitriding, and boronizing can significantly enhance the surface hardness, oxidation resistance, and wear resistance of alloys [21,22,23]. Zhu et al. [24] successfully prepared FeCoCrNiCux and FeCoCrNiSix HEA coatings on SUS 304 stainless steel substrates via laser cladding. The results indicated that the addition of Cu could enhance the thermal conductivity of the coatings and improve their toughness and bonding strength, while the addition of Si could refine the grain size and increase the work hardening degree, thereby enhancing the wear resistance of the coatings. Aluminizing treatment can form a dense Al2O3 oxide film on the surface, which effectively prevents further oxidation and wear [25,26]; nitriding treatment, on the other hand, can significantly improve the surface hardness and wear resistance by forming a high-hardness nitride layer (e.g., AlN, CrN) [27,28]. In recent years, aluminizing-nitriding, as a composite surface treatment technology, combines the advantages of the oxidation resistance of aluminum and the high hardness of nitrogen. Satish Indupuri et al. [29] prepared oxide-free AlN coatings using nitrogen-protected plasma spraying technology, which greatly improved the wear resistance and corrosion resistance of the alloy. He et al. [30,31] demonstrated that introducing aluminum during the plasma nitriding process achieved ultra-high surface hardness and exceptional wear performance. Zhuang et al. [32] subjected 42CrMo steel to aluminum-enhanced plasma nitriding, which resulted in a harder surface layer and excellent wear resistance. Ma et al. [33] performed plasma nitriding on the surface of an aluminum alloy, which improved both the microstructure and mechanical properties of the aluminum surface, nearly doubling its surface hardness. Aluminizing-nitriding has demonstrated excellent performance in traditional materials such as steel and nickel-based alloys [34], but its application in HEAs has rarely been reported.
Although the FeMnCrNi high-entropy alloy system exhibits good strength and toughness, its high-temperature tribological performance still requires improvement [35]. Particularly at elevated temperatures, material softening tends to exacerbate wear. To further enhance the wear resistance and high-temperature oxidation resistance of this alloy across a broad temperature range (from room temperature to 600 °C), this study adopts the aluminum–nitrogen co-infiltrated technique, which has proven effective in traditional alloys, and applies it to this novel high-entropy alloy substrate. The objective is to achieve synergistic enhancement of surface properties through the formation of a composite diffusion layer.
Against this backdrop, this study focuses on the Fe40Mn19Cr20Ni20Mo1 HEA. A composite process of pack aluminizing followed by plasma nitriding is employed to prepare an aluminizing-nitriding layer. The microstructure, growth kinetics, and mechanical properties, as well as the tribological behavior of this layer over a wide temperature range (20–600 °C) are systematically investigated. The primary objective is to determine the critical temperature at which coating failure occurs, thereby establishing a safe operational temperature window for its industrial application. This research aims to reveal the formation mechanism and wear-resistant mechanism of the aluminizing-nitriding layer in HEAs, thereby providing a new technical approach and theoretical basis for the surface strengthening of HEAs.

2. Materials and Methods

2.1. Material Preparation

In this research, we fabricated a high-entropy alloy (HEA) featuring a nominal composition of Fe40Mn19Cr20Ni20Mo1 through vacuum induction melting. Following this, the alloy underwent homogenization treatment at 1200 °C for a duration of 1.5 h. Subsequently, hot rolling was applied at the same temperature to decrease the alloy’s thickness to 5 mm. The alloy was cut into specimens with dimensions of 22 mm × 10 mm × 5 mm using the electrical discharge machining (EDM) process. These alloy samples then underwent a series of treatments including grinding, polishing, ultrasonic cleaning, and finally, drying.
A stepwise treatment was applied to the hot-rolled Fe40Mn19Cr20Ni20Mo1 HEA. In the first step, the hot-rolled Fe40Mn19Cr20Ni20Mo1 HEA was subjected to aluminizing via the pack aluminizing method. The alloy was placed in the center of a corundum crucible (with an inner diameter of 80 mm and a height of 100 mm) filled with a commercial aluminizing agent (composed of aluminum powder, Al2O3, and NH4Cl). Aluminizing processes were carried out at three distinct temperature levels: 800 °C, 850 °C, and 900 °C. Correspondingly, the treatment durations were set at 3 h, 6 h, and 9 h, respectively. Given that the aluminide layer formed at 800 °C demonstrated outstanding coating adhesion along with an appropriate thickness, this specific set of parameters was chosen for subsequent testing. In the second step, the aluminized Fe40Mn19Cr20Ni20Mo1 was subjected to nitriding via the plasma nitriding method. Following placement on the cathode plate, the alloy specimen underwent chamber evacuation to below 50 Pa; subsequently, NH3 was gradually introduced. Nitriding treatments were performed at temperatures of 500 °C, 550 °C, and 600 °C, with holding times of 2 h, 5 h, and 10 h under conditions of 350 Pa and 850 V. Finally, an aluminum–nitrogen co-infiltration alloy was obtained. The Fe40Mn19Cr20Ni20Mo1 HEA in its hot-rolled, aluminized, and Al-N co-infiltration states were denoted as the H-alloy, Al-alloy, and Al-N-alloy, respectively.

2.2. Tests on Mechanical and Frictional Performance

VDI 3198 test was employed to evaluate the adhesion between the substrate and the diffusion layer [36] (Details are provided in Supplementary Material Figure S1). The four different textures of the left part of Figure S1, illustrate the imprint shapes that guarantee strong interfacial bonds between the coating and the substrate. The system is divided into six grades, among which HF1 through HF4 represent acceptable failures, while HF5 and HF6 are considered unacceptable. A Rockwell hardness tester (Model HR-150A, Shandong, China) was used to perform indentation tests on different Al-alloys and Al-N-alloys under an applied load of 1500 N. The indentation morphology was observed using a metallographic microscope (Model IE500M, Ningbo, China). The Vickers microhardness tester (Model HV-1000A, Shanghai, China) was used to apply a 1000 N load for 15 s on the H-alloy, Al-alloy, and Al-N-alloy.
Tribological tests were conducted under dry air conditions using an elevated-temperature ball-on-disk tribometer (HT-1000, Zhejiang, China). The tribopair for this test was a Si3N4 ball. This ball was characterized by a hardness value of approximately 1500 HV and a radius of 2.75 mm. Testing temperatures were sequentially set at 20, 100, 200, 300, 400, 500, and 600 °C, respectively. The sliding speed was maintained at approximately 0.063 m/s for 1800 s. The alloys employed for elevated-temperature tribological testing had dimensions of 22 × 10 × 5 mm3.
Following the wear test, the wear scars were examined with a Keyence VK-X1100 (manufactured in Japan) for detailed analysis. The wear volume loss and wear rate were calculated by measuring the depth and width of the wear tracks. The wear volume loss (ΔV, mm3) was calculated using the following formula:
V   =   L h ( 3 h 2   +   4 b 2 ) 6 b
where h, b, and L represent the depth, width, and perimeter of the wear track, respectively. The wear rate (Wr) is computable through the following formula:
W r = V P S
where P and S denote the normal load and sliding distance, respectively.

2.3. Microstructure Characterization

The indentation morphology of the alloys was examined with an IE500M metallographic microscope (Ningbo, China) after Rockwell testing. X-ray diffraction (XRD, AERIS, The Netherlands) was conducted on the alloys to identify their crystal structure. The microstructure and worn surface morphology of the H-alloy, Al-alloy, and Al-N-alloy were investigated using a scanning electron microscope (SEM, Phenom XL, Shanghai, China) equipped with an energy-dispersive X-ray spectrometer (EDS).

3. Results and Discussion

3.1. Preliminary Experimental Preparations

Firstly, a preliminary test was conducted on Al-alloy to select the final aluminizing process. The VDI 3198 test was employed to evaluate the adhesion between the diffusion layer and the substrate. Among the aluminizing tests, the specimens that underwent treatment at 800 °C with holding durations of 3 h, 6 h, and 9 h demonstrated comparatively favorable adhesion, with a rating of HF2-3 (see Supplementary Material Figure S2). Subsequently, the alloys prepared under the above three aluminizing processes were subjected to nitriding treatment at 600 °C for 10 h. Furthermore, based on the comprehensive evaluation of the adhesion between the obtained diffusion layer and substrate, hardness, and wear resistance, the subsequent aluminizing process was selected as 800 °C for 9 h (see Supplementary Material Figure S3). Secondly, the aluminized alloys were subjected to nitriding treatment. Nitriding was conducted at 500 °C, 550 °C, and 600 °C with holding times of 2 h, 5 h, and 10 h, respectively, to obtain Al-N co-diffused alloys. Furthermore, based on a comprehensive evaluation of the adhesion between the obtained diffusion layer and substrate, hardness, and wear resistance, the optimal Al-N co-diffusion process was identified as aluminizing at 800 °C for 9 h combined with nitriding at 550 °C for 10 h (see Supplementary Materials Figure S4 and Table S1). Finally, this optimized process was adopted to conduct friction and wear tests over a wide temperature range.

3.2. Microstructure

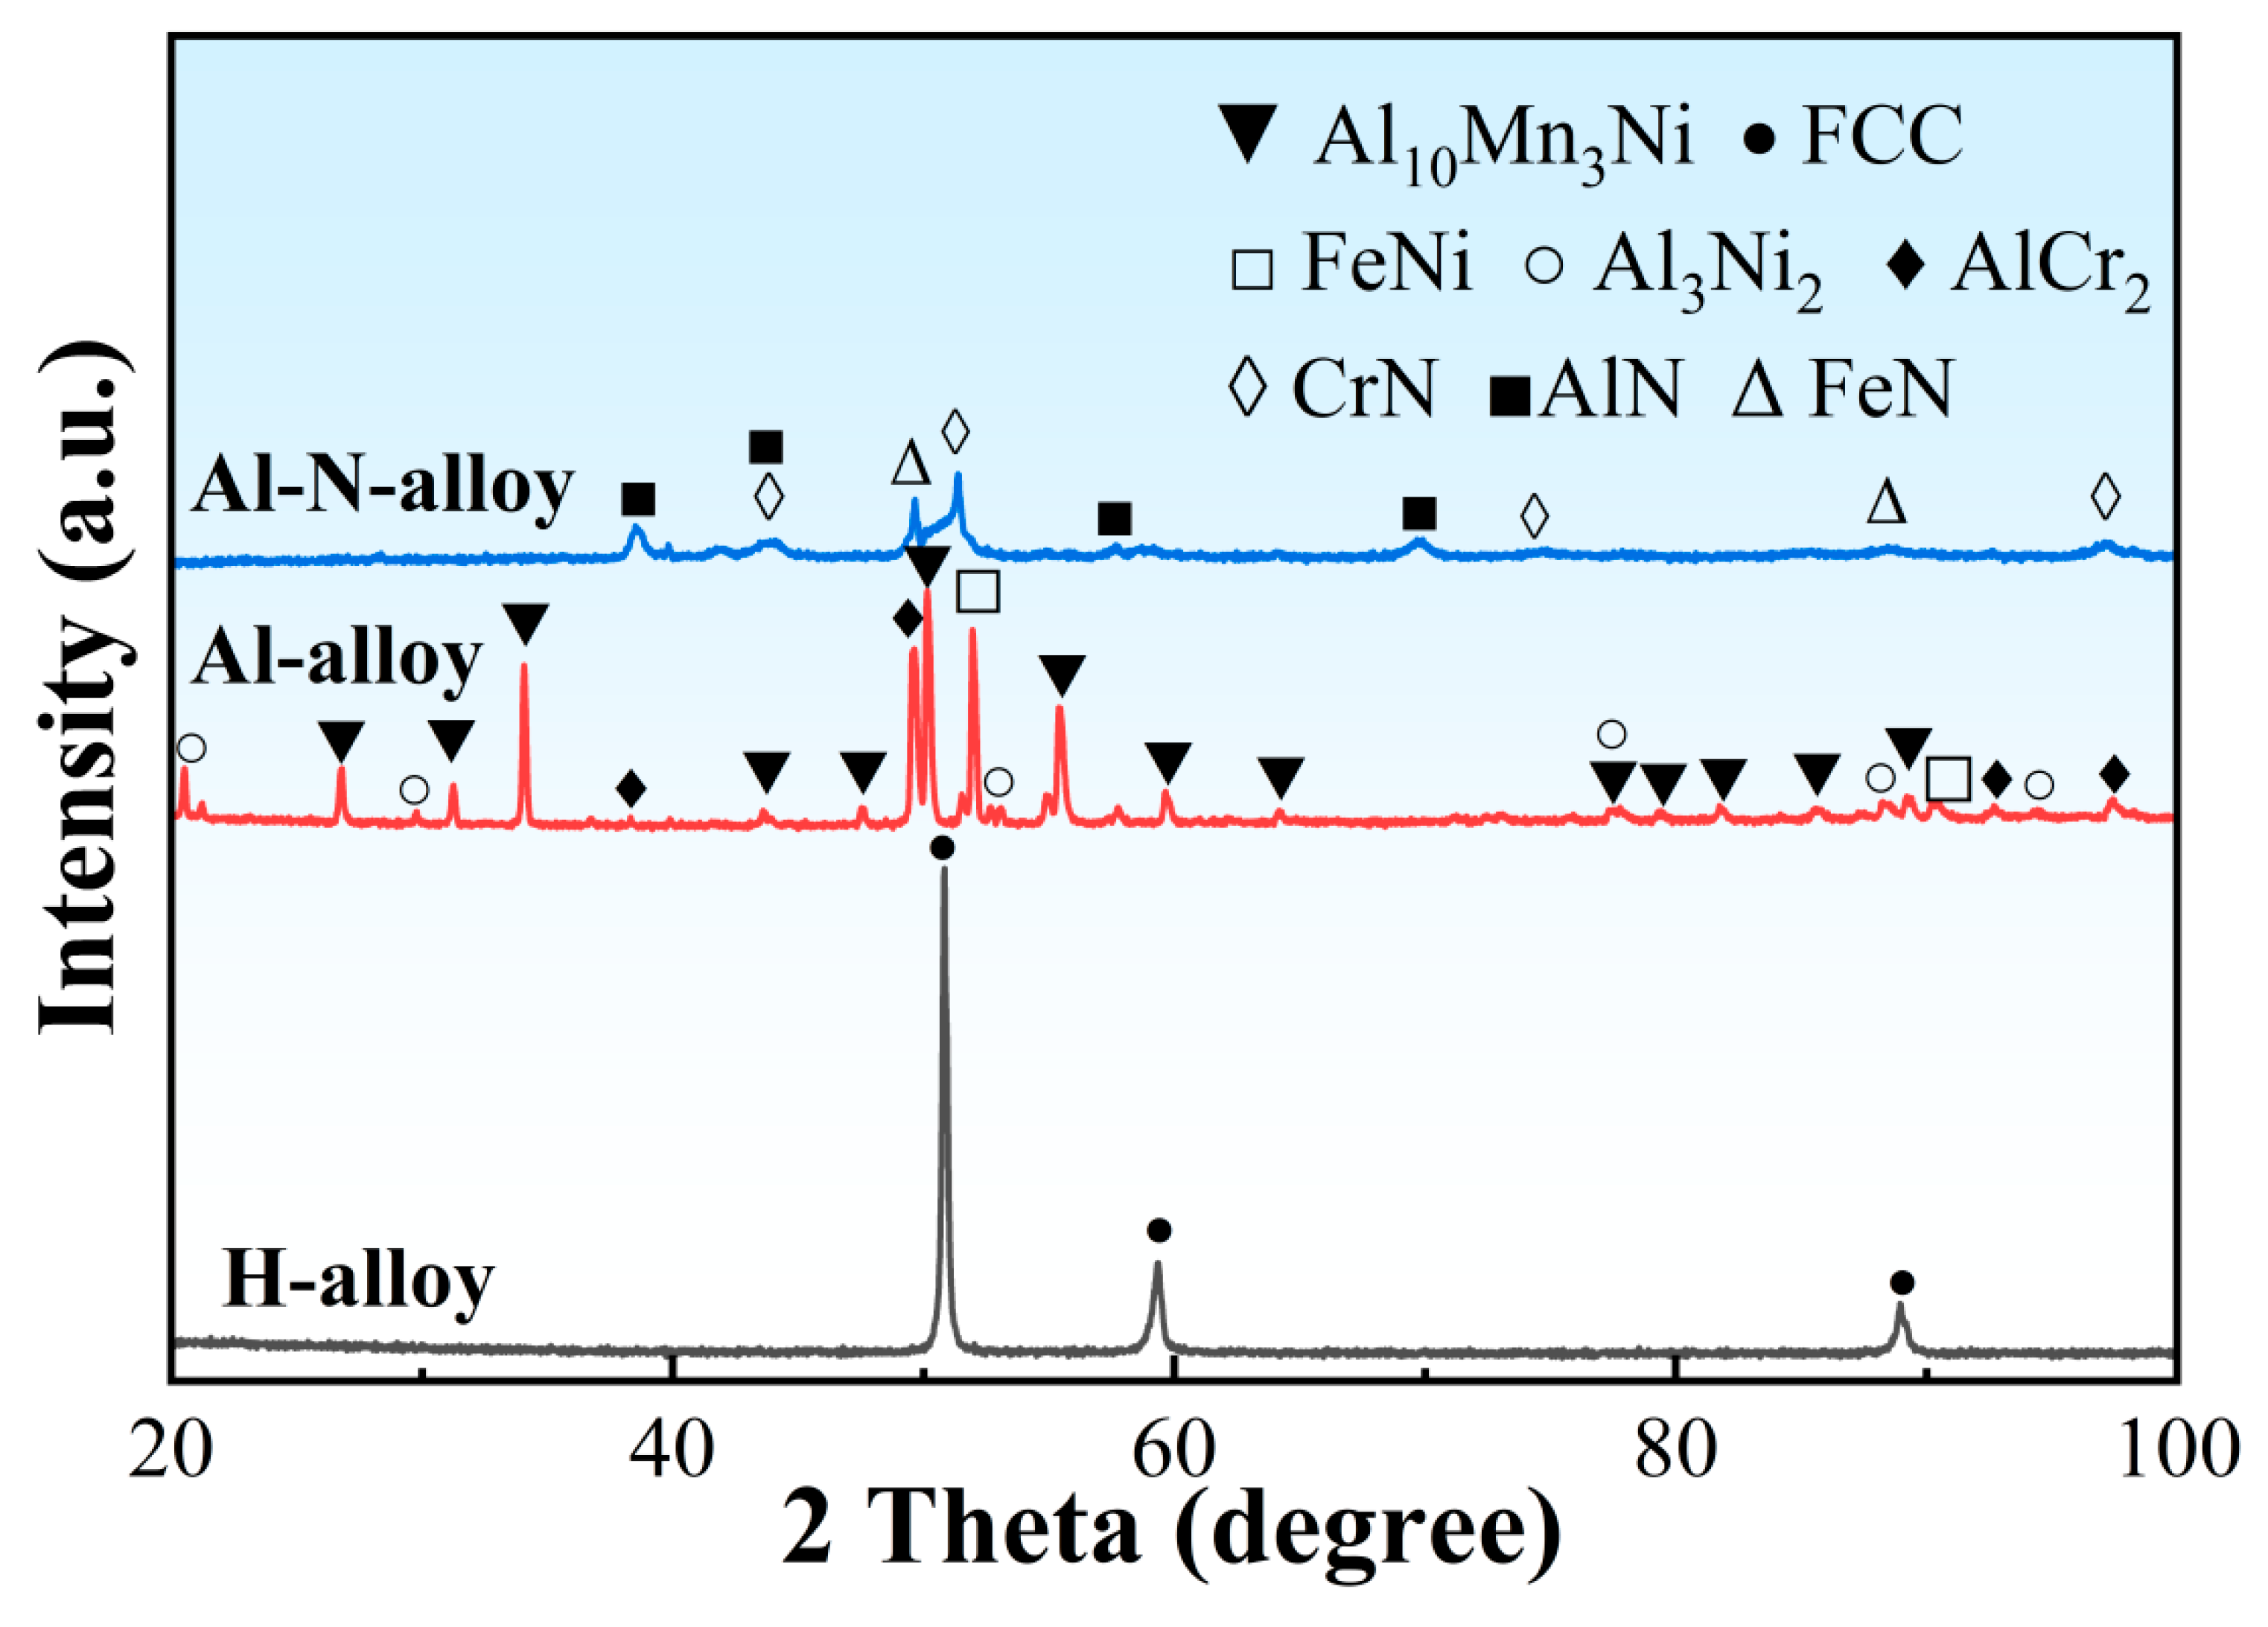
Figure 1 presents the XRD patterns of the H-alloy, Al-alloy, and Al-N-alloy. The H-alloy is a solid solution with a single-phase face-centered cubic (FCC) structure. After aluminizing, the surface of the alloy consists of Al10Mn3Ni-type intermetallic compounds. Furthermore, after nitriding, a large number of nitrides-including CrN, AlN, and FeN are formed on the surface of the Al-N co-diffused Fe40Mn19Cr20Ni20Mo1 HEA.
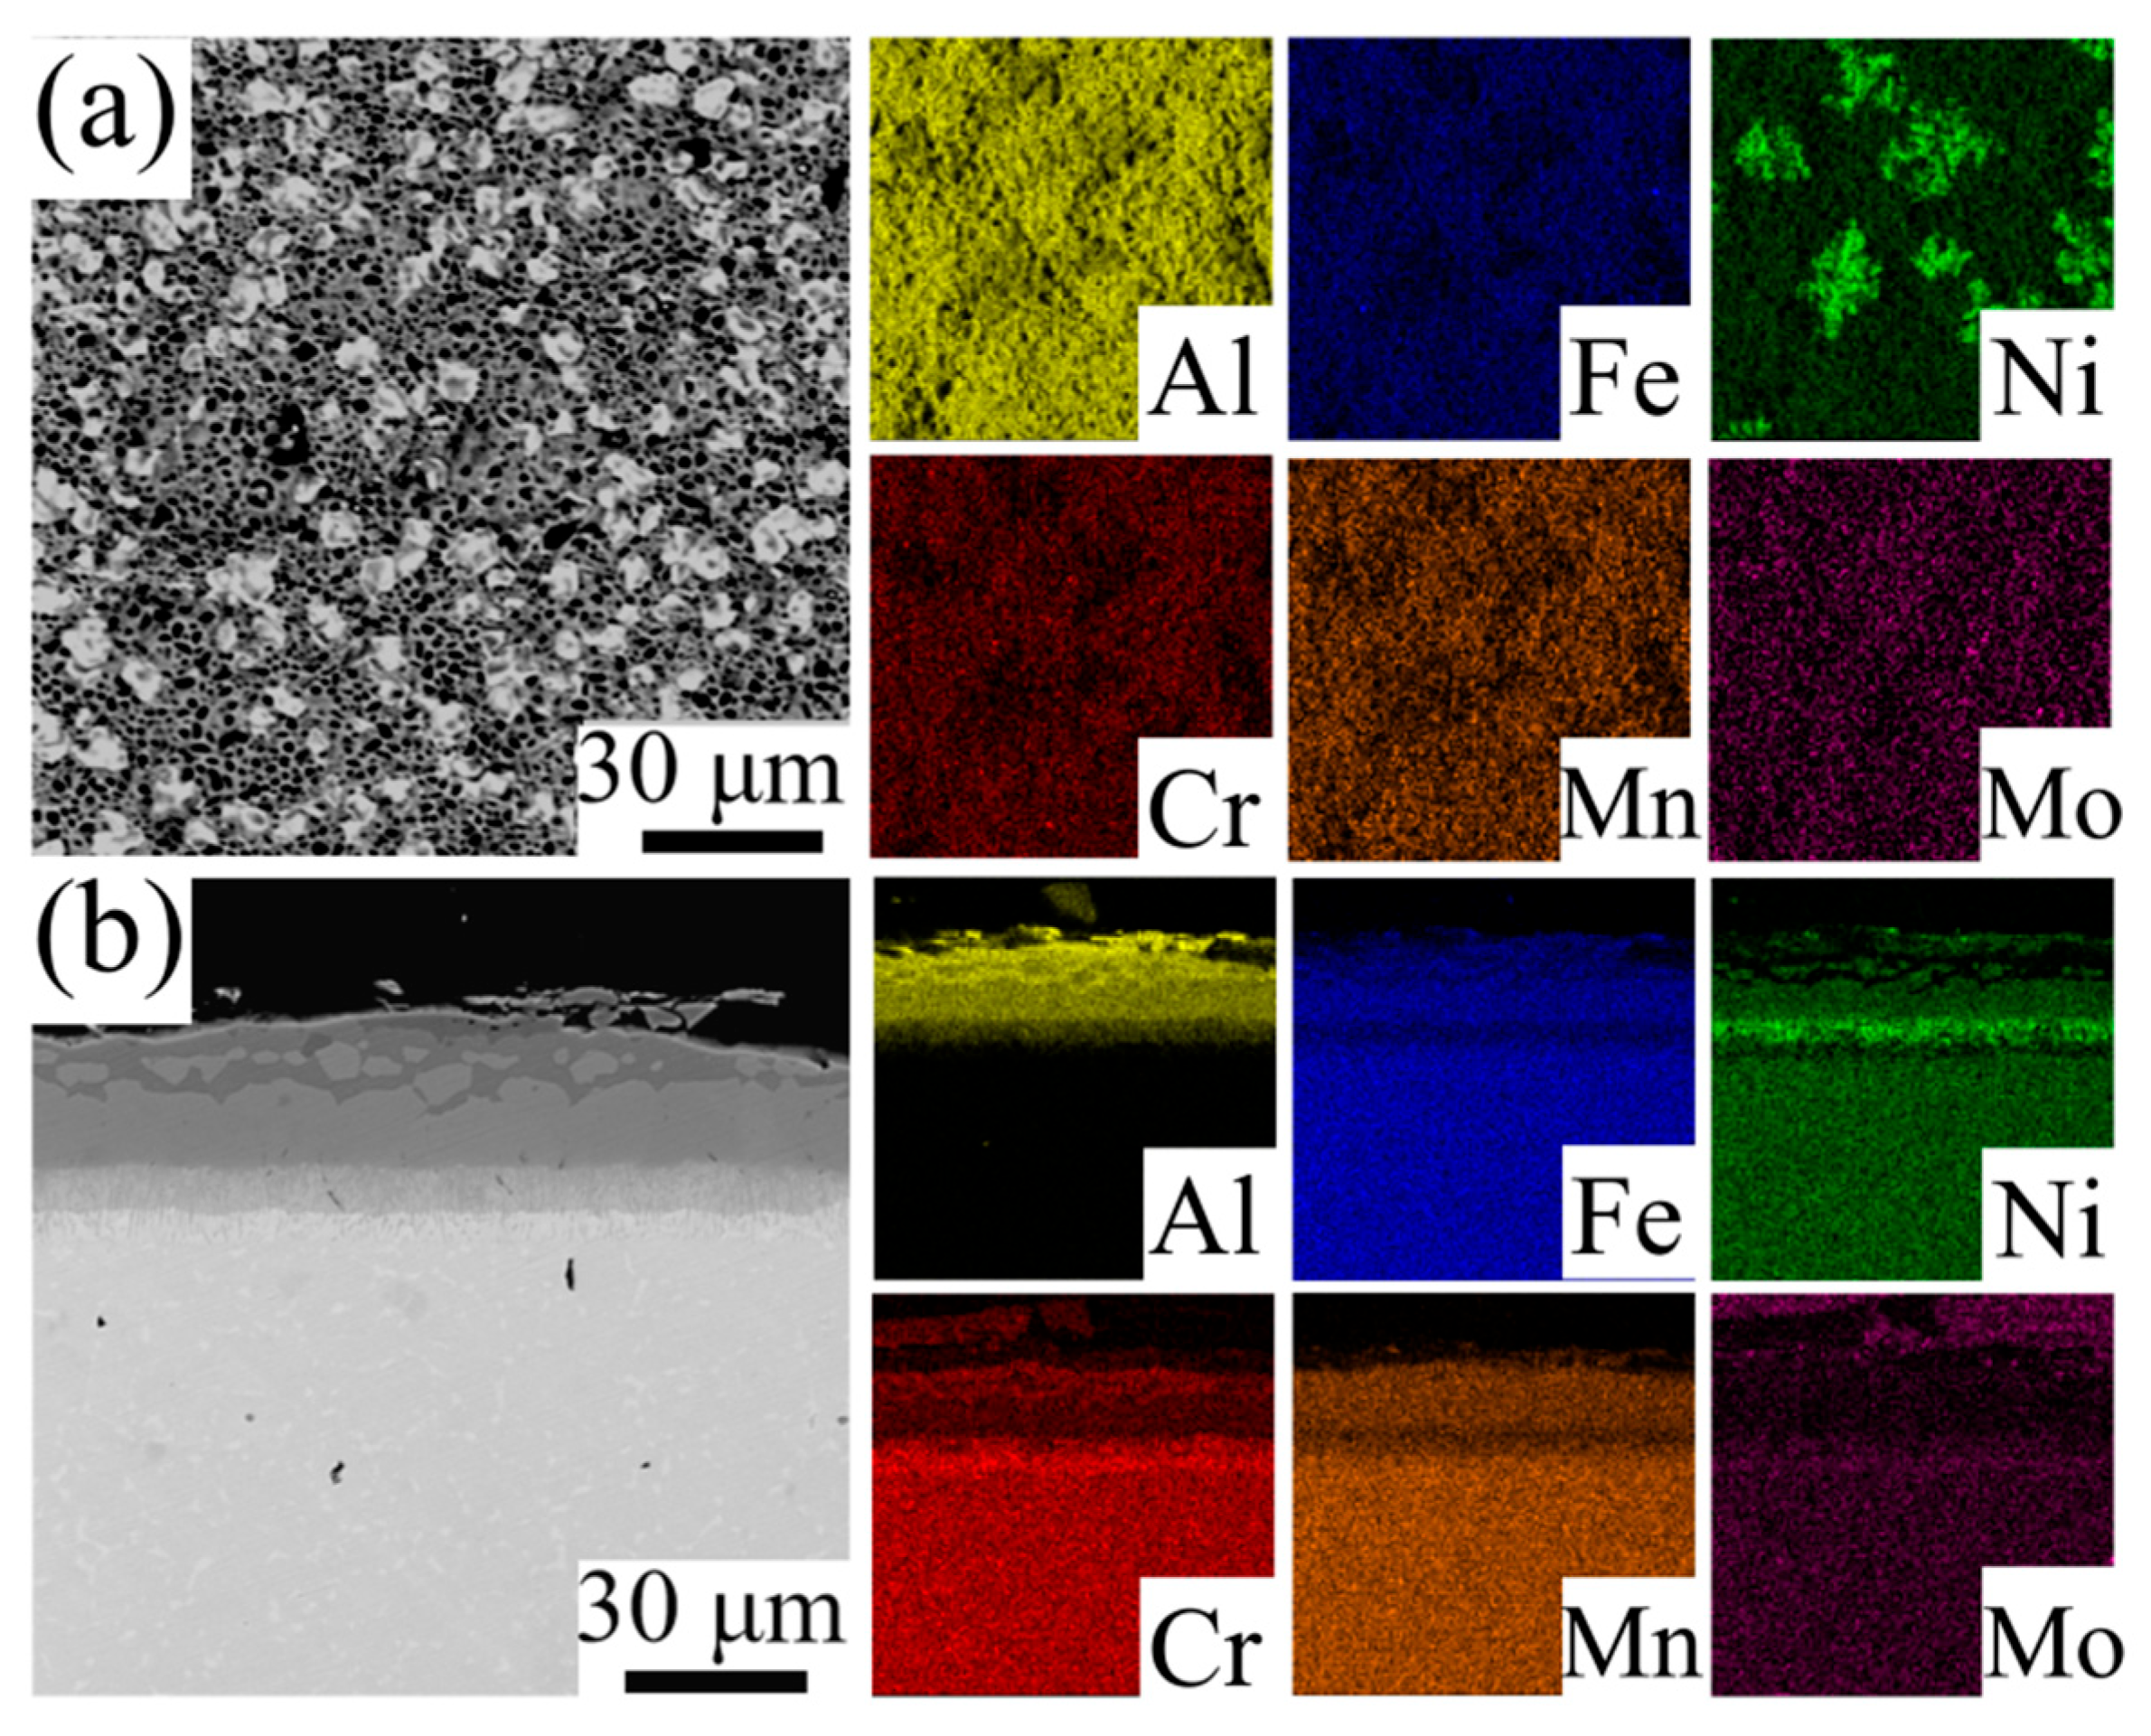
Figure 2 shows the SEM images and EDS mapping of the surface and cross-section of H-alloy. As shown in Figure 2a, the surface of the aluminized HEA exhibits a porous and inhomogeneous microstructure. The surface exhibits the presence of dark colored particles and light colored particles, which correspond to Al2O3 particles and intermetallic compounds, respectively. The Al2O3 particulates are likely to be sourced from either the aluminizing agent employed in the process or the residual oxygen present on the surface of the alloy. In Figure 2b, the SEM micrograph and corresponding EDS mapping of the cross-section of the Al-alloy are presented. The aluminized coating exhibits a thickness of roughly 44 μm, which is composed of an aluminized stratum and an interdiffusion zone (IDZ). The Al concentration within the aluminized layer exhibits a gradual decline moving from the outer surface towards the inner region, and the layer is divided into three sub-layers: with the thicknesses of approximately 6 μm, 8 μm, and 19 μm, respectively. Sub-layer (I) is mainly composed of Al10Mn3Ni-type intermetallic compounds, while Sub-layer (II) is dominated by Al32Cr20-type intermetallic compounds. Sub-layer (III) consists of Al2MnNi-type intermetallic compounds, i.e., Al2(Fe, Mn, Ni). As for the interdiffusion zone (IDZ), It has a thickness of approximately 11 μm, predominantly consisting of AlNi-type intermetallic compounds (see Supplementary Material Figure S5).
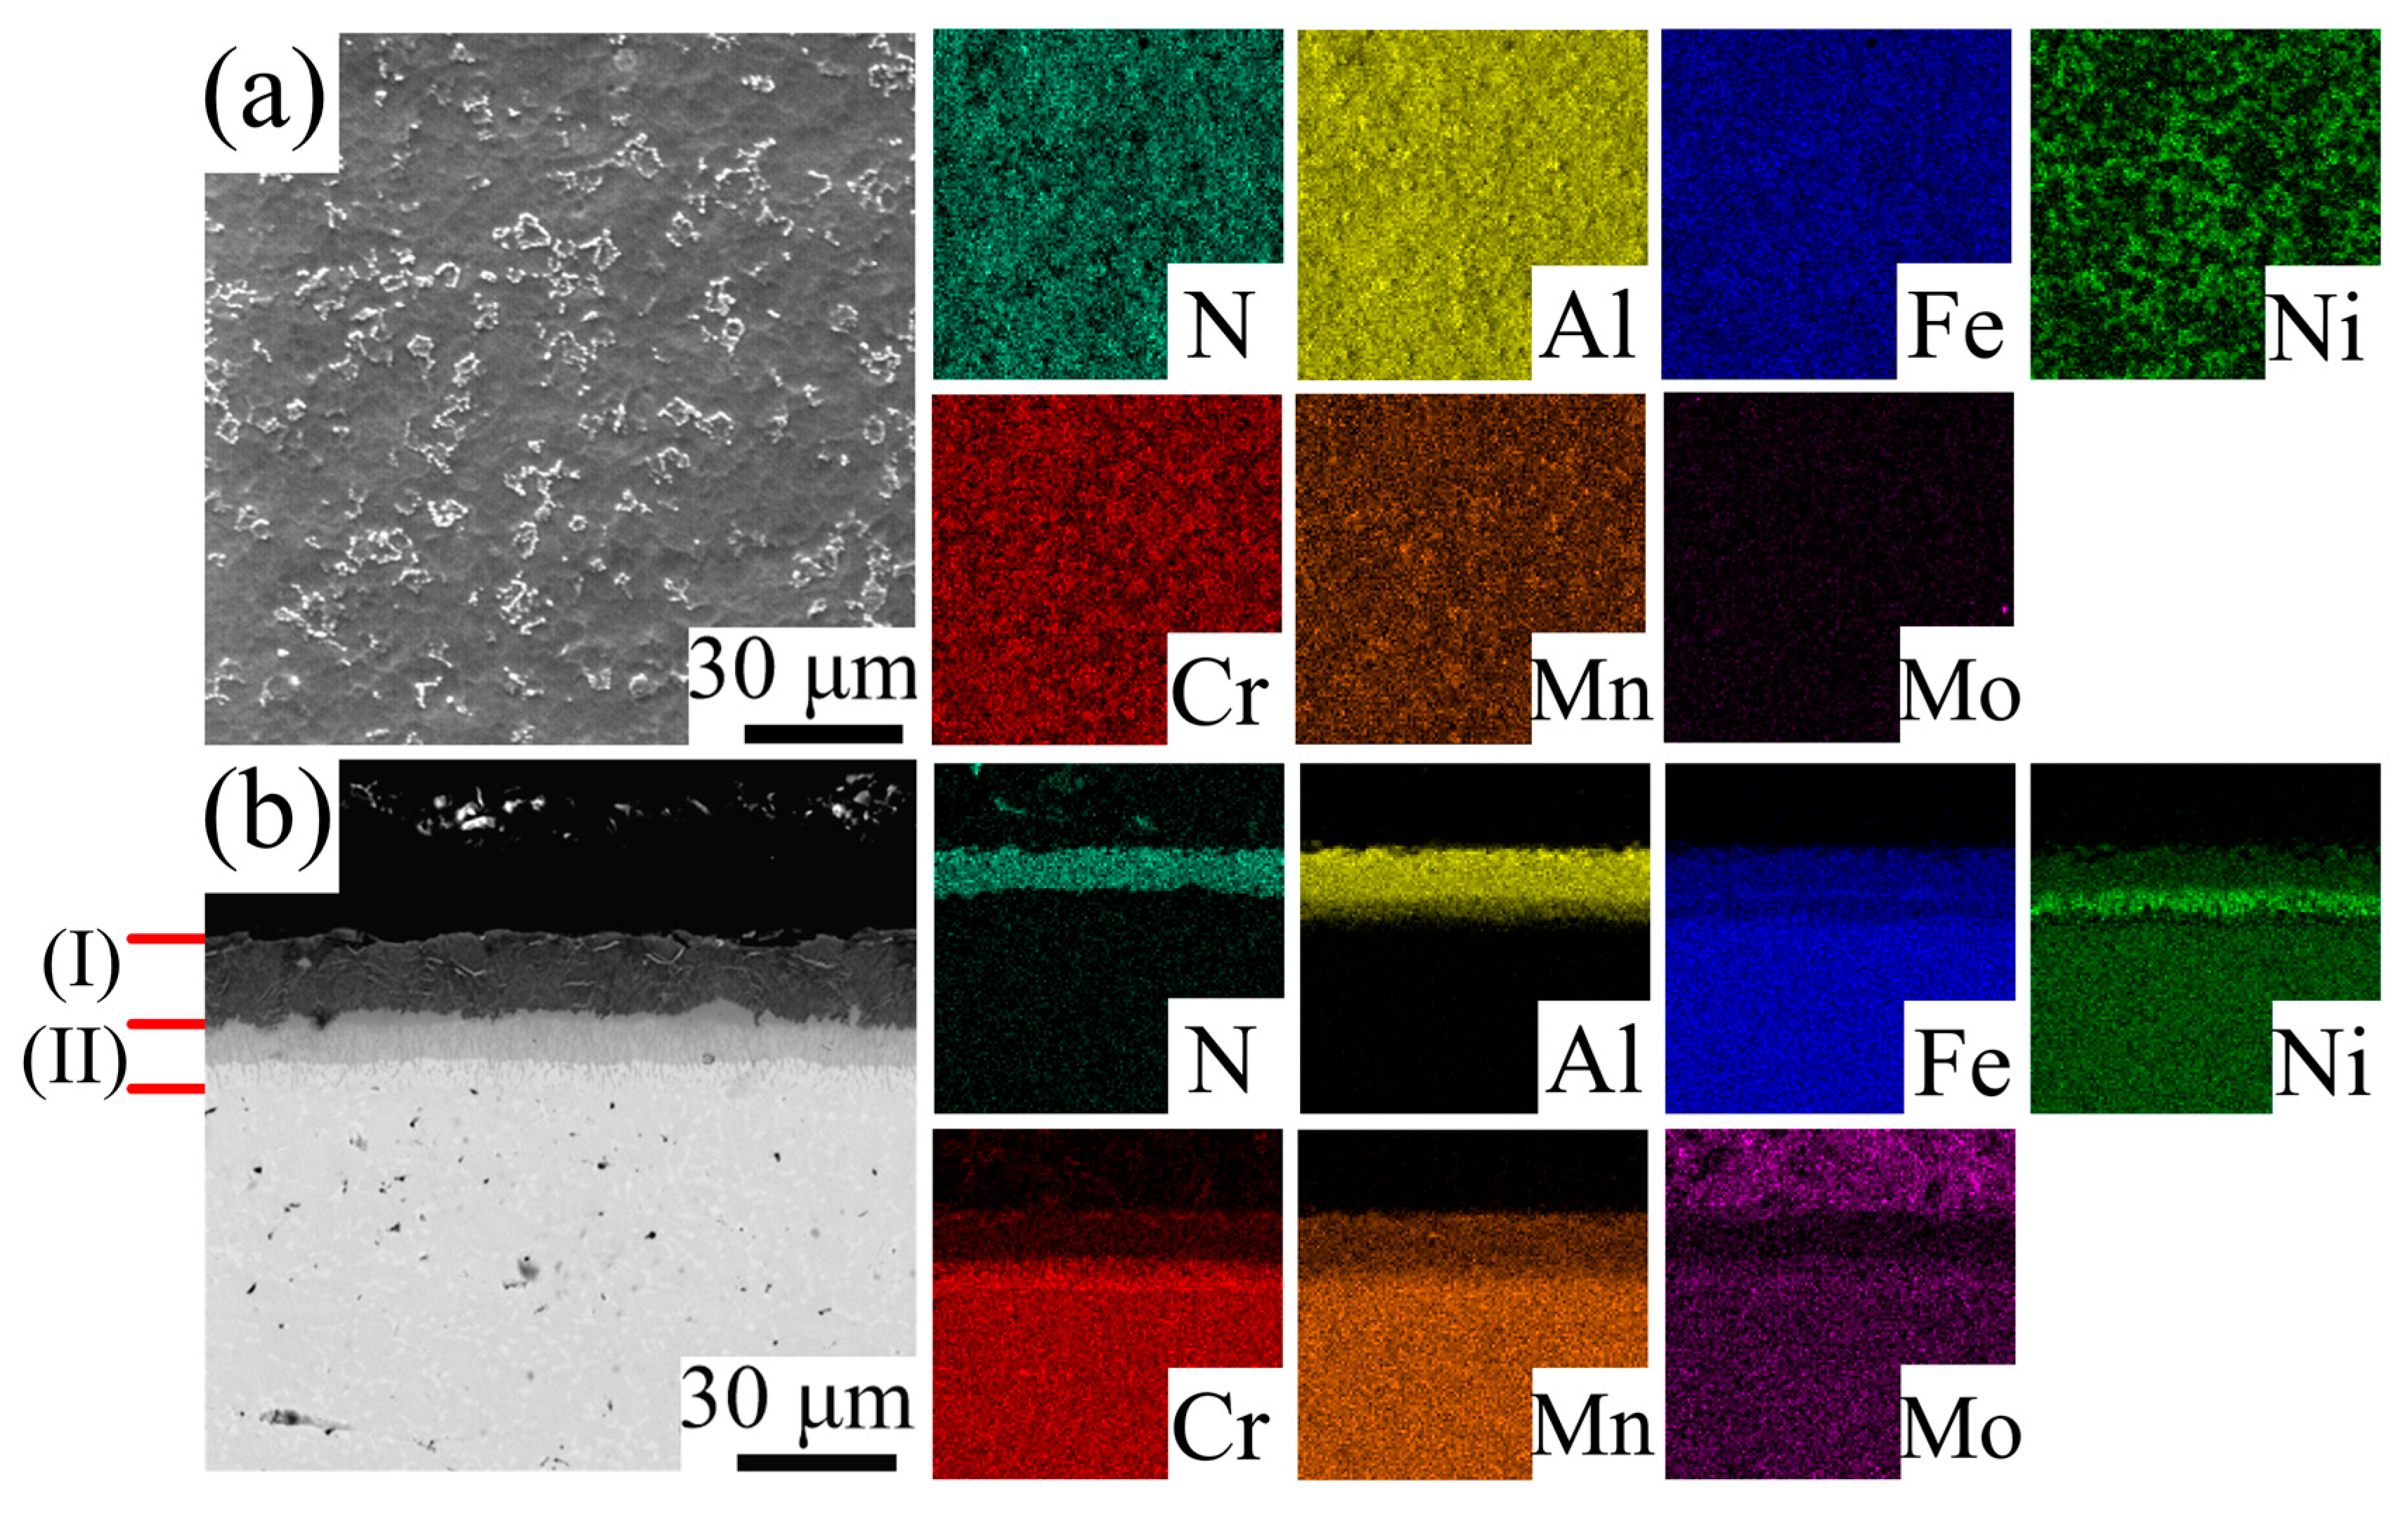
Figure 3 displays the SEM images and EDS mappings of the surface and cross-section of the Al-N co-diffused alloy. After plasma nitriding, a large number of micron-scale nitride structures are present on the alloy surface, which correspond to CrN, AlN, and FeN in the XRD pattern. Meanwhile, the thickness of the diffusion layer of the Al-N-alloy is approximately 17.4 μm (Corresponding to layer (I) in Figure 3b). Additionally, the results of EDS and line scanning indicate that the nitrogen element is uniformly distributed throughout the entire Al-N-alloy layer, and the nitrogen content in the whole layer is basically consistent. The internal bonding of the entire diffusion layer is excellent, with no inclusions or cracks. The results indicate that the Al-N co-infiltration layer has been successfully prepared on the surface of the aluminized alloy using plasma nitriding technology.

3.3. Hardness and Bonding Properties of HEA

3.3.1. Vickers Hardness of HEA

The surface hardness values of H-alloy, Al-alloy, and Al-N-alloy are presented in Figure 4. H-alloy, Al-alloy, and Al-N-alloy have surface hardness values of 178 HV, 592 HV, and 993 HV. The surface hardness of Al-alloy is three times higher than that of H-alloy. In the case of the H-alloy exhibiting a FCC crystal structure, the introduction of Al serves as a catalyst to facilitate the nucleation and growth of hard BCC phases as well as intermetallic compounds [37]. From the matrix to the IDZ, the rising Al content corresponds to a microstructural transition: starting from a single FCC phase, progressing to AlNi-type intermetallics, and finally forming a hard, outer layer of Al10Mn3Ni-type compounds. Furthermore, after plasma nitriding, the surface hardness of the Al-N-alloy reaches five times that of the H-alloy. indicating that Al-N co-infiltration significantly improves the surface hardness, which is attributed to the formation of a large number of nitrides on the surface. For Al-alloy, the increase for its hardness is mainly due to the formation of high-hardness nitrides, which is primarily attributed to the strong covalent bonds or ionic bonds formed between nitrogen atoms and metals or other elements. For example, the high hardness of AlN, FeN, and CrN is mainly attributed to the factors such as their strong covalent bonds, stable crystal structures, grain refinement strengthening, and solid solution strengthening. These characteristics enable them to exhibit excellent performance in high-temperature, high-pressure, and wear-prone environments [38,39].

3.3.2. Evaluation of Infiltration Layer Bonding Properties

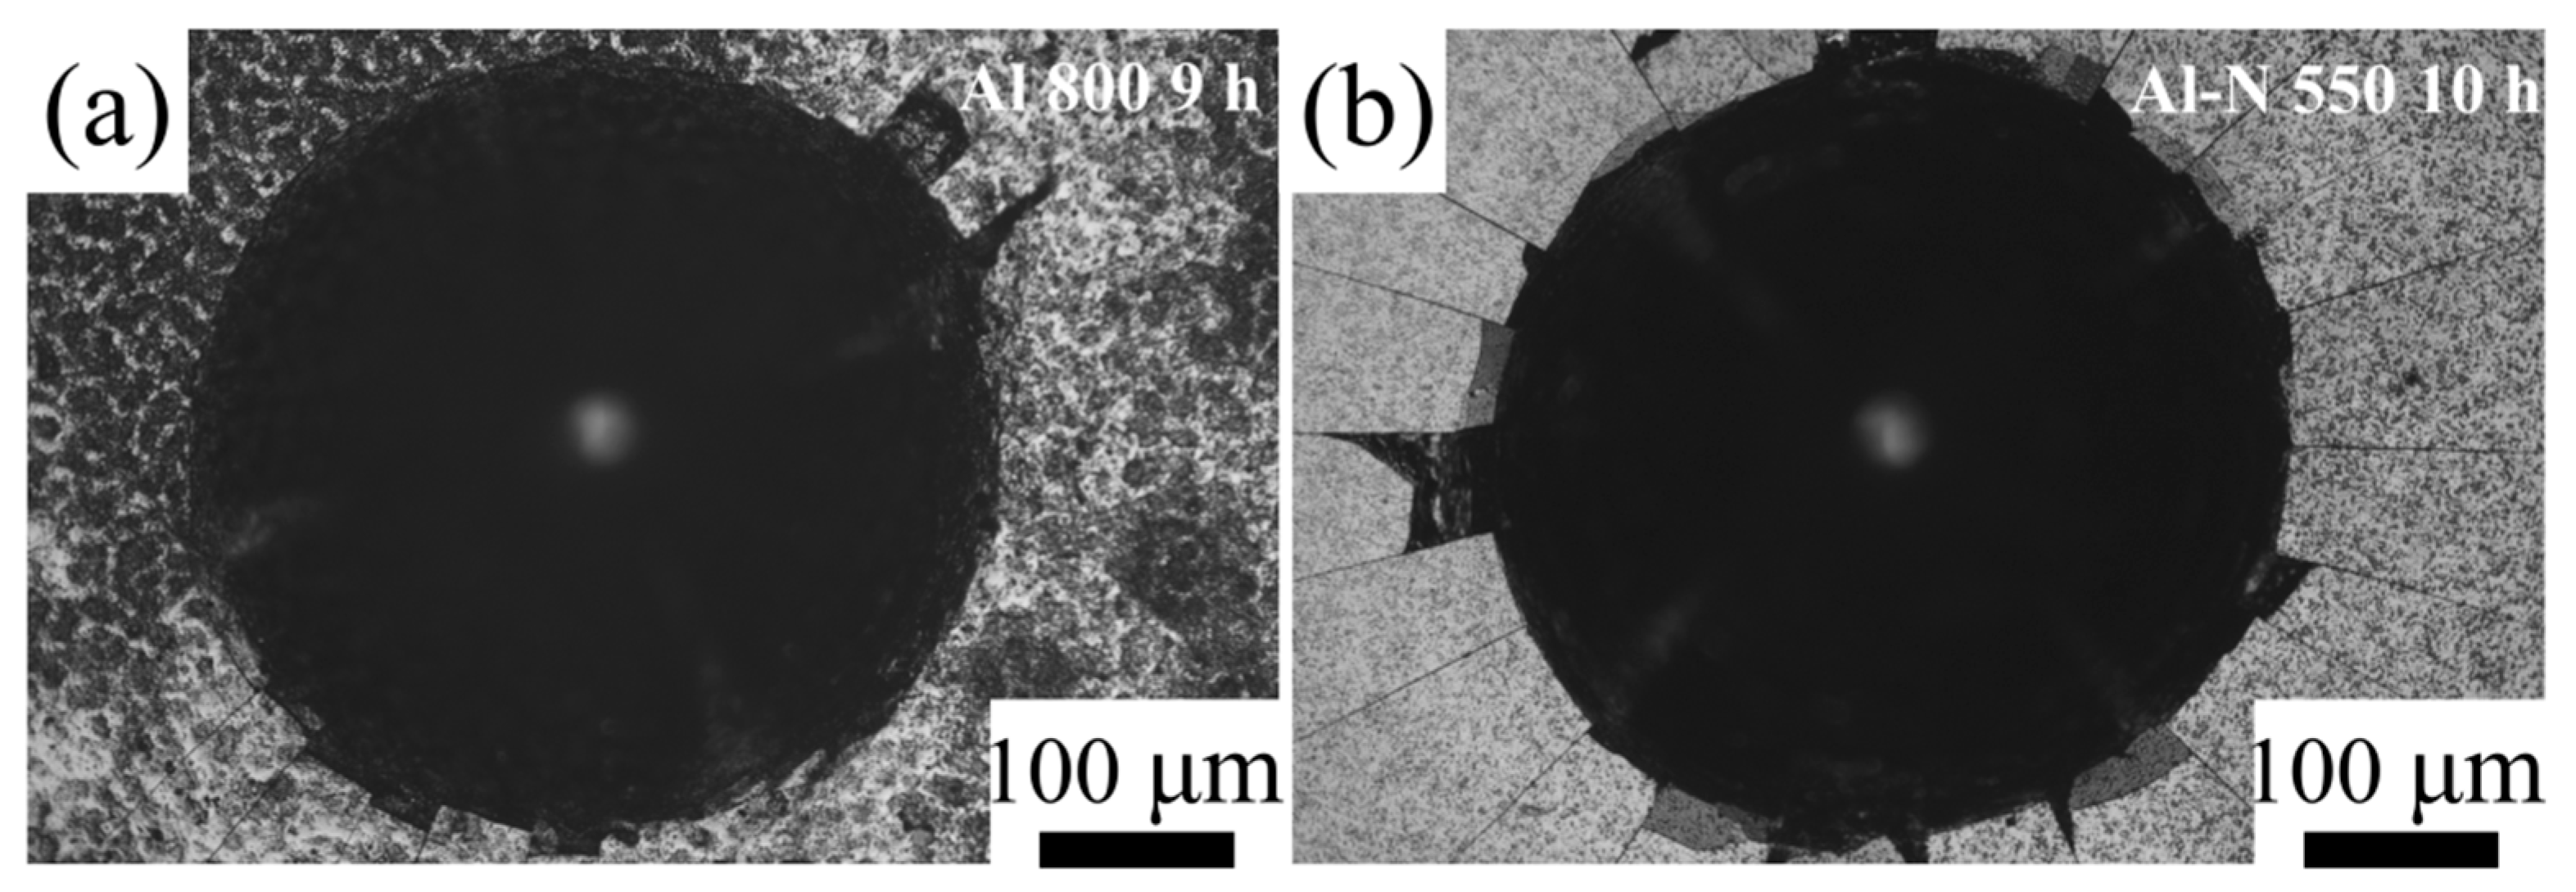
The VDI 3198 test was used to determine the bonding property between the diffusion layer and the matrix. When the aluminizing temperature was 800 °C for 9 h, the bonding property between the diffusion layer and the matrix was relatively good. Based on these findings, aluminizing at 800 °C for 9 h was adopted as the pretreatment prior to the subsequent nitriding step, and then the optimal Al-N co-infiltration process was selected from these experiments. The surface morphology after the Rockwell indentation test is shown in Figure 5. There is no delamination near the indentation, only a small number of cracks. It can be confirmed that the bonding grade between their diffusion layers and matrices is HF2-HF3, which belongs to acceptable failure, indicating good bonding property.

3.4. Growth Kinetics of Al-N-Alloy Gradient Coating

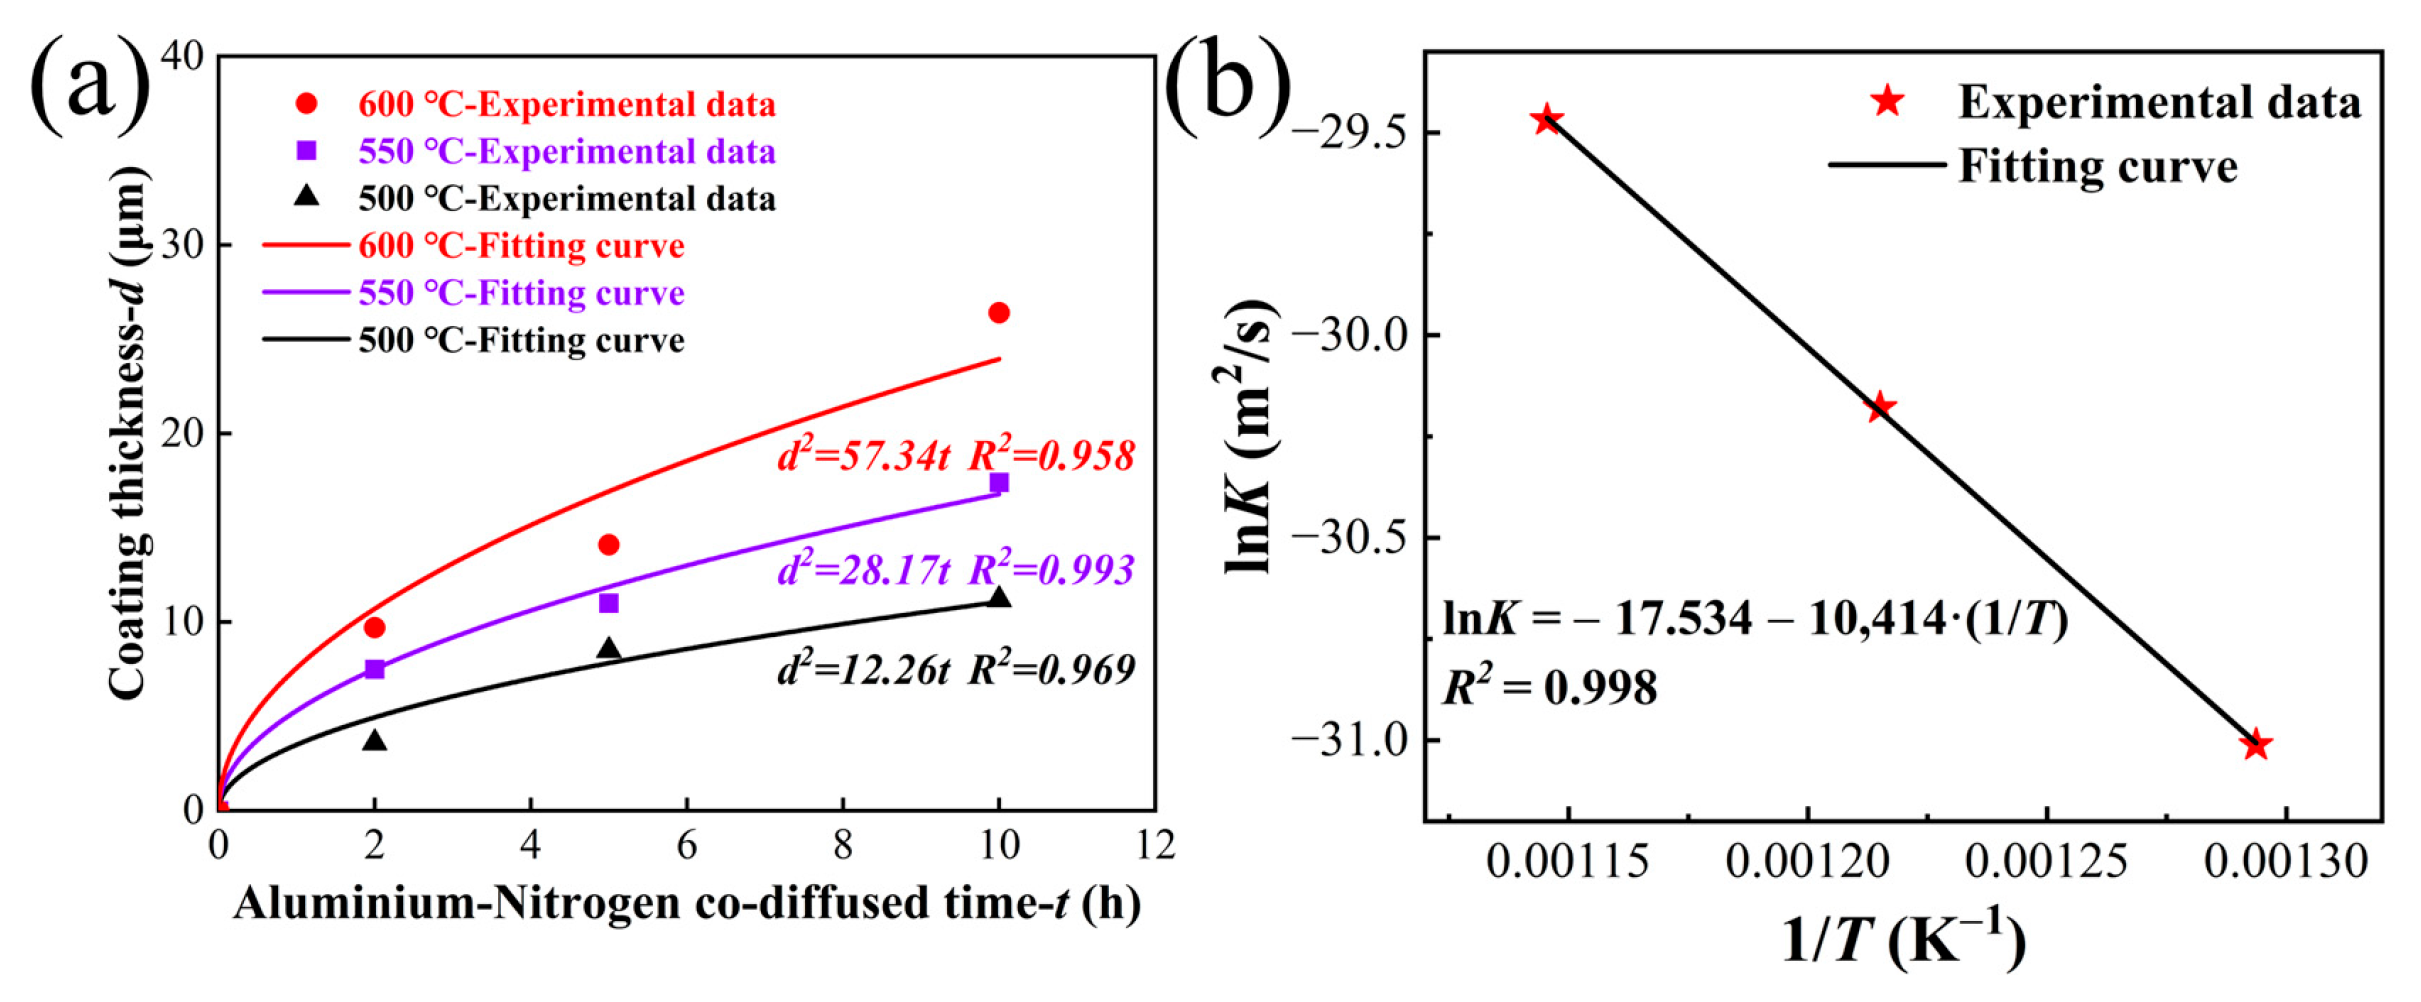
For the purpose of investigating the growth characteristics of the Al-N-co-infiltration layer, the layer thickness was determined through the analysis of cross-sectional images of the Al-alloy sample. Table 1 presents the thicknesses of the Al-N-co-infiltration layers under different temperatures and durations. The growth kinetics of this layer can be described by the following equation:
d   2   =   K t
where d, K, and t correspond to the diffusion layer thickness (m), diffusion coefficient (m2/s), and time (s), respectively. An increase in temperature promotes atomic diffusion, leading to a corresponding rise in the diffusion coefficient. The diffusion coefficients at various temperatures, obtained by fitting Equation (4), are summarized in Table 2. Furthermore, the temperature dependence of the diffusion coefficient follows the Arrhenius relationship:
K   =   K 0 exp Q R T
wherein, K0 refers to the pre-exponential factor (m2/s), Q refers to the average activation energy for diffusion (J/mol), T refers to the thermodynamic temperature, and R refers to the gas constant (8.314 J/mol·K−1). By taking the natural logarithm of both sides of Equation (4), a linear relationship between lnK and 1/T can be obtained, as shown in Equation (5):
ln   K   =   ln   K 0   +   Q R · 1 T
The pre-exponential factor K0 and the average activation energy for diffusion Q can be directly derived from Equation (5). It is concluded that the average diffusion activation energy and pre-exponential factor of the Al-N-alloy after Al-N-co-infiltration treatment are 86.582 kJ/mol and 2.43 × 10⁻⁸; respectively.
Figure 6 depicts the evolution of diffusion layer thickness with temperature and holding time, as well as the lnK-1/T curves. The average diffusion activation energy obtained in this study is higher than that of Fe40Mn20Cr20Ni20 alloy subjected to direct plasma nitriding, which is 41.388 kJ/mol [39]. Nishimoto et al. [40] calculated that the Q required for the plasma nitriding of CoCrFeMnNi HEA is 64.038 kJ/mol. According to Table 2, the diffusion coefficients of the Fe40Mn19Cr20Ni20Mo1 HEA after Al-N-co-infiltration at 500 °C–600 °C are 3.406 × 10⁻¹⁴ m2/s, 7.825 × 10⁻¹⁴ m2/s, and 1.593 × 10⁻¹⁴ m2/s, respectively. This may be attributed to the relatively low temperature of the second-step nitriding experiment, which results in a low diffusion coefficient. The kinetics of the Al-N composite infiltration coating are influenced by factors such as the treatment process and substrate structure.

3.5. Tribological Behavior

3.5.1. Wear Rate and Coefficient of Friction

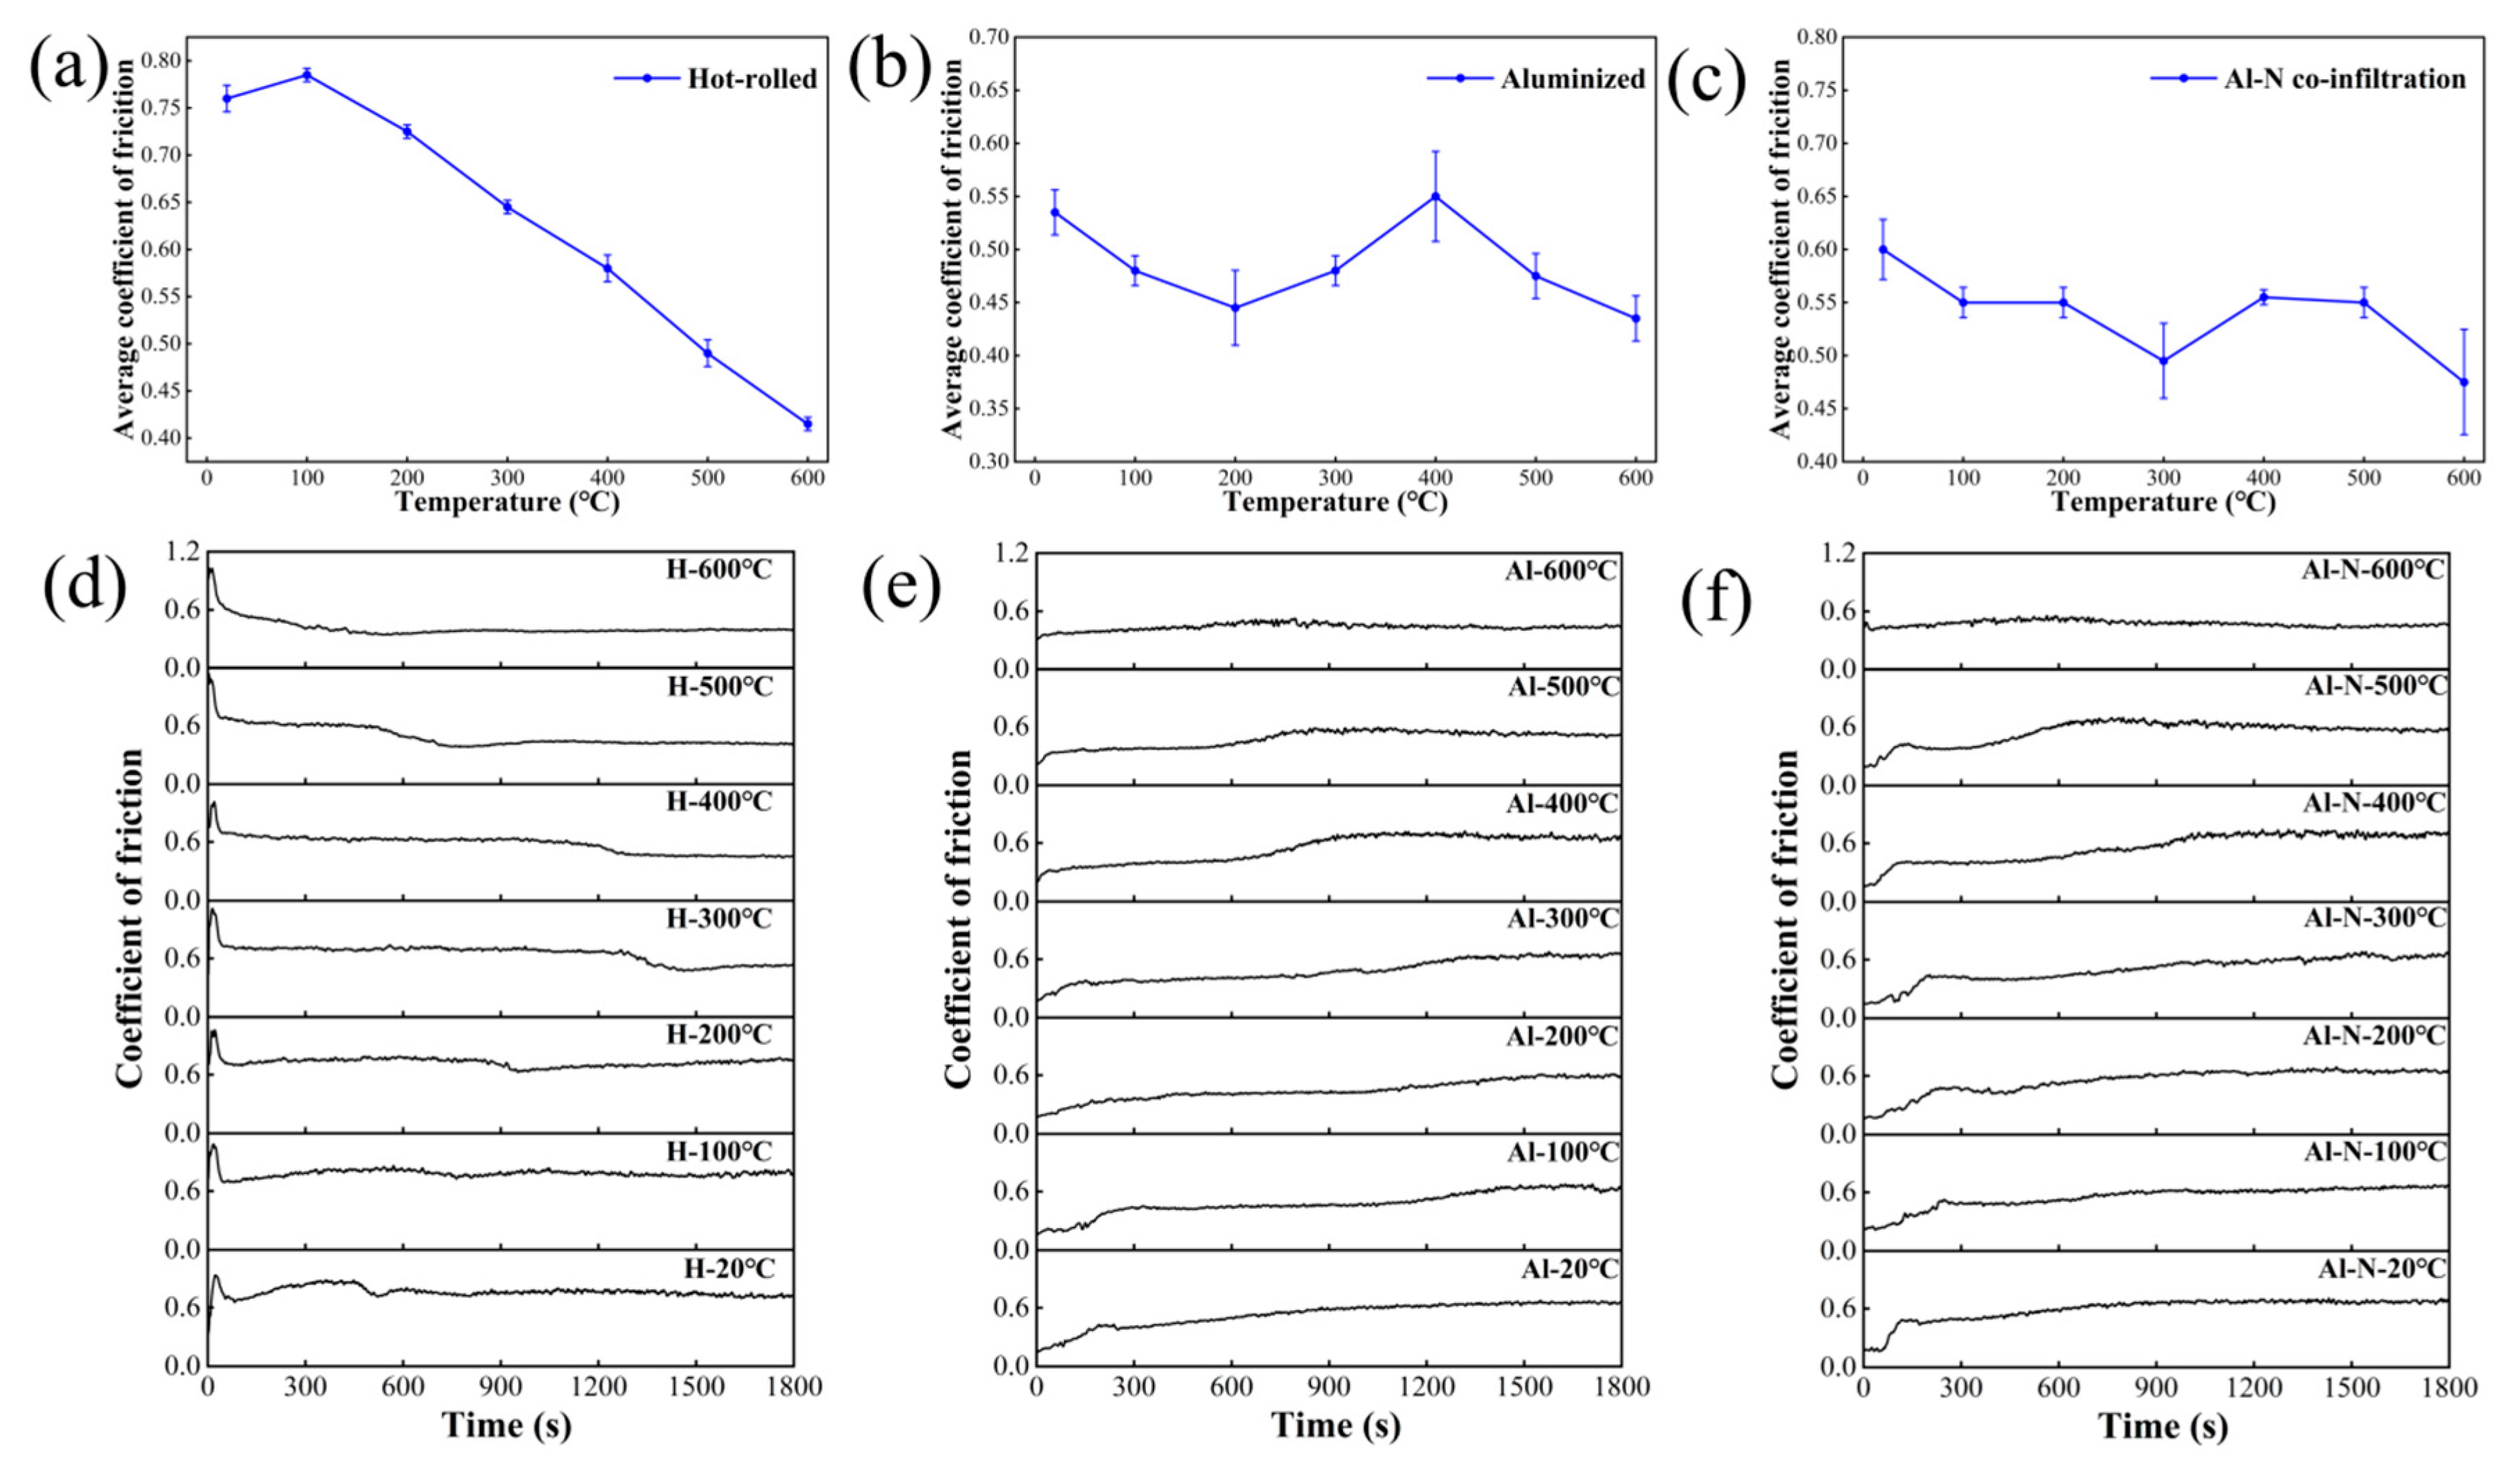
The changes in the average coefficient of friction (COF) of the H-alloy, Al-alloy, and Al-N-alloy over time are shown in Figure 7a–c, respectively. In general, the average friction coefficients of the three alloys exhibit a trend from high values at low temperatures to low values at high temperatures. This is because an oxide film is very likely to form at the interface during the friction process and in a high-temperature environment. Therefore, the oxide film changes from a discontinuous one formed at 20 °C to a continuous and dense one formed at high temperatures, which causes the COF to decrease gradually with increasing the temperature. The average COF of the H-alloy exhibits a decreasing trend with rising temperature. (from 0.76 at 20 °C to 0.42 at 600 °C). With increasing the temperature, the average COF of the Al-alloy first decreases, then increases, and finally decreases again, reaching a maximum value of 0.55 at 400 °C. The average COF of the Al-N-alloy is shown in Figure 7c. With increasing the temperature, the average COF remains stable at approximately 0.55 within the temperature range of 20–500 °C, which is attributed to the high hardness and excellent wear resistance of the Al-N-co-infiltration layer. It decreases at 600 °C (with the lowest COF of approximately 0.475 at this temperature). Among the three alloys, the average COF of the Al-N-alloy remains relatively stable over a wide temperature range, which indicates that the Al-N-alloy exhibits excellent thermal stability and reliable tribological properties.
The temporal variations in the COF of the H-alloy, Al-alloy, and Al-N-alloy over time are shown in Figure 7d–f, respectively. The friction process comprises two distinct stages: the running-in period and the subsequent steady-state stage [41]. During the initial run-in period, The real contact area of the tribological pair progressively increases under applied load, and the surface roughness also increases accordingly until it reaches the stable period. Therefore, the COF gradually increases during the running-in period until it reaches a steady-state value. As the temperature rises from 20 °C to 600 °C, the running-in periods of the H-alloy, Al-alloy, and Al-N-alloy change as follows: the H-alloy’s running-in period shortens from 40 s to 14 s; the Al-alloy’s running-in period shortens from 200 s to 27 s; and the Al-N-alloy’s running-in period increases from 100 s to 250 s. The Al-N-alloy exhibits a relatively long running-in period over a wide temperature range. This is mainly attributed to the extremely high hardness and excellent stability of the nitrided layer on the surface. Additionally, high surface hardness makes it more difficult for the surface asperities to be sheared off and flattened [42,43].
At 20 °C, the COF of the Al-alloy shows a slowly upward trend, and the overall curve is relatively flat. At 100–300 °C, there is a slightly upward trend with fluctuations in the initial stage of the experiment (approximately the first 200 s), followed by entry into a stable region. The COF remains stable at approximately 0.48 before 1200 s, and then stabilizes at around 0.64 in the period from 1200 s to 1800 s. At 400 °C, the COF remains stable at approximately 0.4 before 600 s. After a short unstable period with significant fluctuations, the friction coefficient rapidly rises to a higher plateau (around 0.65) and maintains stability. At 500 °C, after the COF curve rises rapidly in the initial stage, it enters a relatively stable stage (at approximately 0.5). At 600 °C, the COF stabilizes at around 0.42, and the curve is very smooth, with almost no upward trend or large fluctuations.
In the temperature range of 20–400 °C, the running-in period of the Al-N-alloy increases with rising the temperature, which indicates that the Al-N-alloy possesses excellent wear resistance and high surface stability. It then enters a stable region, where the COF shows minimal fluctuations (stabilizing at approximately 0.64). At 500 °C, the COF curve remains stable for a certain period (stabilizing at around 0.43 before 900 s), after which it increases to roughly 0.65, with relatively intense fluctuations in the curve. At 600 °C, the COF curve is stable with almost no fluctuations (stabilizing at approximately 0.48).
The COF is governed by temperature, alloy microstructure, and surface morphology [44]. The boundaries between each layer of the gradient coating are irregular, yet each layer has a clear boundary. The friction process leads to progressive material removal from the contact surface, resulting in mixed friction behavior between adjacent layers. When friction is confined to a single layer, the friction coefficient stabilizes with minor fluctuations; once friction extends to different layers, the COF changes due to variations in the interface structure. This explains why the COF stabilizes at different values during each temperature stage. According to Chen et al. [45], the COF of the SiC/h-BN composite layer exhibited three distinct decreasing stages at 800 °C. Although its variation trend differs from that of the present experiment, the evolution of the friction coefficient is still mainly attributed to changes in the frictional contact interface [46,47].
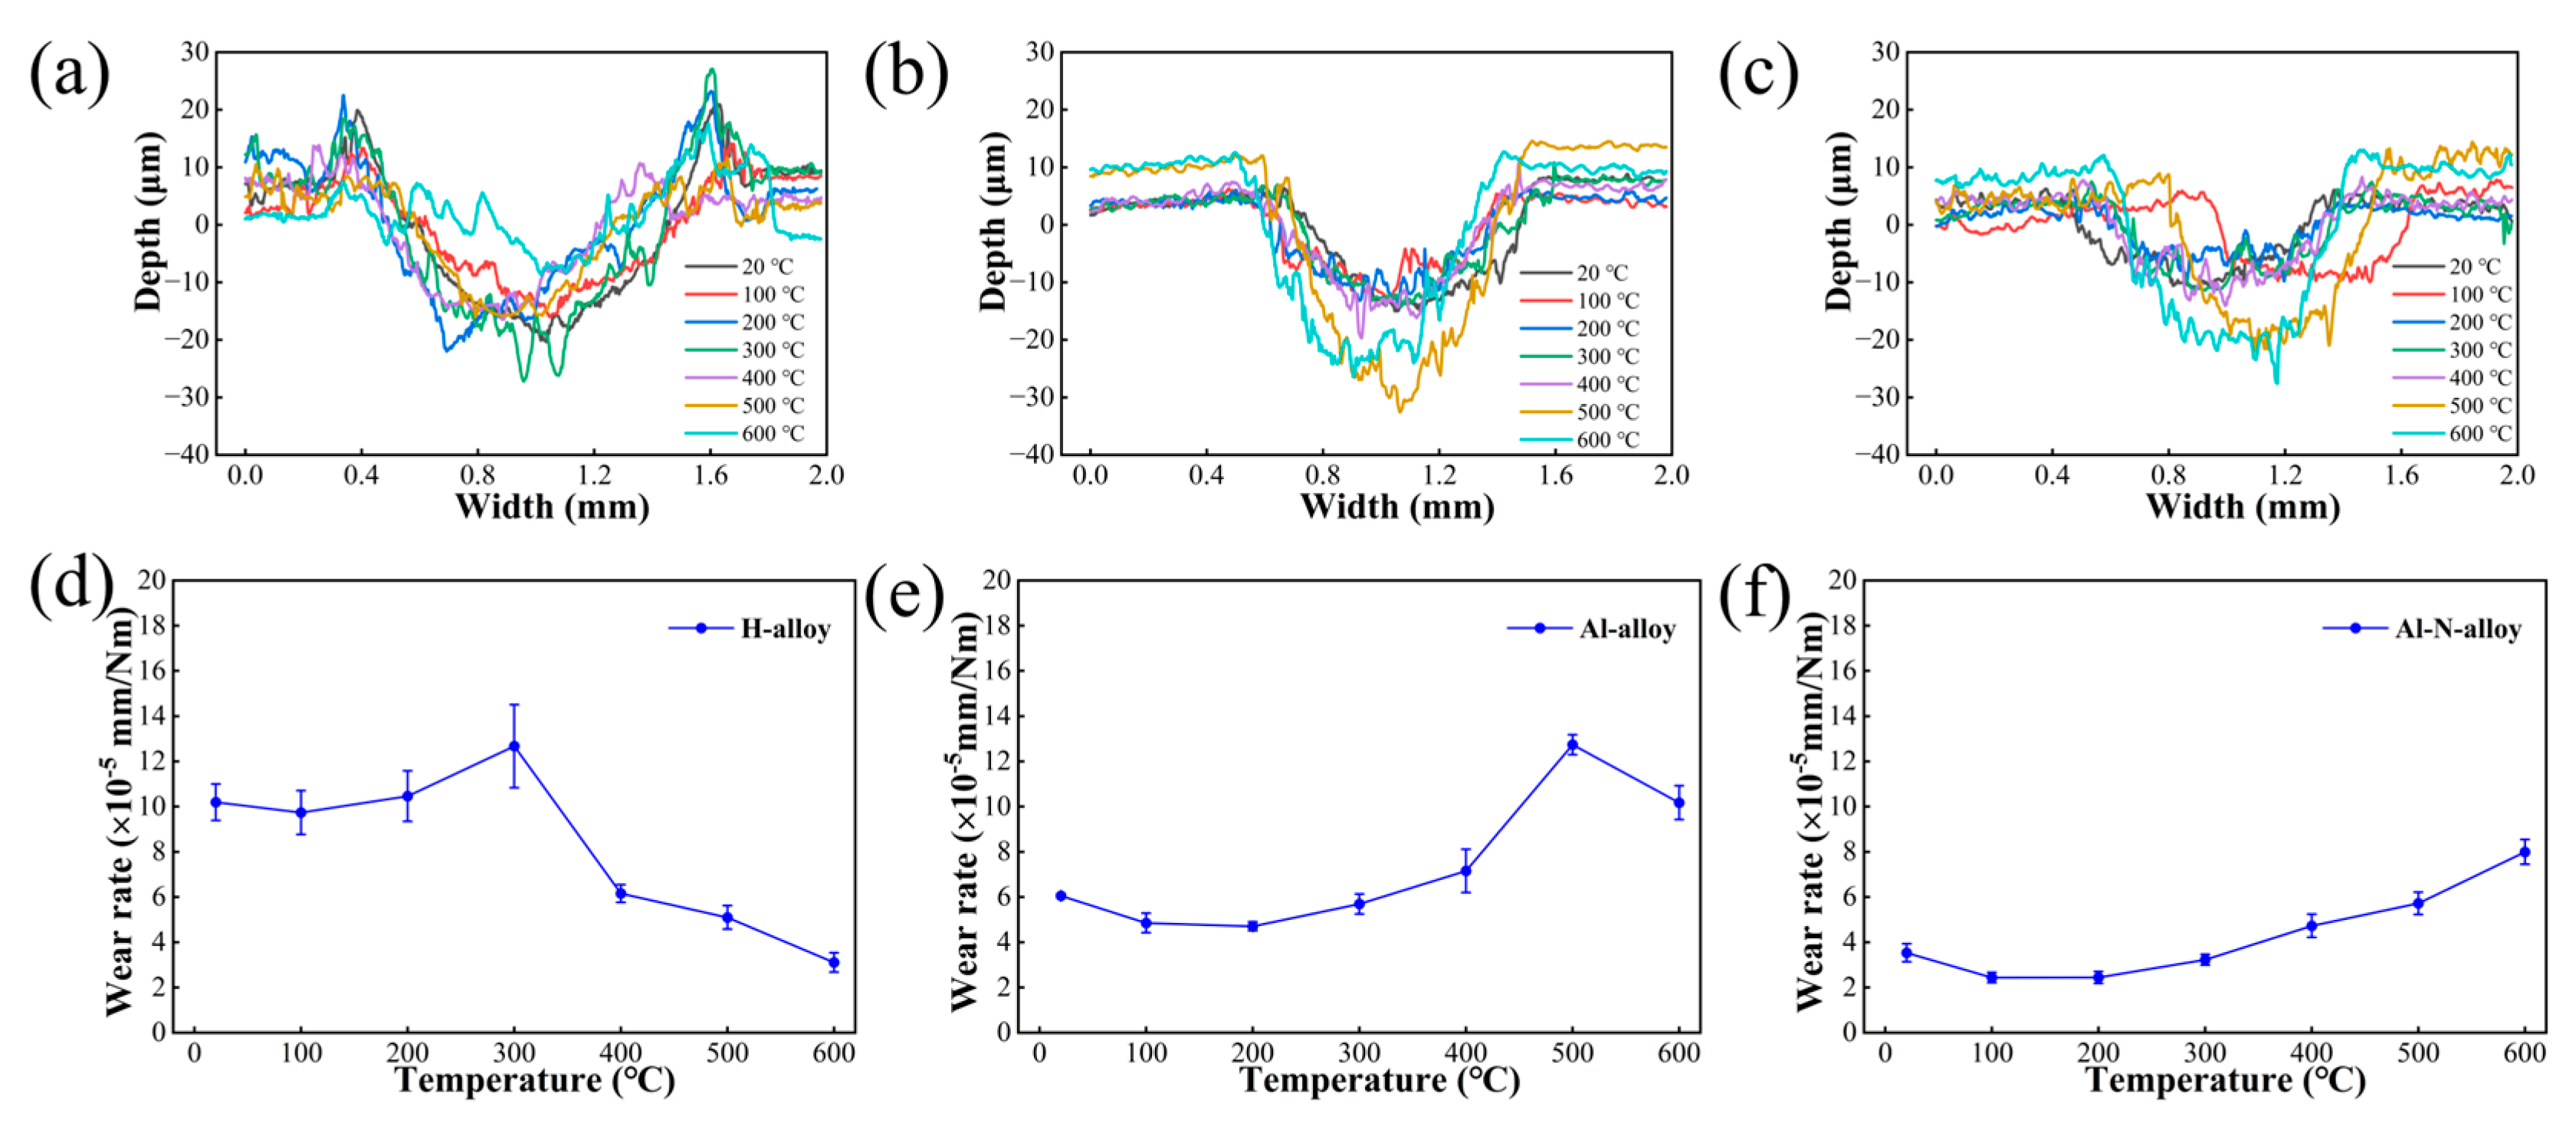
Figure 8b shows the cross-sectional profile of the wear track of the Al-alloy. Material pile-up is clearly observable at both ends of the scratch, providing direct evidence of plastic deformation and material displacement along the scratch edges. For different wear depths, the involved material structures are also different. With increasing temperature, the depths of the wear tracks are approximately 22.81 μm, 17.66 μm, 18.97 μm, 21.81 μm, 25.77 μm, 46.71 μm, and 36.96 μm, respectively. As the depth increases, the contact interface progressively accesses different zones of the coating, from the near-surface region to deeper layers, thereby altering the underlying wear mechanisms. The temperature range of 20–400 °C corresponds to Layer (III), and the temperature range of 500–600 °C corresponds to the (IDZ) layer.
Figure 8c shows the cross-sectional profile of the wear track of the Al-N-alloy. The depths of the wear tracks are approximately 13.80 μm, 11.01 μm, 10.51 μm, 12.79 μm, 16.80 μm, 24.64 μm, and 31.67 μm, respectively, over the temperature range of 20–600 °C. It can be seen from Figure 3 that the thickness of the Al-N co-infiltrated layer is approximately 17.4 μm (corresponding to layer (I) in Figure 3b), and the second layer is an aluminized layer with a thickness of about 13.5 μm (corresponding to layer (II) in Figure 3b). Therefore, it can be concluded that in the temperature range of 20–400 °C, the cross-sectional profile corresponds to the Al-N co-infiltrated layer, while at 500 °C and 600 °C, it corresponds to the aluminized layer.
The wear rate is governed by multiple interfacial mechanisms, including microstructural transformations, the formation of lubricious or oxide layers, and tribochemical reactions at the sliding interface [48,49,50]. The variation in the wear rates of three alloys with temperature is depicted in Figure 8d–f. The H-alloy exhibits a wear rate at 20 °C that is 1.6 times that of the Al-alloy and 2.8 times that of the Al-N-alloy. The wear resistance of the alloys shows a clear temperature dependent trend. At 200 °C and 300 °C, the H-alloy exhibits wear rates 2.2 times and 4.0–4.2 times greater than those of the Al-alloy and Al-N-alloy, respectively. However, this trend reverses at 600 °C, where the wear rates of both the Al-alloy and Al-N-alloy exceed that of the H-alloy by factors of 3.3 and 2.6, respectively. In conclusion, the Al-N-alloy exhibits excellent wear resistance over a wide temperature range, characterized by a low and stable wear rate [51].
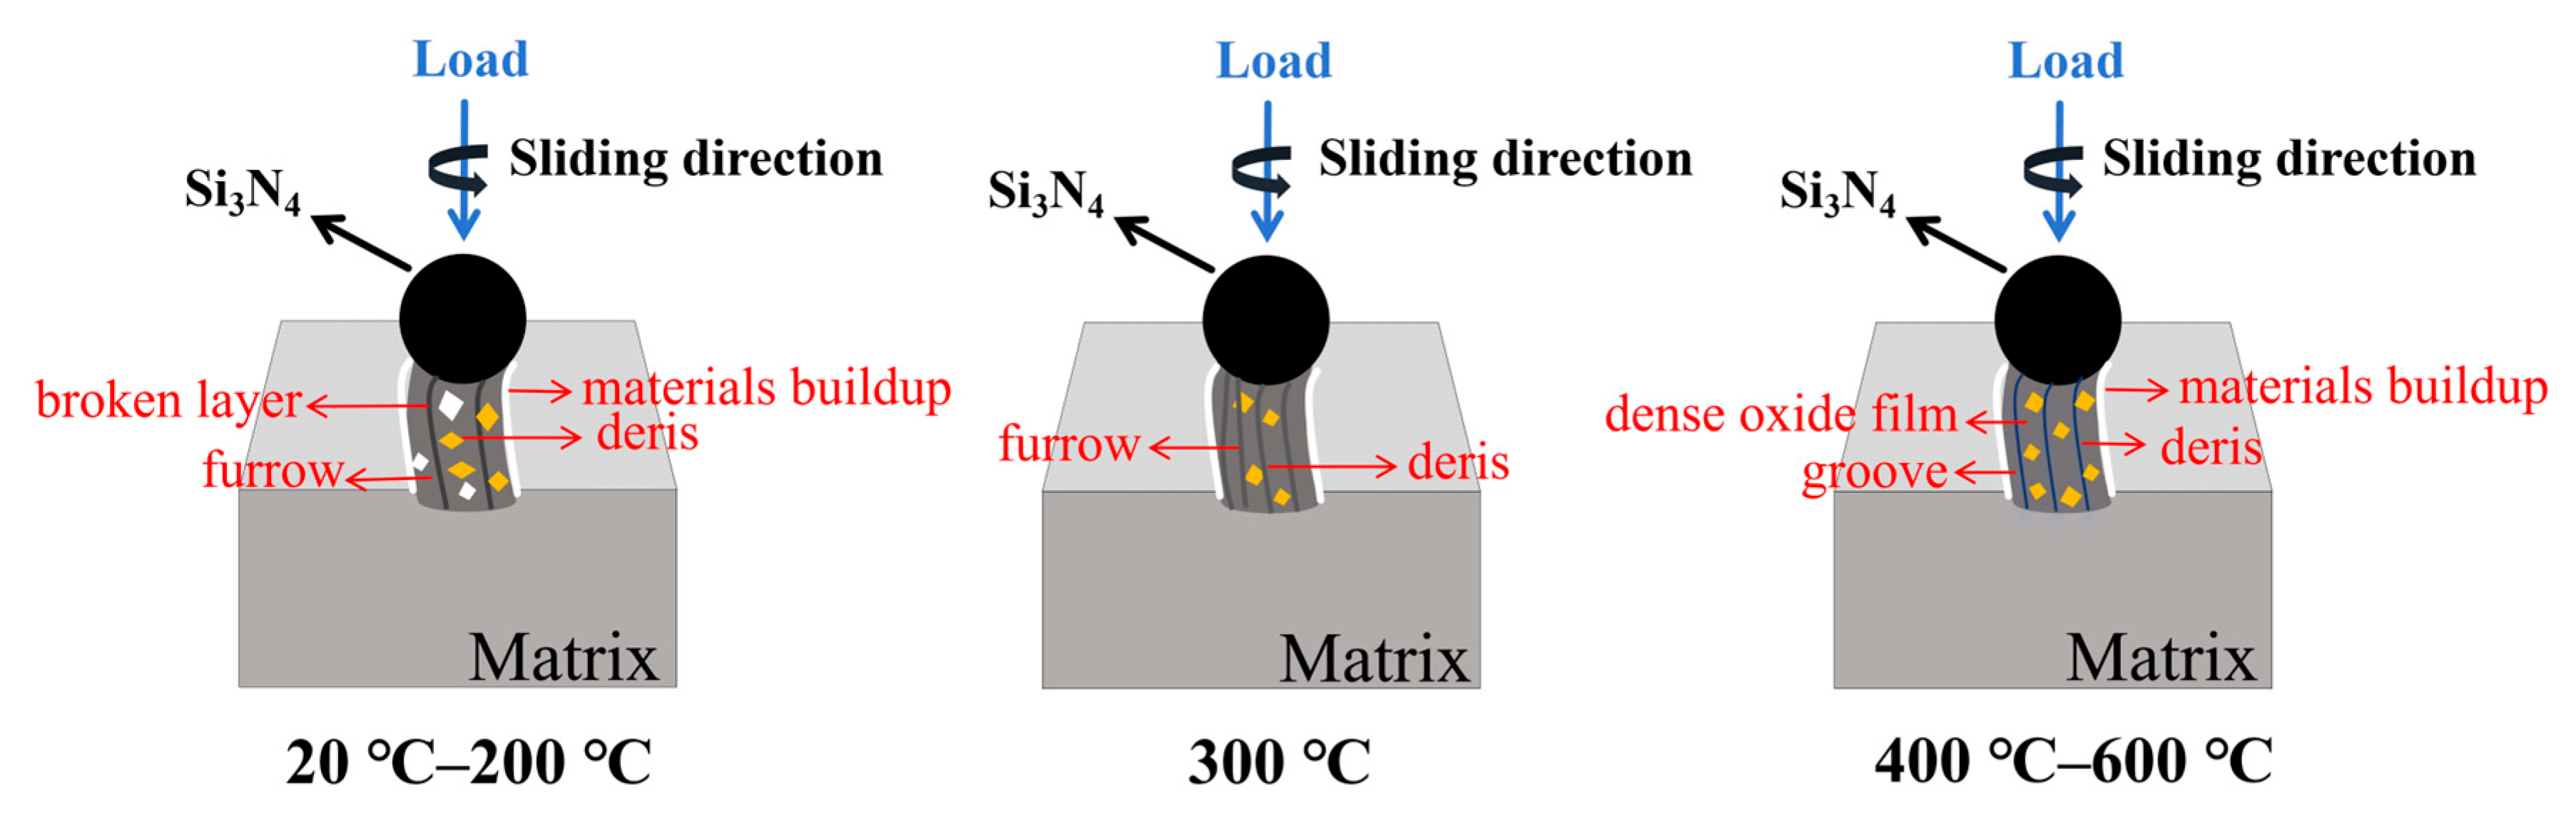
The wear rate of the H-alloy gradually increases in the temperature range of 20–300 °C, which is attributed to the fact that its surface is covered with a layer of fragmented oxide. The local oxide film cannot offset the material softening effect caused by increasing temperature, and at this point, The observed increase in the wear rate can be primarily accounted for by the softening behavior of the alloy. At 300 °C, Progressive compaction and sintering of initially dispersed wear debris result in the formation of a coherent oxide layer through structural integration. At this critical temperature, a steady-state regime is established where oxide formation and frictional removal occur at comparable rates, resulting in maximum wear. In the temperature range of 300–600 °C, the wear rate of the H-alloy gradually decreases, coinciding with the formation of a continuous, dense oxide film on the worn surface. At this point, the oxidation process plays a dominant role. The dense oxide film effectively isolates the direct contact between the friction pair and the material surface, thereby maintaining continual protection on the sliding interface and dramatically lowering the material’s wear rate.
The wear rate of the Al-alloy shows a trend of first decreasing and then increasing. In the temperature range of 20–400 °C, the wear rate of the Al-alloy is lower than that of the H-alloy. This is because the aluminizing treatment provides the H-alloy with higher surface hardness and promotes the formation of an Al2O3 oxide film. Under high-temperature friction conditions, the Al-alloy exhibits higher wear rates than the H-alloy at both 500 °C and 600 °C, the oxidation-wear competition mechanism of intermetallic compounds is strongly affected by their environmental brittleness [52]. Even under predominant oxide film formation, the inherent brittleness of the material makes it highly sensitive to stress concentration and oxygen penetration, which triggers cracks and intensifies wear. The drop in Al content and rise in O and base metal content in EDS data at 500 °C (Table 3) confirm this breakdown.
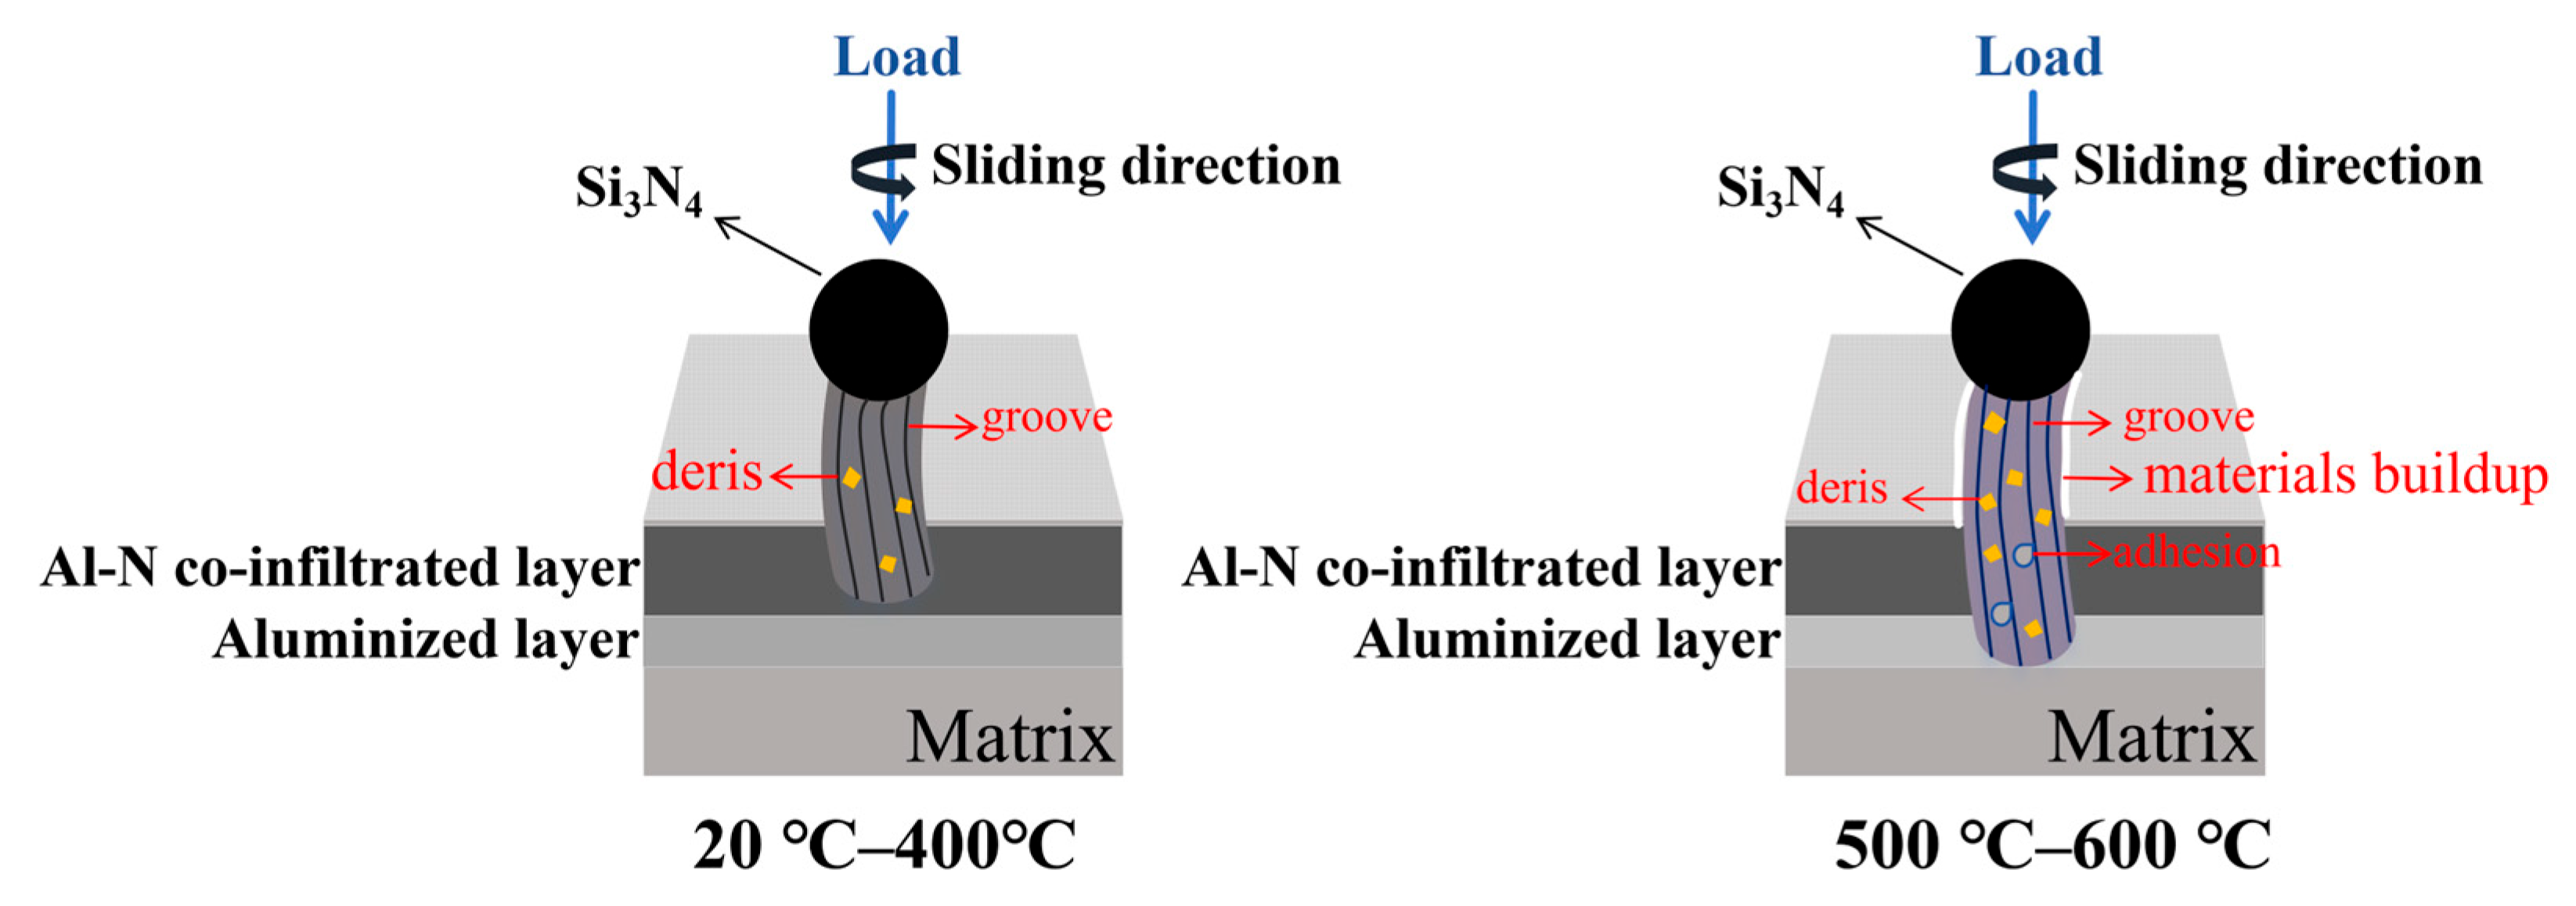
The Al-N-alloy exhibits the lowest and most stable wear rate within the temperature range of 20–500 °C, which is attributed to the formation of a modified layer with extremely excellent performance on its surface. The Al-N co-infiltration process not only infiltrates aluminum into the surface but also infiltrates nitrogen (N) simultaneously. Nitrogen reacts with elements such as aluminum (Al), chromium (Cr), and iron (Fe) to form hard phases including AlN, CrN, and FeN. The AlN phase not only has extremely high hardness, which can effectively resist abrasive wear and plastic deformation, but also exhibits better toughness than many intermetallic compounds [53,54,55]. This prevents the microcracks and delamination wear that the aluminized layer may suffer due to the brittleness, thereby ensuring excellent performance of the Al-N-alloy in the temperature range of 20–500 °C. Secondly, the introduction of nitrogen further improves the structure and properties of the surface oxide film. As the temperature increases, AlN itself oxidizes to form a dense Al2O3 film, while CrN also contributes to the formation of a stable Cr2O3 film or composite oxide film. This oxide film exhibits stronger adhesion, higher density, and higher resistance to cracking and spalling [56,57,58,59]. Even under frictional shear, it can be rapidly repaired, continuously isolating the substrate from the external environment and effectively preventing the inward diffusion of oxygen and the outward loss of material. This is the key reason why its high-temperature wear rate increases slowly and linearly, without severe spalling (the peak at 500 °C) as observed in the aluminized layer. At 600 °C, the wear rate begins to increase sharply. As temperatures approach and exceed 500 °C, these nitrides coarsen or dissolve, leading to a dramatic softening of the coating and a loss of its load-bearing capacity (as confirmed by the precipitous drop in N content in EDS data at 500 °C, Table 3).

3.5.2. Analysis of Wear Mechanisms and Surface Morphology

To prevent the manuscript from becoming overly lengthy while still providing representative data, we have strategically selected: The wear morphology and elemental distribution at the test temperatures of 20 °C, 300 °C, and 600 °C are presented herein. SEM and EDS maps for other test temperatures are provided in the Supplementary Materials (Figures S8–S10).
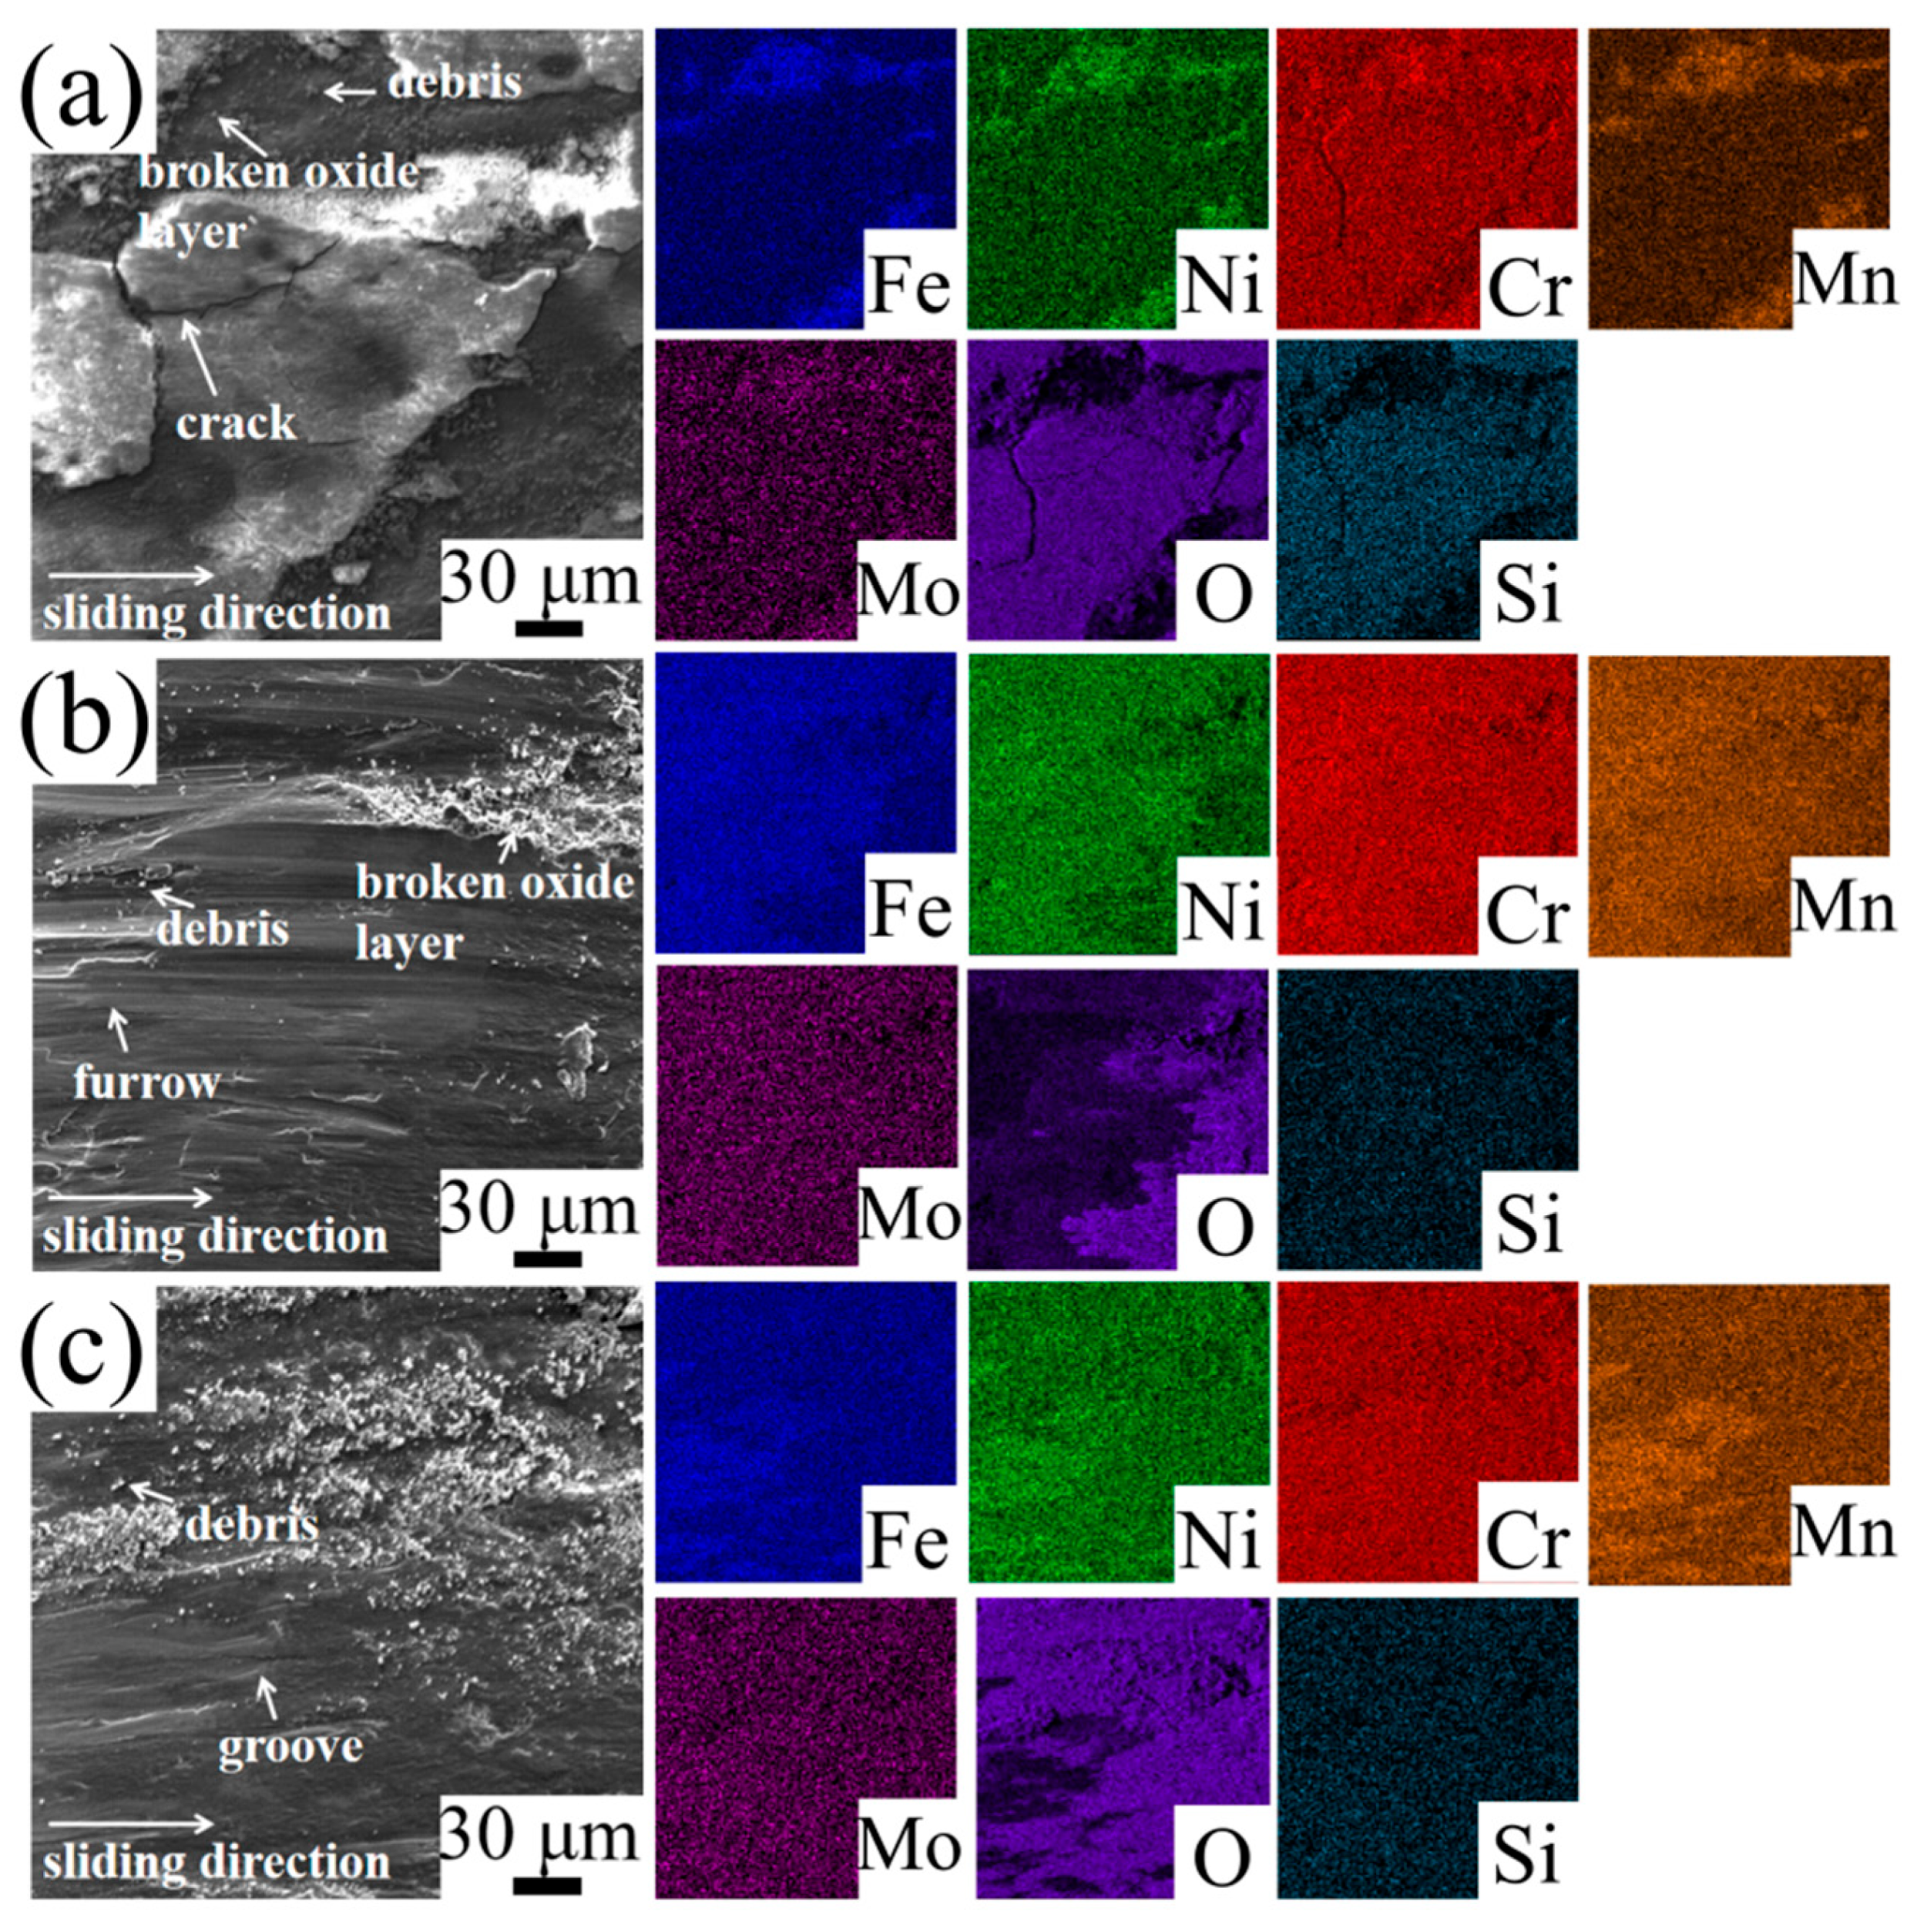
The wear morphologies and EDS mapping of the H-alloy at different temperatures are shown in Figure 9. Wear morphologies demonstrate a systematic trend with increasing temperature. In the temperature range of 20–200 °C, wear debris and fragmented oxide layers are visible on the worn surface, exhibiting the typical characteristics of adhesive wear. The elemental composition of the worn H-alloy surface, as determined by EDS analysis, is summarized in Table 3. From the oxygen content and its distribution, it can be inferred that oxidative wear occurs in the temperature range of 20–200 °C. As the temperature increases, the surface oxygen content decreases, oxides migrate, the wear rate rises continuously, and reaches its maximum value at 300 °C. This indicates that adhesive wear dominates the material failure mechanism in this temperature range. The combined effect of friction and heat causes material softening, thereby increasing the tendency for adhesive wear. At 400 °C, the worn surface exhibits shallow, fine grooves accompanied by minor wear debris distributed across the wear track. Beyond a critical temperature threshold, accelerated oxide formation outpaces frictional removal, leading to a distinct decline in the wear rate. At this stage, the dominant wear mechanisms transition to abrasive and oxidative wear. With further temperature elevation to 500–600 °C, intensified oxidation leads to oxidative wear becoming the predominant material removal mechanism, and obvious grooves and a large amount of wear debris are visible on the worn surface; the wear mechanism is still dominated by the combination of abrasive wear and oxidative wear.
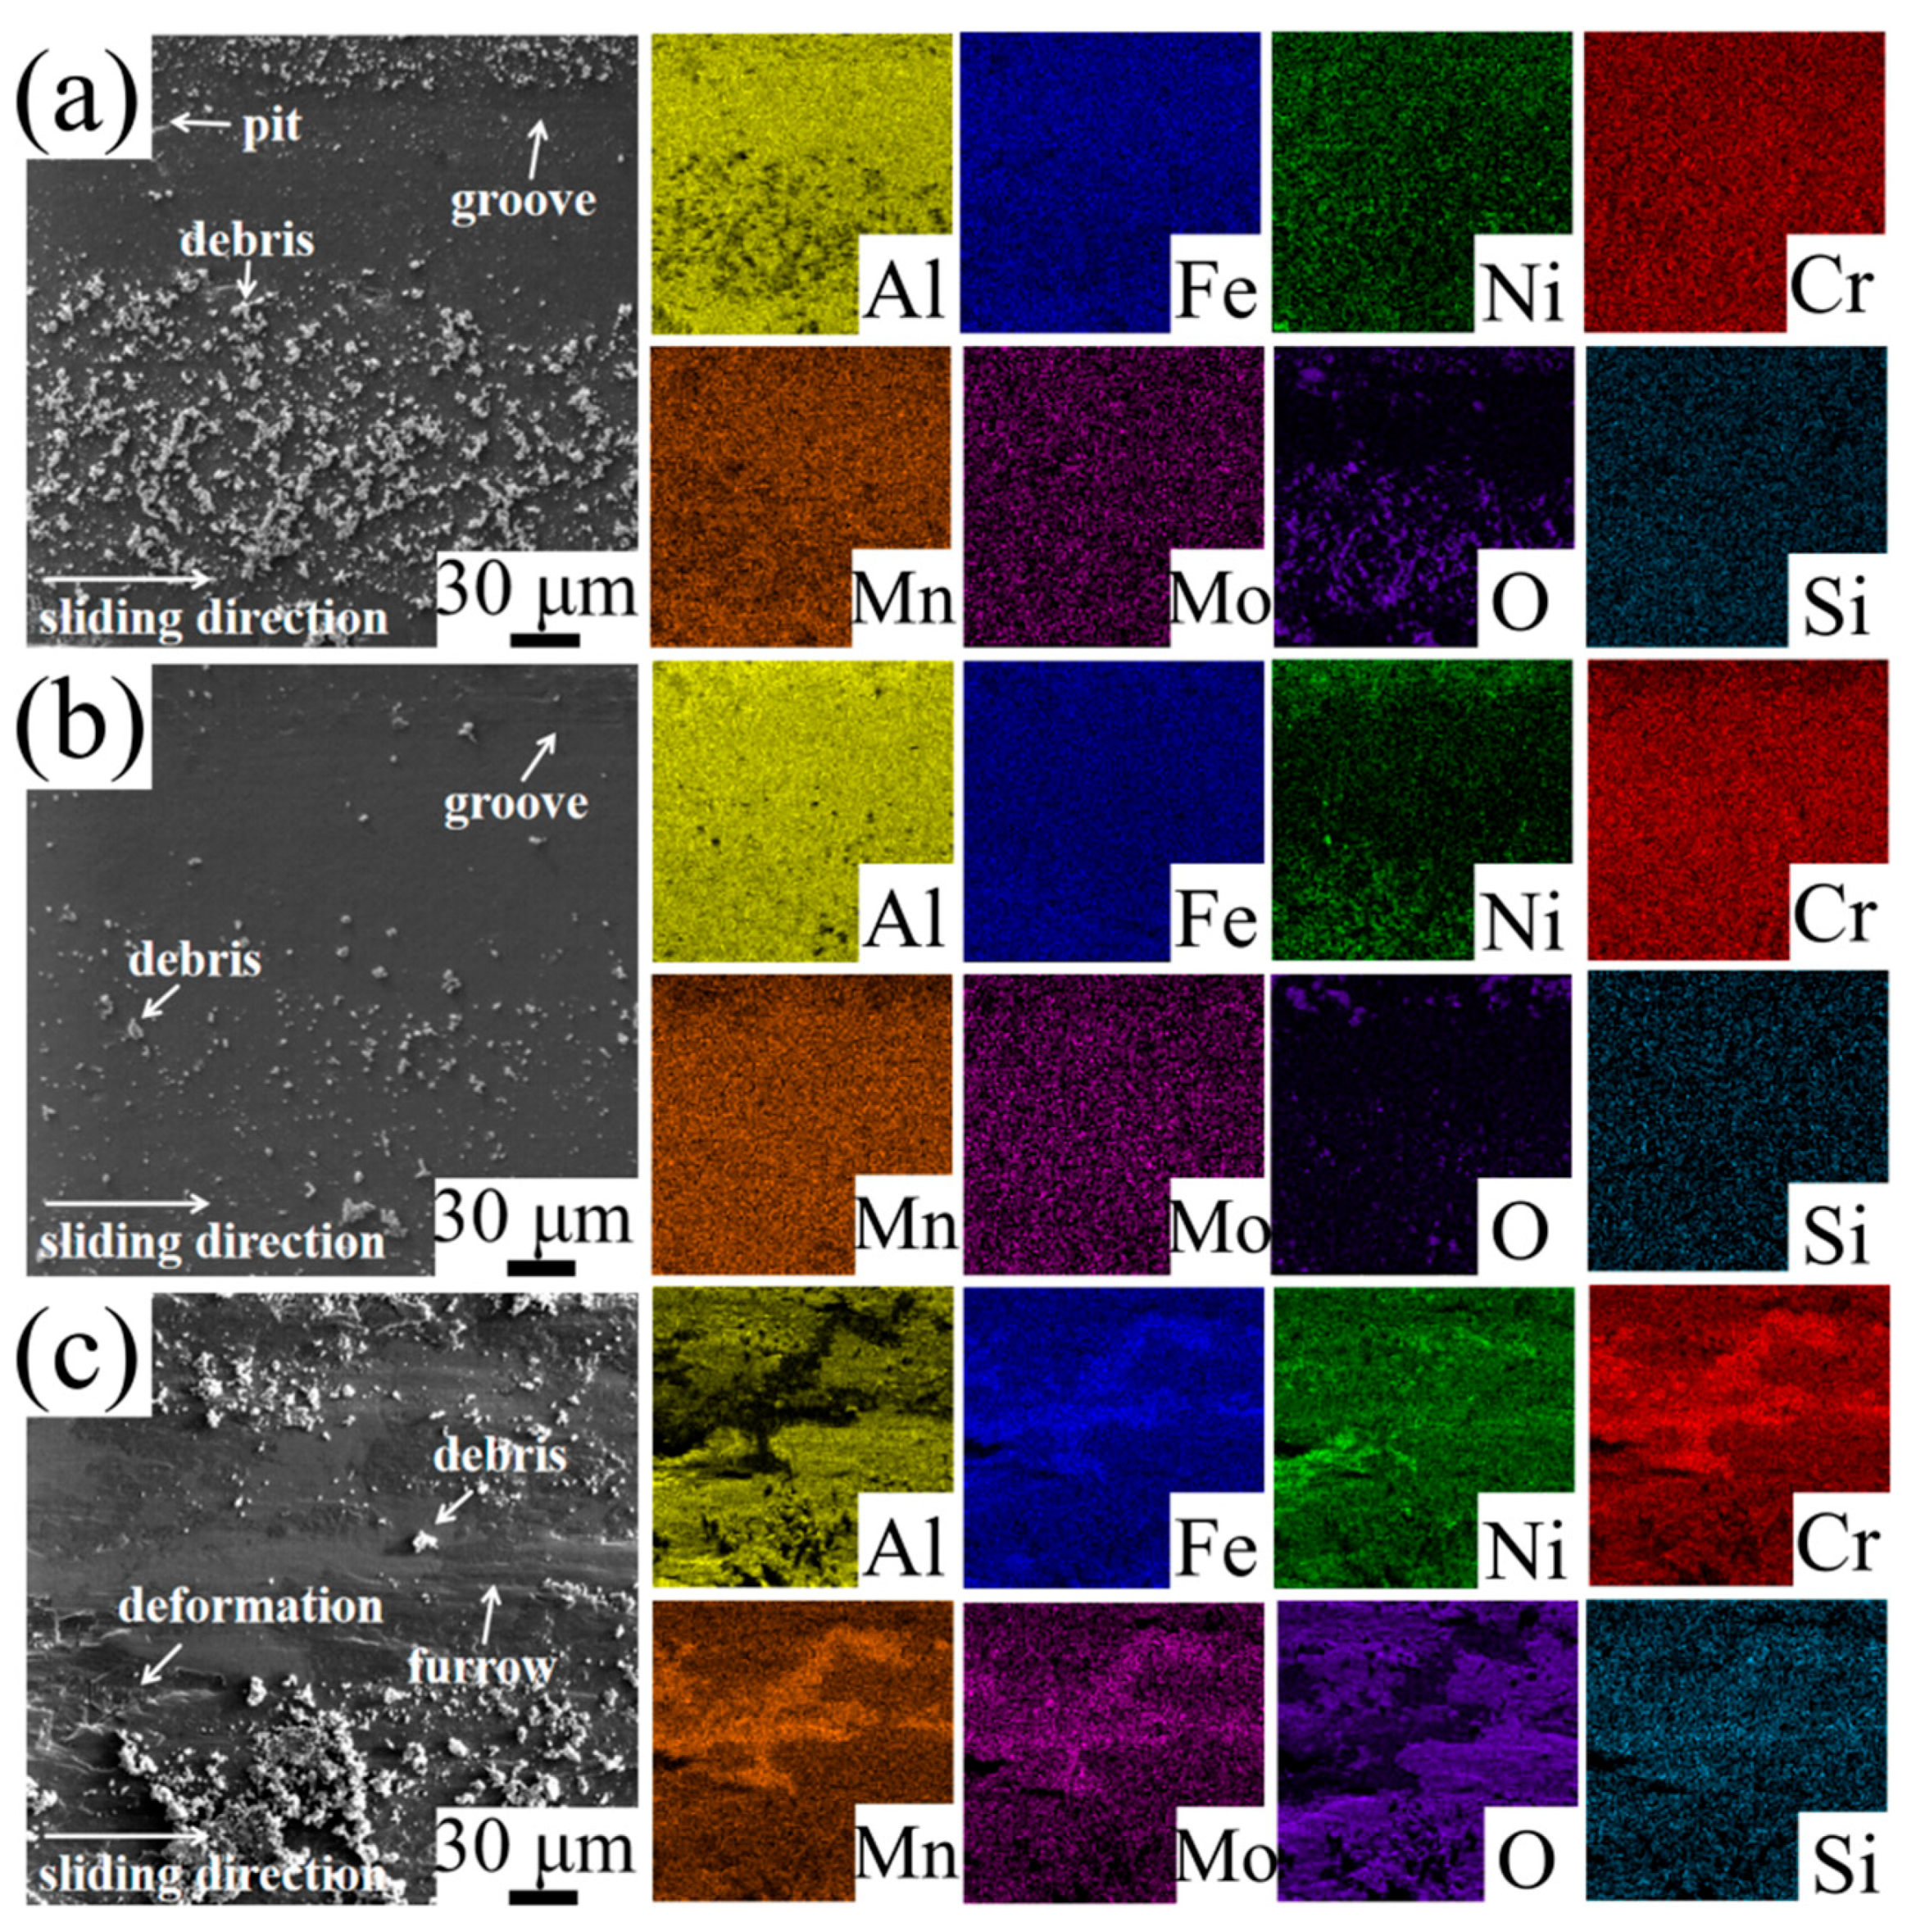
The wear morphologies and EDS mapping of the Al-alloy at different temperatures are shown in Figure 10. At 20 °C, the worn surface is covered with a large number of wear debris of varying sizes, with obvious plastic deformation marks and relatively deep grooves. The surface is rough with severe material removal. It can also be concluded from the oxygen content in Table 3 that oxidative wear also occurs at 20 °C. At this point, the wear mechanism consists of adhesive wear and oxidative wear. A progressive rise in oxygen content leads to a corresponding intensification of surface oxidation as the temperature increases from 100 to 400 °C. As wear debris continue to recede, the surface evolves toward a smoother morphology with reduced asperities. The wear mechanism is mild adhesive wear and oxidative wear. When the temperature rises to 500 °C and 600 °C, the oxygen content also increases. Marked debris buildup is observed alongside extensive plastic deformation zones and pronounced grooves, suggesting severe adhesive and oxidative wear. High temperatures may soften the substrate, causing the oxide film to crack and spall due to insufficient support. After local and fresh metal is exposed, transient adhesion occurs, leading to an increase in wear rate.
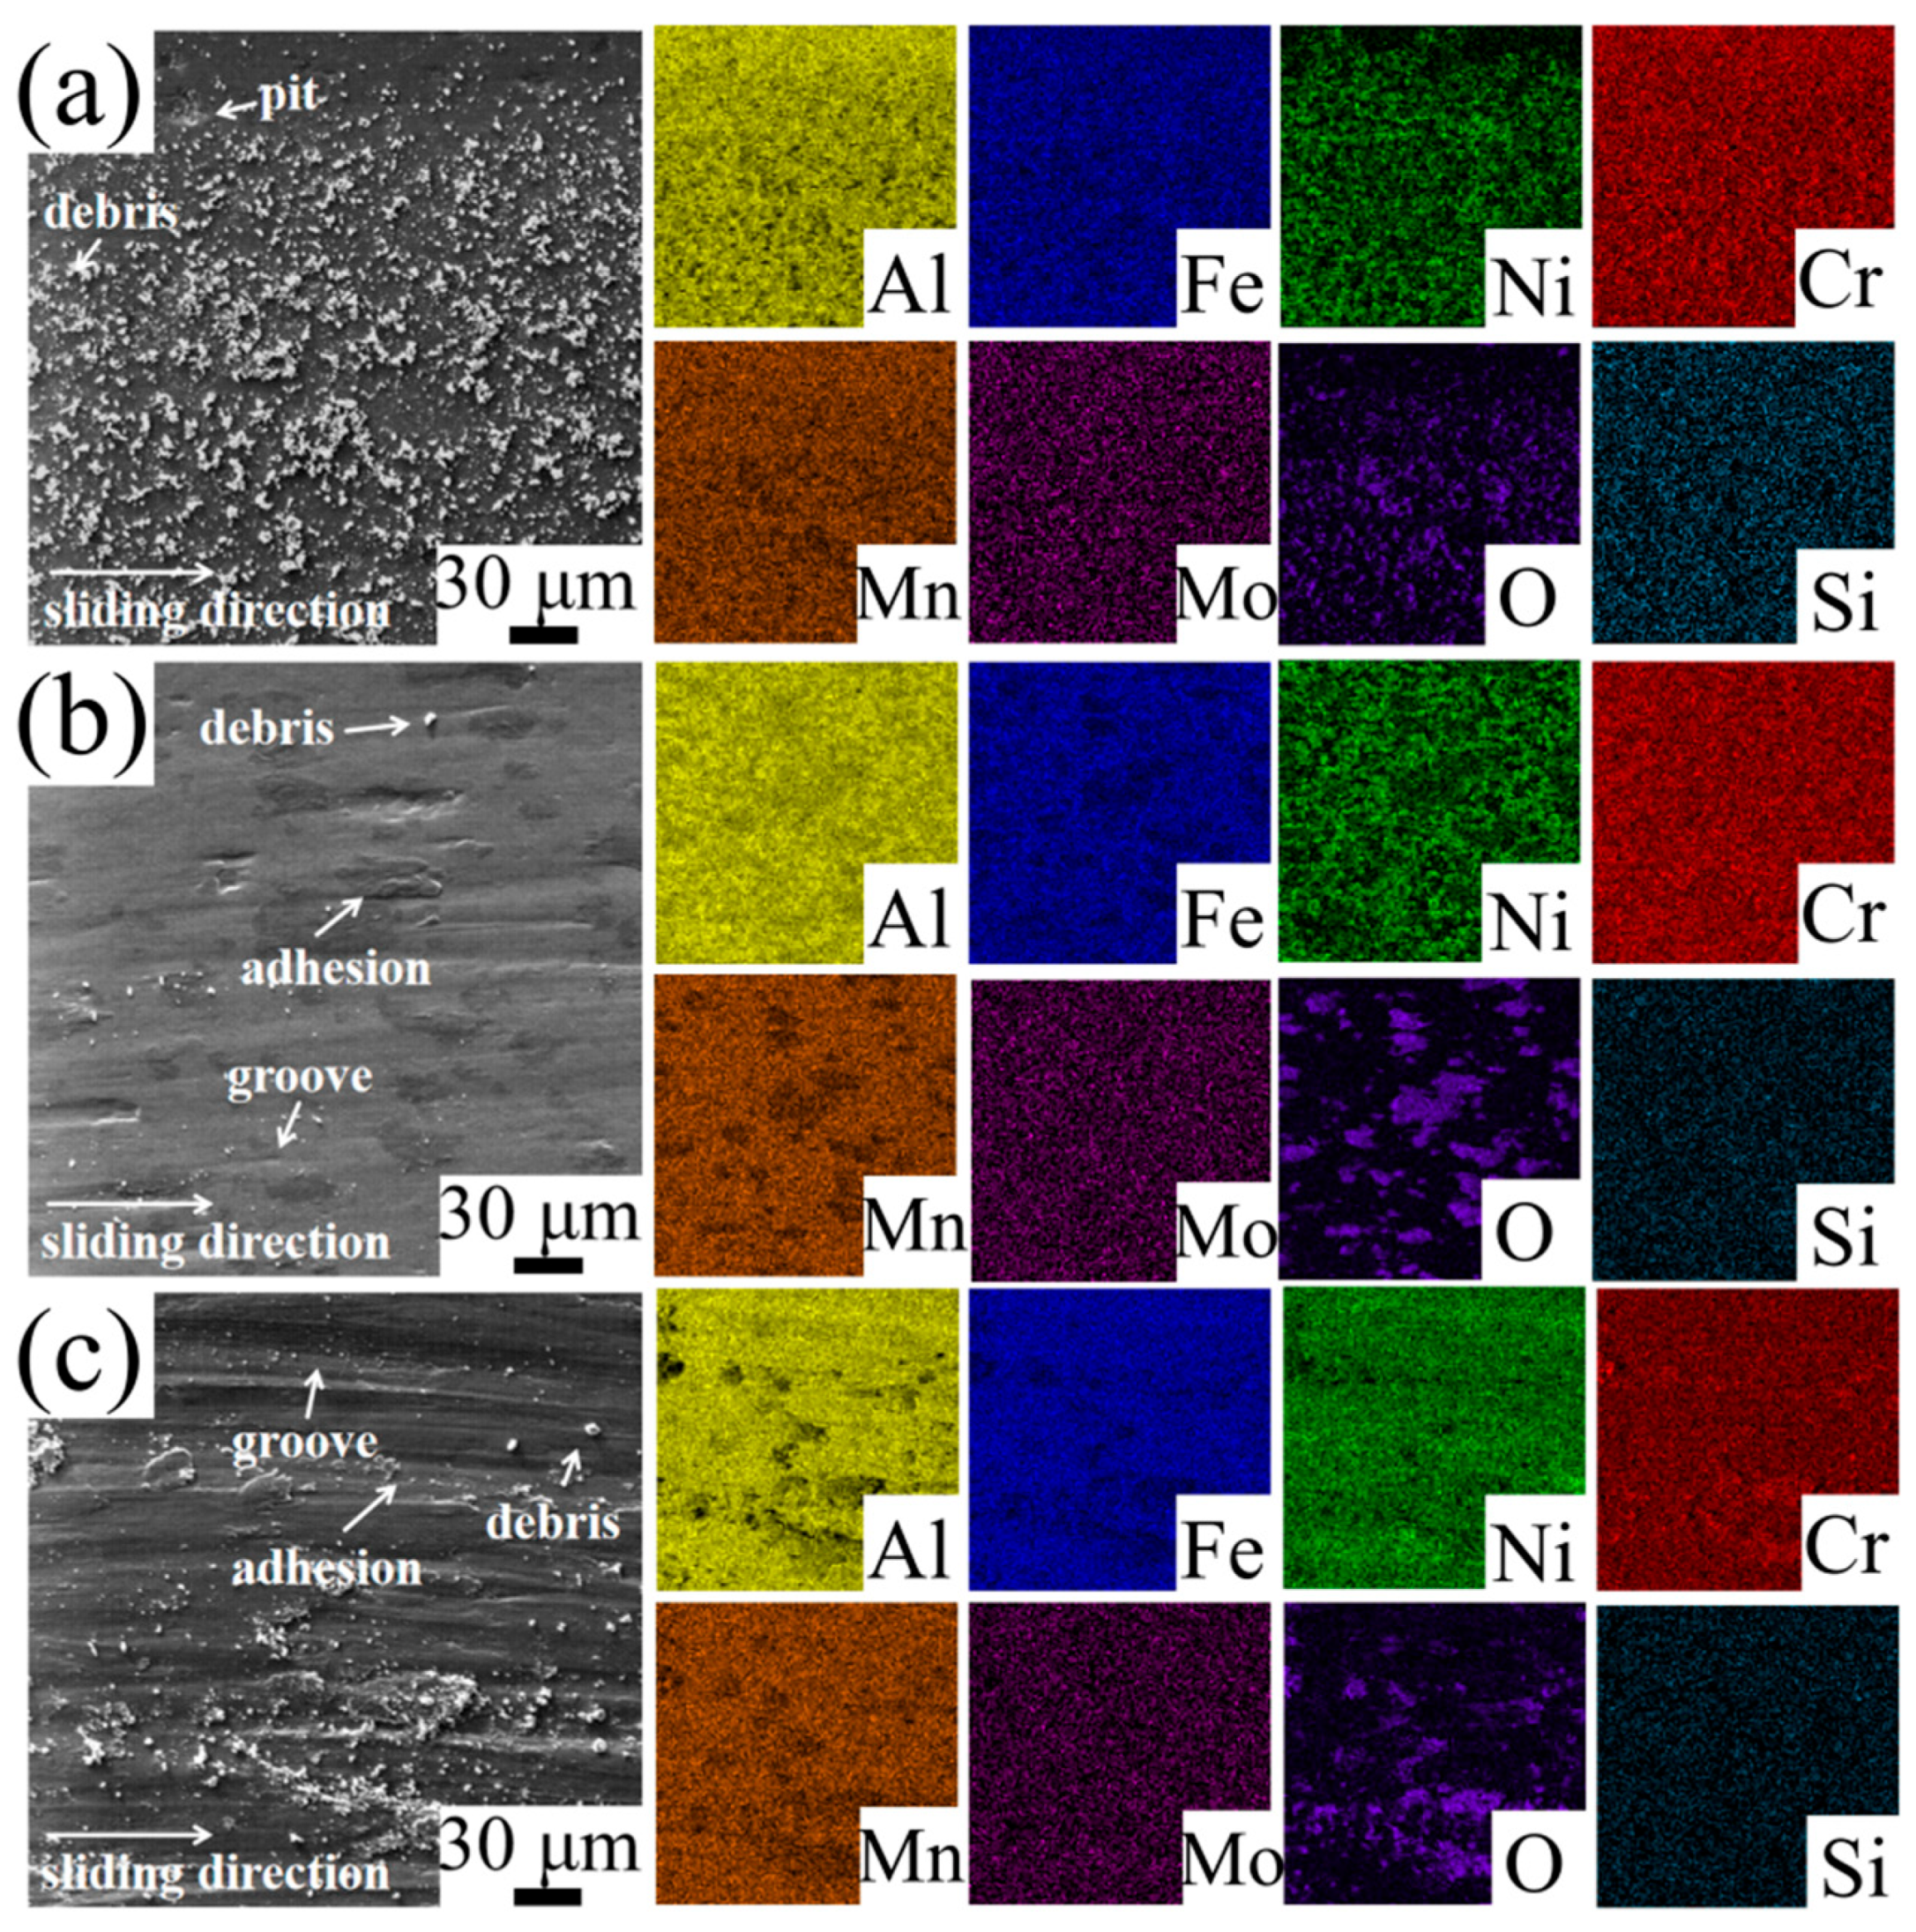
Figure 11 presents the temperature-dependent wear morphology evolution and corresponding EDS elemental distribution of the Al-N alloy. The abrasive grooves on the worn surface appear markedly shallower than those of the hot-rolled HEA, which can be attributed to the comparable hardness between the generated wear debris and the Al-N co-infiltrated layer. This hardness match effectively mitigates the plowing effect during the wear process. In the temperature range of 20–300 °C, the worn surface gradually becomes smoother, with a decrease in generated wear debris and spalling. Therefore, the dominant surface wear mechanism is the polishing effect. At 400 °C, a small amount of wear debris and grooves appear, and the wear mechanism at this point is mild adhesive wear and oxidative wear. In the temperature range of 500–600 °C, the oxygen content increases rapidly, a large amount of wear debris and deep grooves are generated on the worn surface, and the wear mechanism changes to severe adhesive wear and oxidative wear. The cracking rate of the oxide film exceeds its formation rate, leading to an increase in wear rate.
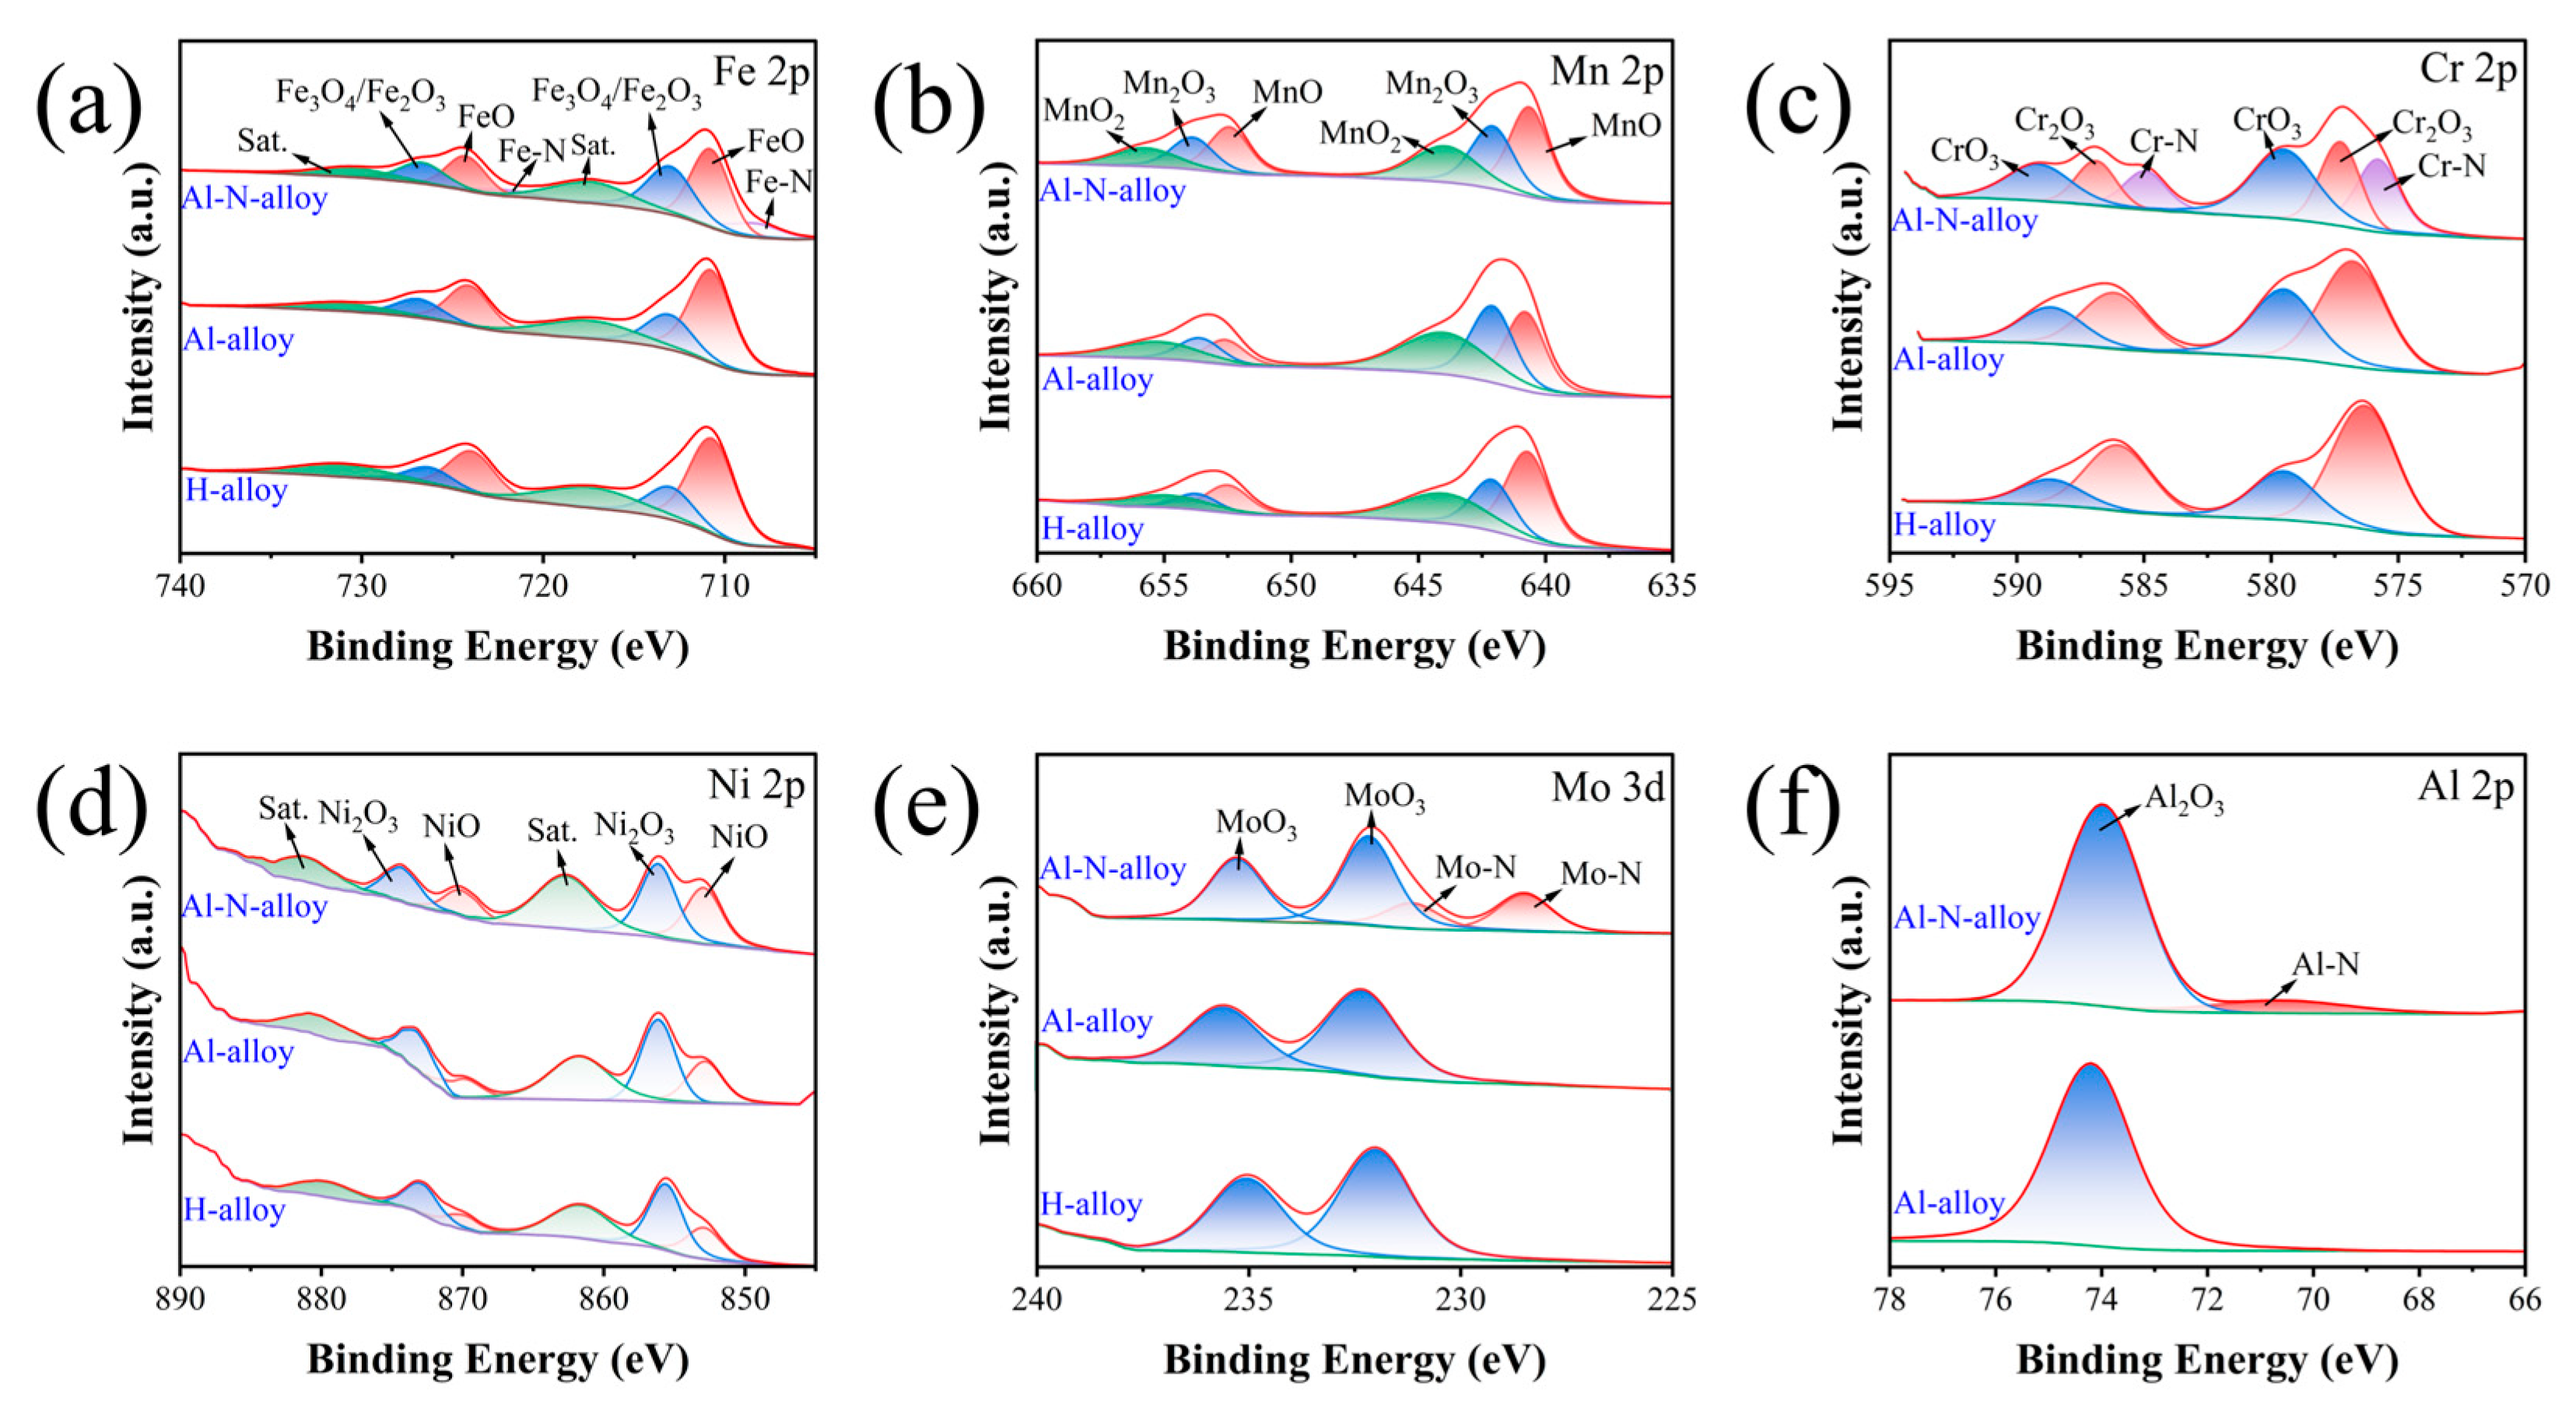
Figure 12 displays the XPS results of the worn surfaces for the three alloys at 300 °C, while the corresponding spectra at 20 °C and 600 °C are provided in Supplementary Figures S14 and S15. During the sliding process, substantial frictional heat generated leads to surface oxidation of the alloys, resulting in the formation of metal oxides. Across the temperature range of 20–600 °C, the worn surfaces are covered with abundant oxides, including Fe3O4, Fe2O3, FeO, MnO, Mn2O3, MnO2, Cr2O3, CrO3, Ni2O3, NiO, MoO3, and Al2O3. In the case of the Al-N alloy, nitrides of Cr, Fe, and Al were also detected. At 20 °C, distinct peaks corresponding to Fe, Mn, Cr, Ni, Mo, and Al are evident. However, these metallic peaks diminish and eventually disappear at 300 °C and 600 °C.
Based on the aforementioned morphological characteristics, we have proposed corresponding wear mechanism models, as illustrated in Figure 13 and Figure 14.

4. Conclusions

In this study, hot-rolled Fe40Mn19Cr20Ni20Mo1 HEA was subjected to Al-N co-infiltration treatment. The microstructures and mechanical properties of the H-alloy, Al-alloy, and Al-N-alloy were characterized. The hardness of the coating and the bonding strength of the infiltrated layer were tested, and the growth kinetics of the Al-N co-infiltrated layer were established. Subsequently, the tribological behavior of the HEA at different temperatures was discussed. The main conclusions are as follows:
(1)
The Al-N co-infiltration treatment significantly enhances the hardness of the alloy. The Al-alloy was prepared by aluminizing the H-alloy at 800 °C for 9 h. The Al-N-alloy was obtained by plasma nitriding the Al-alloy at 550 °C for 10 h. The hardness of the H-alloy, Al-alloy and Al-N-alloy is 178 HV, 592 HV and 993 HV, respectively.
(2)
By fitting the growth kinetics, the activation energy for diffusion in the Al-N-alloy is determined to be 86.582 kJ/mol, while the diffusion activation energy of the FCC Fe40Mn20Cr20Ni20 HEA during plasma nitriding is 41.388 kJ/mol. The migration of nitrogen atoms in the Al-N co-infiltrated layer used in this study requires overcoming a higher energy barrier, making its diffusion kinetic process more difficult.
(3)
The Al-N co-infiltrated alloy exhibits excellent tribological properties over a wide temperature range. The average friction coefficients of the H-alloy, Al-alloy, and Al-N-alloy decrease with increasing temperature. Specifically, in the temperature range of 20–400 °C, the average friction coefficient of the H-alloy fluctuates between 0.58 and 0.79. The average coefficient of friction for the Al-alloy ranged from 0.45 to 0.55, while that of the Al-N-alloy remained stable at 0.55. The wear rates of the H-alloy and Al-alloy show a trend of first increasing and then decreasing as the temperature rises. The wear rate of the Al-N-alloy remains stable below 400 °C, being substantially lower than those of the H-alloy and Al-alloy. Beyond this threshold, it increases with further temperature elevation.
(4)
The wear mechanism of the H-alloy is mainly adhesive wear, oxidative wear, and abrasive wear. As the temperature increases, the oxidative wear becomes more severe. The wear mechanism of the Al-alloy is mainly oxidative wear and adhesive wear. The wear mechanism of the Al-N-alloy is mainly the polishing effect, oxidative wear, and adhesive wear.

Supplementary Materials

The following supporting information can be downloaded at: https://www.mdpi.com/article/10.3390/lubricants13120509/s1, Figure S1. Schematic diagram of classification of VDI 3198 indentation test and coating adhesion; Figure S2. Rockwell indentation morphology of different aluminizing processes: (a) 800 °C 3 h; and (b) 800 °C 6 h; and (c) 800 °C 9 h; and (d) 850 °C 3 h; and (e) 850 °C 6 h; and (f) 850 °C 9 h; and (g) 900 °C 3 h; and (h) 900 °C 6 h; and (i) 900 °C 9 h; Figure S3. Rockwell indentation morphology and corresponding wear curves of different aluminized alloys after plasma nitriding at 600 °C for 10 h: (a,d) 800 °C 3 h; (b,e) 800 °C 6 h; (c,f) 800 °C 9 h; Figure S4. Rockwell indentation morphology of aluminum alloy under different nitriding processes: (a) 500 °C 2 h; and (b) 500 °C 5 h; and (c) 500 °C 10 h; and (d) 550 °C 2 h; and (e) 550 °C 5 h; and (f) 550 °C 10 h; and (g) 600 °C 2 h; and (h) 600 °C 5 h; and (i) 600 °C 10 h; Figure S5. SEM image of the cross-section of aluminized Fe40Mn19Cr20Ni20Mo1 HEA; Figure S6. SEM image of the cross-section of Al-N co-infiltrated Fe40Mn19Cr20Ni20Mo1 HEA; Figure S7. SEM image of the Fe40Mn19Cr20Ni20Mo1 HEA; Figure S8. Wear morphology and EDS surface spectrum of hot-rolled HEA at different temperatures: (a) 100 °C; (b) 200 °C; (c) 400 °C; (d) 500 °C; Figure S9. Wear morphology and EDS surface spectrum of aluminized HEA at different temperatures: (a) 10 °C; (b) 200 °C; (c) 400 °C; (d) 500 °C; Figure S10. Wear morphology and EDS surface spectrum of aluminium-nitrogen co-infiltration HEA at different temperatures: (a) 10 °C; (b) 200 °C; (c) 400 °C; (d) 500 °C; Figure S11. Low-magnification wear scar morphology and EDS surface spectrum of hot-rolled HEA at different temperatures: (a) 20 °C; (b) 100 °C; (c) 200 °C; (d) 300 °C; (e) 400 °C; (f) 500 °C; (g) 600 °C; Figure S12. Low-magnification wear scar morphology and EDS surface spectrum of aluminized HEA at different temperatures: (a) 20 °C; (b) 100 °C; (c) 200 °C; (d) 300 °C; (e) 400 °C; (f) 500 °C; (g) 600 °C; Figure S13. Low-magnification wear scar morphology and EDS surface spectrum of aluminium-nitrogen co-infiltration HEA at different temperatures: (a) 20 °C; (b) 100 °C; (c) 200 °C; (d) 300 °C; (e) 400 °C; (f) 500 °C; (g) 600 °C; Figure S14. High-resolution XPS spectra of individual elements from the worn surfaces of three alloys after sliding against a silicon nitride ball at 20 °C; Figure S15. High-resolution XPS spectra of individual elements from the worn surfaces of three alloys after sliding against a silicon nitride ball at 600 °C; Table S1. Hardness and wear rate of Al-alloy under different nitriding processes; Table S2. The EDS spot scan in Figure S6.

Author Contributions

Z.H.: Writing—original draft, Writing—review & editing, Data curation, Formal analysis, Investigation, Visualization, Methodology. X.Z.: Investigation. X.J. and M.Z.: Finding acquisition, Resources. H.Y.: Data curation, Finding acquisition, Project administration, Resources, Supervision, Investigation, Writing—review & editing. J.Q.: Data curation, Finding acquisition, Project administration, Resources, Supervision, Investigation, Writing—review & editing. All authors have read and agreed to the published version of the manuscript.

Funding

This research was funded by [the National Natural Science Foundation of China] grant number [Nos. 52271110 and 52574444] And The research was funded by [the National Natural Science Foundation of China] grant number [No. 52301217].

Data Availability Statement

Data will be made available on request.

Acknowledgments

Junwei Qiao would like to acknowledge the support of the National Natural Science Foundation of China (Nos. 52271110 and 52574444). Xi Jin would like to acknowledge the financial support of the National Natural Science Foundation of China (No. 52301217).

Conflicts of Interest

The authors declare that they have no known competing financial interests or personal relationships that could have appeared to influence the work reported in this paper.

References

  1. Cantor, B.; Chang, I.T.H.; Knight, P.; Vincent, A.J.B. Microstructural development in equiatomic multicomponent alloys. Mater. Sci. Eng. A 2004, 375–377, 213–218. [Google Scholar] [CrossRef]
  2. Yeh, J.-W.; Chen, S.K.; Lin, S.-J.; Gan, J.-Y.; Chin, T.-S.; Shun, T.-T.; Tsau, C.-H.; Chang, S.-Y. Nanostructured high-entropy alloys with multiple principal elements: Novel alloy design concepts and outcomes. Adv. Eng. Mater. 2004, 6, 299–303. [Google Scholar] [CrossRef]
  3. Miracle, D.B.; Senkov, O.N. A critical review of high entropy alloys and related concepts. Acta Mater. 2017, 122, 448–511. [Google Scholar] [CrossRef]
  4. Zhang, Y.; Zuo, T.T.; Tang, Z.; Gao, M.C.; Dahmen, K.A.; Liaw, P.K.; Lu, Z.P. Microstructures and properties of high-entropy alloys. Prog. Mater. Sci. 2014, 61, 1–93. [Google Scholar] [CrossRef]
  5. George, E.P.; Raabe, D.; Ritchie, R.O. High-entropy alloys. Nat. Rev. Mater. 2019, 4, 515–534. [Google Scholar] [CrossRef]
  6. Gludovatz, B.; Hohenwarter, A.; Catoor, D.; Chang, E.H.; George, E.P.; Ritchie, R.O. A fracture-resistant high-entropy alloy for cryogenic applications. Science 2014, 345, 1153–1158. [Google Scholar] [CrossRef] [PubMed]
  7. Liu, W.H.; Wu, Y.; He, J.Y.; Nieh, T.G.; Lu, Z.P. Grain growth and the Hall–Petch relationship in a high-entropy FeCrNiCoMn alloy. Scr. Mater. 2013, 68, 526–529. [Google Scholar] [CrossRef]
  8. Shi, Y.Z.; Yang, B.; Liaw, P.K. Corrosion-Resistant High-Entropy Alloys: A Review. Metals 2017, 7, 43. [Google Scholar] [CrossRef]
  9. Lu, Y.; Huang, H.; Gao, X.; Ren, C.; Gao, J.; Zhang, H.; Zheng, S.; Jin, Q.; Zhao, Y.; Lu, C.; et al. A promising new class of irradiation tolerant materials: Ti2ZrHfV0.5Mo0.2 high-entropy alloy. J. Mater. Sci. Technol. 2019, 35, 369–373. [Google Scholar] [CrossRef]
  10. Li, Z.; Zhao, S.; Ritchie, R.O.; Meyers, M.A. Mechanical properties of high-entropy alloys with emphasis on face-centered cubic alloys. Prog. Mater. Sci. 2019, 102, 296–345. [Google Scholar] [CrossRef]
  11. Senkov, O.N.; Wilks, G.B.; Miracle, D.B.; Chuang, C.P.; Liaw, P.K. Refractory high-entropy alloys. Intermetallics 2010, 18, 1758–1765. [Google Scholar] [CrossRef]
  12. Ye, Y.F.; Wang, Q.; Lu, J.; Liu, C.T.; Yang, Y. High-entropy alloy: Challenges and prospects. Mater. Today 2016, 19, 349–362. [Google Scholar] [CrossRef]
  13. Zhang, Y.; Yang, X.; Liaw, P.K. Alloy Design and Properties Optimization of High-Entropy Alloys. JOM 2012, 64, 830–838. [Google Scholar] [CrossRef]
  14. Archard, J.F. Contact and rubbing of flat surfaces. J. Appl. Phys. 1953, 24, 981–988. [Google Scholar] [CrossRef]
  15. Stott, F.H. The role of oxidation in the wear of alloys. Tribol. Int. 1998, 31, 61–71. [Google Scholar] [CrossRef]
  16. Blau, P.J. Fifty years of research on the wear of metals. Tribol. Int. 1997, 30, 321–331. [Google Scholar] [CrossRef]
  17. Holmberg, K.; Erdemir, A. Influence of tribology on global energy consumption, costs and emissions. Friction 2017, 5, 263–284. [Google Scholar] [CrossRef]
  18. Davis, J.R. Surface Engineering for Corrosion and Wear Resistance; ASM International: Almere, The Netherlands, 2001. [Google Scholar] [CrossRef]
  19. Budinski, K.G. Surface Engineering for Wear Resistance; Prentice Hall: Englewood Cliffs, NJ, USA, 1988. [Google Scholar]
  20. Bhushan, B. Principles and Applications of Tribology; John Wiley & Sons: Hoboken, NJ, USA, 2013. [Google Scholar] [CrossRef]
  21. Goward, G.W. Progress in coatings for gas turbine airfoils. Surf. Coat. Technol. 1998, 108, 73–79. [Google Scholar] [CrossRef]
  22. Dearnley, P.A. A review of metallic, ceramic and surface-treated metals used for bearing surfaces in human joint replacements. Proc. Inst. Mech. Eng. Part H J. Eng. Med. 1999, 213, 107–135. [Google Scholar] [CrossRef]
  23. Liu, C.; Leyland, A.; Bi, Q.; Matthews, A. Corrosion resistance of multi-layered plasma-assisted physical vapour deposition TiN and CrN coatings. Surf. Coat. Technol. 2001, 141, 164–173. [Google Scholar] [CrossRef]
  24. Zhu, Z.-X.; Liu, X.-B.; Liu, Y.-F.; Zhang, S.-Y.; Meng, Y.; Zhou, H.-B.; Zhang, S.-H. Effects of Cu/Si on the microstructure and tribological properties of FeCoCrNi high entropy alloy coating by laser cladding. Wear 2023, 512–513, 204533. [Google Scholar] [CrossRef]
  25. Pint, B.A. Optimization of Reactive-Element Additions to Improve Oxidation Performance of Alumina-Forming Alloys. J. Am. Ceram. Soc. 2003, 86, 686–695. [Google Scholar] [CrossRef]
  26. Evans, H.E. Stress effects in high temperature oxidation of metals. Int. Mater. Rev. 1995, 40, 1–40. [Google Scholar] [CrossRef]
  27. Holleck, H. Material selection for hard coatings. J. Vac. Sci. Technol. A Vac. Surf. Film. 1986, 4, 2661–2669. [Google Scholar] [CrossRef]
  28. Sundgren, J.-E.; Hentzell, H.T.G. A review of the present state of art in hard coatings grown from the vapor phase. J. Vac. Sci. Technol. A Vac. Surf. Film. 1986, 4, 2259–2279. [Google Scholar] [CrossRef]
  29. Indupuri, S.; Kumar, R.; Prasad, S.; Kumar, K.V.; Islam, A.; Masoom, S.; Pandey, S.M.; Keshri, A.K. Plasma sprayed aluminium nitride (AlN) coating: Microstructural, mechanical, tribological, and corrosion resistance performance. J. Eur. Ceram. Soc. 2024, 44, 1458–1469. [Google Scholar] [CrossRef]
  30. He, Z.; Jia, W.; Liu, X.; Wang, D.; Hu, J. The effect of aluminum addition on plasma nitriding for 42CrMo steel. Mater. Lett. 2024, 377, 137440. [Google Scholar] [CrossRef]
  31. He, Z.; Wei, W.; Hu, J.; Gu, J. Aluminum-Modified Plasma Nitriding with High Efficiency and Enhanced Performance. Coatings 2024, 14, 1373. [Google Scholar] [CrossRef]
  32. Zhuang, H.; Kang, Q.; Xie, Y.; Wu, M.; Wei, K.; Yang, X.; Hu, J. Kinetics analysis and enhancement mechanism of aluminum-enhanced plasma nitriding for 42CrMo steel. J. Mater. Res. Technol. 2023, 24, 6588–6594. [Google Scholar] [CrossRef]
  33. Ma, Z.; Sun, H.; Zheng, H.; Zhao, Y.; Sui, S.; Zhang, C.; Ni, G. Aluminum surface nitriding by an atmospheric-pressure non-thermal plasma technique. Jpn. J. Appl. Phys. 2022, 61, 026001. [Google Scholar] [CrossRef]
  34. Pint, B.; Wright, I.; Lee, W.; Zhang, Y.; Prüßner, K.; Alexander, K. Substrate and bond coat compositions: Factors affecting alumina scale adhesion. Mater. Sci. Eng. A 1998, 245, 201–211. [Google Scholar] [CrossRef]
  35. Yang, R.; Guo, X.; Yang, H.; Qiao, J. Tribological behavior of boronized Fe40Mn20Cr20Ni20 high-entropy alloys in high temperature. Surf. Coat. Technol. 2023, 464, 129572. [Google Scholar] [CrossRef]
  36. Vidakis, N.; Antoniadis, A.; Bilalis, N. The VDI 3198 indentation test evaluation of a reliable qualitative control for layered compounds. J. Mater. Process. Technol. 2003, 143–144, 481–485. [Google Scholar] [CrossRef]
  37. He, J.Y.; Liu, W.H.; Wang, H.; Wu, Y.; Liu, X.J.; Nieh, T.G.; Lu, Z.P. Effects of Al addition on structural evolution and tensile properties of the FeCoNiCrMn high-entropy alloy system. Acta Mater. 2014, 62, 105–113. [Google Scholar] [CrossRef]
  38. Yang, R.; Li, F.; Huang, Z.; Wang, X.; Yang, H.; Qiao, J. Tribological behavior of MP159 superalloys before and after plasma nitriding at different temperatures. Tribol. Int. 2025, 209, 110681. [Google Scholar] [CrossRef]
  39. Yang, R.; Wang, D.; Liu, D.; Yang, H.; Qiao, J. Ion nitriding of a face-centered cubic high-entropy alloy: Nitriding kinetics, the effect of temperature and contact stress on tribological behavior. Intermetallics 2024, 172, 108392. [Google Scholar] [CrossRef]
  40. Nishimoto, A.; Fukube, T.; Maruyama, T. Microstructural, mechanical, and corrosion properties of plasma-nitrided CoCrFeMnNi high-entropy alloys. Surf. Coat. Technol. 2019, 376, 52–58. [Google Scholar] [CrossRef]
  41. Ralls, A.M.; Leong, K.; Liu, S.; Wang, X.; Jiang, Y.; Menezes, P.L. Unraveling the friction and wear mechanisms of surface nanostructured stainless-steel. Wear 2024, 538–539, 205185. [Google Scholar] [CrossRef]
  42. Li, M.; Yu, Y.; Zou, C.; Tian, C.; Xiang, Y. Tribological and Corrosion Performance of CrAlN/CrN Coatings in Artificial Seawater under Varied Nitrogen Pressures. Coatings 2023, 13, 2090. [Google Scholar] [CrossRef]
  43. Jiang, J.; Arnell, R. On the running-in behaviour of diamond-like carbon coatings under the ball-on-disk contact geometry. Wear 1998, 217, 190–199. [Google Scholar] [CrossRef]
  44. Li, Y.; Liu, X.; Wan, L.; Han, B.; Ma, S.; Pan, H.; Wei, J.; Cui, X. Metformin suppresses cardiac fibroblast proliferation under high-glucose conditions via regulating the mitochondrial complex I protein Grim-19 involved in the Sirt1/Stat3 signaling pathway. Free Radic. Biol. Med. 2023, 206, 1–12. [Google Scholar] [CrossRef]
  45. Zishan, C.; Hejun, L.; Qiangang, F.; Xinfa, Q. Tribological behaviors of SiC/h-BN composite coating at elevated temperatures. Tribol. Int. 2012, 56, 58–65. [Google Scholar] [CrossRef]
  46. Lin, N.; Xie, F.; Yang, H.; Tian, W.; Wang, H.; Tang, B. Assessments on friction and wear behaviors of P110 steel and chromizing coating sliding against two counterparts under dry and wet conditions. Appl. Surf. Sci. 2012, 258, 4960–4970. [Google Scholar] [CrossRef]
  47. Zishan, C.; Hejun, L.; Qiangang, F. SiC wear resistance coating with added Ni, for carbon/carbon composites. Surf. Coat. Technol. 2012, 213, 207–215. [Google Scholar] [CrossRef]
  48. Hokao, M.; Hironaka, S.; Suda, Y.; Yamamoto, Y. Friction and wear properties of graphite/glassy carbon composites. Wear 2000, 237, 54–62. [Google Scholar] [CrossRef]
  49. Voevodin, A.A.; O’Neill, J.P.; Zabinski, J.S. Nanocomposite tribological coatings for aerospace applications. Surf. Coat. Technol. 1999, 116–119, 36–45. [Google Scholar] [CrossRef]
  50. Wang, K.; Zhang, Q.; Sun, M.; Wei, X.; Zhu, Y. Rare earth elements modification of laser-clad nickel-based alloy coatings. Appl. Surf. Sci. 2001, 174, 191–200. [Google Scholar] [CrossRef]
  51. Cai, Z.; Wang, Z.; Hong, Y.; Lu, B.; Liu, J.; Li, Y.; Pu, J. Improved tribological behavior of plasma-nitrided AlCrTiV and AlCrTiVSi high-entropy alloy films. Tribol. Int. 2021, 163, 107195. [Google Scholar] [CrossRef]
  52. Liu, C.; White, C. Dynamic embrittlement of boron-doped Ni3Al alloys at 600 °C. Acta Metall. 1987, 35, 643–649. [Google Scholar] [CrossRef]
  53. Geng, D.; Xu, Y.X.; Peng, B.; Li, H.; Wang, Q.; Kim, K.H. Comparative study on mechanical and tribological properties of Cr–Al–N and Cr–Al–O coatings deposited by cathodic arc evaporation. Tribol. Int. 2023, 177, 107989. [Google Scholar] [CrossRef]
  54. Zhang, Y.; Yang, W.; Peng, J.; Wang, A.; Fan, W.; Li, J. Unveiling wear property and multiscale tribological mechanism of laser cladding-nitriding synergistically enhanced high-entropy alloy coatings. Appl. Surf. Sci. 2025, 710, 163878. [Google Scholar] [CrossRef]
  55. Li, X.; Xin, W.; Zheng, X.; Ren, Z.; Sun, D.; Lu, W. Microstructural Characterization and Formation Mechanism of Nitrided Layers on Aluminum Substrates by Thermal Plasma Nitriding. Metals 2019, 9, 523. [Google Scholar] [CrossRef]
  56. Li, B.; Pike, L.M. Utilization of Alumina Scale Formation by Ni-Base Alloys for High-Temperature Oxidation and Corrosion Resistance in Harsh Environments. High Temp. Corros. Mater. 2024, 101, 1315–1330. [Google Scholar] [CrossRef]
  57. Yu, L.; Xiao, C.; Jiang, W.; Li, W.; Ni, S.; Song, M. Effects of aluminizing on the microstructure and wear resistance of AISI 321 steel. Surf. Coat. Technol. 2024, 483, 130753. [Google Scholar] [CrossRef]
  58. Qian, H.; Ye, S.; Guo, P.; Liu, Y.; Yan, D. Improving abrasion resistance of low temperature enamel (LTE) coating by alumina addition. Ceram. Int. 2024, 50, 8971–8980. [Google Scholar] [CrossRef]
  59. Bastakys, L.; Marcinauskas, L.; Milieška, M.; Grigaliūnas, M.; Matkovič, S.; Aikas, M. Tribological Properties of Chromia and Chromia Composite Coatings Deposited by Plasma Spraying. Coatings 2022, 12, 1035. [Google Scholar] [CrossRef]
Figure 1. XRD patterns of the Fe40Mn19Cr20Ni20Mo1 HEA under different processing conditions on the surface.
Lubricants 13 00509 g001
Figure 2. SEM images and EDS mapping of the aluminized Fe40Mn19Cr20Ni20Mo1 HEA: (a) surface; and (b) cross-section.
Lubricants 13 00509 g002
Figure 3. SEM images and EDS mapping of the surface and cross-section of aluminum–nitrogen co-infiltration Fe40Mn19Cr20Ni20Mo1 HEA: (a) surface; and (b) cross-section.
Lubricants 13 00509 g003
Figure 4. Vickers hardness of H-alloy and Al-alloy surface and Al-N-alloy.
Lubricants 13 00509 g004
Figure 5. Surface morphology of the sample after Rockwell indentation test at 1500 N: (a) Al 800 °C-9 h; (b) Al-N 550 °C-10 h.
Lubricants 13 00509 g005
Figure 6. (a) Thickness of aluminum–nitrogen co-infiltration Fe40Mn19Cr20Ni20Mo1 HEA versus the time at 500, 550, and 600 °C; (b) the graph of lnK vs. 1/T for aluminum–nitrogen co-infiltration Fe40Mn19Cr20Ni20Mo1 HEA.
Lubricants 13 00509 g006
Figure 7. Evolution of the average COF for the (a) H-alloy, (b) Al-alloy and (c) Al-N-alloy with the temperature; The COF curves of (d) H-alloy, (e) Al-aloy and (f) Al-N-aloy at different temperatures.
Lubricants 13 00509 g007
Figure 8. The cross-sectional profile of the wear track of (a) H-alloy, (b) Al-alloy and (c) Al-N-alloy; and the average wear rate at different temperatures: (d) H-alloy, (e) Al-alloy and (f) Al-N-alloy.
Lubricants 13 00509 g008
Figure 9. Wear morphology and EDS mapping of H-alloy at varius temperatures: (a) 20 °C; (b) 300 °C; (c) 600 °C.
Lubricants 13 00509 g009
Figure 10. Evolution of wear morphology and surface composition of Al-alloy with Temperature: (a) 20 °C; (b) 300 °C; (c) 600 °C.
Lubricants 13 00509 g010
Figure 11. Evolution of wear morphology and surface composition of Al-N-alloy with Temperature: (a) 20 °C; (b) 300 °C; (c) 600 °C.
Lubricants 13 00509 g011
Figure 12. High-resolution XPS spectra of individual elements from the worn surfaces of three alloys after sliding against a silicon nitride ball at 300 °C: (a) Fe; (b) Mn; (c) Cr; (d) Ni; (e) Mo; (f) Al.
Lubricants 13 00509 g012
Figure 13. Tribological diagram of H-alloy at verius temperatures.
Lubricants 13 00509 g013
Figure 14. Tribological diagram of Al-N-alloy at various temperatures.
Lubricants 13 00509 g014
Table 1. The total thickness of aluminum–nitrogen co-infiltration layer (μm) obtained at different times and temperatures.
Al-N co-infiltration parameters500 °C550 °C600 °C
2 h3.67.59.7
5 h8.51114.1
10 h11.217.426.4
Table 2. Diffusion coefficients at different temperatures.
Nitriding temperature for the Al-N-alloy (°C)500550600
Diffusion coefficient (×10−14 m2/s)3.4067.82515.930
Table 3. Chemical composition (at. %) of the worn surfaces of H-alloy, Al-alloy and Al-N-alloy at varius temperatures.
Temperature/°CFeMnCrNiMoOSiAlN
H-alloy2014.987.377.117.040.3660.922.22
10014.437.147.036.780.3663.340.91
20025.2012.4211.9411.650.5837.870.34
30026.7413.1612.6612.610.6933.690.46
40026.4813.3612.8412.660.6233.710.32
50022.2611.2910.9310.660.5644.090.22
60021.6510.8510.3610.30.5646.080.20
Al-alloy2015.0510.018.241.210.0112.390.0252.64
10014.709.387.941.340.0511.270.0654.80
20016.3310.287.294.080.3511.980.0249.67
30016.569.546.434.660.3115.200.0547.25
40016.439.486.44.650.3114.560.0348.14
50019.099.3310.0910.740.5230.160.0620.02
60017.147.228.9812.530.4325.310.0228.36
Al-N-alloy2011.405.402.705.700.608.100.0422.5043.20
10012.105.302.604.900.708.300.0422.8042.90
20012.165.202.905.600.707.200.0424.1042.10
30012.005.502.905.400.608.100.0522.5042.40
40010.804.502.705.700.909.000.0523.4042.40
50020.709.8312.4412.190.6425.140.0418.390.62
60019.317.624.459.370.1918.570.0440.060.39
Disclaimer/Publisher’s Note: The statements, opinions and data contained in all publications are solely those of the individual author(s) and contributor(s) and not of MDPI and/or the editor(s). MDPI and/or the editor(s) disclaim responsibility for any injury to people or property resulting from any ideas, methods, instructions or products referred to in the content.