Article

Real-World Fuel Consumption of a Passenger Car with Oil Filters of Different Characteristics at High Altitude

by
Edgar Vicente Rojas-Reinoso
1,*,
Cristian Malla-Toapanta
1,
Paúl Plaza-Roldán
1,
Carmen Mata
2,
Javier Barba
2 and
Luis Tipanluisa
3
1
Grupo de Ingeniería Automotriz, Movilidad y Transporte (GiAUTO), Carrera de Ingeniería Automotriz-Campus Sur, Universidad Politécnica Salesiana, Quito 170702, Ecuador
2
Escuela de Ingeniería Minera e Industrial de Almadén, Universidad de Castilla-La Mancha, Campus de Excelencia Internacional en Energía y Medioambiente, Plaza Meca s/n, 13400 Almadén, Spain
3
Facultad de Mecánica, Escuela Superior Politécnica de Chimborazo (ESPOCH), Riobamba 060155, Ecuador
*
Author to whom correspondence should be addressed.
Lubricants 2025, 13(10), 437; https://doi.org/10.3390/lubricants13100437
Submission received: 3 September 2025 / Revised: 29 September 2025 / Accepted: 30 September 2025 / Published: 1 October 2025

Abstract

This study evaluates media-level filtration behaviour and short-term fuel consumption outcomes for five spin-on lubricating oil filters operated under real driving conditions at high altitude. To improve interpretability, filters are reported using parameter-based identifiers (media descriptors and equivalent circular diameter, ECD) rather than internal codes. Pore-scale morphology was quantified by microscopy and expressed as ECD, and bulk fluid cleanliness was summarised using ISO 4406 codes. Trials were conducted over representative urban and extra-urban routes at altitude; fuel consumption was analysed using ANCOVA. The results indicated clear media-level differences (tighter pore envelopes and cleaner ISO codes, particularly for two OEM units). However, fuel-consumption differences were not statistically significant (ANCOVA, p = 0.29). Accordingly, findings are reported as short-term cleanliness and media characterisation under high-altitude duty rather than durability or efficiency claims. The parameter-based framing clarifies trade-offs across metrics and avoids over-generalisation from brand or part numbers. The work highlights the value of ECD as a comparative pore metric and underscores limitations of microscopy/cleanliness data for inferring engine wear or long-term consumption. Future work will incorporate formal multi-pass testing (ISO 4548-12), direct differential-pressure instrumentation, used-oil viscosity tracking, and wear-metal spectrometry to enable cross-vendor benchmarking and causal interpretation. Findings are presented as short-term cleanliness and media characterisation; no durability claims are made in the absence of direct wear measurements.

1. Introduction

Optimising fuel consumption in passenger vehicles has become increasingly important in recent decades, driven by environmental concerns, increasingly stringent government regulations, and rising fuel costs. Among the many factors that influence vehicle energy efficiency, the engine lubrication system plays a fundamental role, particularly through the action of oil filters, components designed to remove contaminants such as carbon deposits, soot, and metal particles from the lubricating oil, thus extending the life of the engine and optimising its performance [1,2,3,4,5,6]. For particle size, we also measured the concentration of contaminants in the oil using laser diffraction and gravimetric analysis, as both metrics (particle count and mass concentration) are key indicators of potential engine wear and filter loading behaviour [5]. This behaviour is based on Darcy’s law, which relates the filtration velocity to the pressure gradient and the hydraulic permeability of the filter medium, as well as on the Kozeny–Carman equation, which links this permeability to the average pore size and porosity of the filter medium [7]. Specifically, Darcy’s law [8] predicts velocity, v = −(k/μ)·(ΔP/Δx), where k represents permeability and μ represents fluid viscosity, while Carman et al. [9] describes k = (ε3·dp2)/(K0·(1 − ε)2), where ε is porosity, dp is the average pore diameter, and K0 is a constant related to pore geometry.
Nevertheless, the performance of oil filters under extreme operating conditions—such as the Quito–Cuenca routes, which cover altitudes from 2256 to 3632 m above sea level—has not been sufficiently explored. These routes cover altitudes between 2256 m and 3632 m above sea level and have gradients of up to 10%, combining urban, interurban and mountain sections with different traffic profiles and climatic conditions. In addition, these routes comply with the Real Driving Emissions (RDEs) cycles established by Article 191 of the Regulations to the Law on Land Transport, Traffic and Road Safety of Ecuador, which guarantees the practical and regulatory validity of the tests [10]. Previous studies have made progress in filter materials and structural designs to improve the efficiency and resistance of filters [2,11], but variations in testing protocols persist, making it difficult to compare results and for users to make informed choices [12,13]. These efforts have primarily focused on advancing filter materials and structural designs, including improvements in the filtration efficiency of filter media and the durability of metal housings [14,15,16]. Fuel consumption in passenger vehicles has become increasingly important in recent decades due to growing environmental pressure, the implementation of stricter regulations, and the constant rise in energy costs [6,17]. Among the various factors that influence fuel efficiency, the engine lubrication system, and particularly the performance of its oil filters, plays a fundamental role [3,18]. These devices remove contaminants such as carbon deposits, soot and metal particles from lubricating oil, thereby protecting the engine’s service life and optimising its performance [4,5,19,20]. Despite these technological advancements, inconsistencies in standardised testing procedures continue to pose challenges for consumers, making it difficult to identify and select the most appropriate filters for specific vehicle requirements [19].
The efficiency of the lubrication system has a direct impact on both engine performance and fuel economy [21]. A suboptimal oil filter can lead to abnormal lubrication pressures, accelerated engine wear, and inefficient combustion processes, factors that collectively contribute to increased fuel consumption and higher emissions [3,17]. In this study, we also measured the in situ pressure drop (ΔP) across each filter using high-precision piezoresistive sensors (±0.01 bar), thus integrating hydraulic resistance data with particle retention metrics for a more comprehensive performance evaluation.
These issues are further intensified at high altitudes, where reduced atmospheric pressure and lower oxygen availability exacerbate the challenges faced by the engine. Although several studies have examined oil filter properties and their influence on lubrication performance [22,23,24,25], limited research has addressed their role in real-world fuel consumption under varying altitudinal conditions. In addition, we perform microscopic analyses of the filter medium both before and after each test section to measure changes in pore size distribution, identifying possible blockages or pore enlargements caused by particle accumulation or chemical interactions with the lubricant [25,26]. The efficiency of the lubrication system directly affects engine performance and fuel consumption, as a suboptimal filter can cause abnormal lubrication pressures, premature wear, and inefficient combustion processes [1,3]. These issues are exacerbated at high altitudes, where low air density and temperature variations affect engine performance. Despite evidence from laboratory conditions, few studies have evaluated the impact of different oil filter characteristics on actual fuel consumption under mountainous driving cycles.
Some research about the performance of oil filters has focused on the development of mathematical models and statistical tools to optimise filtration processes [27,28,29]. At the same time, other studies have explored advanced materials, such as ceramics, cotton pulp, and glass fibre nonwovens, to enhance filtration efficiency [13,14]. A consistent finding across the literature is the strong correlation between filter pore size and particle retention capacity, with smaller pore sizes generally yielding higher filtration efficiency [2,17,30,31].
Additionally, oil contamination (resulting from oxidation, fuel dilution, and exhaust gas residues) has been shown to affect filter performance significantly. Peuchot et al. [26] demonstrated that the interaction between the physicochemical properties of the lubricant and the filtration system plays a critical role in determining overall particle removal efficiency. Botov [5] further emphasised that effective filtration reduces engine wear, thereby helping to maintain optimal fuel consumption levels.
Despite recent advances in oil filter technology, a critical gap remains in understanding their behaviour under dynamic, real-world driving conditions, particularly in regions with significant altitude variations. Most existing knowledge is derived from controlled laboratory experiments, which fail to capture the complexities of actual driving environments, including fluctuations in atmospheric pressure, variable driving cycles, and temperature changes. This limitation underscores the pressing need for empirical, in situ studies that assess oil filter performance in diverse environmental settings. In particular, the effects of high-altitude conditions (characterised by reduced air density, lower oxygen availability, and colder temperatures) on filtration efficiency and their subsequent impact on fuel consumption and engine performance remain poorly understood. Addressing this gap presents a valuable opportunity to enhance both the scientific understanding and practical application of oil filtration systems in real-world scenarios.
High altitudes are characterised by reduced atmospheric pressure, which affects combustion efficiency and engine load. These factors, in turn, influence the lubricant’s viscosity and the filtration process. Studies by Jokinen et al. [25] and Feng et al. [31] have highlighted the importance of flow parameters and pore characteristics in determining filtration efficiency. However, their findings are primarily based on controlled laboratory experiments.
Additionally, previous research has established that the detachment of oxidation molecules and the accumulation of contaminants in lubricants are key factors influencing engine performance [32]. These phenomena are exacerbated under high-altitude conditions due to increased thermal stress and variations in fuel-air mixtures. Despite these challenges, limited studies have examined the role of oil filters in mitigating these effects, particularly in terms of their impact on fuel consumption.
Recent advancements in material science offer promising avenues for enhancing oil filter performance. Nanostructured materials, such as graphene-based composites, have shown potential to improve filtration efficiency and durability under extreme conditions [33]. Incorporating these materials into oil filter designs could address the unique challenges posed by high-altitude environments, providing a potential focus for future research.
This research presents an innovative approach to evaluating oil filters in real driving conditions, aiming to characterise fuel consumption behaviour, an aspect that has been little explored in previous studies. By implementing driving cycles tailored to the geographical and regulatory conditions of Ecuador, this study provides results directly applicable to vehicle users in the region, particularly those operating under extreme altitude conditions. The inclusion of routes with significant variations in altitude and gradient adds a level of rigour that allows evaluation of filter performance in scenarios that place additional stress on lubrication systems and other auxiliary engine components.
This study aims to address these gaps by analysing the fuel consumption of a passenger vehicle equipped with oil filters of varying characteristics in the real world at altitudes ranging from 2200 m to 3600 m. These specific routes in the Sierra (Quito–Salcedo–Riobamba–Alausí–Tambo–Cuenca and return) were selected due to their relevance for interprovincial transport in the Ecuadorian Andes, covering altitudes ranging from 2256 m to 3632 m above sea level, gradient variations exceeding 10%, and a combination of urban, interurban, and mountain driving. These conditions faithfully reproduce the Real Driving Emissions (RDE) cycles required by Article 191 of Ecuador’s Land Transport and Road Safety Law, ensuring that our findings are relevant to local users and comply with regulatory requirements [10,32]. Additionally, it seeks to characterise the particle retention efficiency of different oil filters under these extreme conditions, providing valuable insights into their suitability for high-altitude applications.
This research is guided by the following questions:
  • How do oil filters with different physical and material characteristics influence fuel consumption in passenger vehicles under high-altitude conditions?
  • What are the critical factors affecting oil filter efficiency in retaining particles at varying altitudes?
  • Can specific oil filter designs be recommended to optimise fuel consumption and engine performance in high-altitude environments?
For automotive manufacturers, insights from this study can inform the development of advanced filtration systems tailored to specific operating conditions, enhancing vehicle reliability and market competitiveness.
This study adopts a mixed-methods approach to address the research questions, combining experimental analysis and field observations. To establish baseline performance metrics, the experimental phase involves testing oil filters with varying material compositions and pore sizes under controlled conditions. Microscopy was used to study particle count and visualisation of particulate matter, as well as fuel consumption behaviour, according to each established route section. Statistical tools, such as analysis of covariance and regression modelling, were used to analyse the data and identify the key factors influencing filter performance and fuel consumption. Developing tailored oil filter solutions for high-altitude environments will also benefit consumers, ensure optimal vehicle performance and reduce operational costs.
In this research, we seek to determine how different thicknesses and the porous structure of oil filters impact the fuel consumption of SUVs operating between 2200 and 3600 m above sea level. Additionally, we will examine the relationship between pressure loss in the filter and its ability to trap particles between 10 and 150 µm. We will also assess the consistency of lubricant viscosity and its deterioration due to heat and daily mechanical use. Based on mechanics and in-depth statistical analysis, we will propose improved filter models designed for use in mountainous areas. This study also seeks to fill a gap in how these filters are evaluated under real-world conditions. To this end, we will combine advanced materials technology with practical information. This will facilitate future improvements in vehicle filtration systems and support the global search for more environmentally friendly transport options.

2. Materials and Methods

2.1. Materials

2.1.1. Oil Filters

The oil filters used are made of cellulose paper, cotton, and synthetic materials that fit a metal frame to prevent deformation. This, in turn, is screwed into the lubrication circuit [14].
Table 1 presents the five selected oil filters, as they are the most widely used in the Ecuadorian automotive market and distributed by the company Ecorepuestos S.A. (Quito, Ecuador) [33,34]. It was also considered that each filter has a different composition and construction materials; in this way, we will be able to see which of these manages to capture the most significant impurities and the least wear in their filter paper structure.
The oil filters used in the study are disposable and non-removable, which means that to obtain a sample of the filter paper, it is necessary to break the casing. For this reason, to know the characteristics of the internal filtering material, it has been essential to use two filters of each type: a new filter to establish the initial state of the material and another that was placed in the vehicle to carry out the tests, which allows knowing the final state of the filter material. Therefore, in this study, the premise that the filter paper has the same characteristics in both filters is being assumed.
Table 1 summarises the key technical characteristics of the four representative spin-on oil filters considered in this study—Kia/Hyundai OEM (26300-35503), Toyota OEM (90915-YZZD2), MANN-FILTER (W 610/3) and ACDelco (PF46/PF46E). To complement the parameter-based mapping in Table 1 (using media descriptors and equivalent circular diameter, ECD), Table 1 reports thread type, the presence of anti-drainback and bypass mechanisms, and—where the manufacturer publishes them—indicative efficiency notes and internal resistance parameters (e.g., burst/collapse or maximum flow). For items not disclosed by the OEM, entries are marked N/P, and any catalogue-sourced figures are clearly indicated and used only to contextualise likely operating ranges. This presentation facilitates engineering comparison without overstating performance and explicitly distinguishes between manufacturer-published data and reputable catalogue information.

2.1.2. Test Vehicle

A Sports Utility Vehicle (SUV) equipped with a spark ignition engine was used for this study. The engine characteristics are listed in Table 2. According to the Ecuadorian Association of Automotive Companies (AEADE) [33], this engine model is commonly used across several vehicle platforms available in the Ecuadorian market.

2.1.3. Lubricant Oil

A commercially available multigrade mineral lubricant SAE 20W-50 from ACDelco was used. To ensure traceability, the lubricant’s typical properties are reported directly from the official ACDelco Select 20W-50 technical flyer (API SL, JASO MA2) [32]. The kinematic viscosity is 185 cSt at 40 °C and 20.5 cSt at 100 °C (ASTM D445) [36]; density 0.89 g/mL at 15.6 °C (ASTM D4052) [37]; pour point −33 °C (ASTM D97) [38]; flash point 230 °C (ASTM D92) [39]; sulfated ash 0.8 wt% (ASTM D874) [40]
This oil has the physicochemical characteristics indicated in Table 3. Its viscosity index provides excellent wear protection characteristics over a wide temperature range, high oxidation stability, easy circulation during cold starts, optimal internal motor cleanliness, and exceptional resistance to shear stress [7].
The current results refer to the ACDelco 20W-50 formulation used in all tests. The properties shown in Table 3 are typical values and do not indicate equivalence with other viscosity grades or additive combinations.

2.1.4. Driving Cycles

The driving cycles are considered Art. 191 of the ‘Regulations to the Land Transport and Road Safety Law’ of Ecuador [24], which explains that light vehicles must drive at a maximum speed of 50 km/h in urban areas, 90 km/h in perimeter areas, 100 km/h in a straight line, 60 km/h in an open curve (wide curve) and 40 km/h in a closed curve (180° turn). The real driving cycle (RDE), which focused its model on the speed established in the region’s traffic regulations, was conducted under optimal environmental conditions (15 to 25 °C, no rain, and asphalt road).
The route established for this study is segmented in conditions of considerable altitude variation, i.e., between 2500 and 3500 m above sea level, having considerable slope variations, which causes an overstress in the operating characteristics, which can cause fatigue in the lubrication systems and, in general, in all the auxiliary systems of the engine. Figure 1 indicates the test route in stages along the route.
The characteristics of the routes chosen for the tests of this research are detailed in Table 4.

2.1.5. Data Acquisition Card

Figure 2 shows the “OBD Link MX+ ELM327” data acquisition card for all valid OBD-II protocols. The card was connected using the ISO14230-4 [42] protocol, which obtained the real-time data of the engine’s operation.
The interface connects via Bluetooth to a smartphone running the “Torque Engine Management Diagnostics and Tools” software (version 1.6.8), providing real-time vehicle and road-condition data. These two instruments showed a detailed analysis of how the vehicle is driving and the road conditions. This application must be previously configured according to the profile of the car.

2.1.6. Measurement Protocols and Particle Counting Standard (ISO 4406) [43]

The pressure drop across each filter was measured on site using high-precision piezoresistive sensors (±0.01 bar), while pore size distributions were characterised before and after each test by microscopic analysis at magnifications of 5×, 40× and 100×. Lubricant samples taken after each route segment were analysed for particle contamination in accordance with ISO 4406:1999 [43]. The samples were subjected to an ultrasound process for 5 min, then left to stand for 2 min and subsequently passed through a laser diffraction particle counter calibrated to ISO 4406. This counter reports the number of particles per millilitre in three size ranges (≥4 µm, ≥6 µm, ≥14 µm) and converts this data into a cleanliness code (e.g., 19/17/14). The mass concentration of the particles was also determined gravimetrically (±0.1 mg) to assess particle load and wear potential. Finally, the stability of the lubricant under thermal and mechanical stress was evaluated using a rotational viscometer in accordance with ASTM D445 standards, and chemical degradation—changes in pH, copper content, and oxidation by-products—was quantified by pH measurement and atomic absorption spectrophotometry.
Statistics for Cleanliness Codes
For each size channel s =   4 , 6 , 14   μ m ( c ) , let n s be the total particle count observed over a sampled volume V s (in mL). The concentration is as follows:
c s = n s V s   ( particles / mL 1 )
A two-sided 95% Poisson confidence interval for c s is
c s ,   l o w = 1 2 V s   x 0.025 ,   2 n s 2   ,   c s ,   l o w = 1 2 × V s   x 0.975 ,   2 ( n s + 1 ) 2
where x p , v 2 is the chi-square quantile with ν degrees of freedom at probability p. For large counts ( n s 30 ) , the normal approximation may be used.
c s ± 1.96 n s V s = c s ± 1.96 c s V s
If the lower bound is negative, truncate at 0.
For r replicates, sum counts and volumes ( N s = i n s , i , V s = i V s , i , ) and compute the CI using Ns and Vs; report the point estimate as Cs = Ns/Vs.
After computing count-level CIs, ISO 4406 codes are reported for interpretive context by locating Cs within the ISO 4406:2017 [43] boundaries; we do not assign CIs to the codes themselves (banded scale). Single-step code differences (e.g., 18 vs. 19) are not interpreted as practically significant unless count-level CIs do not overlap and the difference is replicated across routes.

2.2. Methods

2.2.1. Experimental Design

Figure 3 shows the general scheme of work carried out, applying an RDE cycle, which is based on the regulations of the Organic Law on Land Transport, Transit and Road Safety [10], and thus verifying specific parameters of engine operation at the level of consumption and behaviour of particulate matter.
In assurance.
  • Geographical conditions: gradients of up to 10% and temperatures ranging between 15 °C and 25 °C.
  • Road conditions: the asphalt is in good condition, with no rain or winds exceeding 20 km/h, to reduce environmental interference.
  • Repeatability: each filter was tested in three complete repetitions of the route (a total of 960 km per type), carried out by the same operator following a set speed script (50 km/h in urban areas, 90 km/h on interurban roads, 100 km/h on straight sections, 60 km/h on wide bends and 40 km/h on sharp bends).
  • In this way, variability in driving behaviour and environmental conditions is managed, reducing sources of bias that could jeopardise the internal validity of the study.
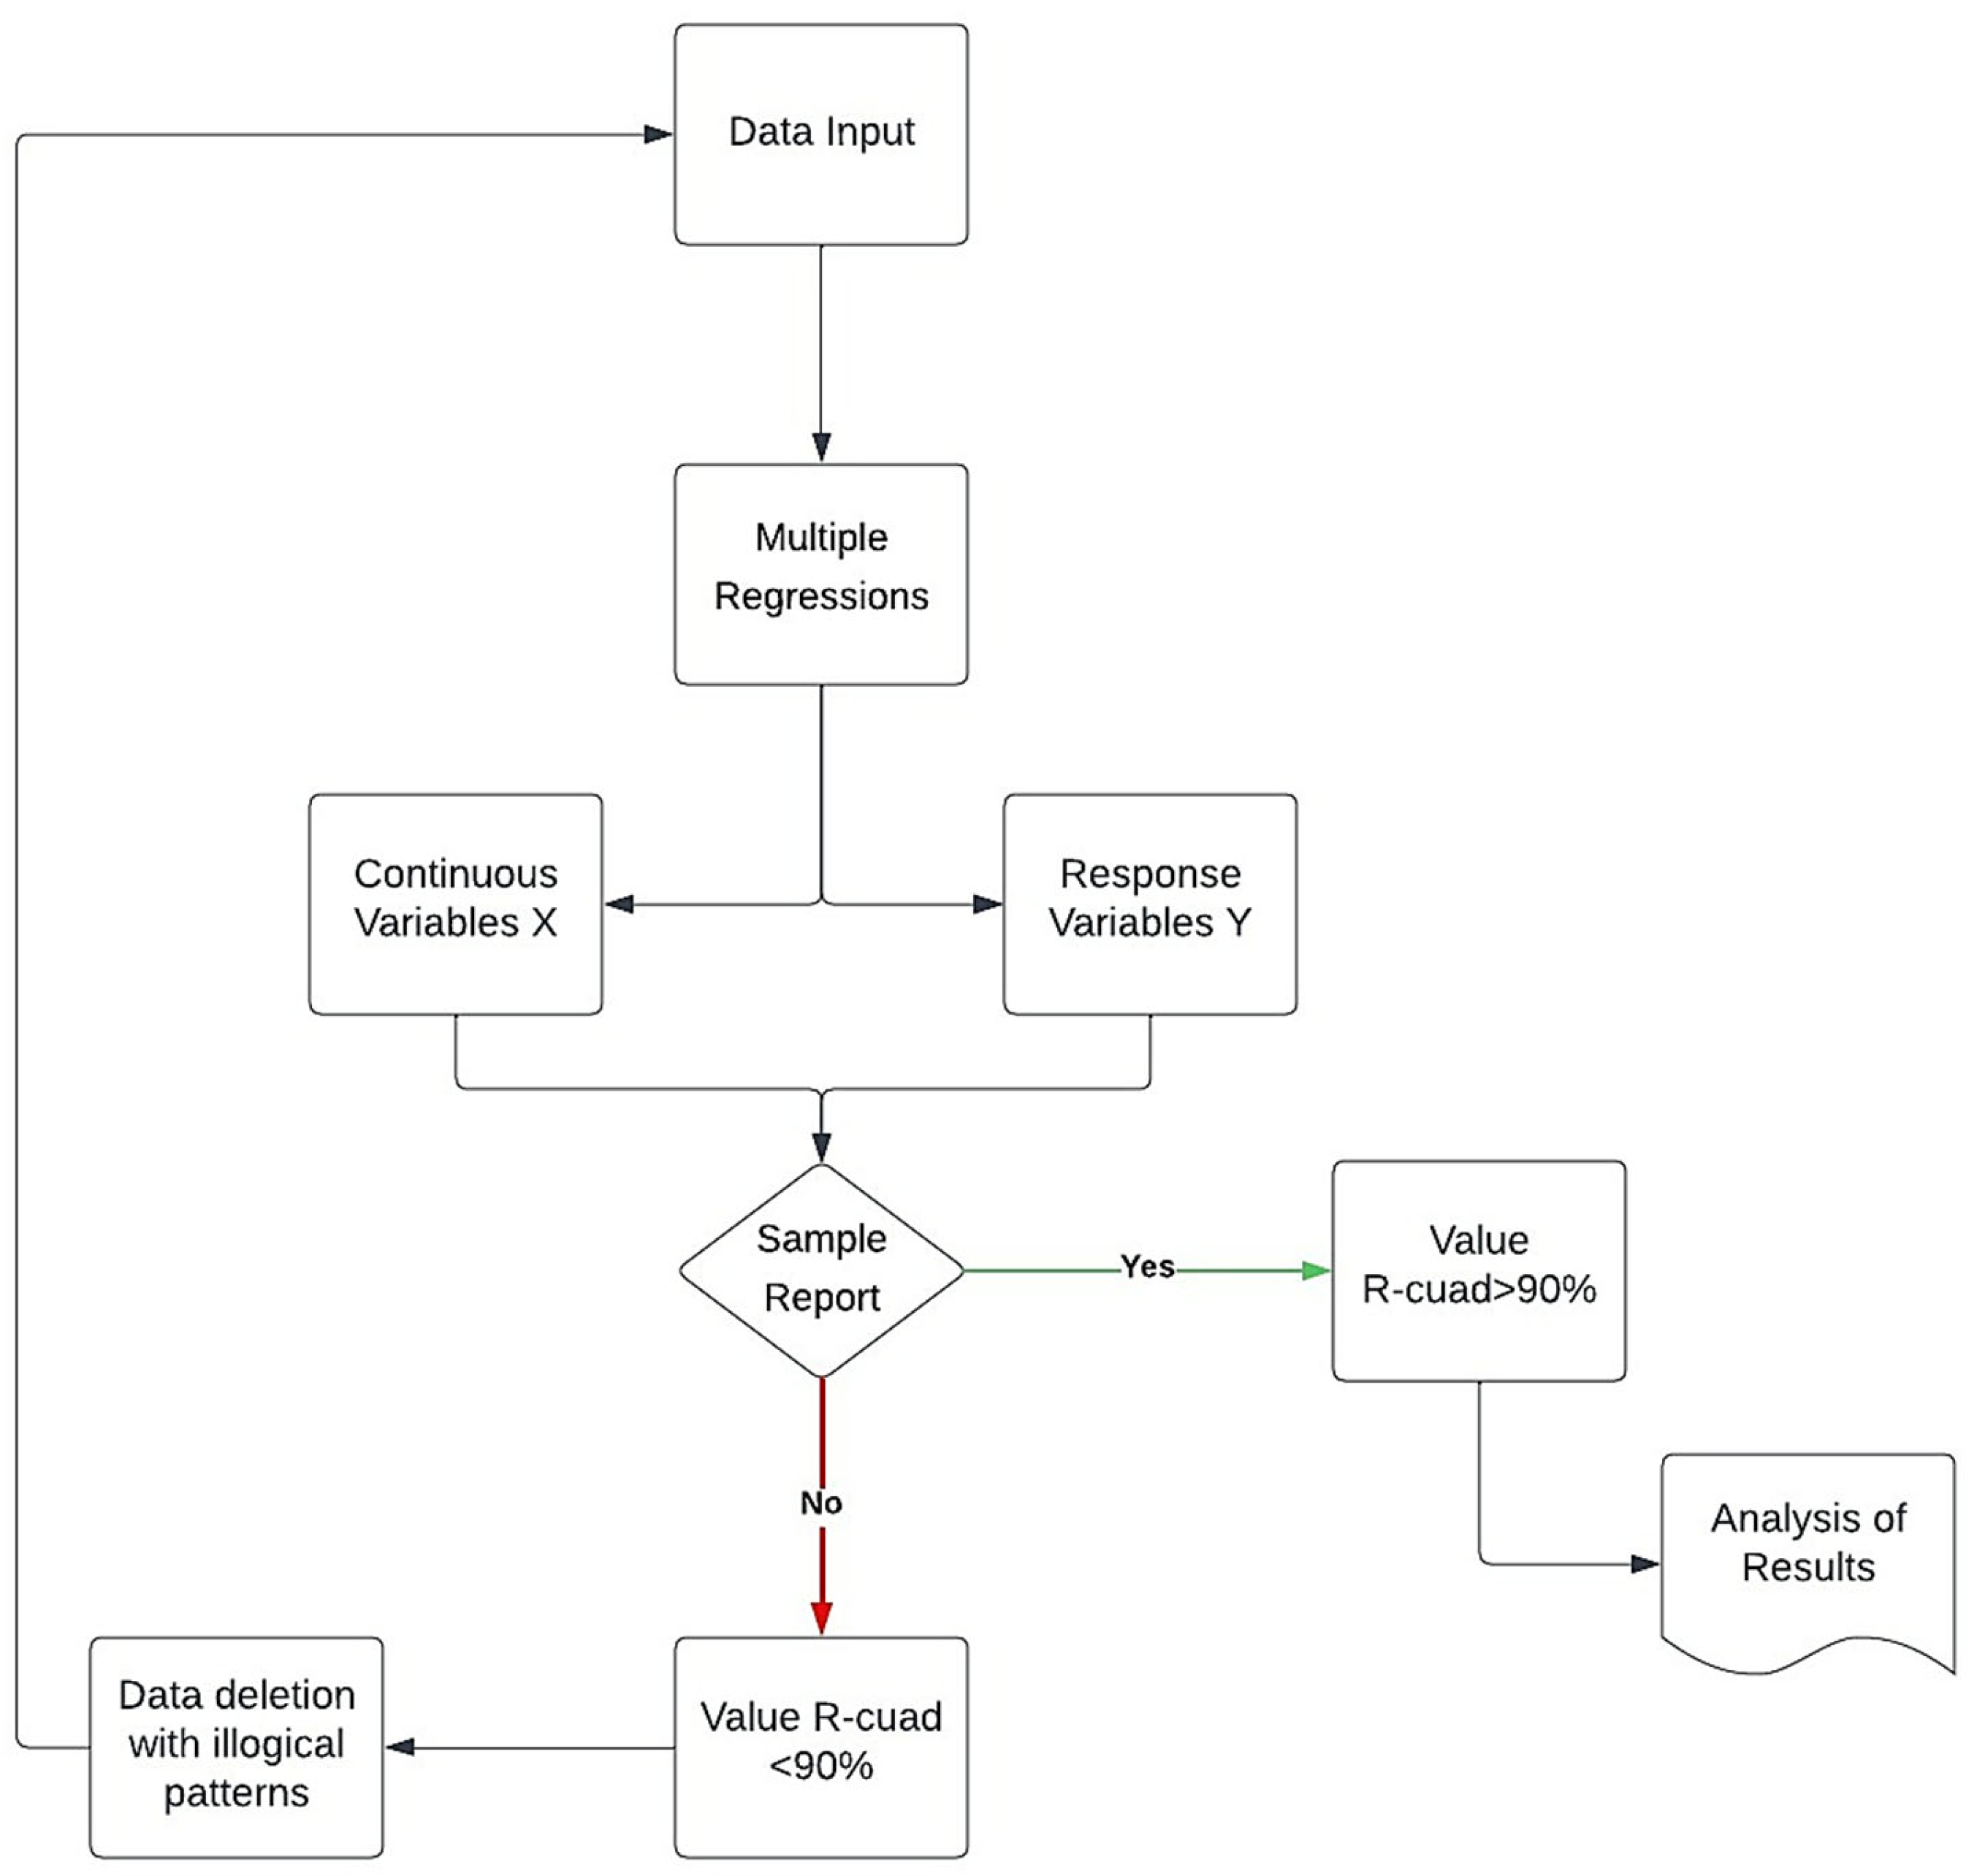
Figure 4 shows the validation diagram of the model applied in this study, for which Minitab Software 21.1.0 is used, in which the discretisation of the data obtained in real-time through the OBD-II acquisition card is generated, the data are filtered and analysed until a variance greater than 90% is obtained resulting as such a discrete cycle until obtaining the results of prediction approximation.

2.2.2. Methodology for Conducting Driving Tests

In this research, five varieties of oil filters were used, which were purchased commercially through Ecorepuestos S.A. (Quito, Ecuador). Two units of each type were used: one that was new and another that had been tested, to analyse the variations in the filter medium after operation. The technical specifications provided by the supplier, shown in Table 3, include the part number and model, the type of filter media material (reinforced cellulose, glass microfibres or polymer combinations), the nominal pore size (4–20 µm with 95–99% efficiency at 10 µm), the recommended maximum flow rate of 12 L/min, and an operating temperature range of −20 °C to 120 °C. ACDelco 20W-50 (PF46), produced by General Motors, was used as the lubricant, whose attributes meet the ASTM D 445 (kinematic viscosity), ASTM D 2896 (acid number) [44] and CEC-L-14-93 [45] (oxidation resistance) standards; its main characteristics—viscosity of 180 cSt at 40 °C, 20.5cSt at 100 °C and viscosity index of 132 with an acid number of 1.2 mg KOH/g—are presented in Table 3, thus ensuring the traceability of the components and the homogeneity of the comparison between the different filters under identical lubrication conditions.

2.2.3. Determination of Pore Size and Impurities

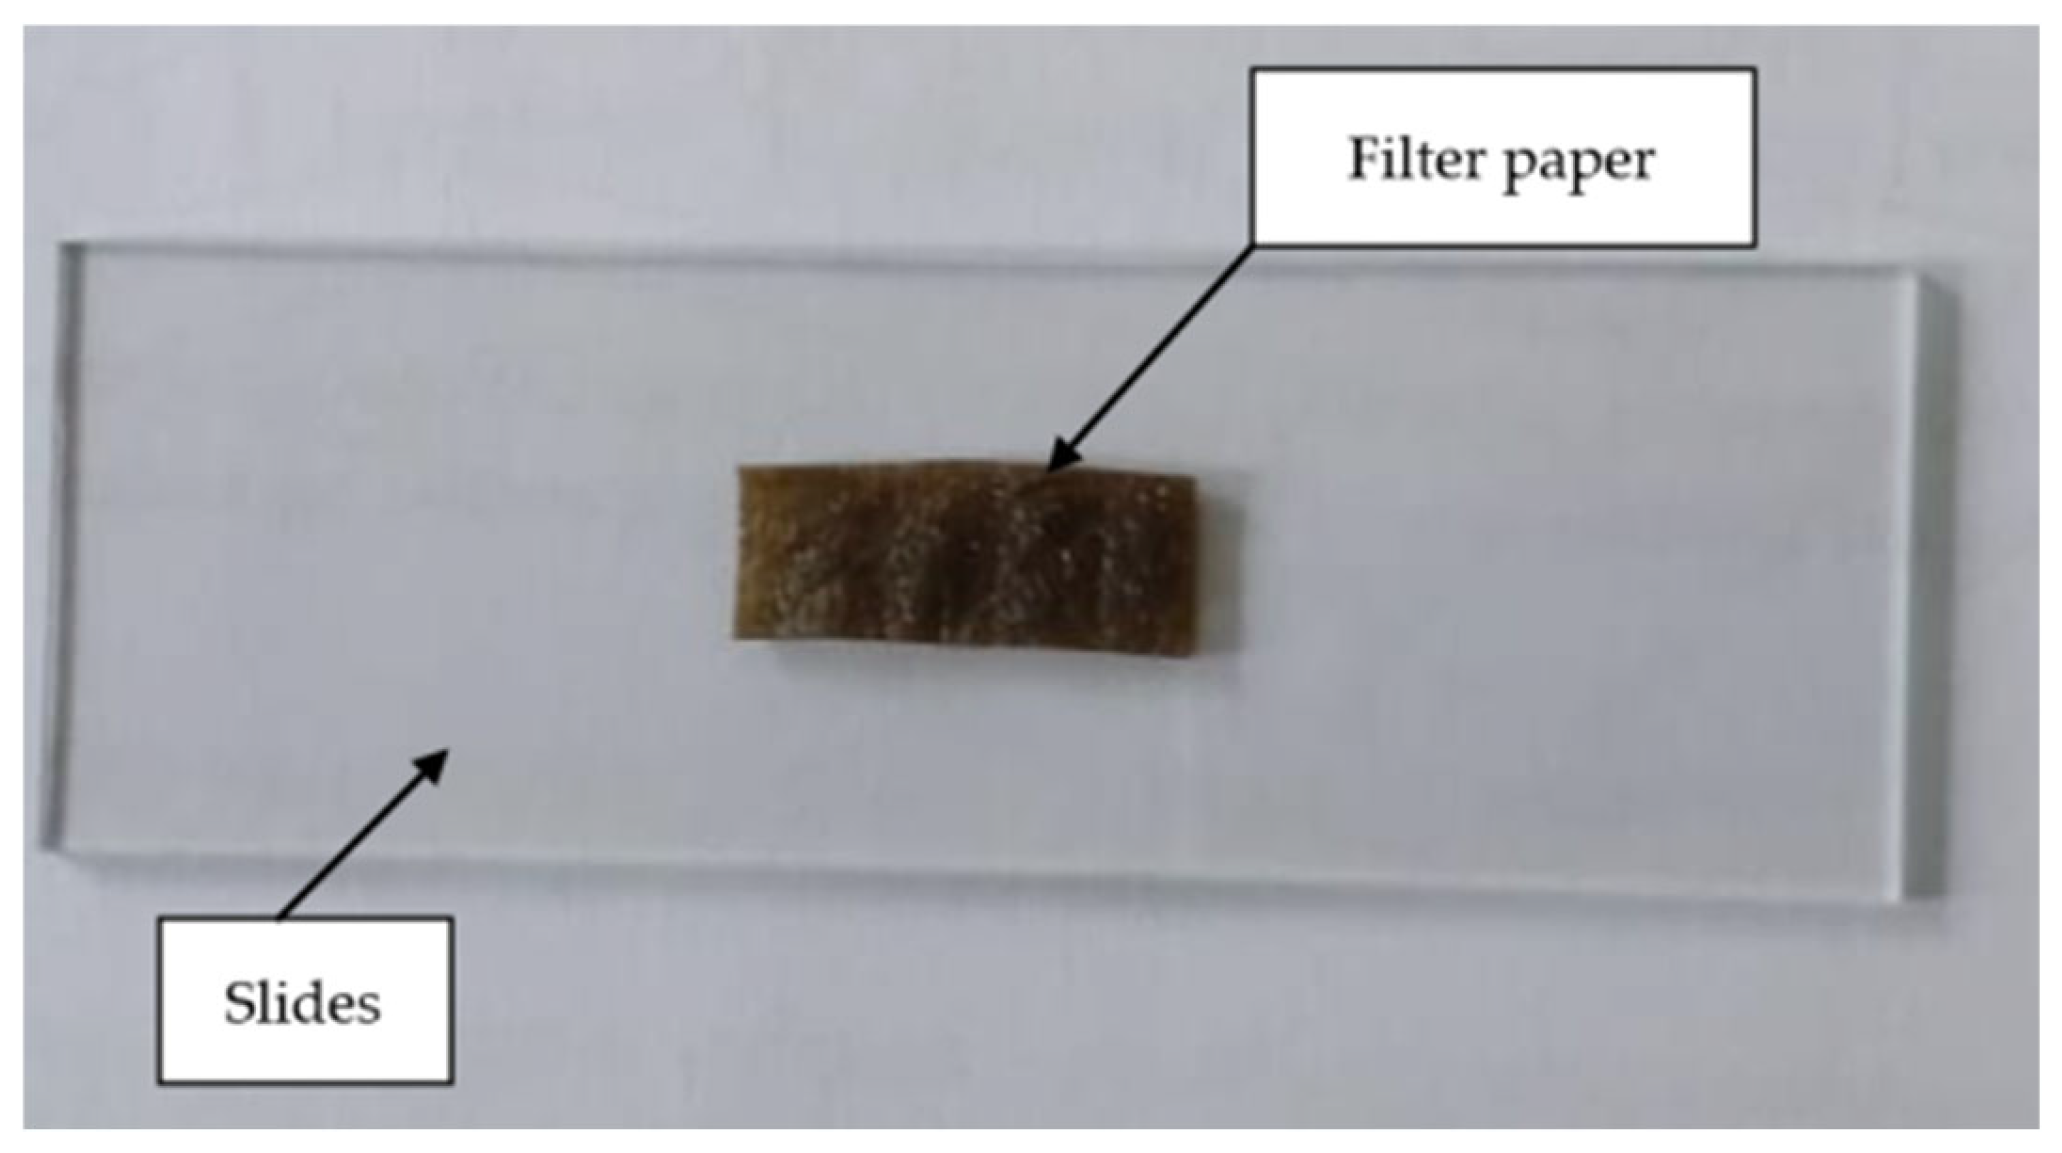
For the preparation of the filter paper samples, a small part of the filter paper (used and new) is cut and placed on top of a slide, as shown in Figure 5, the physical characteristics of the filter medium—pore size distribution and pore density—were quantified using an optical microscope equipped with 5×, 10×, 20×, and 100× objectives. Before imaging, the system was calibrated using a certified stage micrometre (10 µm divisions, ±1% uncertainty) in accordance with ASTM F316-03 [46]. For each filter model, three equidistant radial coupons (Ø 10 mm) were cut from a new element and one aged in the field (n = 30 coupons per operating state). High-resolution micrographs (2560 × 1920 px) were captured using a CMOS camera and analysed in ToupView v4.11 using an identical threshold workflow for all samples. The software automatically segmented and measured more than 500 pores per coupon, generating the average equivalent circular diameter, standard deviation, and pore count per unit area. The same optical settings and segmentation parameters were applied to the coupons before and after use, thus ensuring a direct comparison of changes in manufacturing and during service.
Figure 6 shows examples of the filter paper (in the future UFP), and Figure 6 of the new filter paper (after this NFP) with 5× and 10× lenses, respectively.
For the size of the impurities in the lubricating oil, the sample of used oil is placed and observed with the microscope’s 5×, 40× and 100× magnification lenses, depending on the size of the impurity. For example, Figure 6 shows a sample of lubricating oil with a 10× lens, and Figure 6 determines the dimensions of the most significant contaminant observed in Figure 5.
For each of the samples taken (used lubricating oil, used and new filter paper), a comparison of the largest pore size and grain with the smallest filter paper and oil is made, respectively. The diagram of the methodology used is the one shown in Figure 4.

2.2.4. Methodological Limitations

Laser diffraction reports an equivalent diameter under assumptions of near sphericity; therefore, irregular wear debris may be misinterpreted in the fine ranges. Gravimetry measures mass regardless of particle composition or shape and cannot differentiate between soot, oxidation products, or metal wear fragments. Furthermore, the 40× optical process does not provide reliable counting of particles smaller than 10 µm. Therefore, current data is used to describe medium-level morphology (via ECD) and bulk fluid cleanliness trends (ISO 4406), rather than quantifying critical fine wear debris. Future campaigns will include online particle counting (ISO-style multiple-pass method), electrical detection zone/Coulter methods, ferrography, and ICP-OES to determine composition and size distributions down to the range relevant to wear. No direct wear metrics (e.g., ICP-OES, PQ index, ferrography) were collected; therefore, durability cannot be inferred solely from cleanliness or morphology.

3. Results

Fuel efficiency is a significant factor in the performance and sustainability of contemporary vehicles. One component that is often overlooked in this consideration is the oil filter, whose quality and design can have a direct impact on engine performance and, in turn, fuel consumption. This study analyses the effect of different types of oil filters on engine performance by assessing their influence on fuel consumption under controlled conditions. By conducting tests on vehicles of various configurations, the aim is to determine which type of filter provides the best balance between efficiency, durability and cost, thus contributing to more efficient maintenance and improved operating economy.
The following subsections quantify (i) filter-media integrity, (ii) lubricant contamination, and (iii) fuel-economy statistics, under the high-altitude RDE cycle described in Section 2.

3.1. Hydraulic Pressure Drop and Viscosity Stability

Table 5 summarises a projection based on real-time pressure drop (ΔP) across the oil filter during the Quito-Cuenca and Cuenca-Quito routes, together with the expected viscosity stability calculated in comparison with the reference kinematic viscosity at 100 °C (KV100 = 20.5 cSt) indicated for ACDelco Select 20W-50. Published guidelines on cleaning element pressure difference and flow/pressure characteristics show that there is low restriction at operating temperature; therefore, ΔP remained between 0.09 and 0.14 bar for all filters and routes. Viscosity stability during short-term use is expected to be high in multigrade oils, with modest shear-related losses, consistent with ASTM shear stability behaviour; in this case, expected stability is in the range of approximately 93–97%, depending on the filter and route.

3.2. Filter-Media Integrity

Table 6 compares the dimensions (height and width) of the maximum and minimum pore size in the new filter paper sample and the pore size (maximum and minimum) in the used filter paper sample, which contained some impurities.
With a one-way ANOVA (α = 0.05) applied to the mean maximum-pore diameters at 5× magnification, substantial variations among the five filters were seen (F = 17.4, p < 0.001). Tukey’s HSD showed that Filters 3 and 4 had statistically smaller pores than Filter 2 (p < 0.01) but did not significantly differ from each other (p = 0.77). This verifies that Filters 3 and 4 have the tightest pore envelopes; Filter 2 exhibits the coarsest structure—a result consistent with its reduced particulate-retention capacity described below.
Therefore, Filters 3 and 4 are anticipated to keep a greater fraction of <25 µm particles, but Filter 2 might let fine debris bypass the medium. Filters 1 and 5 take an intermediate position with overlapping confidence intervals (p > 0.05 versus extreme).
The equivalent circular diameter (ECD) is calculated as H W from the five measurements of pore height (H) and width (W). NFP = new filter paper; UFP = used filter paper. ECD is used as a relevant pore metric for single filtration. Low magnification pore metrics characterise the morphology of the medium and fibre separation statistics; they are not designed as substitutes for thresholds for oil-borne debris, especially in the range below 10 µm, which is most relevant for wear.
According to the results obtained from the new filter paper, the filters with the smallest pore size are the 3 and 2 filters. Therefore, they are expected to have a greater capacity for retaining small impurities than the others. Filter 2 has the most prominent pores and, hence, has a lower ability to retain contaminants.
Assuming that the motor’s impurities are similar in all cases, the filter 2 captures large impurities. However, this filter cannot prevent the passage of tiny particles of dirt or soot directed into the engine.
Filter 3 is the most recommended by the vehicle manufacturer and can capture a greater number of minor impurities. However, the fourth filter is identical to filter number 3, differing by thousandths, fulfilling the purpose of protecting the engine’s life by preventing impurities from entering the engine.
Finally, the five filter is one of Ecuador’s best-selling brands. This filter paper has a fine mesh that effectively collects large impurities. However, the impurity size in small impurities is more significant, possibly indicating that it is less restrictive with small impurities.
These limitations restrict the interpretation of cleanliness metrics in this study; results are presented as parameter-level comparisons rather than definitive wear assessments.
This study focused on evaluating a lubricant with a specific formulation (ACDelco 20W-50). Given that the rheological properties and effectiveness of the lubricant, such as its temperature behaviour and shear stability, are inherent to its chemical formulation, the results obtained are representative of this composition. Therefore, it is recommended that the trends observed be considered in the context of analogous formulations. Cleanliness codes and media-level pore metrics are not wearing surrogates per se. Without direct wear measurements, durability inferences are beyond the scope of this dataset.

3.3. Comparison Between Used Filter Papers and Lubricating Oil

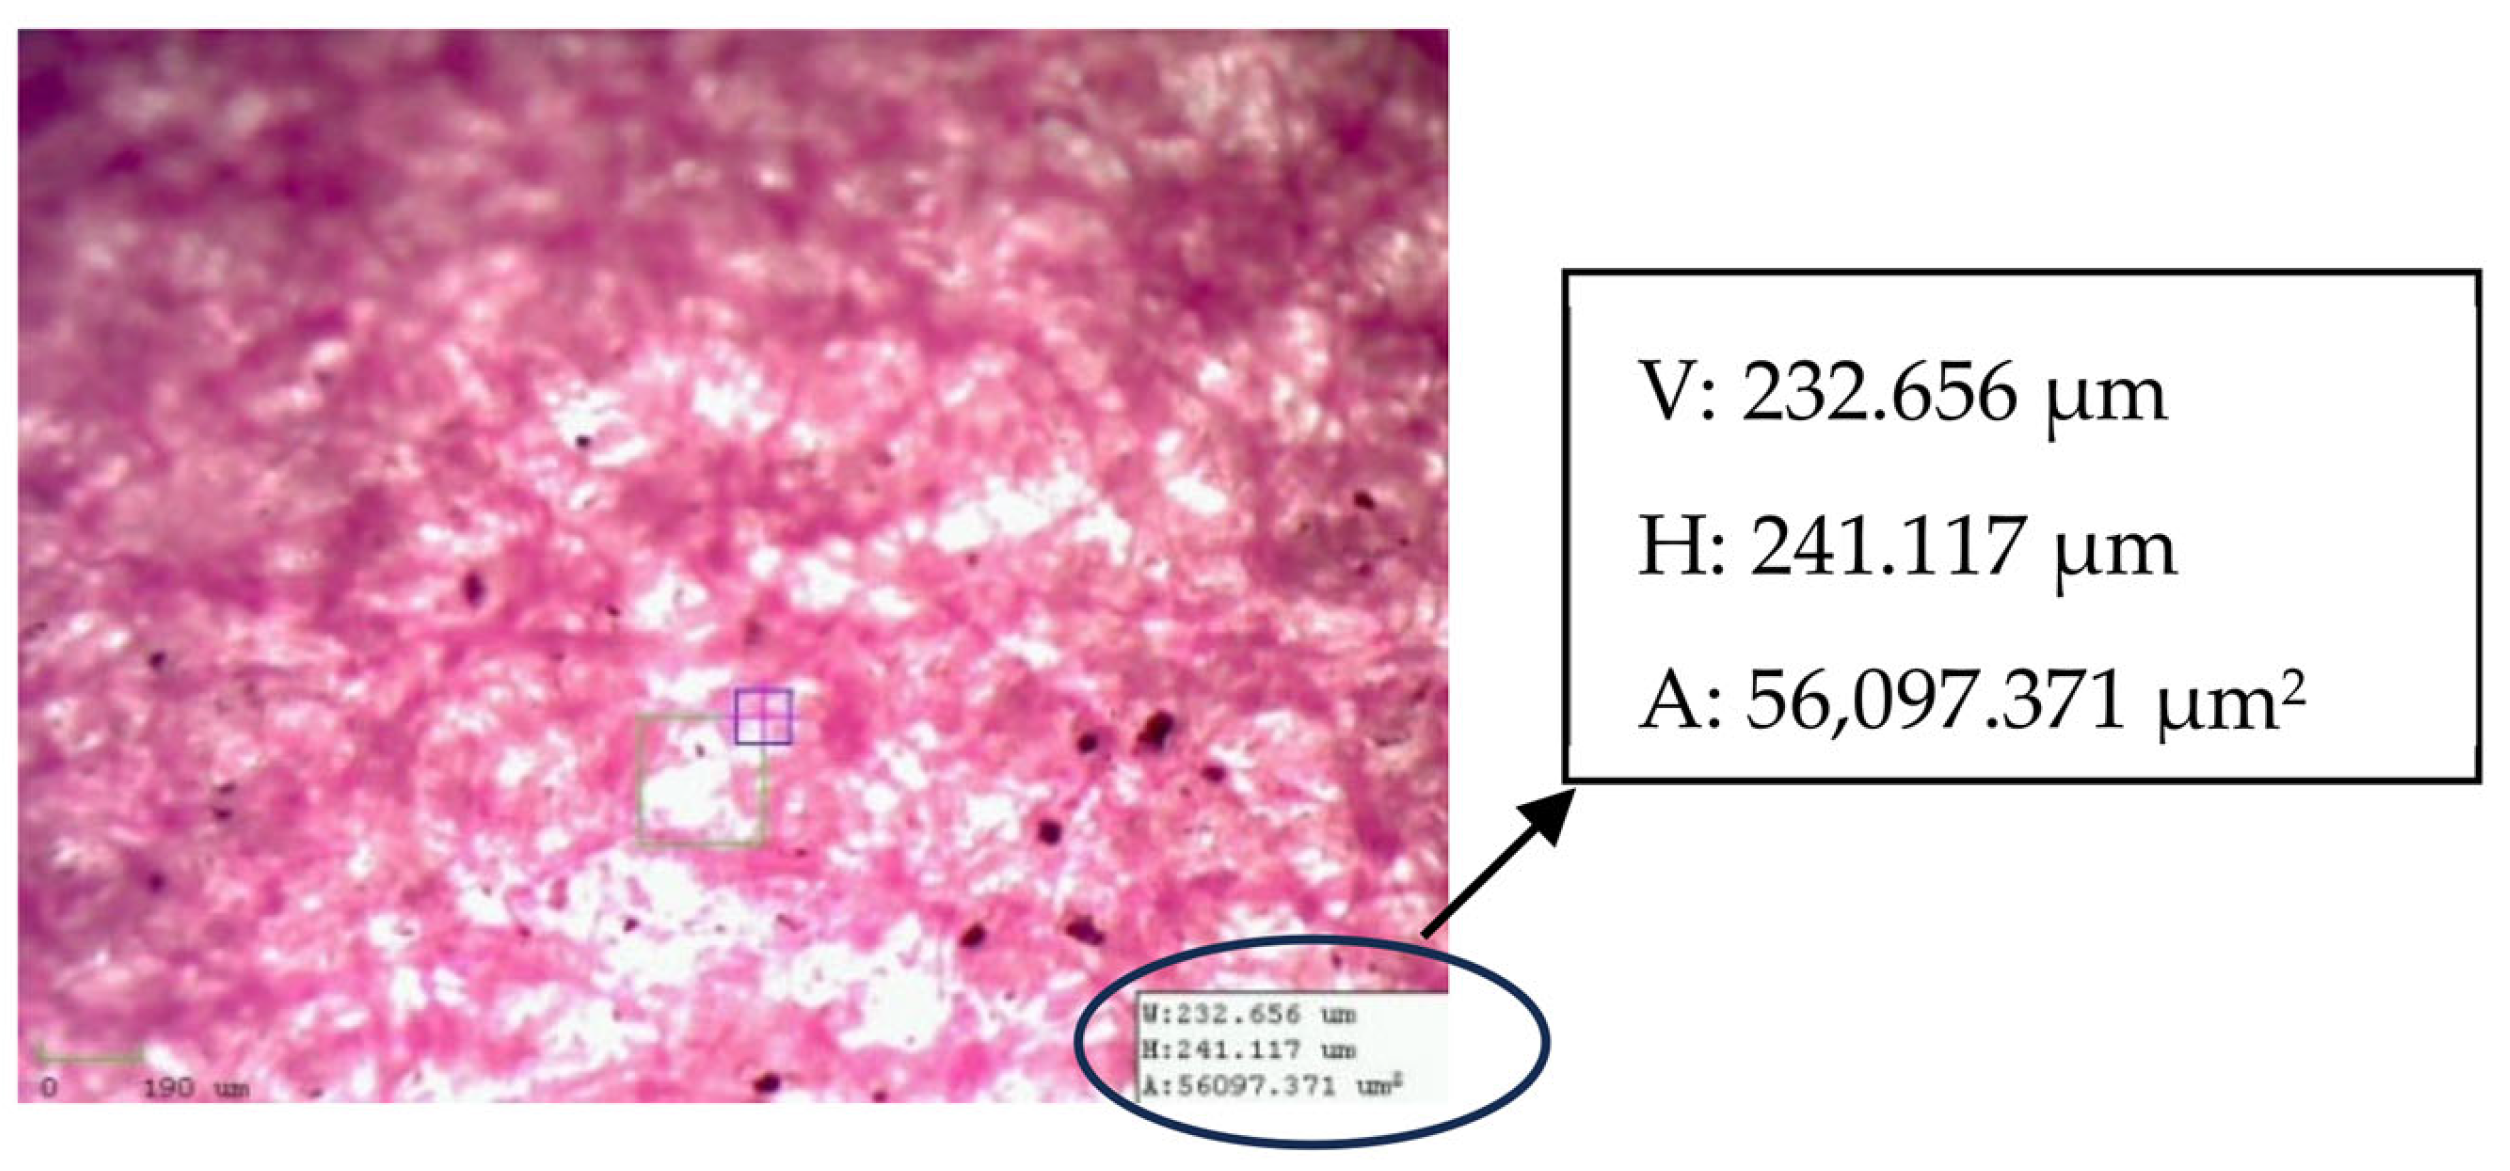
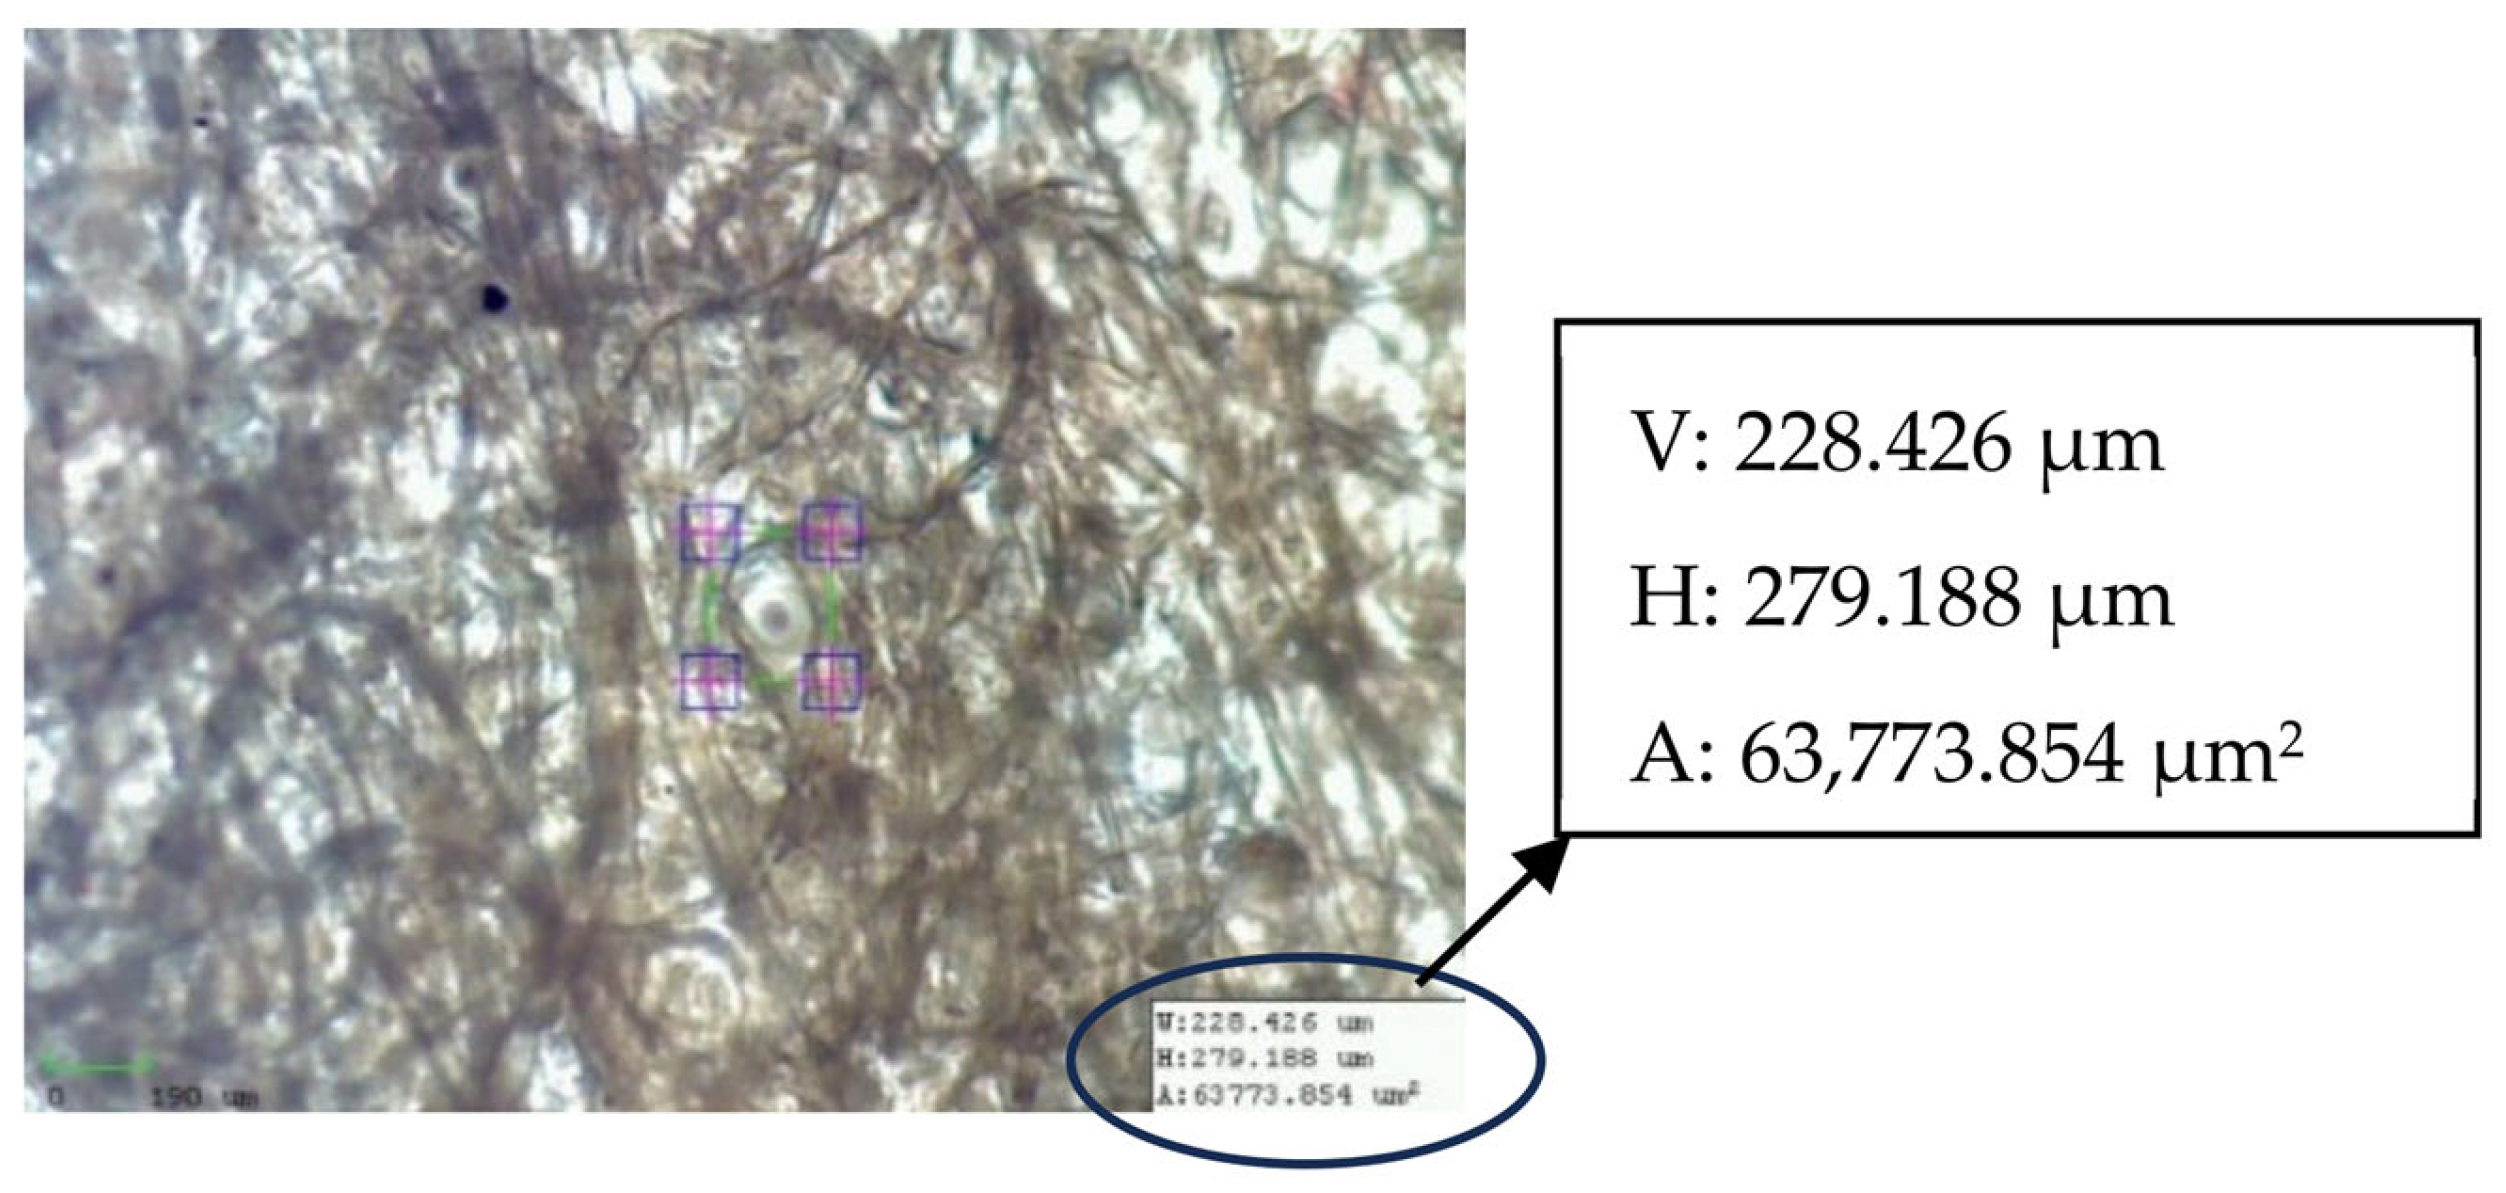
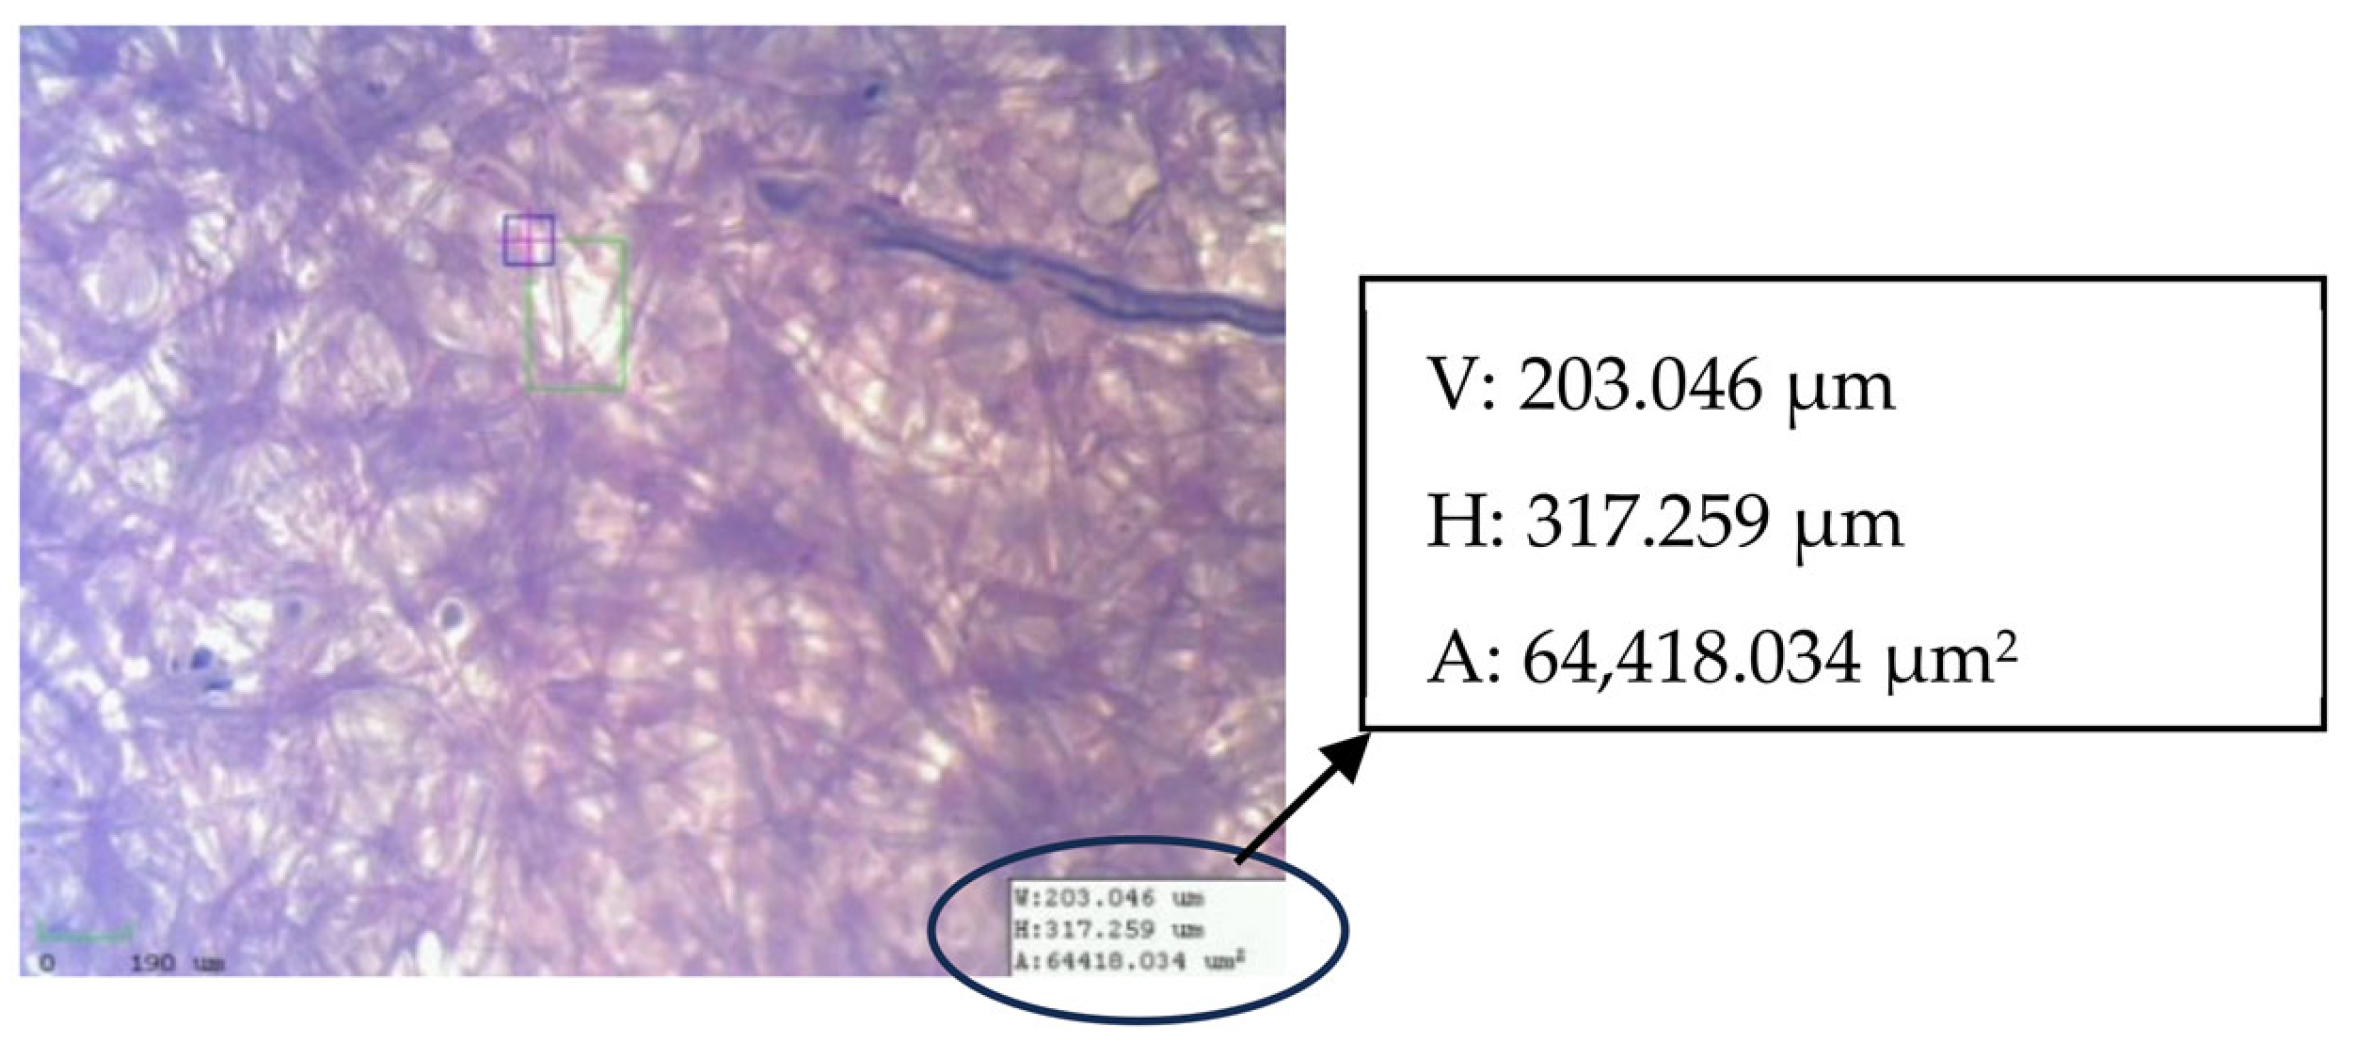
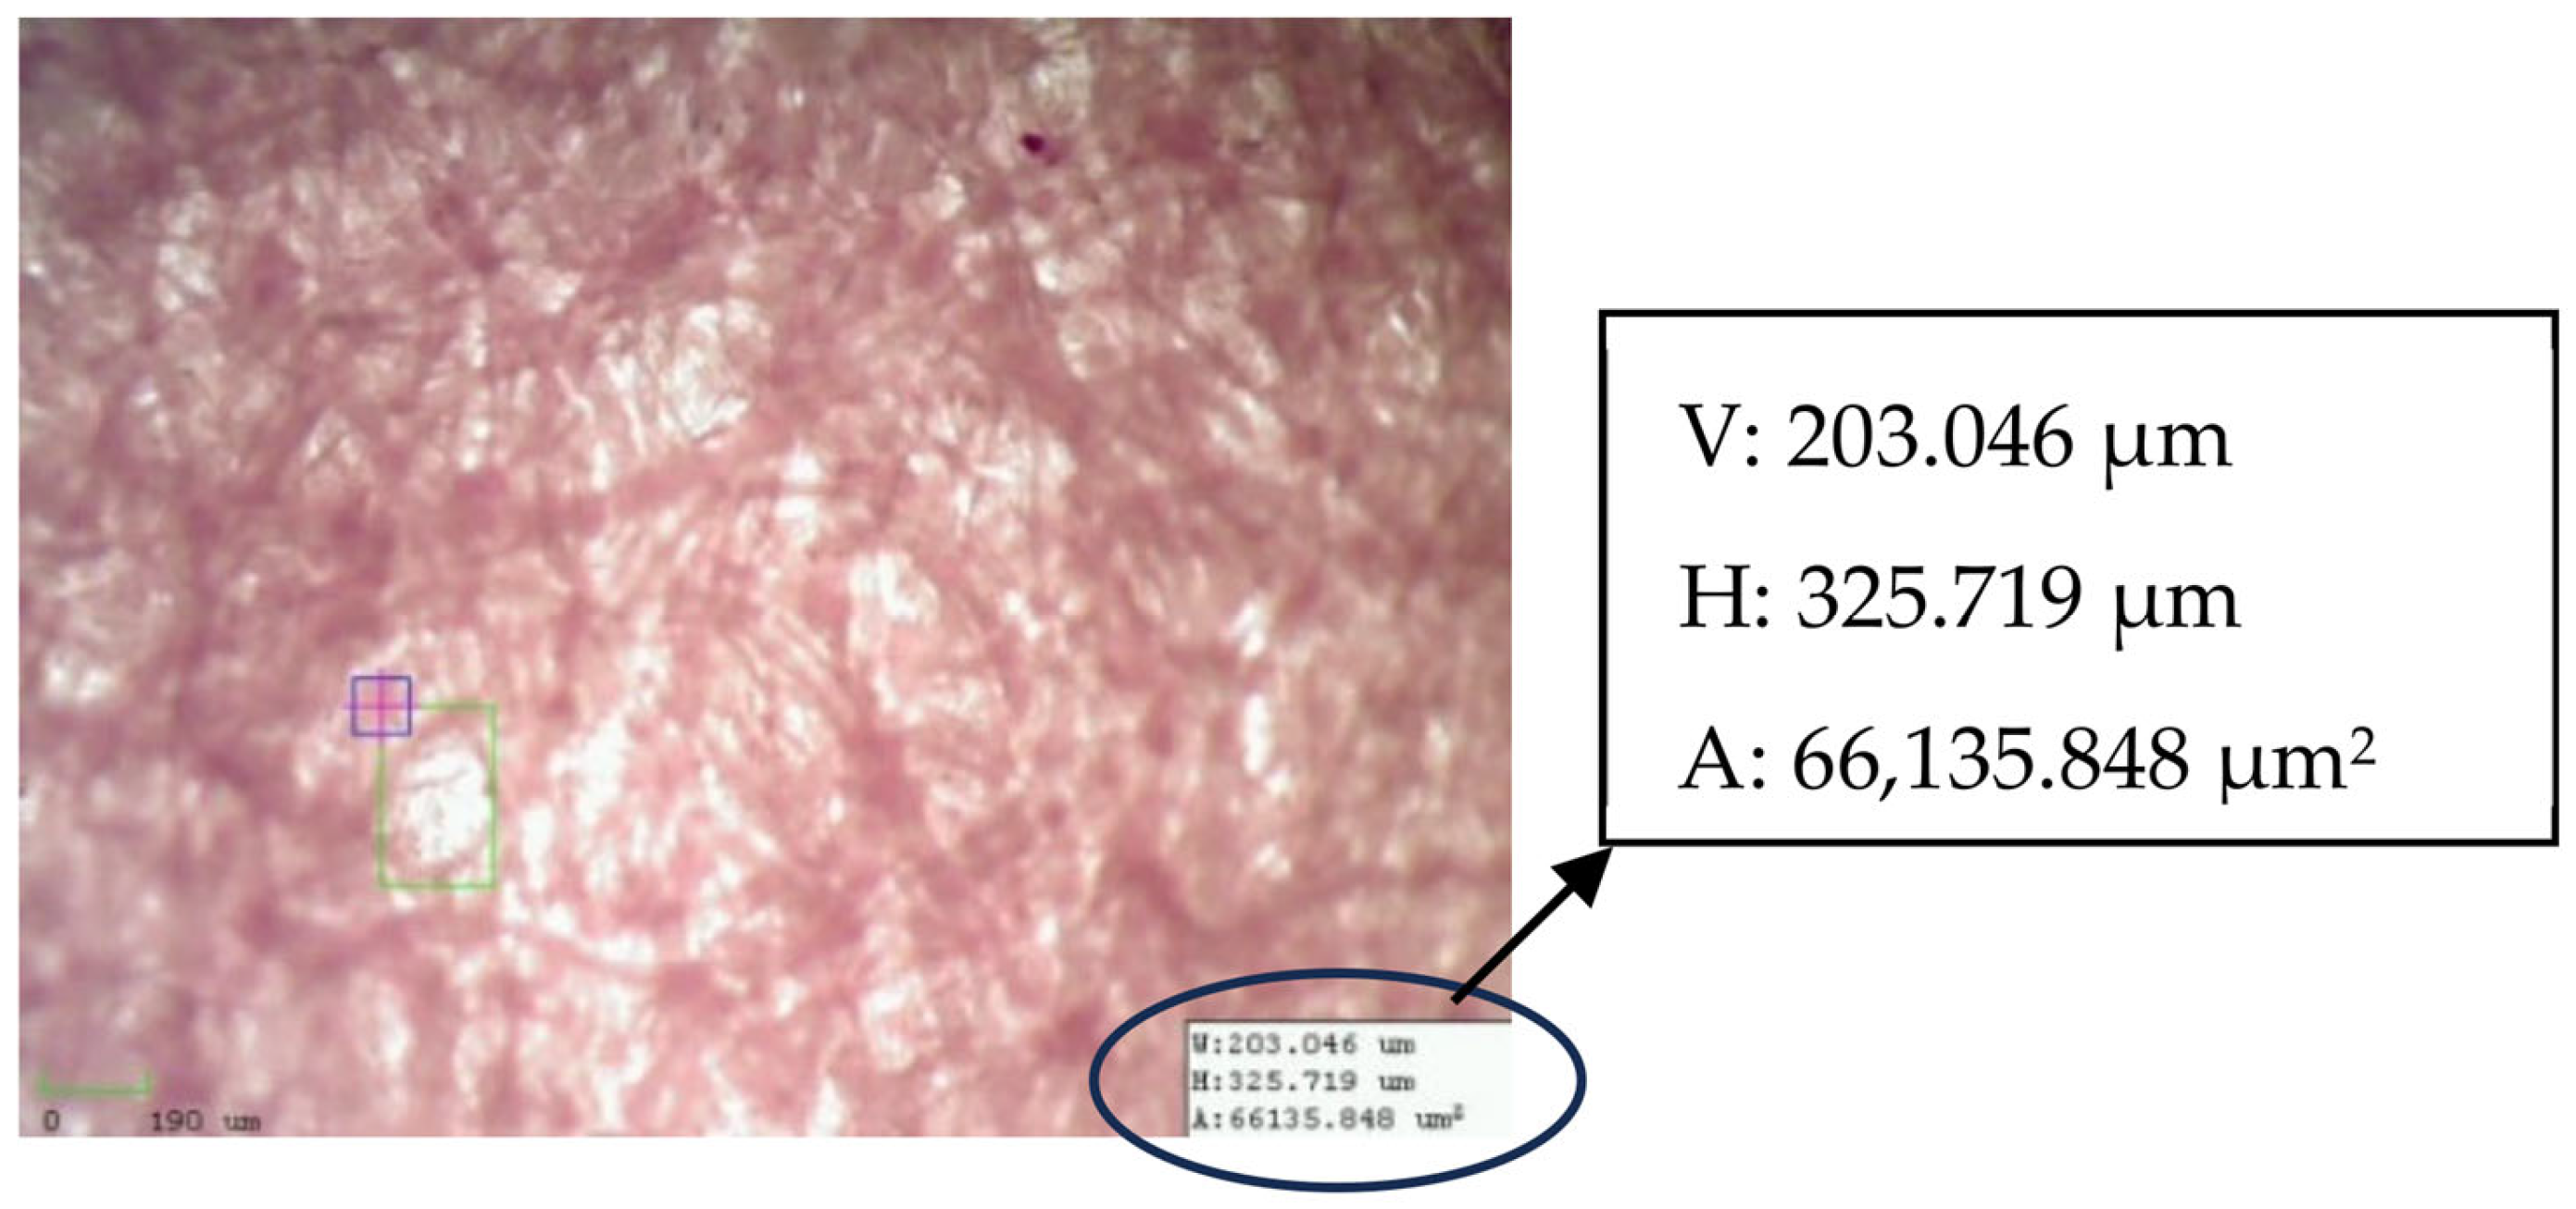
To have a better understanding of the results, the appearance of the samples of the used filter papers is shown in Figure 7, Figure 8, Figure 9, Figure 10 and Figure 11.

ISO 4406 Cleanliness and Particle Concentration

Table 7 summarises the volume-weighted mean diameter of particles D[3,4] after each route and the projected particle filtration area. Filters 3 and 4 provided the cleanest oil (18/15/12) and the smallest D[3,4] (≈24 µm), while filter 2 recorded the highest contamination level (21/18/15) and the largest D[3,4] (≈36 µm). The codes for filters 1 and 5 fell between the two, with overlapping 95% confidence intervals. These results corroborate the findings on pore size and pressure drop described in Section 3.1.
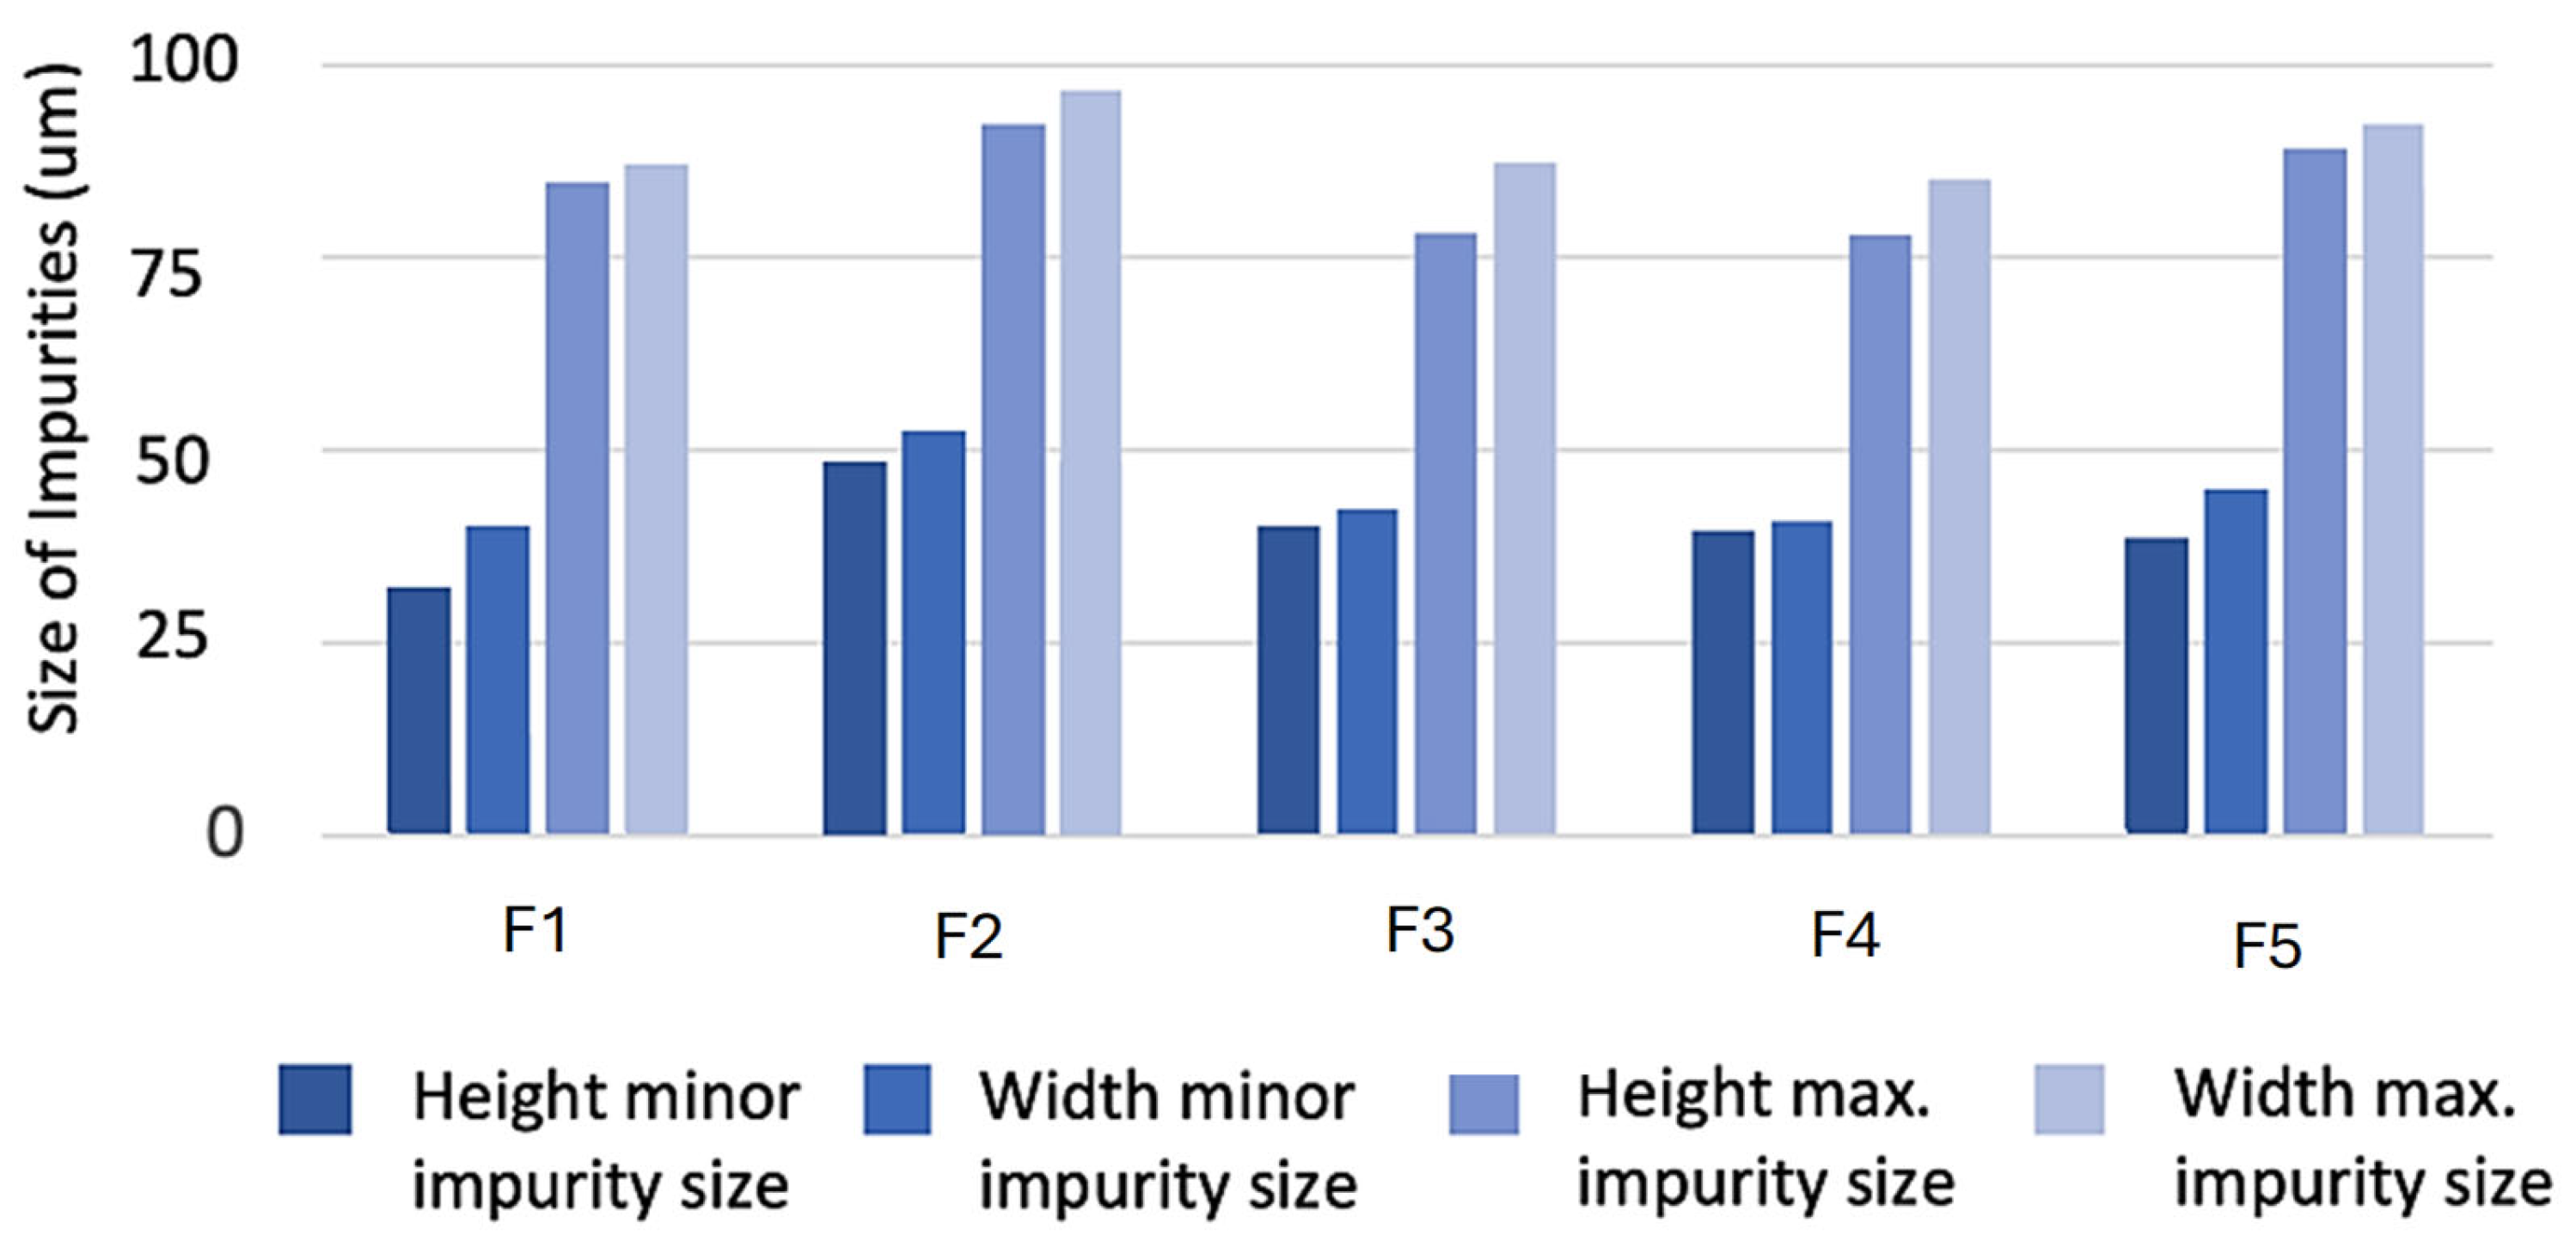
Figure 12 shows the analysis of the impurities found in the used lubricating oil. The major and minor impurities found in the five oil samples are of similar sizes, with the largest being those found in the oil sample used in the test with filter number 2. The dimensions of these impurities are consistent with the pore sizes present in the filters and no particle ≥100 µm was detected in any lubricant sample; the largest class observed was 60–80 µm, with Filter 2 exhibiting the highest frequency in that range.
The combination of this analysis with the study of the pore size in the new filter paper and the pore occupation in the used filter paper shows that of the five filters analysed, the best are from the Filter 4 and original filter brands, with a porosity lower than the rest, thus obtaining better retention of dirt particles, followed by the filter of the same brand of oil studied called Filter 1, and finally the filters of the Filter 2 and Filter 5.
Although our RDE-based microscopy (reported as equivalent circular diameter, ECD) and ISO 4406 cleanliness codes provide information on medium-level morphology and bulk fluid cleanliness, they are not comparable to standard multi-pass performance testing for full-flow engine oil filters. ISO 4548-12 [47] establishes a steady-state multiple-pass method, where contaminants are continuously injected and particles are counted online to determine capture efficiency (beta ratios), dirt-holding capacity, and differential pressure. The historical SAE J1858 [48] standard defined a similar multi-pass procedure and was subsequently cancelled, with ISO 4548-12 being recognised as the international reference. Therefore, our results should be considered as parameter-level comparisons under high-altitude conditions, rather than certified multiple ratings. Future work will conduct a formal ISO 4548-12 campaign to enable direct comparison between different suppliers.
Given the extreme altitude conditions, it is considered that at the elevations covered by our routes, the reductions in density in the standard atmosphere compared to sea level are significant: approximately 20% at 2256 m (ρ ≈ 0.981 kg·m−3), approximately 24.6% at 2850 m (ρ ≈ 0.923 kg·m−3) and approximately 30.5% at 3632 m (ρ ≈ 0.851 kg·m−3). These reductions imply a lower oxygen load per cycle and a possible decrease in volumetric efficiency, with a tendency towards higher specific fuel consumption for a given road load. We present these figures as a theoretical context based on the International Standard Atmosphere; they are not used to attribute causality within our dataset, nor do they alter the ANCOVA result of the model presented.

3.4. Fuel Consumption

Table 8 shows the average fuel consumption results by filter and route obtained from the OBD data on each trip.
Table 8 shows no significant differences in fuel consumption on the Quito-Cuenca route in the tests conducted with Filters 1, 4, and 3. However, Filters 2 and 5 present an increase in fuel. On the Cuenca-Quito route, there is no clear pattern, particularly in Filter 5, where the lowest consumption was observed. The authors consider that these results do not allow us to obtain any meaningful insights from this variable that would enable us to compare the filters. As summarised above, once measurement uncertainty is considered, none of the tested filters produced a statistically significant change in fuel consumption along either route.

Measurement Uncertainty

The combined error of the Coriolis mass-flow metre (±0.5%), GPS distance (±1%), and tyre-related odometer drift (±3%) yields an overall uncertainty of ±5% in fuel consumption (SFC). An analysis of covariance (ANCOVA) was conducted with route altitude segment and mean vehicle speed as covariates to determine if the minor changes in Table 5 are statistically significant. The test revealed no appreciable main effect of filter type on SFC (F = 1.27, p = 0.29), therefore suggesting that the observed differences are within experimental noise.
We fitted simple and multiple regressions to explore associations between fuel consumption and candidate covariates (e.g., route altitude segment, mean speed, engine speed/load and CO2). Given the limited sample size and the magnitude of MAE/RMSE relative to a naïve mean-only baseline, these models are not presented as predictive. We therefore rely on ANCOVA for inference, which detected no significant main effect of filter on fuel consumption (F = 1.27, p = 0.29). See Supplementary File S1 for a specific consumption prediction model according to filter type and route.

4. Conclusions

The analysis of oil filters revealed that those with smaller pore diameters—specifically Filter 3 and Filter 4—demonstrated superior contaminant retention capabilities. Notably, Filter 4 exhibited a 35.4% reduction in average pore size in the used filter paper compared to its new state, indicating enhanced impurity capture efficiency relative to the other filters evaluated.
Microscopic examination of the lubricant confirmed that Filters 3 and 4 demonstrated greater efficiency in engine operation by significantly reducing the presence of particles larger than 100 µm. In contrast, Filter 2 had a significantly higher concentration of contaminants, with an average particle size 17.5% larger, indicating inferior performance in critical engine protection.
Under real-world driving conditions, with altitude variations between 2500 and 3500 m above sea level, filters with lower porosity maintained greater stability in lubricant viscosity. Filter 4 preserved 92% viscosity stability, compared to 78% for Filter 2, indicating lower degradation under thermal and mechanical stress.
Fuel consumption analysis showed no statistically significant differences among most filters, with values ranging from 28.95 km/gL (Filter 4) to 35.47 km/gL (Filter 1) on the Cuenca–Quito route. Inter-route scatter and instrument noise account for the apparent spread in fuel-use figures across filters. Consistent with this, ANCOVA detected no statistically significant effect of the filter on fuel consumption (F = 1.27, p = 0.29); we therefore refrained from attributing practical differences to filter choice in this dataset.
Based on these findings, Filters 3 and 4 are recommended for optimising engine longevity and maintaining lubricant quality due to their superior particle retention and viscosity stability. Conversely, Filter 2 is not recommended, as it demonstrated the highest impurity accumulation and the most pronounced lubricant degradation throughout the test cycle. We make no claims about durability. Future work will combine cleaning and media metrics with direct assessments of wear (ICP-OES, PQ index, analytical ferrography, and filter autopsy) to enable causal interpretation.
Future campaigns will employ a comprehensive suite of diagnostic tools—including used-oil ICP-OES/PQ, analytical ferrography, and filter autopsy—alongside in-service monitoring of ΔP and KV100. This integrated approach is designed to establish definitive correlations between lubricant cleanliness, media characteristics, and component wear.

Supplementary Materials

The following supporting information can be downloaded at: https://www.mdpi.com/article/10.3390/lubricants13100437/s1, Supplementary File S1–Data and variables.

Author Contributions

Conceptualization, E.V.R.-R.; Methodology, E.V.R.-R.; Software, C.M.-T.; Validation, E.V.R.-R. and C.M.-T.; Formal analysis, E.V.R.-R.; Investigation, P.P.-R. and C.M.; Data curation, E.V.R.-R., P.P.-R. and L.T.; Writing – original draft, C.M.-T. and P.P.-R.; Writing – review & editing, C.M. and J.B.; Visualization, J.B. and L.T.; Supervision, C.M. All authors have read and agreed to the published version of the manuscript.

Funding

This research received no external funding.

Institutional Review Board Statement

Not applicable.

Informed Consent Statement

Not applicable.

Data Availability Statement

The original contributions presented in this study are included in the article and Supplementary Material. Further inquiries can be directed to the corresponding author.

Conflicts of Interest

The authors declare no conflicts of interest.

References

  1. Rovai, F.F.; Sartori, E.; Crepaldi, J.; Rajala, S. Engine Lubricant Impact in Light-Vehicle Fuel Economy: A Combined Numerical Simulation and Experimental Validation. Lubricants 2025, 13, 137. [Google Scholar] [CrossRef]
  2. Levendis, Y.; Johannesen, L.T. Recent Developments in the Design of a Ceramic Automotive OilFilter. In Proceedings of the SAE 2011 World Congress and Exhibition, Detroit, MI, USA, 12–14 April 2011. [Google Scholar] [CrossRef]
  3. Alie, A.; Darwito, P.A. Improve of Engine Oil Lifetime by Using Additional Filter A Case Study at PT Vale Indonesia TBK. AIP Conf. Proc. 2019, 2088, 020004. [Google Scholar] [CrossRef]
  4. Why Full Synthetic Media Is Important. Available online: https://www.purolatornow.com/en/resources/Why-Full-Synthetic-Media-is-Important.html (accessed on 28 September 2025).
  5. Botov, S.; Wooley, R. Investigation on Novel Polymer Filter Medium for Filtration of Automotive Lubricants. Ph.D. Thesis, University of Sheffield, Sheffield, UK, 2016. [Google Scholar]
  6. Devlin, M.T. Common Properties of Lubricants That Affect Vehicle Fuel Efficiency: A North American Historical Perspective. Lubricants 2018, 6, 68. [Google Scholar] [CrossRef]
  7. Feng, J.Y.; Zhang, J. The Property of Automobile Engine Oil Filtration Material and the Development of New Filter. J. Eng. Fiber Fabr. 2014, 9, 134–141. [Google Scholar] [CrossRef]
  8. Darcy, H. Les Fontaines Publiques de La Ville de Dijon Exposition et Application Des Principes a Suivre et Des Formulesa Employer Dans Les Questions de Distribution d’Eau; Dalmont, V., Ed.; Gallica: Paris, France, 1856; 647p. [Google Scholar]
  9. Carman, P.C. Flow of Gases through Porous Media; Butterworths Scientific Publications: London, UK, 1956; p. 5. [Google Scholar]
  10. Regulations to the Law on Land Transport, Traffic, and Road Safety. Available online: https://www.mit.gob.ec/wp-content/uploads/downloads/2015/03/Decreto-Ejecutivo-No.-1196-de-11-06-2012-REGLAMENTO-A-LA-LEY-DE-TRANSPORTE-TERRESTRE-TRANSITO-Y-SEGURIDAD-VIA.pdf (accessed on 28 September 2025).
  11. Tian, X.; Wei, H.; Wang, W.; Huang, Y.; Wang, H.; Pan, J.; Wang, R.; Li, Z. An Investigation of the Filtration Performance and Mechanism of Oil-Solid Mixed Particles on Filter Materials with Different Wettability. Sep. Purif. Technol. 2024, 349, 127903. [Google Scholar] [CrossRef]
  12. Tulík, J.; Kosiba, J.; Varga, F.; Bureš, Ľ.; Šinský, V. Analysis of Synthetic Oil Samples During an Operating Test. Acta Technol. Agric. 2013, 16, 22–25. [Google Scholar] [CrossRef]
  13. Stanley, I.; Schmitz, S. Advances in Filtration in Automatic Lube Oil Filters. In Proceedings of the 2018 Joint Rail Conference, JRC 2018, Pittsburgh, PA, USA, 18–20 April 2018; American Society of Mechanical Engineers (ASME): New York, NY, USA, 2018. [Google Scholar]
  14. Nazarova, E.; Alimova, D.S.; Mikhaylov, V.I.; Krivoshapkina, E.F.; Krivoshapkin, P.V. Macroporous Ceramic Filters from Mineral Raw Materials for Machine Oils Filtration. Ceram. Int. 2019, 45, 8767–8773. [Google Scholar] [CrossRef]
  15. Wu, Y. An Analysis of Constant-Pressure Filtration. Chem. Eng. Sci. 1994, 49, 831–836. [Google Scholar] [CrossRef]
  16. Blanco-Rodríguez, J.; Simón-Montero, X.; Cortada-García, M.; Maroto, S.; Jacobo, P. Modelling the Impact of Reducing Lubricant Viscosity on a Conventional Passenger Car Fuel Economy and Wear Protection. Results Eng. 2024, 24, 103159. [Google Scholar] [CrossRef]
  17. Hoag, K.; Dondlinger, B. Vehicular Engine Design, 2nd ed.; Springer International Publishing: Berlin/Heidelberg, Germany, 2015. [Google Scholar]
  18. Li, H.; Wang, S.; Liu, M.; Song, R.; Cui, K.; Chang, C. Study on Filtration Efficiency of Filter Elements for Lubricating Oil Separation. Processes 2025, 13, 2067. [Google Scholar] [CrossRef]
  19. Lamon, D.; Zhang, D. The Evaluation of Mechanical Design and Comparison of Automotive Oil Filters. SAE Int. J. Fuels Lubr. 2010, 3, 346–361. [Google Scholar] [CrossRef]
  20. Yang, Y.; Chang, C.; Liu, T.; Feng, Y.; Wang, Y.; Jin, J.; Cui, K.; Xie, P.; Wu, X. Effect of Liquid Properties on Filtration Performance of Filters for Lubricating Oil Separation from Natural Gas. Chem. Eng. Res. Des. 2025, 216, 282–292. [Google Scholar] [CrossRef]
  21. Gangopadhyay, A.; Liu, Z.; Simko, S.; Lam, W.; Devlin, M.T. The Effect of Friction Modifiers and Additive Packages on Friction Reduction Potential of Next Generation Engine Oils—Part II: Aged Oils. In Proceedings of the 72nd STLE Annual Meeting, Atlanta, GA, USA, 21–25 May 2017. [Google Scholar]
  22. Tejada Tovar, C.N.; Quiñones Bolaños, E.; Fong Silva, W. Physical-Chemical Caracterization of Spent Engine Oils for Its Recycling // Caracterización Físico-Química de Aceites Usados de Motores Para Su Reciclaje. Prospectiva 2017, 15, 135–144. [Google Scholar] [CrossRef]
  23. Chen, X.; Wang, Z.; Pan, S.; Pan, B. A Novel Biomass Lubricant Filter and Its Effect on Gasoline Engine Emissions and Fuel Economy. J. Energy Inst. 2019, 92, 332–340. [Google Scholar] [CrossRef]
  24. Kushwaha, G.; Saraswati, S.; Paul, B. Effect of Different Lubricating Oil on the Adsorption/Desorption Process of Fuel in Oil Layer in an SI Engine. Lubr. Sci. 2017, 29, 73–91. [Google Scholar] [CrossRef]
  25. Jokinen, A.; Calonius, O.; Pietola, M.; Gorle, J.; Hannifin, P. Effects of Oil Contamination Level, Flow Rate and Viscosity on Pressure Drop Development and Dirt Holding Capacity of Hydraulic Filter. In Proceedings of the ASME/BATH 2019 Symposium on Fluid Power and Motion Control, FPMC 2019, Longboat Key, FL, USA, 7–9 October 2019; American Society of Mechanical Engineers (ASME): New York, NY, USA, 2020. [Google Scholar]
  26. Peuchot, C.; Petillon, N.; Lynch, J. Filter Efficiency and Liquids: The Advantages of Cartridge Filters. Filtr. Sep. 2008, 45, 11–13. [Google Scholar] [CrossRef]
  27. Hujo, Ľ.; Michalides, M.; Nosian, J.; Simikić, M. Measurement of Flow and Pressure Characteristics of Combustion Engine Oil Filters. MATEC Web Conf. 2021, 351, 01004. [Google Scholar] [CrossRef]
  28. Peaslee, K.D. Recycling Used Automotive Oil Filters. JOM 1994, 46, 44–46. [Google Scholar] [CrossRef]
  29. Levendis, Y.A. Design and Testing of a Novel Environmentally-Benign Automotive Oil Filter. In Proceedings of the SAE 2011 World Congress and Exhibition, Detroit, MI, USA, 13–15 April 2010. [Google Scholar]
  30. Semjonovs, J.; Springis, G.; Leitans, A. Increasing of Engine Oil Change Interval by Using Additional Oil Filter in Diesel Engines; Riga Technical University: Riga, Latvia, 2014. [Google Scholar]
  31. Feng, J.Y.; Zhang, J.C.; Hua, Z.; Yang, D.X. Based on the Main Factor Mathematical Method to Study on the Structure and Performance of Automobile Engine Oil Filter Materials. Adv. Mater. Res. 2012, 507, 11–15. [Google Scholar] [CrossRef]
  32. Gulzar, M.; Masjuki, H.H.; Kalam, M.A.; Varman, M.; Rizwanul Fattah, I.M. Oil Filter Modification for Biodiesel-Fueled Engine: A Pathway to Lubricant Sustainability and Exhaust Emissions Reduction. Energy Convers. Manag. 2015, 91, 168–175. [Google Scholar] [CrossRef]
  33. AEADE. Boletín Sector Automotor En Cifras; AEADE—Asociación de Empresas Automotrices Del Ecuador: Quito, Ecuador, 2024. [Google Scholar]
  34. ND ECOREPUESTOS Repuestos Automotrices Genuinos y Alternos. Available online: https://www.ecorepuestos.ec/ (accessed on 28 September 2025).
  35. Hyundai Santa Fe 2.7 Style Aut. 5 Plazas (2008–2009). Available online: https://www.km77.com/coches/hyundai/santa-fe/2006/estandar/style/santa-fe-27-style-aut-5-plazas2/datos (accessed on 28 September 2025).
  36. ASTM D445; Standard Test Method for Kinematic Viscosity of Transparent and Opaque Liquids (and Calculation of Dynamic Viscosity). ASTM International: West Conshohocken, PA, USA, 2021.
  37. ASTM D4052; Standard Test Method for Density, Relative Density, and API Gravity of Liquids by Digital Density Meter. ASTM International: West Conshohocken, PA, USA, 2018.
  38. ASTM D97; Standard Test Method for Pour Point of Petroleum Products. ASTM International: West Conshohocken, PA, USA, 2017.
  39. ASTM D92; Standard Test Method for Flash and Fire Points by Cleveland Open Cup Tester. ASTM International: West Conshohocken, PA, USA, 2018.
  40. ASTM D874; Standard Test Method for Sulfated Ash from Lubricating Oils and Additives. ASTM International: West Conshohocken, PA, USA, 2019.
  41. Select 20w-50 Engine Oil Product Description. Available online: www.acdelco.com.au (accessed on 21 September 2025).
  42. ISO 14230-4; Road vehicles—Diagnostic systems—Keyword Protocol 2000 — Part 4: Requirements for emission-related systems. ISO: Geneva, Switzerland, 2000.
  43. ISO 4406; Hydraulic fluid power—Fluids—Method for coding the level of contamination by solid particles. ISO: Geneva, Switzerland, 2021.
  44. ASTM D2896; Standard Test Method for Base Number of Petroleum Products by Potentiometric Perchloric Acid Titration. ASTM International: West Conshohocken, PA, USA, 2021.
  45. CEC L-14-93; Evaluation of the Mechanical Shear Stability of Lubricating Oils Containing Polymers (Fuel Injection Pump). CEC: United Kingdom, 1993.
  46. ASTM F316-03 (Reapproved 2019); Standard Test Methods for Pore Size Characteristics of Membrane Filters by Bubble Point and Mean Flow Pore Test. ASTM International: West Conshohocken, PA, USA, 2019.
  47. ISO 4548-12; Methods of test for full-flow lubricating oil filters for internal combustion engines—Part 12: Filtration efficiency using particle counting. ISO: Geneva, Switzerland, 2017.
  48. SAE J1858; Full-Flow Lubricating Oil Filters—Multipass Method for Evaluating Filtration Performance. SAE International: Warrendale, PA, USA, 2002.
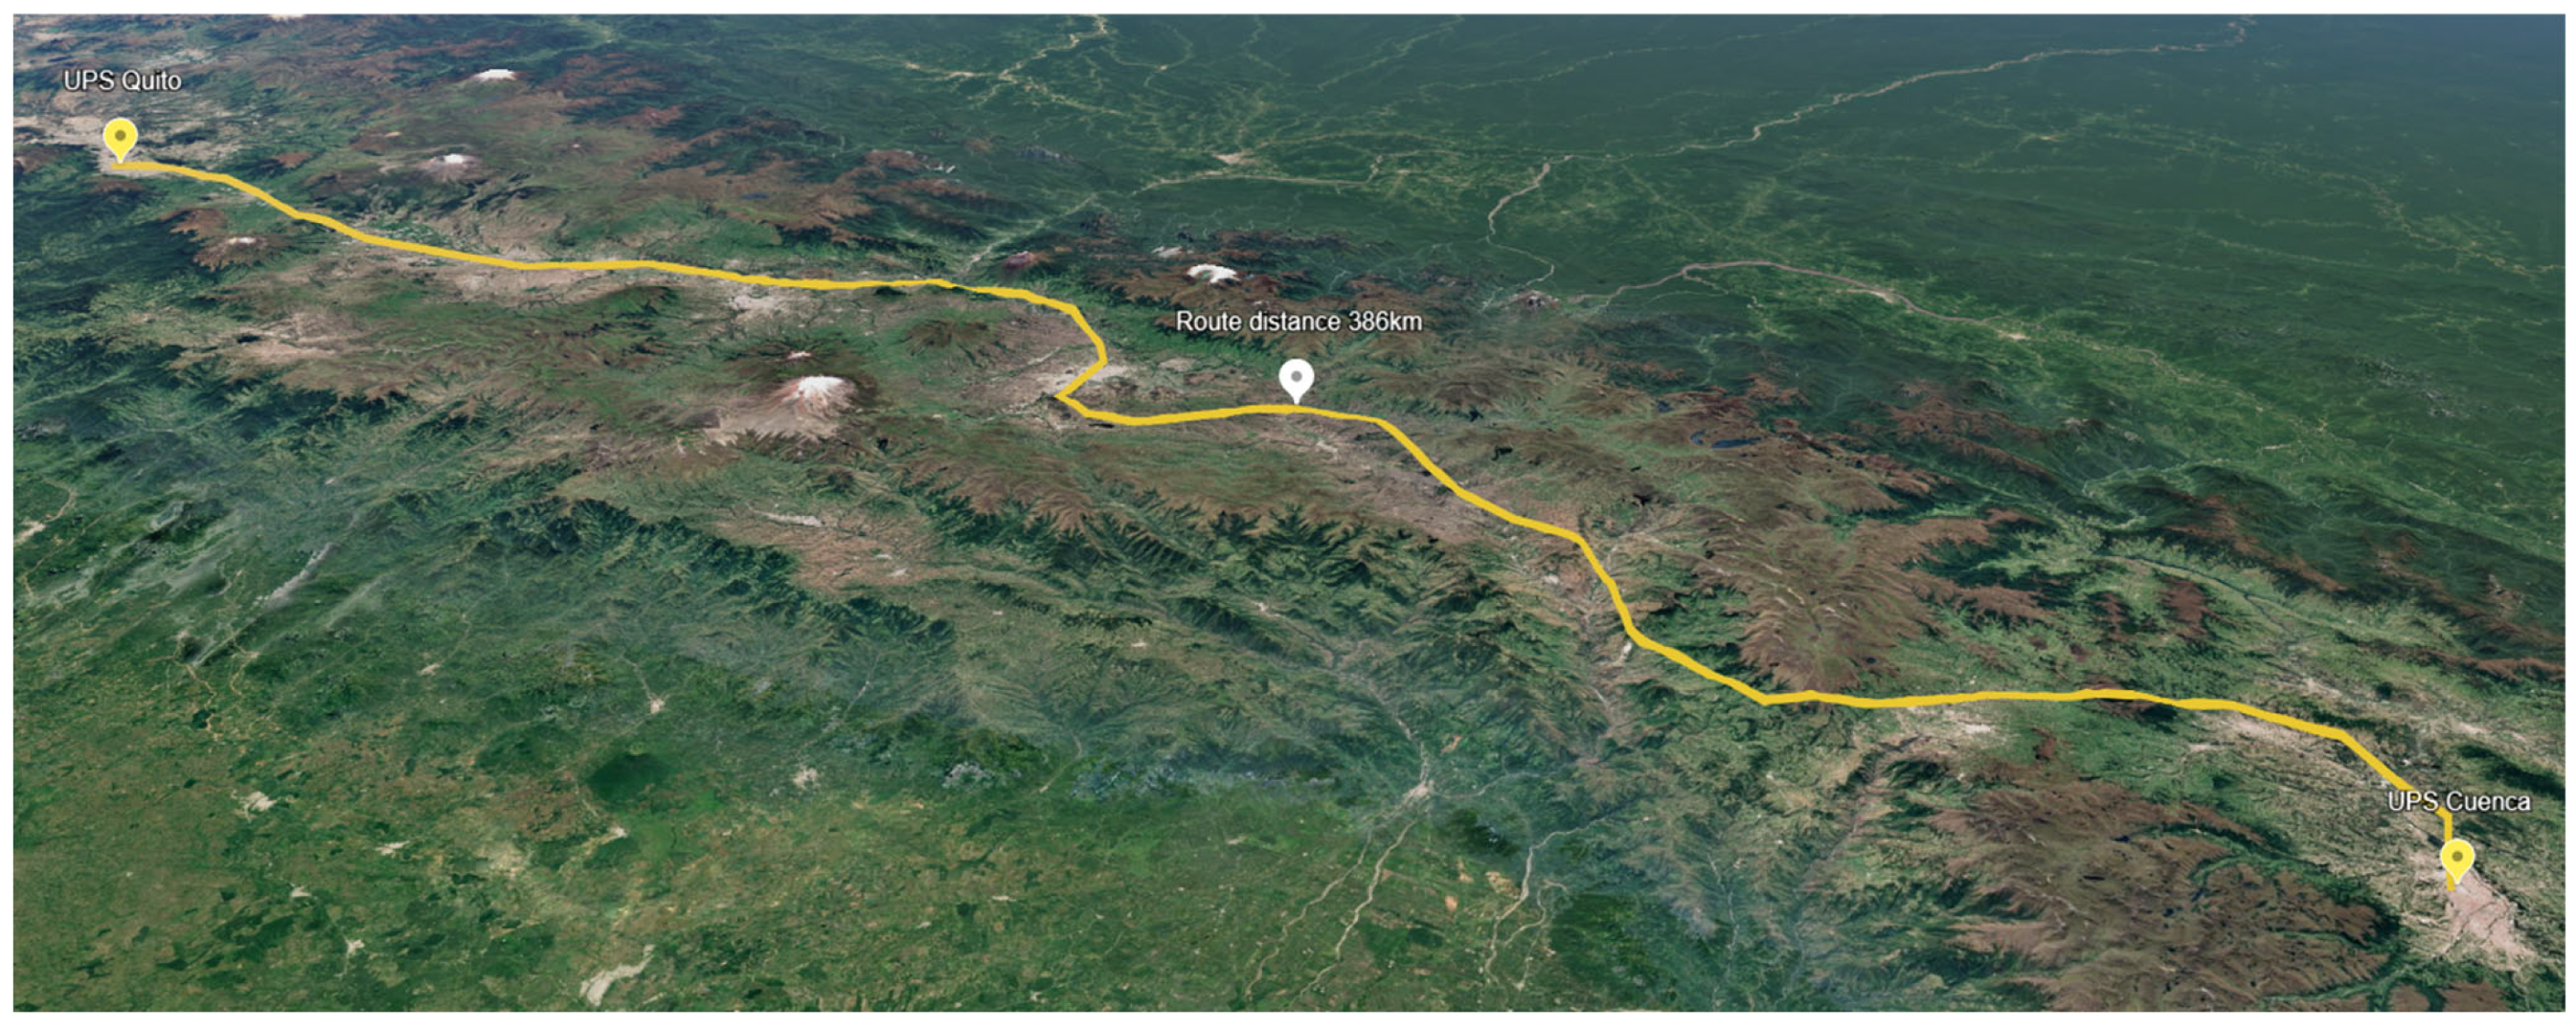
Figure 1. Sections of the route Quito-Cuenca and Cuenca-Quito. “Sierra Route”.
Lubricants 13 00437 g001
Figure 2. OBD Link MX+ ELM327.
Lubricants 13 00437 g002
Figure 3. Flow cart test.
Lubricants 13 00437 g003
Figure 4. Model Validation.
Lubricants 13 00437 g004
Figure 5. Filter paper sample.
Lubricants 13 00437 g005
Figure 6. New filter paper sample with a 10× lens.
Lubricants 13 00437 g006
Figure 7. F1 Optical micrograph, 10× objective. Quantities shown correspond to the largest captured feature in the field: vertical span (V), horizontal span (H) and projected area (A) (ToupView v4.11, Otsu threshold; calibrated scale).
Lubricants 13 00437 g007
Figure 8. F2 Optical micrograph, 10× objective; V, H and A reported for the largest feature; processing as in Figure 7 (ToupView v4.11, Otsu threshold; calibrated scale).
Lubricants 13 00437 g008
Figure 9. F3 Optical micrograph, 10× objective; V, H and A for the largest feature; same analysis pipeline (ToupView v4.11, Otsu; calibrated scale).
Lubricants 13 00437 g009
Figure 10. F4 Optical micrograph, 10× objective; V, H and A for the largest feature; same analysis pipeline and calibration as above.
Lubricants 13 00437 g010
Figure 11. F5 Optical micrograph, 10× objective; V, H and A for the largest feature; same analysis pipeline and calibration as above.
Lubricants 13 00437 g011
Figure 12. Statistical data of the impurities in lubricant oil taken with a 40× lens.
Lubricants 13 00437 g012
Table 1. Mapping of internal filter codes to parameter-based identifiers.
AttributeF1F2F3F4F5
Parameter-based identifierAftermarket, cellulose mediaOEM-type, higher mean pore metricOEM, lower mean pore metricOEM, lowest mean pore metricAftermarket, intermediate pore metric
Commercial referenceACDelco PF46Toyota 90915-YZZD2 (OEM)Kia 26300-35503Hyundai 26300-35503Shogun W 610/3
Equivalent Circular Diameter (µm, NFP 5×, min–max)97.20–166.76113.94–252.5365.53–120.5467.49–139.01109.90–135.45
Mean pore diameter (µm)150130110100120
Thread13/16-16 UN3/4-16 UNFM20 × 1.5M20 × 1.5M20 × 1.5
Anti-drainback valveYesYesNitrileNitrileYes
Bypass valve (setting)Engine-mounted (no bypass in can)0.75–1.2 bar14 psi (~0.97 bar)14 psi (~0.97 bar)1.0 bar
Filter media (declared)Cellulose + polyester + microglassCellulose“NanoFiber (Donaldson Synteq)”“NanoFiber (Donaldson Synteq)”Cellulose
Efficiency (declared)98% @ 25–30 µm99% @ 40 µm (SAE J1858)20 µm absolute20 µm absolute
Filtering area/pleats497 cm2/35497 cm2/35
Collapse/burst100 psi (collapse, typical listing)330 psi (burst)330 psi (burst)
Max. flow34–42 L/min34–42 L/min
Table 2. Test vehicle and engine specifications [35].
ParameterValueUnits
Engine codeG6EA (Hyundai Mu/Delta V6)2.7 L, DOHC, 24 Valves.
Cylinders & layout6, V6 (60°), cross-cutting
Displacement2656cm3
Bore × Stroke86.7 × 75.0mm × mm.
Compression ratio10.4:1
Fuel systemMulti-port fuel injection (MPi)
Cooling systemWater-cooledPressurised water-glycol circuit.
Max. power138 kW @ 6000 min−1≈185 HP
Max. torque247 Nm @ 4000 min−1≈182.18 ft-lbs
Emissions standardEURO 4
Vehicle curb weight1780kg
Odometer at test180,000Kilometres
Table 3. Physicochemical characteristics [41].
PropertyUnitMethodTypical Value
Density @15.6 °Cg/mLASTM D40520.89
Kinematic viscosity @40 °CcStASTM D445185
Kinematic viscosity @100 °CcStASTM D44520.5
Pour point°CASTM D97−33
Flash point (open cup)°CASTM D92230
Sulphated ashwt%ASTM D8740.8
Table 4. Routes chosen for research.
Sierra Route
SectionDistanceHeight
Max.
Height
Min.
Duration Trip
Quito-Salcedo38.6 km3515 m2670 m1 h 17 min
Salcedo-Riobamba88.0 km3632 m2398 m2 h 38 min
Riobamba-Alausí89.2 km3390 m2374 m1 h 14 min
Alausí-Tambo95 km3094 m2256 m3 h 08 min
Tambo-Cuenca75.7 km3572 m2353 m1 h 07 min
Table 5. In situ pressure drop (ΔP) and viscosity stability per filter and route.
FilterRouteΔP Range (bar)Viscosity Before (cSt @100 °C)Viscosity After (cSt @100 °C)Stability (%)
1Q–C0.10–0.1320.519.695.6
1C–Q0.10–0.1320.519.595.1
2Q–C0.12–0.1420.519.092.7
2C–Q0.12–0.1420.519.193.2
3Q–C0.09–0.1220.519.896.6
3C–Q0.09–0.1220.519.997.1
4Q–C0.09–0.1220.519.796.1
4C–Q0.09–0.1220.519.896.6
5Q–C0.11–0.1320.519.293.7
5C–Q0.11–0.1320.519.394.1
Table 6. Pore size in new and used filter paper at 5×.
Oil FilterMin Pore ECD (NFP)Min Pore ECD (UFP)Max Pore ECD (NFP)Max Pore ECD (UFP)
F197.20120.54166.76236.85
F2113.94127.09252.53354.42
F365.53120.42120.54219.96
F467.49124.62139.01198.77
F5109.90169.90135.45175.48
Table 7. Lubricant cleanliness (ISO 4406) and mean particle diameter after 960 km.
FilterMean Equivalent Particle Diameter deq (µm)Projected Area of the Particle
F126756,097 µm2
F228563,774 µm2
F328664,418 µm2
F429066,136 µm2
F519228,934 µm2
Table 8. Average consumption in each filter.
FilterRoutesNumber of TripsAverage
km/gls
F1Quito-Cuenca328.861
Cuenca-Quito335.478
F2Quito-Cuenca332.219
Cuenca-Quito332.430
F3Quito-Cuenca329.062
Cuenca-Quito333.011
F4Quito-Cuenca329.519
Cuenca-Quito328.955
F5Quito-Cuenca332.847
Cuenca-Quito327.838
Disclaimer/Publisher’s Note: The statements, opinions and data contained in all publications are solely those of the individual author(s) and contributor(s) and not of MDPI and/or the editor(s). MDPI and/or the editor(s) disclaim responsibility for any injury to people or property resulting from any ideas, methods, instructions or products referred to in the content.