Article

Finite Element Analysis of Damage Evolution of Solid Lubrication Film in Rolling–Sliding Contact

1
School of Mechatronics Engineering, Henan University of Science and Technology, Luoyang 471003, China
2
Henan Key Laboratory for Machinery Design and Transmission System, Luoyang 471003, China
3
Collaborative Innovation Center of Henan Province for High-End Bearing, Luoyang 471000, China
4
Luoyang Bearing Research Institute Co., Ltd., Luoyang 471039, China
*
Author to whom correspondence should be addressed.
Lubricants 2024, 12(7), 258; https://doi.org/10.3390/lubricants12070258
Submission received: 16 May 2024 / Revised: 11 June 2024 / Accepted: 26 June 2024 / Published: 18 July 2024

Abstract

:
Based on the cohesive zone model (CZM), a finite element model of the film–substrate bearing system in the rolling–sliding contact state is established. Through analyzing the normal and tangential bearing states of the film–substrate system, the effects of the sliding–rolling ratio and the film–substrate adhesion strength on the interfacial stress and the interfacial energy release rate of the film–substrate system are studied. The results show that there is an almost symmetric stress distribution at both sides of the contact zone in rolling contact. In rolling–sliding contact, obvious shear flow along the rolling–sliding direction occurs at the front edge of the contact zone, which results in a significant increase in the shear stress at the interface at the front edge of the contact zone, increasing the risk of interface damage and delamination failure. Meanwhile, the shear flow causes a normal tensile stress concentration along the film surface behind the contact zone, which very easily causes the emergence and expansion of the film surface cracks. In addition, there is a clear positive correlation between the adhesion strength and the load-bearing capacity of the film–substrate interface. The tangential delamination damage mainly occurs at the interface regardless of the rolling or rolling–sliding contact state.

1. Introduction

Under the conditions of dry friction or boundary lubrication, a solid lubrication film can significantly enhance the friction reduction and wear resistance of the friction pair surface of mechanical parts. Using the magnetron sputtering process, a solid lubrication film is deposited on the surface of rolling bearing parts, such as bearing rings and rolling elements, which can enhance the self-lubricating performance of the bearings and effectively improve the service performance of bearings under harsh working conditions [1]. However, in the actual operation, when the rolling bearing operation is unstable or occurs at a high speed, the elastic rolling–sliding effect will occur between the bearing ring and the rolling element to a certain extent, which will aggravate the relative sliding between the rolling element and the bearing ring. Compared with the rolling state, the bearing capacity of the solid lubrication film on the surface of the bearing parts is relatively weak in the rolling–sliding state, which will reduce the friction reduction and wear resistance of the solid lubrication film and cause the premature failure of the bearing.
The interfacial properties of the film–substrate system are important factors in determining the tribological performance of solid lubrication films. Related studies show that the film–substrate system introduces two potential defect factors, the film and the film–substrate adhesion interface, and the main failure forms include interface delamination, film fracture, peeling, buckling, wear, etc. [2,3,4,5]. Among them, the interface delamination is the most serious failure form, which results from the separation between the film and the substrate under the action of high interfacial stresses due to the insufficient adhesion performance of the film–substrate interface [6,7]. Cracks occur in both the interior of the film and the interface of the film–substrate system during the preparation of the film–substrate system [8]. The delamination of the interface and the crack damage of the film will not only lead to a significant decrease or even loss of the performance of the film–substrate system in terms of lubrication, load bearing, protection, etc., but will also cause abrasion and scratches on the surface of the friction pair when the film fragments enter into the contact micro-zone as impurities, which results in the drastic deterioration of the operating condition of the parts [9,10].
The cohesive zone model and extended finite element method are widely used for film cracking and interface delamination problems [11,12]. Based on the above models, a lot of analyses on the mechanical and damage properties of the film–substrate system have been performed. It has been found that interfacial delamination damage is closely related to the friction coefficient [13], the interfacial adhesion property [13,14], the material properties of the film–substrate system [15,16], the film thickness [17], and other factors. In indentation test analyses, tangential delamination tends to occur at the film–substrate interface during loading [17,18,19]. During unloading, normal tensile delamination tends to occur at the contact center [20]. In the process of analyzing interface delamination and damage, the influence of the interface adhesion strength cannot be ignored [21]. The increase in the film elastic modulus raises the critical load of interfacial delamination and decreases the critical load of the film fracture [21]. Interfacial delamination causes a significant change in the maximum stress of the film, which affects the film cracking damage behavior. Therefore, the study of the complex competitive damage failure behavior of film–substrate systems under high contact stresses needs to consider two failure forms, film cracking and interface delamination [22]. However, most of these studies have focused mainly on the fundamental studies, such as the indentation and scratching of films, and have not paid attention to the characteristics of the rolling–sliding coexistence of solid lubrication films in practical applications.
In this paper, taking a MoS2-based solid lubrication film as the research topic, a finite element model of the film–substrate system in the rolling–sliding contact state is established based on the cohesive zone model. The validity of the model is verified by a rolling–sliding friction test. Through analyzing the normal and tangential bearing state of the film–substrate system, the influence of the sliding–rolling ratio and the adhesion strength on the interfacial stress and the interfacial energy release rate is analyzed.

2. Materials and Methods

2.1. Geometric Model

Figure 1 shows the schematic of the rolling–sliding contact model for a film–substrate system. The linear–elastic film of thickness h is connected to a fully elastic–plastic substrate with cohesive units. E is the elastic modulus, ν is Poisson’s ratio, the angular markers z and s represent the film and substrate, respectively, and σ s is the substrate yield strength. In the rolling state, the rolling element adopts exactly the same linear velocity as the substrate, and the linear velocity of the substrate changes accordingly to accommodate different sliding–rolling ratios. The rolling–sliding direction is along the x–positive direction. Here, the sliding–rolling ratio is expressed as follows [23]:
η = 2 u f u c u f + u c
where u f and u c are the linear velocity of the rolling element and the substrate in the rolling–sliding direction, respectively.
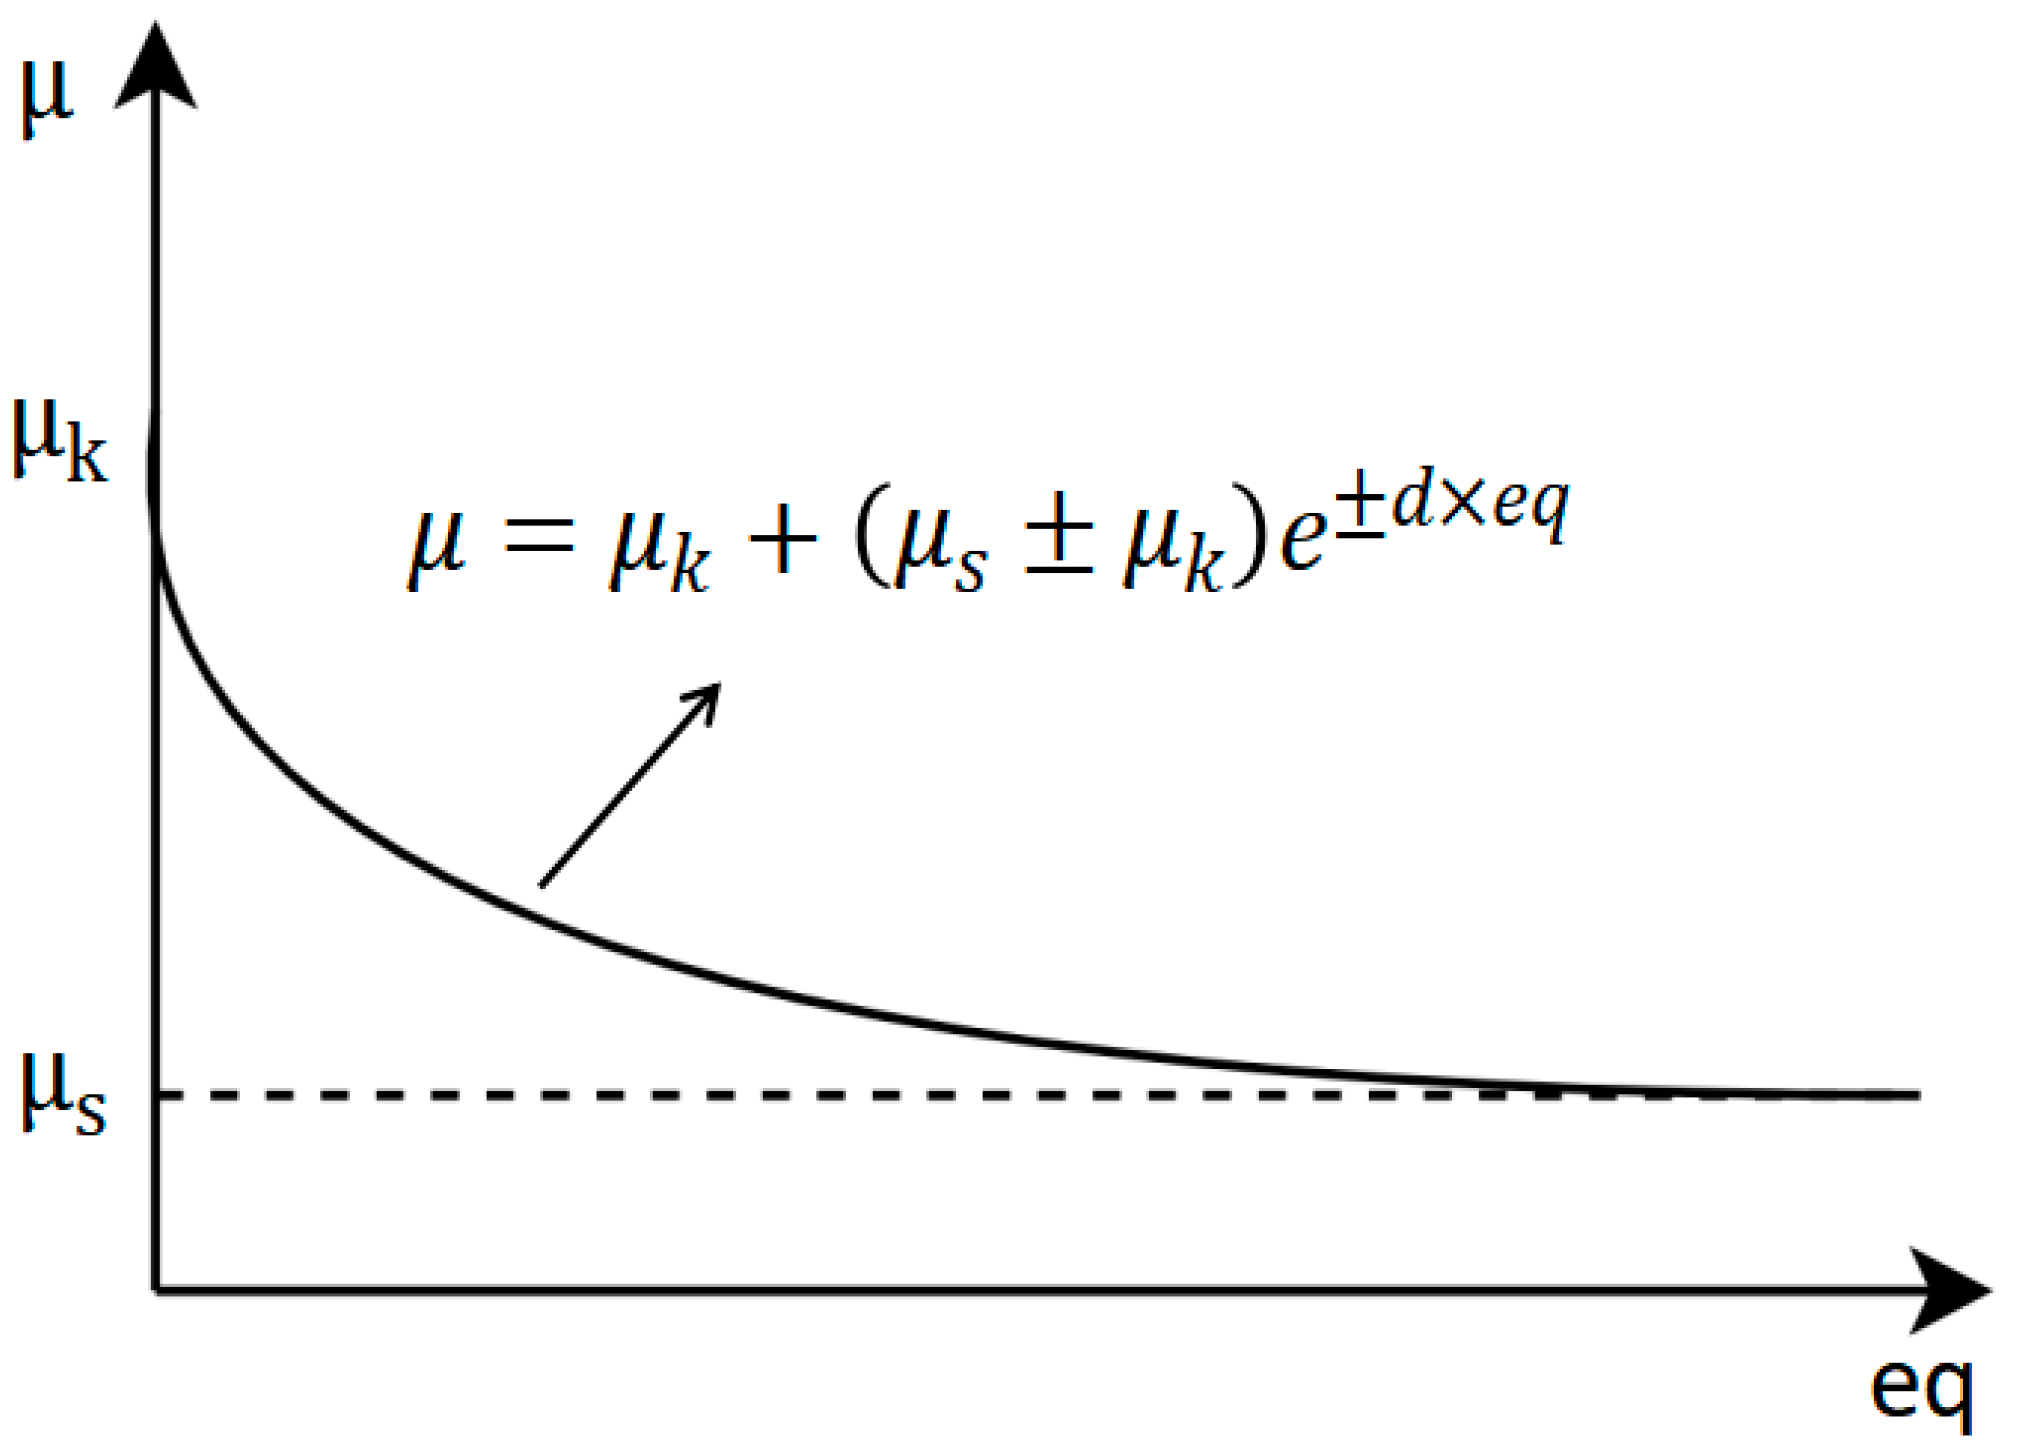
In this study, the Static–Kinetic Exponential Decay model is used to calculate the friction force between the rolling element and the film in the rolling–sliding contact state. The friction coefficient μ is related to the relative sliding speeds of the two contacting objects, and the friction coefficient μ is expressed as follows [23]:
μ = μ k + μ s ± μ k e ± d × e q
where μ k is the sliding friction coefficient, μ s is the rolling friction coefficient. The test measured the MoS2-based solid lubrication film sliding friction coefficient, μ k = 0.07; the rolling friction coefficient is μ s = 0.01. d is the decay index. e q is the relative speed at which the rolling friction coefficient is transformed into the sliding friction coefficient, taking 100 µm/s. The schematic of the model is shown in Figure 2.
In this study, the film is MoS2-based solid lubrication film, and the substrate is 9Cr18 bearing steel. The analysis model and interface parameters adopted are listed in Table 1.

2.2. Cohesive Zone Model

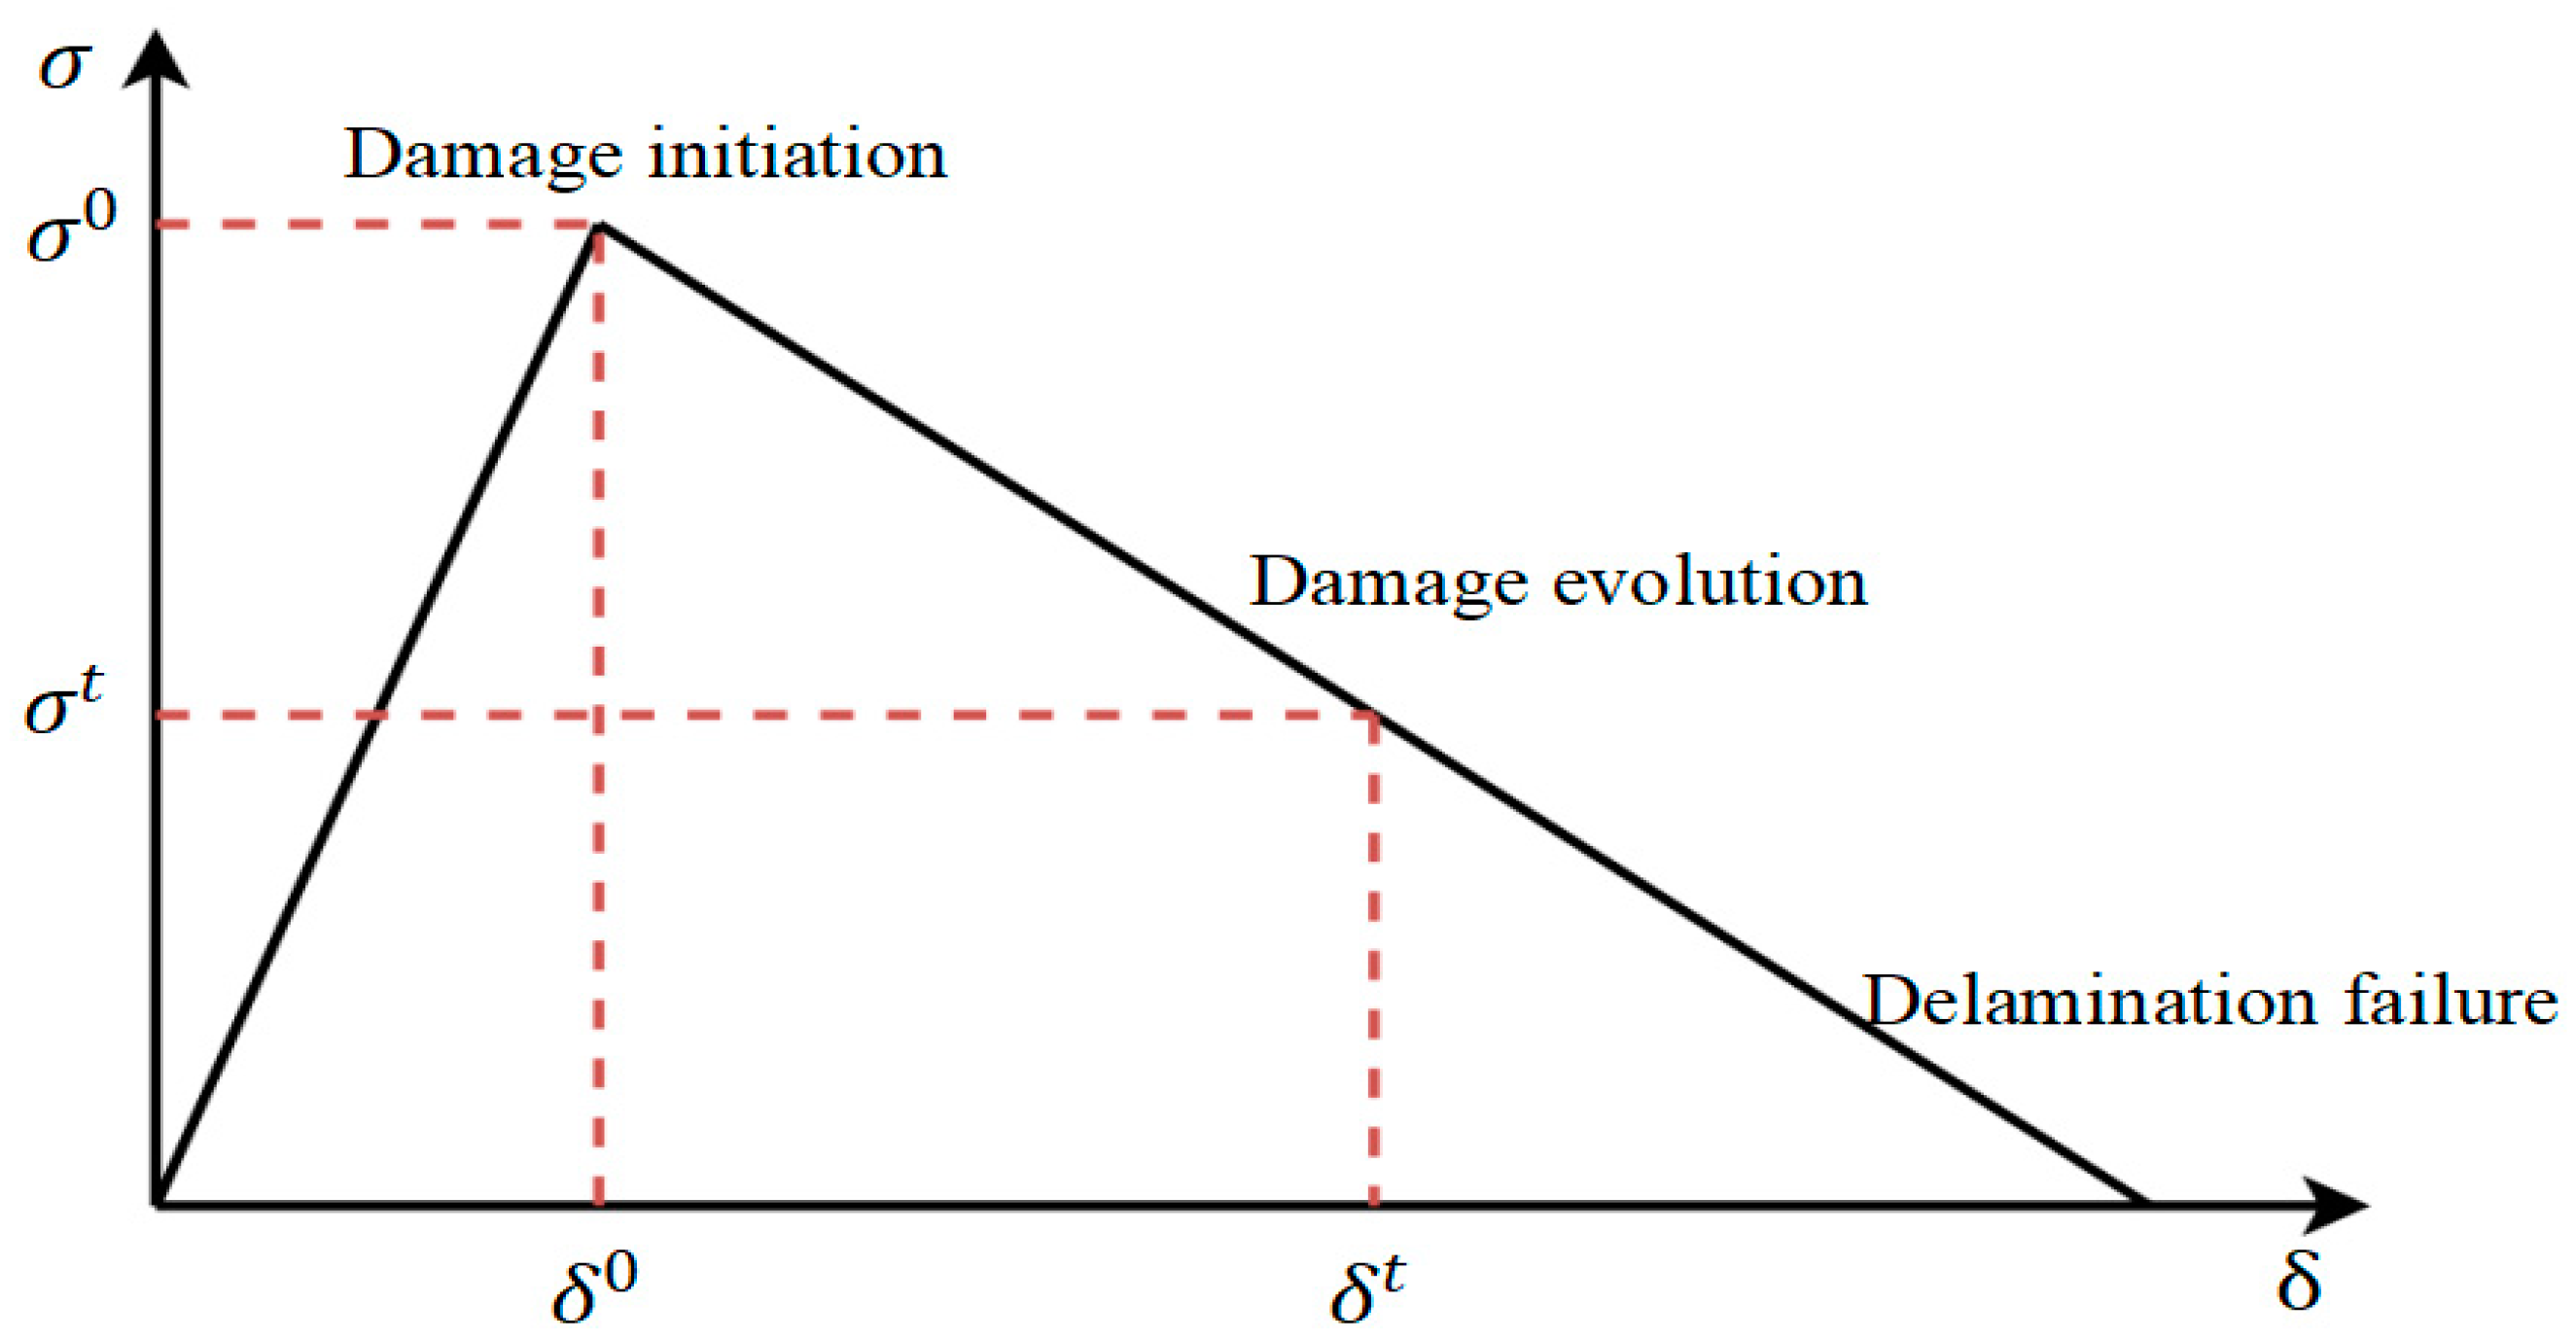
A bilinear cohesion model in the normal and tangential mixed modes is used to simulate the damage and failure behaviors of the film–substrate adhesion interface, as shown in Figure 3. Here, σ is the interfacial stress; δ is the interfacial separation displacement, K is the interfacial stiffness; σ 0 is the interfacial adhesion strength (the stress required for delamination damage to occur between the film and the substrate); δ 0 is the interfacial characteristic length (the critical point of interfacial delamination displacement; when it reaches the characteristic length, the interfacial adhesion strength reaches the peak and the film starts to be damaged); δ f is the interfacial failure displacement (the displacement of the film when delamination failure occurs) [24].
When the cohesion region reaches the critical stress, the cohesion region units begin to soften, and damage begins to accumulate. The initial damage criterion in this study adopts the squared nominal stress criterion, which is expressed as follows [24]:
σ n σ n 0 2 + σ t σ t 0 2 = 1
where σ n = m a x σ n , 0 . From Equation (3), it can be seen that when the interface normal stress σ n is the compression stress ( σ n < 0), the film–substrate adhesion interface can only be damaged along the tangential direction; that is, the interface possesses infinite adhesion strength along the normal direction under the compressive stress. In the traction–separation relation (T-S law) shown in Figure 3, when describing the normal constitutive relation, the corresponding interfacial normal stress is the tensile stress. For the tangential direction, there is no restriction on the direction of stress.
The power-function-based failure criterion for film delamination is given by [25]:
Γ n Γ n c α + Γ t Γ t c α = 1
where Γ n = σ n d δ n is the normal energy release rate of the interface. Γ t = σ t d δ t is the tangential energy release rate of the interface. Γ 0 is the critical energy release rate of the interface; the angular markers n and t represent normal and tangential directions, respectively. α is the power index, which is taken as 1 in this paper.

2.3. Finite Element Model

The finite element analysis software ABAQUS2022 implicit analysis module is used for computational analysis. The finite element analysis model and mesh division are shown in Figure 4. The length and thickness of the substrate are 20h and the thickness of the film is h. By checking the convergence of the model and verifying the mesh–independence, as shown in Table 2, it was determined that the mesh size at the interface is about 0.0675h. The substrate near the interface is divided by the gradual mesh and the mesh size at the bottom of the substrate away from the contact zone is about 5.25h.
The finite element model is simplified as follows:
(1)
To improve the computational efficiency, the simplified model is a two-dimensional plane model, in which the simplified film is a linear–elastic material, and the substrate is a completely elastic–plastic material.
(2)
The effects of loading rate and inertial load are not considered, the film–substrate interface is assumed to be smooth, and the effects of residual stress are not considered.

2.4. Model Validation

In order to verify the validity of the above finite element model, a comparative analysis is carried out through the rolling–sliding friction test and simulation. The structural principle of the test machine is shown in Figure 5. This test uses the MoS2-based solid lubrication film prepared by magnetron sputtering as the research object; the substrate material is 9Cr18 bearing steel; the rolling friction coefficient under dry friction conditions is measured as μ s = 0.01; the sliding friction coefficient is measured as μ k = 0.07.
In order to ensure that the test parameters correspond to the simulation parameters, the test and simulation parameters are listed in Table 3. The normal load of simulation and test both are 50 N. The two sets of parameters of the sliding–rolling ratio η = 0.1, 0.2 are selected to analyze the friction force between the simulation and the test in the rolling–sliding state, as shown in Figure 6. The simulation results have a certain fluctuation because the friction coefficient of the model will change with the relative speed of two contacting parts in the rolling–sliding state. When the relative sliding speed of the two contacting parts is small enough, this is the rolling motion state, where the friction coefficient μ is the rolling friction coefficient μ s . When the relative sliding occurs between two contacting parts, the friction coefficient μ quickly changes to the sliding friction coefficient μ k . From Figure 6, it can be seen that the test and simulation results are basically consistent, which verifies the validity of the finite element model.

3. Results and Discussion

3.1. Stress State of Film–Substrate System

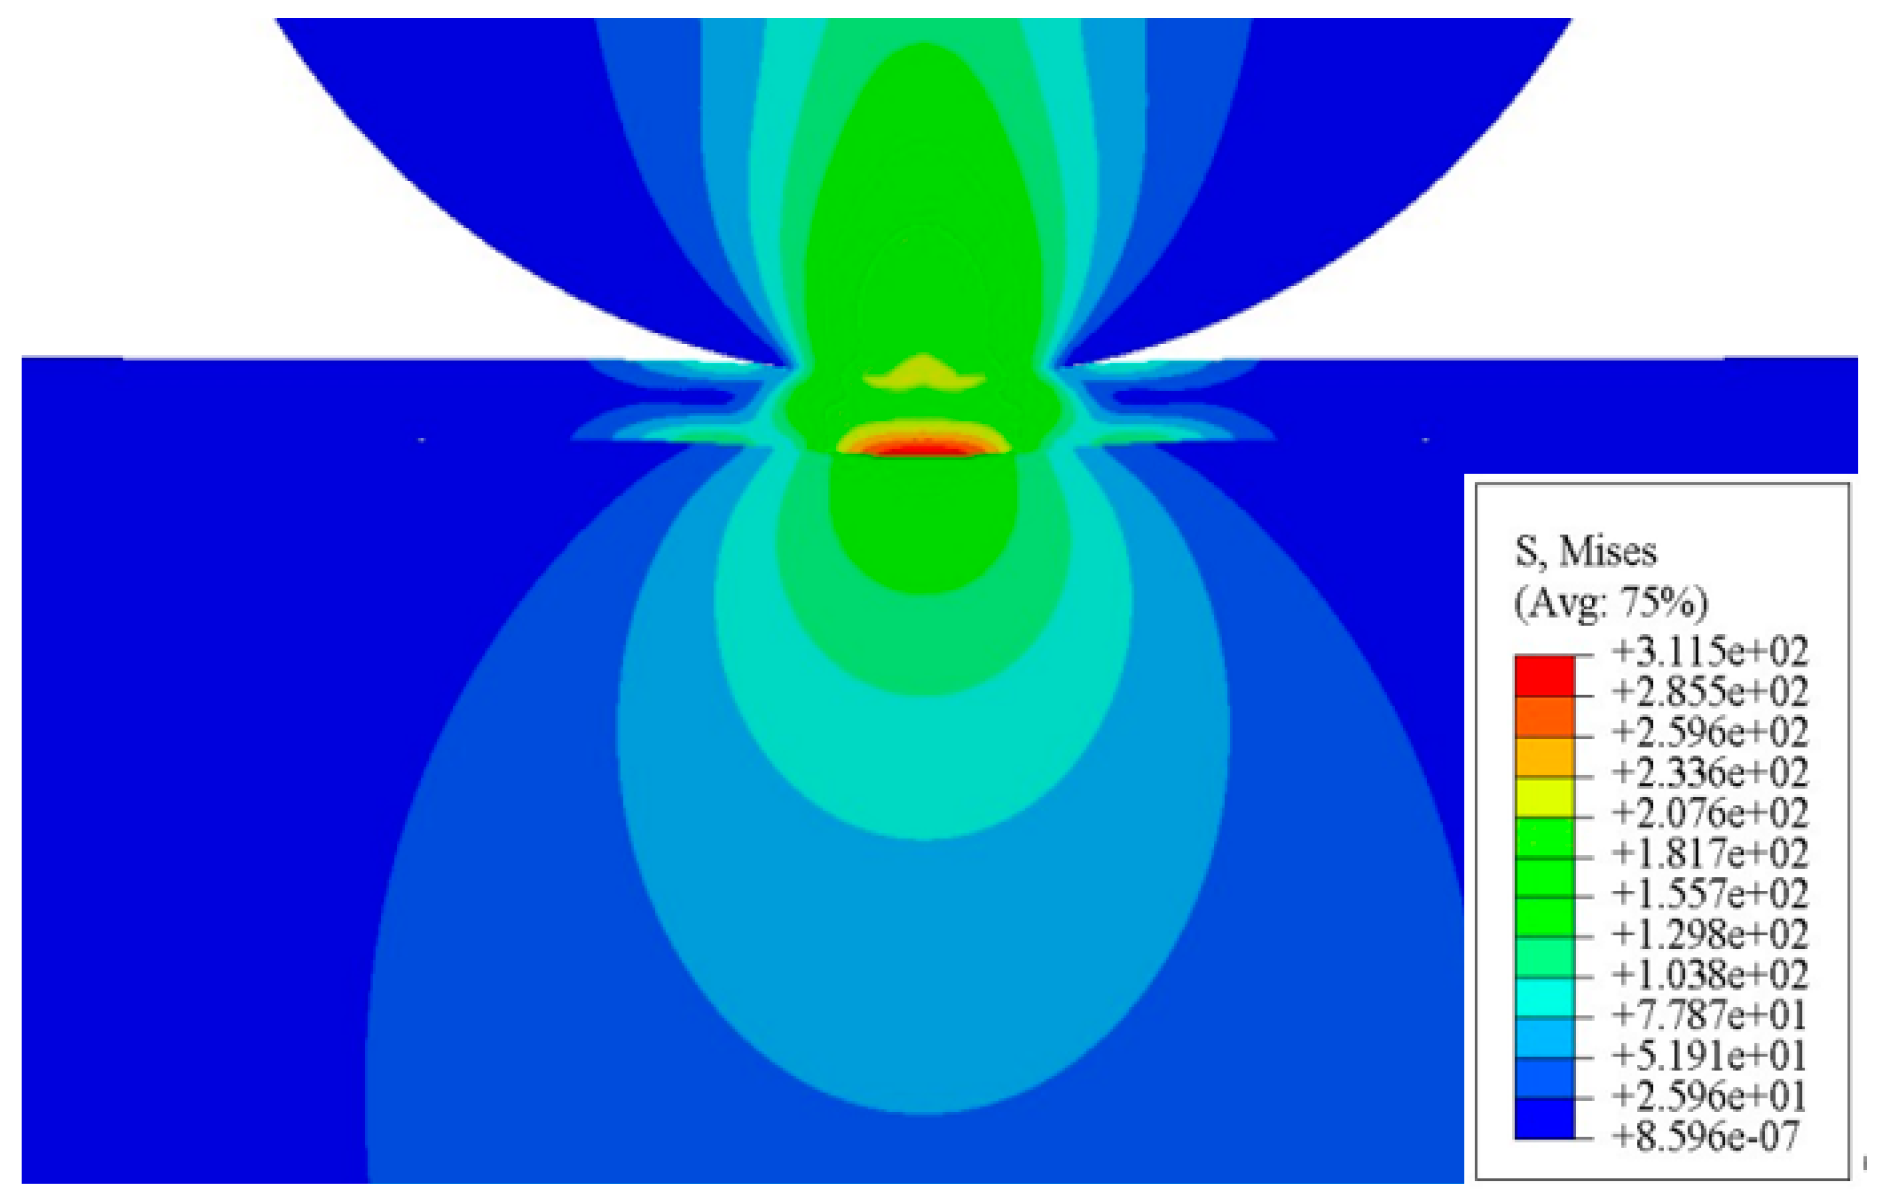
When the maximum contact stress is P = 0.5 GPa, the maximum equivalent stress of the film–substrate system in the loading process is about 0.31 GPa, as shown in Figure 7. The maximum equivalent stress is located at the interface of the film–substrate, which is about 0.8h away from the film surface. Due to the differences between the adhesion strength and the material properties of the film–substrate system, the equivalent stress component of the film–substrate system is obviously discontinuous.
The stress state of the film–substrate system at different sliding–rolling ratios is shown in Figure 8. In the rolling state ( η = 0), as shown in Figure 8a, it is observed that the stress distribution is almost symmetric at both sides of the contact zone. While in the rolling–sliding state ( η = 0.2, 0.4), as shown in Figure 8b,c, there is obvious asymmetric stress distribution; the shear flow of the film’s sub-surface mechanical features at the front edge of the contact zone is clearly observed; the shear flow direction is consistent with the rolling–sliding direction. The shear flow not only results in a significant increase in the shear stress at the interface at the front edge of the contact zone, as shown in Figure 9a, which increases the damage area and the damage degree at the interface along the tangential direction. In addition, the shear flow also causes an obvious normal tensile stress concentration along the film surface at the rear edge of the contact zone, as shown in Figure 9b. The tensile stress concentration on the film surface is caused by the bending and stretching of the film; its generation and action mechanism are closely related to the elastic modulus of the film and substrate, the film thickness, and the friction coefficient of the loaded contact surface [26,27,28]. Such tensile stress concentration can easily cause the emergence and expansion of film surface cracks [29].
The normal and tangential stress of the film–substrate adhesion interface when the sliding–rolling ratio η = 0.4 are shown in Figure 10a, respectively. The normal stress of the interface is compressive stress at the contact zone, and the normal stress of the interface is small tensile stress at both sides of the contact zone. The tangential stress of the interface has two opposite extreme values at both sides of the contact zone, and the tangential stress at the front edge of the contact zone (x/b > 0) is significantly greater than that at the rear edge of the contact zone (x/b < 0).
The energy release rate of the interfacial cohesion units along the tangential direction also shows two peaks at both sides of the contact zone, as shown in Figure 10b. Similarly, the energy release rate at the front edge of the contact zone is significantly higher than that at the rear edge of the contact zone, with a maximum value of about 0.78 Γ 0 . Since the normal stress of the interface at the contact zone is compressive stress, it can be seen from Equation (3) that the compressive stress does not cause any damage along the normal direction. The energy release rate of the interfacial cohesion units along the normal direction is very small and almost negligible, which is mainly due to the small normal tensile stresses of the interface at both sides of the contact zone. Combined with the delamination failure criterion Equation (4), it can be seen that, under this motion state, the interface has no damage in normal and tangential directions.

3.2. Influence of Sliding–Rolling Ratio on Interface Delamination

The interfacial bearing state of the film–substrate system with the maximum contact stress P = 0.5 GPa, and the sliding–rolling ratios η of 0, 0.2, 0.4, and 0.6 are shown in Figure 11. As shown in Figure 11a, the difference in the interfacial normal compressive stress in the contact zone is very small and almost negligible for different sliding–rolling ratios. There are small normal tensile stresses of the interfaces at both sides of the contact zone, and the normal tensile stresses increase with the increase in the sliding–rolling ratio at the front of the contact zone. The position where the maximum value of the normal tensile stress appears moves outward along the front of the contact zone. The maximum value of the normal tensile stress of the interface is only 0.08 σ 0 , which does not reach the damage threshold. From the above analysis results, it can be concluded that the damage and failure caused by different sliding–rolling ratios in the normal direction of the interface can be almost ignored.
The tangential stress of the interface is shown in Figure 11b; the interfacial tangential stresses at the front and rear edges of the contact zone show opposite trends with the change of sliding–rolling ratios. At the front of the contact zone, the interfacial shear stress increases with the increases in the sliding–rolling ratio; meanwhile, at the rear of the contact zone, the interfacial shear stress decreases with the increases in the sliding–rolling ratio. Under different sliding–rolling ratios, no damage occurred at the rear of the contact zone. When the sliding–rolling ratio η = 0.6, the value of the shear stress at the front edge of the contact zone reaches the interface damage threshold σ 0 . At this time, the tangential damage occurs at the front edge of the contact zone, and the maximum value of the shear stress begins to decrease. This phenomenon is expressed in the bilinear damage evolution shown in Figure 3, which is a linear softening stage. The maximum value of the shear stress is not 0, indicating that the interface is damaged, but no delamination failure occurs at this time.
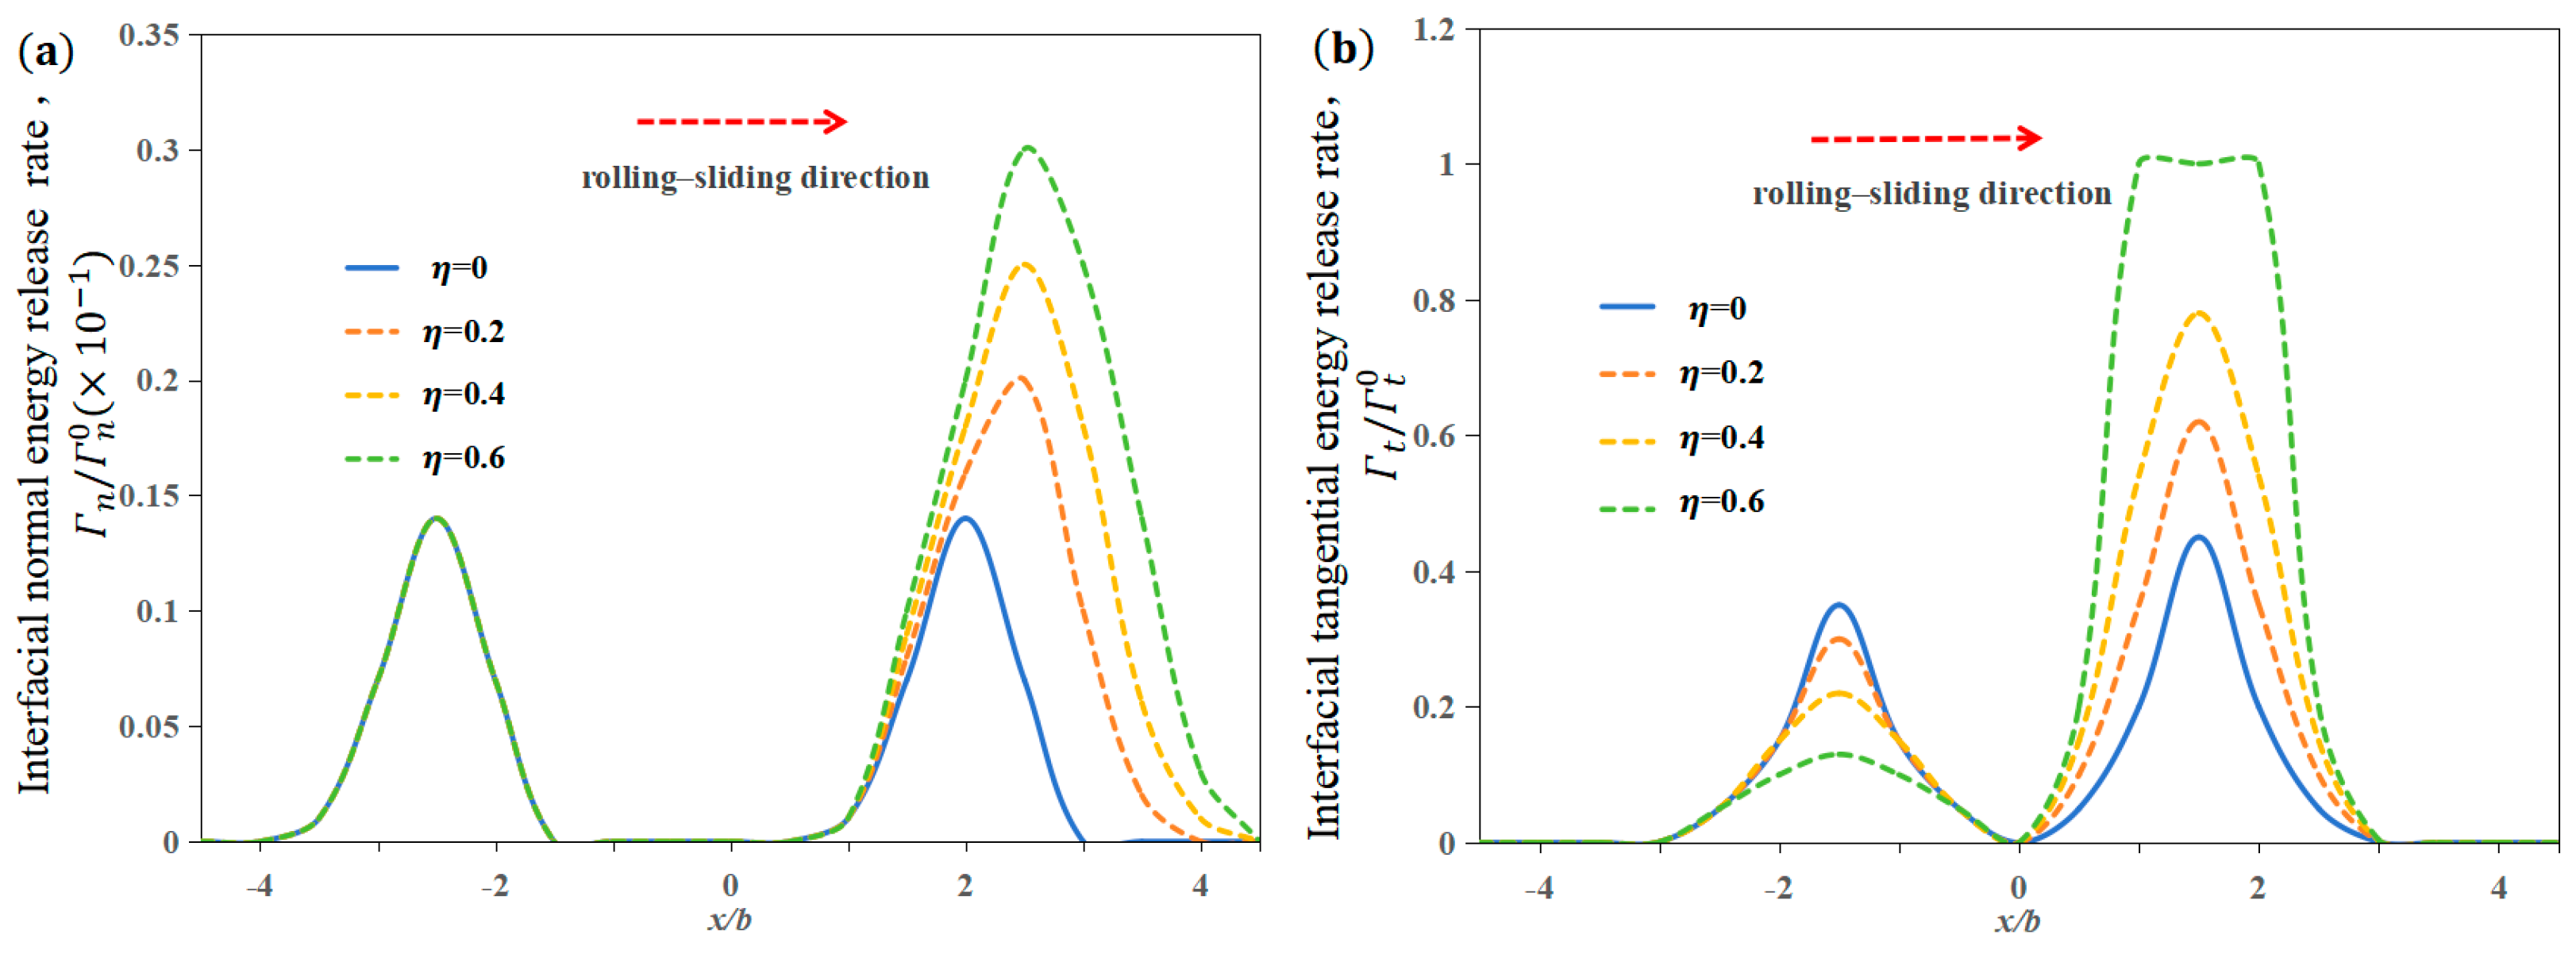
The energy release rate of the interface is shown in Figure 12. The interface has a small energy release rate along the normal direction only at both sides of the contact zone. The normal energy release rate of the interface at the front edge of the contact zone increases with the increase in the sliding–rolling ratio; meanwhile, the normal energy release rate at the rear edge of the contact zone remains almost unchanged with the increase in the sliding–rolling ratio, as shown in Figure 12a. The tangential energy release rate of the interface obviously exists at both sides of the contact zone, and its value at the front edge of the contact zone is obviously larger than that at the rear edge. At the front edge of the contact zone, the interfacial tangential energy release rate increases with the increase in the sliding–rolling ratio. At the rear edge of the contact zone, the interfacial tangential energy release rate decreases with the increase in the sliding–rolling ratio, as shown in Figure 12b. When the sliding–rolling ratio η = 0.6, the tangential energy release rate at the front edge of the contact zone reaches the threshold of interface delamination failure, and tangential damage occurs at the interface. From the perspective of improving the interface reliability, the proportion of sliding friction in the rolling–sliding friction effect should be minimized.

3.3. Influence of Adhesion Strength on Interface Delamination

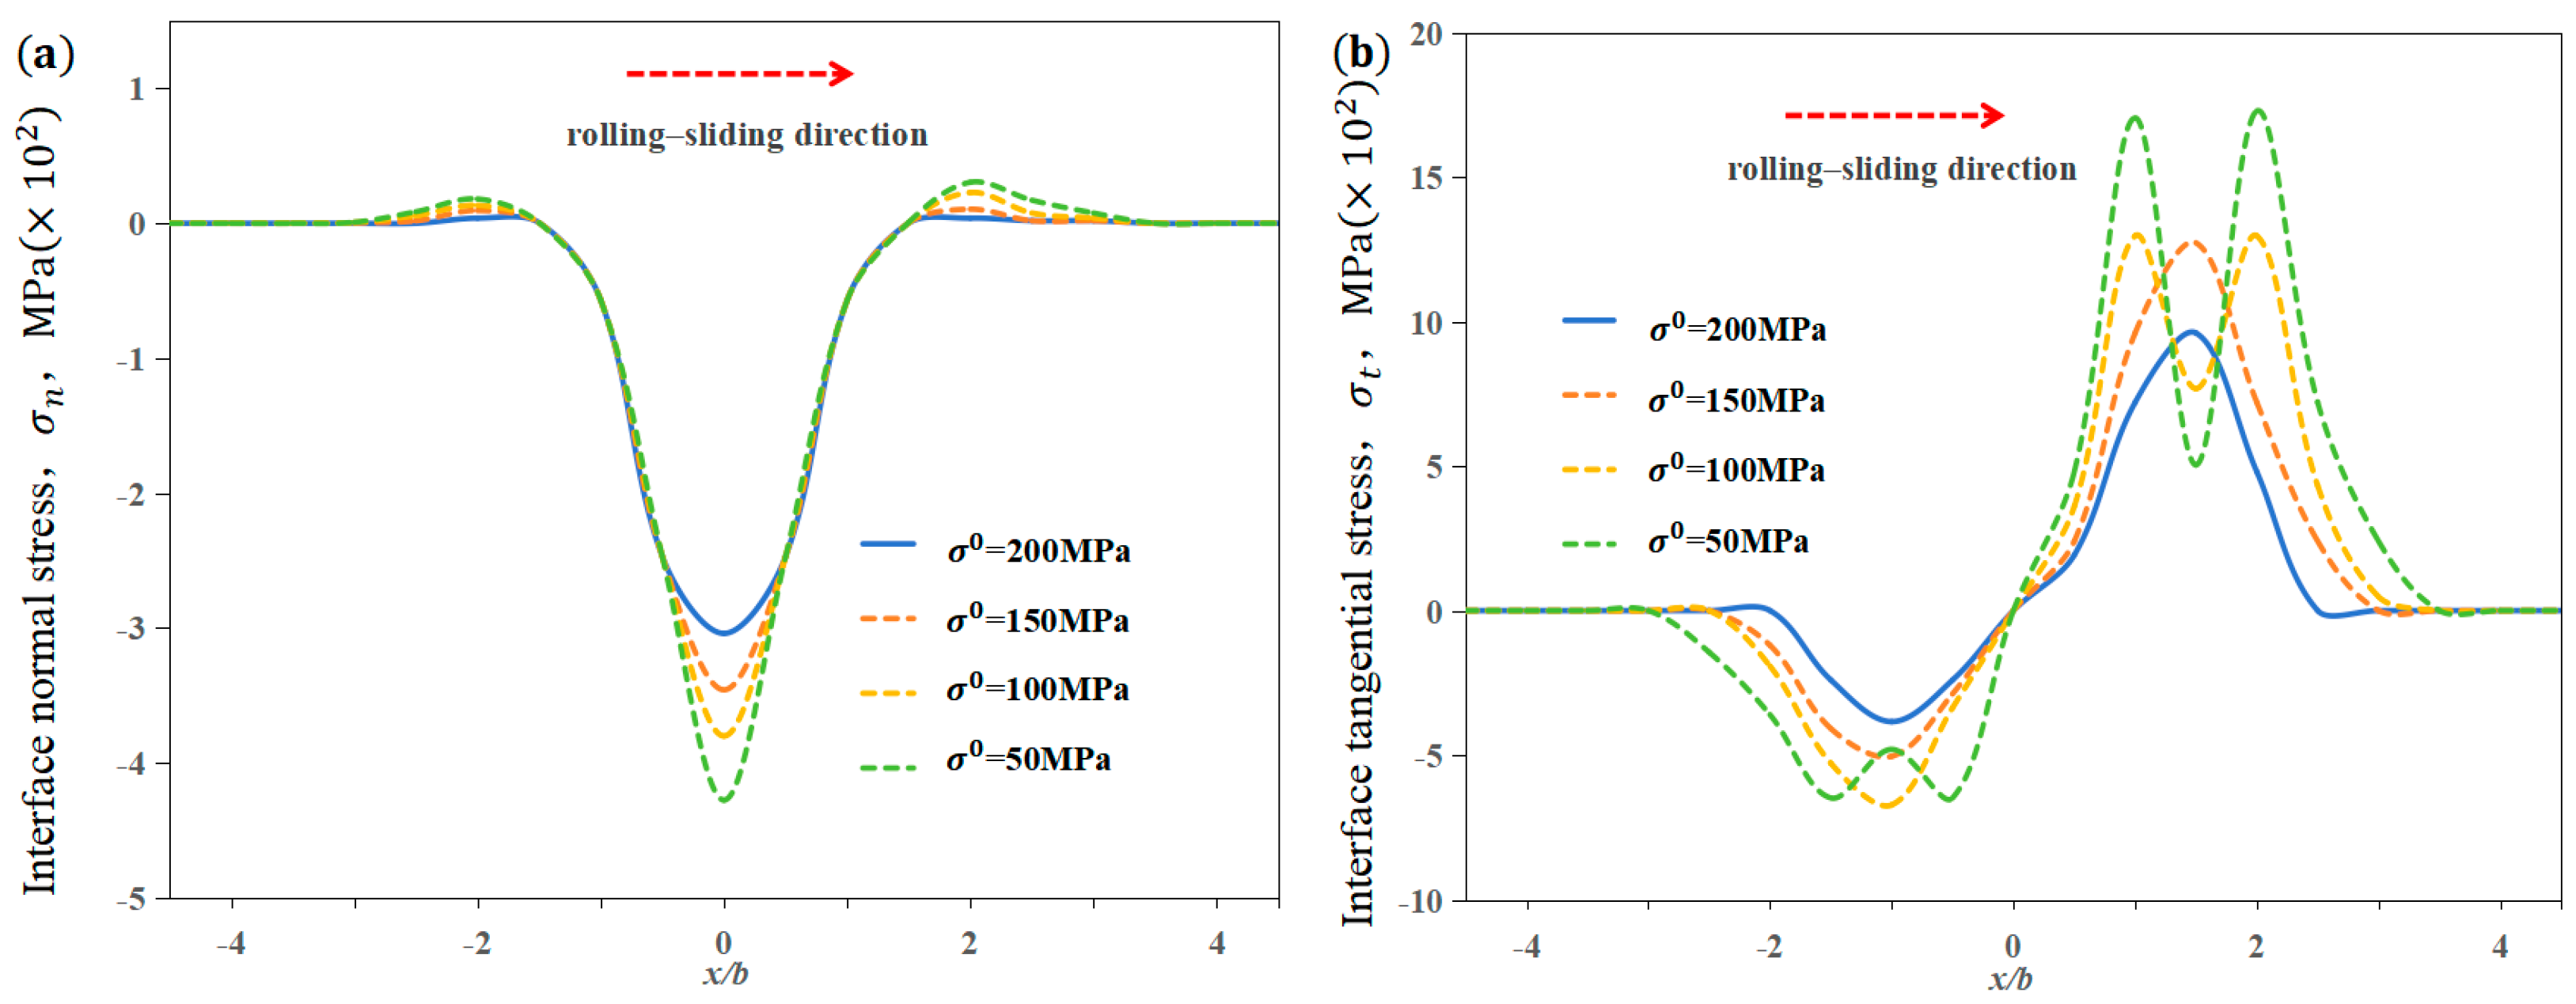
The interfacial bearing state of the film–substrate system with the sliding–rolling ratio η = 0.2, the maximum contact stress P = 0.5 GPa, and the adhesion strengths σ 0 of 50, 100, 150, and 200 MPa are shown in Figure 13. As shown in Figure 13a, with the increase in adhesion strength, the value of the interfacial normal compressive stress in the contact zone decreases gradually. Under this compression stress, at both sides of the contact zone, the interfacial normal stress is a small tensile stress, and the value of tensile stress decreases with the increase in the adhesion strength. Under different adhesion strengths, the normal stress of the interface is in the elastic recoverable stage, and no damage occurs at the interface.
The tangential stress of the interface is shown in Figure 13b; at both sides of the contact zone, the direction of the interfacial tangential stress is opposite. With the increase in the adhesion strength, the value of interfacial tangential stress decreases gradually, and the influence and action zone of the tangential stress increases gradually towards both sides of the contact zone. At the rear edge of the contact zone, the value of the shear stress reaches the interface damage threshold σ 0 when the adhesion strength σ 0 = 50 MPa. At the front edge of the contact zone, the value of the shear stress reaches the interface damage threshold σ 0 when the adhesion strength σ 0 = 100, 50 MPa. At this time, tangential damage occurs at both sides of the contact zone, leading to the decrease in the maximum value of the tangential stress. This phenomenon is expressed in the bilinear damage evolution shown in Figure 3, which is a linear softening stage.
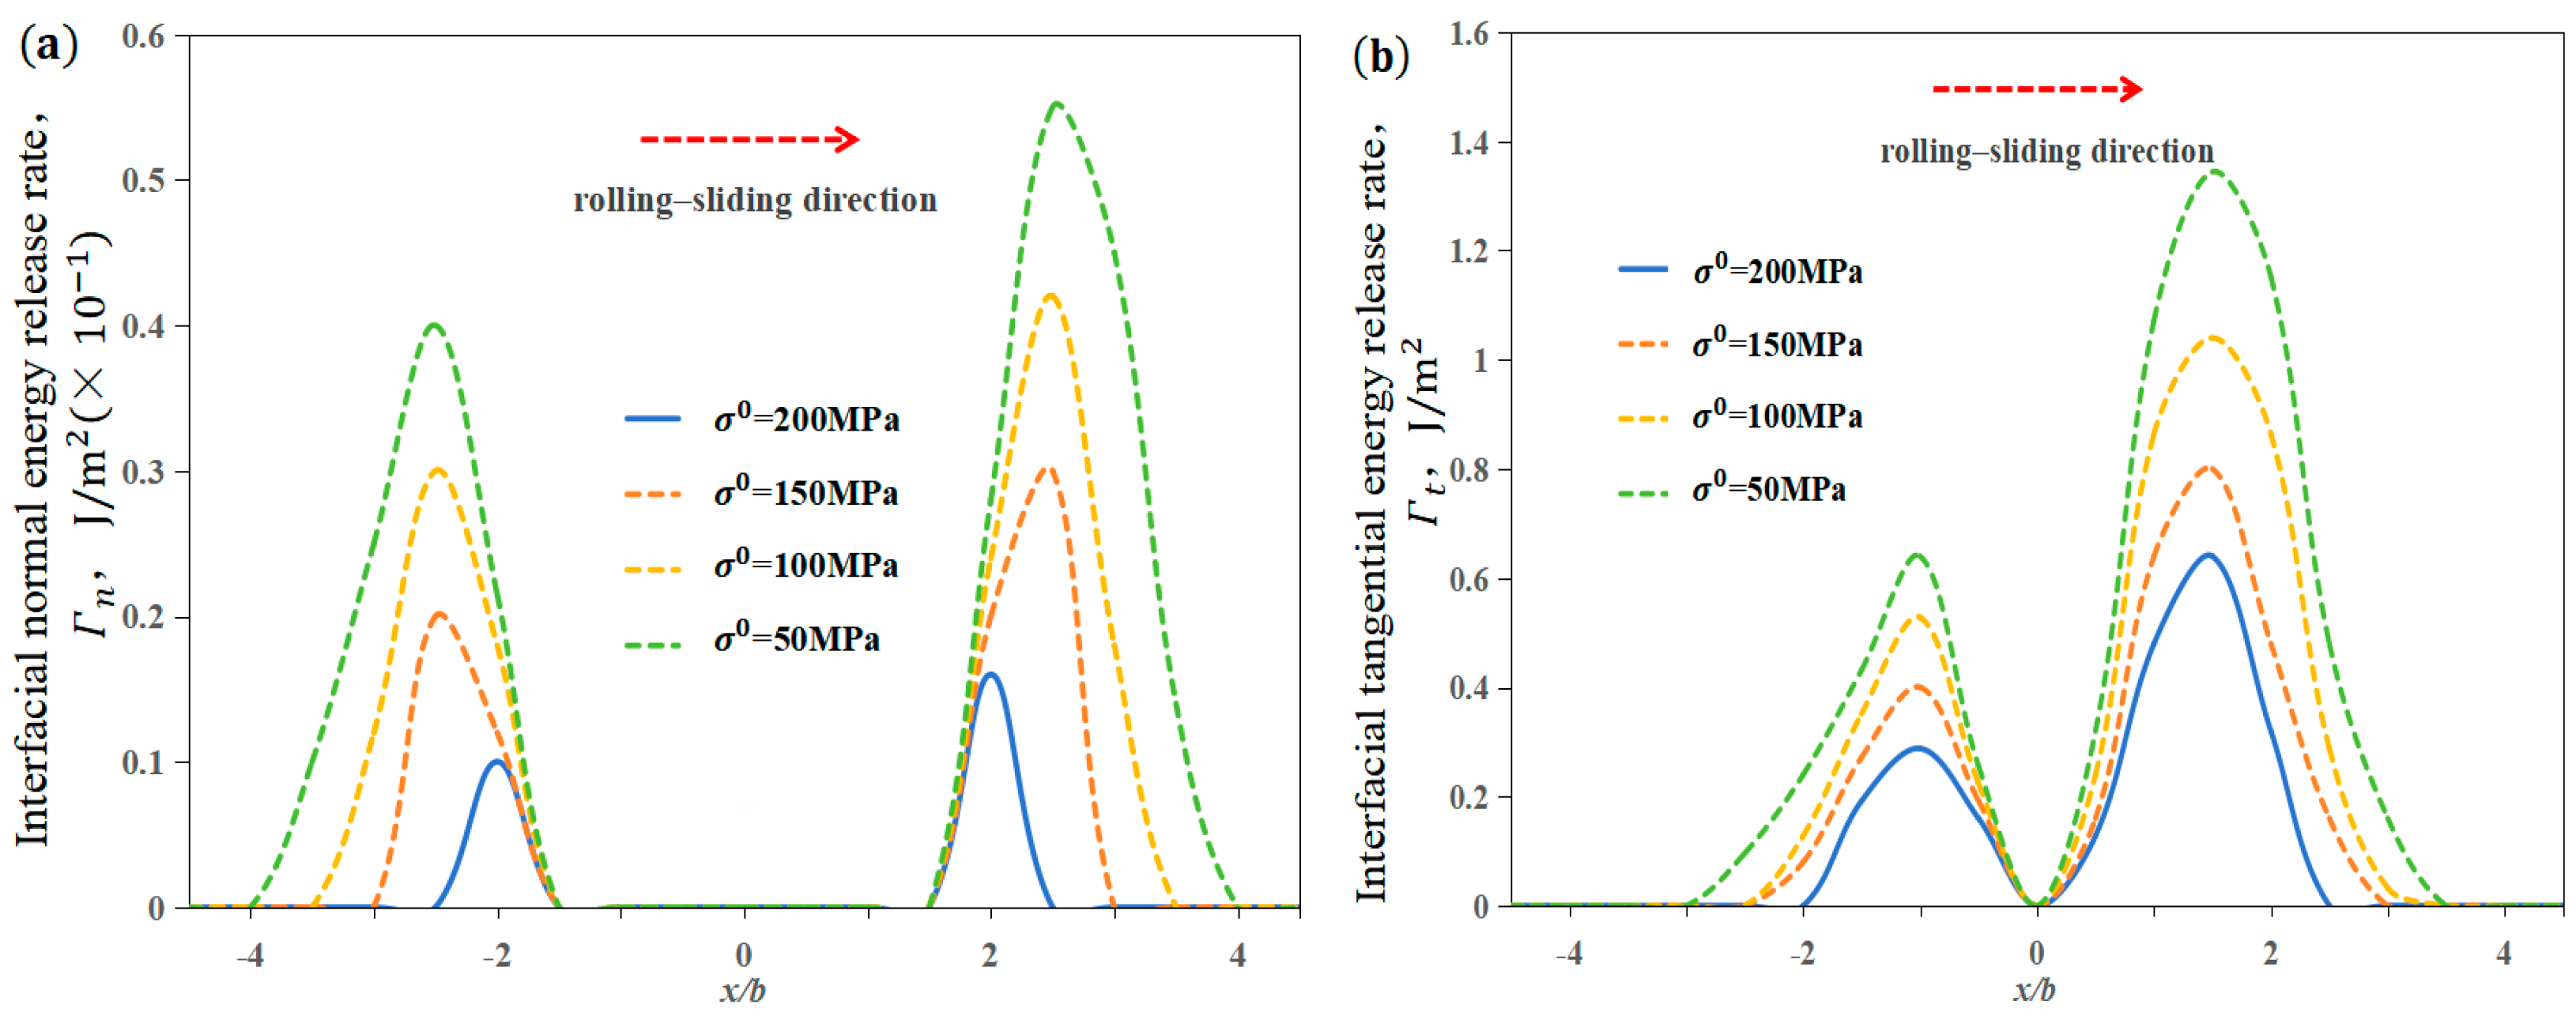
The energy release rate of the interface is shown in Figure 14. Whether in the rolling or the rolling–sliding contact state, there is a small energy release rate of the interface along the normal direction only at both sides of the contact zone; the value of the normal energy release rate decreases with the increase in the adhesion strength, as shown in Figure 14a. But, compared with the interfacial tangential energy release rate (as shown in Figure 14b), the interfacial normal energy release rate is small; that is, the interface’s possibility of normal damage and delamination failure is small. There is an obvious energy release rate at the front edge and the rear edge of the contact zone in the tangential direction of the interface. The tangential energy release rate has the same trend as that of the change of the tangential stress with the adhesion strength. Therefore, in order to improve the ability of the interface to resist damage and enhance the interface’s bearing capacity, the tangential adhesion strength of the film–substrate interface should be improved.

4. Conclusions

Based on the cohesive zone model (CZM), the finite element model is used to analyze the normal and tangential bearing states of the film–substrate system in the rolling–sliding contact state. The effects of the sliding–rolling ratio and the adhesion strength on the interfacial stress and the interfacial energy release rate is studied. The main results are as follows:
(1)
In rolling contact, the film–substrate system shows almost symmetric stress distribution at both sides of the contact zone, and the rolling friction has less effect on the shear instability of the film. In the rolling–sliding contact, the film–substrate system has obvious asymmetric stress distribution at both sides of the contact zone; an obvious shear flow along the rolling–sliding direction is observed along the front of the contact zone.
(2)
The increase in the sliding–rolling ratio leads to a significant increase in the shear stress at the interface at the front edge of the contact zone, which increases the risk of interfacial damage and delamination failure. The rolling–sliding motion also causes the normal tensile stress concentration along the surface of the film at the rear edge of the contact zone, which very easily causes the emergence and expansion of film surface cracks.
(3)
The increase in the adhesion strength of the film–substrate system can raise the bearing capacity of the interface. Whether in the rolling or the rolling–sliding contact state, the degree of delamination damage of the film–substrate system interface in the tangential direction is obviously greater than that in the normal direction. The tangential adhesion strength of the film–substrate system should be enhanced to improve the bearing capacity of the interface.

Author Contributions

Conceptualization, Y.X. and P.L.; methodology, P.L.; software, P.L.; validation, C.T.; investigation, Y.X.; resources, H.C. and C.T.; data curation, P.L. and C.T.; writing—original draft preparation, P.L.; writing—review and editing, Y.X. and P.L.; visualization, Y.Y. (Yanjing Yin); project administration, Y.Y. (Yongjian Yu); funding acquisition, Y.X. All authors have read and agreed to the published version of the manuscript.

Funding

This research was funded by the National Key Research and Development Program of China (grant no. 2021YFB3400401) and the National Defense Industrial Technology Development Program (grant no. JCKY2018419C101).

Data Availability Statement

The authors confirm that the data supporting the finding of this study are available within the article.

Conflicts of Interest

Author Yanjing Yin was employed by Luoyang Bearing Research Institute Co., Ltd. The remaining authors declare that the research was conducted in the absence of any commercial or financial relationships that could be construed as a potential conflict of interest.

References

  1. Fan, X.; Xue, Q.; Wang, L. Carbon-based solid-liquid lubricating coatings for space applications—A review. Friction 2015, 3, 191–207. [Google Scholar] [CrossRef]
  2. Li, H.; Zhang, G.; Wang, L. The role of tribo-pairs in modifying the tribological behavior of the MoS2/Ti composite coating. Phys. D Appl. Phys. 2016, 49, 095501. [Google Scholar] [CrossRef]
  3. Xiao, Y.; Shi, W.; Wan, Q. Evaluation of failure properties of a DLC/steel system using combined nanoindentation and finite element approach. Diam. Relat. Mater. 2019, 93, 159–167. [Google Scholar] [CrossRef]
  4. Bakoglidis, K.D.; Nedelcu, I.; Ivanov, I.G. Rolling performance of carbon nitride-coated bearing components in different lubrication regimes. Tribol. Int. 2017, 114, 141–151. [Google Scholar] [CrossRef]
  5. Zhu, W.; Zhou, Y.C.; Guo, J.W. Quantitative characterization of the interfacial adhesion of Ni thin film on steel substrate: A compression-induced buckling delamination test. J. Mech. Phys. Solids 2015, 74, 19–37. [Google Scholar] [CrossRef]
  6. Xiao, Y.; Shi, W.; Luo, J. Indentation for evaluating cracking and delamination of thin coatings using finite element analysis. Vacuum 2015, 122, 17–30. [Google Scholar] [CrossRef]
  7. Sun, W.D.; Wang, J.; Wang, K.W.; Pan, J.J.; Wang, R.; Wen, M.; Zhang, K. Turbulence-like Cu/MoS2 films: Structure, mechanical and tribological properties. Surf. Coat. Technol. 2021, 422, 127490. [Google Scholar] [CrossRef]
  8. Zhou, Y.; Xu, Y.; Gong, H.; Wang, C. Prediction and Regulation of Delamination at Flexible Film/Finite-Thickness-Substrate Structure Interfaces. Acta Mech. Solida Sin. 2024, 37, 238–251. [Google Scholar] [CrossRef]
  9. Ferguen, N.; Leclerc, W.; Lamini, E.S. Numerical investigation of thermal stresses induced interface delamination in plasma-sprayed thermal barrier coatings. Surf. Coat. Technol. 2023, 461, 129449. [Google Scholar] [CrossRef]
  10. Hu, P.; Li, X.; Lubineau, G. Prediction of a complex delamination front using a general cohesive model. Compos. Sci. Technol. 2023, 233, 109911. [Google Scholar] [CrossRef]
  11. Hameed, M.A.; Ibrahim, G.R.; Albarbar, A. Effect of friction and shear strength enhancement on delamination prediction. J. Compos. Mater. 2020, 54, 3329–3342. [Google Scholar] [CrossRef]
  12. Liu, J.; Wang, X.; Li, H. Delamination mechanism maps for coatings/substrates system subjected to adhesive contact loads. Thin Solid Film. 2017, 626, 159–167. [Google Scholar] [CrossRef]
  13. Chen, L.; Yeap, K.B.; She, C.M. A computational and experimental investigation of three-dimensional micro-wedge indentation-induced interfacial delamination in a soft-film-on-hard-substrate system. Eng. Struct. 2011, 33, 3269–3278. [Google Scholar] [CrossRef]
  14. Liu, P.; Zhang, Y.W.; Zeng, K.Y. Finite element analysis of interface delamination and buckling in thin film systems by wedge indentation. Eng. Fract. Mech. 2007, 74, 1118–1125. [Google Scholar] [CrossRef]
  15. Wang, Z.; Zhong, X.; Jiang, L. Effect of interfacial delamination on coating crack in thick diamond-like carbon coatings under indentation. Acta Mech. Sin. 2020, 36, 524–535. [Google Scholar] [CrossRef]
  16. Xia, S.M.; Gao, Y.F.; Bower, A.F. Delamination mechanism maps for a strong elastic coating on an elastic–plastic substrate subjected to contact loading. Int. J. Solids Struct. 2007, 44, 3685–3699. [Google Scholar] [CrossRef]
  17. Lofaj, F.; Németh, D. The effects of tip sharpness and coating thick ness on nanoindentation measurements in hard coatings on softer substrates by FEM. Thin Solid Film. 2017, 644, 173–181. [Google Scholar] [CrossRef]
  18. Kot, M.; Rakowski, W.; Lackner, J.M. Analysis of spherical indentations of coating-substrate systems: Experiments and finite element modeling. Mater. Des. 2013, 43, 99–111. [Google Scholar] [CrossRef]
  19. Chen, X.; Shaw, C.; Gelman, L. Advances in test and measurement of the interface adhesion and bond strengths in coating-substrate systems, emphasising blister and bulk techniques. Measurement 2019, 139, 387–402. [Google Scholar] [CrossRef]
  20. Lu, P.; Xiao, X.; Chou, Y.K. Interface delamination study of diamond-coated carbide tools considering coating fractures. Surf. Coat. Technol. 2014, 260, 239–245. [Google Scholar] [CrossRef]
  21. Qiu, L.S.; Zhu, X.D.; Lu, S. Quantitative evaluation of bonding strength for hard coatings by interfacial fatigue strength under cyclic indentation. Surf. Coat. Technol. 2017, 315, 303–313. [Google Scholar] [CrossRef]
  22. Hu, J.; Chou, Y.K.; Thompson, R.G. Cohesive zone effects on coating failure evaluations of diamond-coated tools. Surf. Coat. Technol. 2008, 203, 730–735. [Google Scholar] [CrossRef]
  23. Zhang, S.; Spiryagin, M.; Lin, Q.; Ding, H.; Wu, Q.; Guo, J.; Liu, Q.; Wang, W. Study on wear and rolling contact fatigue behaviors of defective rail under different slip ratio and contact stress conditions. Tribol. Int. 2022, 169, 107491. [Google Scholar] [CrossRef]
  24. Zawischa, M.; Makowski, S.; Schwarzer, N. Scratch resistance of superhard carbon coatings–A new approach to failure and adhesion evaluation. Surf. Coat. Technol. 2016, 308, 341–348. [Google Scholar] [CrossRef]
  25. Zhao, B.; Zhang, S.; Keer, L.M. Spherical Elastic–Plastic Contact Model for Power-Law Hardening Materials Under Combined Normal and Tangential Loads. J. Tribol. 2017, 139, 021401. [Google Scholar] [CrossRef]
  26. Jamison, R.D.; Shen, Y.L. Delamination analysis of metal–ceramic multilayer coatings subject to nanoindentation. Surf. Coat. Technol. 2016, 303, 3–11. [Google Scholar] [CrossRef]
  27. Yuan, H.; Li, X. Critical remarks to cohesive zone modeling for three-dimensional elastoplastic fatigue crack propagation. Eng. Fract. Mech. 2018, 202, 311–331. [Google Scholar] [CrossRef]
  28. Fu, K.; Chang, L.; Ye, L. Indentation stress-based models to predict fracture properties of brittle thin film on a ductile substrate. Surf. Coat. Technol. 2016, 296, 46–57. [Google Scholar] [CrossRef]
  29. Shu, K.; Zhang, C.; Sun, D.; Wu, B.; Li, Z.; Wu, J.; Zheng, D.; Gu, L. Contact cracking and delamination of thin solid lubricating films on deformable substrates. Tribol. Int. 2021, 163, 107181. [Google Scholar] [CrossRef]
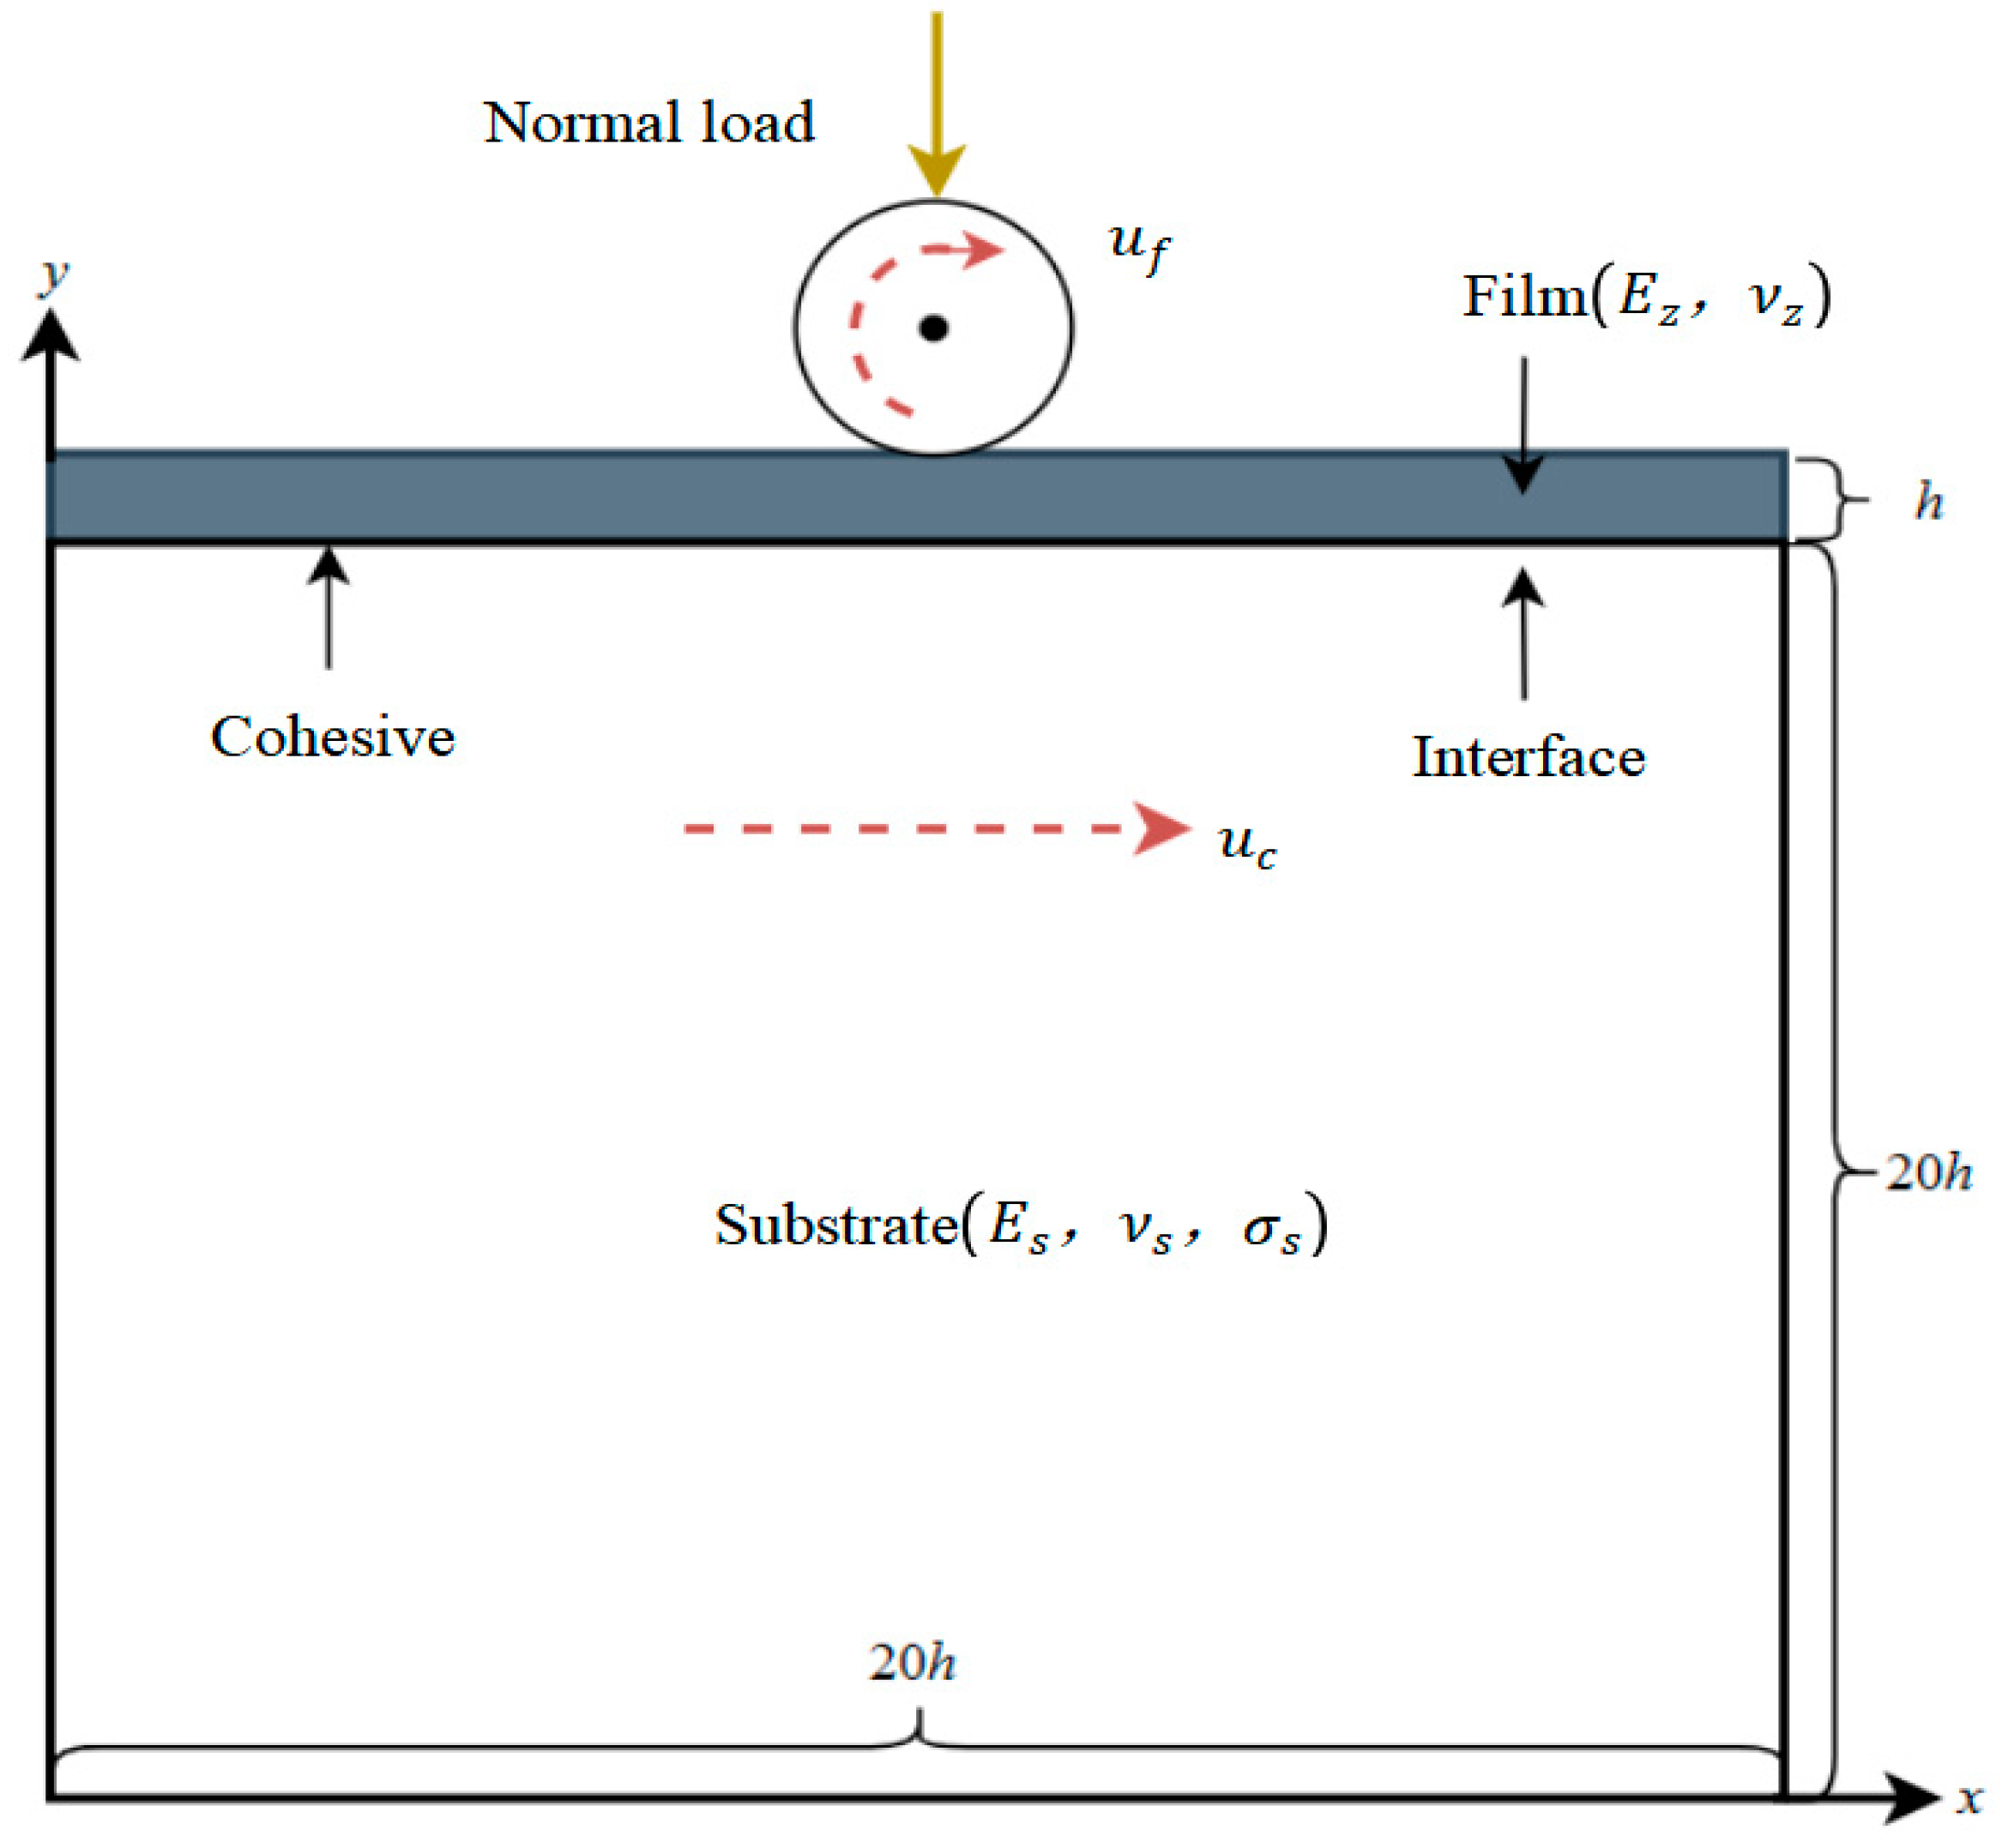
Figure 1. Schematic of rolling–sliding contact model for film–substrate system.
Lubricants 12 00258 g001
Figure 2. Schematic of the Static–Kinetic Exponential Decay model.
Lubricants 12 00258 g002
Figure 3. Schematic of the bilinear cohesion model.
Lubricants 12 00258 g003
Figure 4. Film–substrate system mesh.
Lubricants 12 00258 g004
Figure 5. (a) Principle of rolling–sliding friction tester; (b) drive system of rolling–sliding friction tester.
Lubricants 12 00258 g005
Figure 6. Comparison of simulation and test friction force: (a) sliding–rolling ratio η = 0.1; (b) sliding–rolling ratio η = 0.2.
Lubricants 12 00258 g006
Figure 7. Stress state of the film–substrate system during loading.
Lubricants 12 00258 g007
Figure 8. Stress state of film–substrate system at different sliding–rolling ratios: (a) sliding–rolling ratio η = 0; (b) sliding–rolling ratio η = 0.2; (c) sliding–rolling ratio η = 0.4.
Lubricants 12 00258 g008
Figure 9. Tangential and normal stress states of the film–substrate system when the sliding–rolling ratio η = 0.4. (a) Tangential stress; (b) normal stress.
Lubricants 12 00258 g009
Figure 10. Interfacial stress and interfacial energy release rate when the sliding–rolling ratio η = 0.4. (a) Interfacial stress; (b) interfacial energy release rate.
Lubricants 12 00258 g010
Figure 11. Effect of different sliding–rolling ratios on interface stress. (a) Normal stress; (b) tangential stress.
Lubricants 12 00258 g011
Figure 12. Effect of different sliding–rolling ratios on the energy interfacial release rate. (a) Normal energy release rate; (b) tangential energy release rate.
Lubricants 12 00258 g012
Figure 13. Effect of different adhesion strengths on interface stress. (a) Normal stress; (b) tangential stress.
Lubricants 12 00258 g013
Figure 14. Effect of different adhesion strengths on the interfacial energy release rate. (a) Normal energy release rate; (b) tangential energy release rate.
Lubricants 12 00258 g014
Table 1. Model and interface parameters.
ParameterValue
Film elastic modulus, E z 90 GPa
Substrate elastic modulus, E s 210 GPa
Rolling element elastic modulus, E 210 GPa
Film Poisson’s ratio, ν z 0.3
Substrate Poisson’s ratio, ν s 0.3
Rolling element Poisson’s ratio, ν 0.3
Substrate yield strength, σ s 1 GPa
Film thickness, h 1 µm
Contact half width, b 1.3 µm
Interfacial adhesion strength, σ 0 200 MPa
Interfacial critical energy release rate, Γ 0 6 J/m2
Characteristic length, δ 0 0.0004 µm
Separation displacement, δ 0.04 µm
Interfacial stiffness, K 107 MPa/mm
Table 2. Mesh-independent verification.
Interface Mesh Size0.0785h0.0675h0.0565h0.0455h
Inaccuracies1.67%0%0.41%0.36%
Table 3. Simulation and test parameters.
Sliding–Rolling Ratio, η 0.10.2
Test disk linear velocity (mm/s)10001000
Test ball linear velocity (mm/s)904.76818.18
Simulation rolling element linear velocity (µm/s)2020
Simulation substrate linear velocity (µm/s)18.0916.36
Disclaimer/Publisher’s Note: The statements, opinions and data contained in all publications are solely those of the individual author(s) and contributor(s) and not of MDPI and/or the editor(s). MDPI and/or the editor(s) disclaim responsibility for any injury to people or property resulting from any ideas, methods, instructions or products referred to in the content.