Article

Study on the Wear Performance and Wear Prediction of Leaf Spring Calipers under Lubricating Medium Conditions

College of Mechanical Engineering, Tianjin University of Science and Technology, Tianjin 300222, China
*
Author to whom correspondence should be addressed.
Lubricants 2024, 12(2), 41; https://doi.org/10.3390/lubricants12020041
Submission received: 23 November 2023 / Revised: 24 January 2024 / Accepted: 29 January 2024 / Published: 31 January 2024

Abstract

:
Leaf spring calipers are a kind of pipe detector that installs strain gauges on the detecting arm, and the strain gauges measure the geometrical dimensions of the inner wall of the pipe by detecting the bending strain of the leaf spring and the sensors of the leaf spring caliper are set up on the detecting arm, so it has higher detecting accuracy and smaller structural dimensions. Leaf spring calipers are widely used because of their outstanding advantages, but their detection arms are worn out, and their detection accuracy increases with the detection distance. In this paper, we establish a wear model of the detection arm for the operation of the leaf spring caliper in crude oil and refined product pipelines, and according to the model, we build a wear test system for the detection arm. The wear test system of the inspection arm simulates the wear between the inspection arm made of G61500 (UNIFIED NUMBERING SYSTEM) material and the pipe made of X80 (API SPEC 5L) material. The wear pattern of the inspection arm in crude oil and refined oil pipelines is investigated by adding lubricating media with similar physical parameters to crude oil and refined oil, such as light mineral oil, SAE 5W-30 lubricant, 600XP 680 lubricant. The experimental results are analyzed to explore the wear performance of the leaf spring caliper arm, and the prediction algorithm is used to predict the wear pattern of the leaf spring after lubrication. The results show that the average error between the predicted and actual values meets the accuracy requirements, and the wear prediction model of the detection arm can be used as a correction algorithm for the wear error of the leaf spring caliper to improve the detection accuracy.

1. Introduction

Using pipelines for oil transport has stability, economy, and efficiency far beyond sea, road, and rail transport [1,2,3,4,5,6]. Oil transport pipelines have rapidly gained popularity and formed a worldwide oil transport network [7]. With the increase in the service life of oil pipelines, the aging of pipeline infrastructure is obvious, including corrosion, creep, deformation, and cracking [8,9,10,11]. Oil pipelines are often buried underground or placed in locations that are difficult for maintenance personnel to reach, such as the seabed. Oil leaks are usually not detected in time, and large quantities of leaking oil can cause damage to the natural environment and huge economic losses to transport companies [12,13,14]. In order to avoid the occurrence of oil pipeline leakage accidents, it is necessary to check the internal condition of the pipeline regularly. If large deformations, broken welds, cracks, corrosion, and other defects are found inside the pipeline, they need to be repaired or replaced. Caliper pig is a very effective inspection tool for detecting the geometric information inside the pipe, measured by direct contact between the inspection arm and the inner wall of the pipe [15,16].
Caliper pigs can be categorized into three types: wheel-type caliper (wheeled caliper), rod-type caliper, and probe-type caliper [17]. The detection arm of the wheel-type caliper is in contact with the inner wall of the pipe through the wheel, which converts the sliding friction between the detection arm and the two metals of the inner wall of the pipe into rolling friction and avoids scratches to the inner wall of the pipe during the detection process [18,19]. However, due to their wheeled construction, wheel-type calipers are more suited to deformation detection of pipes and tend to be overlooked for smaller cracks or leaks. However, due to their wheeled construction, wheel-type calipers are more suited to deformation detection of pipes and tend to be overlooked for smaller cracks or leaks. The overall detection arm of the rod-type caliper is rod-shaped, and compared with the wheel-type caliper, its size is smaller, and the detection accuracy is high [20,21]. However, the end of the detection arm of the rod-type caliper is in direct contact with the inner wall of the pipeline, not only easily damaging the inner wall of the pipeline but also causing friction damage to the detection arm itself. This type of detector arm will generally be polished and smoothed to reduce wear and tear and scratches at the end of the treatment. In probe-type caliper, the end of the detection arm is a needle-like structure due to the smaller cross-section size of the detection arm, so in the angle encoder structure size and accuracy of a certain premise can be arranged for a greater number of detection arms, has a higher detection accuracy, can be measured in the pipeline small-size defects such as small cracks, small corrosion [22,23].
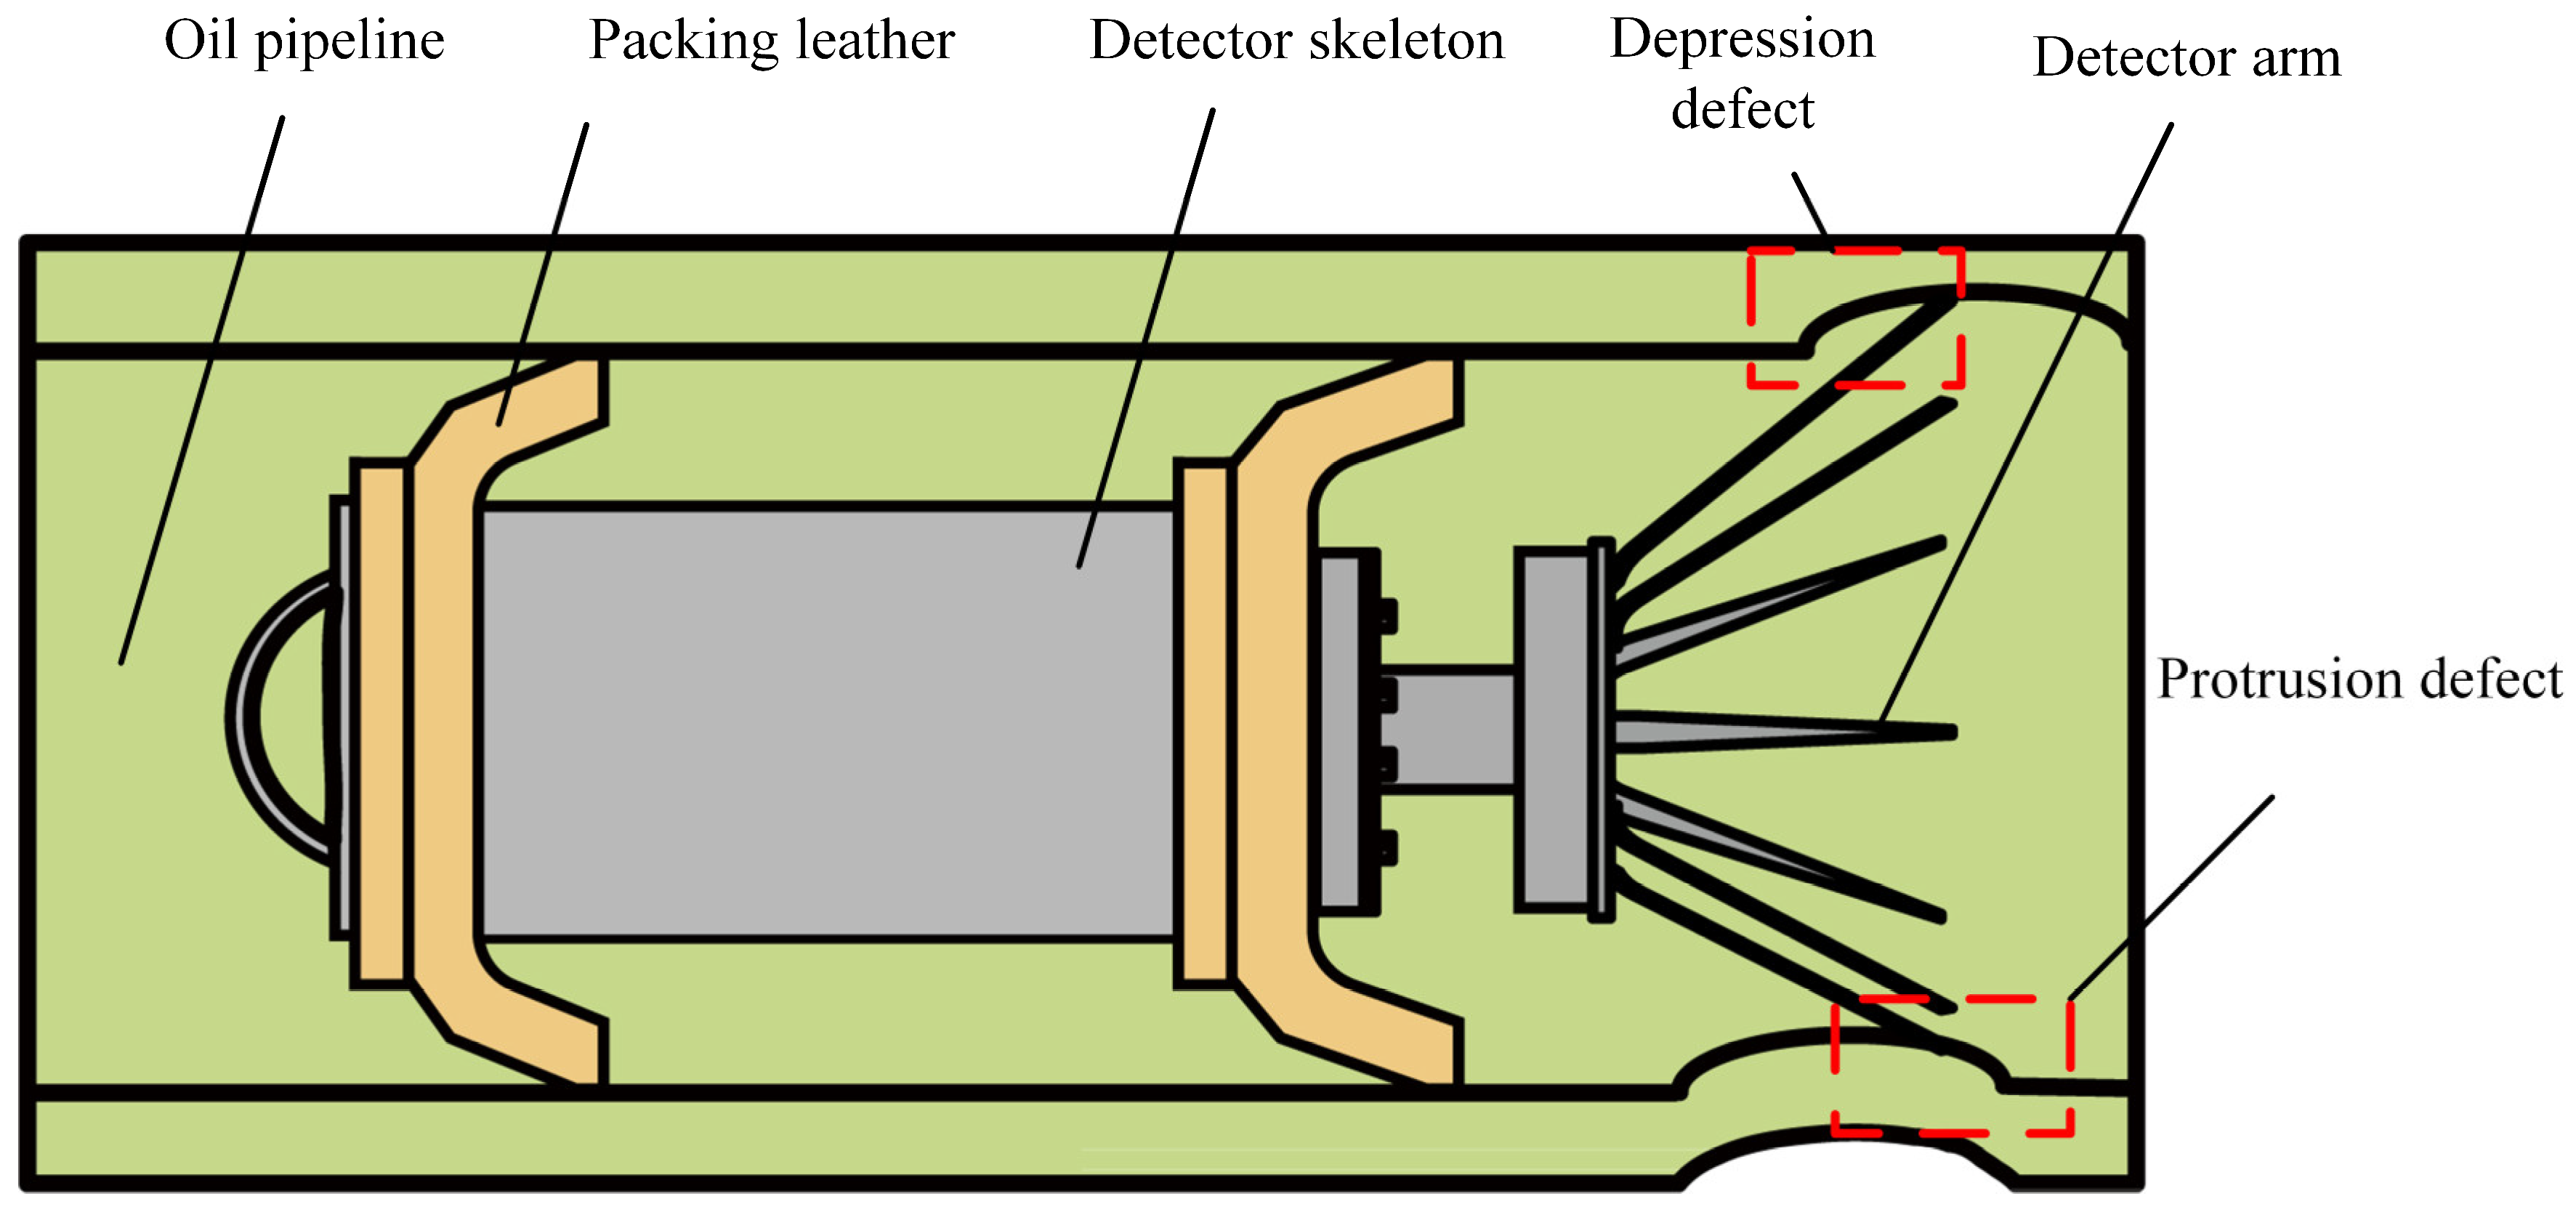
The leaf spring caliper is a new type of pipeline geometric sizing detector [24]. The leaf spring caliper structure consists of three parts, including a packing leather, a detector skeleton, and a detecting arm. A schematic diagram of the leaf spring caliper structure is shown in Figure 1. The packing leather supports the overall structure and forms a seal with the pipe so that the pressure inside the pipe can push the detector forward. The packing leather is a double petal-shaped packing leather stacked installation, under the premise of providing good sealing, and at the same time, has good deformation ability to ensure that the packing leather in the pipeline has good passability.
A set of resilient metal plates (leaf springs) are arranged annularly at the end of the detector as a detection arm. The leaf spring has the original shape of a rectangular metal sheet 15 mm long by 3.9 mm wide by 1 mm high. The leaf spring is mounted on the detector skeleton at an angle so that the diameter of the approximate circle formed by the end of the leaf spring is larger than the diameter of the pipe’s inner wall. When the detector is placed into the pipe and put into operation, the leaf spring is compressed and bent into a circular shape by the pressure in the direction of the radius of the pipe wall because the diameter of the circle formed by the end of the leaf spring is larger than the diameter of the pipe inner wall. A strain gauge is mounted on each spring leaf, and the function of the strain gauge is to detect the leaf spring’s bending and amplify the degree of bending of the leaf spring [26]. The inspection principle of the Leaf Spring Calipers is to calculate the diameter of the pipe’s inner wall from the bending strain of the strain gauges. In practice, the leaf spring calipers are used with a positioning device (e.g., a mileage wheel) to determine the location of depression and protrusion defects. As the leaf spring caliper advances through the pipe, the degree of bending of the leaf spring remains constant, so the bending strain on the strain gauges remains constant. If a protrusion defect is encountered in the pipe wall, the leaf spring is further compressed and bent (curvature increases) and is recognized by the strain gauges, at which point a data logging device connected to the strain gauges with a locating device records the protrusion defect for subsequent repair. If a defect is encountered in the form of a depression in the inner wall of the pipe, the leaf spring is bent less (curvature decreases), and the data logging device records the defect. Leaf springs are subjected to pressure in the radial direction of the pipe wall and are in close contact with the pipe wall. Although this ensures the accuracy of the measurement data, the relative motion between the leaf spring and the pipe wall is a direct metal-to-metal contact under pressure, and the leaf springs wear out as the mileage increases. As wear increases, the degree of bending of the leaf spring decreases (curvature decreases), the bending strain of the strain gauges decreases, and the value of the pipe diameter detected by the leaf spring caliper increases as the mileage increases. However, the actual inner diameter of the pipe remains unchanged, and this phenomenon of deviation between the actual and detected values of the pipe diameter is known as wear error. If the wear error is not corrected in time, the leaf spring caliper will fail due to low detection accuracy. Leaf spring wear must be considered when calculating the measured pipe diameter data. Leaf spring calipers require a function of the amount of wear on the leaf spring versus the distance traveled to be incorporated into the I.D. calculation to correct wear errors. Leaf spring calipers are used in a wide range of applications, including product pipelines and crude oil pipelines, which can be divided into low-viscosity and high-viscosity crude oil pipelines. In this case, it is necessary to bring in a different wear-mileage correction function for the different operating environments of the leaf spring calipers. In this paper, we developed a model of detection arm wear for the problem of leaf spring calipers that wear out when operating in a pipeline. Based on the model, we built a testing system for detecting arm wear to simulate the environment of leaf spring calipers operating in pipelines to derive a function of the change in the relationship between the amount of wear of leaf springs and the mileage traveled. This allows us to incorporate the function of leaf spring wear and mileage into the calculation of the inside diameter of the pipe to correct the error due to wear. Since the operating range of leaf spring calipers includes refined oil pipelines, low-viscosity crude oil pipelines, and high-viscosity crude oil pipelines, we used lubricating media with similar physical parameters to crude oil and refined oil to simulate this process of oil lubrication in pipelines. Light mineral oil was used to simulate refined oil, and SAE 5W-30 lubricant (The brand of SAE 5W-30 lubricating oil is Shell, and its origin is Hong Kong, China) and 600XP 680 (The brand of 600XP 680 lubricating oil is Mobil, and its origin is Jiangsu, China) lubricant were used to simulate low-viscosity crude oil and high-viscosity crude oil. We first used a friction tester to investigate the relationship between the coefficient of friction and the amount of wear at a given speed and load. Then, the relationship between the variation of the amount of wear of the leaf springs and the mileage traveled was studied at a certain speed and a certain load. And a function was fitted to the changing relationship between wear and mileage traveled. This paper presents the concepts of speed correction factor and load correction factor. By comparing the results of wear experiments with the same medium at different speeds and the fitting functions, we find a multiplicative relationship between the fitting functions for different speeds, called the speed correction factor. Similarly, there is a multiplicative relationship between the fitting functions for different loads, called the load correction factor. We use the quadratic interpolation method to obtain the formulas for the velocity correction factor and the load correction factor. The role of the speed correction coefficient is to correct the wear function under different working speeds, thus making the wear function proposed in this paper have a wider range of speed applications. The role of the load correction coefficient is to correct the wear function under different working loads so that the wear function proposed in this paper has a wider range of load applications. The LS-SVM method was used to predict the resulting wear-mileage function, and the accuracy of the prediction was verified by extending the experimental mileage. Ultimately, the wear–mileage function with verified accuracy is brought into the calculation of the wear error correction of the leaf spring caliper to reduce the influence of the wear of the inspection arm on the calculation of the inner diameter of the pipeline and to improve the accuracy of the inspection.

2. Materials and Methods

2.1. Modeling of Detection Arm Wear

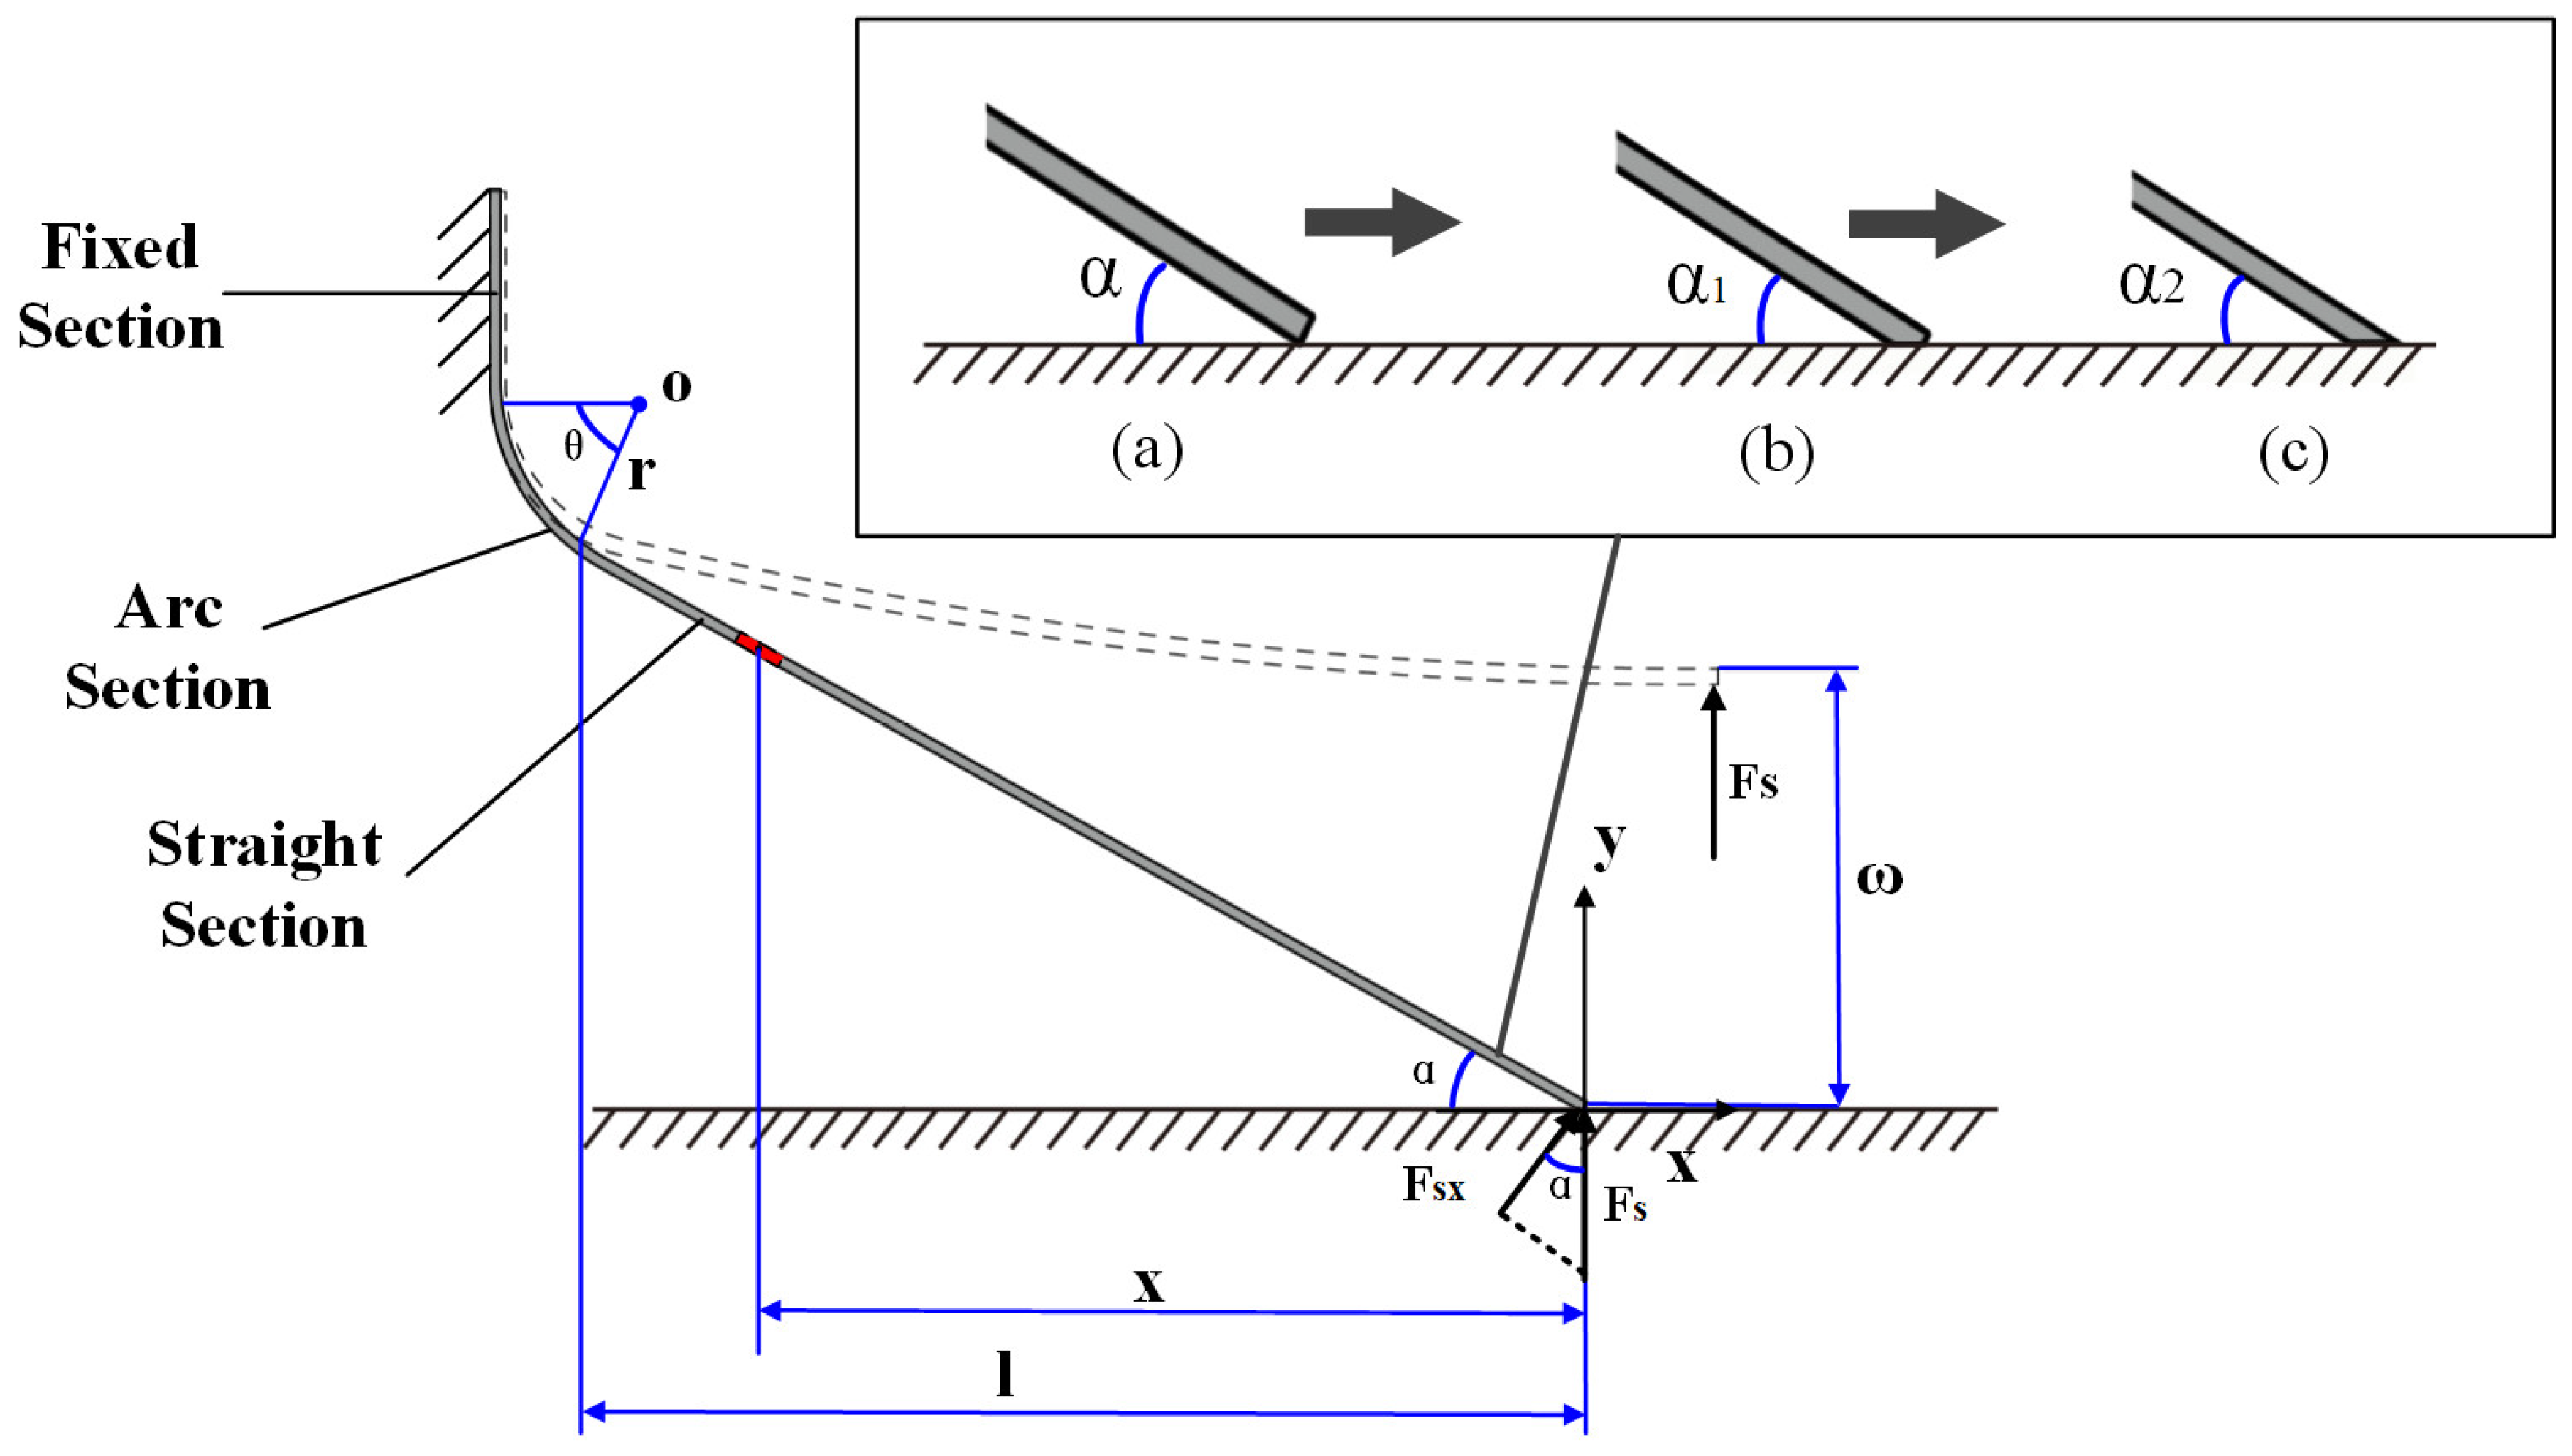
During the operation of the detection arm, the cross-section change of the contact position of the detection arm and the inner wall of the pipeline is shown in the Figure above; when there is no wear and tear at the contact point of the detection arm, the model is shown in Figure 2a, and the contact point is a line contact. When the detecting arm starts to advance, with the increase in wear, the contact point gradually changes to the contact surface. As shown in Figure 2b, the length of the detecting arm decreases, and the angle between the detecting arm and the inner wall of the pipeline increases from ɑ to ɑ1. At this time, the thickness of the wear is less than the thickness of the detecting arm, and the contact surface is a rectangle that is gradually enlarged. Its contact area S j is calculated as (1).
S j 1 = l cos α l tan α sin α 1 cos α 1 l w = ( l cos α cos α 1 l tan α sin α 1 cos α 1 ) l w
where l w is the width of the detection arm; this is called the half-worn state.
As the wear increases, as shown in Figure 2c, the wear thickness is equal to the thickness of the detection arm, the contact surface reaches the maximum value, and the contact area S j is calculated as (2).
S j 2 = 2 b l w sin α 2
where 2b is the thickness of the detection arm; this is called the full wear state.
After that, the ɑ angle increases with wear, but the contact surface gradually decreases in area, although it remains rectangular and is calculated using the same formula as S j 2 .

2.2. Experimental Method

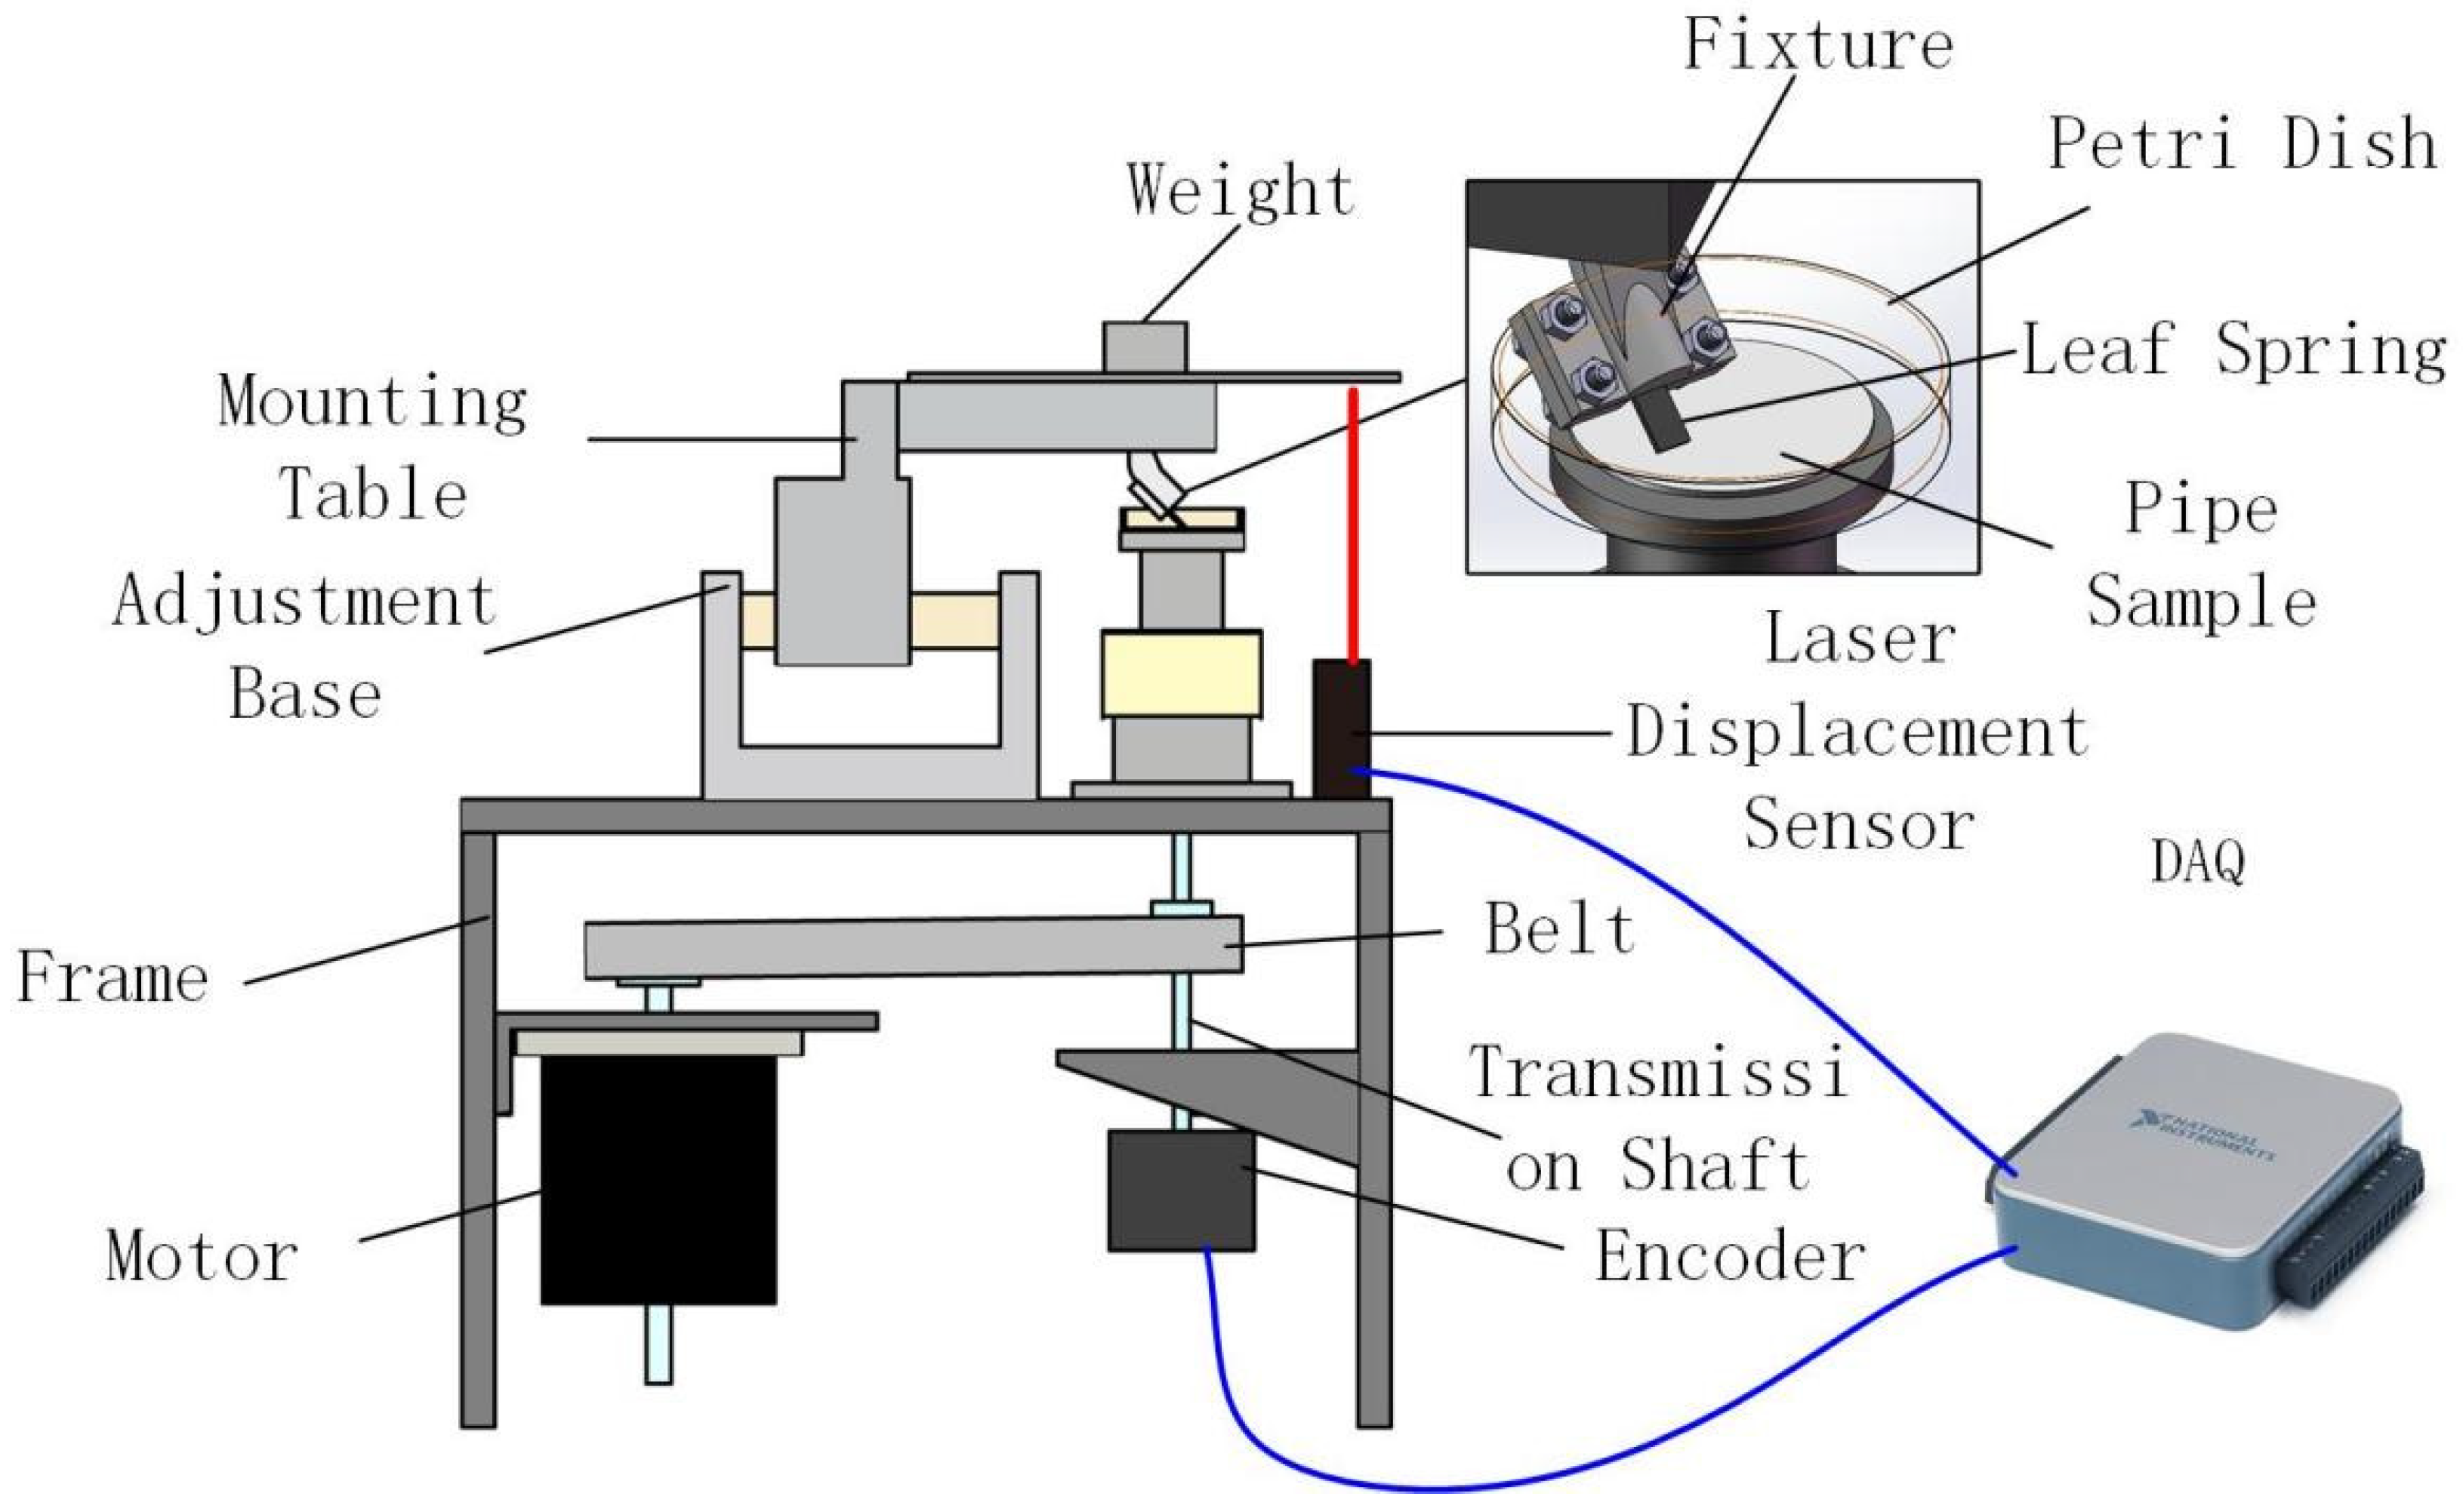
The inspection arm wear test system consists of three parts: the rack system, the power system, and the test system, as shown in Figure 3. The frame system comprises a frame, an adjustment base, and a mounting table. The transmission system consists of a motor, belt, transmission shaft, and base. The test system consists of a leaf spring fixture, petri dish, leaf spring sample, pipe sample, weights, laser displacement sensor, rotary encoder, and DAQ data acquisition card.
Rack system: Adjusting the base can change the left and right positions of the leaf spring specimen so that the leaf spring is perpendicular to the rotational direction of the pipe specimen to ensure that the leaf spring runs forward along the tangential direction of the pipe specimen.
The mounting table holds the leaf spring specimen fixture to keep the leaf spring in place. A laser distance sensor measures the height of the mounting table’s flat plate to infer the leaf spring specimen’s height. When the height of the leaf spring specimen decreases due to wear and tear, the mounting table is free to rotate vertically to lower the height of the long plate, and the laser distance sensor can obtain the change in the height of the leaf spring specimen to calculate the amount of wear and tear.
Weights can be placed on the mounting table to adjust the preload on the leaf spring specimen during operation using weights.
Transmission system: The controller controls the motor rotation speed, the rotary motion through the transmission belt to the transmission shaft, the transmission shaft through the transmission base to the petri dish, the petri dish, and the transmission base fixed connection. When the motor is running, the leaf spring specimen is fixed, the petri dish rotates, the pipe specimen is fixedly connected with the petri dish, then the pipe specimen rotates to simulate the running state of the leaf spring in the pipe.
Test system: The fixture is in two parts, top and bottom, and four bolts fix the leaf spring specimen. The height is controlled by the mounting table so that it just touches the pipe specimen and is in a horizontal state.

2.3. Test Instrument

The material of the leaf spring specimen is G61500 (UNIFIED NUMBERING SYSTEM), and the pipe specimen is X80 (API SPEC 5L).
The laser distance sensor model LG5A65PU has a resolution of 0.003 mm and an accuracy of 0.02 mm, and it can measure a distance of 45–60 mm.
The rotary encoder can measure the rotational speed in real-time to calculate the leaf spring specimen’s linear velocity.
The signal of the laser ranging sensor and the rotary encoder signal enter the DAQ acquisition card at the same time, and the DAQ acquisition card is selected as the NI6001 model, which is connected to the computer to store the collected data into the computer for analysis.
Coefficient of friction testing:
Ducom POD 4.0 Tribometer;
Surface topography mapping:
ZYGO GPI XP/D Laser Interferometer.

2.4. Experimental Material

The leaf spring material is named G61500 under the standard of UNIFIED NUMBERING SYSTEM and 50CrVA under the GB/T 1222-1984 standard. This material is spring steel, whose main components include carbon (C), silicon (Si), manganese (Mn), chromium (Cr), vanadium (V), and small amounts of phosphorus (P) and sulfur (S). The composition range is as follows:
Carbon (C): approx. 0.46–0.54%;
Silicon (Si): approx. 0.17–0.37%;
Manganese (Mn): approx. 0.50–0.80%;
Chromium (Cr): approx. 0.80–1.10%;
Vanadium (V): Approx. 0.10–0.20%;
Phosphorus (P): not more than 0.035%;
Sulfur (S): not more than 0.035%.
The pipeline material is called X80 pipeline steel under the API SPEC 5L nomenclature.X80 pipeline steel is a high-strength, high-toughness steel for pipelines, primarily used for transporting natural gas and oil. It is usually classified as a high-strength low alloy (HSLA) steel. The following are the composition ranges of X80 pipeline steel in general as follows:
Carbon (C): approx. 0.06–0.12%;
Silicon (Si): between 0.15–0.40%;
Manganese (Mn): Between 1.00 and 1.80%;
Phosphorus (P): not more than 0.030%;
Sulfur (S): not more than 0.030%;
Niobium (Nb): between 0.04 and 0.10%;
Vanadium (V): Between 0.06–0.12%;
Chromium (Cr): Between 0.25 and 1.25%;
Nickel (Ni): Below 0.25%.
Light mineral oil, a mixture of refined liquid hydrocarbons obtained from petroleum, has a density of 0.83 g/mL at 40 °C, a kinematic viscosity of 30.4 mm2/s, a boiling point of 210 °C, a flash point of 185 °C and a pour point of −30 °C with a viscosity index of between 80 and 120. It is a colorless semi-transparent oily liquid, non- or almost non-fluorescent, odorless and tasteless when cold, slightly petroleum odor when heated, insoluble in water, ethanol, soluble in volatile oils, miscible in most non-volatile oils, stable to light, and heat, acid, etc., but it will be oxidized slowly when exposed to light and heat for a long time. They are widely used in mechanical equipment, engines, lubrication systems, and other applications requiring lubrication and protection. Since light mineral oil and refined oil at the same temperature have highly similar density, kinematic viscosity, and other physicochemical properties, and light mineral oil has a high chemical stability, this paper selects the light mineral oil medium to simulate the pipeline in the refined oil medium.
SAE 5W-30 lubricant with a density of 0.91 g/mL at 40 °C, a kinematic viscosity of 62.64 mm2/s, a flash point of 200 °C, a pour point of −35 °C to −40 °C and a viscosity index of 150. The light yellow petroleum variety is insoluble in water, ethanol, and volatile oils and soluble in most non-volatile oils, light, heat, and acid. SAE 5W-30 is a multi-viscosity grade of motor oil that meets the Society of Automotive Engineers (SAE) standards. The “5W” designation indicates fast flow in cold conditions, while the “30” designation indicates moderate viscosity at high temperatures. Since the density, kinematic viscosity, and other physicochemical properties of SAE5W-30 lubricant are close to those of low-viscosity crude oil in the crude oil pipeline under the same conditions of temperature, and it has high chemical stability and safety, this paper chooses SAE5W-30 lubricant medium to simulate the crude oil medium in the crude oil pipeline.
Mobil 600XP 680 lubricant has a density of 0.86 g/mL at 40 °C, a kinematic viscosity of 680 mm2/s, a pour point of −9, a flash point of 285, and a viscosity index of 90. It is amber in color, insoluble in water, ethanol, and volatile oils, soluble in most non-volatile oils, and stable to light, heat, and acids. Mobil 600XP 680 lubricants are high-performance gear oils with outstanding extreme pressure characteristics and load-carrying capacity for all circulating or splash-lubricated closed gears. As Mobil 600XP 680 lubricants and crude oil pipelines in the high viscosity crude oil at the same temperature under the same conditions have a highly similar density, kinematic viscosity, and other physicochemical properties, and its chemical stability, this paper selects the Mobil 600XP 680 lubricant media simulation pipeline in the high viscosity of the crude oil medium.

2.5. Experimental Procedure

Wear accuracy test:
In the first step, the weight was set to 10 N so that the motor drove the pipe specimen to move at a speed of 1 r/s, and the radius of rotation was 0.015 m, i.e., the leaf spring specimen was running at a speed of 0.0942 m/s. The pipe specimen was run continuously for 50 h, i.e., the total mileage of the run was 16,956 m. The motor was stopped at this time, and the leaf spring abrasion amount was calculated.
In the second step, light mineral oil was added with a density of 0.83 g/mL, a kinematic viscosity of 30.4 mm2/s, 40 °C, weights of 10 N, and a speed of 1 r/s for 50 h.
In the third step, SAE 5W-30 lubricant was added with a density of 0.91 g/mL, a kinematic viscosity of 62.64 mm2/s, 40 °C, weights of 10 N, and a speed of 1 r/s for 50 h.
In the fourth step, Mobilgear 600 XP 680 lubricant was added with a density of 0.86 g/mL, a kinematic viscosity of 680 mm2/s, 40 °C, weights of 10 N, and a speed of 1 r/s for the test 50 h.
In the fifth step, light mineral oil was tested at a speed of 0.5 r/s (0.0471 m/s) and a load of 10 N for 100 h (the rest of the experimental conditions remained unchanged).
In the sixth step, the light mineral oil was tested at a speed of 2 r/s (0.1884 m/s) and a load of 10 N for 25 h (the rest of the experimental conditions remained unchanged).
In the seventh step, the light mineral oil was tested at a speed of 1 r/s and a load of 5 N for 50 h (the rest of the experimental conditions remained unchanged).
In the eighth step, light mineral oil was tested at a speed of 1 r/s and a load of 15 N for 50 h (the rest of the experimental conditions remained unchanged).
In the ninth step, SAE 5W-30 lubricant was tested at a speed of 0.5 r/s (0.0471 m/s) and a load of 10 N for 100 h (the rest of the experimental conditions remained unchanged).
In the 10th step, SAE5W-30 lubricant was tested at a speed of 2 r/s (0.1884 m/s) with a load of 10 N for 25 h (the rest of the experimental conditions remained unchanged).
In the 11th step, the SAE 5W-30 lubricant was tested for 50 h at a speed of 1 r/s and a load of 5 N (the rest of the experimental conditions remained unchanged).
In the 12th step, SAE5W-30 lubricant was tested at a speed of 1 r/s and a load of 15 N for 50 h (the rest of the experimental conditions remained unchanged).
In the 13th step, 600XP-680 lubricant was tested at a speed of 0.5 r/s (0.0471 m/s) and a load of 10 N for 100 h (the rest of the experimental conditions remained unchanged).
In the 14th step, 600XP-680 lubricant was tested at a speed of 2 r/s (0.1884 m/s) with a load of 10 N for 25 h (the rest of the experimental conditions remained unchanged).
In the 15th step, 600XP-680 lubricant was tested at a speed of 1 r/s and a load of 5 N for 50 h (the rest of the experimental conditions remained unchanged).
In the 16th step, 600XP-680 lubricant was tested at a speed of 1 r/s and a load of 15 N for 50 h (the rest of the experimental conditions remained unchanged).
The experimental groupings are shown in Table 1.
Friction coefficient test
In the first step, the leaf spring specimen and fixture are fixed on the tribometer, the pipe specimen is fixed on the rotating chassis, no lubricating medium is added, the pressure is applied as 5 N, and the test is carried out at a speed of 1 r/s, and the results are obtained after 100 laps of the test.
In the second step, light mineral oil was added, the pressure was applied as 5 N, the test was carried out at a speed of 1 r/s, and the results were obtained after 100 laps of the test.
In step 3, SAE5W-30 lubricant was added, 5 N of pressure was applied, the test was carried out at 1 r/s, and the results were obtained after 100 laps.
The fourth step is to add Mobil 600XP 680 lubricant, apply pressure of 5 N, test at 1 r/s, and obtain the result after 100 laps.
Surface topography mapping:
In the first step, the samples from the wear test system without added lubricant medium were mounted on the measurement platform of the optical interferometer for testing.
In the second step, the data output from the optical interferometer are visualized, and the results are obtained.

3. Results and Discussion

3.1. Wear Test Analysis

According to the experimental steps of friction coefficient testing, conduct friction coefficient testing experiments.
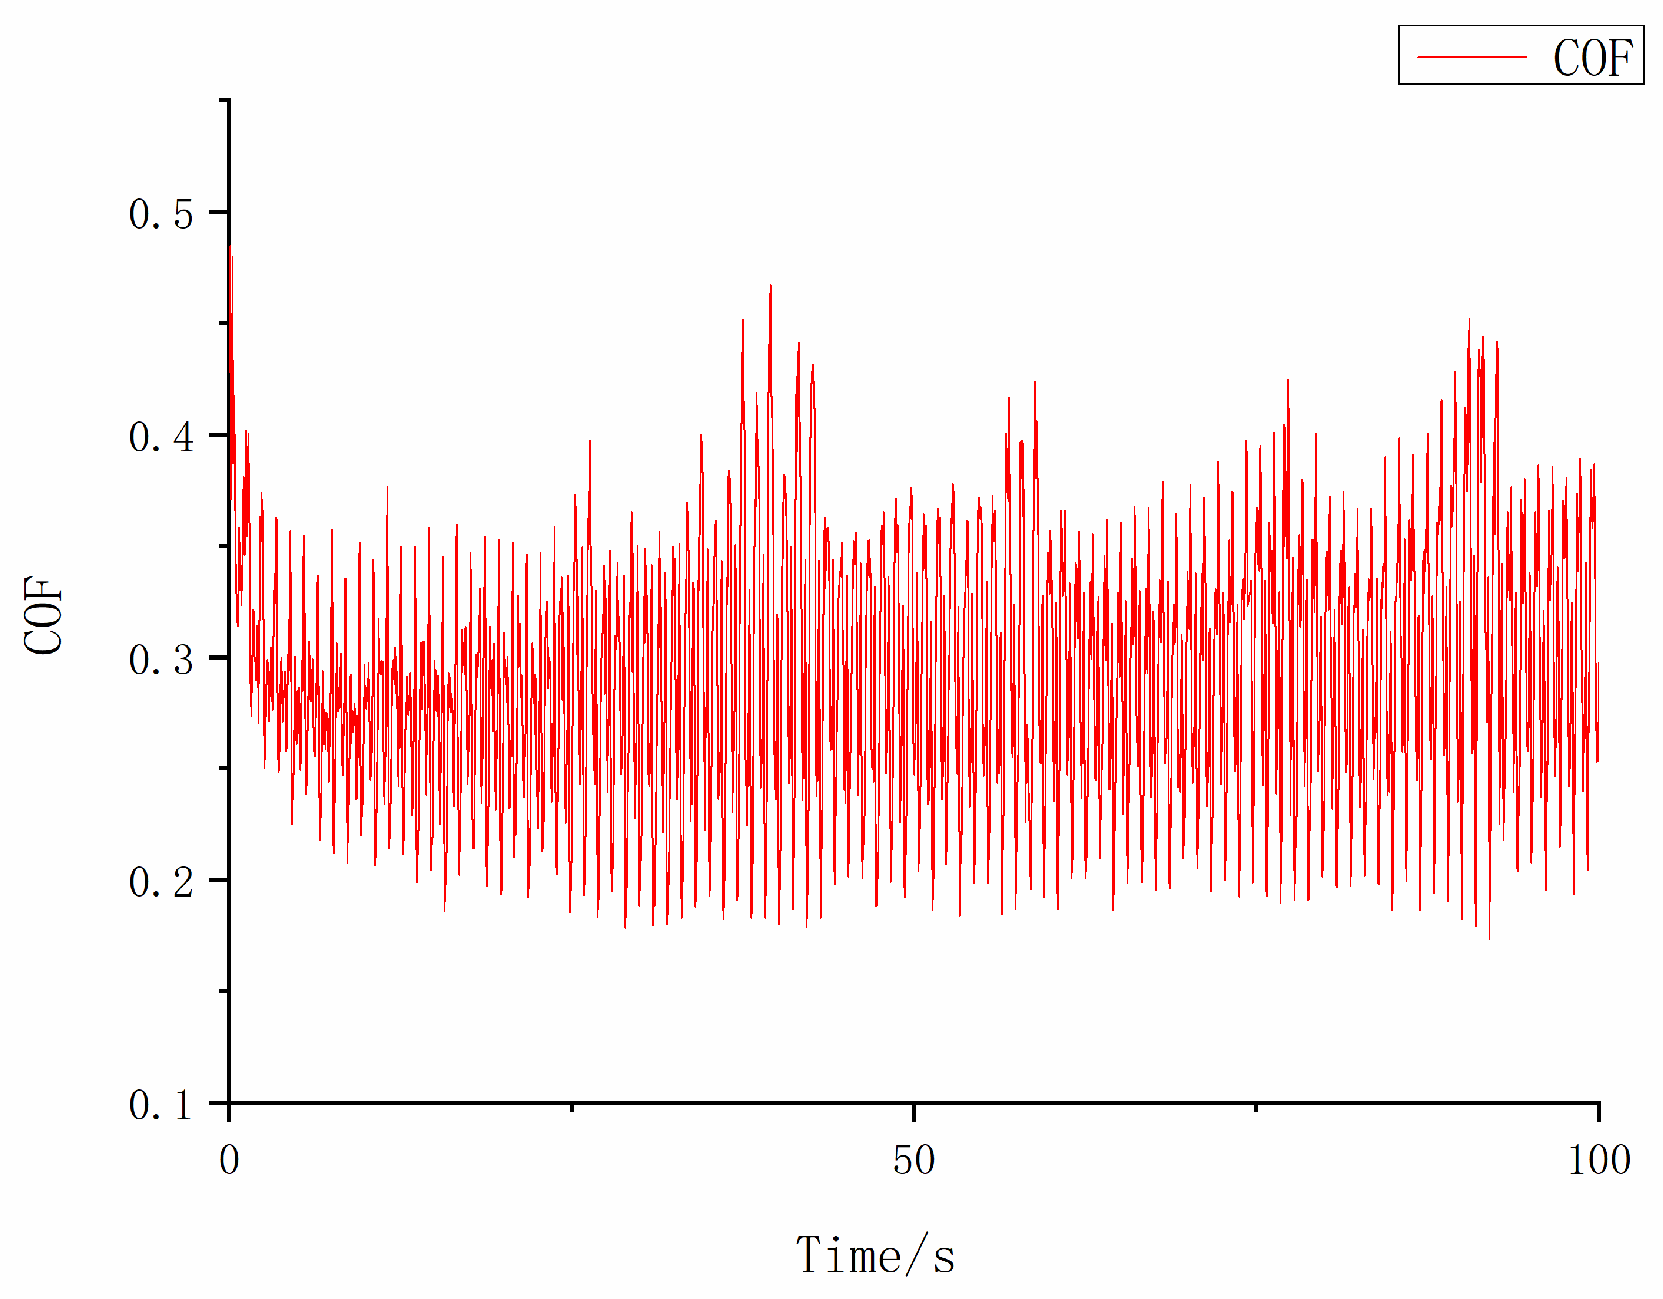
The friction coefficient between the G61500 leaf spring specimen and the X80 pipeline steel specimen is tested using a friction meter, and the result is shown in Figure 4.
A load of 5 N and a speed of 1 r/s were used in this experiment because the manual for the Ducom POD 4.0 tribometer, the instrument we used to test the coefficient of friction, specifies that for most of the measurements, a load of 5 N and a speed of 1 r/s should be used as the standard parameters of the test in order to ensure the accuracy of the data measurements. At the same time, using 5 N load and 1 r/s speed is close to the actual working conditions of leaf spring calipers so that the parameters can be set more closely to the actual working conditions.
When the tribometer tests 100 laps, we obtain enough and tend to stabilize the COF value; 100 laps of the COF value are sufficient for the needs of the analysis of this experiment. For the experiment of detecting COF values of different media, we set the test time to 100 laps at the same time in order to ensure the consistency and comparability of the test.
Based on the results, calculations can be obtained that the coefficient of friction between the leaf spring specimen and the pipe specimen under the condition of no lubricating medium is about 0.292, with a standard deviation of 0.057.
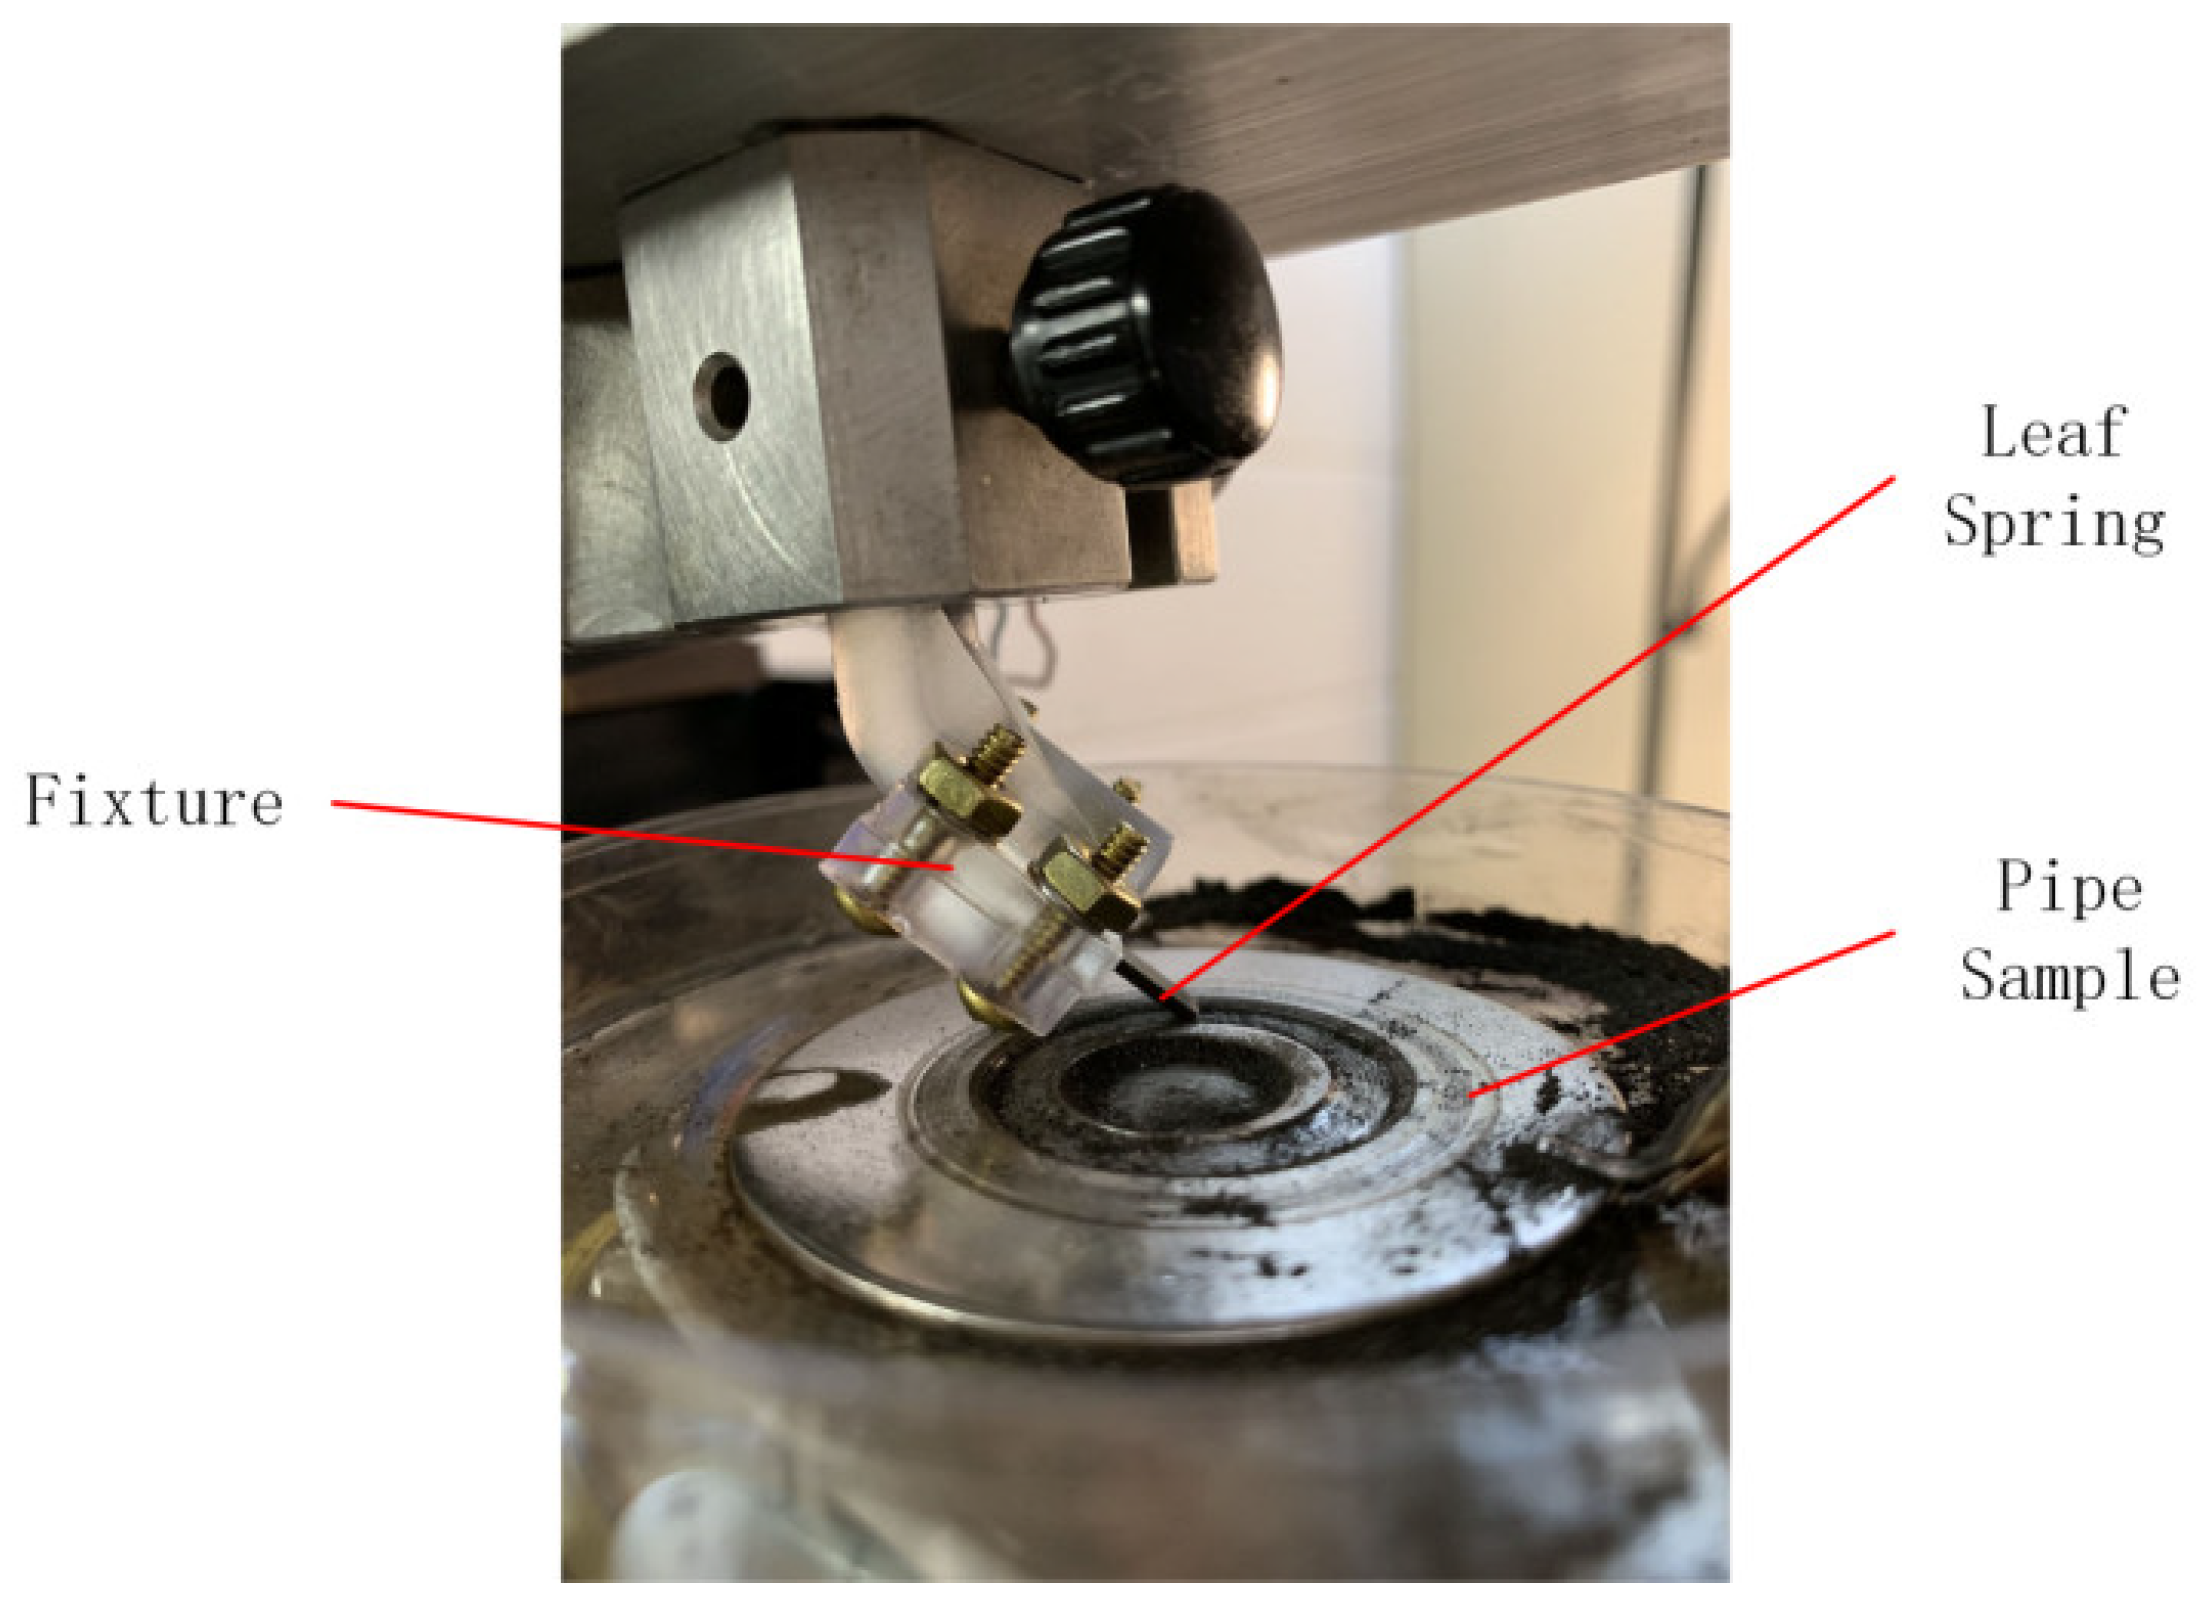
After measuring the coefficient of friction, a wear test was carried out, and the physical diagram of the experiment is shown in Figure 5.
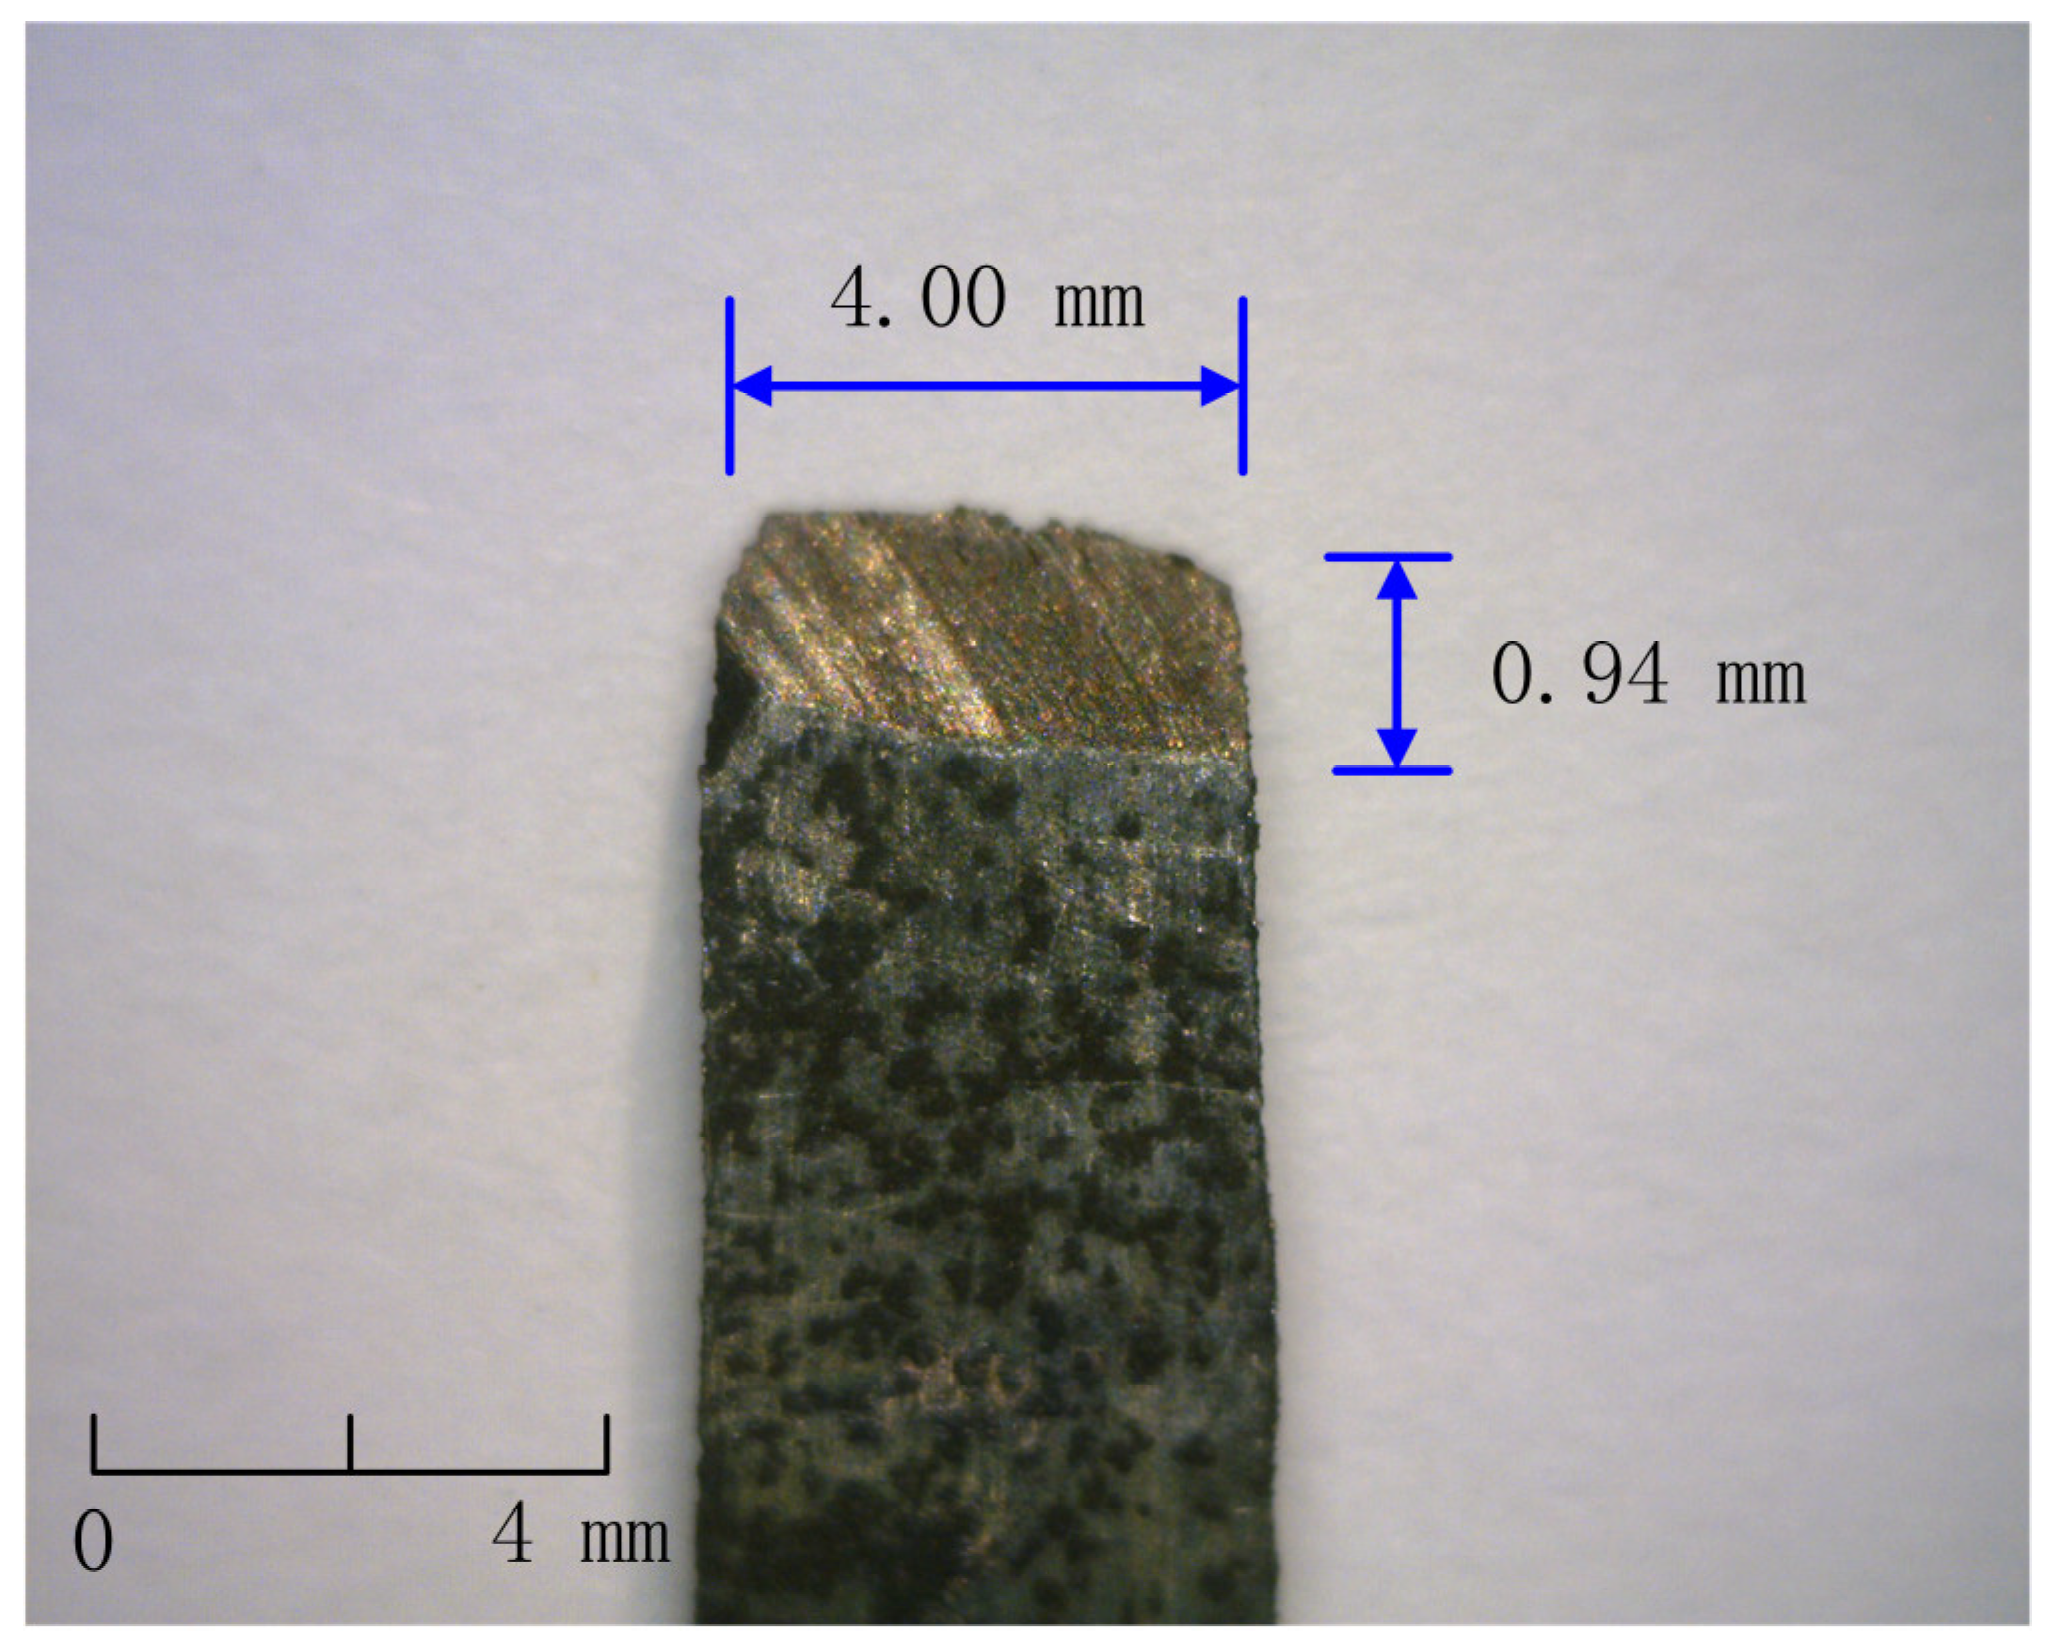
After 50 h of operation at 1 r/s under 10 N load, the leaf spring specimen was removed, and obvious wear marks were visible, as shown in Figure 6.
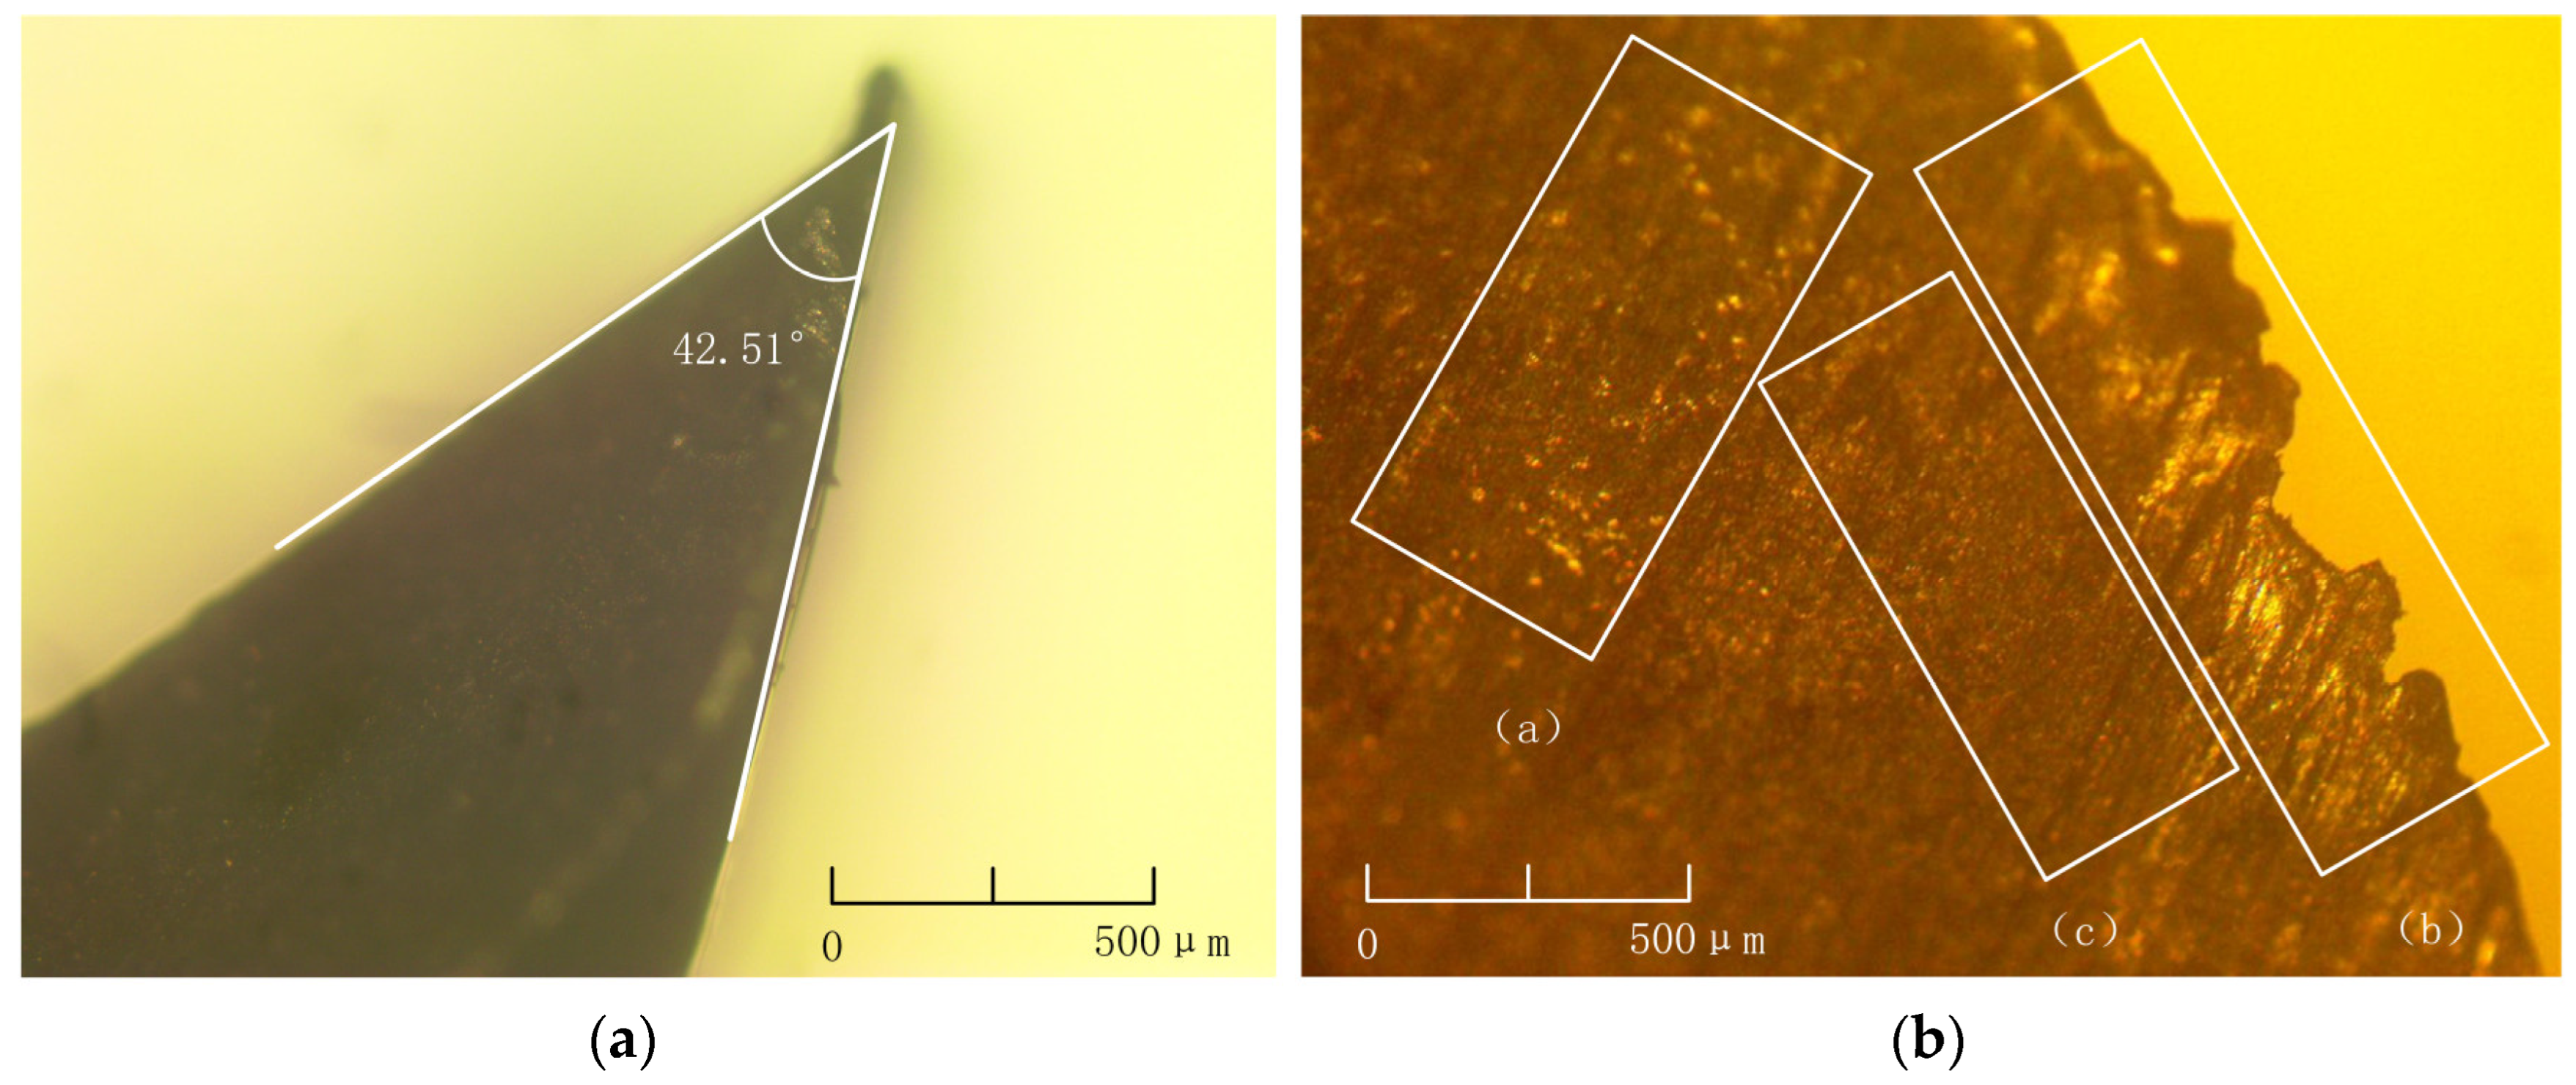
Observation of the worn area of the leaf spring through an optical microscope is in Figure 7.
According to Figure 7a, the wear angle of the leaf spring specimen is 42.51 degrees. After the wear test of the leaf spring was observed by optical microscope, as shown in Figure 7b, we found that three distinct surface morphologies appeared in the wear section. First, we name the surface morphology in Figure 7, which consists of many very small pits as area (a). The reason for the formation of small pits during the wear process is that the actual contact area of the two metals in the experiment only accounts for 0.1~0.01% of the total area, which results in the high metal contact pressure, the maximum of which can be up to 5000 Mpa, and the transient high temperatures of more than 1000 degrees will be generated under the high-speed movement. The contact pressure of the metal is large, and the maximum place can reach 5000 Mpa; the high-speed movement will produce more than 1000 degrees of instantaneous high temperature. This localized high temperature lasts only a few milliseconds. The high temperatures and pressures rupture the lubricant film, adsorption film, or other surface film, resulting in the adhesion of the metal in direct contact. In the ensuing motion, the adhering metal breaks down, and the metal peels away from the surface to form a crater. This wear condition of adhesion, destruction, and re-adhesion is known as adhesive wear [27,28]. Secondly, we name the area (b) in Figure 7, where scratches appear after wear, and the wear section is relatively smooth. The reason for this surface morphology after wear is that when the bond strength is higher than the strength of the two metals, the shear damage occurs mainly within the surface layer of the soft metal and sometimes within the surface layer of the hard metal as well. The metallic material adhering to the hard metal scratches the soft metal, so the abrasion mainly occurs on the surface of the soft metal, and this kind of wear is called abrasion wear [29]. Finally, we will name the long and deep groove in Figure 7 as region (c). This is due to finer and harder abrasive particles between the two friction surfaces, which cut and wear the surface material. In the friction process between the leaf spring specimen and the pipe specimen, the abrasive particles after the leaf spring wear are mixed into the two friction parts, forming the secondary abrasive wear, which increases the degree of wear, and this kind of wear is called abrasive wear [30].
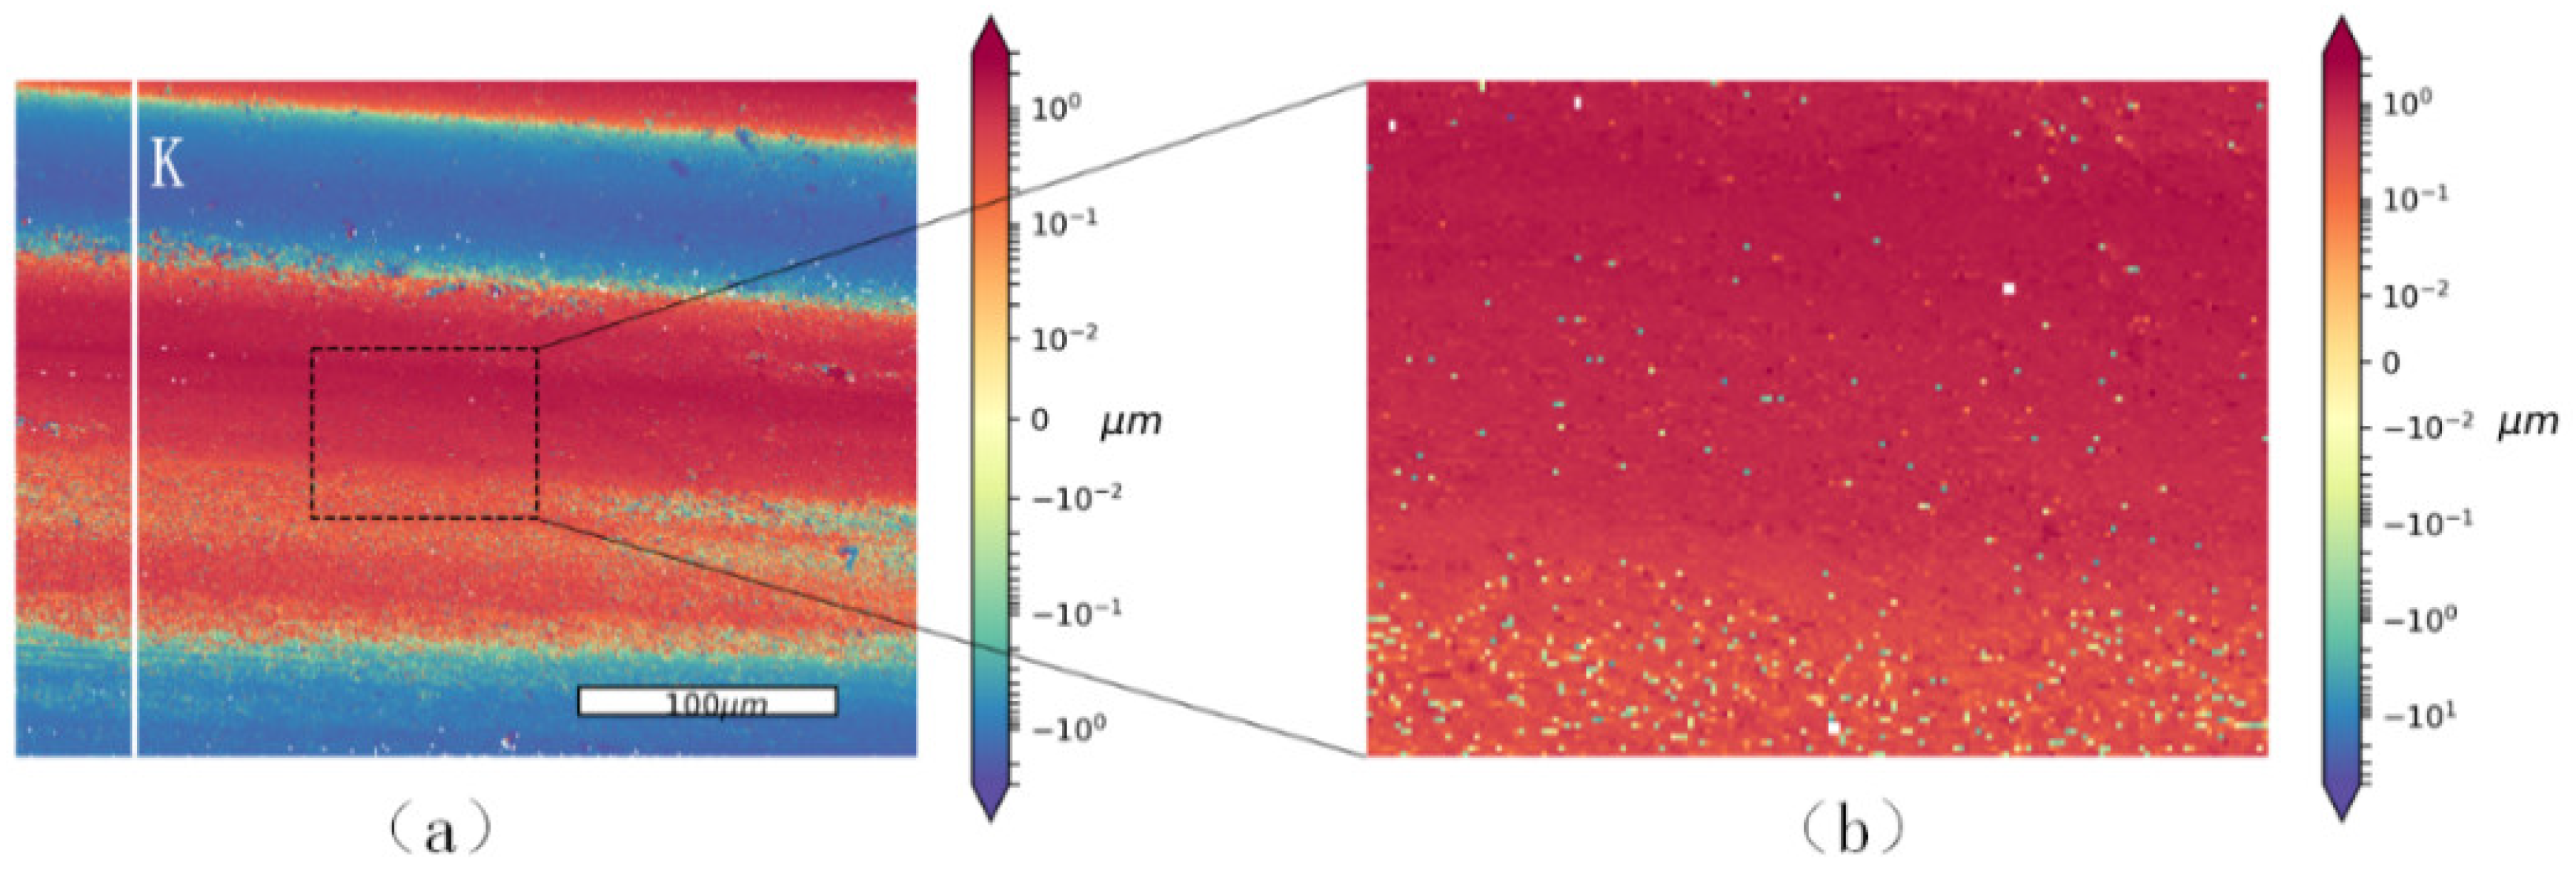
The roughness of the worn surface was examined using an optical interferometer to obtain Figure 8.
Using optical interferometry, the surface morphology of the wear section of a leaf spring specimen was mapped. The detection principle is that the optical interferometer converts the shape of the wear section into a set of three-dimensional data consisting of horizontal coordinates, vertical coordinates, and surface height values, and we visualized the data output from the optical interferometer, as shown in Figure 8. Through Figure 8, we can observe the concave and convex morphology of the wear surface; for example, the pitting pits in Figure 8b are pitting caused by adhesive wear, and the combined effect of abrasion wear and abrasive grain wear forms the long striped grooves.
The wear surface morphology has obvious directionality, i.e., the wear marks are parallel to the running direction of the leaf spring. It can be seen that during the running of the leaf spring, the abrasive particles move between the leaf spring specimen and the pipe specimen due to the stress, forming wear marks parallel to the running direction. Between each wear band, the wear height is similar.
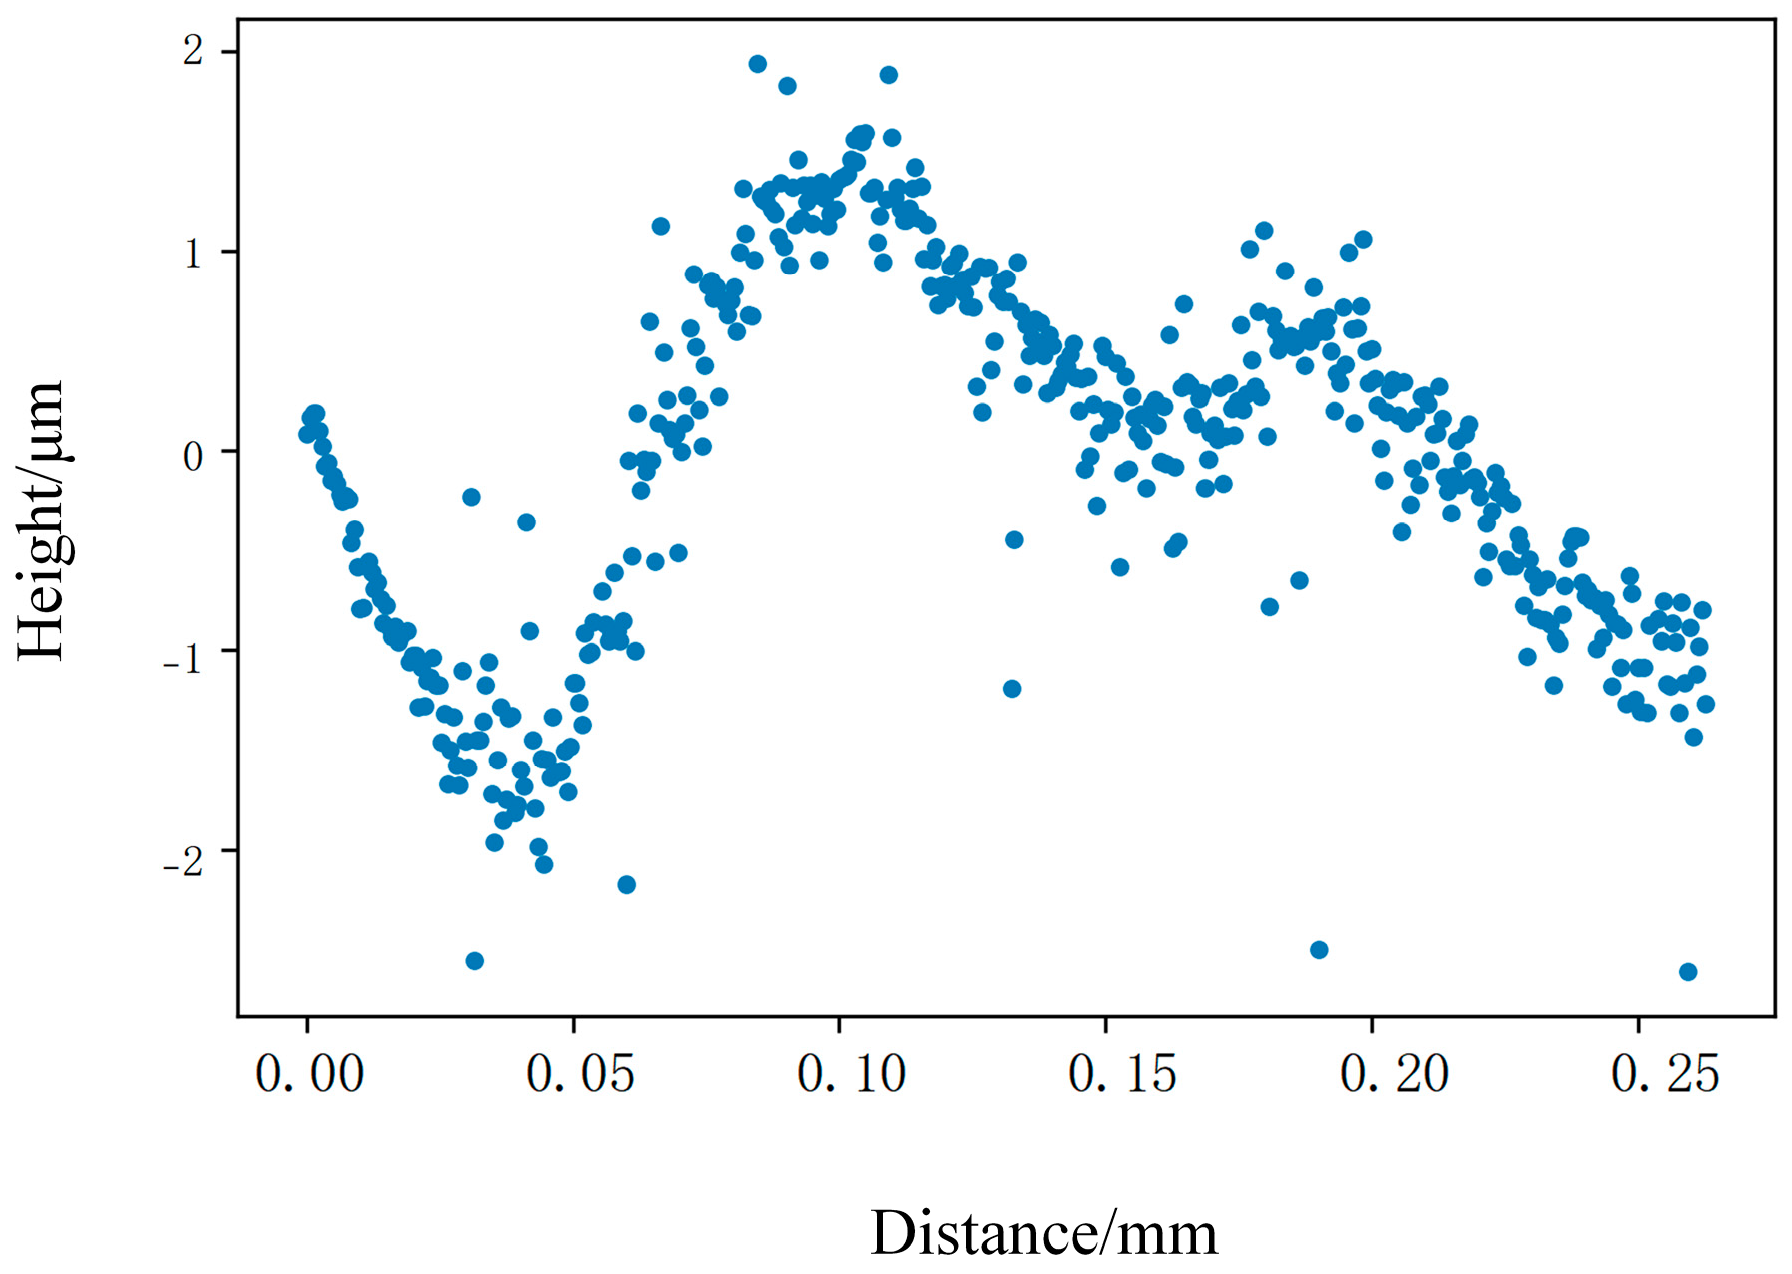
Figure 8 is a set of three-dimensional data plots consisting of horizontal and vertical coordinates and surface height values, where part k is a straight line taken from Figure 8 with a fixed horizontal coordinate value and a different vertical coordinate value. The variation of the longitudinal coordinates of the k-straight line in Figure 8 corresponding to the height values is very informative. Therefore, we plot the height value of the vertical coordinate of line k in Figure 8 as the vertical coordinate and the vertical coordinate of line k in Figure 8 as the horizontal coordinate in Figure 9. Figure 9 shows that there is a change in the height of the surface approximately parallel to the direction of advancement, and the height of the surface decreases continuously when the distance value is from 0.00 to 0.04 and reaches the lowest value at 0.04. This localized depth of the wear grooves is due to the abrasive wear caused by the presence of fine, hard abrasive particles cutting the material between the two friction partners. The scattered dots in the Figure indicate the presence of fine pits and adhesive wear in the wear section. However, Figure 9 has fluctuating heights, but the average height is stable, so there is abrasive wear.
The heights of points in a given area are counted using an optical interferometer, and the average value of the height deviation is calculated to obtain the roughness value for that cross-section.
According to Figure 9, the wear surface height difference is about 4 μm at the K section.
Based on the surface roughness equation
R a = 1 1 0 1 y dx
The wear surface roughness Ra is 0.77 μm, and the standard deviation is 0.96 μm. The standard deviation is larger than the roughness, so it can be seen that the wear surface has a large height difference and is greatly affected by abrasive particles.
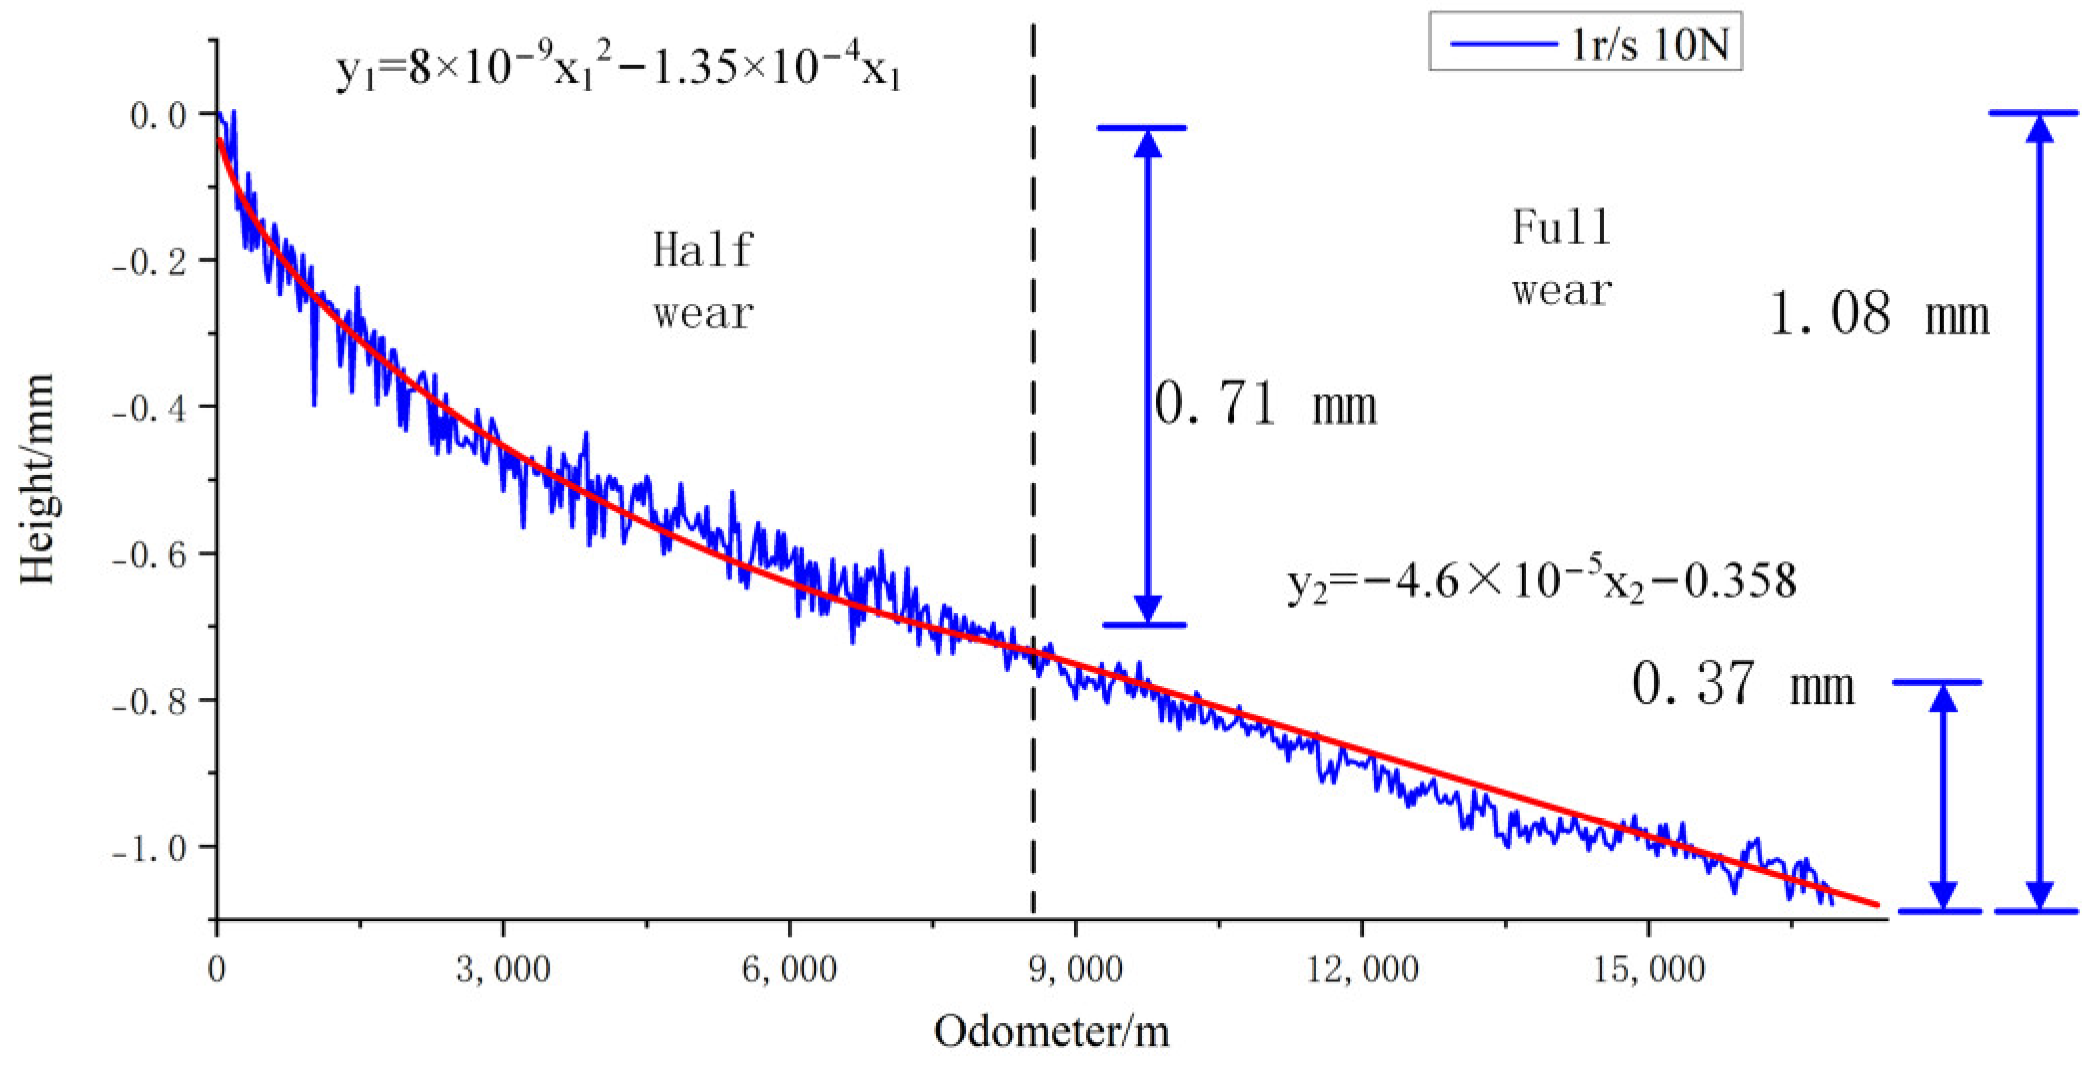
The signals collected by the laser range sensor are processed to obtain Figure 10.
According to Figure 10, it can be seen that there is a clear stage difference in the height change of the leaf spring specimen. In the half-wear state, the contact area is smaller due to the smaller contact area under the same preload, resulting in larger contact pressure and a larger wear rate. The height can be based on the following equation:
h = 2 b cos α
The drop height to enter the full wear height was calculated, and based on this experiment, it is known that a drop of at least 0.707 mm is required to enter the full wear condition.
In the half-wear state, the height of the leaf spring specimen decreased from 0 mm to −0.71 mm, with a total decrease of 0.71 mm. After 8000 m of operation, the leaf spring specimen entered the full-wear state with a reduced wear rate. The half-wear state mileage is 47.1% of the full mileage. The leaf spring specimen decreases from −0.71 mm to −1.08 mm with a total drop height of 0.37 mm. Based on the curve fitting, the function of the two stages is as follows:
y 1 = 8 × 1 0 9 x 1 2 1.35 × 1 0 4 x 1
y 2 = 4.6 × 1 0 5 x 2 0.358
Because the fixture angle is fixed, the experimental test process leaf spring specimen and pipe specimen angle are unchanged. Still, in the actual working conditions of the leaf spring caliper, the leaf spring and the pipe between the angle will be due to the leaf spring wear and tear of the shorter angle change, so according to the experimental height change of the leaf spring specimen to calculate the angle of the change in the actual working conditions of the same height after wear. Based on Figure 2,
sin α = h L
where h is the height from the fixed end to the surface of the pipe, and L is the length of the straight section of the leaf spring. When the leaf spring wears out,
sin α m = h L m
where αm is the angle of entrapment after wear, and Lm is the length of the leaf spring after wear,
L m sin α m = L sin α
L m = L h t sin α t
ht is the height of wear in the wear test, and αt is the angle between the leaf spring specimen and the pipe specimen in the wear test.
Therefore,
α m = arcsin L sin α sin α t L sin α t h t

3.2. Analysis of the Influence of Operating Medium on Wear Accuracy

Oil film lubrication mechanism:
When we add lubricant between the friction interfaces, the molecules in the lubricant adsorb near the metal surfaces, and due to the viscosity of the lubricant, the lubricant forms a continuous film, which we call the lubricant film. As we apply pressure and relative motion between the two metals, the lubricant fills the wear interface, which includes microscopic grooves on uneven surfaces. When the two surfaces come close, repulsive forces between the film molecules prevent the surfaces from staying close together and spreading the pressure. The formation of a stable lubricant film in this environment isolates the metal surfaces and reduces contact between them, thereby reducing friction and wear [31].
Boundary lubrication mechanism:
Boundary lubrication is a critical state when the lubricant is unable to form a sufficient lubricant film on the surface of a mechanical component, and the contact surface is about to transition from liquid lubrication to dry friction (direct contact between the surfaces of the friction pair) process. Boundary lubrication usually occurs in localized areas of the friction pair, especially in areas of high loads and pressures where the metal microstructure is spiky. Under boundary lubrication conditions, the lubricant cannot form a continuous lubricant film; therefore, the lubricant film formed on the metal surface is relatively thin. Boundary lubrication is usually an unstable lubrication condition, and when the lubrication conditions improve, boundary lubrication is transformed into liquid lubrication (oil film lubrication) or mixed lubrication. Although boundary lubrication reduces direct metal contact, it has very high friction and wear compared to mixed lubrication and oil film lubrication [32].
Mixed lubrication mechanism:
Mixed lubrication is a type of lubrication in which there are many different types, including oil film lubrication, dry friction (direct contact between the two metals), and so on. Mixed lubrication occurs when the lubrication interface fails to form a continuous and uniform lubricant film when the speed is reduced or when the friction partner is subjected to an uneven force at a certain location where the local high pressure squeezes the lubricant out of the oil film that cannot be formed, or due to the effect of the roughness of the surface of the friction partner, which leads to direct contact between the two metals. Oil film lubrication and dry friction (direct contact between the two metals) characterize mixed lubrication. At the same time, mixed lubrication is an unstable lubrication state, reducing lubrication performance [33].
(1)
Effect of light mineral oils on wear accuracy
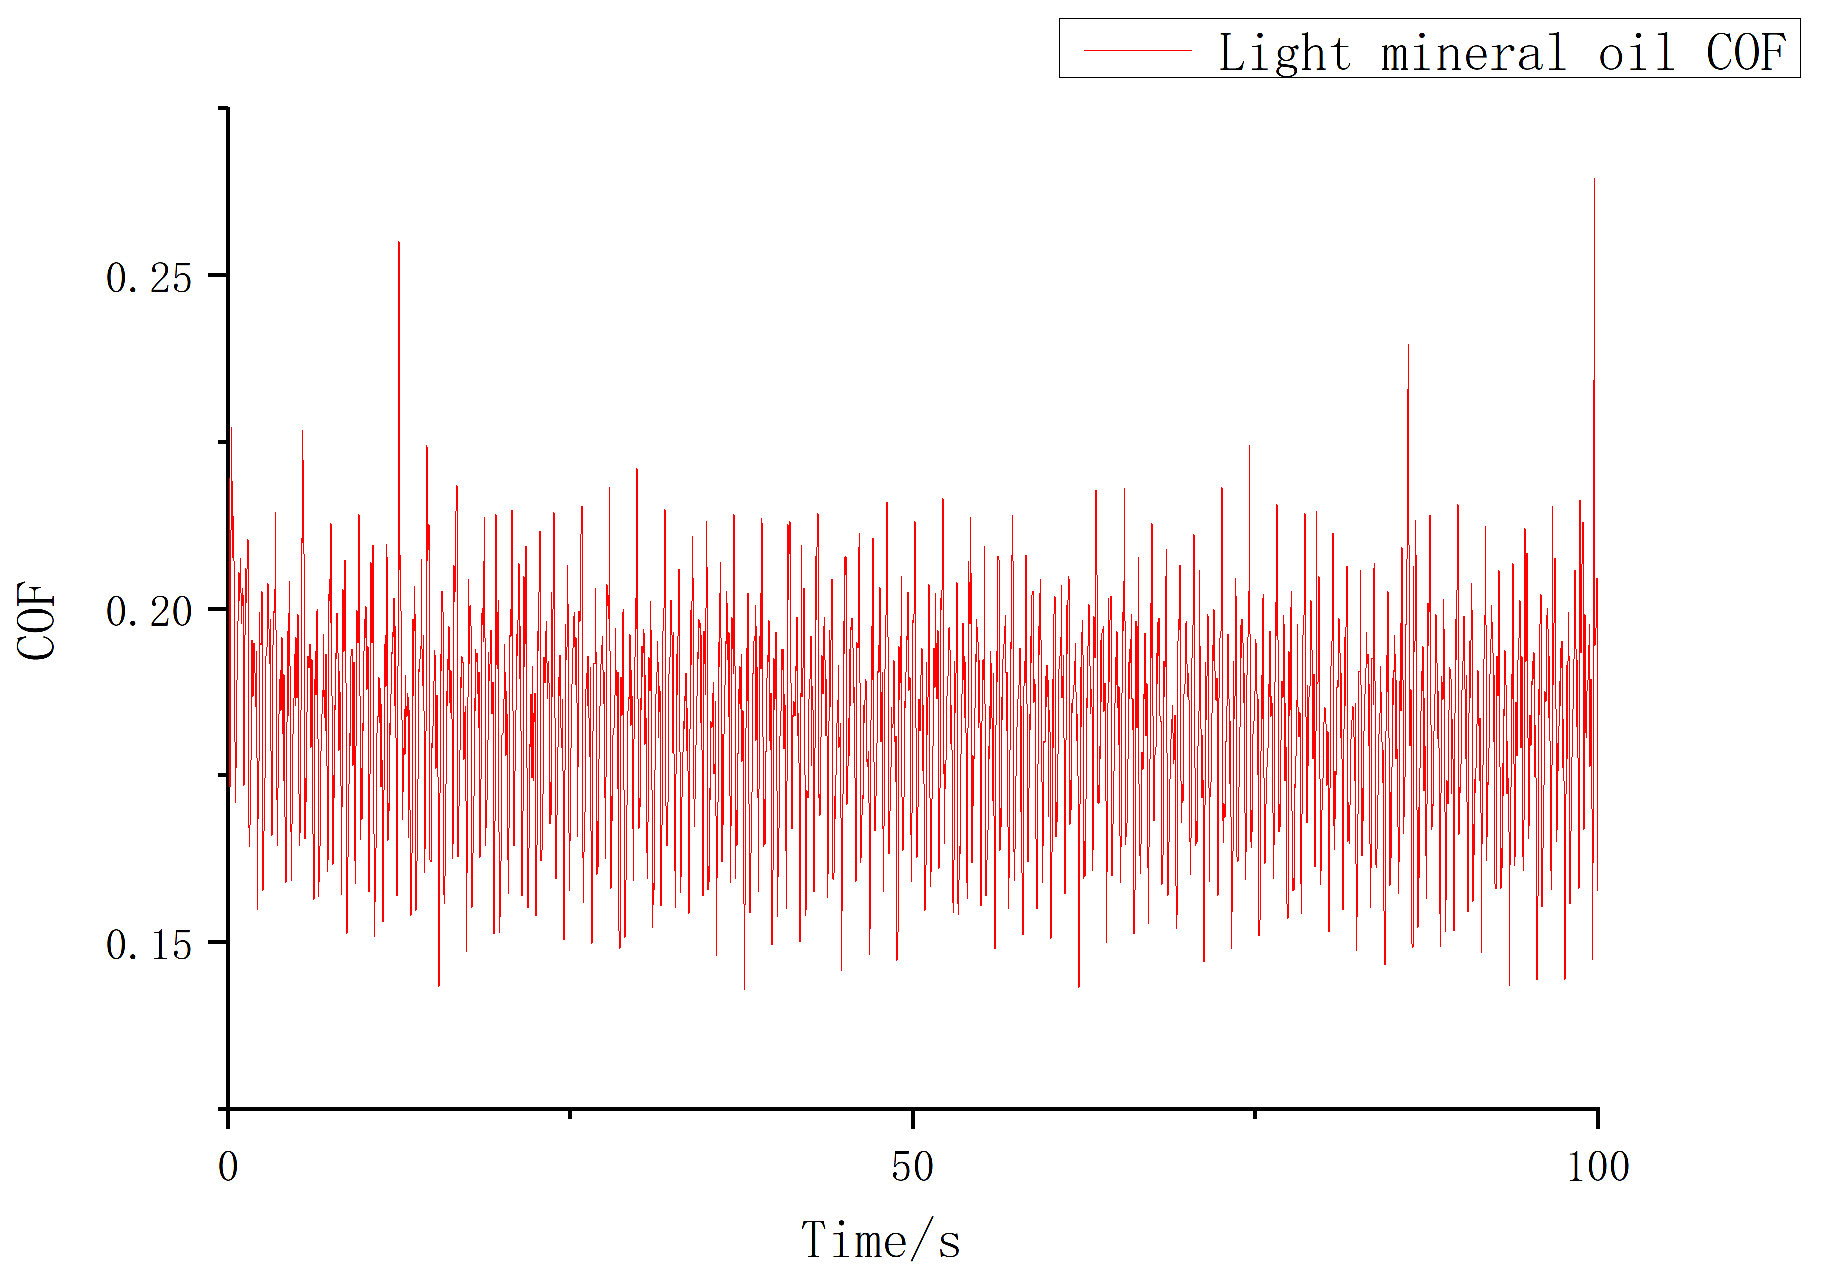
The coefficient of friction between a G61500 leaf spring specimen and an X80 pipeline steel specimen under light mineral oil lubrication conditions was tested using a tribometer. The testing method is similar to the wear experiment: the leaf spring specimen and the fixture are fixed on the tribometer, the pipe specimen is fixed on the rotating chassis, 5 N of pressure is applied, and the test is carried out at a speed of 1 r/s with the results obtained after 100 turns of the test. The results are shown in Figure 11.
Based on the results, calculations can be made that the coefficient of friction between the leaf spring specimen and the pipe specimen under the condition of no lubricating medium is approximately 0.182, with a standard deviation of 0.015.
After measuring the coefficient of friction, wear tests were carried out.
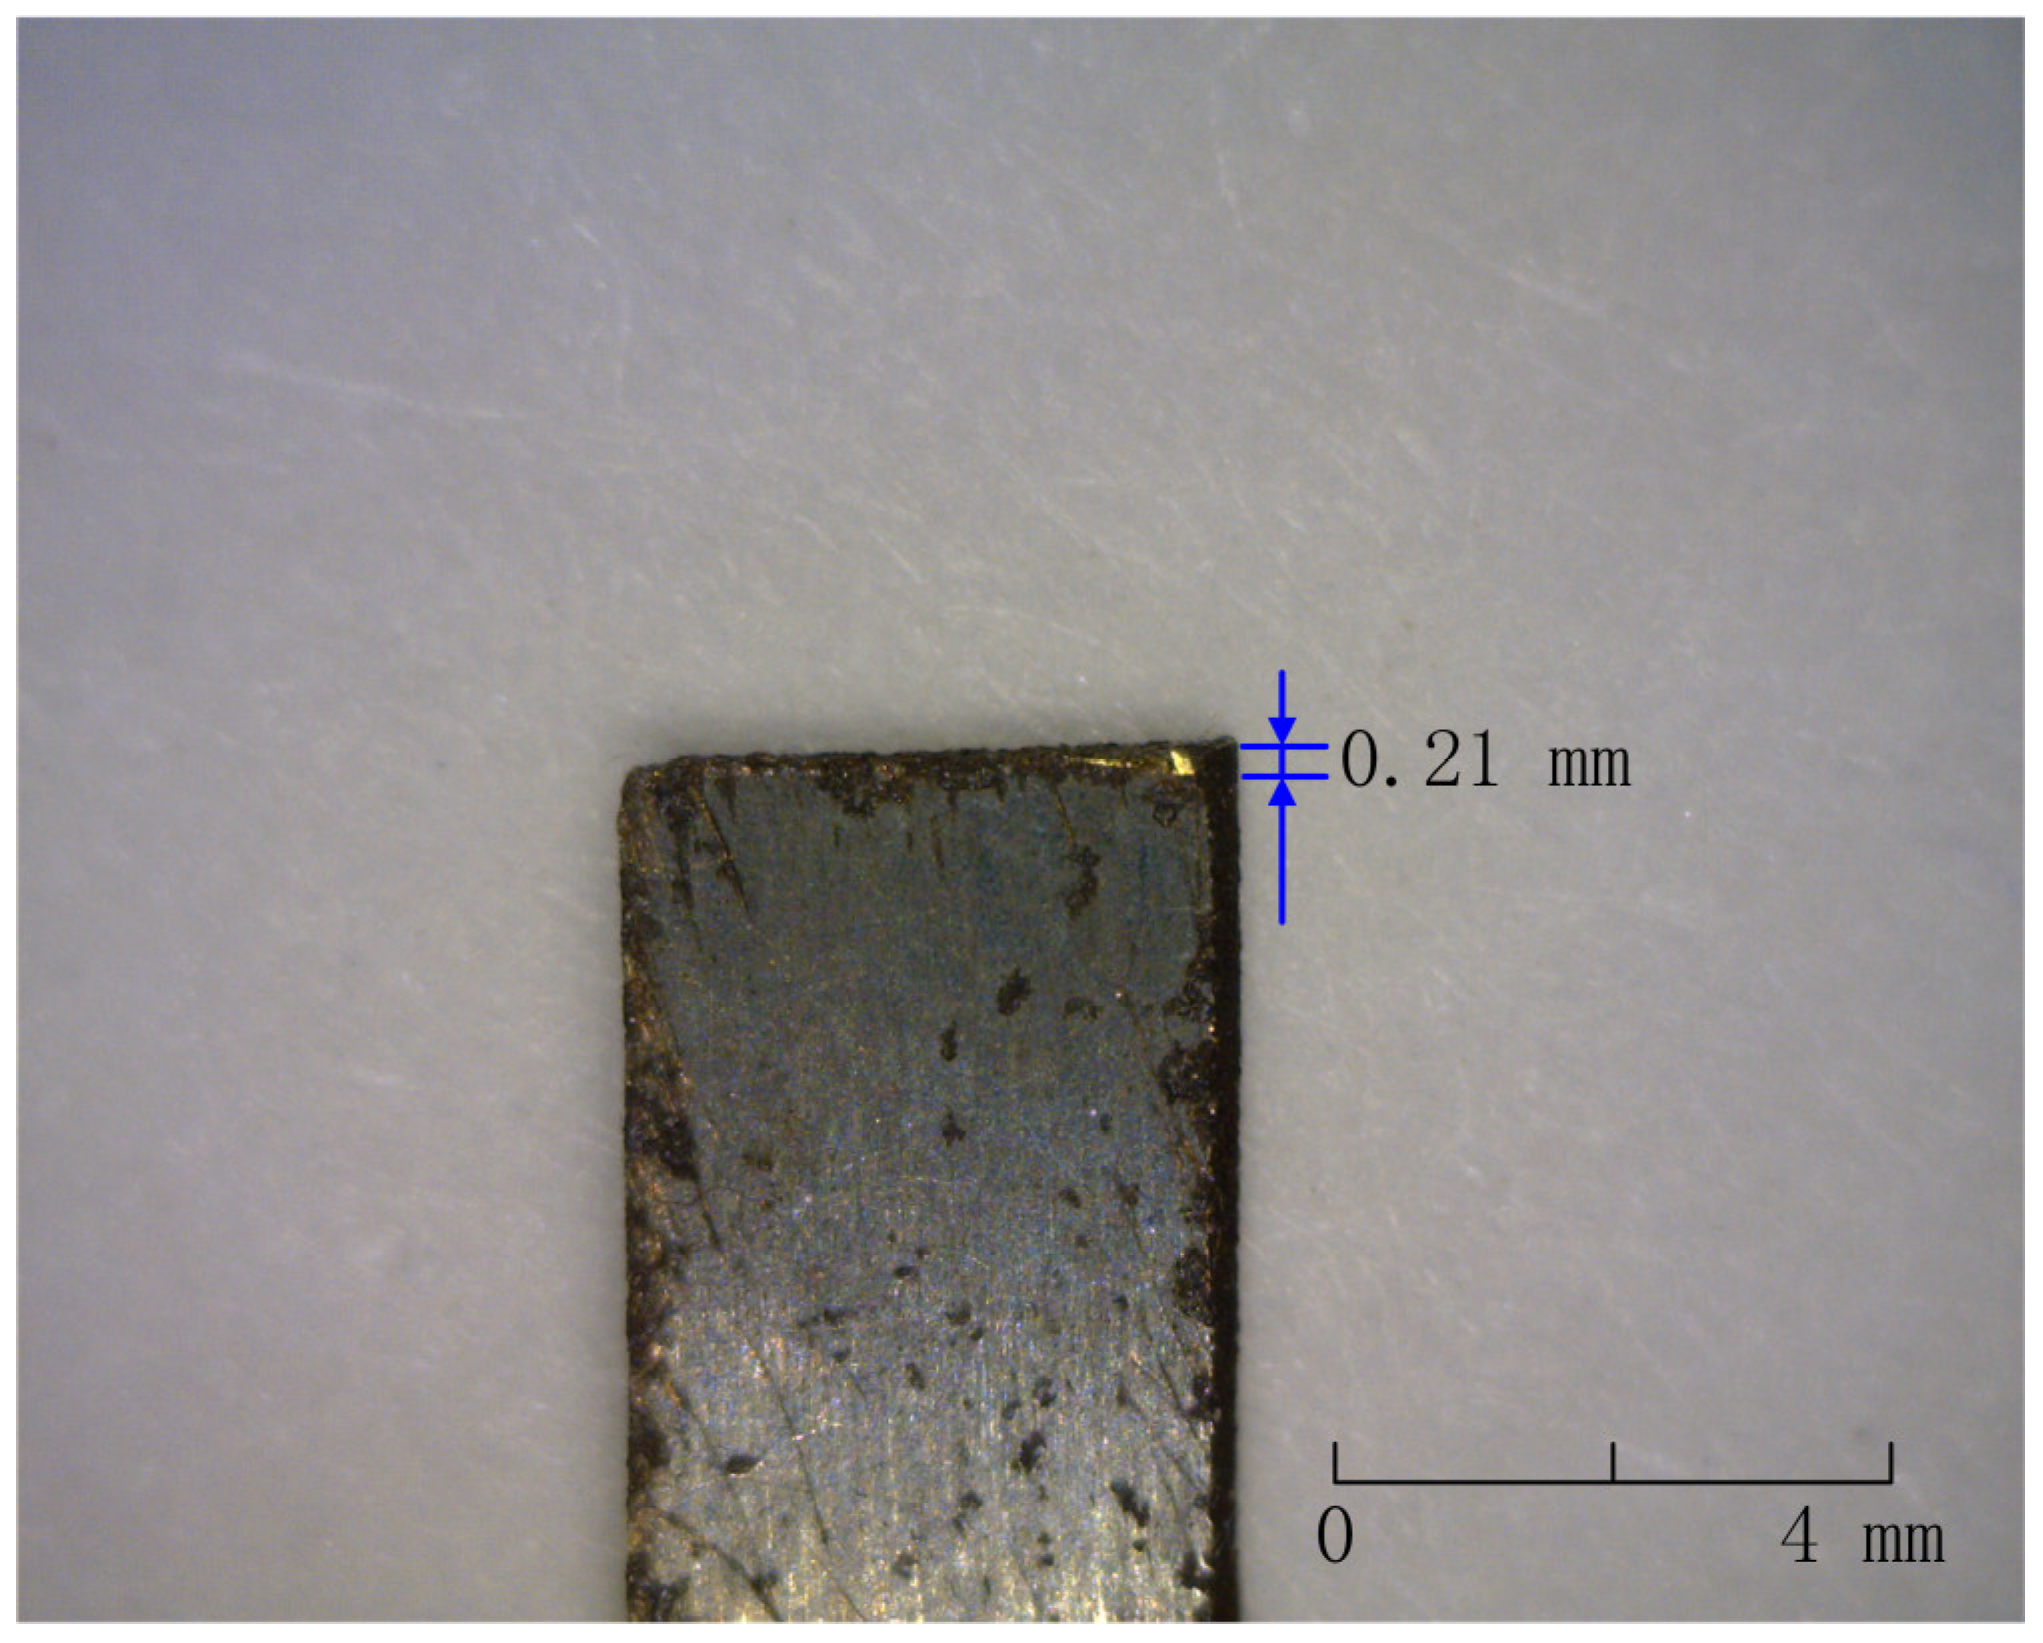
After 50 h of operation at 1 r/s under a 10 N load, the leaf spring specimen was removed and wear marks were visible, as shown in Figure 12.
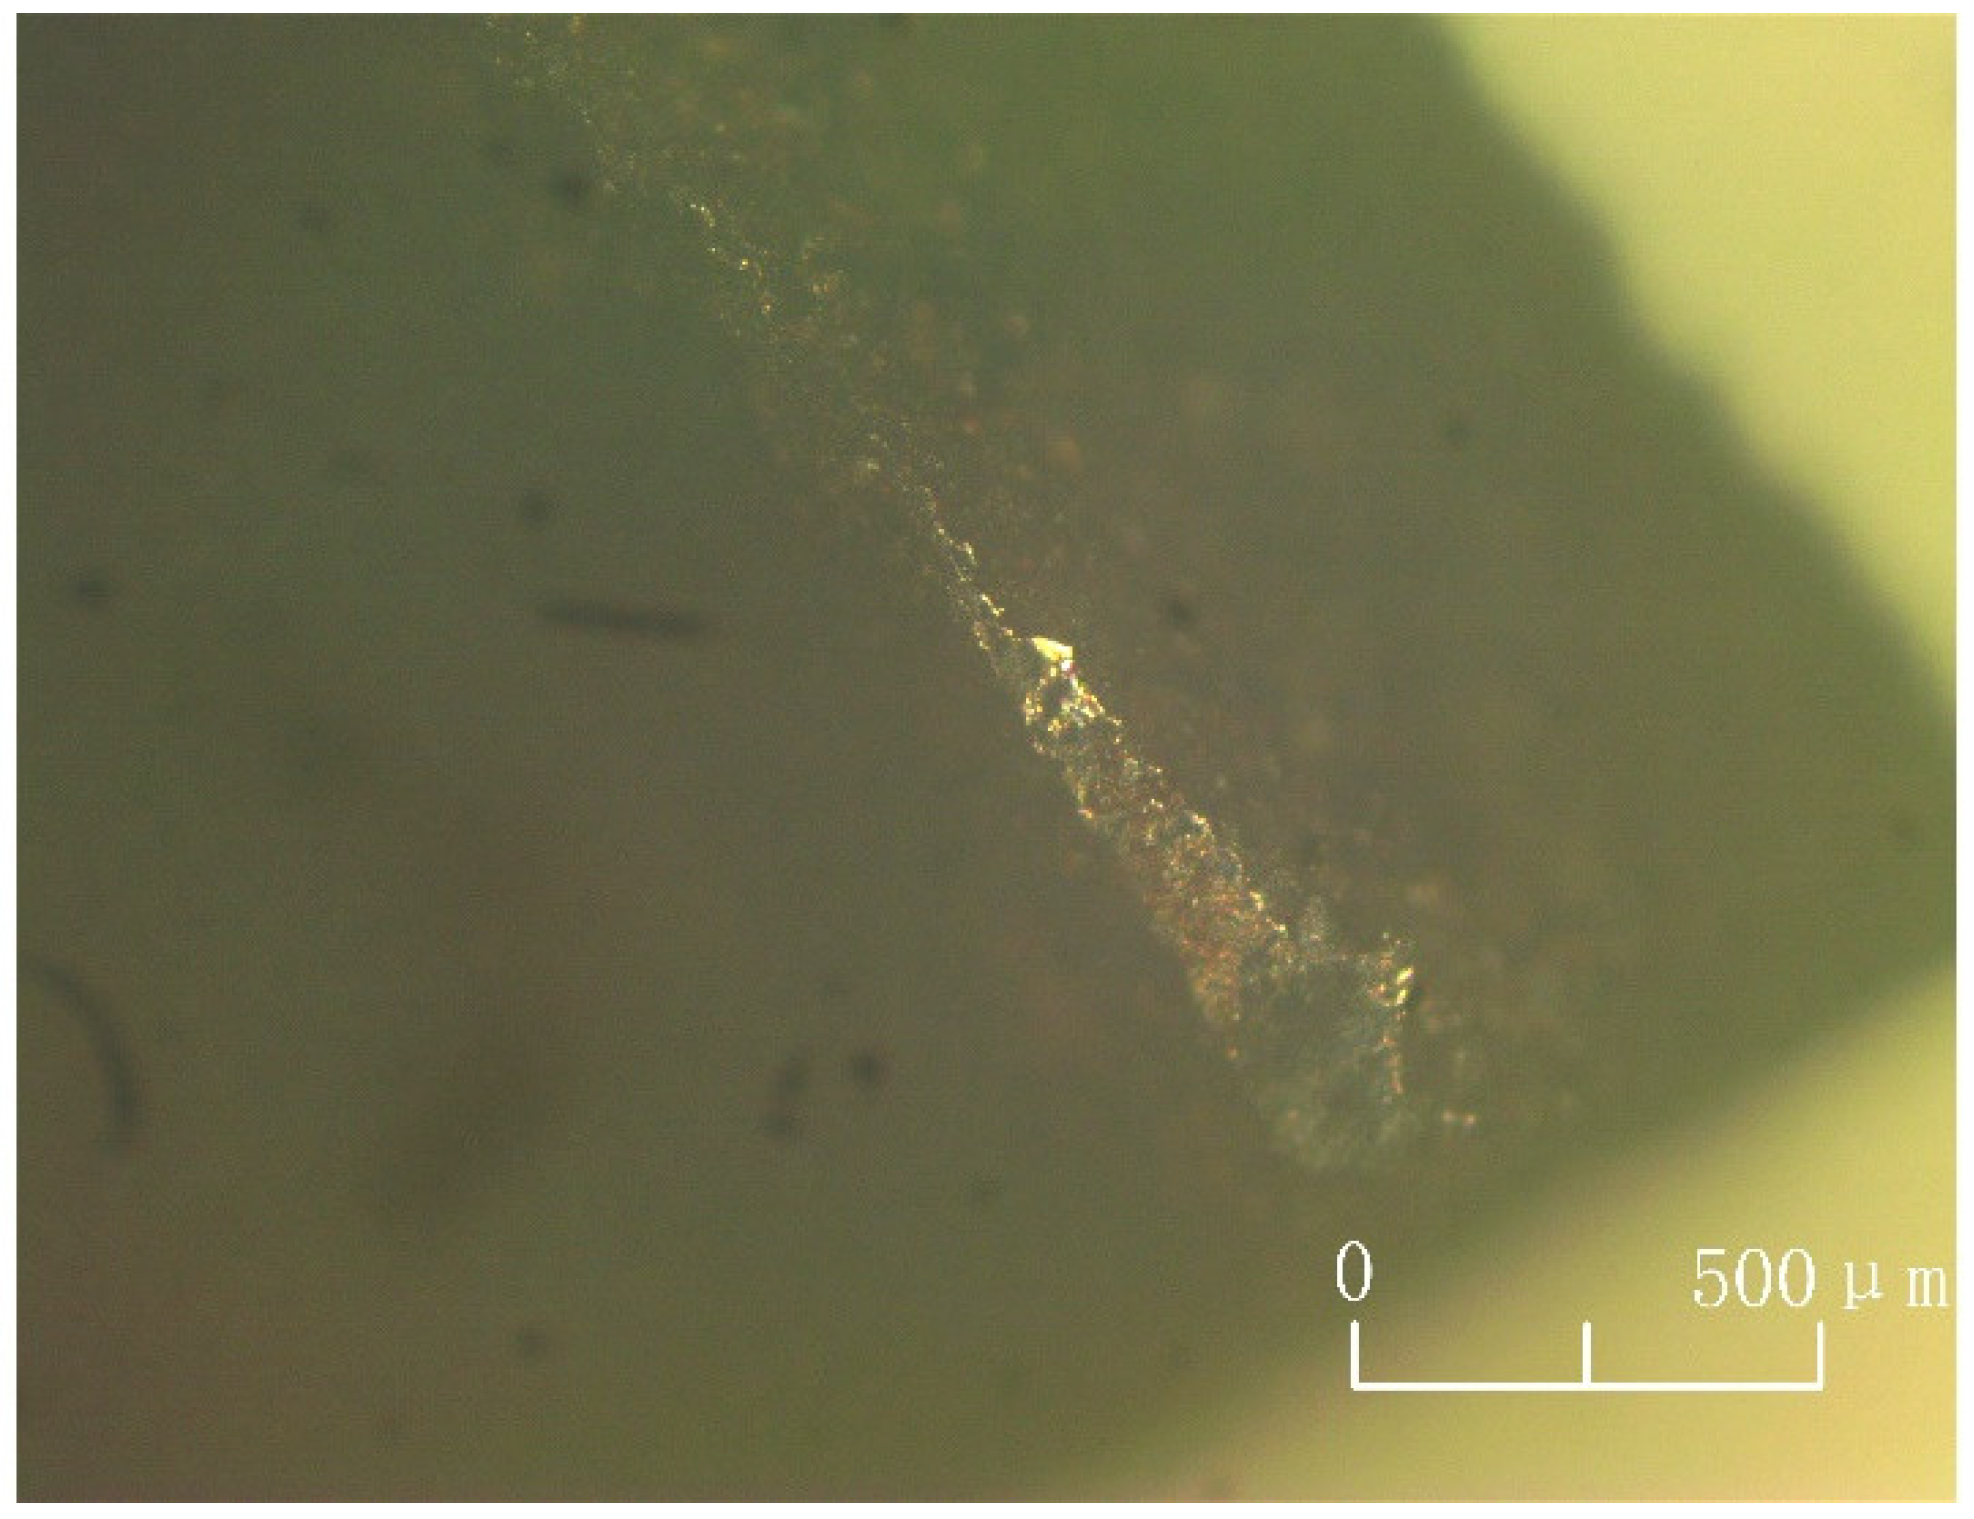
Observation of the leaf spring wear area through an optical microscope yielded Figure 13.
According to Figure 13, the wear part is greatly reduced compared to dry friction adhesive wear and abrasive wear in the case of lubricating oil. However, abrasive wear still exists.
Lubrication stages can be classified into oil film, boundary, and mixed lubrication. In the wear test with light mineral oil as the lubricant, oil film lubrication, boundary lubrication, and mixed lubrication occur simultaneously on the surface of the friction partner.
When pressure exists on the surface of the friction pair and relative motion occurs, light mineral oil forms a continuous stable lubricant film on the surface of the friction pair, which we call the oil film lubrication stage. Oil film lubrication is the main lubrication stage of the friction surface. The formation of a stable lubricant film in this environment isolates the metal surfaces and reduces the contact between them, thus reducing friction and wear.
When two metal spikes are about to contact the high-load and high-pressure area, the contact surface from the liquid lubrication transition to the critical state of direct metal contact is called boundary lubrication. If the lubrication interface locally fails to form a continuous and uniform lubricant film, oil film lubrication and direct contact between the two metals coexist, and this stage is called mixed lubrication. The lubricant film formed by light mineral oils is thinner and more easily damaged due to the poor adhesion between the oil film and the metal caused by the lower viscosity of the light mineral oil. The light mineral oil in the boundary lubrication stage and mixed lubrication stage accounted for a high proportion, and the boundary lubrication stage is higher than the mixed lubrication stage, so the lubrication effect is not good. The direct contact of metal causes the surface of the friction partner to have abrasion wear.
The signal collected by the laser range sensor is processed to obtain Figure 14.
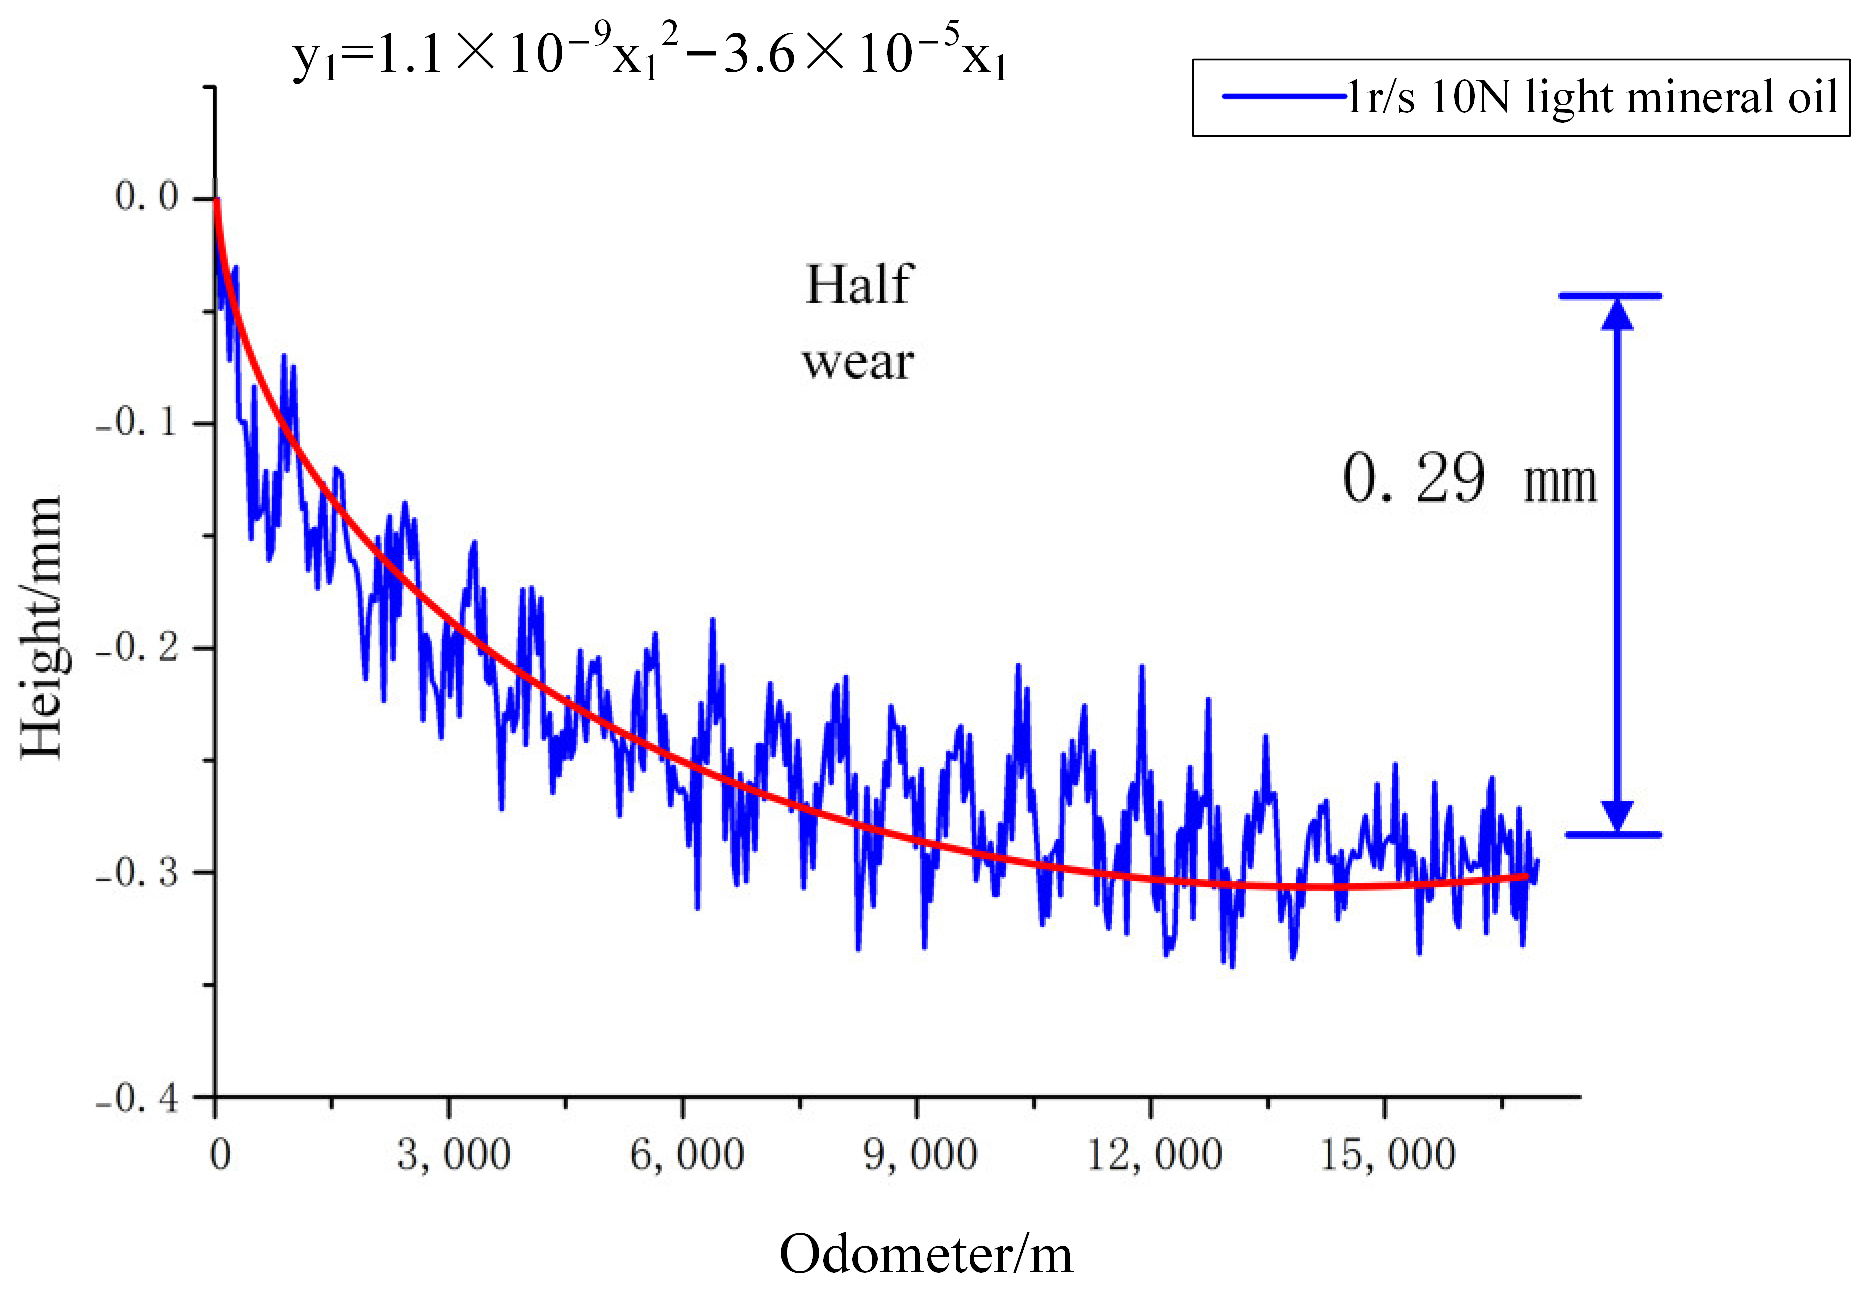
As shown in Figure 14, the leaf spring specimens are in a half-wear state for 50 h wear, and the final wear height is 0.29 mm.
The curve fitting function is as follows:
y 1 = 1.1 × 1 0 9 x 1 2 3.6 × 1 0 5 x 1
With light mineral oil lubrication, there is a significant reduction in wear, so leaf springs should wear less in oil pipelines than in gas pipelines.
(2)
Effect of SAE5W-30 on wear accuracy
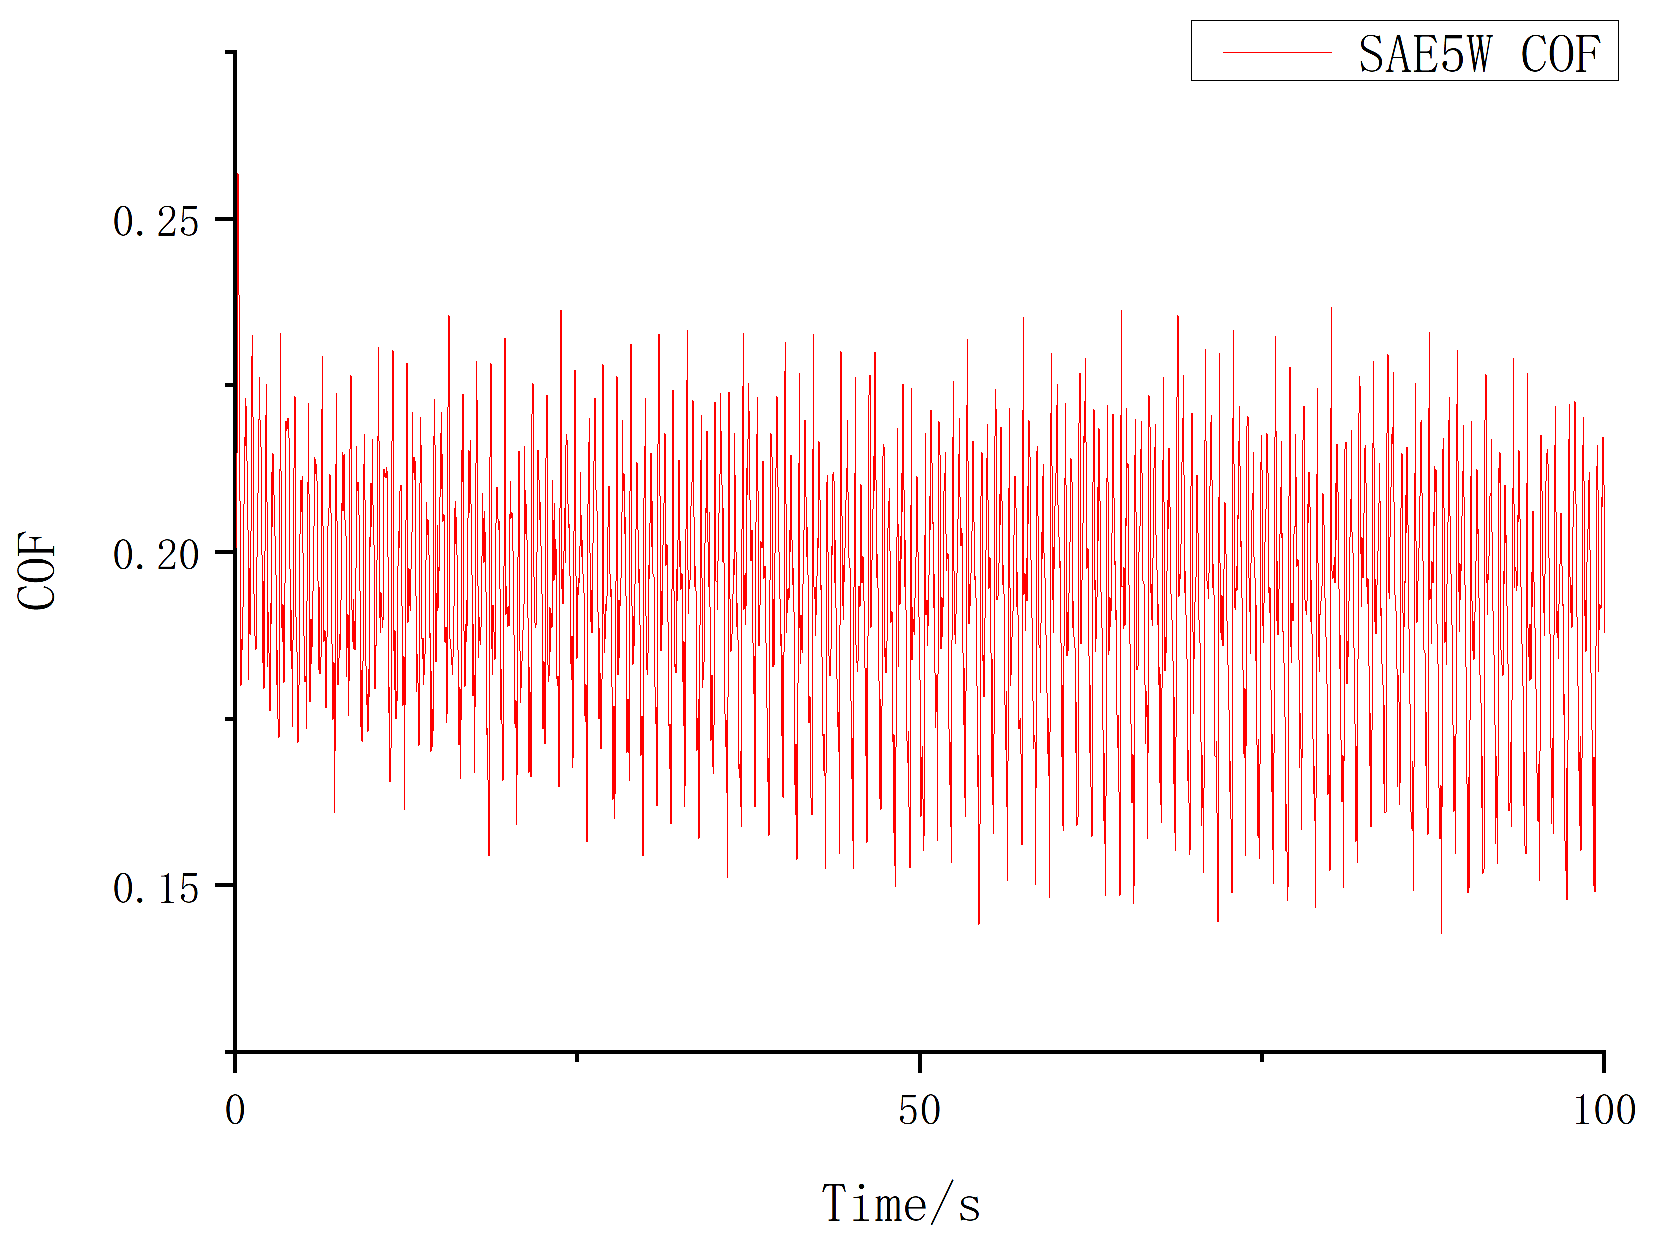
The coefficient of friction between a G61500 leaf spring specimen and an X80 pipeline steel specimen under SAE5W-30 lubricant lubrication conditions was tested using a tribometer. The testing method is similar to the wear experiment: the leaf spring specimen and the fixture are fixed on the tribometer, and the pipe specimen is fixed on the rotating chassis; 5 N of pressure is applied, and the test is carried out at a speed of 1 r/s with the results obtained after 100 turns of the test. The results are shown in Figure 15.
Based on the results, calculations can be made that the coefficient of friction between the leaf spring specimen and the pipe specimen under the condition of no lubricating medium is approximately 0.193, with a standard deviation of 0.018.
After measuring the coefficient of friction, a wear test was carried out.
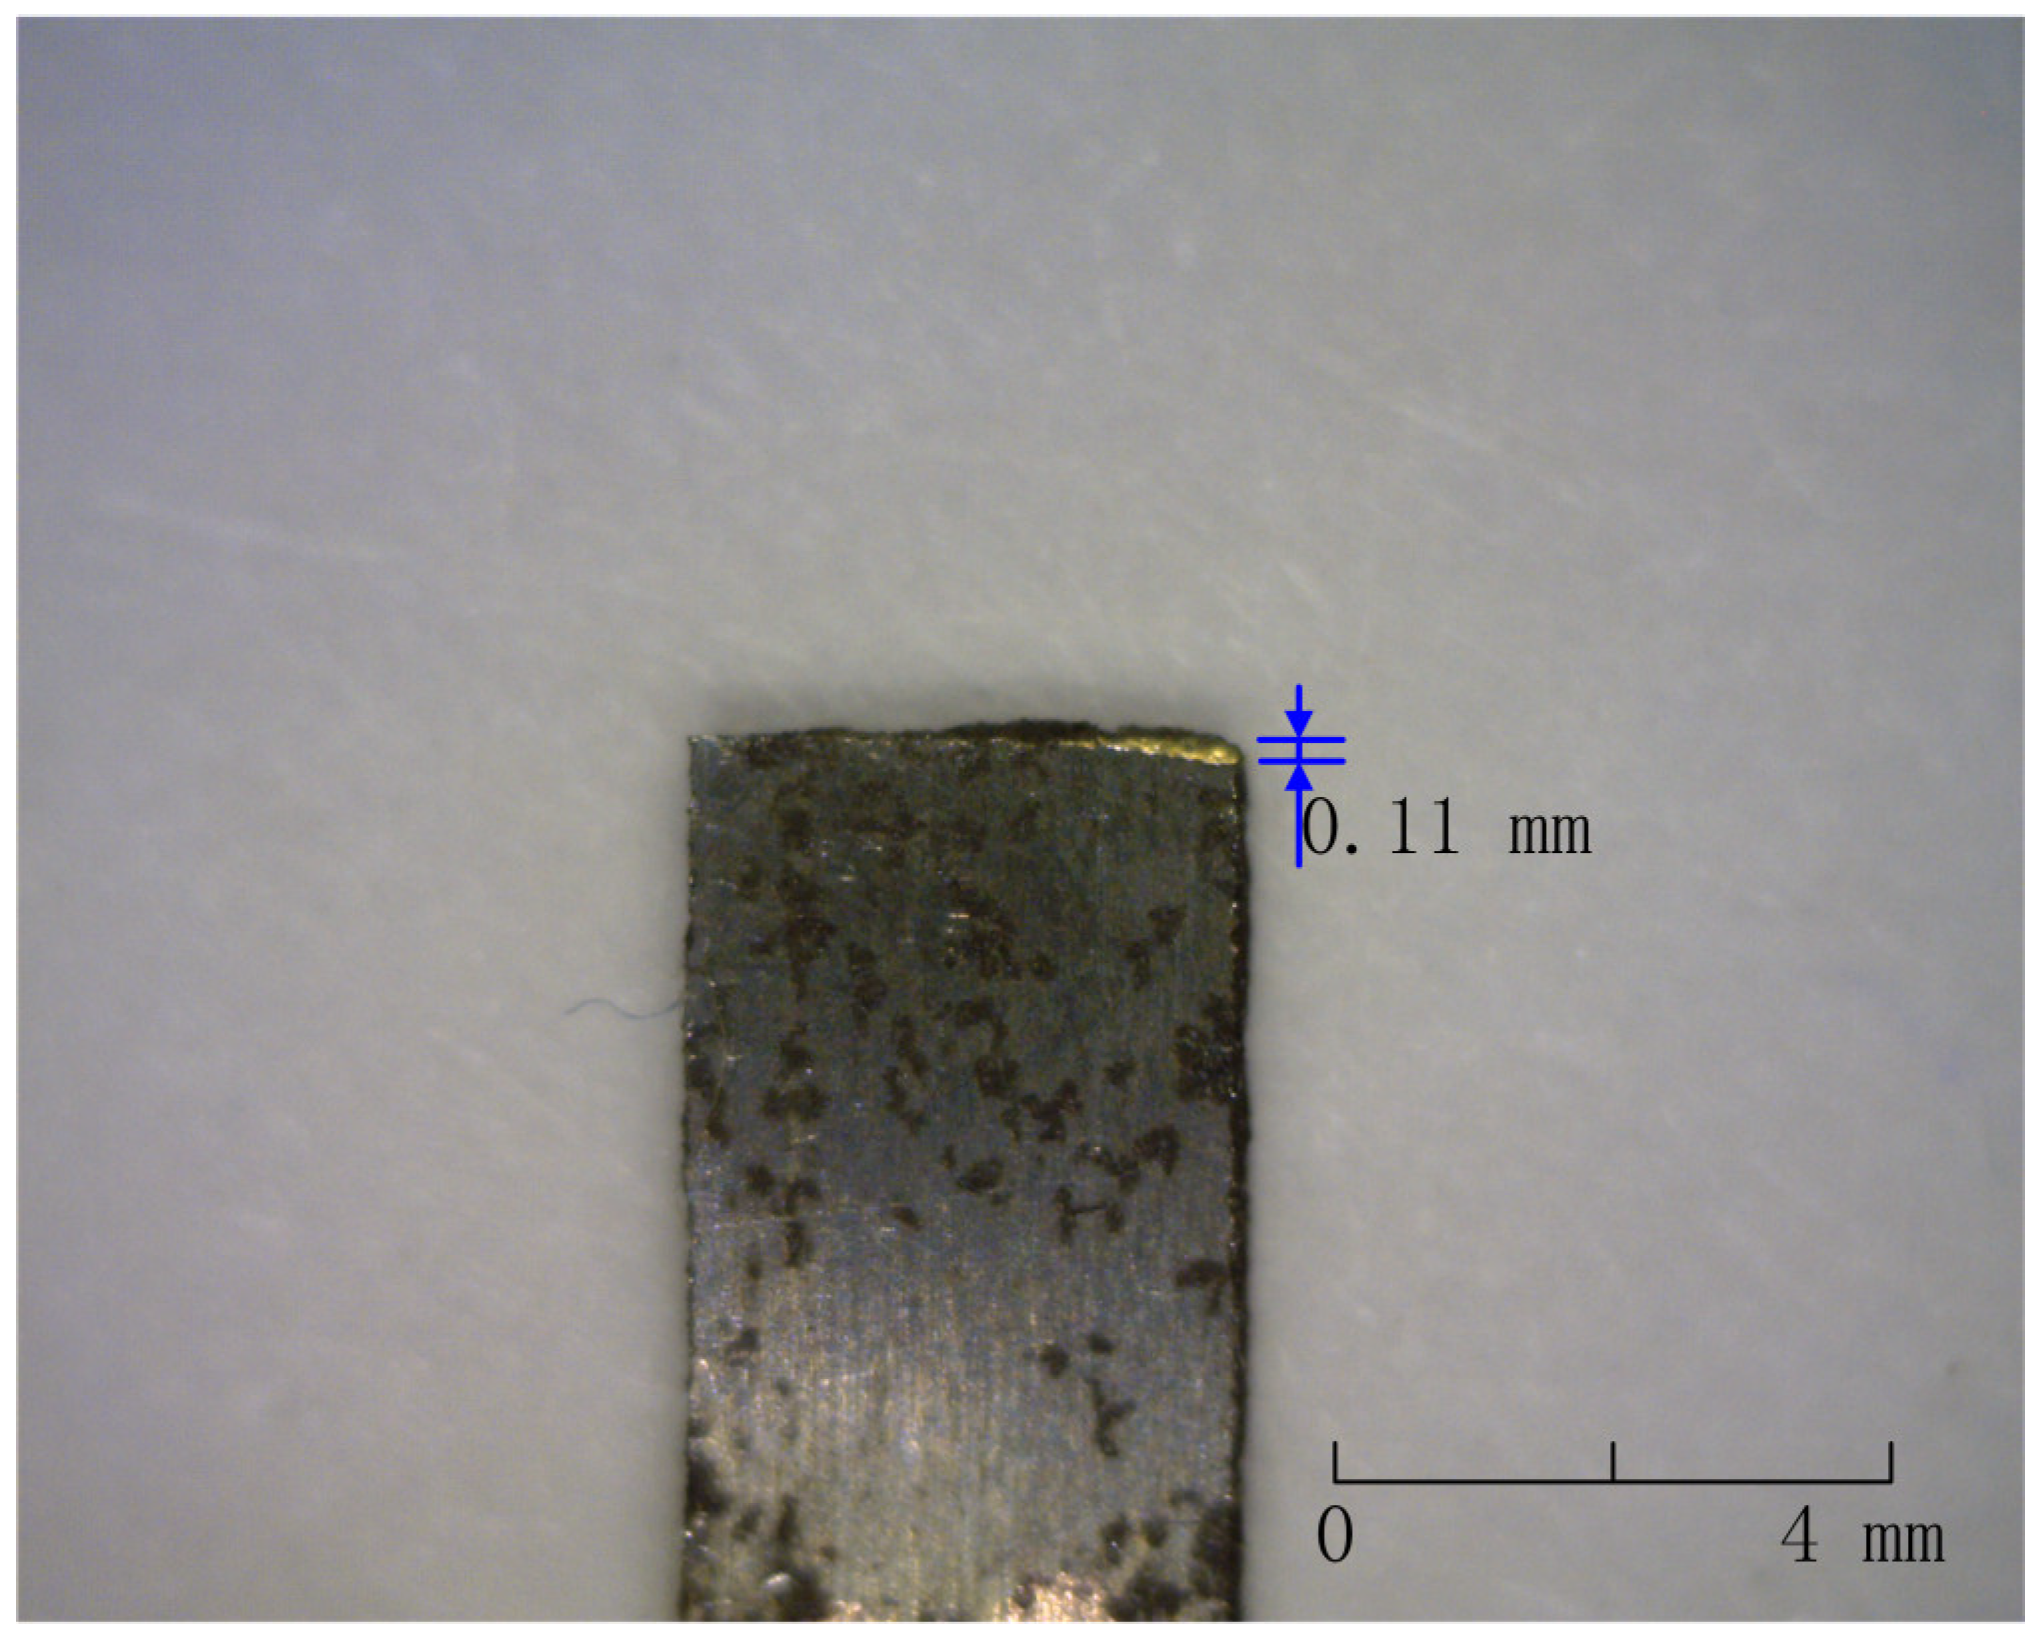
After 50 h of operation at 1 r/s under 10 N load, the leaf spring specimen was removed, and wear marks were visible, as shown in Figure 16.
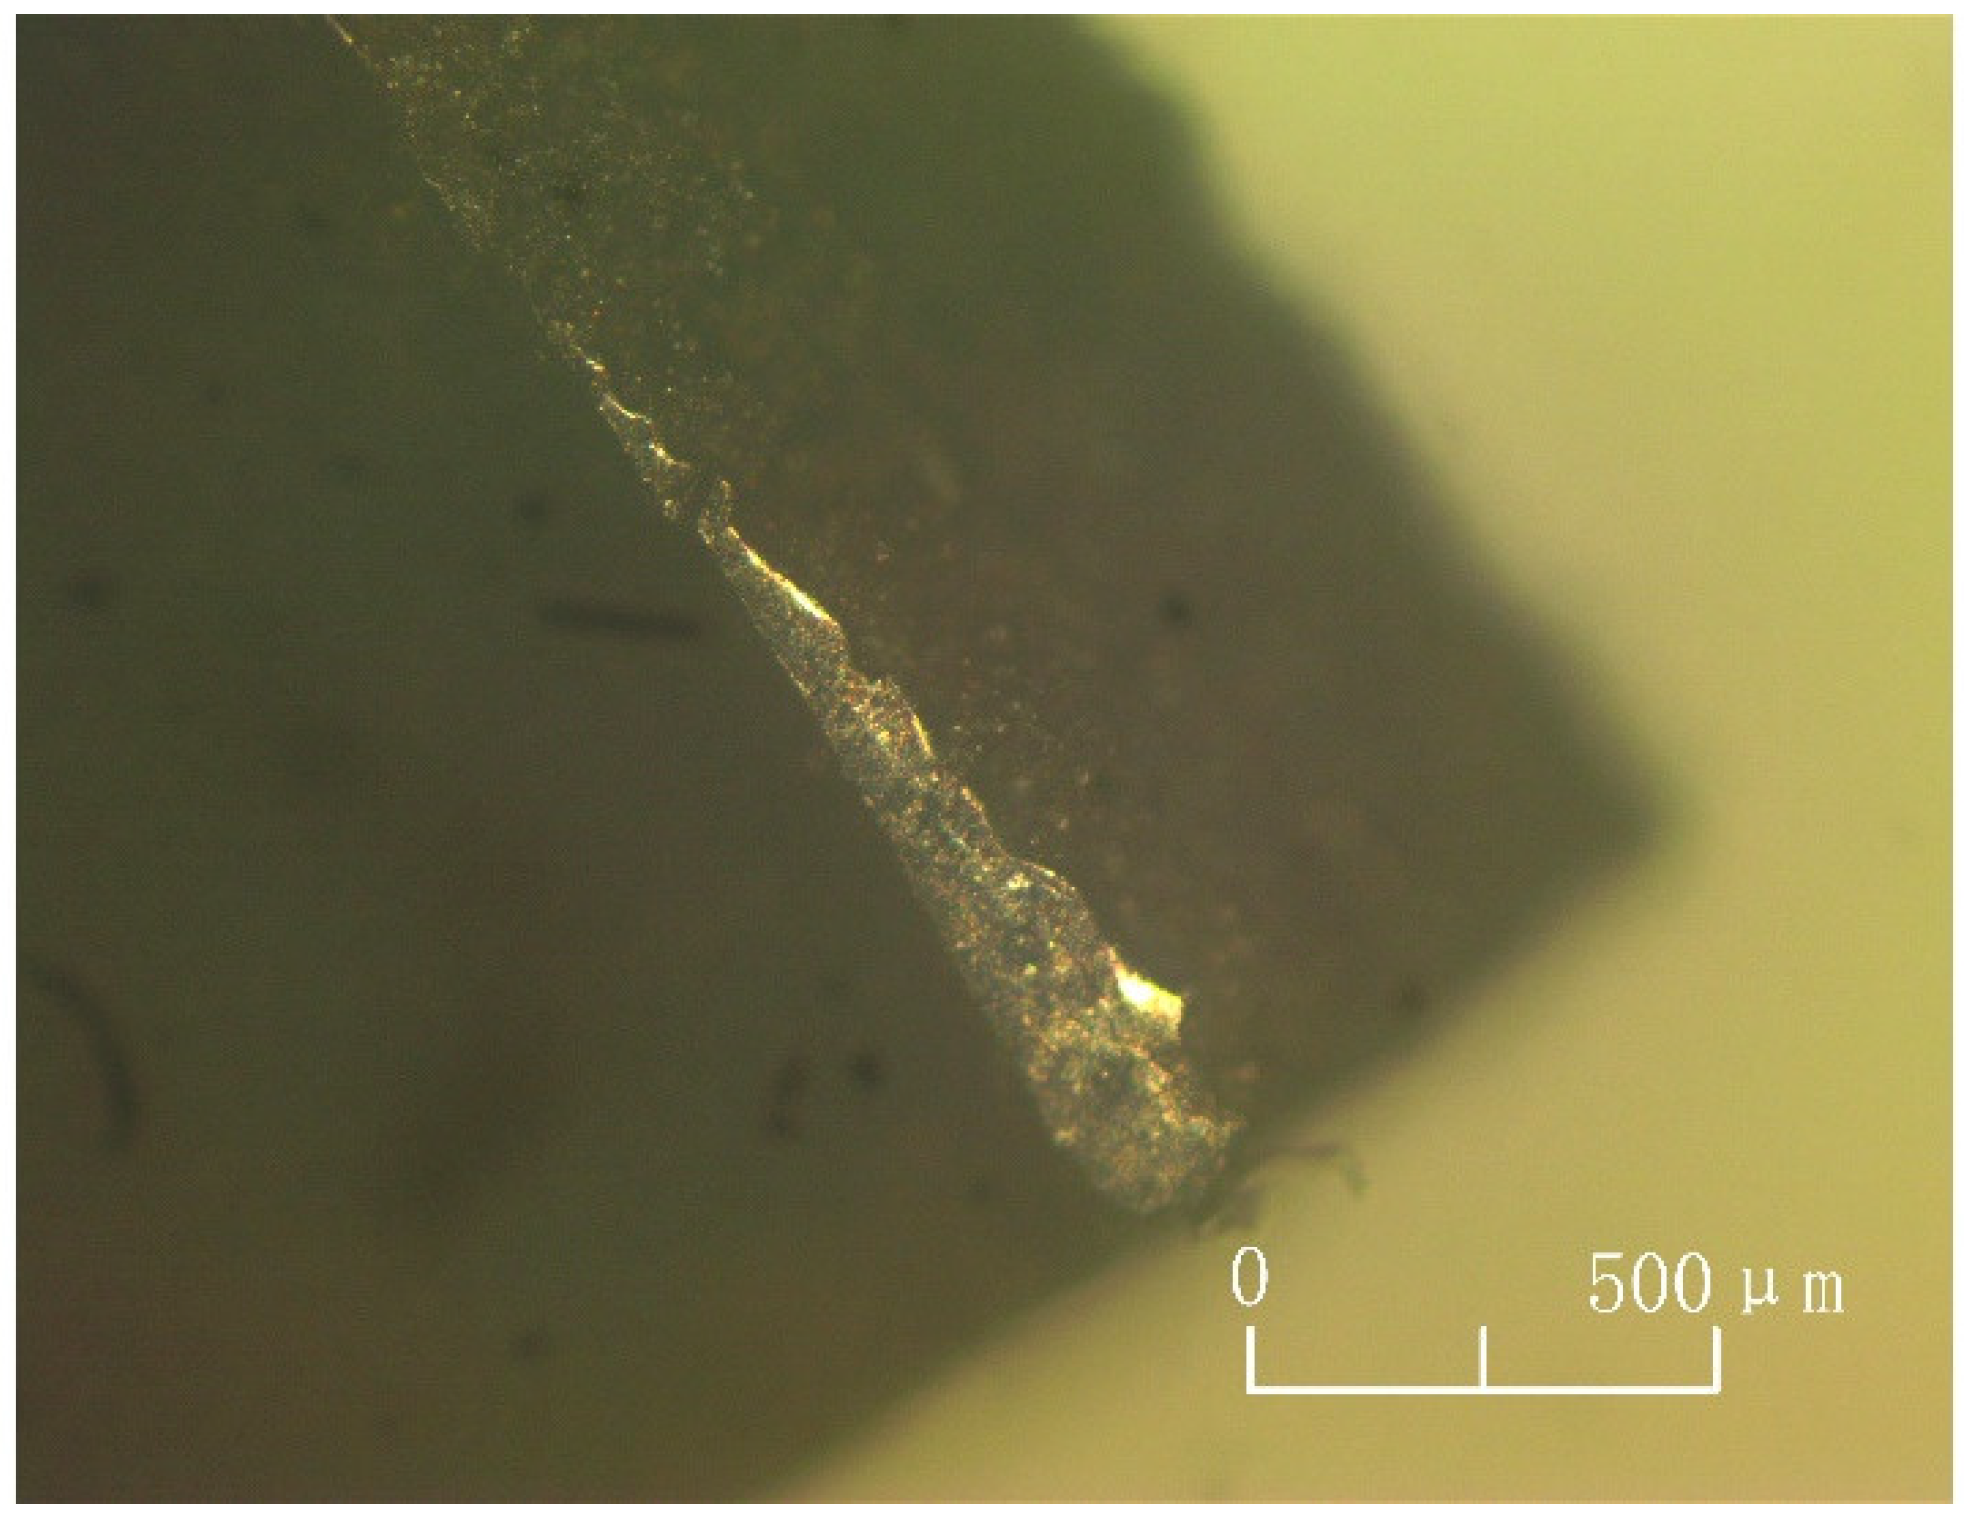
Observation of the leaf spring wear area through an optical microscope yielded Figure 17.
According to Figure 17, the wear portion is similar in shape and size to lighter mineral oils, indicating that the lubricating medium acts similarly, and both can significantly improve wear problems. Higher viscosity lubricant film has better adhesion between the two metals, forming a thicker lubricant film that is less likely to be broken [34]. Compared to light mineral oils, SAE5W-30 lubricants have fewer areas of high loads and high pressures, smaller areas of direct contact between the two metals, and a lower percentage of boundary lubrication and mixing lubrication phases for better lubrication.
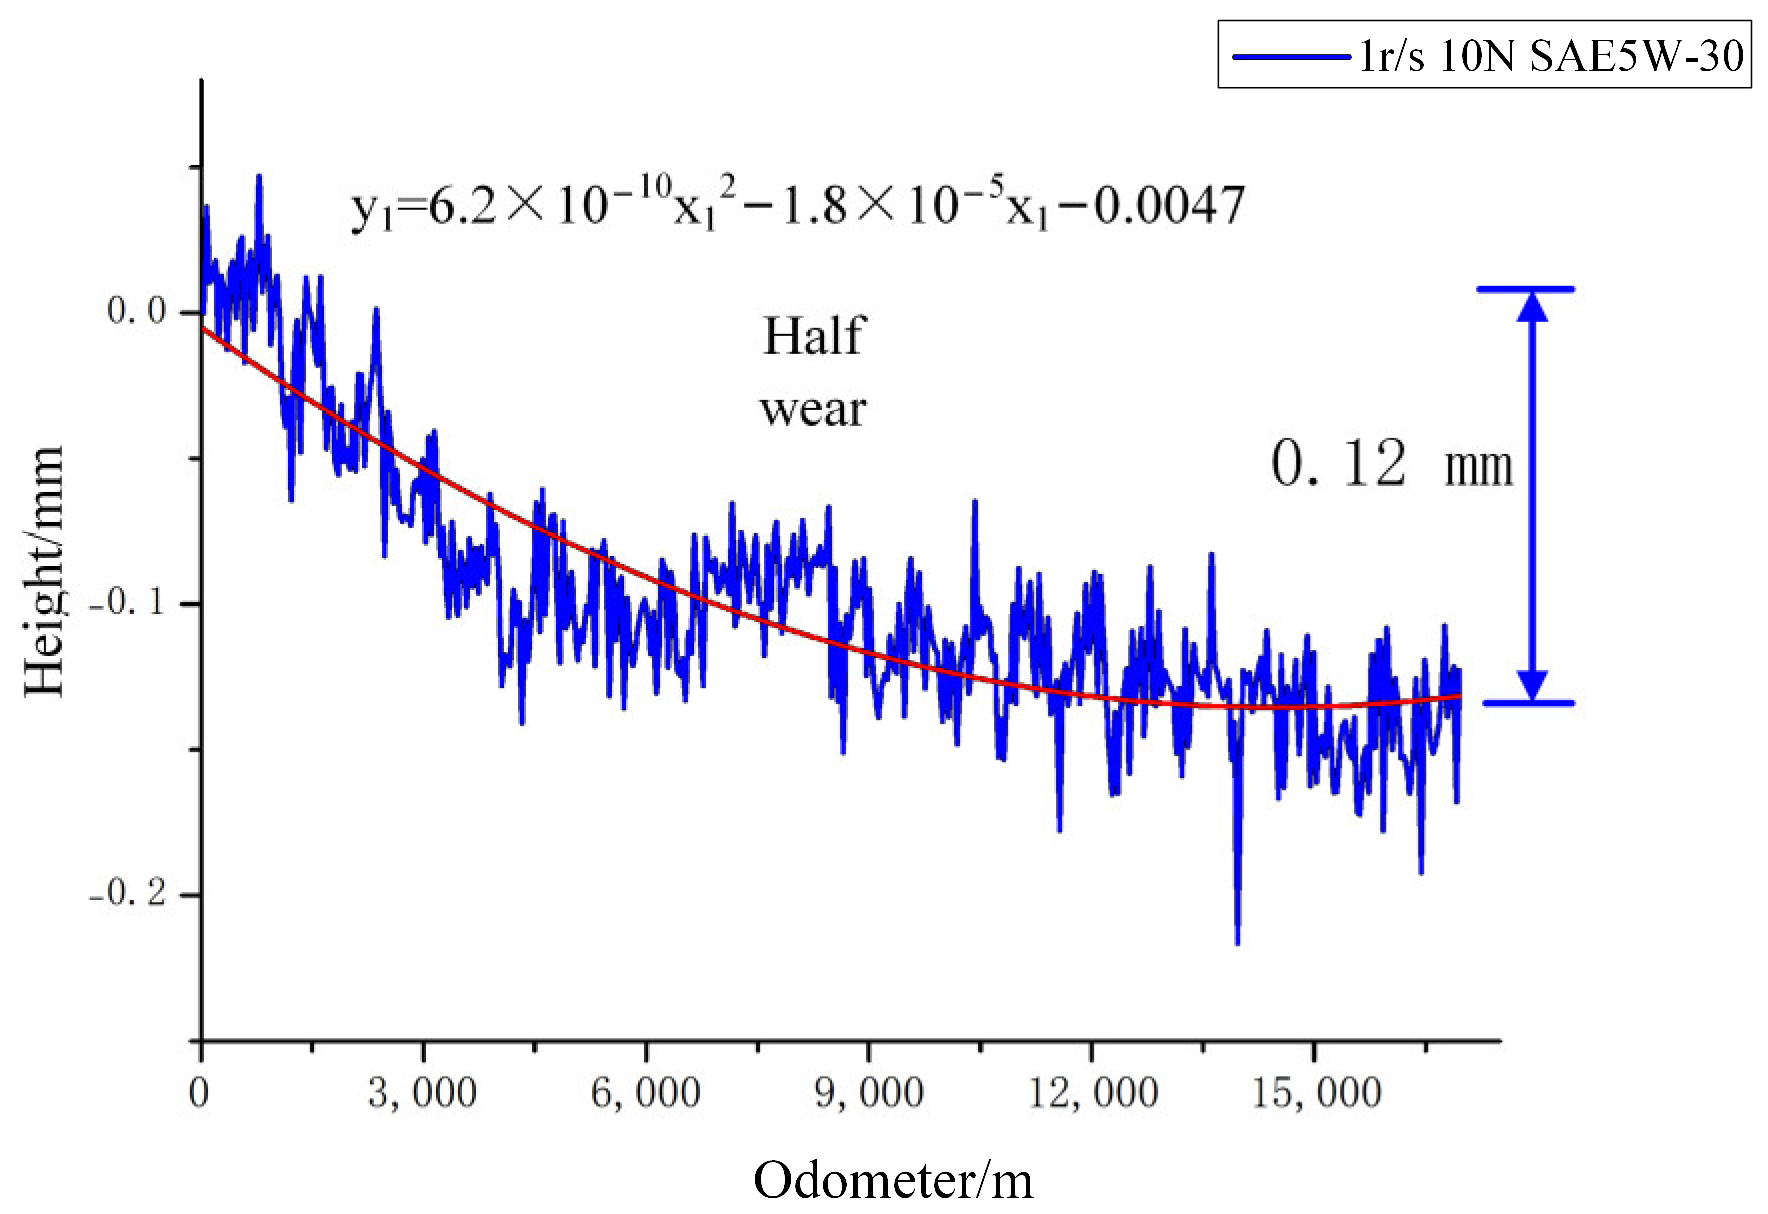
The signal collected by the laser range sensor was processed to obtain Figure 18.
As can be seen from Figure 18, the 50 h wear of leaf spring specimens are all in a half-wear state, and the final wear height is 0.12 mm, which is approximated to be half of the wear of light mineral oil, indicating that the wear reduction effect of SAE5W-30 is better due to its added wear reduction components.
According to the curve fitting function,
y 1 = 6.2 × 1 0 10 x 1 2 1.8 × 1 0 5 x 1
(3)
Impact of 600 XP 680 on wear accuracy
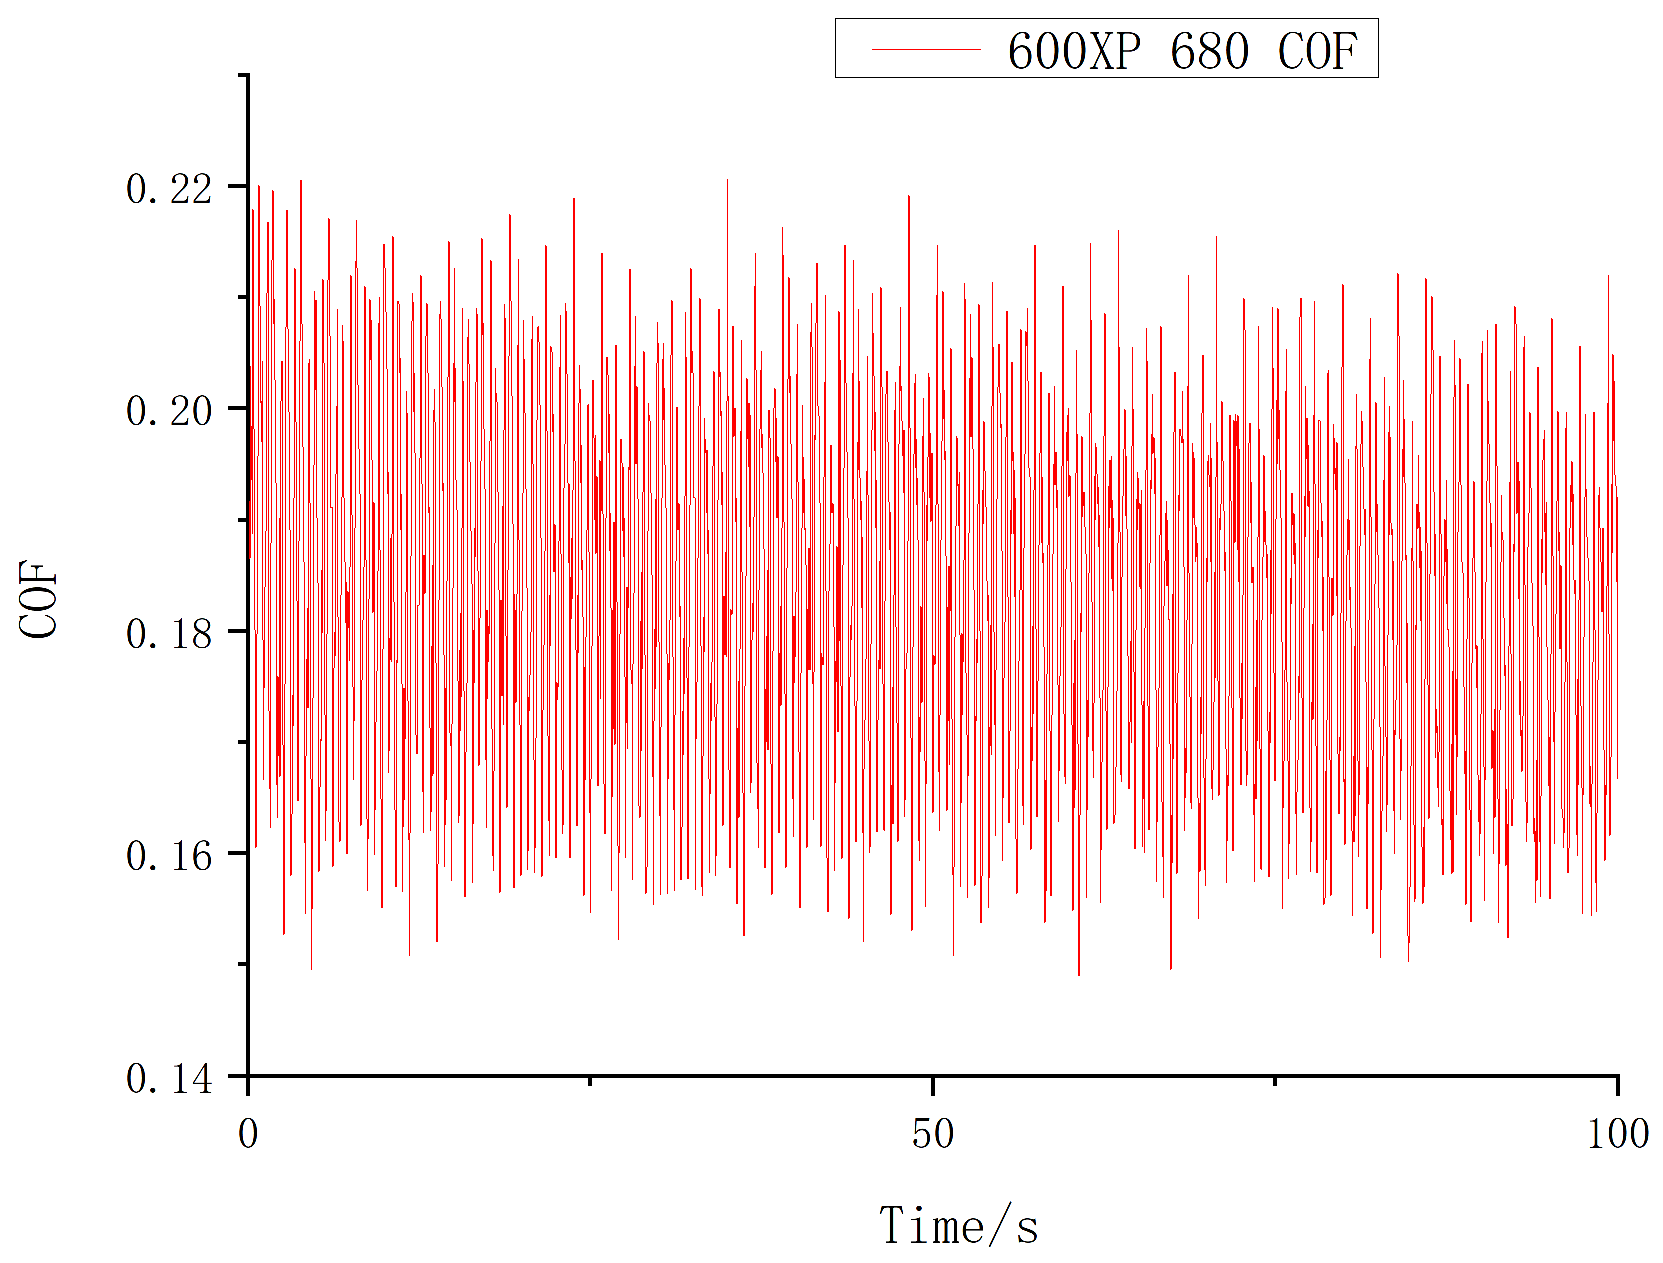
The coefficient of friction between a G61500 leaf spring specimen and an X80 pipeline steel specimen under 600 XP 680 lubricant lubrication conditions was tested using a tribometer. The test was carried out in a similar manner to the wear test, where the leaf spring specimen and fixture were fixed on the tribometer, and the pipe specimen was fixed on a rotating chassis, with an applied pressure of 5 N at a speed of 1 r/s, and the results were obtained after 100 revolutions of the test. The results are shown in Figure 19.
Based on the results, calculations can be made that the coefficient of friction between the leaf spring specimen and the pipe specimen under the condition of no lubricating medium is approximately 0.183, with a standard deviation of 0.016.
After measuring the coefficient of friction, a wear test was carried out.
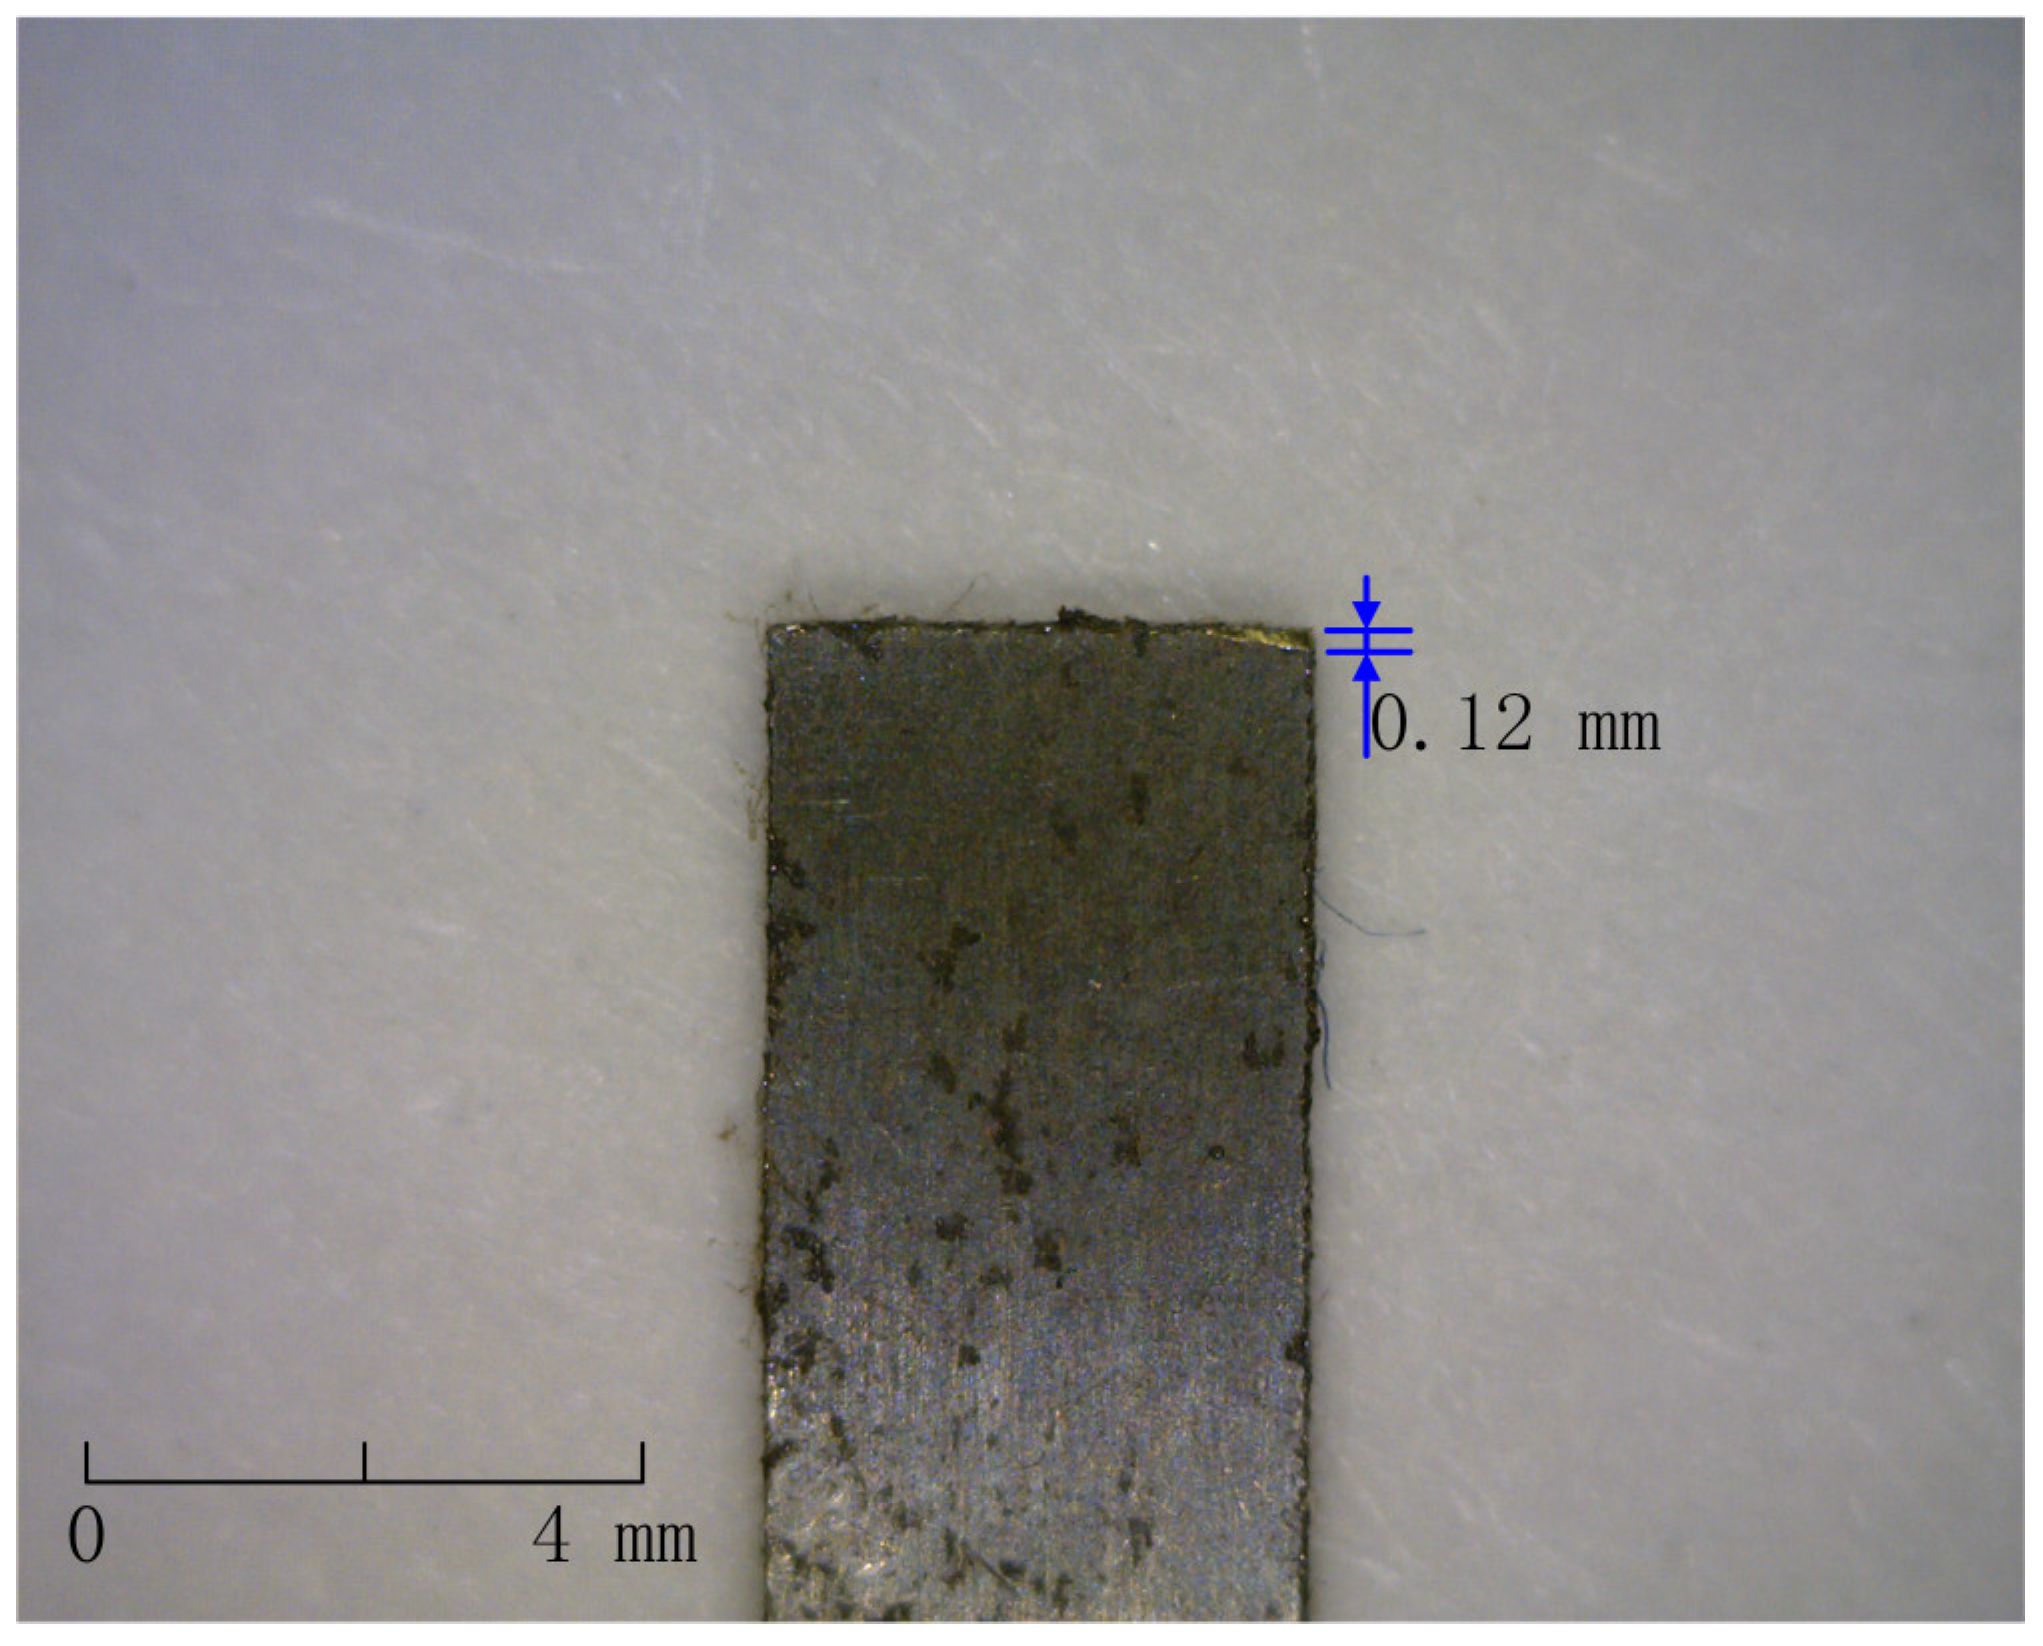
After 50 h of operation at 1 r/s under 10 N load, the leaf spring specimen was removed, and wear marks were visible, as shown in Figure 20.
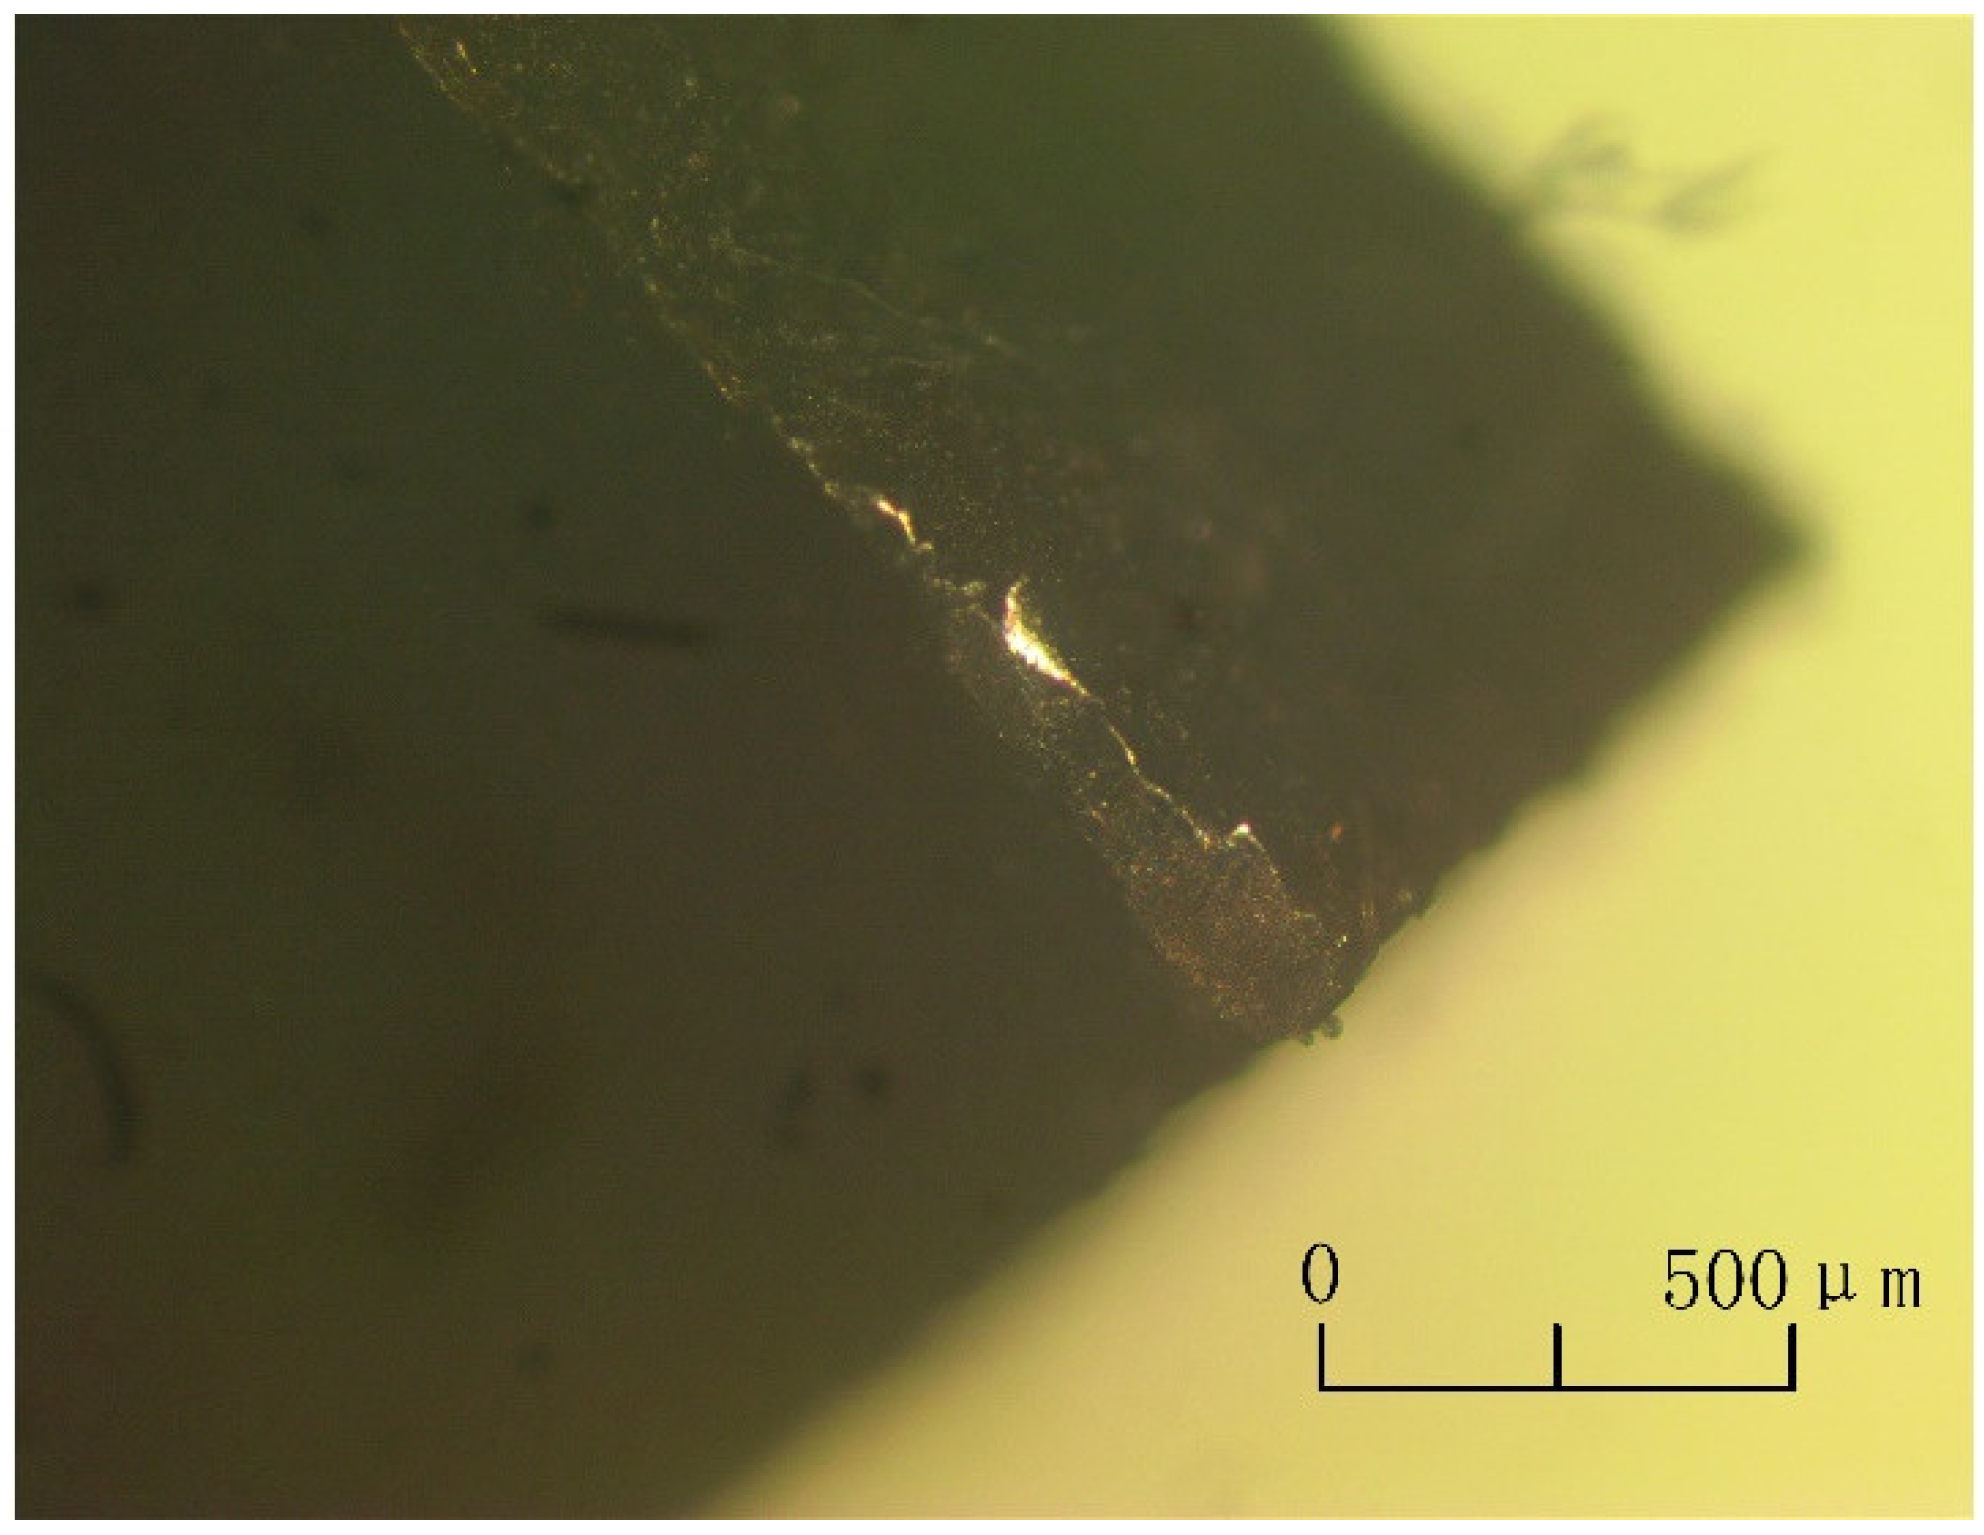
Observation of the leaf spring wear area through an optical microscope yielded Figure 21.
According to Figure 21, it can be seen that the wear part is similar to SAE5W-30, the friction coefficient of the two lubricating media is similar, and the friction coefficient has a correlation with the wear condition. Compared to the other two lubricating media, 600XP 680 lubricant has the highest viscosity, and lubricant film formation is difficult, so the mixed lubrication stage, where oil film lubrication and direct contact between the two metals exists at the same time, is higher than the boundary lubrication stage. Since the lubrication effect of the mixed lubrication stage is higher than that of the boundary lubrication stage, the lubrication effect of 600XP 680 lubricant is higher than that of light mineral oil.
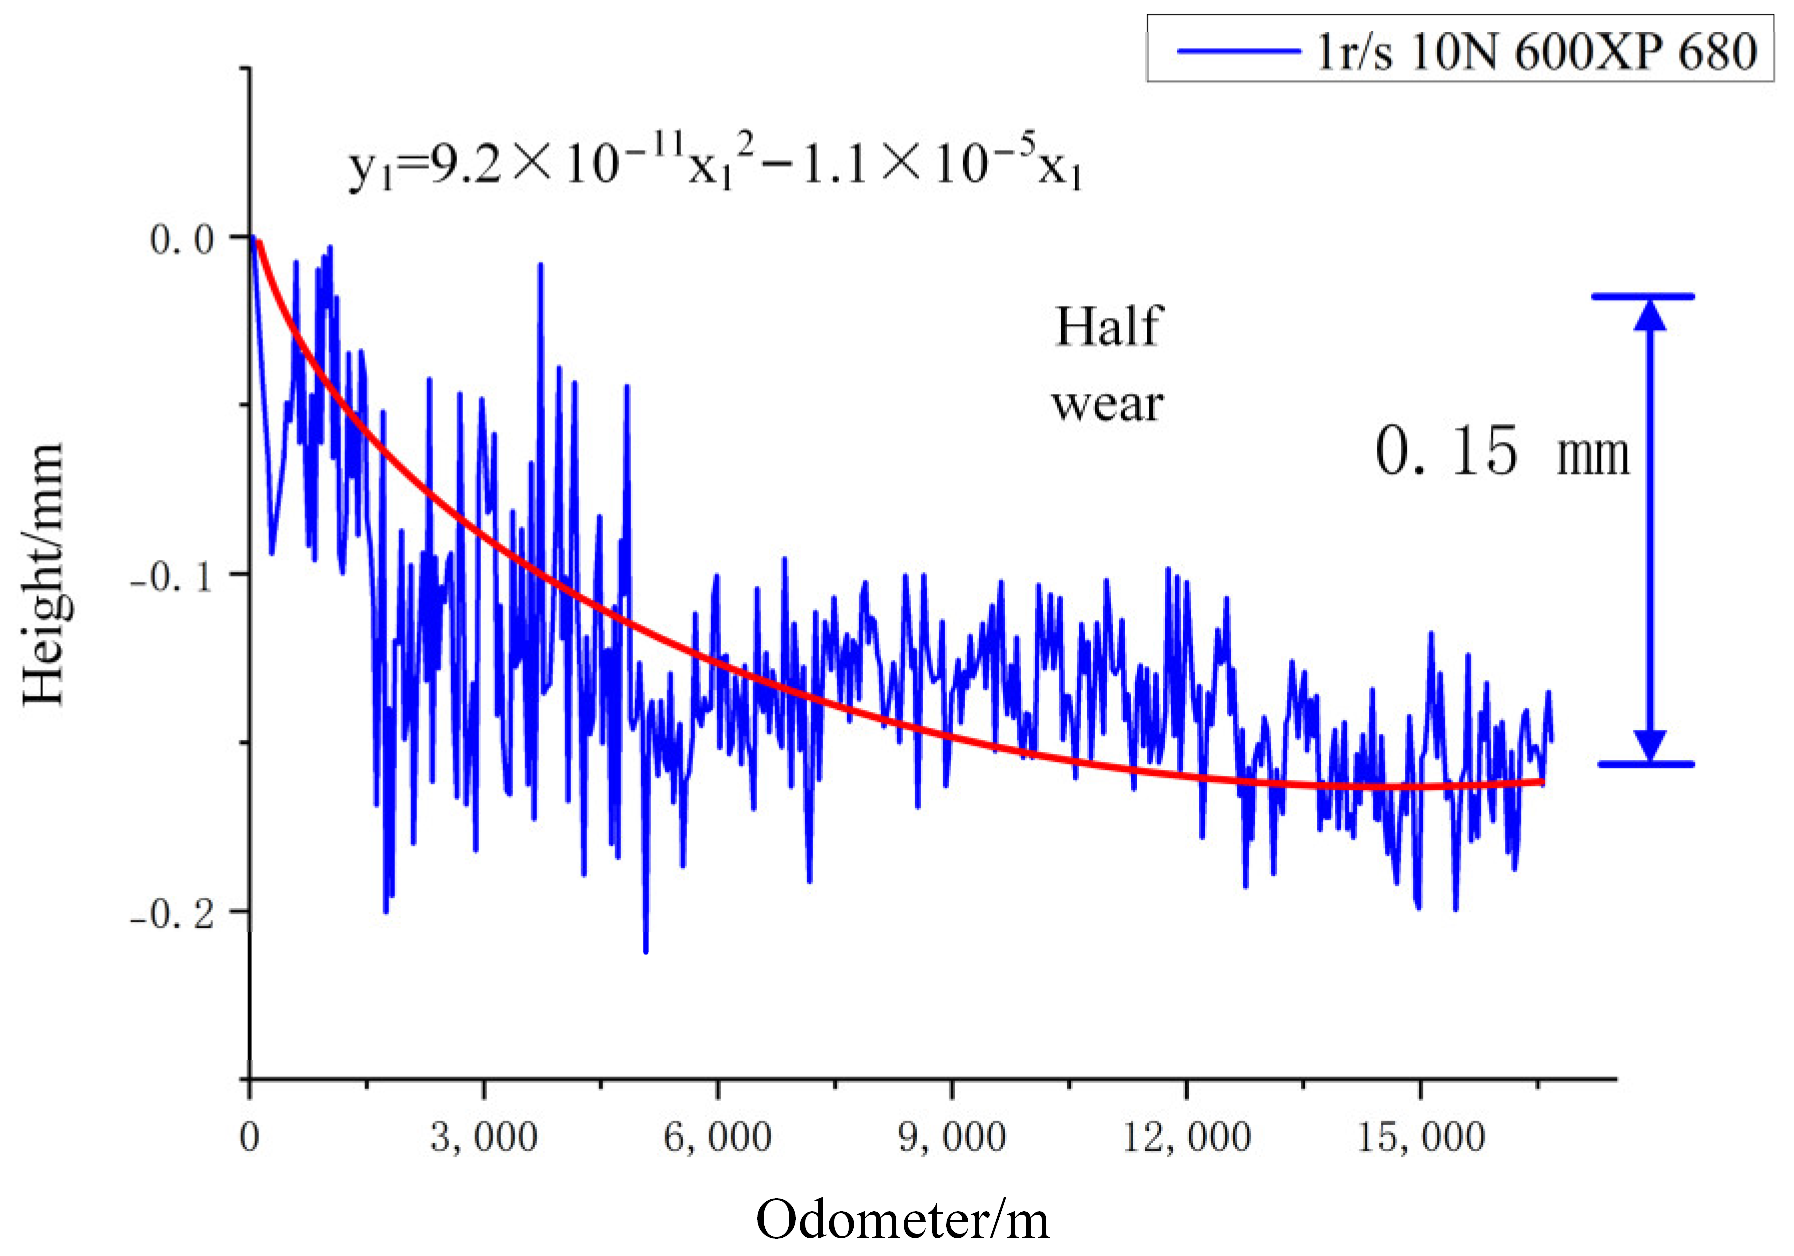
The laser range sensor acquisition signal is processed to obtain Figure 22.
As shown in Figure 22, the leaf spring specimens are in a half-wear state for 50 h wear, and the final wear height is 0.15 mm.
The curve fitting function is as follows:
y 1 = 9.2 × 1 0 11 x 1 2 1.1 × 1 0 5 x 1
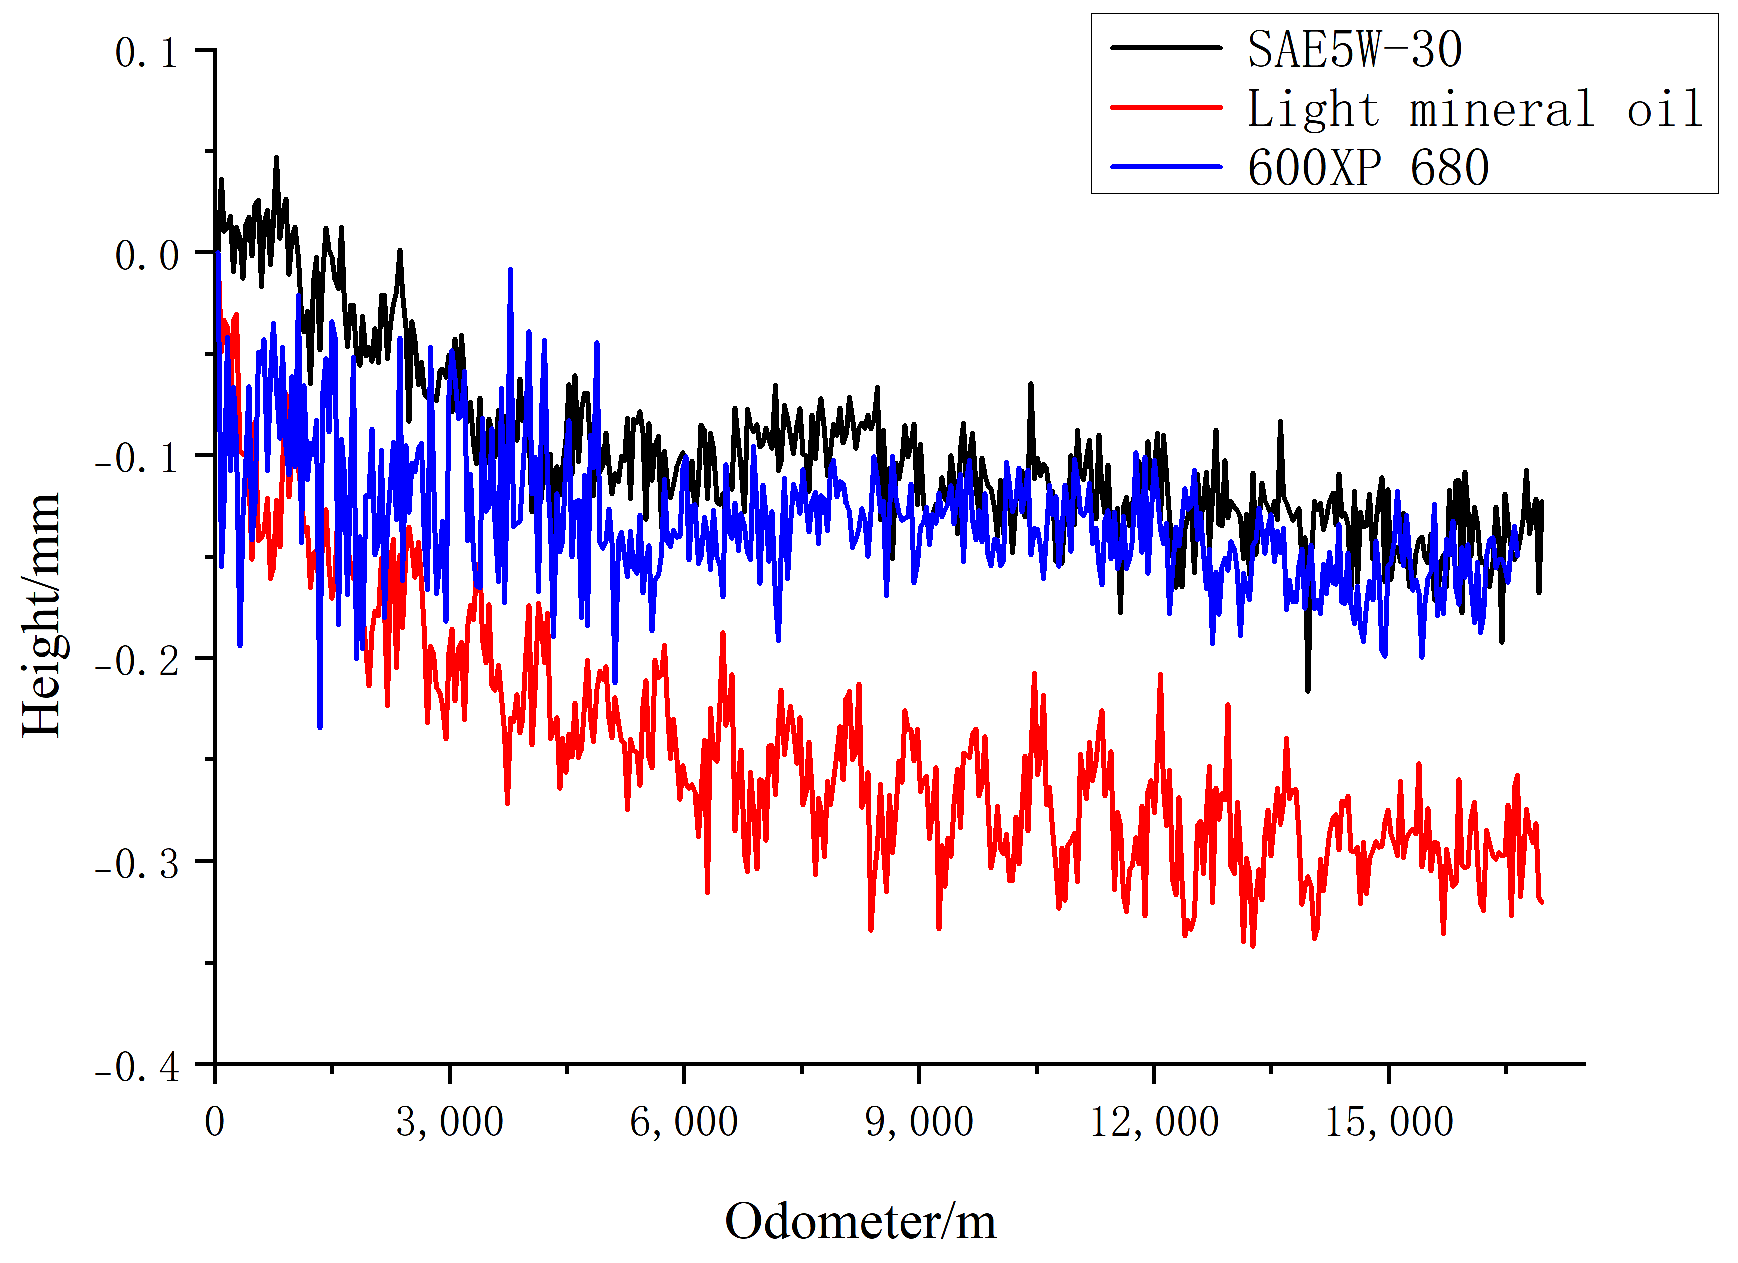
The comparison curves of the three lubricating media are shown in Figure 23.
The comparison shows that SAE 5W-30 lubricant and 600XP 680 have similar friction coefficients, so the wear is generally similar; both are less than light mineral oils, and the wear is proportional to the coefficient of friction. As shown in Figure 23, SAE 5W-30 lubricant (kinematic viscosity of 62.64 mm2/s) provides better lubrication than light mineral oil (kinematic viscosity of 30.4 mm2/s). The lubrication principle of lubricating oils forms a lubricating film between moving parts to minimize direct metal-to-metal contact. Compared with light mineral oil, SAE5W-30 lubricant has a higher viscosity, forms a thicker lubricating oil film, and has better adhesion between the oil film and the metal, making the oil film less susceptible to damage. Light mineral oil, due to its lower viscosity, leads to poor adhesion between the oil film and the metal, and the positive pressure between the two friction parts of the experiment will lead to the increased loss of low-viscosity lubricant, so the lubricant film formed by light mineral oil is thinner and more easily destroyed. In conclusion, the lower viscosity lubricant cannot effectively reduce the direct contact between metal surfaces, leading to increased friction and wear.
As shown in Figure 23, although Mobil 600XP 680 lubricants (with a kinematic viscosity of 680 mm2/s) have a higher viscosity than SAE 5W-30 lubricants (with a kinematic viscosity of 62.64 mm2/s), Mobil 600XP 680 lubricants are less lubricious than SAE 5W-30 lubricants. Higher viscosity oils have poor fluidity, resulting in a more viscous lubricant film between the friction pairs rather than a uniform and effective lubricant film. A lubricant with the right viscosity will carry away the heat generated by friction and reduce the likelihood of adhesive wear between the metals, but if the viscosity is too high, the heat dissipation effect will be poor, which will exacerbate the problem of poor lubrication. High viscosity lubricant for the friction between the metal particles of the package better reduces abrasive wear and has a better effect.
In summary, too high viscosity lubricant and metal adhesion are good and not easy to destroy, but the formation of the film is not uniform, and the lubrication effect is not good. Too low viscosity lubricants formed by the film are thin and easy to destroy, resulting in direct contact with the metal lubrication effect, which is not good.
(4)
Effect of speed on wear accuracy
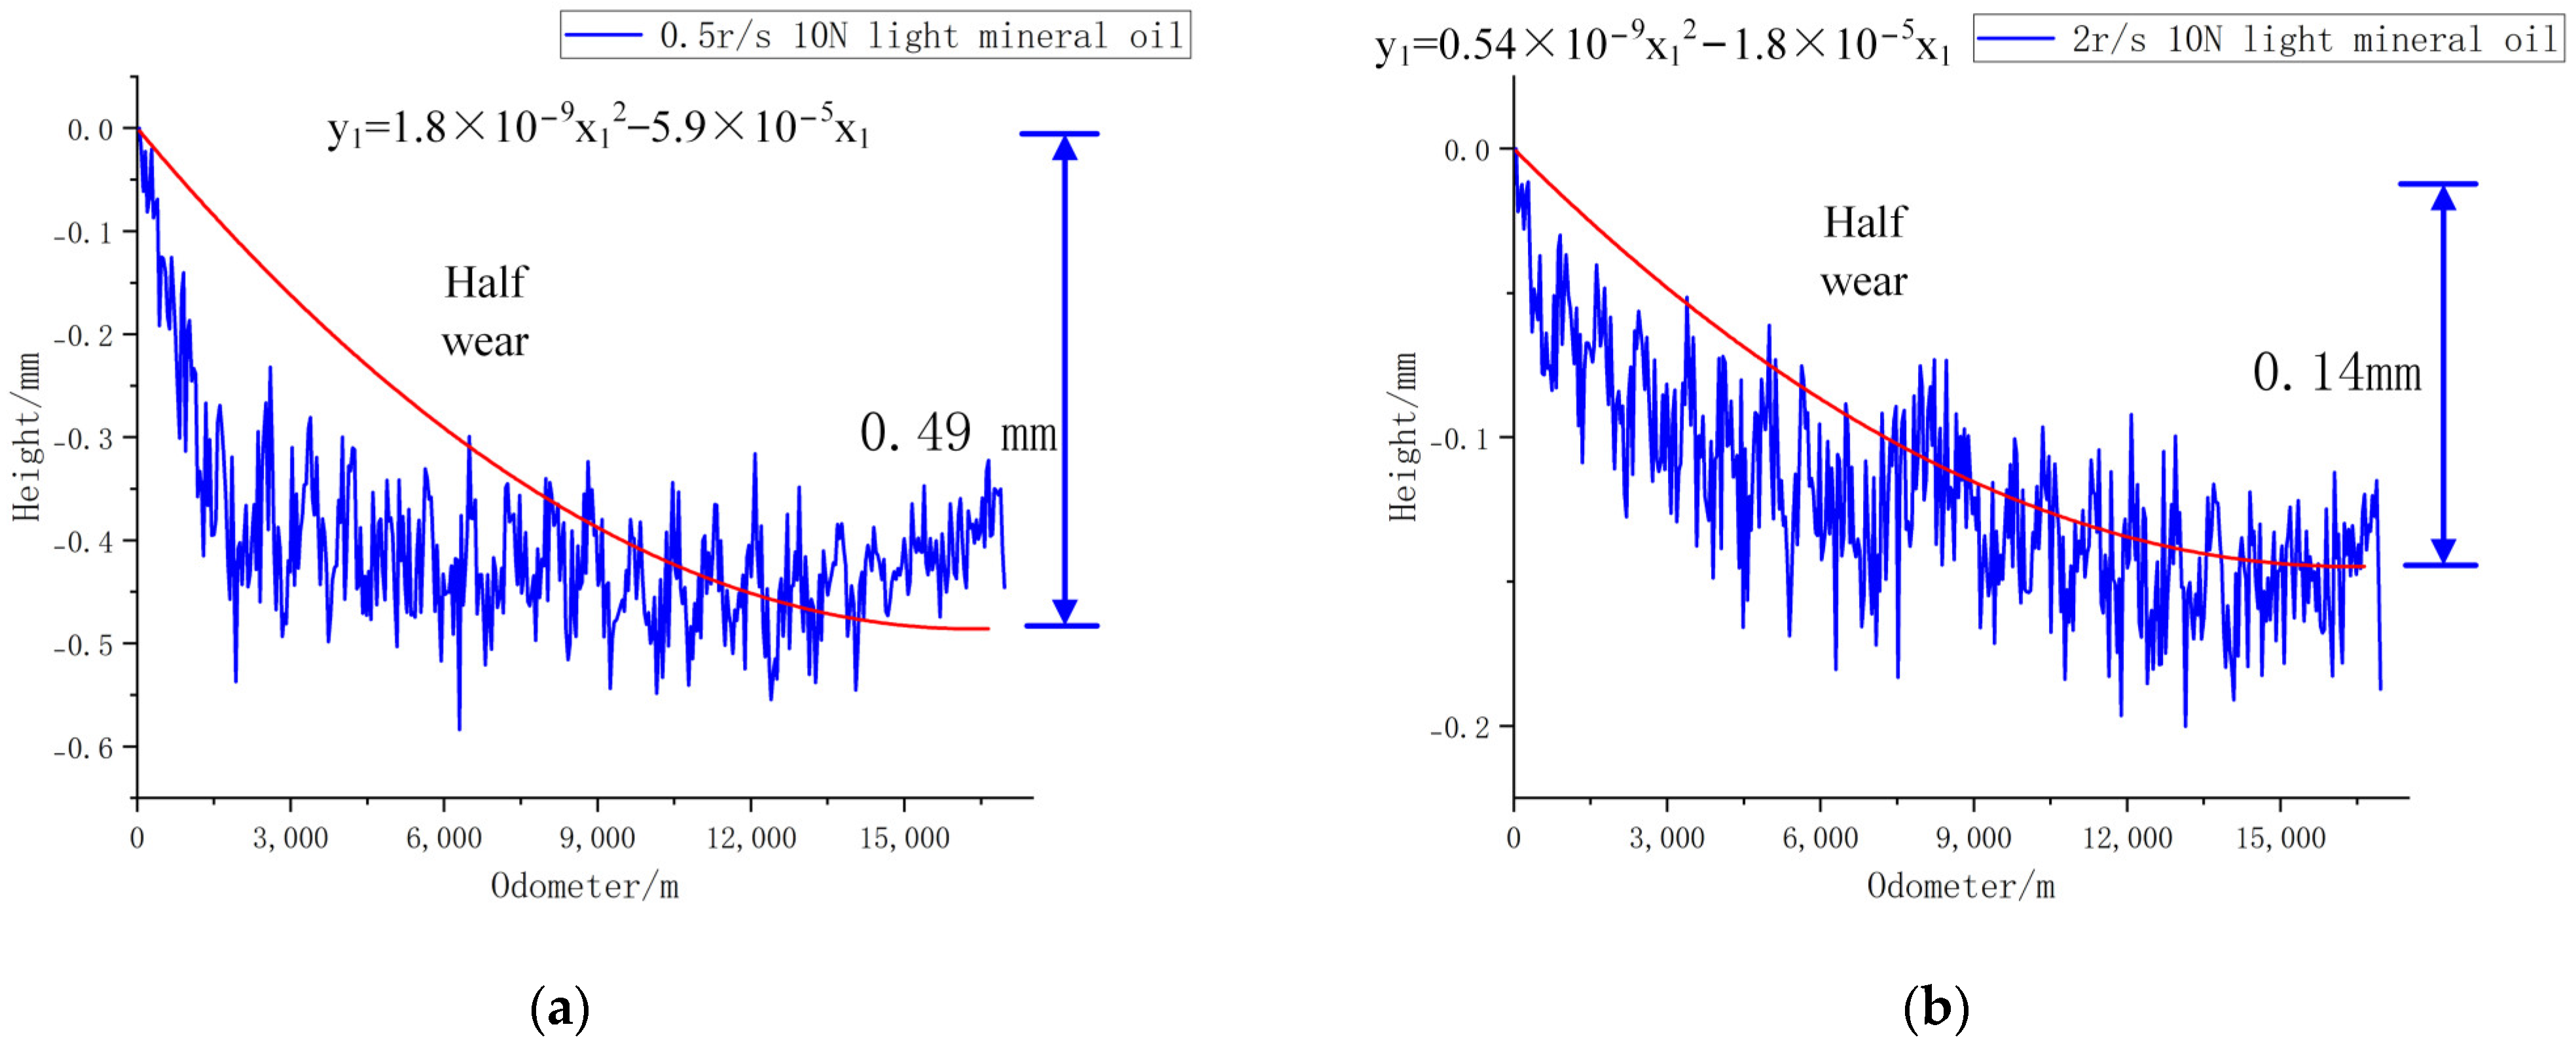
After 100 h of running at 0.5 r/s under a 10 N load with light mineral oil, the signals collected by the laser range sensor were processed to obtain Figure 24a; after 25 h of running at 2 r/s under a 10 N load with light mineral oil, the signals collected by the laser range sensor were processed to obtain Figure 24b.
At a running speed of 0.5 r/s, the leaf spring specimens were all in a half-worn state, with a final wear height of 0.49 mm. The fitting function is as follows:
y 1 = 1.8 × 1 0 9 x 1 2 5.9 × 1 0 5 x 1
At a running speed of 2 r/s, the leaf spring specimens were all in a half-worn state, with a final wear height of 0.14 mm. The fitting function is as follows:
y 1 = 0.54 × 1 0 9 x 1 2 1.8 × 1 0 5 x 1
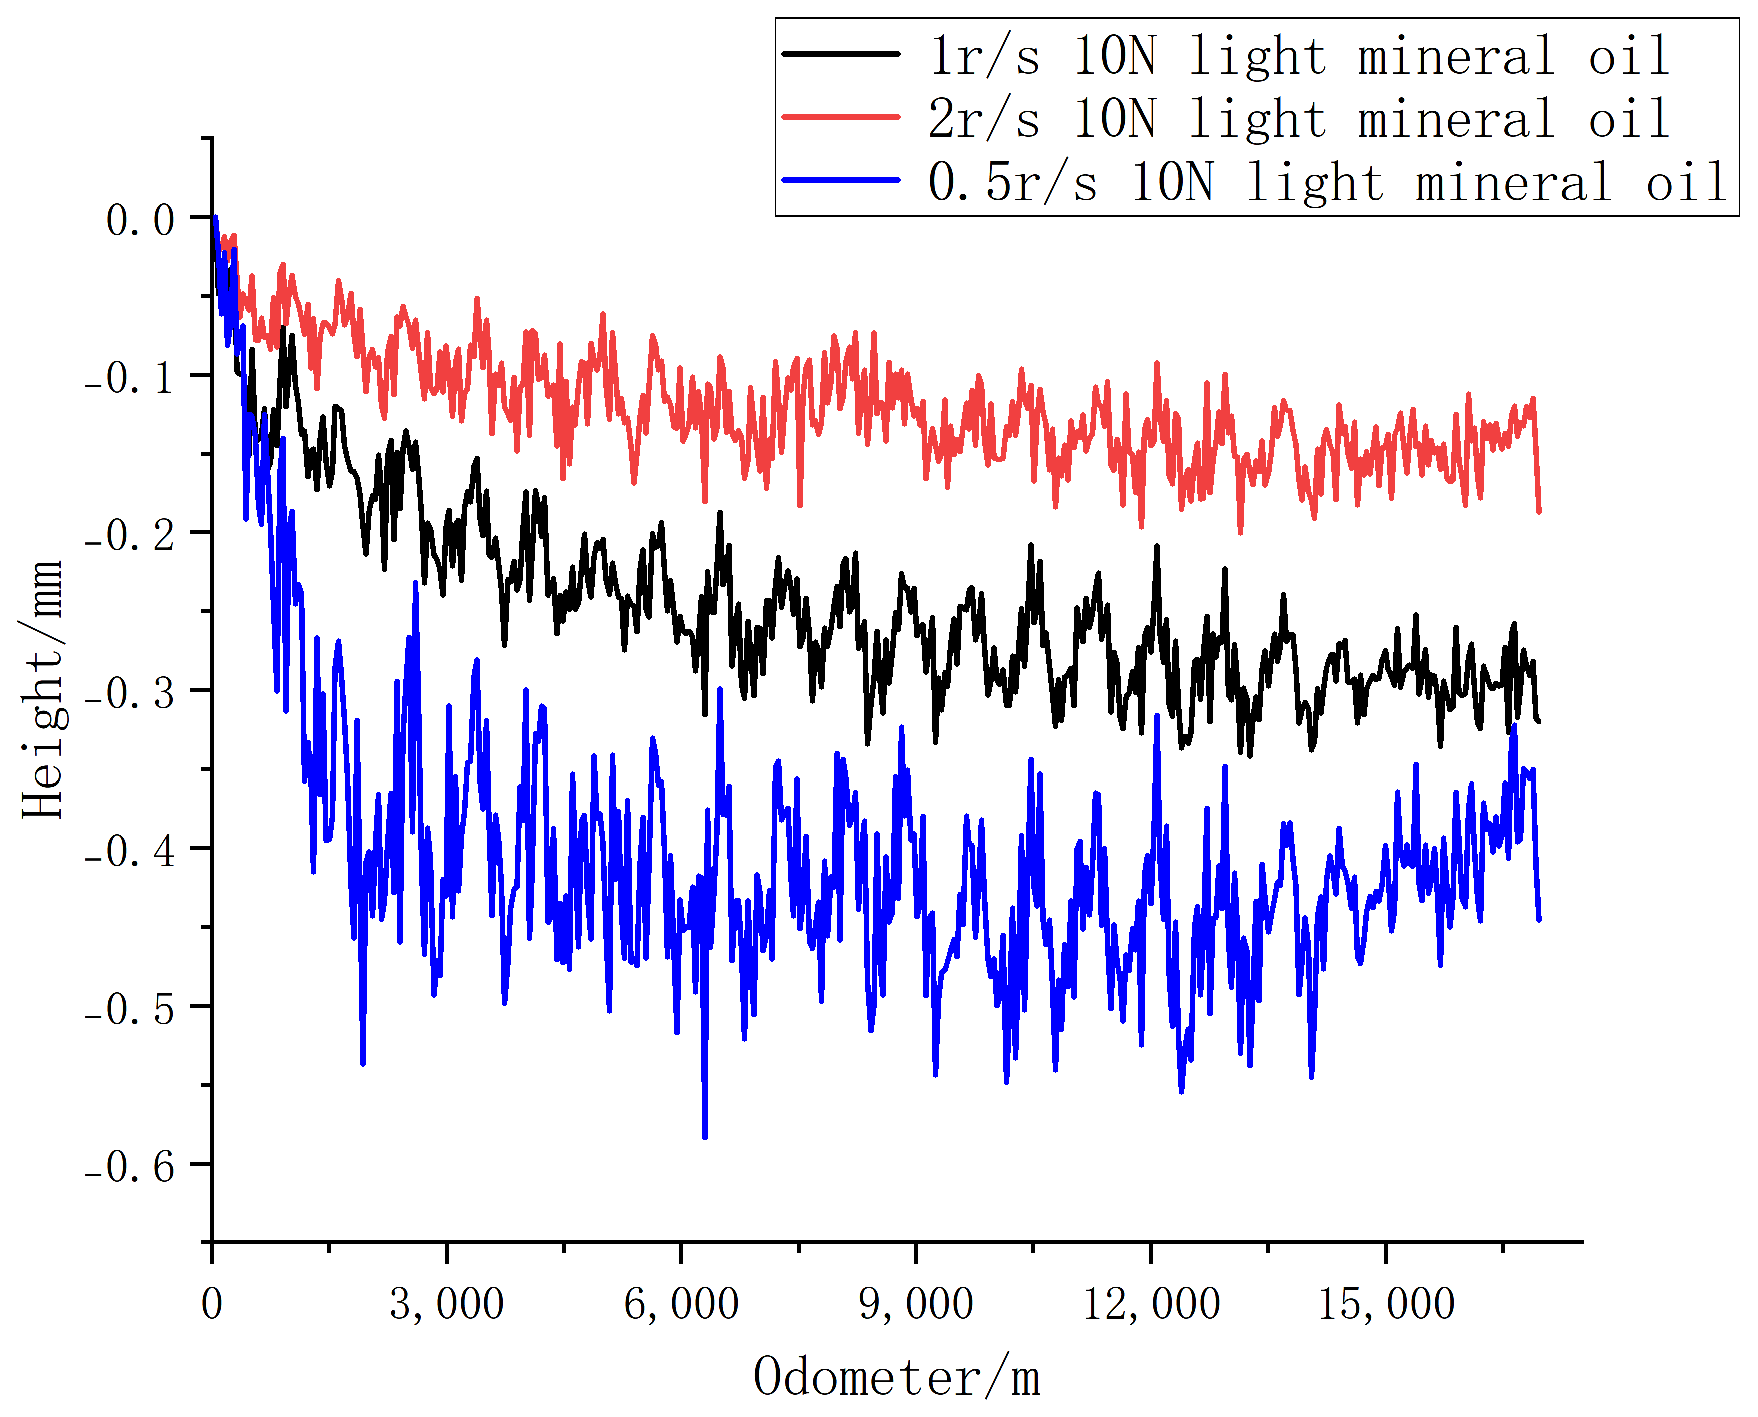
A graph comparing the three speeds of wear is shown in Figure 25.
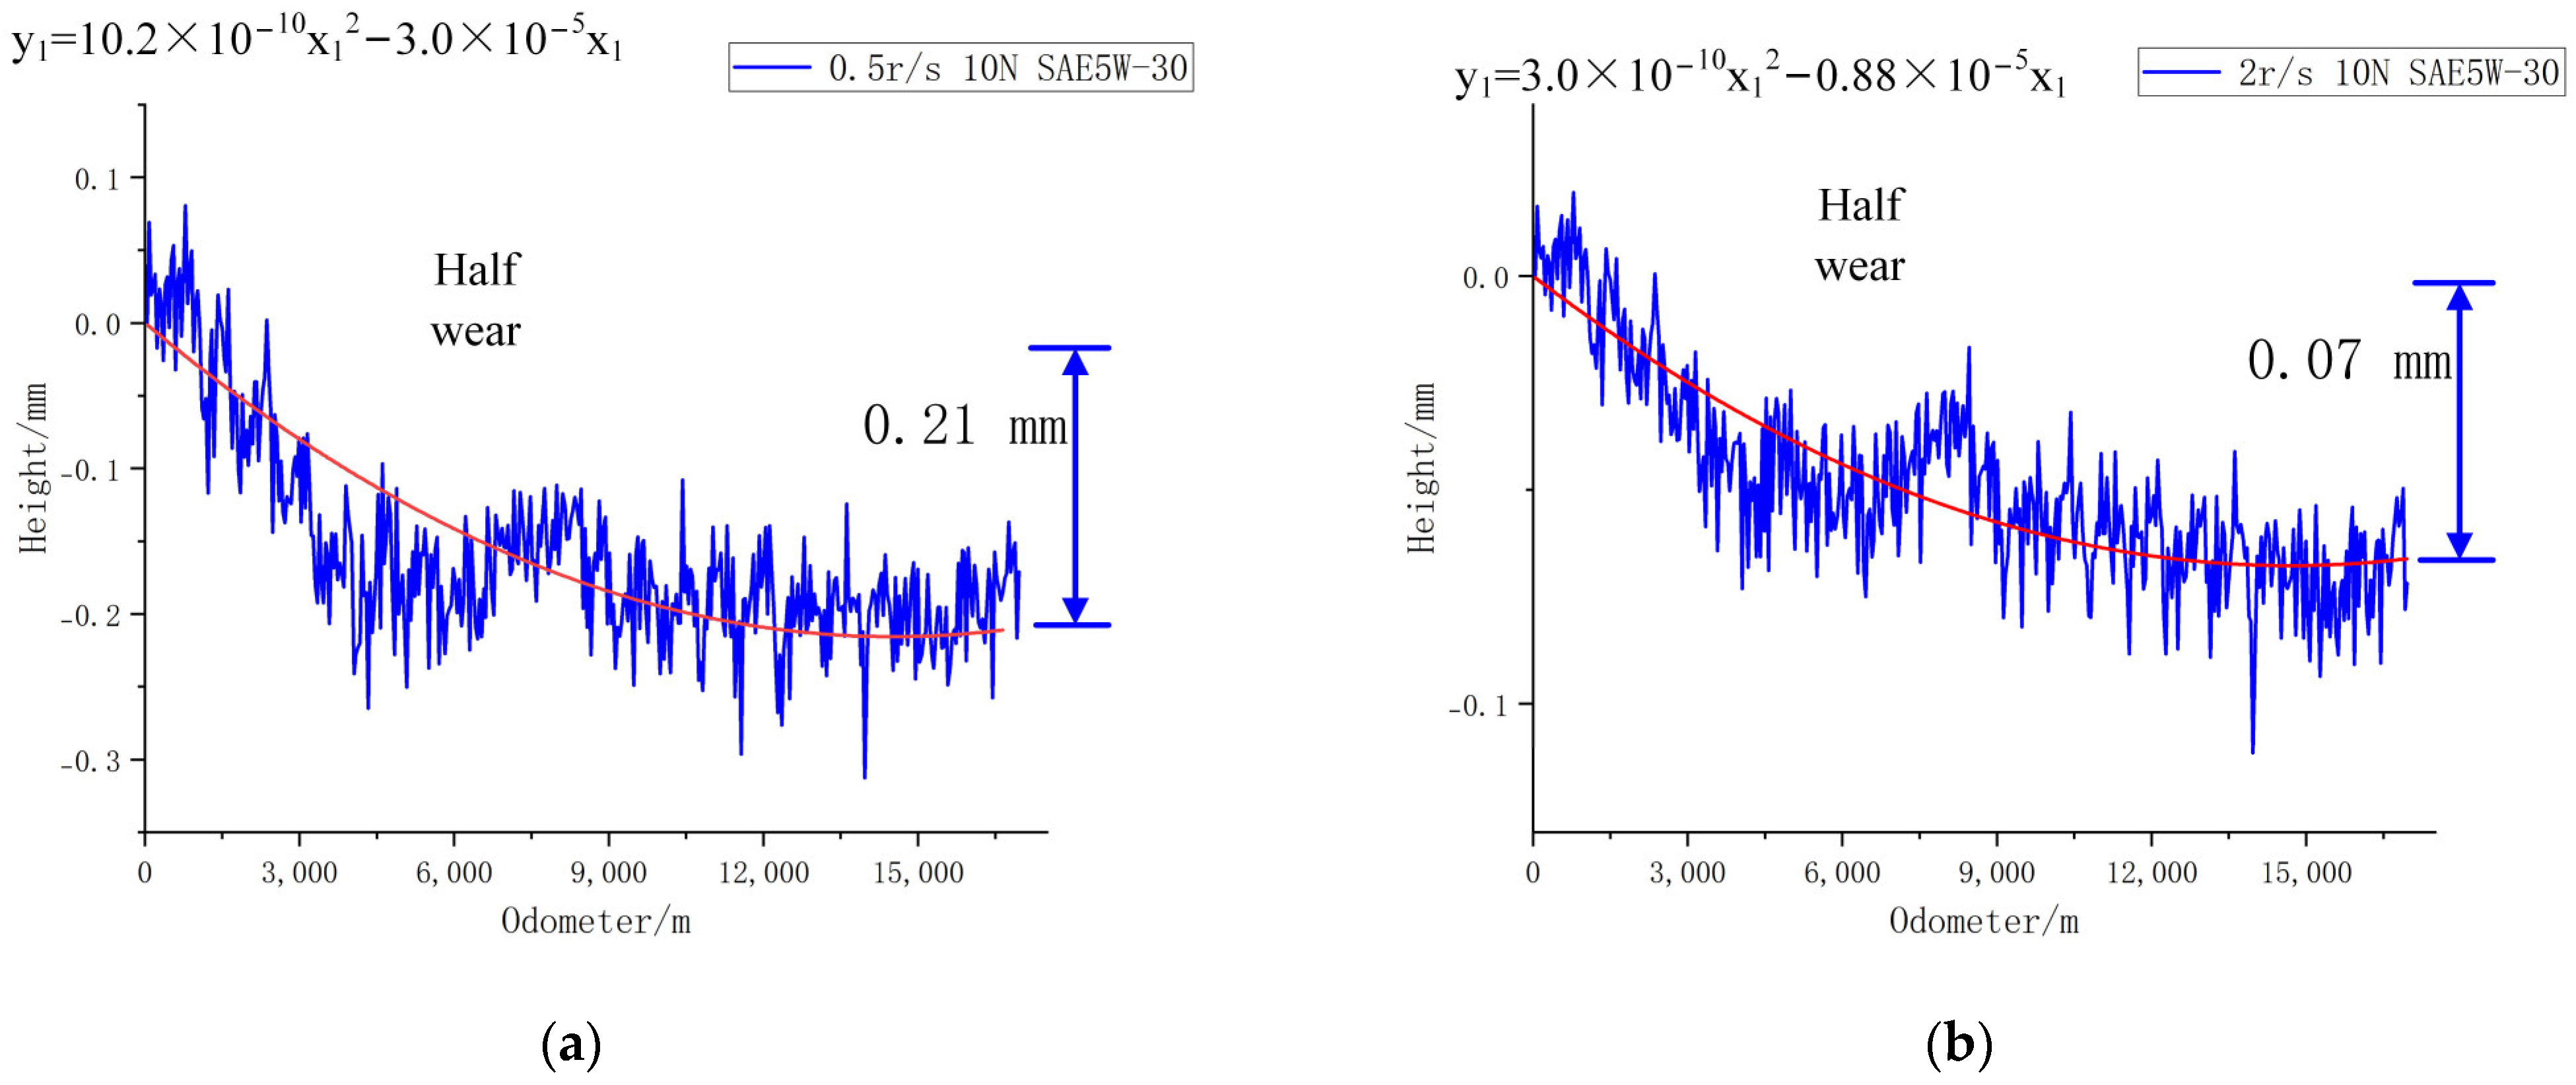
For SAE5W-30 lubricant under a 10 N load, after running at 0.5 r/s for 100 h, the signal collected by the laser distance sensor is processed to obtain Figure 26a; for SAE5W-30 lubricant under a 10 N load, after running at 2 r/s for 25 h, the signal collected by the laser distance sensor is processed to obtain Figure 26b.
At a running speed of 0.5 r/s, the leaf spring specimens were all in a half-worn state, with a final wear height of 0.21 mm. The fitting function is as follows:
y 1 = 10.2 × 1 0 10 x 1 2 3.0 × 1 0 5 x 1
At a running speed of 2 r/s, the leaf spring specimens were all in a half-worn state, with a final wear height of 0.07 mm. The fitting function is as follows:
y 1 = 3.0 × 1 0 10 x 1 2 0.88 × 1 0 5 x 1
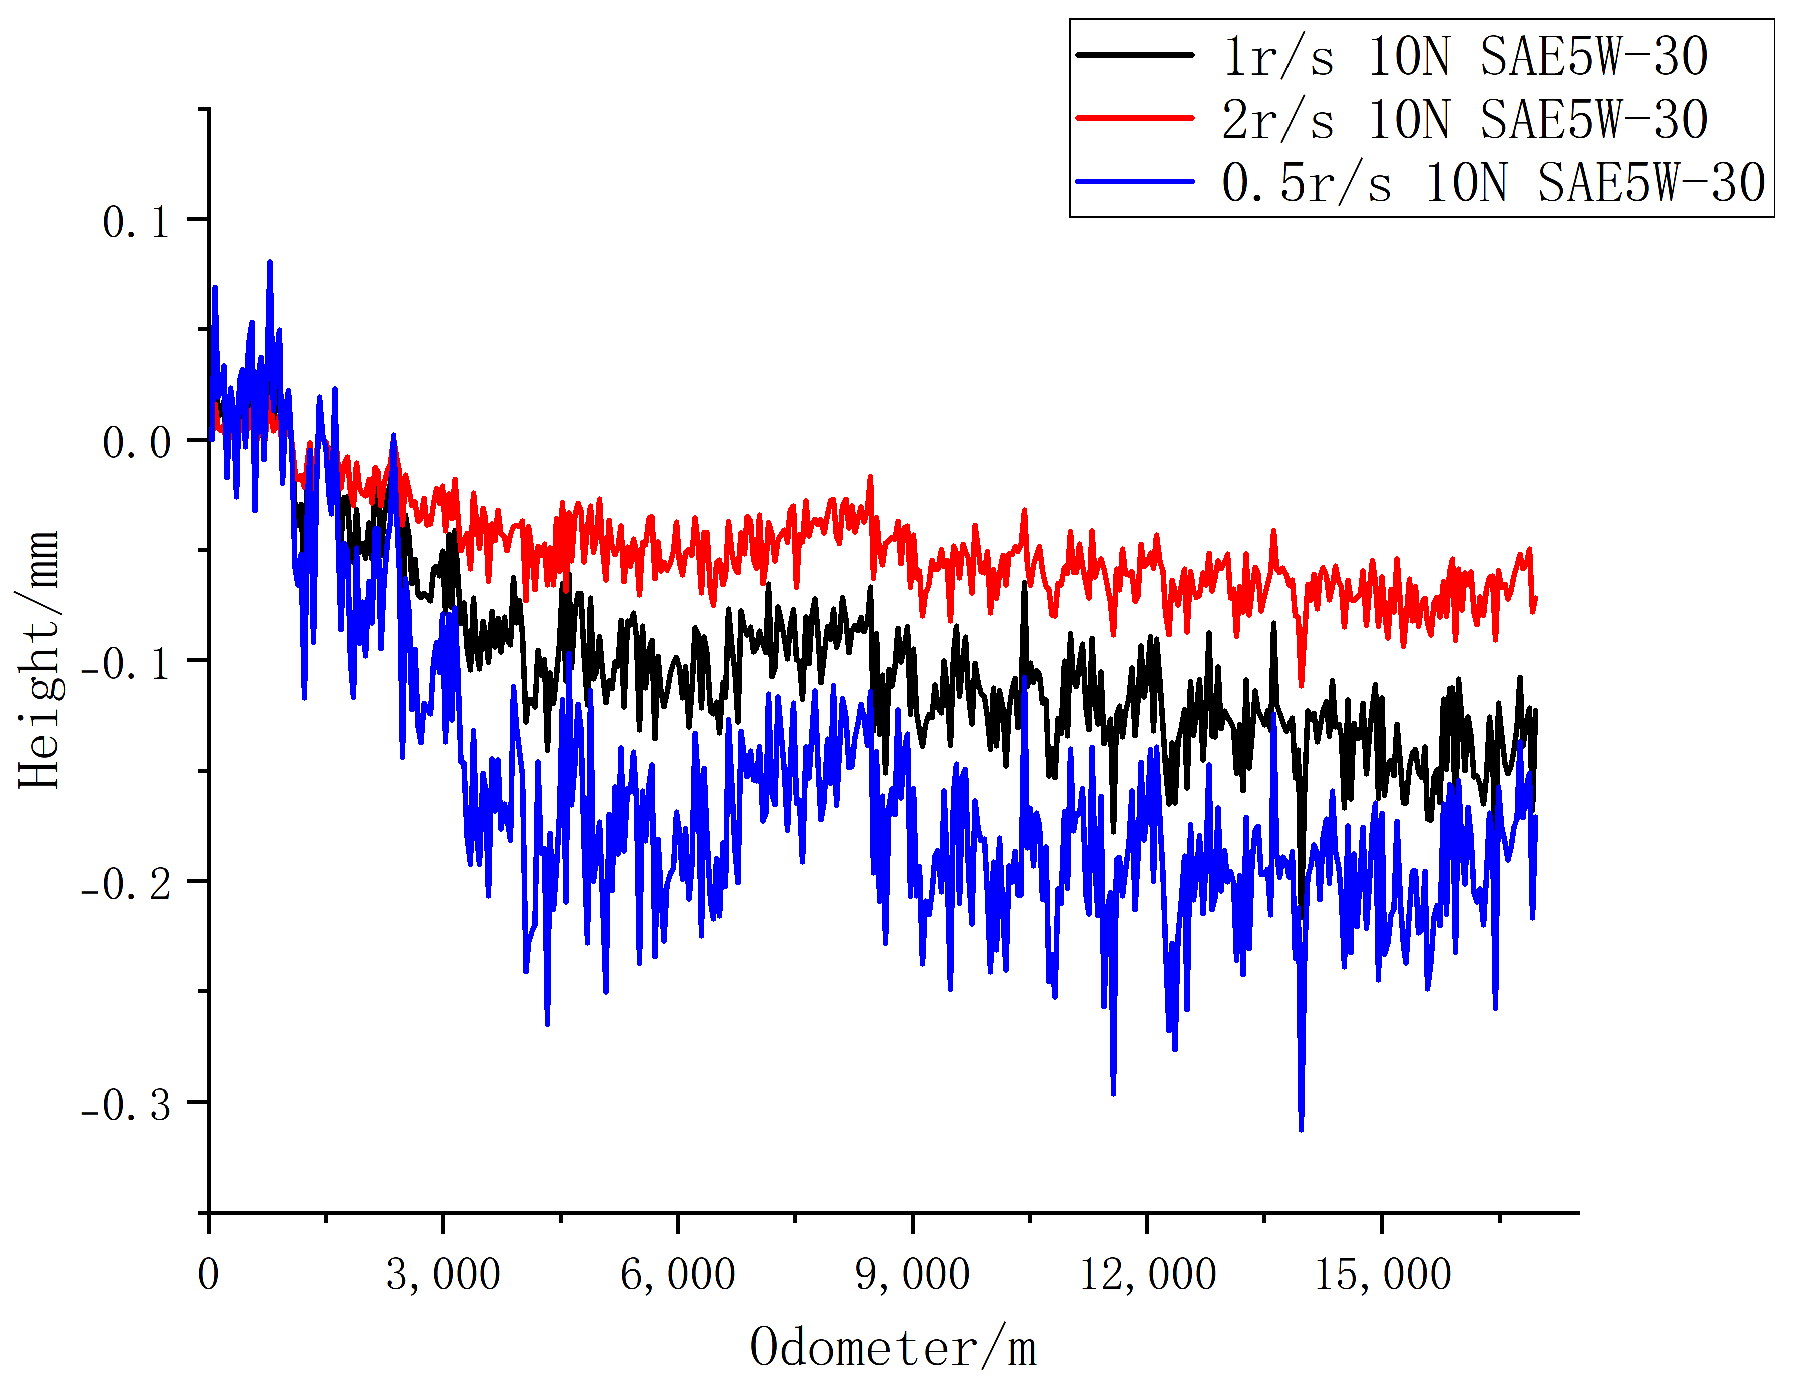
A graph comparing the wear of the three speeds is shown in Figure 27.
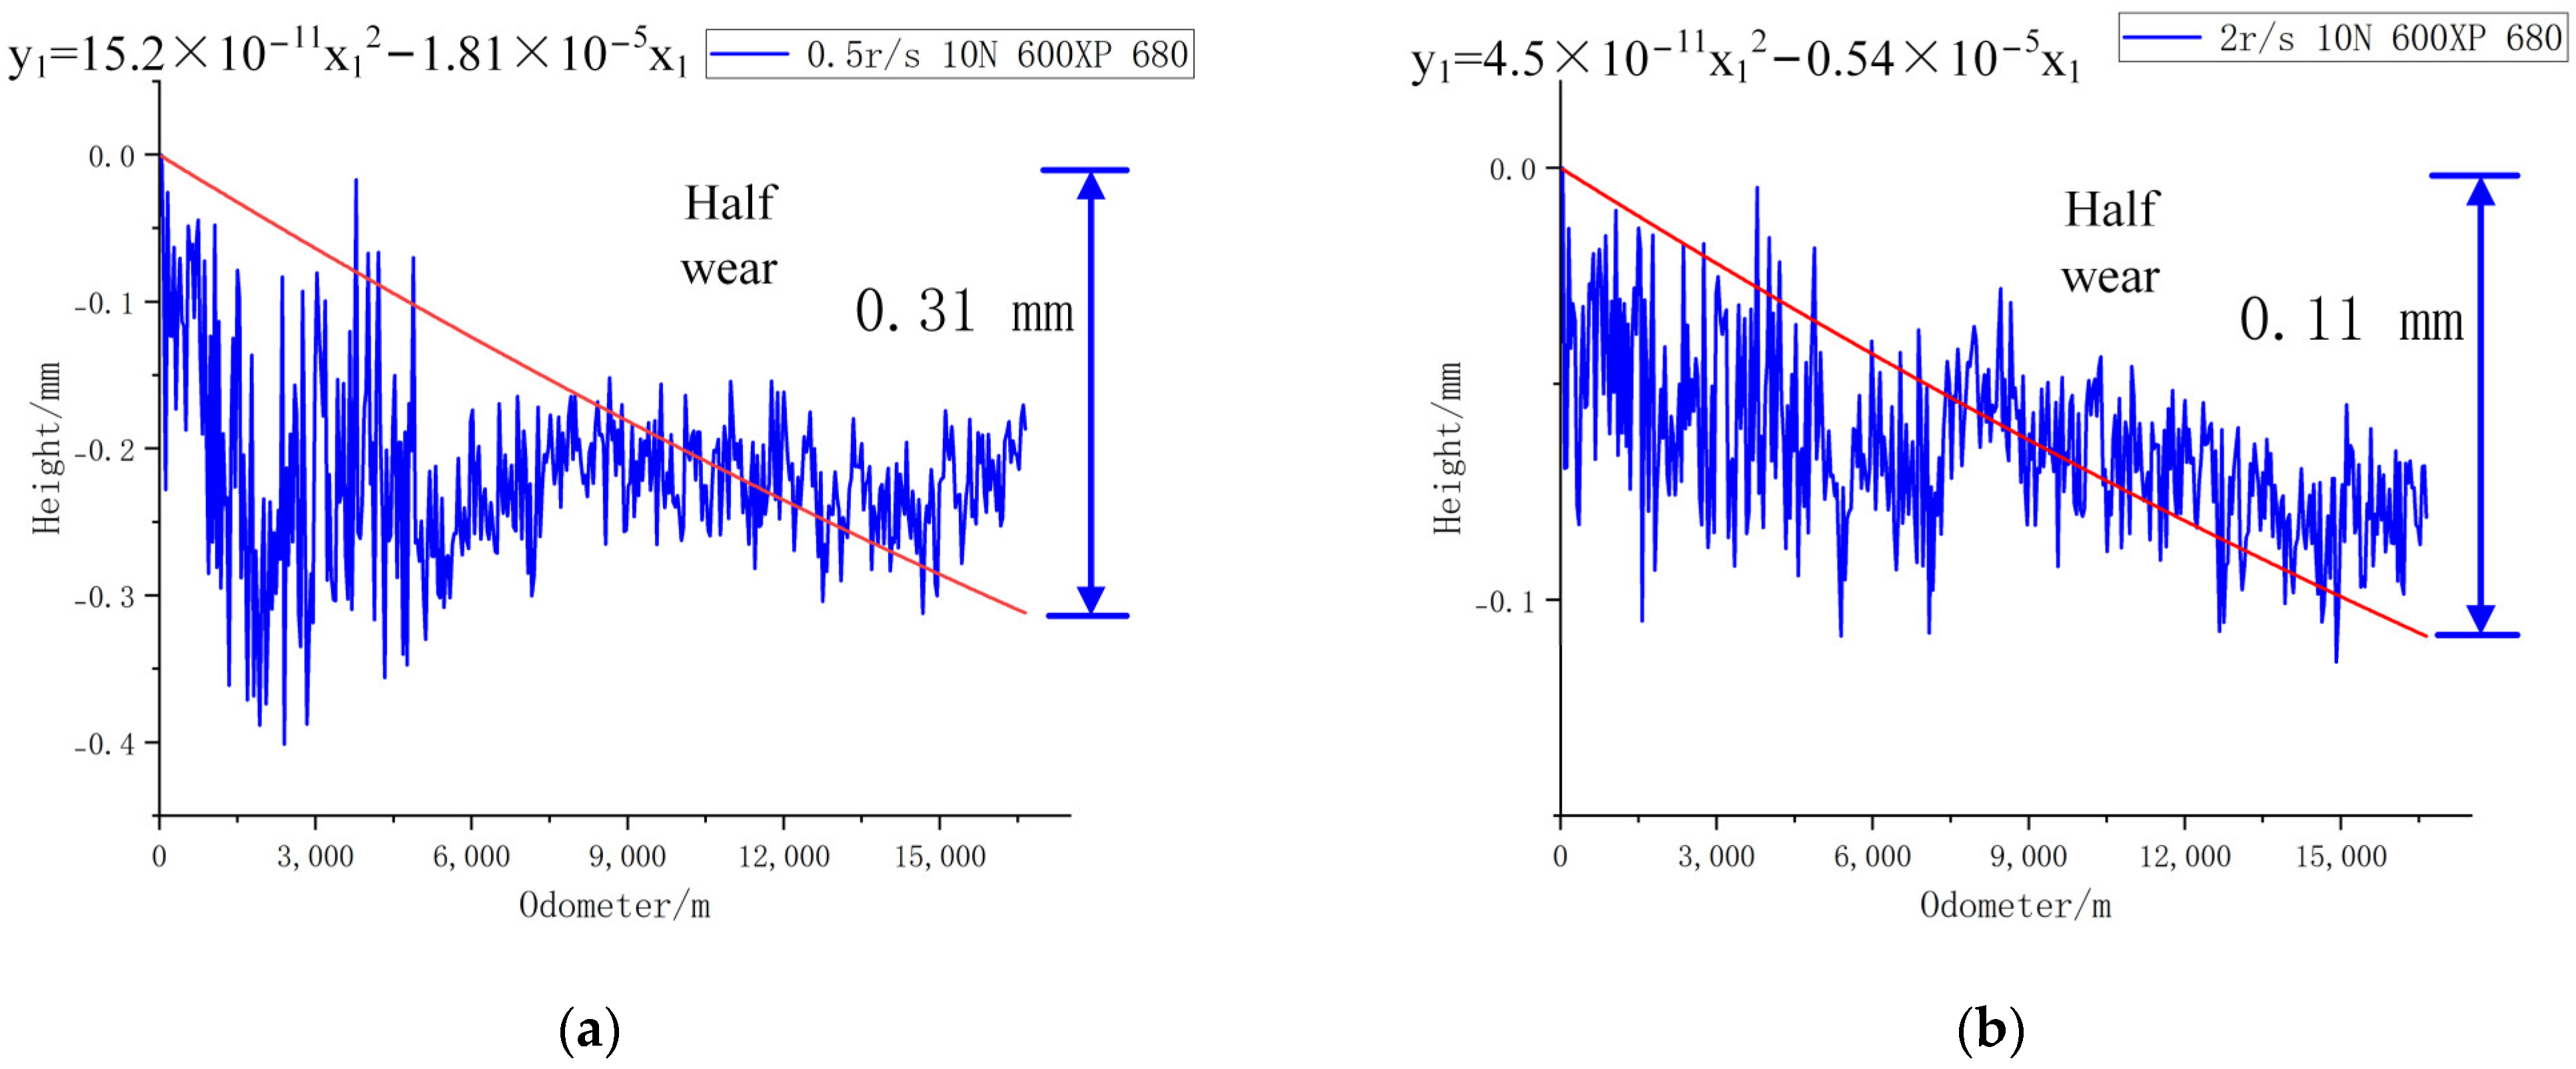
For 600XP-680 lubricant under a 10 N load, after running at 0.5 r/s for 100 h, the laser distance sensor acquisition signal is processed to obtain Figure 28a; for 600XP-680 lubricant under a 10 N load, after running at 2 r/s for 25 h, the laser distance sensor acquisition signal is processed to obtain Figure 28b.
At a running speed of 0.5 r/s, the leaf spring specimens were all in a half-worn state, with a final wear height of 0.31 mm. The fitting function is as follows:
y 1 = 15.2 × 1 0 11 x 1 2 1.81 × 1 0 5 x 1
At a running speed of 2 r/s, the leaf spring specimens were all in a half-worn state, with a final wear height of 0.11 mm. The fitting function is as follows:
y 1 = 4.5 × 1 0 11 x 1 2 0.54 × 1 0 5 x 1
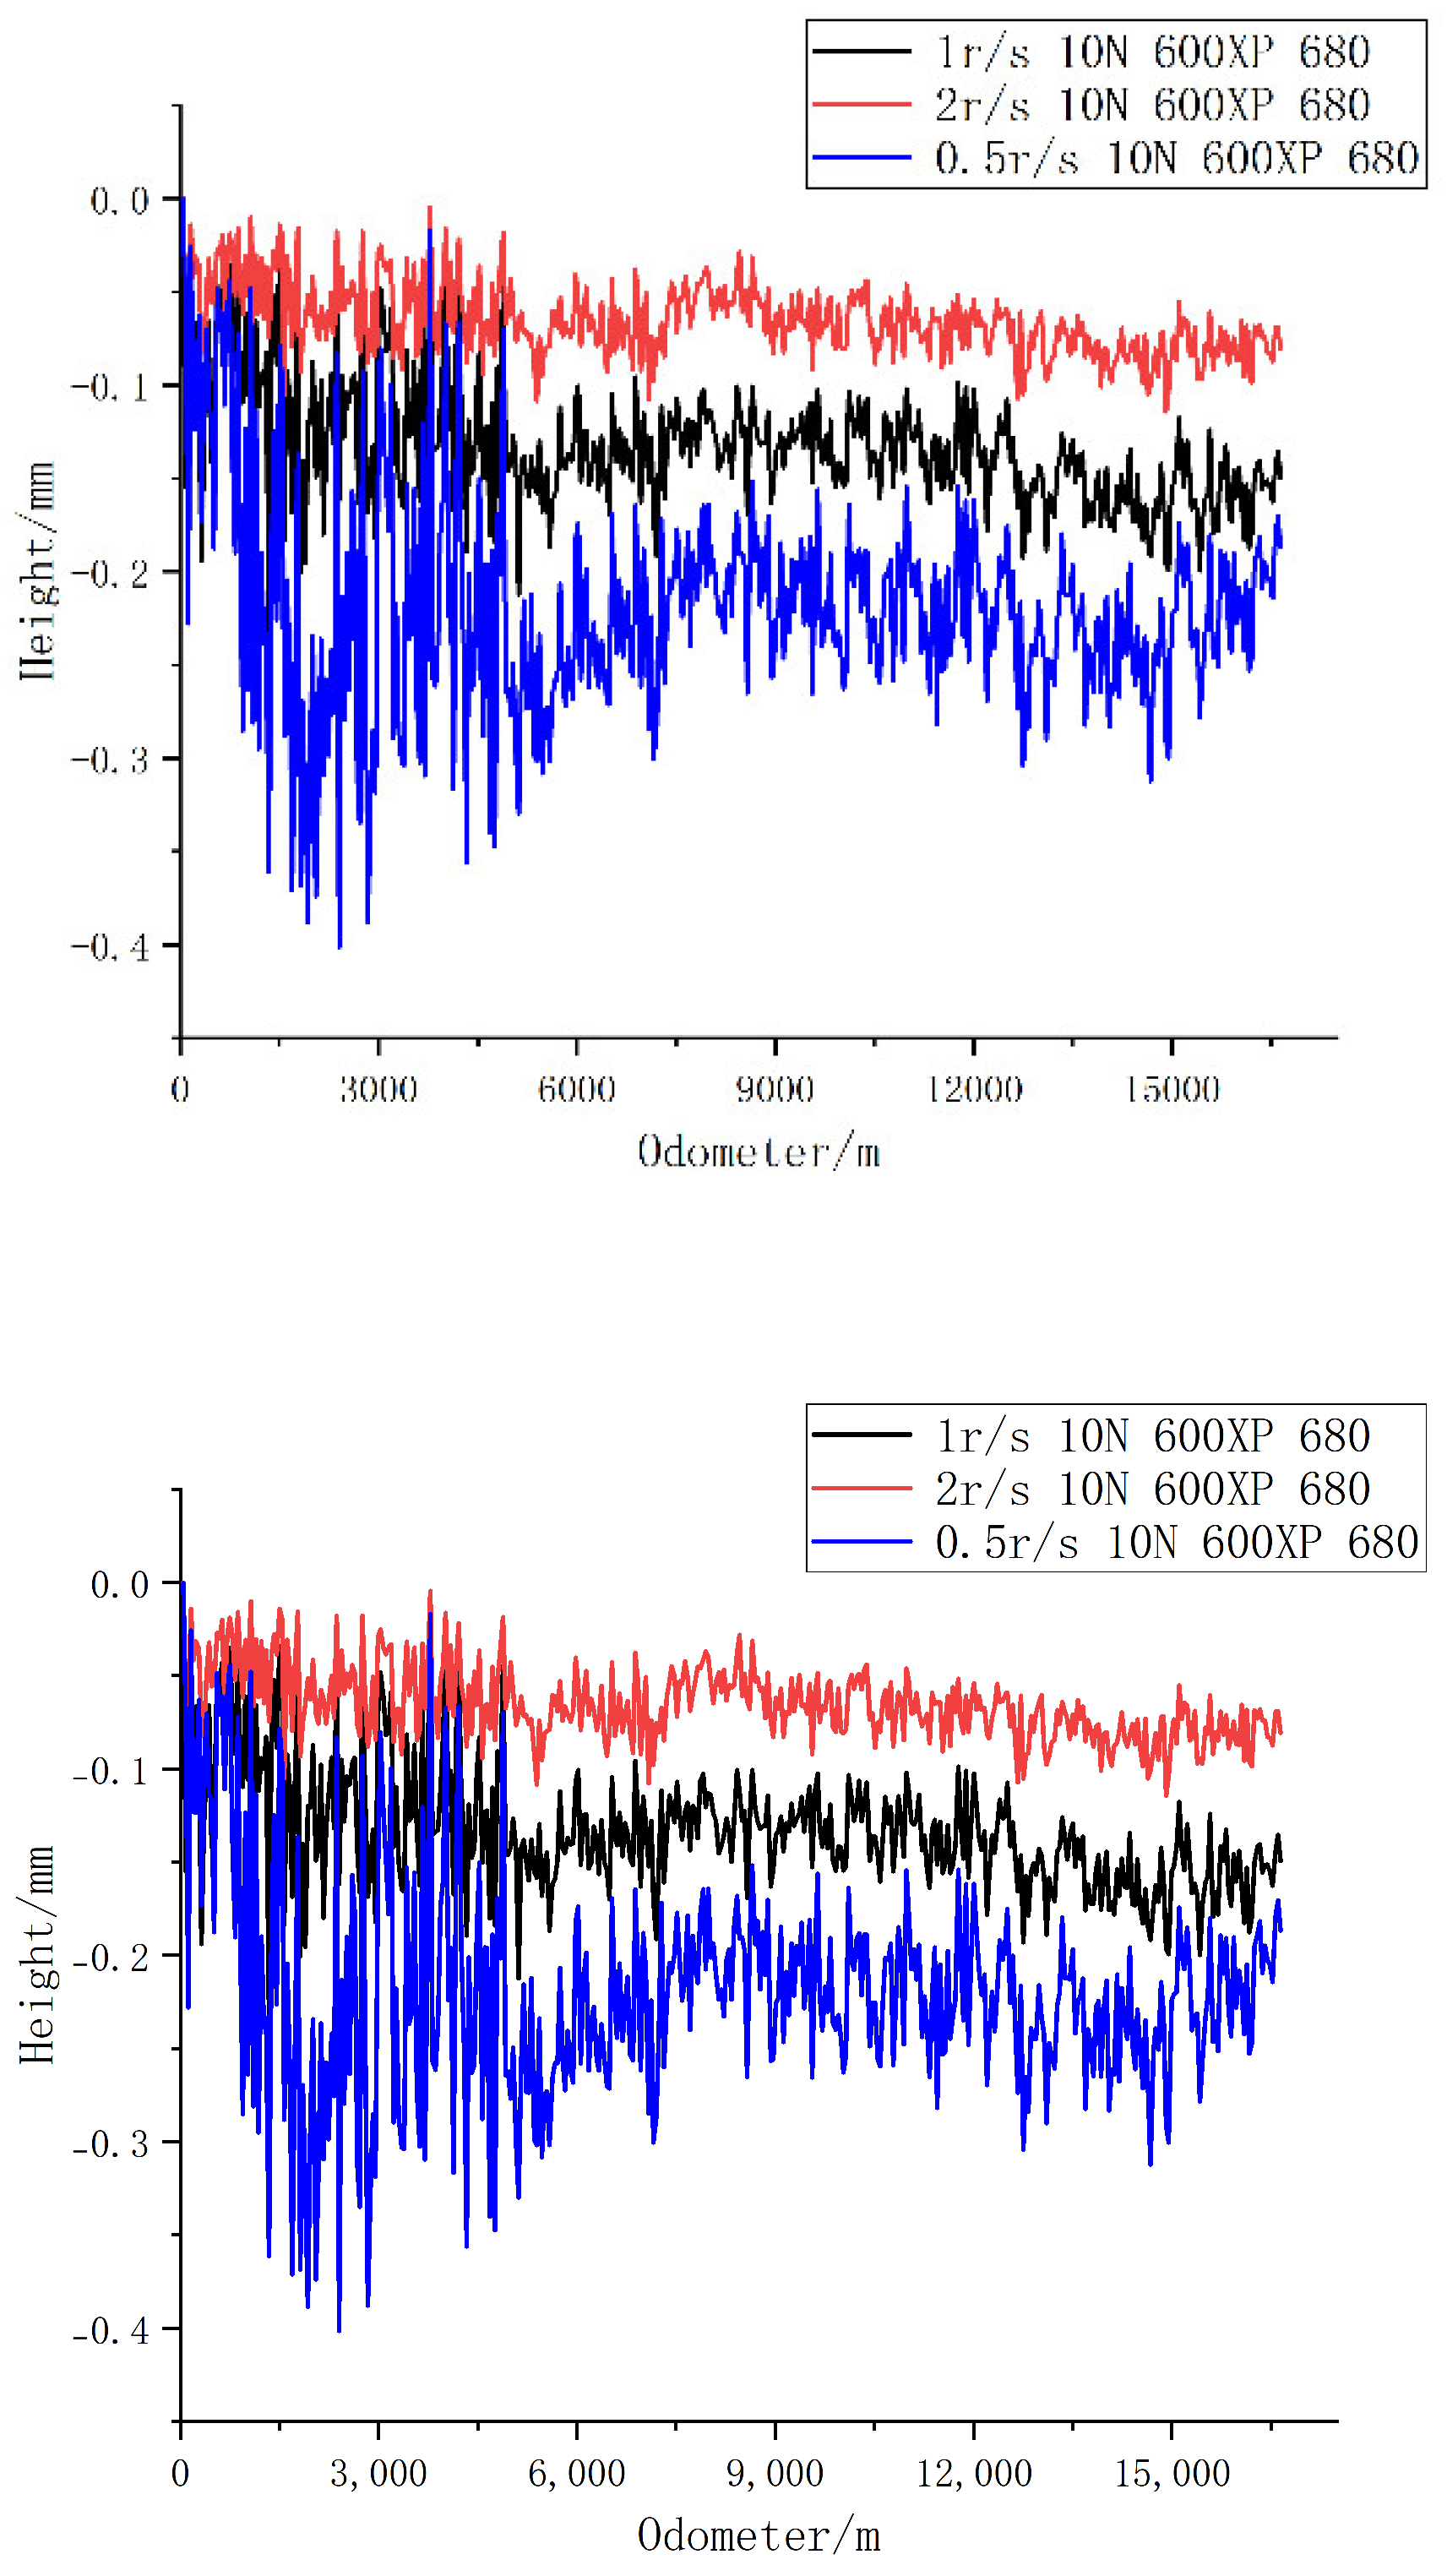
A comparison of the three speeds of wear is shown in Figure 29. The wear curves of three types of lubricating oils at different speeds are shown in Table 2.
According to the comparison of different speed experiments, light mineral oil, SAE5W-30 lubricant, and 600XP-680 lubricant as a lubricant medium, different speeds run the same mileage; the lower the speed, the greater the wear.
When light mineral oil, SAE5W-30 lubricant, and 600XP-680 lubricant are used as lubricating media and the rest of the conditions remain unchanged, the wear rate of 2 r/s (0.1884 m/s) is 0.491328 times higher than that of 1 r/s (0.0942 m/s), and the wear rate of 0.5 r/s (0.0471 m/s) is 0.491328 times higher than that of 1 r/s (0.0942 m/s) wear velocity 1.649410 times when the working speed is not the rated speed (0.0942 m/s). If the working speed increases, the wear equation as a whole decreases exponentially. If the operating speed decreases, the wear equation as a whole increases exponentially. We call this multiplicative relationship the speed correction factor. Use the method of quadratic interpolation to obtain the formula for calculating the velocity correction coefficient, where k1 is the velocity correction coefficient, and v1 is the linear velocity (unit: m/s). The formula for calculating the velocity correction factor is as follows:
k 1 = 59.3630 v 1 2 22.1759 v 1 + 2.5622
The wear functions of light mineral oil, SAE 5W-30 lubricant, and 600XP-680 lubricant as lubricating mediums at different speeds are shown in Table 3.
(5)
Effect of load on detection accuracy
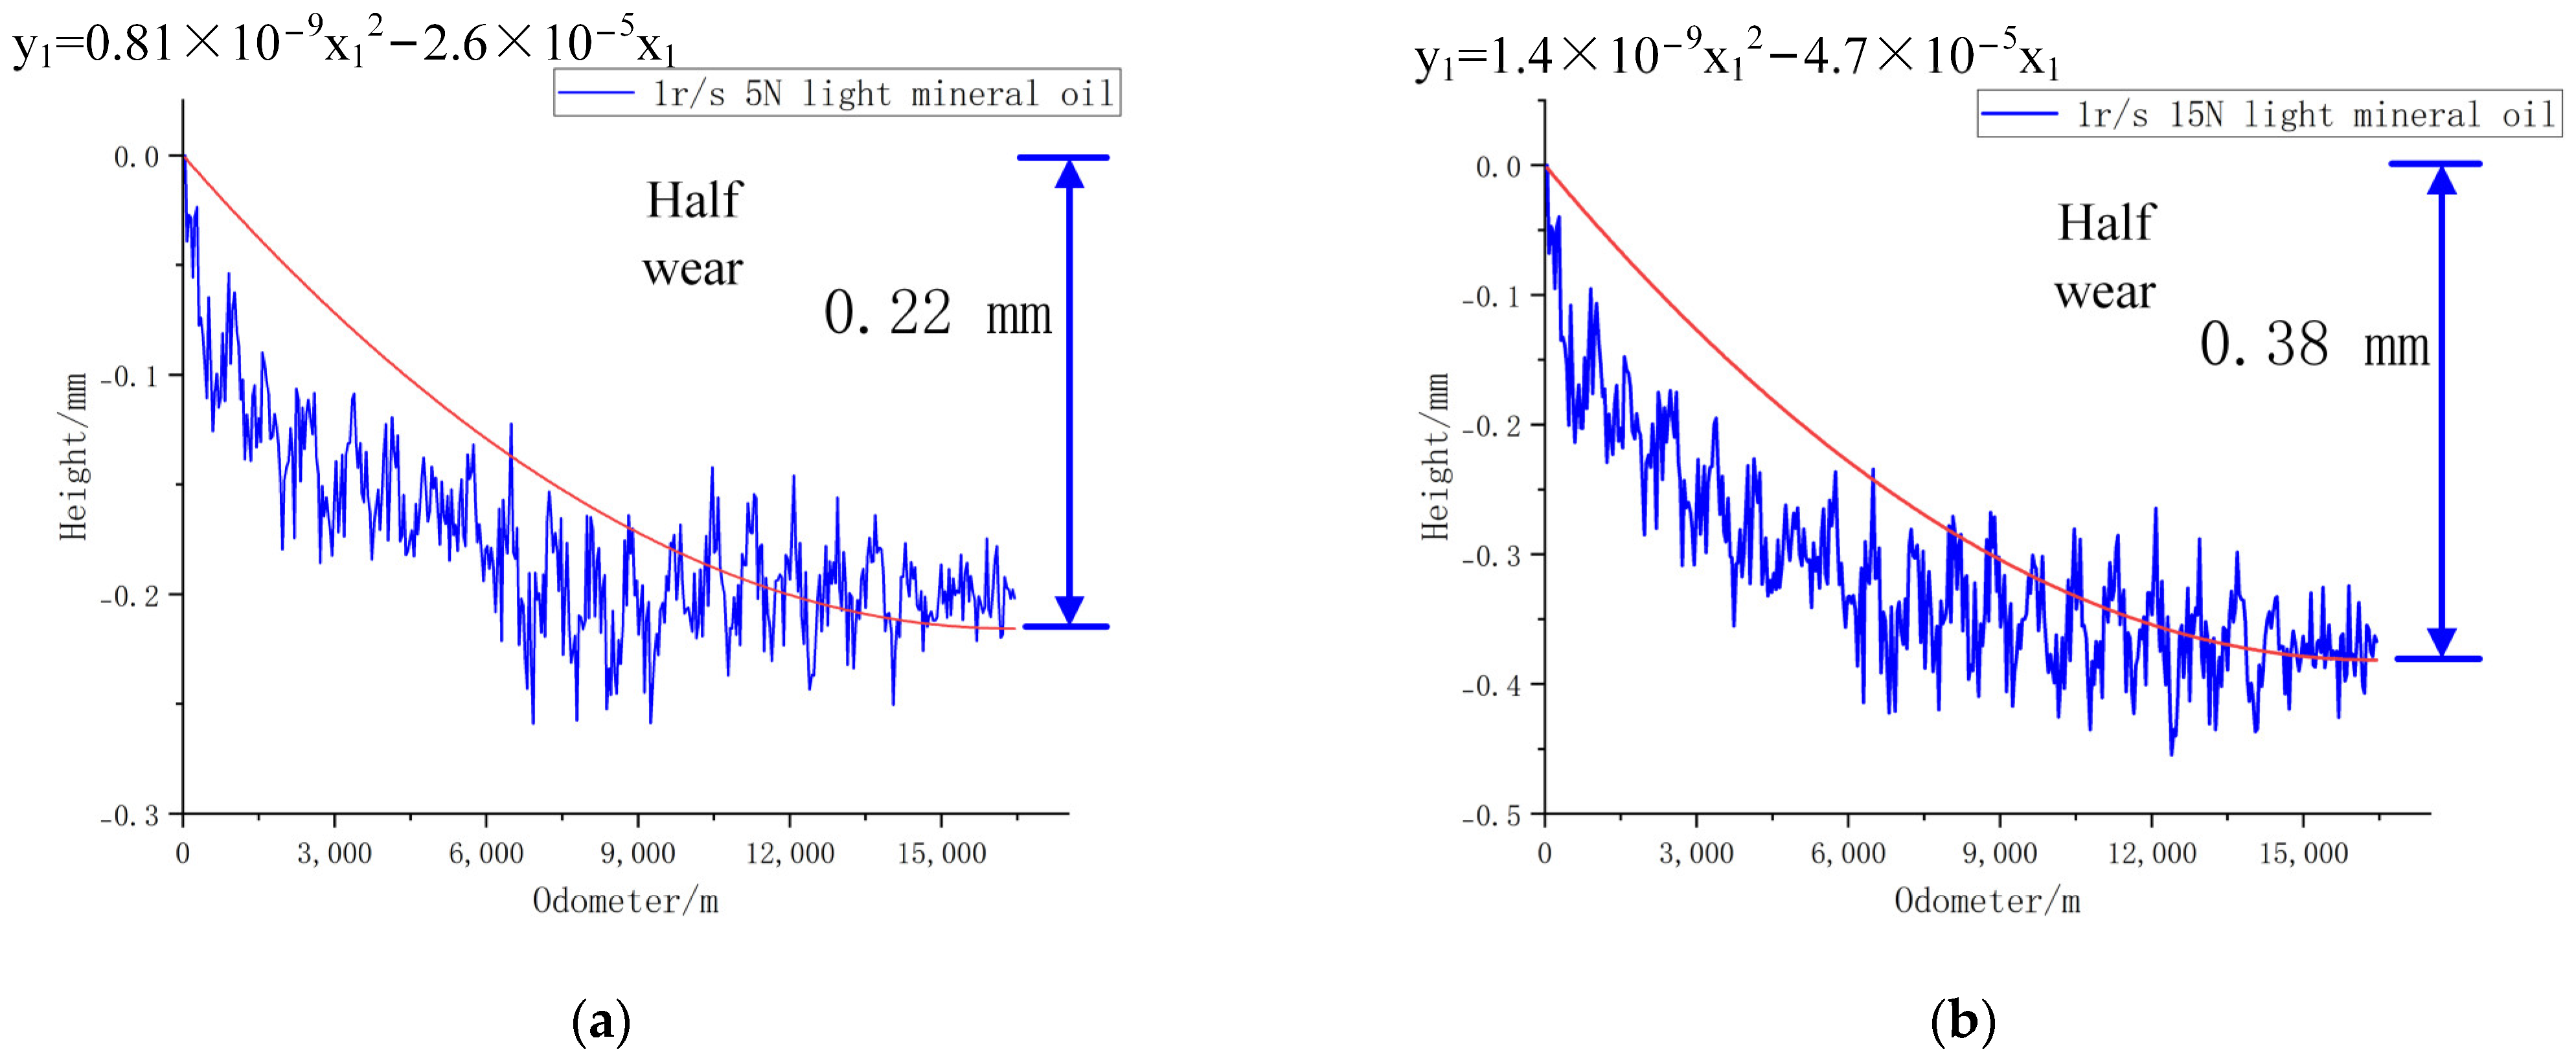
For light mineral oil under a 5 N load, after running at a speed of 1 r/s for 50 h, the signal collected by the laser distance sensor was processed to obtain Figure 30a; for light mineral oil under a 15 N load, after running at a speed of 1 r/s for 50 h, the signal collected by the laser distance sensor was processed to obtain Figure 30b.
The leaf spring specimens were all in a half-worn condition with a final wear height of 0.22 mm under a load of 5 N. The fitting function is as follows:
y 1 = 0.81 × 1 0 9 x 1 2 2.6 × 1 0 5 x 1
At a load of 5 N, wear is significantly slower than at 10 N.
The leaf spring specimens were all in a half-worn condition with a final wear height of 0.38 mm under a load of 15 N. The fitting function is as follows:
y 1 = 1.4 × 1 0 9 x 1 2 4.7 × 1 0 5 x 1
At 15 N load, there is a significant increase in wear compared to the 10 N condition.
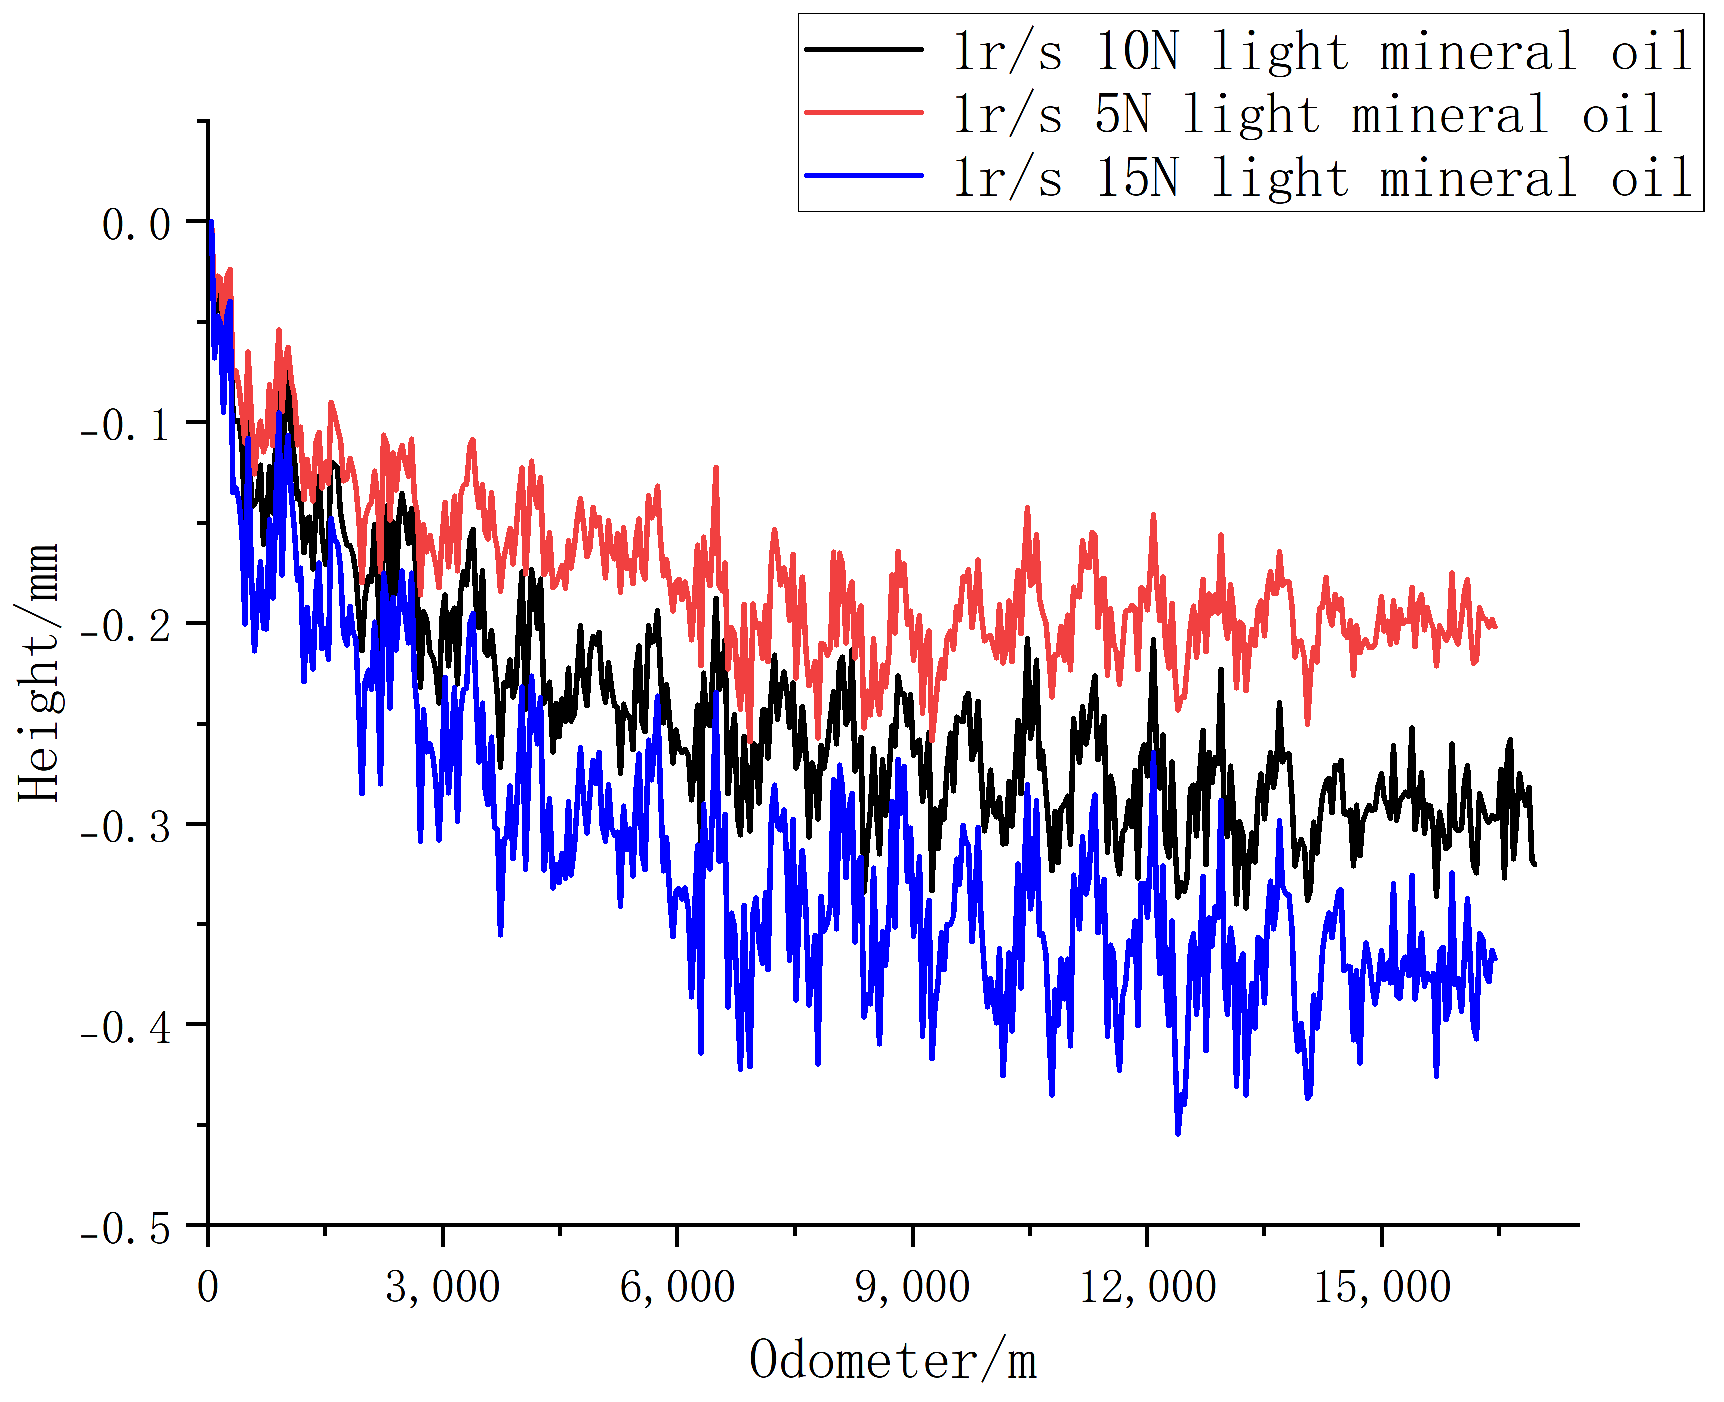
The three-speed wear comparison graphs are shown in Figure 31.
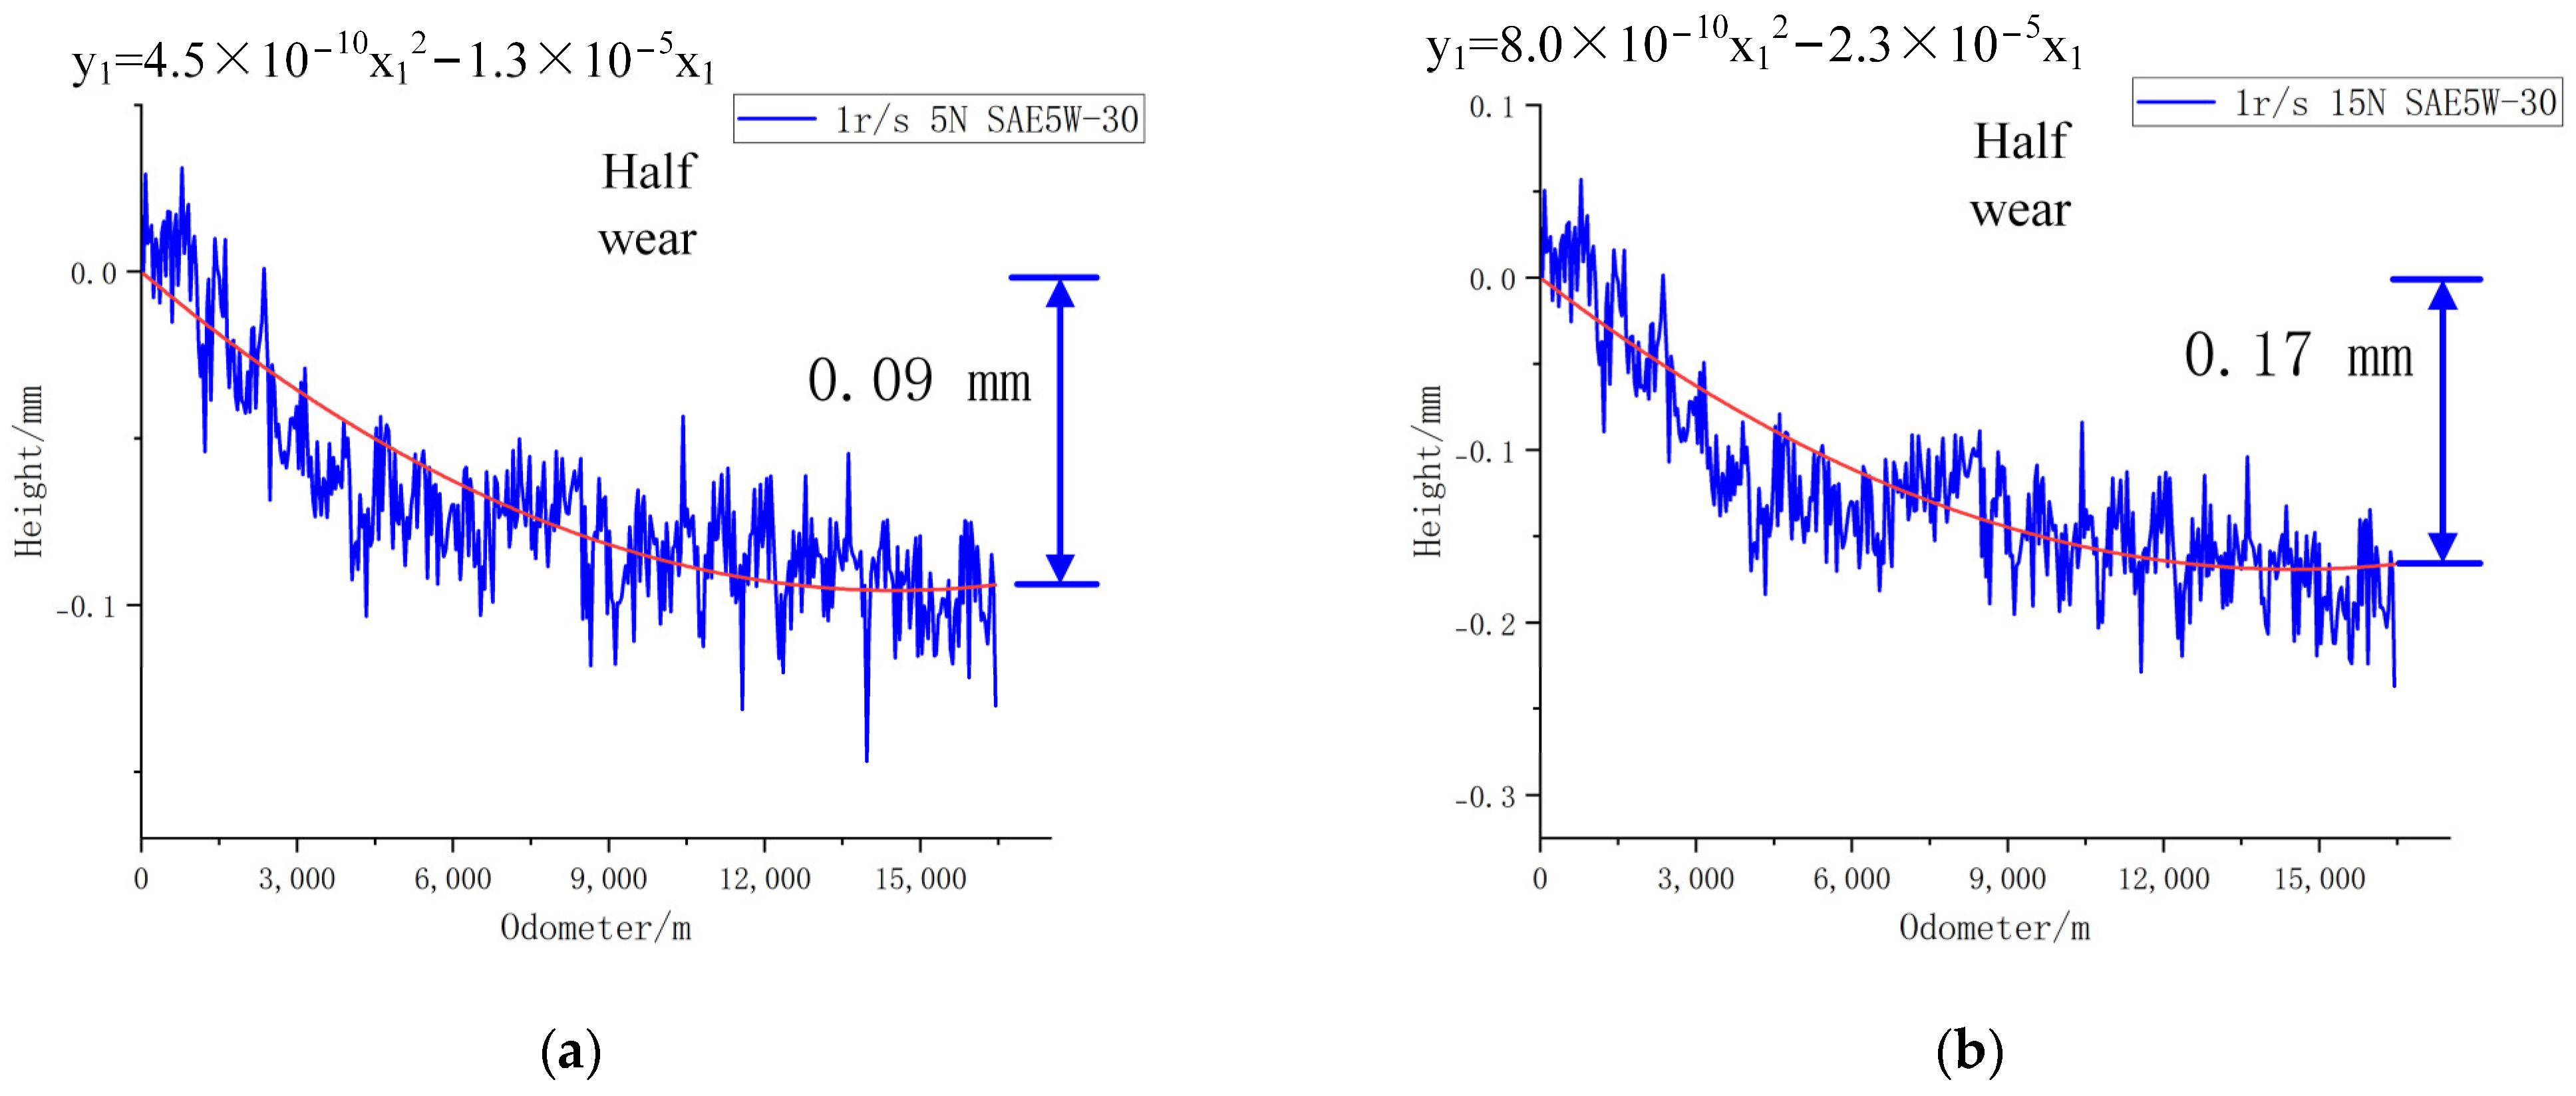
For SAE5W-30 lubricant under a 5 N load, after running at a speed of 1 r/s for 50 h, the laser ranging sensor collected signals were processed to obtain Figure 32a; for SAE5W-30 lubricant under a 15 N load, after running at a speed of 1 r/s for 50 h, the laser ranging sensor collected signals were processed to obtain Figure 32b.
At 5 N load, the leaf spring specimens were all in half-wear condition with a final wear height of 0.09 mm. The fitting function is as follows:
y 1 = 4.5 × 1 0 10 x 1 2 1.3 × 1 0 5 x 1
At 5 N load, the wear was significantly slowed down as compared to the 10 N condition.
At 15 N load, the leaf spring specimens were all in half-wear condition with a final wear height of 0.17 mm. The fitting function is as follows:
y 1 = 8.0 × 1 0 10 x 1 2 2.3 × 1 0 5 x 1
At 15 N load, there is a significant increase in wear compared to the 10 N condition.
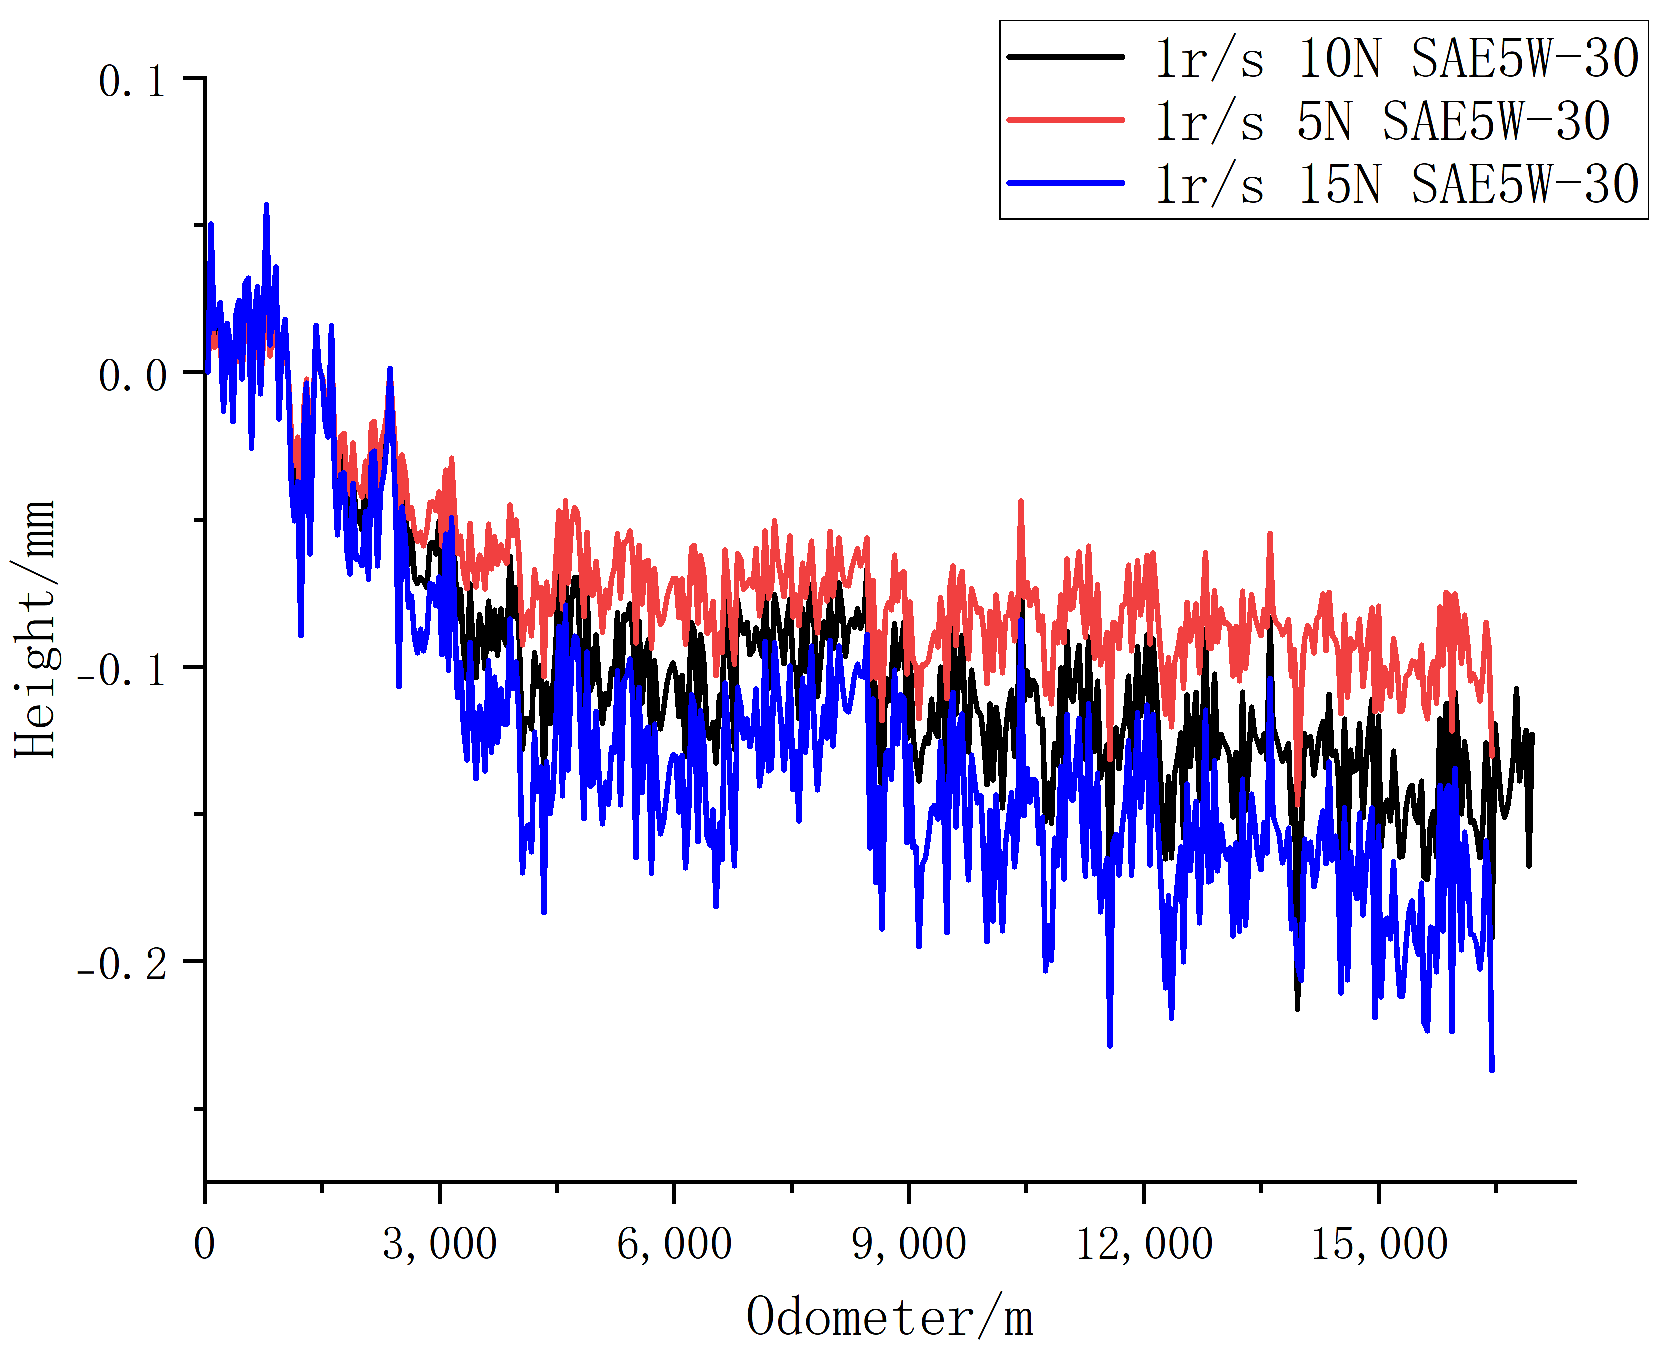
The three-speed wear comparison graphs are shown in Figure 33.
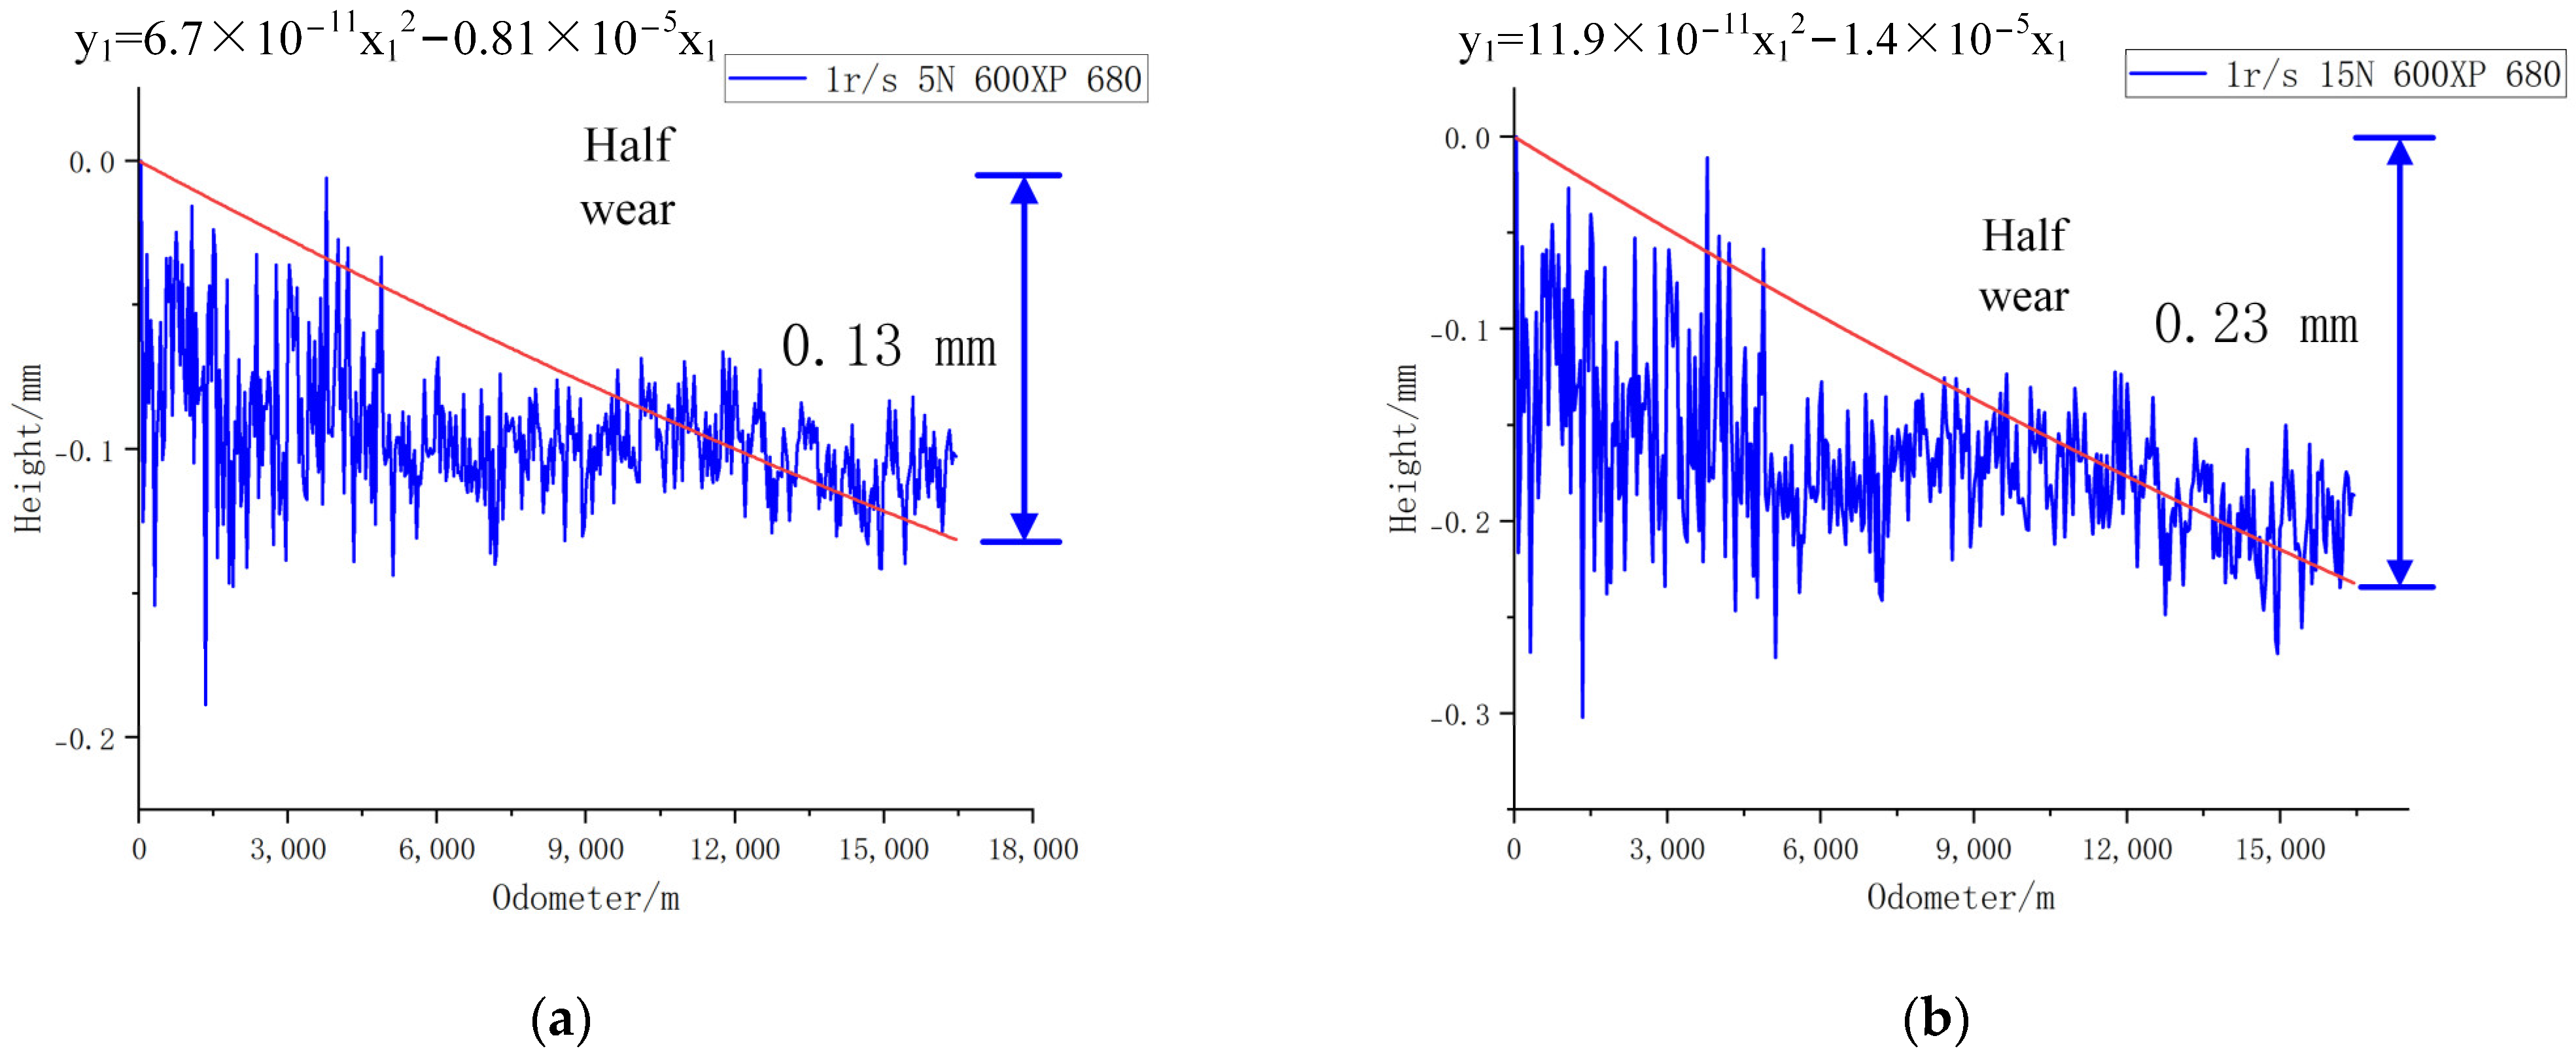
For 600XP-680 lubricant under a 5 N load, after running at a speed of 1 r/s for 50 h, the laser ranging sensor acquisition signal is processed to obtain Figure 34a; 600XP-680 lubricant under a 15 N load, after running at a speed of 1 r/s for 50 h, the laser ranging sensor acquisition signal is processed to obtain Figure 34b.
At a 5 N load, the leaf spring specimens were all in half-wear condition with a final wear height of 0.13 mm. The fitting function is as follows:
y 1 = 6.7 × 1 0 11 x 1 2 0.81 × 1 0 5 x 1
At a 5 N load, the wear was significantly slowed down compared to the 10 N condition.
At a 15 N load, the leaf spring specimens were all in half-wear condition with a final wear height of 0.23 mm. The fitting function is as follows:
y 1 = 11.9 × 1 0 11 x 1 2 1.4 × 1 0 5 x 1
At a 15 N load, there is a significant increase in wear compared to the 10 N condition.
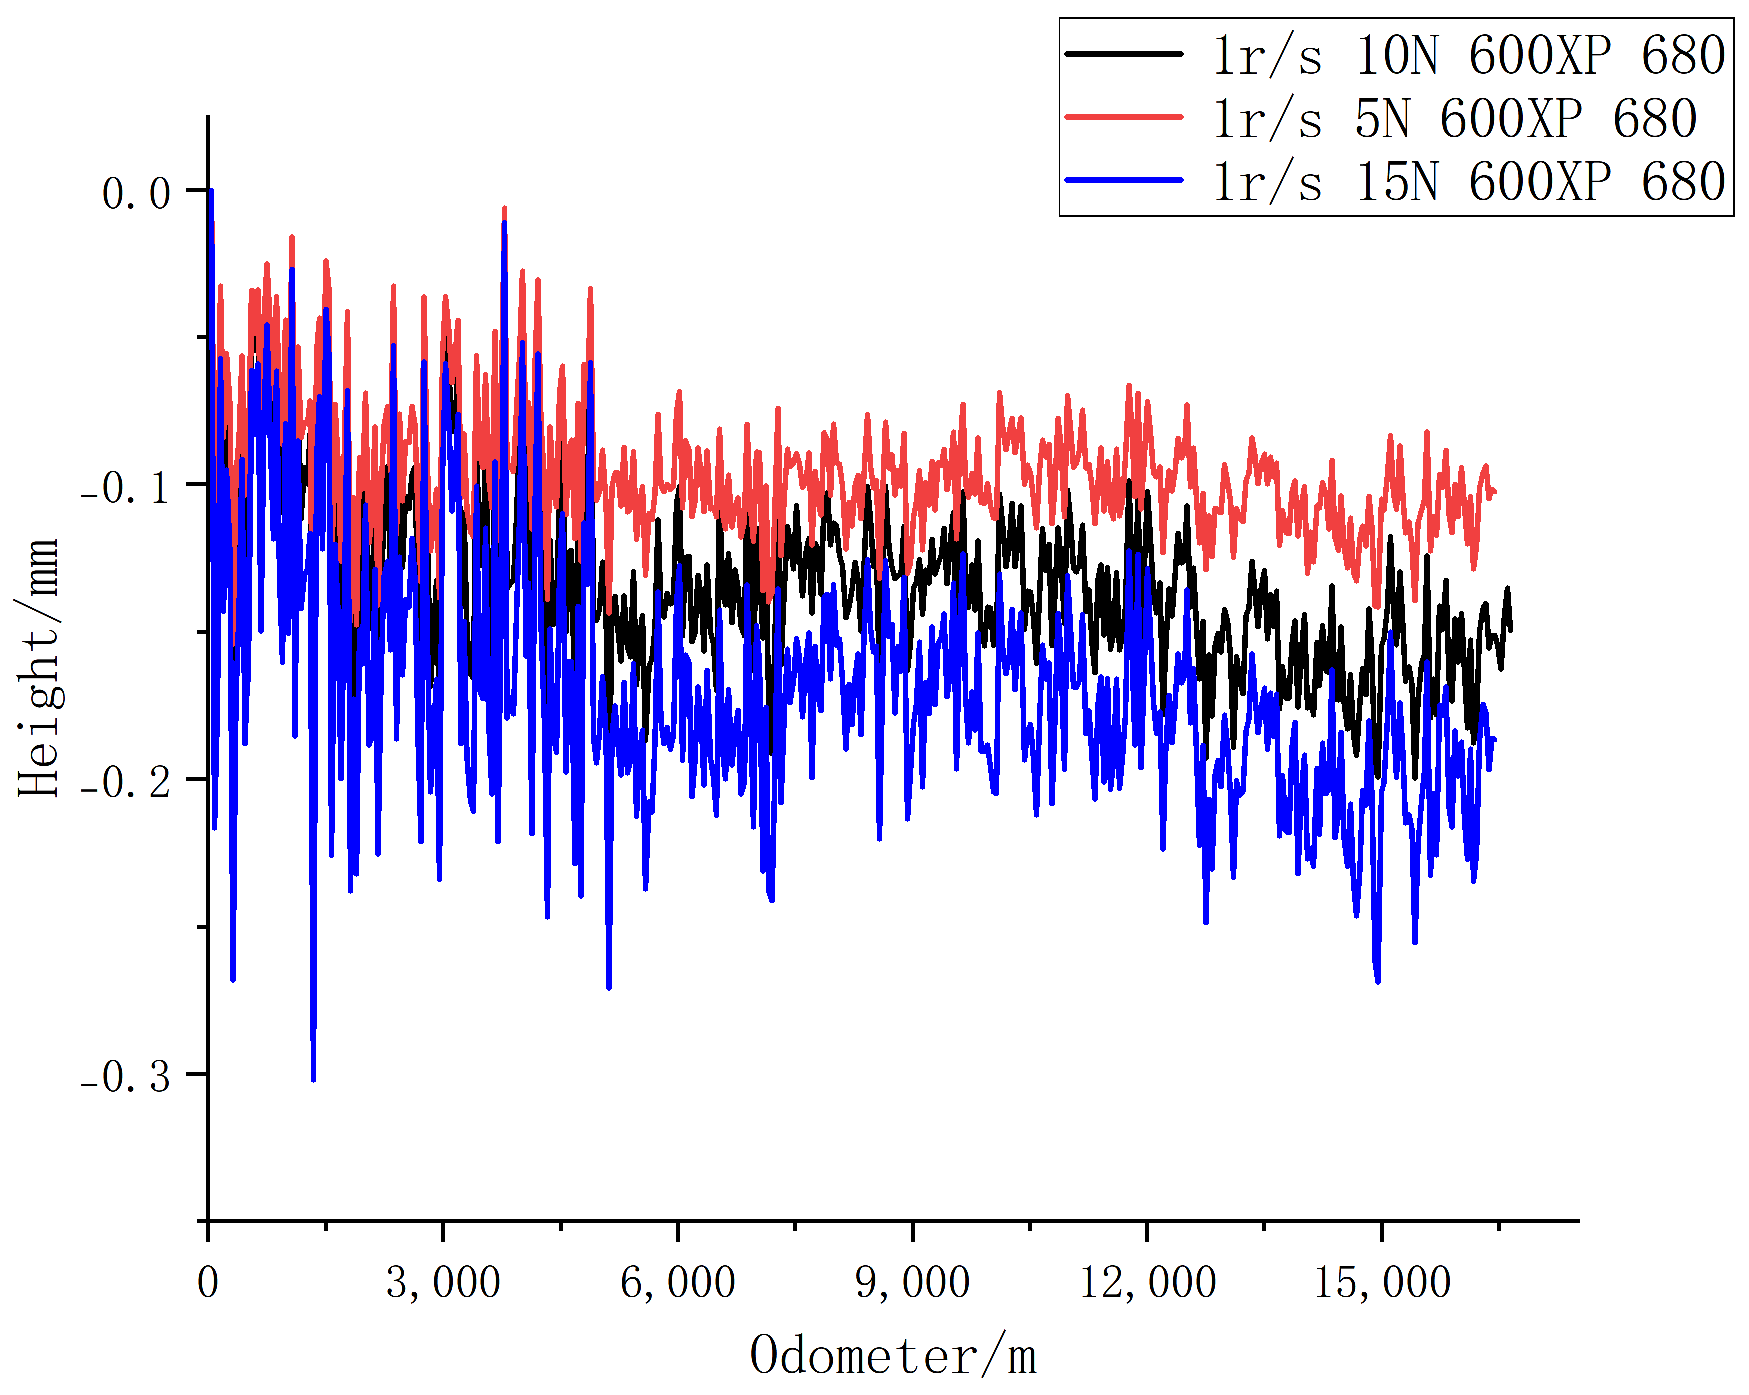
The three-speed wear comparison graphs are shown in Figure 35. The wear curves of three types of lubricating oils under different loads are shown in Table 4.
According to the comparison of three different load experiments, it can be seen that when light mineral oil, SAE5W-30 lubricant, and 600XP-680 lubricant oil are used as a lubricating medium in the half-wear stage, different loads are operated for the same time, and the higher the load, the higher the wear. When different loads are run for the same mileage, the greater the load, the greater the wear.
When light mineral oil, SAE 5W-30 lubricant, and 600XP-680 lubricant are used as a lubricant, and the rest of the conditions remain the same, the wear rate of the 5 N load is 0.731872 times the wear rate of the 10 N load, and the wear rate of the 15 N load is 1.294220 times the wear rate of the 10 N load when the workload is not rated (10 N). If the working load increases, the wear equation as a whole increases exponentially. If the working speed decreases, the wear equation as a whole decreases exponentially. We call this multiplicative relationship the load correction factor. The formula for calculating the load correction factor is obtained using quadratic interpolation, where k2 is the load correction factor and where f1 is the load (in N). The formula for calculating the load correction factor is as follows:
k 2 = 0.0005 f 1 2 + 0.0458 f 1 + 0.4898
The wear functions of light mineral oil, SAE 5W-30 lubricant, and 600XP-680 lubricant as lubricating media at different loads are shown in Table 5.
In summary, if the working speed is not the rated speed (0.0942 m/s) and the working load is not the rated load (10 N). We only need to find the speed correction coefficient and load correction coefficient by using the above equations. Then, multiply the speed correction coefficient and load correction coefficient by the wear equation at the same time to find the exact wear equation suitable for this operating condition. The wear functions of light mineral oil, SAE 5W-30 lubricant, and 600XP-680 lubricant as lubricating media at non-rated speed (0.0942 m/s) and non-rated load (10 N) are shown in Table 6.
Notes:
k 1 is the velocity correction factor, v1 is the linear velocity (unit: m/s)
k 2 is the load correction factor, f1 is the load (unit: N)
In the wear function in this section, x 1 is the distance traveled by the detector (in m), and y 1 , y 2 is the amount of wear on the detector arm (in mm).
3.3. Research on Wear Prediction Algorithm under Lubrication Conditions Based on Least Squares Support Vector Machine LS-SVM Approach

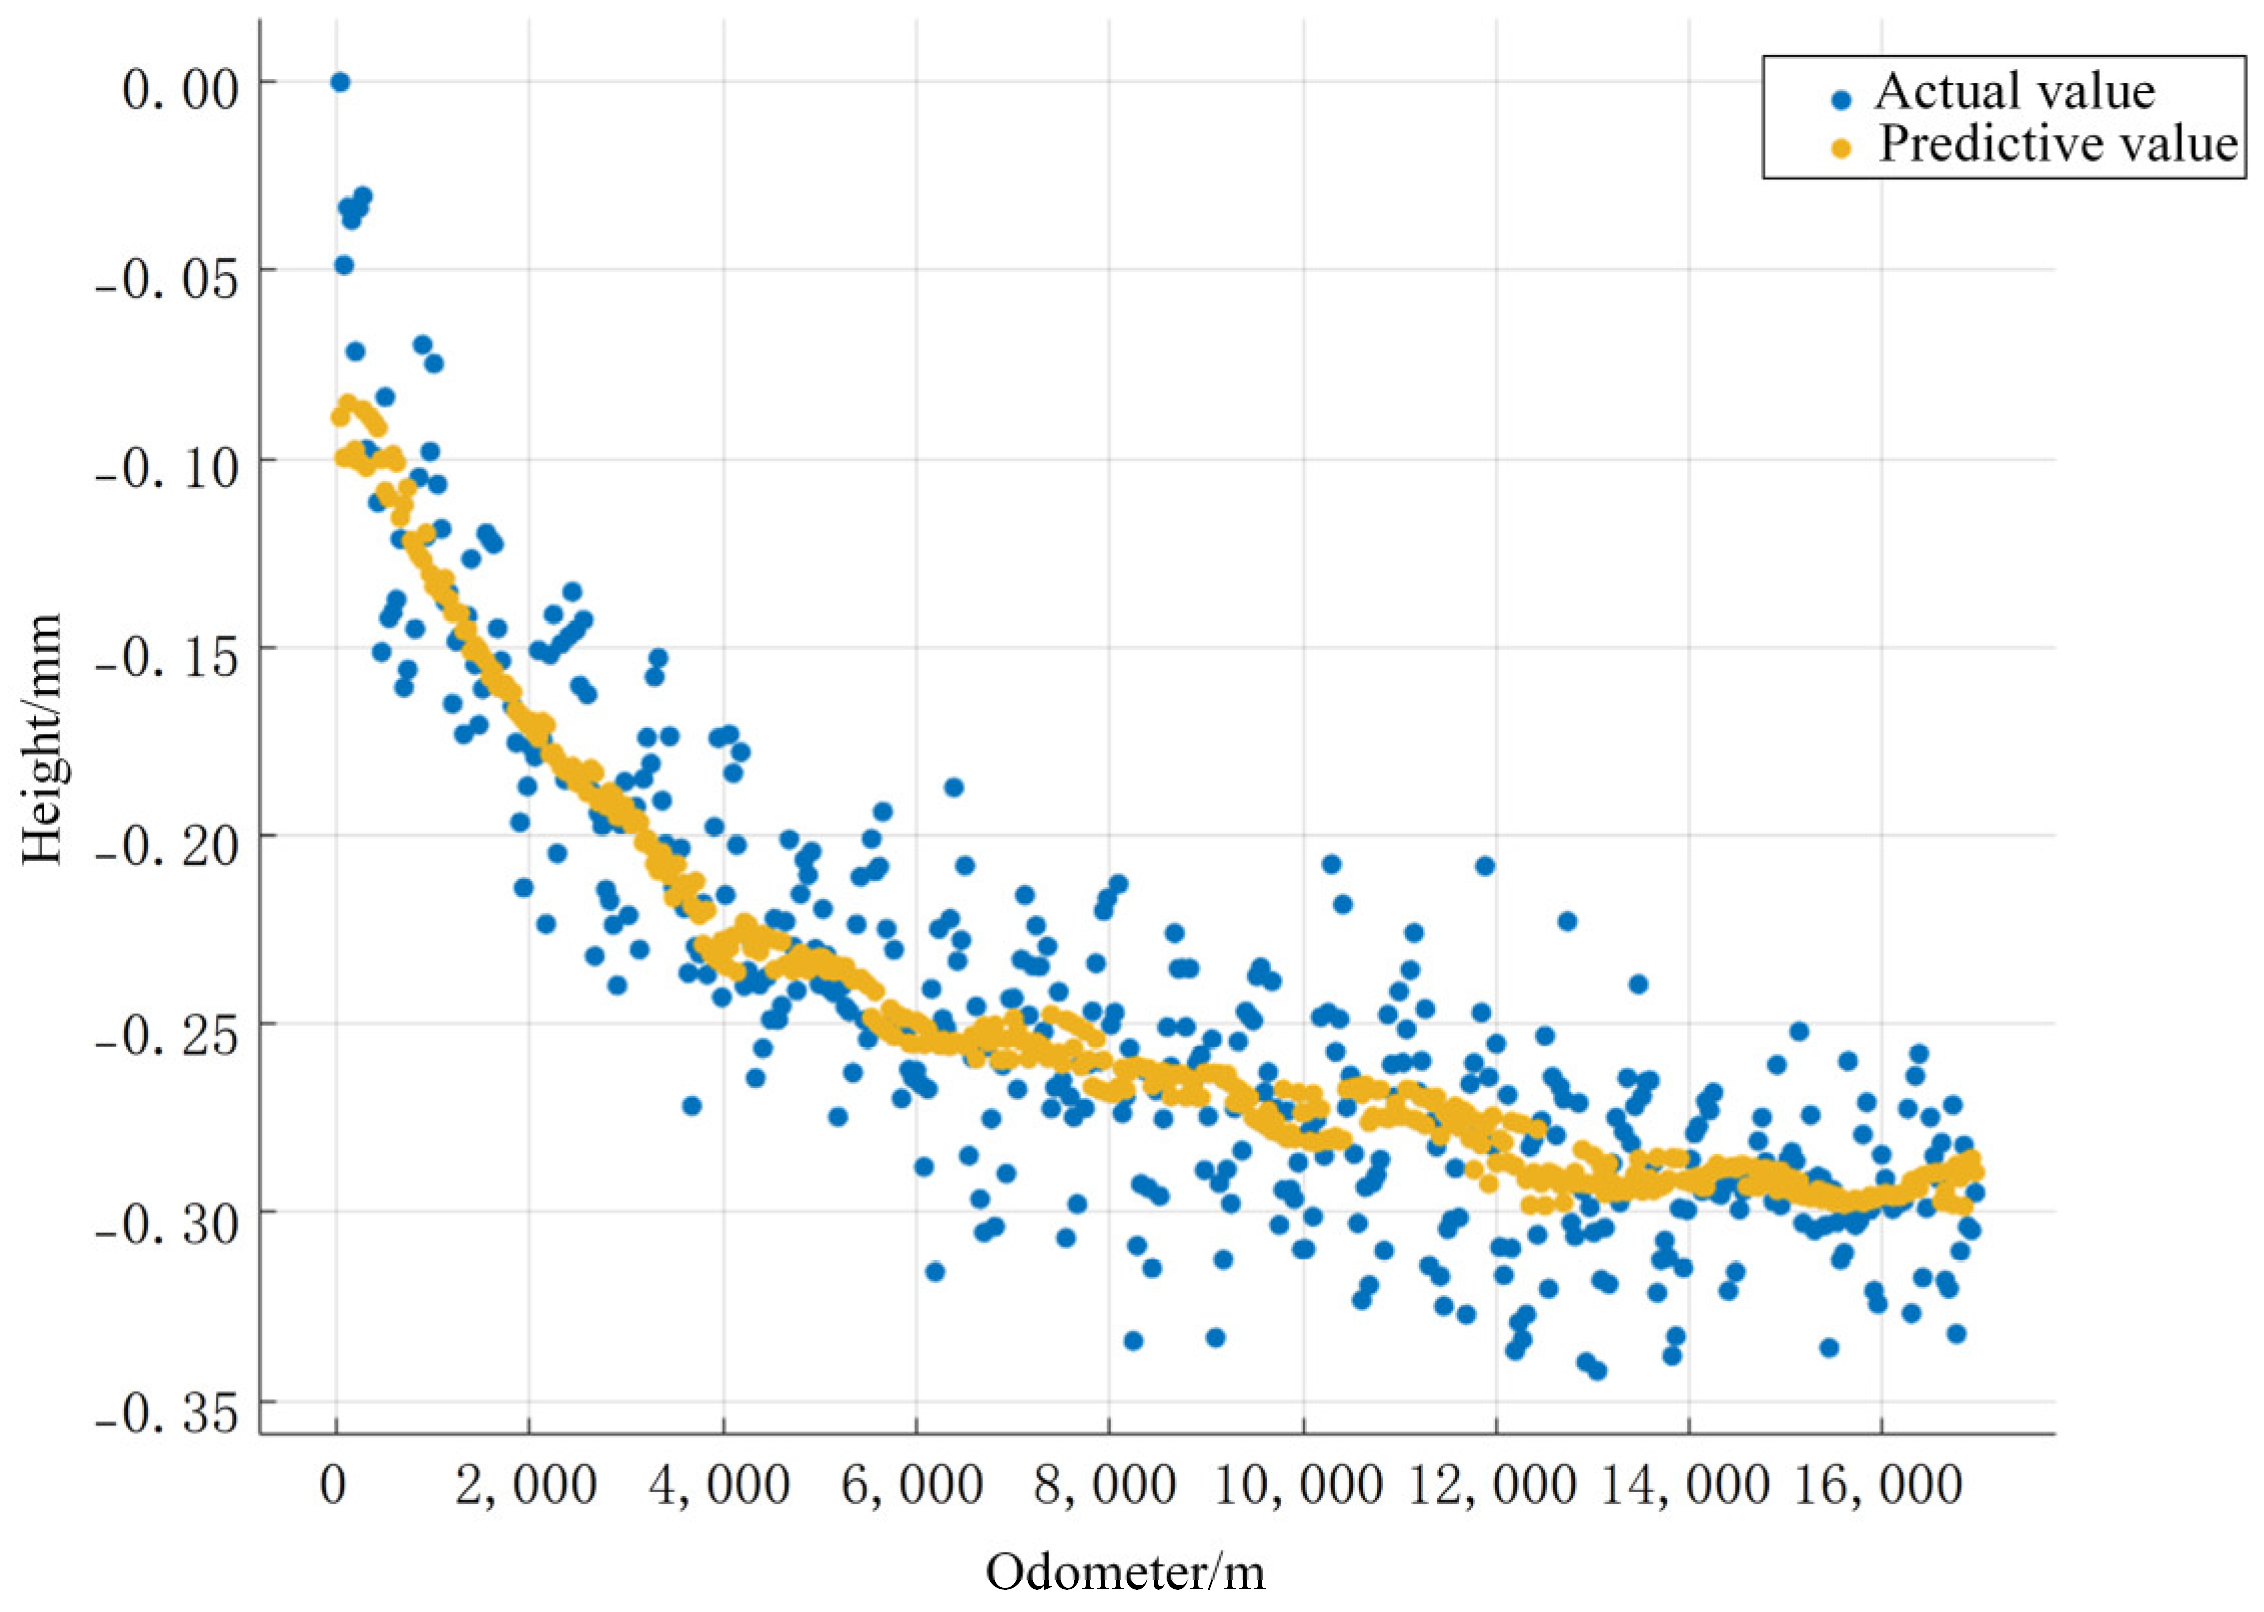
The LS-SVM algorithm was trained for regression prediction of wear under lubrication conditions, and the leaf spring wear under different speed and load conditions was predicted by the regression algorithm. The friction coefficient, motion speed, load size, and running distance are taken as input quantities, and the wear height h is the output quantity; the model training is carried out 24,000 times, and its error evaluation index is shown in Table 7.
Its training model curve is shown in Figure 36.
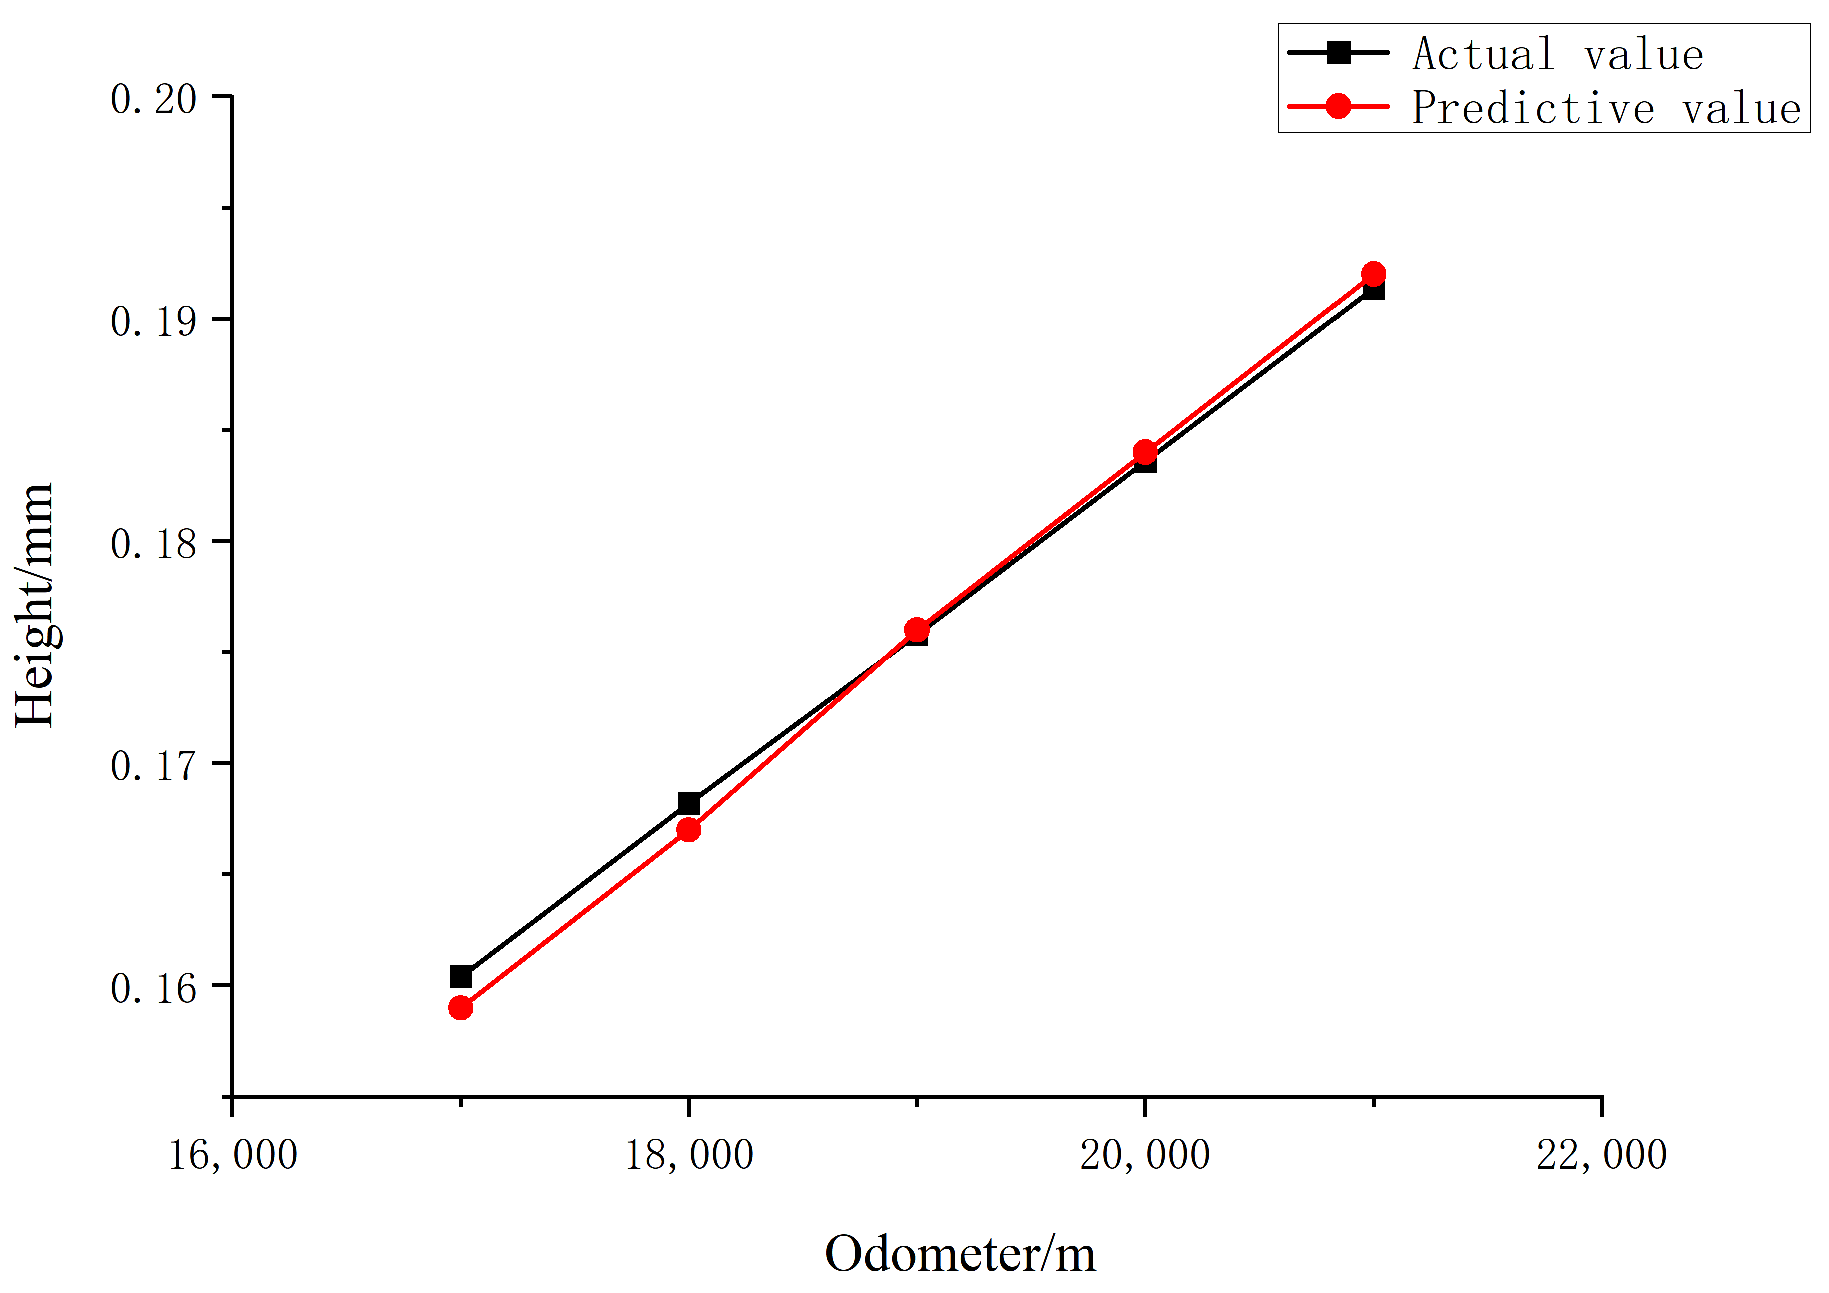
The prediction model predicts 17,000 m, 18,000 m, 19,000 m, 20,000 m, and 21,000 m of wear with 600XP 680 lubricant lubrication medium, 1 r/s speed, and a 10 N load, and compares it with the experimental data, as shown in Figure 37and Table 8.
As can be seen from the chart, the average error of prediction is 0.45%, which meets the requirement of prediction accuracy.

4. Conclusions

In this paper, wear experiments were carried out on leaf springs using a homemade wear detection system. The surface morphology of the wear cross-section of the pipe specimen without added lubricant medium was mapped using an optical interferometer. Adhesive wear, abrasion wear, and abrasive wear occur on the surface of the friction partner, and the wear surface is greatly affected by abrasive wear.
The coefficient of friction experiments revealed that SAE 5W-30 lubricants and 600XP 680 lubricants have similar friction coefficients; therefore, wear is generally similar and less than that of light mineral oils. Therefore, wear is directly proportional to the coefficient of friction.
When light mineral oil is used as the lubrication medium in the wear detection system to simulate the operating conditions of a finished oil, the wear portion of the friction surfaces is greatly reduced compared to dry friction in terms of adhesive and abrasive wear. However, abrasive wear is still present. Oil film lubrication, boundary lubrication, and mixed lubrication phases occur simultaneously on the friction surface, with the boundary lubrication phase being higher than the mixed lubrication phase.
When SAE 5W-30 lubricant is used as a lubricant in the wear detection system to simulate low viscosity crude oil conditions, the oil film of SAE 5W-30 lubricant adheres better to the metal and forms a thicker lubricant film that is not easily damaged compared to light mineral oils with a lower viscosity than light mineral oils. In the SAE5W-30 lubrication process, the proportion of boundary and mixed lubrication stages is lower, and the lubrication effect is better.
When 600XP 680 lubricant is used as a lubricant in the wear detection system to simulate the working conditions of high viscosity crude oil, the mixed lubrication stage, in which the oil film lubrication and the direct contact between the two metals coexist, is higher than the boundary lubrication stage due to the difficulty of lubricant film formation because of its high viscosity. The lubrication effect is lower than SAE 5W-30 lubricant and higher than light mineral oil.
In the leaf spring calipers in the test, the friction surface will appear simultaneously during the oil film lubrication stage, boundary lubrication stage, and mixed lubrication stage. The finished oil pipeline boundary lubrication stage accounted for the highest proportion because the boundary lubrication stage is the third lubrication stage of the largest wear stage, so in the finished oil pipeline working environment of the leaf spring caliper wear is highest. The proportion of oil film lubrication stage is highest in transporting low-viscosity crude oil pipelines. Because the lubrication effect of the oil film lubrication stage is the best, the wear degree of the leaf spring is the lowest in the working environment of low-viscosity crude oil pipelines. High-viscosity crude oil pipelines have the highest proportion of mixed lubrication stage due to the lubrication performance of mixed lubrication stage between the boundary lubrication stage and the oil film lubrication stage, so in the working environment of low-viscosity crude oil pipeline leaf spring caliper wear between the above-refined oil and low-viscosity crude oil.
According to the comparison of different speed experiments, light mineral oil, SAE5W-30 lubricant, and 600XP-680 lubricant as a lubricant medium, different speeds run the same mileage; the lower the speed, the greater the wear.
When light mineral oil, SAE5W-30 lubricant and 600XP-680 lubricant are used as lubricating media and the rest of the conditions remain unchanged, the wear rate of 2 r/s (0.1884 m/s) is 0.491328 times higher than that of 1 r/s (0.0942 m/s), and the wear rate of 0.5 r/s (0.0471 m/s) is 0.491328 times higher than that of 1 r/s (0.0942 m/s) wear velocity by 1.649410 times when the working speed is not the rated speed (0.0942 m/s). If the working speed increases, the wear equation as a whole decreases exponentially. If the operating speed decreases, the wear equation as a whole increases exponentially. We refer to this multiplicative relationship as the velocity correction factor. Use quadratic interpolation to find the formula for the velocity correction factor. According to the comparison of three different load experiments, it can be seen that when light mineral oil, SAE5W-30 lubricant, and 600XP-680 lubricant oil are used as a lubricating medium in the half-wear stage, different loads are operated for the same time, and the higher the load, the higher the wear. When different loads are run for the same mileage, the greater the load, the greater the wear.
When light mineral oil, SAE 5W-30 lubricant, and 600XP-680 lubricant are used as a lubricant, and the rest of the conditions remain the same, the wear rate of 5 N load is 0.731872 times the wear rate of the 10 N load, and the wear rate of 15 N load is 1.294220 times the wear rate of 10 N load when the workload is not rated (10 N). If the working load increases, the wear equation as a whole increases exponentially. If the working speed decreases, the wear equation as a whole decreases exponentially. We call this multiplicative relationship the load correction factor. The formula for calculating the load correction factor is obtained using quadratic interpolation.
If the working speed is not the rated speed (0.0942 m/s) and the working load is not the rated load (10 N), we simply use the above Equations to find the speed correction factor and the load correction factor. Then, multiply the speed correction coefficient and load correction coefficient by the wear equation to find the exact wear equation for this operating condition.
The LS-SVM algorithm was trained for wear regression prediction, and the wear of the leaf spring with 600XP 680 as the regression algorithm predicted the lubricating medium. The average prediction error is 0.45%, which meets the requirement of prediction accuracy.
In this paper, the accuracy and feasibility of the correction function are verified through the training of wear regression prediction. It effectively reduces the influence of the wear of the detection arm on the calculation of the inner diameter of the pipeline and improves the detection accuracy. This study can provide a reference for improving pipeline detection accuracy in the future. However, the scope of application of this study is limited: the material of the detector arm is G61500, the pre-pressure (load) in operation is limited to between 5 N and 20 N, and the operating speed of the detector is limited to between 0.0471 m/s and 0.1884 m/s. The viscosity of the medium in the pipeline was limited to 30.4 mm2/s to 680 mm2/s.

Author Contributions

Conceptualization, H.W.; methodology, H.W.; software, H.W. and L.D.; validation, H.W. and L.D.; data curation, H.W., L.D., C.Z., X.G. and J.Z.; writing—original draft preparation, H.W.; writing—review and editing, L.D. All authors have read and agreed to the published version of the manuscript.

Funding

This research received no external funding.

Data Availability Statement

Data are contained within the article.

Conflicts of Interest

The authors declare no conflicts of interest.

References

  1. Bęben, D.; Steliga, T. Monitoring and Preventing Failures of Transmission Pipelines at Oil and Natural Gas Plants. Energies 2023, 16, 6640. [Google Scholar] [CrossRef]
  2. Al-Sabaeei, A.M.; Alhussian, H.; Abdulkadir, S.J. Prediction of oil and gas pipeline failures through machine learning approaches: A systematic review. Energy Rep. 2023, 10, 1313–1338. [Google Scholar] [CrossRef]
  3. Melchers, R.E. Internal corrosion of seabed ‘parked’steel oil and gas pipelines. Ocean Eng. 2023, 276, 114145. [Google Scholar] [CrossRef]
  4. Katysheva, E. Analysis of the Interconnected Development Potential of the Oil, Gas and Transport Industries in the Russian Arctic. Energies 2023, 16, 3124. [Google Scholar] [CrossRef]
  5. Lin, A.J. Volatility Contagion from Bulk Shipping and Petrochemical Industries to Oil Futures Market during the Economic Uncertainty. Mathematics 2023, 11, 3737. [Google Scholar] [CrossRef]
  6. Haavik, T.K.; Kongsvik, T.; Vigen, M. Risk in transit: A case study of the introduction of a new risk definition for risk management in the Norwegian petroleum industry. J. Risk Res. 2023, 29, 1244–1262. [Google Scholar] [CrossRef]
  7. Jia, H.; Adland, R.; Wang, Y. Global Oil Export Destination Prediction: A Machine Learning Approach. Energy J. 2021, 42, 111. [Google Scholar] [CrossRef]
  8. Azzam, M.; Khalifa, W. Investigation of subsea oil pipeline rupture. Eng. Fail. Anal. 2023, 152, 107415. [Google Scholar] [CrossRef]
  9. Velázquez, J.C.; Hernández-Sánchez, E.; Terán, G. Probabilistic and statistical techniques to study the impact of localized corrosion defects in oil and gas pipelines: A review. Metals 2022, 12, 576. [Google Scholar] [CrossRef]
  10. Xi, Y.; Li, Y.; Yao, Y. Identification and Analysis of Corrosion Mechanisms for Ground Pipelines with Hanging Rings. Coatings 2022, 12, 1257. [Google Scholar] [CrossRef]
  11. Dao, U.; Yarveisy, R.; Anwar, S. A Bayesian approach to assess under-deposit corrosion in oil and gas pipelines. In Process Safety and Environmental Protection; Elsevier: Amsterdam, The Netherlands, 2023. [Google Scholar]
  12. Wait, A.D.; Tuit, C.B.; Maney, J.P. Forensic sampling practices for oil spills in the marine environment. Environ. Forensics 2020, 21, 310–318. [Google Scholar] [CrossRef]
  13. Yim, U.H.; Khim, J.S.; Kim, M. Environmental impacts and recovery after the Hebei Spirit oil spill in Korea. Arch. Environ. Contam. Toxicol. 2017, 73, 47–54. [Google Scholar] [CrossRef] [PubMed]
  14. Jiang, A.; Han, L.; Wang, C. Migration Movements of Accidentally Spilled Oil in Environmental Waters: A Review. Water 2023, 15, 4092. [Google Scholar] [CrossRef]
  15. Li, R.; Chen, P.; Huang, J. Research on Internal Shape Anomaly Inspection Technology for Pipeline Girth Welds Based on Alternating Excitation Detection. Sensors 2023, 23, 7519. [Google Scholar] [CrossRef]
  16. Hopkins, P.; Tyne, N.U.; Palmer, A. Pipeline Internal Inspection—What a Pipeline Operator Needs to Know. Available online: https://www.penspen.com/wp-content/uploads/2014/09/pipeline-internal-inspection.pdf (accessed on 10 August 2015).
  17. Dai, L.; Zhang, S.; Zhu, X. Research development of pipeline caliper tool technology. Oil Gas Storage Transp. 2012, 31, 808–813. [Google Scholar]
  18. Xiaoxiao, Z.; Quan, J.; Xiaolong, L.; Shimin, Z.; Shuhai, L. Experimental research on the precision of wheeled caliper arm for measuring pipeline deformation. Measurement 2018, 127, 15–20. [Google Scholar]
  19. Lyashenko, I.A.; Popov, V.L. The influence of adhesion on rolling and sliding friction: An experiment. Technol. Phys. 2022, 67, 203–214. [Google Scholar] [CrossRef]
  20. Chen, T.; Wei, P.; Zhu, C. Experimental Investigation of Gear Scuffing for Various Tooth Surface Treatments. Tribol. Trans. 2023, 66, 35–46. [Google Scholar] [CrossRef]
  21. Zang, X.; Xu, Z.D.; Lu, H. Ultrasonic guided wave techniques and applications in pipeline defect detection: A review. Int. J. Press. Vessel. Pip. 2023, 206, 105033. [Google Scholar] [CrossRef]
  22. Nguyen, T.T.; Kim, D.K.; Rho, Y.W.; Kim, S.B. Dynamic modeling and its analysis for PIG flow through curved section in natural gas pipeline. In Proceedings of the IEEE International Symposium on Computational Intelligence in Robotics & Automation, Banff, AB, Canada, 29 July–1 August 2001. [Google Scholar]
  23. Saeidbakhsh, M.; Rafeeyan, M.; Ziaei-Rad, S. Dynamic analysis of small pigs in space pipelines. Oil Gas Sci. Technol. 2009, 64, 155–164. [Google Scholar] [CrossRef]
  24. Canavese, G.; Scaltrito, L.; Ferrero, S.; Pirri, C.F.; Cocuzza, M.; Pirola, M.; Corbellini, S.; Ghione, G.; Ramella, C.; Verga, F.; et al. A novel smart caliper foam pig for low-cost pipeline inspection-part a: Design and laboratory characterization. J. Pet. Sci. Eng. 2015, 127, 311–317. [Google Scholar] [CrossRef]
  25. Wang, H.; Zhu, X.; Fang, Y.; Zhang, H.; Zhang, S. Study on the detection arm accuracy of a leaf spring caliper for detecting internal convex defects in gas pipelines. Meas. Sci. Technol. 2018, 29, 085901. [Google Scholar] [CrossRef]
  26. Madsen, N.D.; Hausladen, M.; Chiriaev, S. Titanium nitride as a strain gauge material. J. Microelectromech. Syst. 2016, 25, 683–690. [Google Scholar] [CrossRef]
  27. Zhang, H.; Wu, X.; Wang, W. Effect of fluid pressure on adhesive wear of spherical contact. Tribol. Int. 2023, 187, 108723. [Google Scholar] [CrossRef]
  28. Pham-Ba, S.; Molinari, J.F. Role of minimum adhesive wear particle size in third-body layer properties. arXiv 2023, arXiv:2304.14783. [Google Scholar] [CrossRef]
  29. Ma, Z.; Huang, R.; Yuan, X. Tribological performance and scuffing behaviors of several automobile piston rings mating with chrome-plated cylinder liner. Friction 2022, 10, 1245–1257. [Google Scholar] [CrossRef]
  30. Wang, Y.; Song, C.; Song, R. Size Effect of Impact Abrasive Particles on Wear and Surface Hardening Behavior of High-Manganese Steel. Acta Metall. Sin. (Engl. Lett.) 2023, 36, 906–916. [Google Scholar] [CrossRef]
  31. Stephan, S.; Schmitt, S.; Hasse, H. Molecular dynamics simulation of the Stribeck curve: Boundary lubrication, mixed lubrication, and hydrodynamic lubrication on the atomistic level. Friction 2023, 11, 2342–2366. [Google Scholar] [CrossRef]
  32. Lee, K.; Park, J.; Lee, J. An enhanced boundary lubrication friction model for sheet metal forming. Int. J. Mech. Sci. 2023, 260, 108652. [Google Scholar] [CrossRef]
  33. Lijesh, K.P.; Khonsari, M.M. On the degradation of tribo-components in boundary and mixed lubrication regimes. Tribol. Lett. 2019, 67, 12. [Google Scholar] [CrossRef]
  34. Wróblewski, P. The theory of the surface wettability angle in the formation of an oil film in internal combustion piston engines. Materials 2023, 16, 4092. [Google Scholar] [CrossRef] [PubMed]
Figure 1. Schematic diagram of the leaf spring caliper [25].
Lubricants 12 00041 g001
Figure 2. Wear model of the detection arm. (a) Model when the detection arm is not worn; (b) model when the detection arm is worn, and the contact point becomes a contact surface; (c) model with continuous wear of the detector arm, where the wear thickness is equal to the thickness of the detector arm.
Lubricants 12 00041 g002
Figure 3. Wear test system of the detection arm.
Lubricants 12 00041 g003
Figure 4. Test the friction coefficient between the leaf spring sample and the pipe sample without lubrication.
Lubricants 12 00041 g004
Figure 5. Physical drawing of wear test.
Lubricants 12 00041 g005
Figure 6. Physical diagram of wear of leaf spring sample.
Lubricants 12 00041 g006
Figure 7. Optical microscope observation. (a) A picture of the worn area of the leaf spring under a light microscope. (b) A magnified optical microscope image of the wear area of the leaf spring, which has three different surface morphologies. They can be classified as: adherent wear area, abrasive wear area and abrasive grain wear area.
Lubricants 12 00041 g007
Figure 8. Fitting diagram of surface roughness of wear surface of leaf spring sample. (a) Image of checking the roughness of the worn surface for an optical interferometer. (b) Image of inspecting the roughness of the worn surface using an enlarged optical interferometer.
Lubricants 12 00041 g008
Figure 9. Height curve of section K.
Lubricants 12 00041 g009
Figure 10. Height wear curve of leaf spring sample.
Lubricants 12 00041 g010
Figure 11. Test of the friction coefficient of the leaf spring and pipeline samples in light mineral oil.
Lubricants 12 00041 g011
Figure 12. Physical picture of leaf spring sample wear under light mineral oil lubrication.
Lubricants 12 00041 g012
Figure 13. Optical microscope observation under light mineral oil lubrication.
Lubricants 12 00041 g013
Figure 14. Height wear curve of leaf spring sample under light mineral oil lubrication.
Lubricants 12 00041 g014
Figure 15. Test the friction coefficient of the leaf spring sample and the pipe sample under the lubrication oil medium OF SAE5W-30.
Lubricants 12 00041 g015
Figure 16. Physical picture of wear of leaf spring sample under the lubricating medium of SAE5W-30 lubricating oil.
Lubricants 12 00041 g016
Figure 17. Optical microscope observation of SAE5W-30 lubricating oil under lubricating medium.
Lubricants 12 00041 g017
Figure 18. Height wear curve of leaf spring sample under LUBRICATING medium SAE5W-30.
Lubricants 12 00041 g018
Figure 19. Test of the friction coefficient between the leaf spring sample and the pipe sample under 600XP 680 lubricating oil medium.
Lubricants 12 00041 g019
Figure 20. 600XP 680 lubricants under the lubrication medium leaf spring sample wear physical diagram.
Lubricants 12 00041 g020
Figure 21. 600XP 680 optical microscope observation under lubricating medium.
Lubricants 12 00041 g021
Figure 22. 600XP 680 lubrication medium leaf spring sample height wear curve.
Lubricants 12 00041 g022
Figure 23. Height wear curves of leaf spring samples under three lubricating media.
Lubricants 12 00041 g023
Figure 24. Wear curves of leaf springs at speeds of 0.5 r/s and 2 r/s. (a) Wear the curve of the leaf spring using light mineral oil as a medium at 0.5 r/s. (b) Wear the curve of the leaf spring using light mineral oil as a medium at 2 r/s.
Lubricants 12 00041 g024
Figure 25. Comparison diagram of wear curves at different speeds.
Lubricants 12 00041 g025
Figure 26. Wear curves of leaf springs at speeds of 0.5 r/s and 2 r/s. (a) Wear the curve of the leaf spring using SAE5W-30 lubricant as a medium at 0.5 r/s. (b) Wear the curve of the leaf spring using SAE5W-30 lubricant as a medium at 2 r/s.
Lubricants 12 00041 g026
Figure 27. Comparison diagram of wear curves at different speeds.
Lubricants 12 00041 g027
Figure 28. Wear curves of leaf springs at speeds of 0.5 r/s and 2 r/s. (a) Wear the curve of the leaf spring using 600XP-680 lubricant as a medium at 0.5 r/s. (b) Wear the curve of the leaf spring using 600XP-680 lubricant as a medium at 2 r/s.
Lubricants 12 00041 g028
Figure 29. Comparison diagram of wear curves at different speeds.
Lubricants 12 00041 g029
Figure 30. Wear curves of leaf spring for loads of 5 N and 15 N. (a) Wear curve of leaf spring under a load of 5 N using lightweight mineral oil as the medium. (b) Wear curve of leaf spring under a load of 15 N using lightweight mineral oil as the medium.
Lubricants 12 00041 g030
Figure 31. Comparison diagram of wear curves under different loads.
Lubricants 12 00041 g031
Figure 32. Wear curves of leaf spring for loads of 5 N and 15 N. (a) Wear curve of leaf spring under a load of 5 N using SAE5W-30 lubricant as the medium. (b) Wear curve of leaf spring under a load of 15 N using SAE5W-30 lubricant as the medium.
Lubricants 12 00041 g032
Figure 33. Comparison diagram of wear curves under different loads.
Lubricants 12 00041 g033
Figure 34. Wear curves of leaf spring for loads of 5 N and 15 N. (a) Wear curve of leaf spring under a load of 5 N using 600XP-680 lubricant as the medium. (b) Wear curve of leaf spring under a load of 15 N using 600XP-680 lubricant as the medium.
Lubricants 12 00041 g034
Figure 35. Comparison diagram of wear curves under different loads.
Lubricants 12 00041 g035
Figure 36. Wear prediction model curves under different lubrication conditions.
Lubricants 12 00041 g036
Figure 37. Comparison of experimental wear value and algorithm predicted value under 1 r/s speed 10 N load 600XP 680 lubrication conditions.
Lubricants 12 00041 g037
Table 1. Wear test table.
Serial NumberVelocity (r/s)Load (N)Lubricating MediumRun Time (h)
1110not50
2110light mineral oil50
3110SAE 5W-30 lubricant50
4110600 XP 680 lubricant50
50.510light mineral oil100
60.510SAE 5W-30 lubricant100
70.510600 XP 680 lubricant100
8210light mineral oil25
9210SAE 5W-30 lubricant25
10210600 XP 680 lubricant25
1115light mineral oil50
1215SAE 5W-30 lubricant50
1315600 XP 680 lubricant50
14115light mineral oil50
15115SAE 5W-30 lubricant50
16115600 XP 680 lubricant50
Table 2. Wear equations for different lubricants at different speeds.
Serial NumberVelocity (r/s)Load (N)Lubricating MediumRun Time (h)Wear Function
1110light mineral oil50 y 1 = 1.1 × 1 0 9 x 1 2 3.6 × 1 0 5 x 1
20.510light mineral oil100   y 1 = 1.8 × 1 0 9 x 1 2 5.9 × 1 0 5 x 1
3210light mineral oil25 y 1 = 0.54 × 1 0 9 x 1 2 1.8 × 1 0 5 x 1
4110SAE 5W-30 lubricant50 y 1 = 6.2 × 1 0 10 x 1 2 1.8 × 1 0 5 x 1
50.510SAE 5W-30 lubricant100 y 1 = 10.2 × 1 0 10 x 1 2 3.0 × 1 0 5 x 1
6210SAE 5W-30 lubricant25 y 1 = 3.0 × 1 0 10 x 1 2 0.88 × 1 0 5 x 1
7110600 XP 680 lubricant50 y 1 = 9.2 × 1 0 11 x 1 2 1.1 × 1 0 5 x 1
80.510600 XP 680 lubricant100 y 1 = 15.2 × 1 0 11 x 1 2 1.81 × 1 0 5 x 1
9210600 XP 680 lubricant25 y 1 = 4.5 × 1 0 11 x 1 2 0.54 × 1 0 5 x 1
Table 3. Wear functions for different lubricants at different speeds.
Serial NumberLubricating MediumWear Function
1light mineral oil y 1 = k 1 × 1.1 × 1 0 9 x 1 2 3.6 × 1 0 5 x 1
2SAE 5W-30 lubricant y 1 = k 1 × 6.2 × 1 0 10 x 1 2 1.8 × 1 0 5 x 1
3600 XP 680 lubricant y 1 = k 1 × 9.2 × 1 0 11 x 1 2 1.1 × 1 0 5 x 1
Table 4. Wear equations for different lubricants under different loads.
Serial NumberVelocity (r/s)Load (N)Lubricating MediumRun Time (h)Wear Function
1110light mineral oil50 y 1 = 1.1 × 1 0 9 x 1 2 3.6 × 1 0 5 x 1
215light mineral oil50 y 1 = 0.81 × 1 0 9 x 1 2 2.6 × 1 0 5 x 1
3115light mineral oil50 y 1 = 1.4 × 1 0 9 x 1 2 4.7 × 1 0 5 x 1
4110SAE 5W-30 lubricant50 y 1 = 6.2 × 1 0 10 x 1 2 1.8 × 1 0 5 x 1
515SAE 5W-30 lubricant50 y 1 = 4.5 × 1 0 10 x 1 2 1.3 × 1 0 5 x 1
6115SAE 5W-30 lubricant50 y 1 = 8.0 × 1 0 10 x 1 2 2.3 × 1 0 5 x 1
7110600 XP 680 lubricant50 y 1 = 9.2 × 1 0 11 x 1 2 1.1 × 1 0 5 x 1
815600 XP 680 lubricant50 y 1 = 6.7 × 1 0 11 x 1 2 0.81 × 1 0 5 x 1
9115600 XP 680 lubricant50 y 1 = 11.9 × 1 0 11 x 1 2 1.4 × 1 0 5 x 1
Table 5. Wear function of different lubricants at different loads.
Serial NumberLubricating MediumWear Function
1light mineral oil y 1 = k 2 × 1.1 × 1 0 9 x 1 2 3.6 × 1 0 5 x 1
2SAE 5W-30 lubricant y 1 = k 2 × 6.2 × 1 0 10 x 1 2 1.8 × 1 0 5 x 1
3600 XP 680 lubricant y 1 = k 2 × 9.2 × 1 0 11 x 1 2 1.1 × 1 0 5 x 1
Table 6. Wear function.
Serial NumberPending ProjectsFunction
1Speed correction system k 1 = 59.3630 v 1 2 22.1759 v 1 + 2.5622
2Load correction system k 2 = 0.0005 f 1 2 + 0.0458 f 1 + 0.4898
3light mineral oil y 1 = k 1 × k 2 × 1.1 × 1 0 9 x 1 2 3.6 × 1 0 5 x 1
4SAE 5W-30 lubricant y 1 = k 1 × k 2 × 6.2 × 1 0 10 x 1 2 1.8 × 1 0 5 x 1
5600 XP 680 lubricant y 1 = k 1 × k 2 × 9.2 × 1 0 11 x 1 2 1.1 × 1 0 5 x 1
Table 7. Evaluation index of wear prediction error.
AlgorithmMAERMSEMSER2
Wear prediction0.0220.0270.00080.8
Table 8. Comparison of experimental wear values and algorithm predicted values under 1 r/s speed 10 N load 600XP 680 lubrication conditions.
Running Distance (m)Wear Height (mm)Predicted Height (mm)Error
17,0000.1600.1590.87%
18,0000.1680.1670.71%
19,0000.1760.1760.12%
20,0000.1840.1840.23%
21,0000.1910.1920.33%
Disclaimer/Publisher’s Note: The statements, opinions and data contained in all publications are solely those of the individual author(s) and contributor(s) and not of MDPI and/or the editor(s). MDPI and/or the editor(s) disclaim responsibility for any injury to people or property resulting from any ideas, methods, instructions or products referred to in the content.