1. Introduction
Tribological performance, the study of friction, wear, and lubrication, is a critical factor in the efficiency and longevity of mechanical systems. In industrial applications, poor tribological performance can lead to increased energy consumption, reduced durability, and higher maintenance costs [
1]. It is estimated that friction and wear-related problems account for nearly 25% of the world’s energy consumption, with significant potential for improvement if effective strategies are implemented. Enhancing tribological properties, such as reducing friction and wear, can significantly improve the performance of components in high-demand sectors like automotive and manufacturing, contributing to energy efficiency and prolonged service life.
Surface texturing—one of the most promising approaches to achieve a better tribological performance—electively introduces micro- and nano-patterns to surfaces to control friction and increase wear resistance. The texturing of surfaces by femtosecond lasers has been established as a very important technique because it paves the way for controlled possible textures capable of improving surface interactions [
2]. Textured surfaces can act as micro-bearings, storage reservoirs for lubrication, and wear debris traps, lowering friction and improving surface durability. These features are important in applications requiring near-perfect accuracy, minimal wear, lubrication, and optimization of components to provide effective performance. However, optimizing laser parameters to achieve the texturing process still relies heavily on trial-and-error assessments, creating an opportunity for prediction tools such as machine learning that could speed up the process [
3].
Different investigations have exemplified the impact of the laser parameters on surface texture outcomes. Benton et al. [
4] demonstrated that one could control the groove depth through the laser power and scanning speed. At the same time, Campanelli et al. [
5] studied the influence of laser power, scanning speed, and frequency on surface roughness. Desai and Shaikh [
6] explored ML-based predictive capabilities, such as Multi-Gene Genetic Programming and ANN, where the latter showed that using these models could reduce trial and error methodology in tests for texture depth. However, notwithstanding these advancements, currently, a majority of investigations hinge on empirical models or perusal of specific parameter sets, with scant comparisons between machine-learning models for optimizing LST.
There are several critical gaps in the existing literature. First, most studies focus on optimizing a narrow set of laser parameters without exploring the broader applicability of machine learning across diverse parameter combinations. Second, while machine learning offers powerful predictive capabilities, limited research compares different models—such as decision trees (dT), support vector machines (SVM), and ANN—to identify the most suitable for LST prediction tasks. Finally, the complexity of machine learning models, which often requires expert knowledge in data preprocessing and model tuning, poses a significant barrier to their adoption in impractical industrial settings.
This study proposes to bridge these gaps using a detailed comparative evaluation of three models of machine learning, namely Decision Trees, SVM, and ANN, for the prediction of femtosecond laser surface texturing parameters. In contrast to previous works that are specific to certain setups, this work describes comparative studies of models with varying ranges of parameters to determine the best-suited one for surface texture prognostication. To improve the clarity and applicability of the research, we introduce a two-stage modeling approach. In the first stage, machining parameters (such as pulse energy, scanning speed, and repetition rate) are used to determine the surface layer characteristics, including groove depth, alignment, and geometric structure. In the second stage, these surface parameters, along with material properties, are modeled to predict the tribological properties, including the coefficient of friction and wear rate. This two-stage approach not only enhances the understanding of the machining process but also extends the applicability of this research to other engineering fields.
Machine learning models such as artificial neural networks (ANN) and genetic algorithms (GA) effectively address the intricate nonlinear relationships between laser process parameters and surface characteristics. Their ability to model complex input-output interactions surpasses traditional methods. Furthermore, inverse modeling using GA allows precise prediction of the laser parameters required to achieve specific surface properties, effectively bridging critical gaps in process optimization. Besides that, the work adds to the literature by proposing a very practical framework that aids the application of machine learning in laser surface texturing. Thus, these tools become available to non-expert users in the industrial environment.
2. Background
The last few decades have witnessed the remarkable evolution of surface texturing via an incessant search for enhancing tribological performance by reducing friction and wear while boosting lubrication in industrial applications [
7,
8,
9,
10,
11,
12,
13,
14,
15,
16,
17]. This section surveys surface texturing technologies, discusses the importance of laser surface texturing, and showcases some emerging roles for ML in optimizing texturing processes. It also outlines the key research gaps and how this study fills them.
2.1. Advances in Surface Texturing Technologies
Surface texturing modifies surface topography to create micro- and nano-scale features that improve interactions between contacting surfaces. These textures enhance tribological performance by enabling functions such as lubricant retention and wear debris confinement. Increasingly used in industries like automotive and aerospace, texturing boosts efficiency, lifespan, and reliability. While traditional methods lack precision, femtosecond laser surface texturing (LST) offers superior control, high precision, minimal thermal damage, and eliminates the need for post-processing [
14,
15,
16,
17,
18].
Nevertheless, it remains a challenge to optimally select laser parameters like pulse energy, scanning speed, and pulse frequency. Researchers like Benton et al. [
4] have demonstrated that modulation of laser power and scanning velocity could directly influence the depth and width of grooves formed on surfaces. The other works included those by Campanelli et al. [
5], who investigated the different effects of different parameters on surface roughness and shape of textures on titanium alloys, again illustrating the highly significant impact of selection on the efficient interplay of parameters. Furthermore, Majumdar et al. [
19] based their works on laser surface texturing of stainless steels, establishing that the pulse duration and laser fluence determined surface hydrophobicity, which is connected to texture uniformity and feature dimensions. Another work, by Zhang et al. [
11], simultaneously brings the influence of laser pulse repetition rate and beam overlap on the efficiency of surface texturing and tribological performance in metals and ceramics to the light. Their observations indicate that tuning such parameters might improve wear resistance and reduce friction, which is fundamentally important for aerospace and oil and gas applications. In addition, Yang et al. [
12] considered how the various types of laser pulse width affected the structure formation. They showed that different levels of microcrack formation and thermal distortions occur depending on the interaction between laser pulse width and the material response.
Although there are advancements, the use of LST in an industrial context fluctuates due to time and inefficiency, especially in the traditional method of trial and error in parameter selection. The complexity of interactions among parameters often necessitates extensive experimental runs to yield the desired outcomes. This creates the demand for predictive models, such as machine learning, to help achieve efficient and dependable parameter optimization.
2.2. Importance of Laser Surface Texturing
Laser surface texturing (LST) is preferred for its precision and flexibility in creating micro- and nano-scale textures. Femtosecond LST uses ultra-short laser pulses with minimal heat diffusion, reducing friction and wear in tribological systems. Textured surfaces act as hydrodynamic bearings, prevent surface contact, and serve as lubricant reservoirs, making them vital for applications like automotive engines and medical implants [
8,
12].
Several studies have demonstrated the effectiveness of LST in improving tribological performance. Pou-Álvarez [
8] investigated how varying the pulse length in laser texturing can influence surface topography and corrosion resistance, concluding that shorter pulses tend to produce finer surface features, enhancing certain coatings’ protective properties. Ezhilmaran et al. [
7] explored how different laser wavelengths affect the morphology of textured dimples, revealing that specific wavelengths optimize dimple formation, leading to better lubricant film distribution and a notable reduction in friction. Similarly, Wang et al. [
10] examined the effects of laser pulse energy and frequency on the wear resistance of steel surfaces, showing that finely textured surfaces produced through controlled laser parameters can significantly improve wear performance under high-load conditions. Zhang et al. [
20] studied laser surface texturing for biomedical applications and discovered that the interaction of laser parameters, such as scanning speed and energy density, can influence cell adhesion properties, making it a valuable technique for medical implant surfaces. In the automotive industry, Mishra et al. [
21] focused on optimizing laser parameters to improve the durability of engine components, finding that laser texturing could enhance oil retention and reduce component wear.
Nonetheless, the key challenge remains determining for each substrate/application the best combination of laser parameters. The choice of these parameters determines whether a costly and time-consuming development effort will be required to establish them. For instance, Xie et al. [
22] indicated that laser surface texturing could improve the tribological properties of ceramics; however, this has not made a large development breakthrough because parameter optimization is still not systematic, and variable performance across batches of material often arises. This substantiates that it may well benefit from integrated approaches, including simulation or machine learning, as such approaches would streamline the procedure of parameter selection and decrease dependency on trial-and-error experimentations.
2.3. Application of Machine Learning in Laser Surface Texturing
Machine learning (ML) is increasingly used to optimize laser texturing, predicting surface textures based on laser parameters and reducing the need for extensive trials. ML models complex relationships between variables like laser power and scanning speed and outcomes like texture depth, improving efficiency and minimizing time and costs.
Desai and Shaikh [
6] applied ANN to predict the depth of laser-textured patterns, comparing the results with semi-analytical models like Multi-Gene Genetic Programming (MGGP). Their study showed that ANN models provided better predictive accuracy than traditional models, highlighting the potential of ML to improve surface texturing outcomes. Other researchers have also explored using various ML techniques for laser texturing. For instance, Liu et al. [
23] implemented SVM to predict surface roughness and texture features, finding that SVM models performed well in capturing nonlinear relationships between laser parameters and texture outcomes, especially in complex materials like alloys and ceramics.
Decision trees have found application in optimizing laser parameters in many studies. Specifically, Cheng et al. [
24] showed how useful DT can be in categorizing surface topography results based on input variables such as laser power, pulse duration, and scanning speed, easing decision-making in parameter tuning. Also, random forest, an ensemble-learning approach based on multiple decision trees, is reported to be more robust and accurate in predicting surface features by Zhang et al. [
25] in the case of laser-textured steel surfaces.
Additionally, gradient boosting algorithms have been explored by Singh [
26] to predict tribological performance, where the model outperformed simpler regression-based approaches in estimating wear resistance based on laser-induced surface patterns. Researchers such as Li et al. [
27] have also introduced Gaussian Process Regression (GPR) as a probabilistic approach to model uncertainty in laser texturing outcomes, showing promise in capturing the variations in surface characteristics due to minute changes in laser parameters.
Although ML is widely studied for laser texturing, comparisons across models, parameters, and materials remain limited. Advanced techniques like GPR, CNNs, and reinforcement learning may enhance predictions, particularly for complex data. Comprehensive studies are needed to identify the most effective algorithms and fully utilize ML’s potential in laser texturing.
2.4. Comparison of Machine Learning Models in Tribology
Machine learning (ML), a subset of artificial intelligence, focuses on detecting patterns and making predictions using various algorithms [
28,
29,
30]. It is divided into supervised and unsupervised learning. Supervised learning uses labeled input-output pairs for prediction, with tasks like classification (discrete outcomes) and regression (continuous outcomes) [
31]. Unsupervised learning works with unlabeled data where outcomes are not predefined.
Table 1 outlines the key differences between these two types of ML [
32,
33].
This study uses laser parameters as inputs to a supervised regression task to predict groove dimensions in tribological applications (see
Table 2). The ML methodology, outlined in
Figure 1, includes five main phases: data cleaning, feature engineering, model selection, hyperparameter optimization, and evaluation with an unseen dataset. These steps help refine the model, ensuring accurate predictions and generalization. ML effectively identifies trends, handles high-dimensional data, and improves prediction accuracy [
28].
This study employs three distinct ML models: decision trees (DT), support vector machines (SVM), and artificial neural networks (ANN). A genetic algorithm (GA) is also used to realize an inverse model, which can define the requisite input parameters to reach a certain depth and surface performance [
34].
2.4.1. Decision Trees
The technique illustrated in
Figure 2 is called branching. It involves building a tree structure through successive creation of decision rules [
35]. Decision trees aim to divide the dataset into smaller subsets while reducing prediction errors until further prediction can occur. The final model outputs the mean of all the points inside the leaf.
To minimize prediction error, it is important to split the variable at different levels in the tree. The mean squared error (Equation (3)) for regression tasks is one of the criteria used most.
where
c represents the number of variable groups and
pi represents the probability of the formation.
where
n represents the number of data points,
yi the actual target value for the
ith data point, and
is the predicted value for the
ith data point.
2.4.2. Support Vector Machines
SVM classification and regression tasks incur benefits from SVMs, as their applicability is diverse [
36]. In a regression problem, one tries to predict a continuous output variable based on the input features given to it. This separation occurs when the SVM tries to find the best line or hyperplane that separates the data points, thus increasing the distance or edge between the points and the decision line to the nearest line point. These edges (called edges of time) are determined by the specific data close to the line. The goal of the SVM algorithm is to minimize this distance while minimizing the prediction error.
SVM regression is a method that attempts to find a straight line that passes through as much data as possible while minimizing error. This straight line is popularly known as the “support vector regression” line, and the data points surrounding it have been defined as “support vectors”. A “kernel function” in the SVM algorithm is applied to transform input data into the higher dimensional space, and it helps SVM to discover a straight boundary in that high-dimensional space, which may relate to the original input space as a nonlinear boundary.
2.4.3. Artificial Neural Networks
ANNs are possible due to their computational architecture, which is based entirely on the structure and workings of the human brain [
37,
38,
39]. They are used for classification and to solve other intricacies. ANNs comprise nodes (neurons) grouped into interconnected layers, each receiving an input and passing the result down to the next layer, as shown in
Figure 3.
A typical neural network architecture has an input layer that feeds one or more layers and ends with an output layer. Each connection between two neurons has a weight adjusted during training to reduce prediction error. Functions (such as Sigmoid, Tanh, and ReLU) are nonlinear functions that allow the network to learn complex patterns. Neural network training often uses iteration, which feeds the error of the output process back through the network to adjust the weights. This is achieved with optimization algorithms such as SGD or Adam, which are repeated until the model reaches a high level of performance.
2.4.4. Genetic Algorithms
Genetic algorithms (GAs) are simulators of natural selection that select the most reproductive individuals to create the next generation [
34]. Therefore, genetic algorithms can be effective in searching space to find the best solutions, especially for inefficient studies, by simulating evolutionary mechanisms. Genetic algorithms start with developers from proposals or individuals. Each person is evaluated by the so-called functional strength, which indicates the candidate’s ability to solve the problem. The genetic algorithm flowchart is shown in
Figure 4.
The processes of the algorithm are determined to simulate natural evolution. Each of them is carried out in turn, and finally, the optimal solution is found. Specifically, individuals with the most superior fitness scores, i.e., the fittest ones, are selected to mate and reproduce. Then, parents are paired to generate offspring by a crossover process; the two individuals undergo genetic information exchange at random points; in the meanwhile, the genetic traits are inherited from two parents and form a new offspring. At last, a mutation probability is acted on the genetic information, which aims to create genetic diversity and escape from convergence to a locally optimal solution. This mutation introduces random changes to some genes. The descent of the new generation replaces the older ones, who are evaluated for their fitness. This cycle of selection, crossover, mutation, and replacement is iterated for a congratulatory set of generations. As is the case, this should lead to the creation of better solutions, ideally continuing until a stop criterion is reached, whether that might be the number of generations preempted or when a so-called good fitness level has been achieved [
34,
40].
2.4.5. Limitations of Traditional Parameter Selection Methods
The traditional trial-and-error approach to parameter selection in LST is highly inefficient and impractical for large-scale applications. In this method, one parameter varies at a time while keeping others constant, and the resulting texture is analyzed. This approach fails to account for the complex interactions between multiple parameters, leading to suboptimal results and wasted time. Additionally, this method becomes increasingly unfeasible as the number of parameters increases and the experimental effort required grows exponentially. Predictive models, particularly those based on machine learning, offer a promising alternative by enabling users to forecast texture outcomes based on input parameters, significantly reducing the need for physical trials [
28,
29,
41,
42,
43].
3. Materials and Characterizations
3.1. Materials
The tribological behavior of tungsten carbide specimens is investigated, revolving around critical attribute dimensions such as texture depth, coefficient of friction, wear rate, and hardness. Tungsten carbide was selected due to its extremely high hardness, wear resistance, and durability under extreme conditions; hence, its suitability for high-demand sectors like the oil and gas industry, where equipment is working under tribological conditions such as abrasive particles, high pressure, and friction.
Two coats, WS2 and TiCN, were applied to assess the efficiency of improving the properties under laser texturing. The combination of uncoated and coated material was studied for tribological performance over various surfaces, enabling a full picture of the resistance to wear and frictional behavior.
The study aims to optimize laser texturing parameters to accurately predict and control surface texture depth, coefficient of friction, wear rate, and hardness. These advancements could significantly improve the performance and longevity of components used in oil and gas operations, such as drill bits, valves, and pumps. By fine-tuning surface properties, this research contributes to more efficient operations and reduced maintenance in environments where high wear resistance is essential.
3.2. Surface Texturing and Characterizations
Different micro-textures were shaped on uncoated and coated samples using a Ti femtosecond laser system (model “PRO 400”, Femtolasers Produktions GmbH, Vienna, Austria), amplified by the “Femtopower Double 10 kHz” system. The laser emitted pulses centered at a wavelength of 800 nm, with a pulse length of 30 fs, a maximum energy of 200 μJ per pulse, and a repetition rate of 10 kHz. The output laser beam was polarized to enhance precision during the machining process. The focusing of the laser beam was accomplished using a doublet lens of 20 mm focal length, leading to an approximate 3.6 μm diameter of the focal point. The motion control of the milling was managed via Mastercam 2018—Mill software (version: 20.0.21000.1) connected directly to the laser system through post-processing tools. The different micro-textures that were created, corresponding to the different laser parameters of pulse energy, number of passes, and repetition rate, allowed one to freely control the depth, size, and pattern distribution to obtain different surface textures that could be optimized for different applications. Different parameters were moved underneath to ascertain the effect on tribological performance. Each set was processed with multiple passes for groove formation, maintaining a consistent laser direction. The number of passes was adjusted to achieve the desired depth and surface texture.
A ball-on-disk tribometer was employed to conduct rotary sliding tests to evaluate the samples’ wear performance and frictional characteristics. The tests were performed at a load of 5 N, a rotational speed of 250 rpm, and a sliding time of 20 s in a controlled dry environment with relative humidity maintained between 30 and 40% at 20 °C. The tribometer software provided data on the coefficient of friction over time, enabling the calculation of the average friction coefficient from the stable portion of the curve. Also, microhardness measurements of the textured surfaces were obtained using a microhardness tester, with a load of 0.05 kgf applied for 20 s.
3.3. Design of Experiments
A full factorial design of experiments was applied for trials to fertilize relevant data for machine learning model inputs. Three key processing parameters related to laser work represented four levels for each texture morphology. The output parameters selected in this study—groove depth, coefficient of friction (COF), wear rate, and hardness—are directly linked to tribological performance. Groove depth influences surface interaction mechanisms such as load-carrying capacity and lubrication efficiency. The COF and wear rate are key indicators of sliding performance, providing insights into reducing friction and material loss. Hardness, conversely, determines the material’s ability to resist deformation and wear under operational stresses. Together, these parameters comprehensively define the surface functionality and durability, making them critical for evaluating and optimizing tribological systems.
The selection parameters (laser power rate, scanning rate, and pulse repetition rate) are essential for femtosecond laser processing. The laser energy density can affect depth as the energy must pass through the removal equipment. Thus, pulse energy is a crucial factor in material ablation. Additionally, pulse repetition rate and scanning speed are pivotal for determining surface quality and optimizing processing time. Preliminary tests were conducted to establish the parameter ranges, balancing the goals of maximizing material removal efficiency and maintaining high surface quality (refer to
Table 2).
The remaining laser processing parameters were held constant, as listed in
Table 3. Each configuration was repeated three times to increase reliability. These repetitions were treated as separate configurations for machine learning model development, allowing the model to capture the variability between trials. In the full factorial DoE approach, the total number of trials was determined based on the levels (L) and factors (k). A total of 64 experiments were repeated thrice, yielding 192 data points for model training. A test set consisting of 16 additional data points was created to assess the model’s performance, with the same factorial design applied to both the primary experiments and the additional verification trials. These supplementary tests evaluated how well the model could generalize across different parameter ranges. To evaluate the model’s robustness, a paired
t-test was performed to compare the predicted values with the experimental outcomes for each parameter.
4. Machine Learning Modeling
This methodology focuses on building a robust ML model to accurately predict the texture’s dimensions based on specific laser settings and prescribe laser parameters to achieve a targeted size. In this study, the modeling process is conducted in two stages. The first stage involves predicting surface layer characteristics based on machining parameters. These characteristics include the geometric structure of the surface, such as groove depth and alignment. Machining parameters like pulse energy, scanning speed, and repetition rate are used as input features to determine these surface properties. The second stage uses the surface layer parameters derived in Stage 1 to use ML techniques to predict tribological properties such as the coefficient of friction (COF) and wear rate. These properties are influenced not only by the surface geometry but also by material properties. By integrating these two stages, a comprehensive understanding of the relationship between machining, surface characteristics, and tribological performance is achieved.
As shown in
Figure 5, the methodology begins with a comparative analysis of multiple ML models to identify the one that performs the best in-depth prediction. All the models were rigorously fine-tuned for hyperparameters to ensure they performed optimally. This optimal model was validated using the R
2 score and applied in an inverse framework to predict laser parameters for texture sizes. In the case of inverse modeling, the accuracy was evaluated by assessing the absolute difference between the predicted laser parameters and actual parameters for a specific texture size.
The objective is to develop a data-driven methodology that (1) enables area growth prediction for a texture based on certain input parameters and (2) generates a set of input parameters for a specified texture of a given area within a small margin, consequently backing up the rest of the work. Those dual objectives are of practical relevance, particularly in tribology, where precise texture dimensions can greatly help surface performance.
4.1. Selected Models
The selection of decision trees (DT), artificial neural networks (ANN), and genetic algorithms (GA) was driven by their complementary strengths in handling complex, nonlinear datasets. DT provides interpretable decision rules that can simplify parameter categorization, while ANN excels at capturing intricate patterns in high-dimensional data. Conversely, GA is particularly suited for inverse modeling, as it iteratively refines input parameters to achieve specific surface characteristics through evolutionary optimization. This combination ensures robust predictive and prescriptive capabilities for laser texturing applications.
In this study, three ML models were chosen for their diversity in learning algorithms and established efficacy in similar applications: DT, SVM, and ANN. The selection of these models ensures diversity in the learning algorithms. The selected model must be the right one for the data and intended objectives. For example, DT uses tree-based algorithms to structure data and involves separating the data in terms of decision rules. Further, SVM operates by constructing hyperplanes in the multi-dimensional space to separate different classes; in regression, the idea is to fit an estimated curve to the data. ANN is a neural net such that interconnected node layers process input data and is especially suitable for issues with complex patterns. Given the unique strengths of each model, selecting from such a diverse pool increases the likelihood of identifying the best predictive tool for texture size prediction. Details on each model’s characteristics and functionality are provided in
Section 2.
4.2. Hyperparameter Optimization
Each ML model relies on specific hyperparameters that control its behavior during training, affecting both model performance and its ability to generalize to unseen data. For this study, hyperparameters were optimized using an AutoML tool that automates the hyperparameter tuning process, allowing us to find the optimal values systematically. The primary hyperparameters adjusted varied by model: for instance, DT was tuned for maximum tree depth, minimum samples at each leaf node, and the number of estimators; SVM was adjusted for kernel functions and regularization parameters. A description of the hyperparameters tuned for each model is given in
Table 4.
The use of 3-fold cross-validation during model training reduced overfitting. Each model was trained on different folds of the dataset to provide a reliable and unbiased performance assessment. Cross-validation splits the data into three subsets, sequentially using two subsets for training and one for validation, rotating this process across all folds to average out performance errors. This approach ensures that model performance is not skewed by specific data distributions, contributing to a more stable evaluation.
4.3. Evaluation Metrics
The R
2 score, or the coefficient of determination, was chosen as the primary evaluation metric to ensure the reliability of predictions. The R
2 score is a standard metric in regression analysis that reflects the proportion of variance in the dependent variable that can be predicted from the independent variable(s), as shown in Equation (4). In this study, values close to one indicated a better fit of the model to the data, whereas values below zero would suggest that the model performs worse than a simple mean-based prediction.
The Friedman test was then conducted to confirm differences in performance between models statistically. The Friedman statistic is computed as shown in Equation (5)
This non-parametric test ranks the models based on their performance across different datasets to determine if significant performance disparities exist. If the Friedman test reveals significant differences, a post hoc Nemenyi test is applied to identify which models differ from each other. Using these tests ensures that the selected model’s performance is statistically superior to others and not a result of random variance.
4.4. Inverse Model
A reverse method was developed to reverse engineer the machine learning to predict the laser beam that creates the texture depth. The inverse model uses a machine learning model to predict the texture depth based on a combination of patterns from the original data. The parameter that predicted the closest to the target cavity depth was assumed to be the optimal value for the input.
Advanced evolutionary strategies employing a genetic algorithm (GA) have been implemented to fine-tune parameter selection. The genetic algorithm simulates natural selection processes by iterating through populations of parameter combinations, with the most accurate sets selected for “mating” to produce offspring in each generation. During this evolution, crossover and mutation operations are applied to evolve the population towards convergence at a solution that minimizes the difference between the predicted depth from the model and the target depth.
The genetic algorithm-driven inverse modeling framework is designed to predict laser parameters required to achieve desired surface features with high precision. The GA iteratively evolves candidate solutions by simulating natural selection processes, improving their fitness through selection, crossover, and mutation. This approach ensures that the predicted parameters converge toward minimizing the difference between the target and predicted values. Validation experiments demonstrated that the GA effectively reduced prediction errors, confirming its ability to navigate complex parameter landscapes and avoid convergence to suboptimal local minima.
Major GA parameters include population size, mutation rate, and crossover probability. For this study, based on trial-and-error procedures, a population of eight, a mutation rate of about 0.9, and a crossover probability of 0.9 was set, generating an ever-increasing accuracy in predicting the parameters.
This evolutionary scheme thus considers the inverse model to generate exact input combinations to achieve the target cavity depth, maintaining the least deviation. It thus lends itself to real screenings in nature, where precision, among other things, becomes pertinent. By authentically tuning this model through GA, this approach affords itself an excellent method for optimizing laser parameters for a desired effect.
5. Results and Discussion
The results section analyzes the performance of the machine learning models in predicting laser surface texturing parameters that improve tribological advantages for WS2 and TiCN-textured samples.
5.1. Tribological and Mechanical Performance Analysis
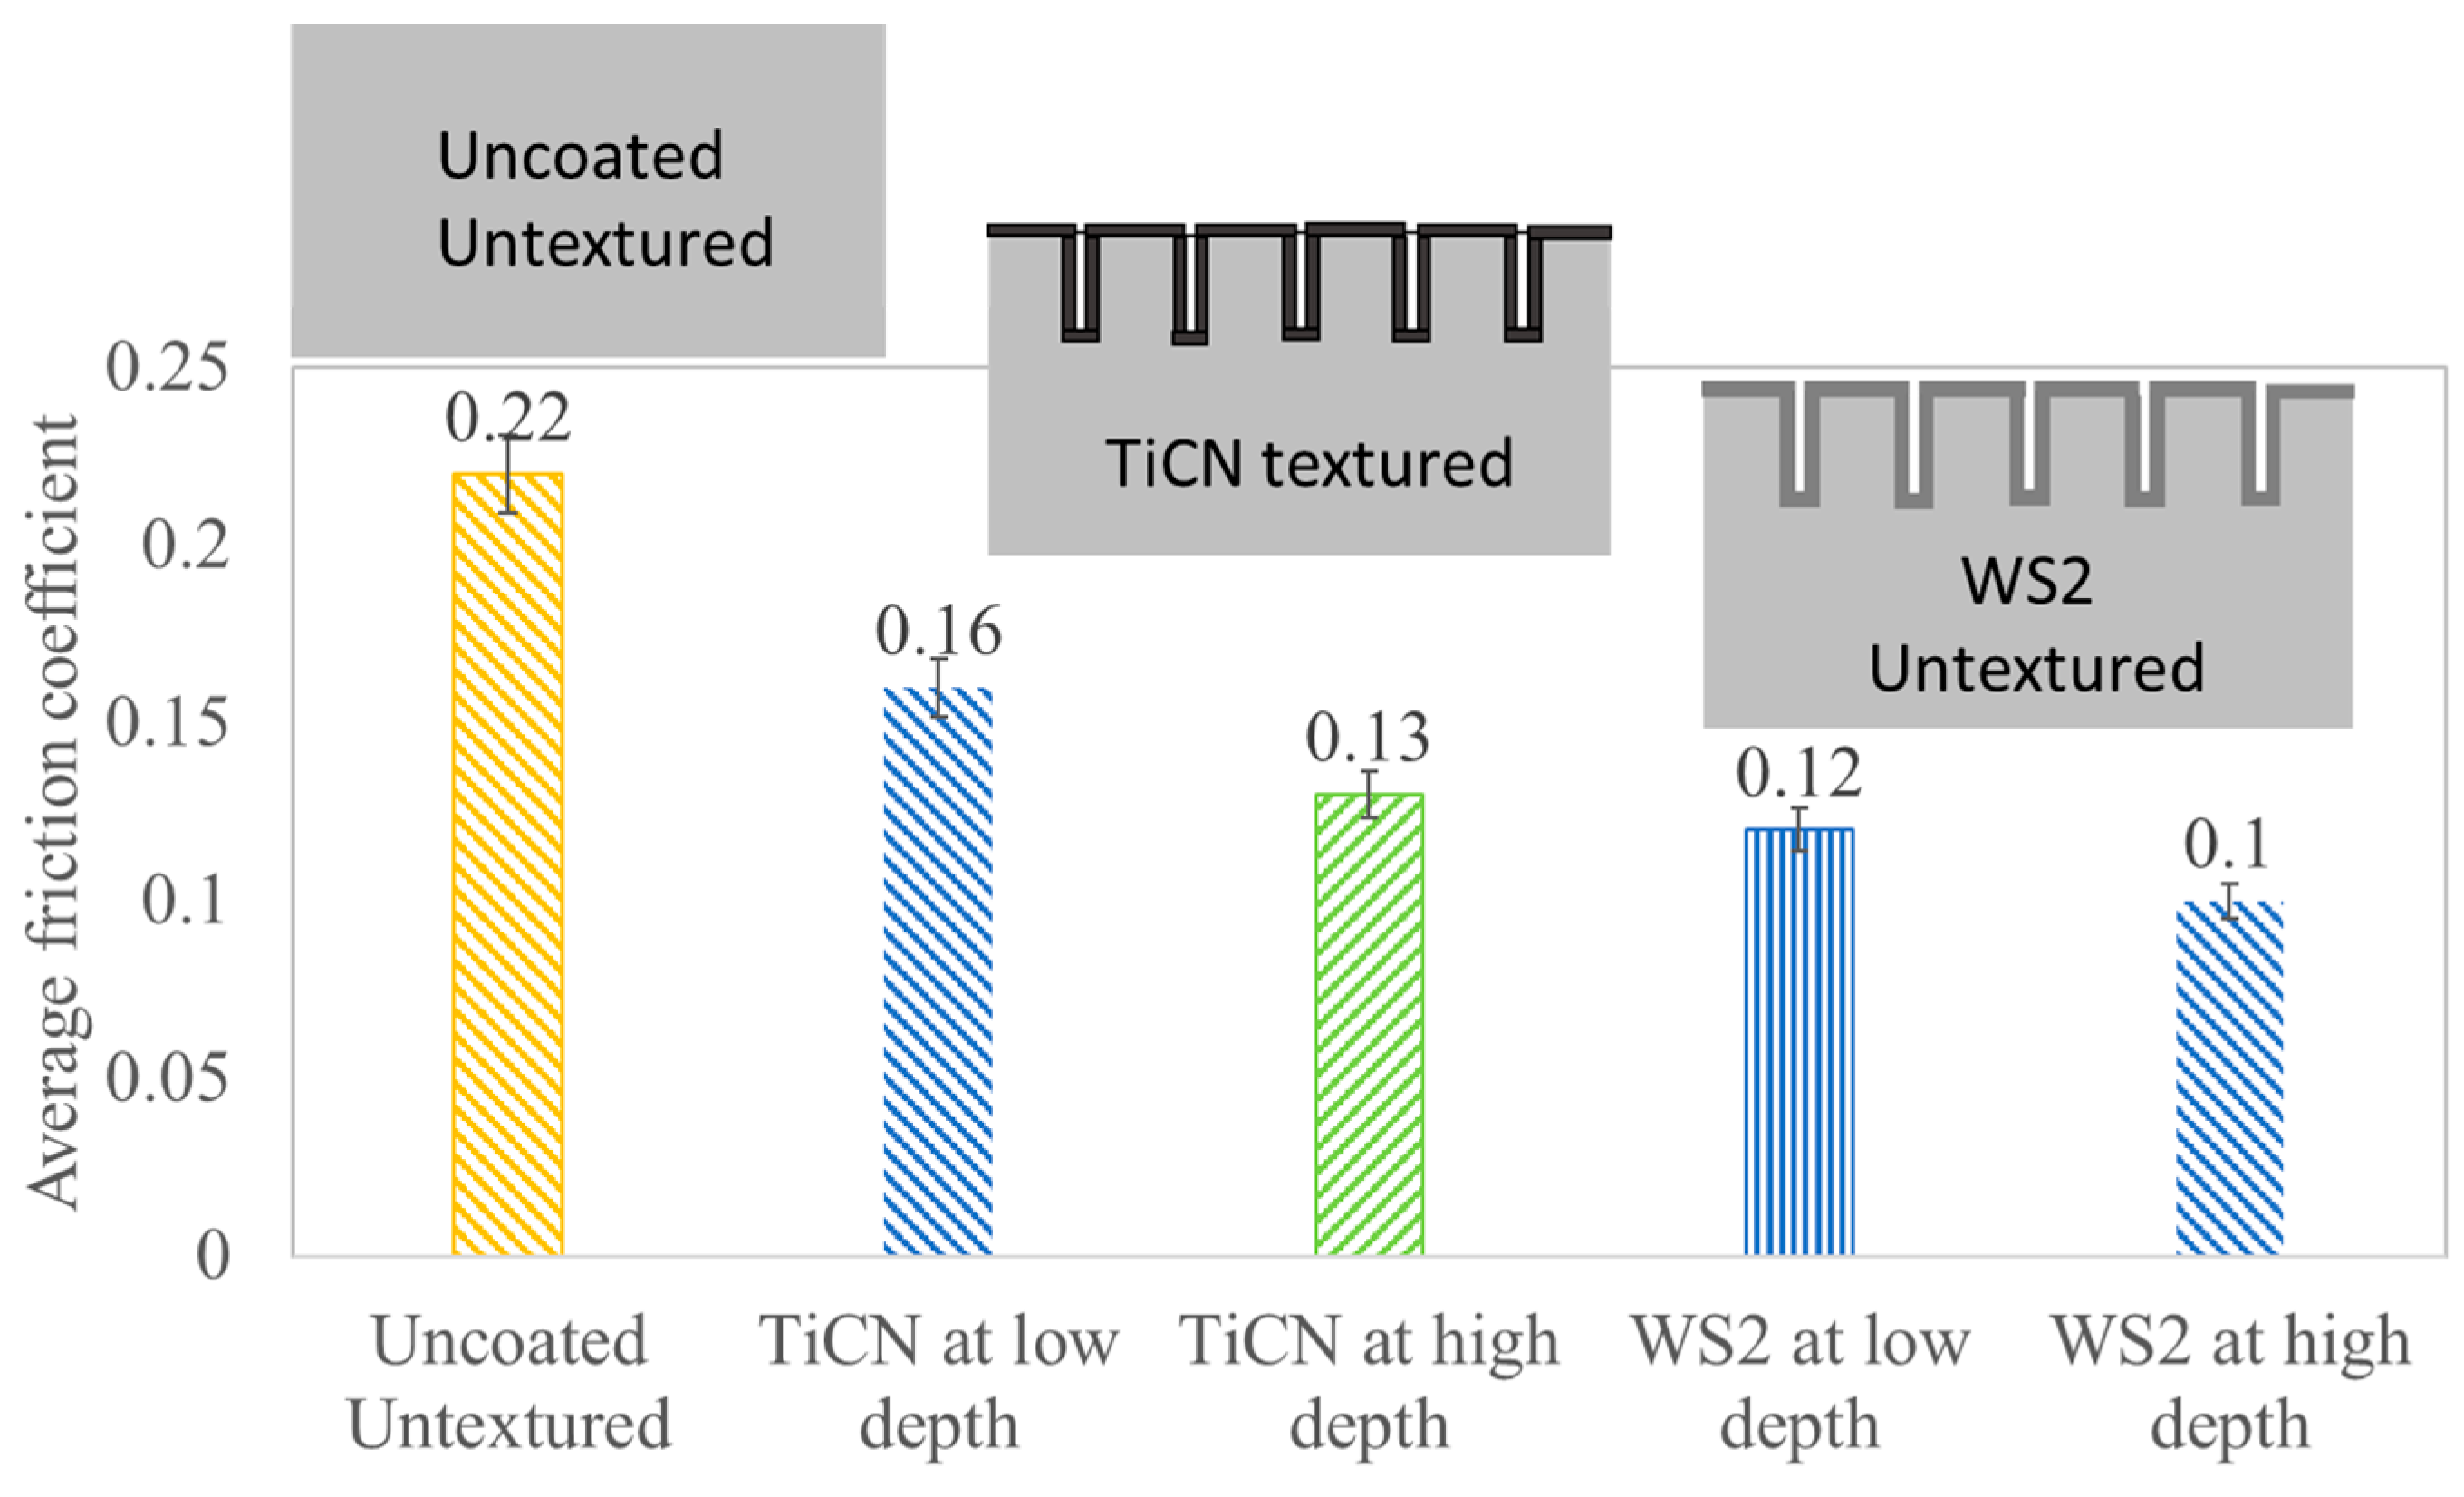
The results obtained from a ball-on-disk test found that for samples with different groove depths, the COF would severely drop for those coated with WS
2 and TiCN compared to the uncoated specimens. The average values of COF determined over the sliding time for the two systems are given in
Figure 6. All samples generally showed a rapid increase in COF followed by a stabilization after about 15 s. Under dry sliding conditions, the uncoated smooth sample showed a COF of 0.22. At the same time, the WS
2 and TiCN coatings with different groove depths demonstrated lower COFs, with the minimum values occurring at deeper grooves. Among the coated samples, TiCN-coated surfaces exhibited COFs of 0.13, respectively, while WS
2-coated surfaces achieved even lower values, reaching as low as 0.10. The higher COF in uncoated samples can be attributed to increased material interactions at the microscopic level. In contrast, the coatings combined with textured grooves improved sliding performance and reduced friction by decreasing the contact area. The lower COF values in coated, textured samples were due to minimized contact area, which lessened the effects of deformation and adhesion at the interface. Deformation in smooth samples occurs due to interlocking asperities under applied load, while adhesion arises from bonding between sliding surfaces, amplifying friction. Textured and coated surfaces, however, reduced these forces, requiring less applied force to maintain sliding motion. Additionally, the groove patterns effectively trapped wear debris, contributing to COF reduction by preventing abrasive particles from interacting directly with the sliding surfaces. This effect resulted in COF reductions of 36% for TiCN-coated textures, while the WS
2 texture coating achieved a further reduction of 68%.
Figure 7 presents the calculated wear rates for both polished and textured samples. The data highlight the superior anti-wear performance of the textured surface, which exhibits the lowest wear rate among all samples, while the polished surface has the highest. These wear rate patterns align with changes in the average friction coefficients, emphasizing the enhanced wear resistance achievable through femtosecond LST. The textured surfaces demonstrate high resistance to wear, attributed to effective debris trapping and a reduced contact area. Consequently, variations in wear rates and average COF for TiCN and WS
2 coatings across different texture depths show similar trends.
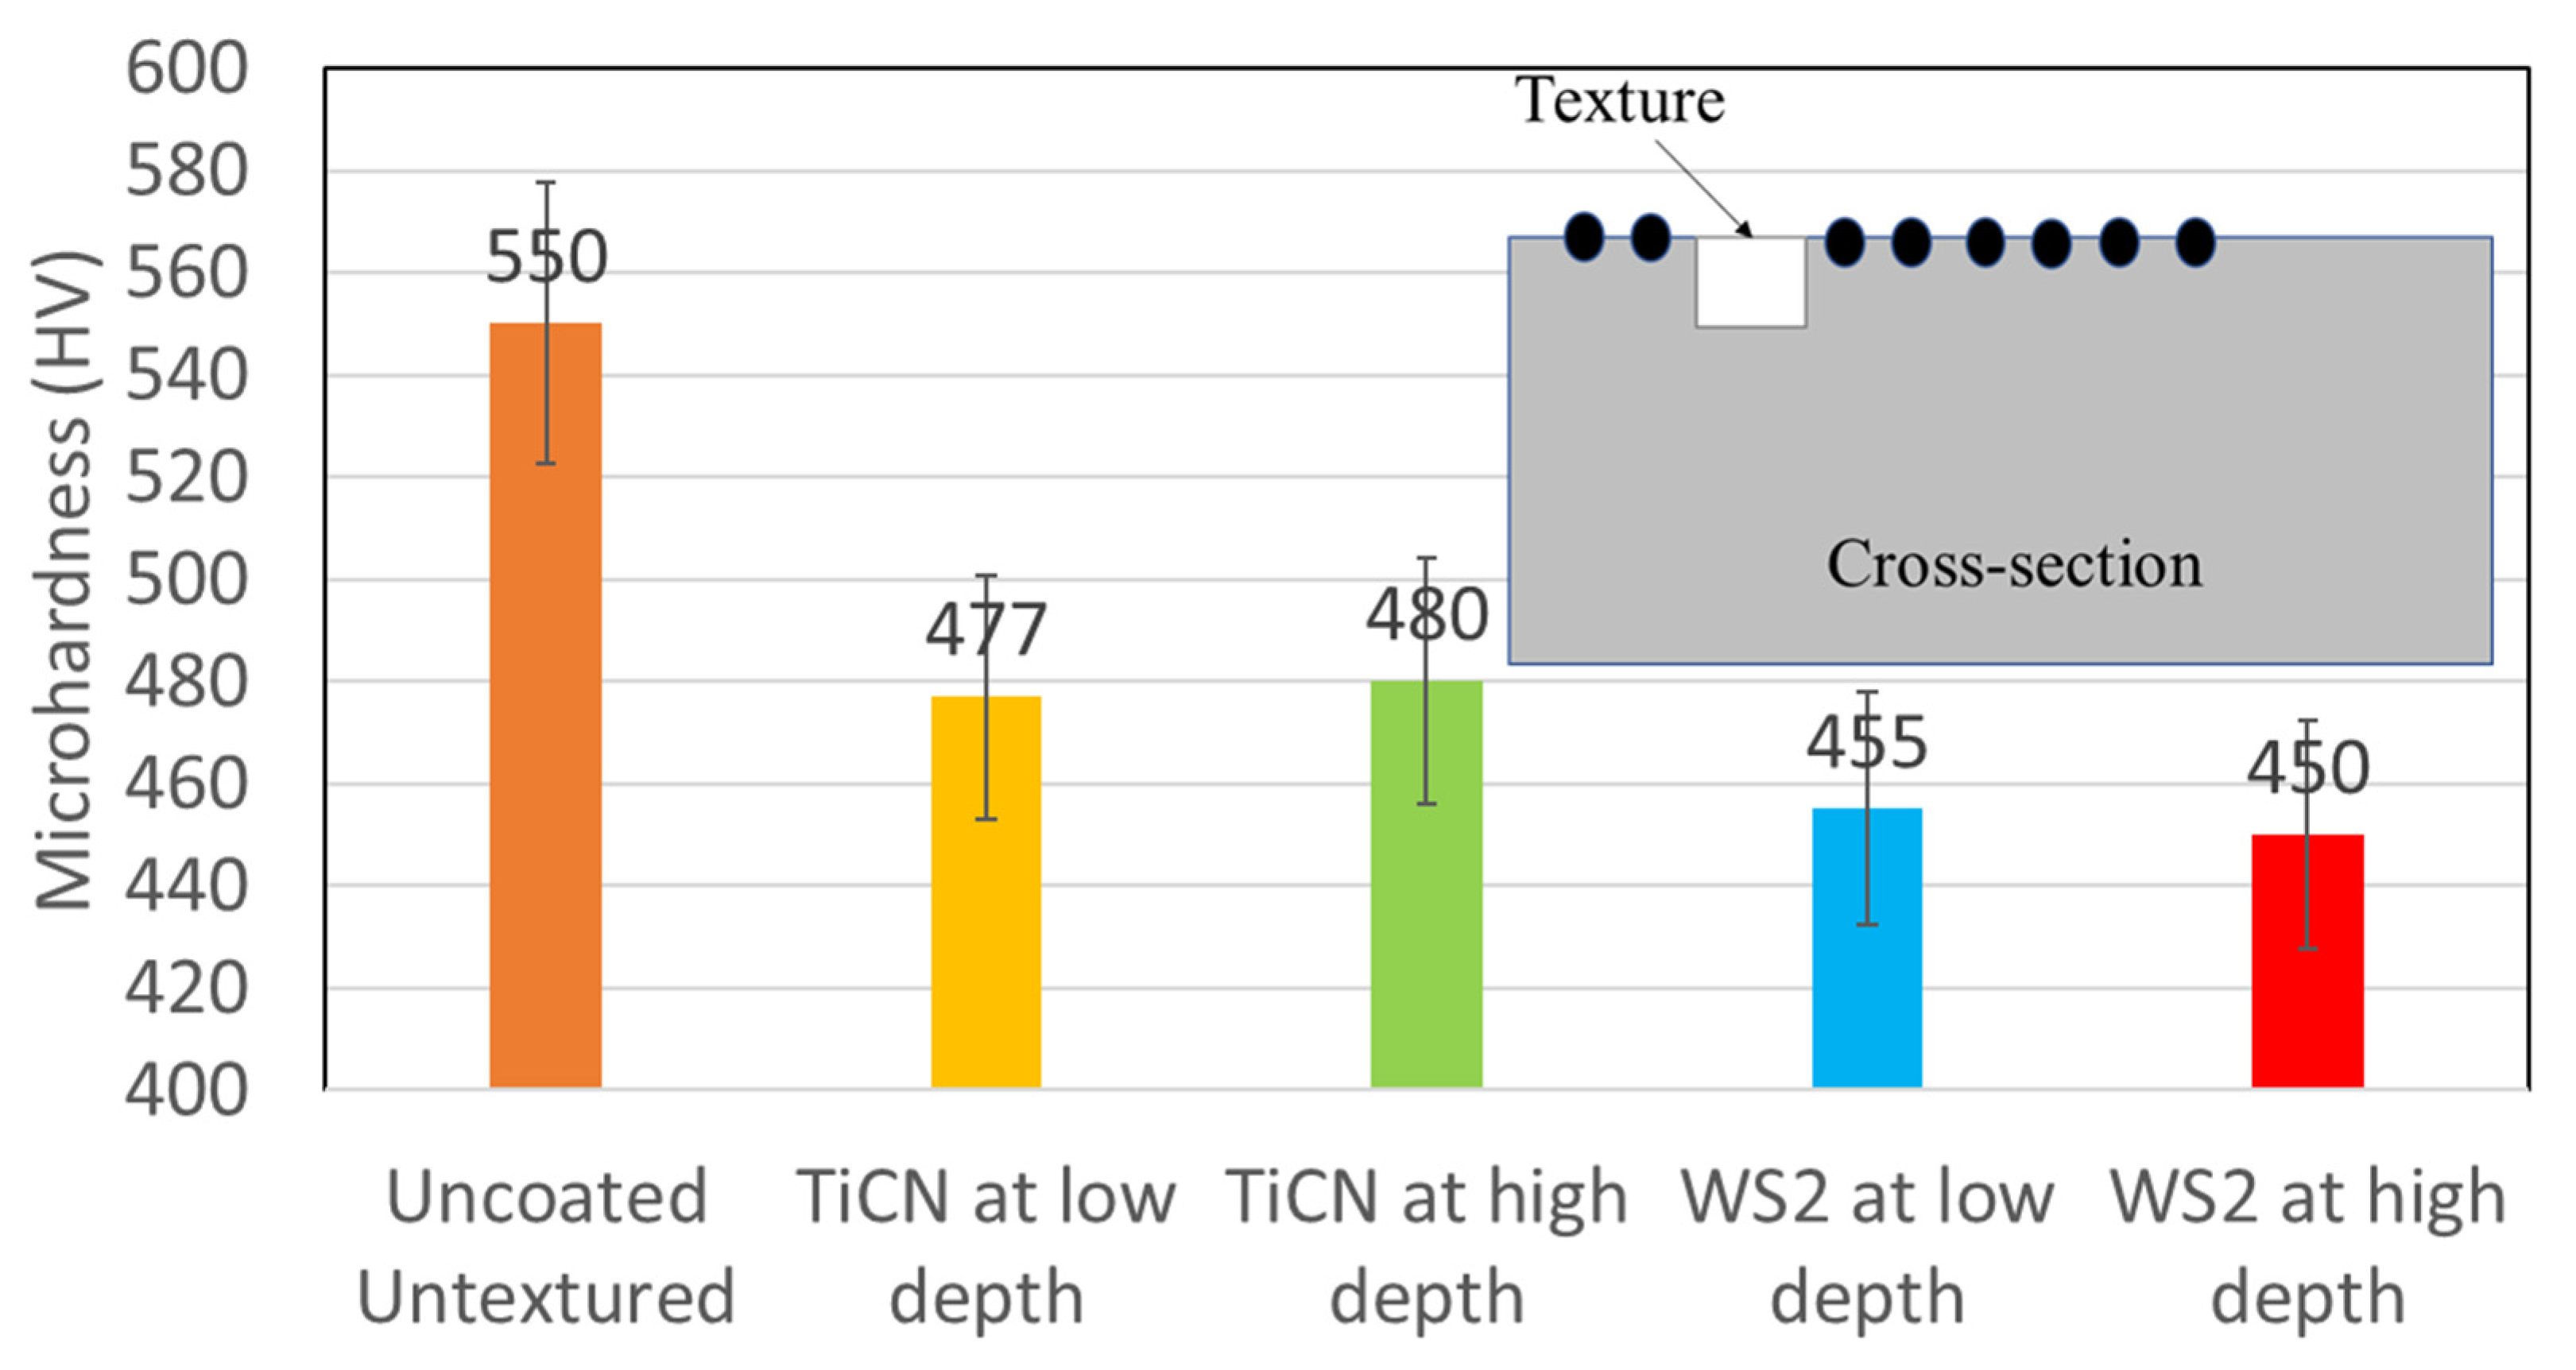
Figure 8 illustrates the hardness values for different conditions. The hardness values near the channels are lower than the hardness of an uncoated smooth surface. For textures coated with WS
2, the hardness reaches 490 HV, showing a 30% reduction from its original hardness. In contrast, textures coated with TiCN show smaller reductions of around 26% compared to the uncoated sample.
5.2. Machine Learning Model Evaluation and Hyperparameter Tuning
This study evaluates multiple machine learning models to determine the most effective one for predicting depth and finding better conditions (coated/uncoated and textured/untextured) in various laser-machined textures. The findings from model training and prediction and hyperparameter tuning results are shown in
Figure 9.
Figure 9 illustrates the performance of three machine learning models, which are DT, SVM, and ANN, across five different surface treatment cases: uncoated untextured, textured TiCN with low depth, textured TiCN with high depth, textured WS
2 with low depth, and textured WS
2 with high depth. Each graph in the figure presents the impact of tuning specific hyperparameters on the models’ performance. For the decision tree, parameters such as maximum depth, maximum features, minimum samples leaf, and minimum samples split determine the complexity of the tree and how it divides the data for prediction. In the support vector machine, gamma, C, and epsilon control the model’s ability to create decision boundaries, balancing the trade-off between margin maximization and prediction accuracy. In the artificial neural network, hyperparameters like alpha, batch size, and maximum iterations influence the model’s learning rate and the number of training iterations. These graphs show how different hyperparameter settings affect model performance for each surface treatment, providing insight into how surface texture and depth influence predictive accuracy. The results underline the significance of selecting optimal hyperparameters for each model to enhance the accuracy of predictions related to cutting tool performance. Once tuning and training were completed, the models’ performance across datasets was assessed using the R
2 score on the test set.
Extensive validation was performed using experimental data to ensure the reliability of ANN predictions. The ANN achieved error margins below 5% across key parameters, including groove depth, COF, and wear rate, highlighting its accuracy in capturing the relationships between input laser settings and output surface characteristics. Additionally, hyperparameter optimization and cross-validation techniques were applied to mitigate risks of overfitting and enhance the model’s generalizability to unseen data. A sample of 12 test set data values is provided in
Table 5, with the model results shown in
Table 6.
The analysis shows that all methods achieved higher accuracy in predicting lower texture depths for TiCN- and WS2-coated samples than the ones with higher depths, with R2 values of 0.99 for lower texture depth and scores of approximately 0.75 for higher texture depth. Decision trees had the lowest R2 scores among the models, while the ANN model consistently outperformed other methods across all datasets, making it the most effective for output prediction.
Figure 10 provides some examples of visual representations of the predictions for depth and COF for textured WS
2 with low-depth samples to illustrate these results. The graph shows the variance between actual and predicted values, clearly showing the model’s accuracy. The scatter plot displays actual values against predicted ones, with points closer to the regression line indicating more accurate depth predictions. Examining the plots for the texture dataset corroborates the findings in
Table 6. The graphs of SVM show the comparison between the predicted and actual values is less than with DT. However, the ANN model has a lower discrepancy and the smallest uncertainty in its predictions. Thus, it seems to outperform all the other models.
Neural networks based on the analysis and evaluation of unexplored diversity are good models for depth estimation. As discussed in
Section 4.4, this work presents two adaptive methods to obtain input points from the target depth. The performance evaluation of both methods is performed on test data. The first method is a simple model that defines the parameters that estimate the closest depth to the target from the training data.
Results from this first method showed that the maximum absolute deviation of good from the correct predicted target depth is about 7%, with a mean deviation of about 4% on the 16 test instances. In this case, the minor differences indicate the method’s capability of suggesting the values of combinations of parameters that yield depth results close to the specified target. As this first method derives its input parameters solely based on given data points without generating other parameter combinations, it may lead to inaccuracies in prescribing specific input parameters.
5.3. Evaluation of Inverse Modeling Approaches for Parameter Prediction
To overcome the limitations of the previous section, a more diverse model was developed using genetics. The algorithm optimizes the input parameters by continuously improving a population of parameter sets using selection, crossover, and mutation to obtain a target depth close to the true value. The analysis of the inverse model using this evolutionary strategy is summarized. In each case, the genetic algorithm was used 50 times, and the algorithm that gave the best result (low average error) was selected as the best. This verification method is necessary to solve the system with several local minima so that various configurations can provide different depths according to the characteristics of the measurement system. However, this idea is helpful because it shows that the algorithm can find the parameters that create the target depth.
The results against this strategy for the inverse problem, where laser parameters are specified as a function of depth, are shown in
Table 7. The errors are kept well within 6.2%, with one having a mean error of 4.8% for all parameters. Notably, the solutions consistently yield depths very close to the target. Comparatively, the evolutionary method has shown a considerable improvement compared to both inverse modeling approaches, as it brought error down across all prescribed parameters. The huge reduction in error proves the efficiency of the evolutionary method in obtaining input parameters more closely related to the exact depth.
6. Model Verification Through Experimental Validation
A series of additional experiments were conducted to validate the reliability of the respective machine learning models in predicting the laser texturing parameters. This validation compared the model-predicted optimum parameters to the results of actual experiments. The aim was to assess the final model’s ability to generalize beyond the initial training dataset while exploring its application to achieve desired surface characteristics in the experimental test.
6.1. Experimental Setup for Verification
The verification experiments evaluated predictions made by the models regarding depth, hardness, wear rate, and the coefficient of friction (COF) on the WS2-textured samples. Different parameters for laser texturing—such as power level, pulse duration, and frequency—were suggested by the model for the expected outcomes and were then implemented for verifying the model. The following variables were recorded:
Predicted Depth, Hardness, Wear Rate, COF: Values generated by the artificial neural network model, identified as the most accurate model during the validation phase.
Experimental Depth, Hardness, Wear Rate, COF: Measured values from the verification experiments conducted on the samples.
6.2. Comparison of Predicted and Experimental Results
Table 8 summarizes the predicted and experimental results for the target values corresponding to different surface characteristics. The parameters predicted by the model were implemented into the experimental setup for each target, with the depth, hardness, wear rate, and COF being measured subsequently. The difference between predicted and experimental values provides insight into the model’s accuracy. The low percentage error shown in
Table 8 indicates that the model’s predictions and experimental results are strongly aligned, proving the model’s effectiveness in real-life applications.
6.3. Verification Scatter Plot Analysis
Figure 11 serves as a visual comparison of the predicted and observed values for each parameter in several trials. In all the scatter plots, each red dot refers to a model prediction, and the blue dots refer to experimental outcomes. The closer the predictions stand to the experimental points, the better the model’s performance.
The scatter plots in
Figure 11 reveal that the ANN model’s predictions closely match the experimental data across depth, hardness, wear rate, and COF, particularly for depth and hardness, where the points nearly overlap. This suggests that the model has effectively captured the relationships between laser parameters and surface characteristics, validating its use for precise texturing applications.
6.4. Statistical Analysis of Verification Results
To further assess the model’s reliability, a paired
t-test was conducted between the predicted and experimental values for each parameter. The null hypothesis was that there was no significant difference between the predicted and experimental means, as shown in
Table 9. A significance level of 0.05 was used.
Since all p-values are above 0.05, the results indicate no statistically significant difference between the predicted and experimental outcomes for any parameters. This provides strong statistical evidence that the model’s predictions are reliable and consistent with real-world results.
7. Conclusions
This study proposes a machine learning-based method for recommending optimal femtosecond laser parameters to obtain specific surface features. This process involves analyzing three machine learning algorithms to select the best-performing models, which would then assist in developing two inverse modeling techniques. These inverse models permit the identification of ideal laser input parameters for achieving characterizations. This two-stage modeling approach provides a more detailed and structured framework for understanding the relationship between machining parameters, surface characteristics, and tribological properties. The approach not only enhances the accuracy and interpretability of the results but also broadens the potential applications of this research to various fields of engineering, such as aerospace, automotive, and manufacturing, where surface integrity and tribological performance are critical. The following sections summarize the findings and insights derived from comparing the models and analyzing the results.
Among the tested algorithms, the ANN provides the highest accuracy of in-depth predictions and has the highest R2 score. Several statistical tests corroborated that for the present dataset, the ANN model is best suited for making depth predictions. Also, all models were more accurate in predicting depth for WS2 textured samples than TiCN samples. However, further analysis is required to ascertain the complete character of this trend.
The results show that ML provides a framework for predicting femtosecond laser texture characteristics. An inverse modeling approach has had limited success, in which the laser input parameters were suggested to provide enough depth close to the target depth with an average error margin of approximately 4%. However, the proposed input parameters often differ from the actual ones tested, as several combinations can yield similar depth values, thus resulting in differences in the proposed parameters. In addition, this model shows promise for predicting the optimal laser-texturing parameters to obtain the desired depth, associated level of hardness, wear rate, and COF. This potential makes this methodology a worthy strategy for optimizing laser processing to improve surface performance characteristics.
The methods proposed in this study offer several key advantages over traditional approaches. Leveraging predictive machine learning models greatly reduces the need for extensive trial-and-error experimentation, saving both time and resources. This approach optimizes the laser texturing process and ensures more consistent and precise control over surface properties. These benefits translate directly into improved performance, such as lower friction, enhanced wear resistance, and greater durability of components, which are critical in industries like automotive and oil and gas. The verification experiments further highlight the practical value of this methodology, demonstrating its potential for reliable and scalable application in industrial settings.
The verification experiments confirm that the ANN model can reliably predict optimal laser parameters to achieve desired surface characteristics on WS2-textured samples. The minimal error rates suggest the model’s applicability for real-world settings, including potential applications in industries where precise control over surface properties is essential, such as oil and gas. However, slight discrepancies observed for wear rate indicate that further refinement or additional data may be needed to improve the model’s accuracy for this parameter. The following areas are identified as potential directions for future work:
Investigating the observed performance difference in predicting depths for WS2 textured versus TiCN and developing techniques to improve depth predictions.
Expanding the dataset to include more diverse texturing parameters, potentially enhancing model generalizability.
Developing an online framework to enable non-expert users to replicate the proposed methodology, further democratizing access to machine learning in laser process optimization.
This study contributes valuable insights into using machine learning for femtosecond laser texturing, with promising results for predictive accuracy and parameter optimization.


