Article

Utilization of Magnetic Fraction Isolated from Steel Furnace Slag as a Mild Abrasive in Formulation of Cu-Free Friction Composites

by
Vlastimil Matějka
1,*,
Priyadarshini Jayashree
2,
Kryštof Foniok
1,
Jozef Vlček
3,
Petra Matějková
4 and
Giovanni Straffelini
2
1
Department of Chemistry and Physico-Chemical Processes, Faculty of Materials Science and Technology, VSB—Technical University of Ostrava, 17. listopadu 2172/15, 708 33 Ostrava, Czech Republic
2
Department of Industrial Engineering, University of Trento, Via Sommarive 9, Povo, 38 123 Trento, Italy
3
Material and Metallurgical Research Ltd., Pohraniční 693/31, 703 00 Ostrava, Czech Republic
4
Centre for Advanced Innovation Technologies, Faculty of Materials Science and Technology, VSB—Technical University of Ostrava, 17. listopadu 2172/15, 708 33 Ostrava, Czech Republic
*
Author to whom correspondence should be addressed.
Lubricants 2024, 12(12), 440; https://doi.org/10.3390/lubricants12120440
Submission received: 4 November 2024 / Revised: 30 November 2024 / Accepted: 7 December 2024 / Published: 10 December 2024

Abstract

:
Magnetic fraction isolated from steel furnace slag was tested as a component of Cu-free friction composites. The friction–wear performance and production of wear particles during their testing using a pin-on-disc tester against a cast iron disc were evaluated. To compare the effect of the magnetic fraction on the parameters studied, the composite with alumina and the composite with original steel furnace slag were also prepared and tested. All composites showed a comparable friction coefficient. The composite with original steel furnace slag, and the composite with a magnetic fraction showed higher wear resistance compared to the composite containing alumina. The positive effect of the magnetic fraction on the extent of the emission of wear particles was observed and explained by the decreased aggressiveness of this composite to the cast iron disc. The influence of the phase composition of the steel furnace slag and the magnetic fraction on the friction film formation was also indicated, and its effect on the production of wear particles was proposed.

Graphical Abstract

1. Introduction

There are several requirements for friction composites dedicated to automotive brake pads. These requirements mainly include the suitable friction level in different braking scenarios. Other important aspects are their resistance against the wear and comfort properties. Recently, the parameters associated with environmental friendliness, mainly the presence of copper in friction formulations and wear particle emissions released during braking, became the central theme of research activities in this field. Friction composites dedicated to automotive brake pads are usually composed of more than 20 components, and their proportions are tuned to achieve desired operational behavior. In general, the components are classified into four groups: (i) binders, (ii) reinforcing fibers, (iii) fillers, and (iv) frictional additives [1,2]. The most frequently used binder in brake pads is Novolac phenolic resin [3], and its main function is to bind all other components. Metallic, synthetic, or natural fibers [4,5,6] are used in formulations to achieve adequate mechanical properties of the final brake lining. The fibers also play an important role in the formation of primary and secondary contact plateaus [7,8]. Different powders of inorganic, organic, and natural character belong to fillers, whereas baryte, iron powder, clay minerals, or different nut shells are typical examples [9,10,11,12]. Frictional additives represent an important group and include mainly solid lubricants [13] and abrasives [14]. Abrasives are mainly responsible for the appropriate and stable friction coefficient (CoF), while solid lubricants keep the braking event smooth. Different types of abrasives have already been tested in the formulation of friction composites for automotive brake pads, whereas zirconium silicate, zirconium oxide, alumina, and silicon carbide are the most frequently used for this purpose. The important factor influencing the functionality of the abrasives in friction composites is their hardness and the size of their particles [15]. The friction pair is surrounded by air, and oxidation reactions of some of the components of the friction composite are observed most often [16]. The tribochemical reactions could be even more complex, as shown, for example, by Filip et al. [17] and Lee et al. [18].
Recently, a strong effort to minimize the negative environmental impact of the wear particles released during braking resulted in the decision to avoid copper as the component in friction composites dedicated to automotive brake linings. Even earlier, before the amount of copper began to be regulated, asbestos, stibnite, and other raw materials were banned from being used in the formulation of friction composites. The temperature and frictional forces at the sliding interface are responsible for tribochemical reactions. Wear particle emissions released during braking have become intensively studied in the last 20 years. Different research groups, academic as well as industrial, are focused on strategies to reduce the wear particle emissions released during braking. Several concepts for the reduction of PM10 produced during the braking of passenger cars were introduced, and comprehensive overviews of these solutions were published by, for example, Perricone et al. [19]. One of the strategies is to tune the formulation of friction mixtures. A proper combination of raw materials leads to the formation of stable secondary contact plateaus on the friction surface of pads. Systematic research focused on the effect of individual components of friction materials enables indicating their effect on the production of wear particle emissions and the relationship between the level of emissions and the friction–wear phenomenon. For example, the effects of the most widely used abrasives, SiC, Al2O3, ZrSiO4, and MgO, or different types of fibers on PM10 and PN10 production are summarized in different papers [20,21]. Based on the results, the authors indicated that ZrSiO4 and MgO are the abrasives responsible for the lower production of airborne wear particles during the friction test. The Mohs hardness of ZrSiO4 and MgO reaches values of 7.5 and 6, respectively. These hardness values are significantly lower compared to those values for SiC and Al2O3, which reach a value greater than 9. The authors indicated the hardness of the abrasives as one of the crucial parameters affecting the wear particle emissions. In another paper, the same group of authors studied the effect of the size of the zircon silicate abrasive on particle emissions and observed that its production decreased with the decreasing size of the zircon particles [22]. The results show the importance of both the hardness and the particle size of the abrasives on the production of wear particles.
In the past, silicon oxide was also used as the abrasive in the brake pads. Nowadays, brake pad producers avoid the utilization of silicon oxide and even carefully check for the presence of this compound in other materials used as the component of friction mixtures because of the possible respirable silica issue [23]. Silicon carbide is a known abrasive used in the formulation of commercial friction composites for car brake applications, and it is known to be aggressive to the cast iron disc, and it is usually combined with other softer abrasives. Alumina as a thermally and chemically stable abrasive with, so far, no reported negative environmental effect is frequently tested as an abrasive in Cu-free friction mixtures [24,25]. Interest in the utilization of alumina for Cu-free friction composites is also documented by efforts to improve noise vibration performance through the surface modification of alumina particles. For example, Chauhan et al. [26] observed that the modification of alumina with siloxane improved the overall noise vibration performance of prepared Cu-free friction composites.
Metallurgical slags are by-products that originate during the production of different metals and alloys. The largest quantity of the slags is related to the production of pig iron and steel. Blast furnace slag (BFS) originates during the production of pig iron, and its chemical composition (expressed in the form of oxides) includes CaO, SiO2, MgO, and Al2O3 [27]. BFS can be amorphous or crystalline, depending on the cooling rate used for solidification from its molten state. If the blast furnace slag is slowly cooled down, the crystalline phases, between them mainly akermanite with chemical formulaCa2Mg(Si2O7), are formed [28]. The reported Mohs hardness of akermanite is in the range of 5–6 [29] and thus predetermines this slag to behave as a mild abrasive in friction mixtures. If the blast furnace slag is rapidly cooled down, so-called granulated blast furnace slag (GBFS) of an amorphous character originates. Steel furnace slags (SFSs) originate during steel production in basic oxygen furnaces and, in contrast to BFS, also contain a high amount of iron. Iron in SFS could be present in its metallic form, in the form of oxides (mainly wüstite and magnetite), or as brownmillerite. Other typical phases of SFS represent calcium and magnesium oxides, as well as various calcium silicates and aluminosilicates [30]. The Mohs hardness of the steel furnace slag particles ranges from 5 to 7 [31], and SFS can be considered similar to BFS as the mild abrasive. Regarding the phase composition, steel furnace slag could represent multiphase raw material for friction composites. Matějka et al. [32] compared the effect of the blast furnace, granulated blast furnace, and steel furnace slags on the friction–wear performance and the production of wear particle emissions from Cu-free friction composites. The authors observed a reduction in the specific wear rate of friction composites in the case of samples with BFS and GBFS; however, samples with SFS produced the lowest amount of wear particles. The authors attributed the lower particle emissions observed for SFS composites to the positive effect of iron-containing phases on the reduction of the disc wear. Jayashree et al. [33] tested SFS as a component of Cu-free friction composites and observed its positive effect on the formation of secondary contact plateaus and the lower production of wear particle emissions.
In our research, the effect of the addition of a magnetic fraction to a Cu-free friction composite on their friction–wear performance and the production of wear particles was studied. The magnetic fraction was obtained from SFS using a method including ultrasound treatment of the SFS through water suspension, followed by magnetic separation. To compare the effect of the magnetic fraction on the friction–wear performance and the production of wear particles, tests with pins containing Al2O3 and SFS were conducted. The original pins and the surfaces of the pins after the pin-on-disc (PoD) test were studied using scanning electron microscopy (SEM) and laser scanning confocal microscopy (LSCM). The positive effect of the magnetic fraction on the performance of Cu-free friction composites was observed and discussed.

2. Materials and Methods

2.1. Materials

The steel furnace slag was obtained directly from the steel producer (Czech Republic). The original slag was dried at 100 °C for 24 h. The particle size of the dried slag was adjusted using a jaw crusher BCD-2 (Brio Hranice, Hranice, Czech Republic), followed by grinding for 5 min using a vibrational mill BVM-2p (Brio Hranice, Hranice, Czech Republic). Finally, the milled powder was sieved through the sieve with a screen size of 0.1 mm. The obtained sample was labeled SFS (steel furnace slag). The magnetic fraction was obtained through wet magnetic separation of SFS, which is based on the action of a strong magnetic field on the water suspension of the SFS previously agitated with a powerful ultrasound. In a typical laboratory experiment, the SFS water suspension was prepared in a glass beaker, mixed with an overhead stirrer, and agitated using ultrasound for 5 min. Neodymium magnets were placed outside of the laboratory beaker wall, and the suspension was continuously stirred using an overhead stirrer for the next 10 min. The magnetic particles were stacked on the inside wall of the laboratory beaker in the position of the magnets and recovered after the settled nonmagnetic fraction was washed out of the laboratory beaker. The obtained magnetic fraction, labeled MFS, was dried at 100 °C in a laboratory oven for 24 h.
The model of Cu-free friction formulation, composed of 8 components, was used in the preparation of a master batch. The prepared masterbatch was further used for the preparation of composites through its modification with Al2O3, SFS, and MFS. The components used for the preparation of friction mixtures include the following: (i) phenolic resin as a binder, (ii) graphite and tin sulfide as solid lubricants, (iii) a mixture of barite and calcite, vermiculite, and iron powder as the fillers, (iv) steel wool and aramid fibers as the reinforcing fibers, and (v) alumina, SFS, or MFS as the abrasives. All of the components were carefully weighed and mixed in a TURBULA® mixer (WAB group, Nidderau-Heldenbergen, Germany) for 30 min. The prepared mixtures were labeled FC–Al (the mixture with alumina as the abrasive), FC–SFS (the mixture with steel furnace slag as the abrasive), and FC–MFS (the mixture with the magnetic fraction as the abrasive). The composition of all three friction mixtures is shown in Table 1.
The pins were prepared from the friction mixtures by using a hot-press molding procedure. In this procedure, the given friction mixture placed in a dedicated cylindrical steel mold with diameter of 10 mm was pressed for 10 min at 150 °C and a 100 MPa compaction pressure in the hot-press equipment Pneumet I (BUEHLER, Leinfelden-Echterdingen, Germany). The obtained pins were subjected to a post-curing process at 200 °C for 4 h in a laboratory oven. In total, five pins of each mixture were prepared and used for characterization and PoD tests.

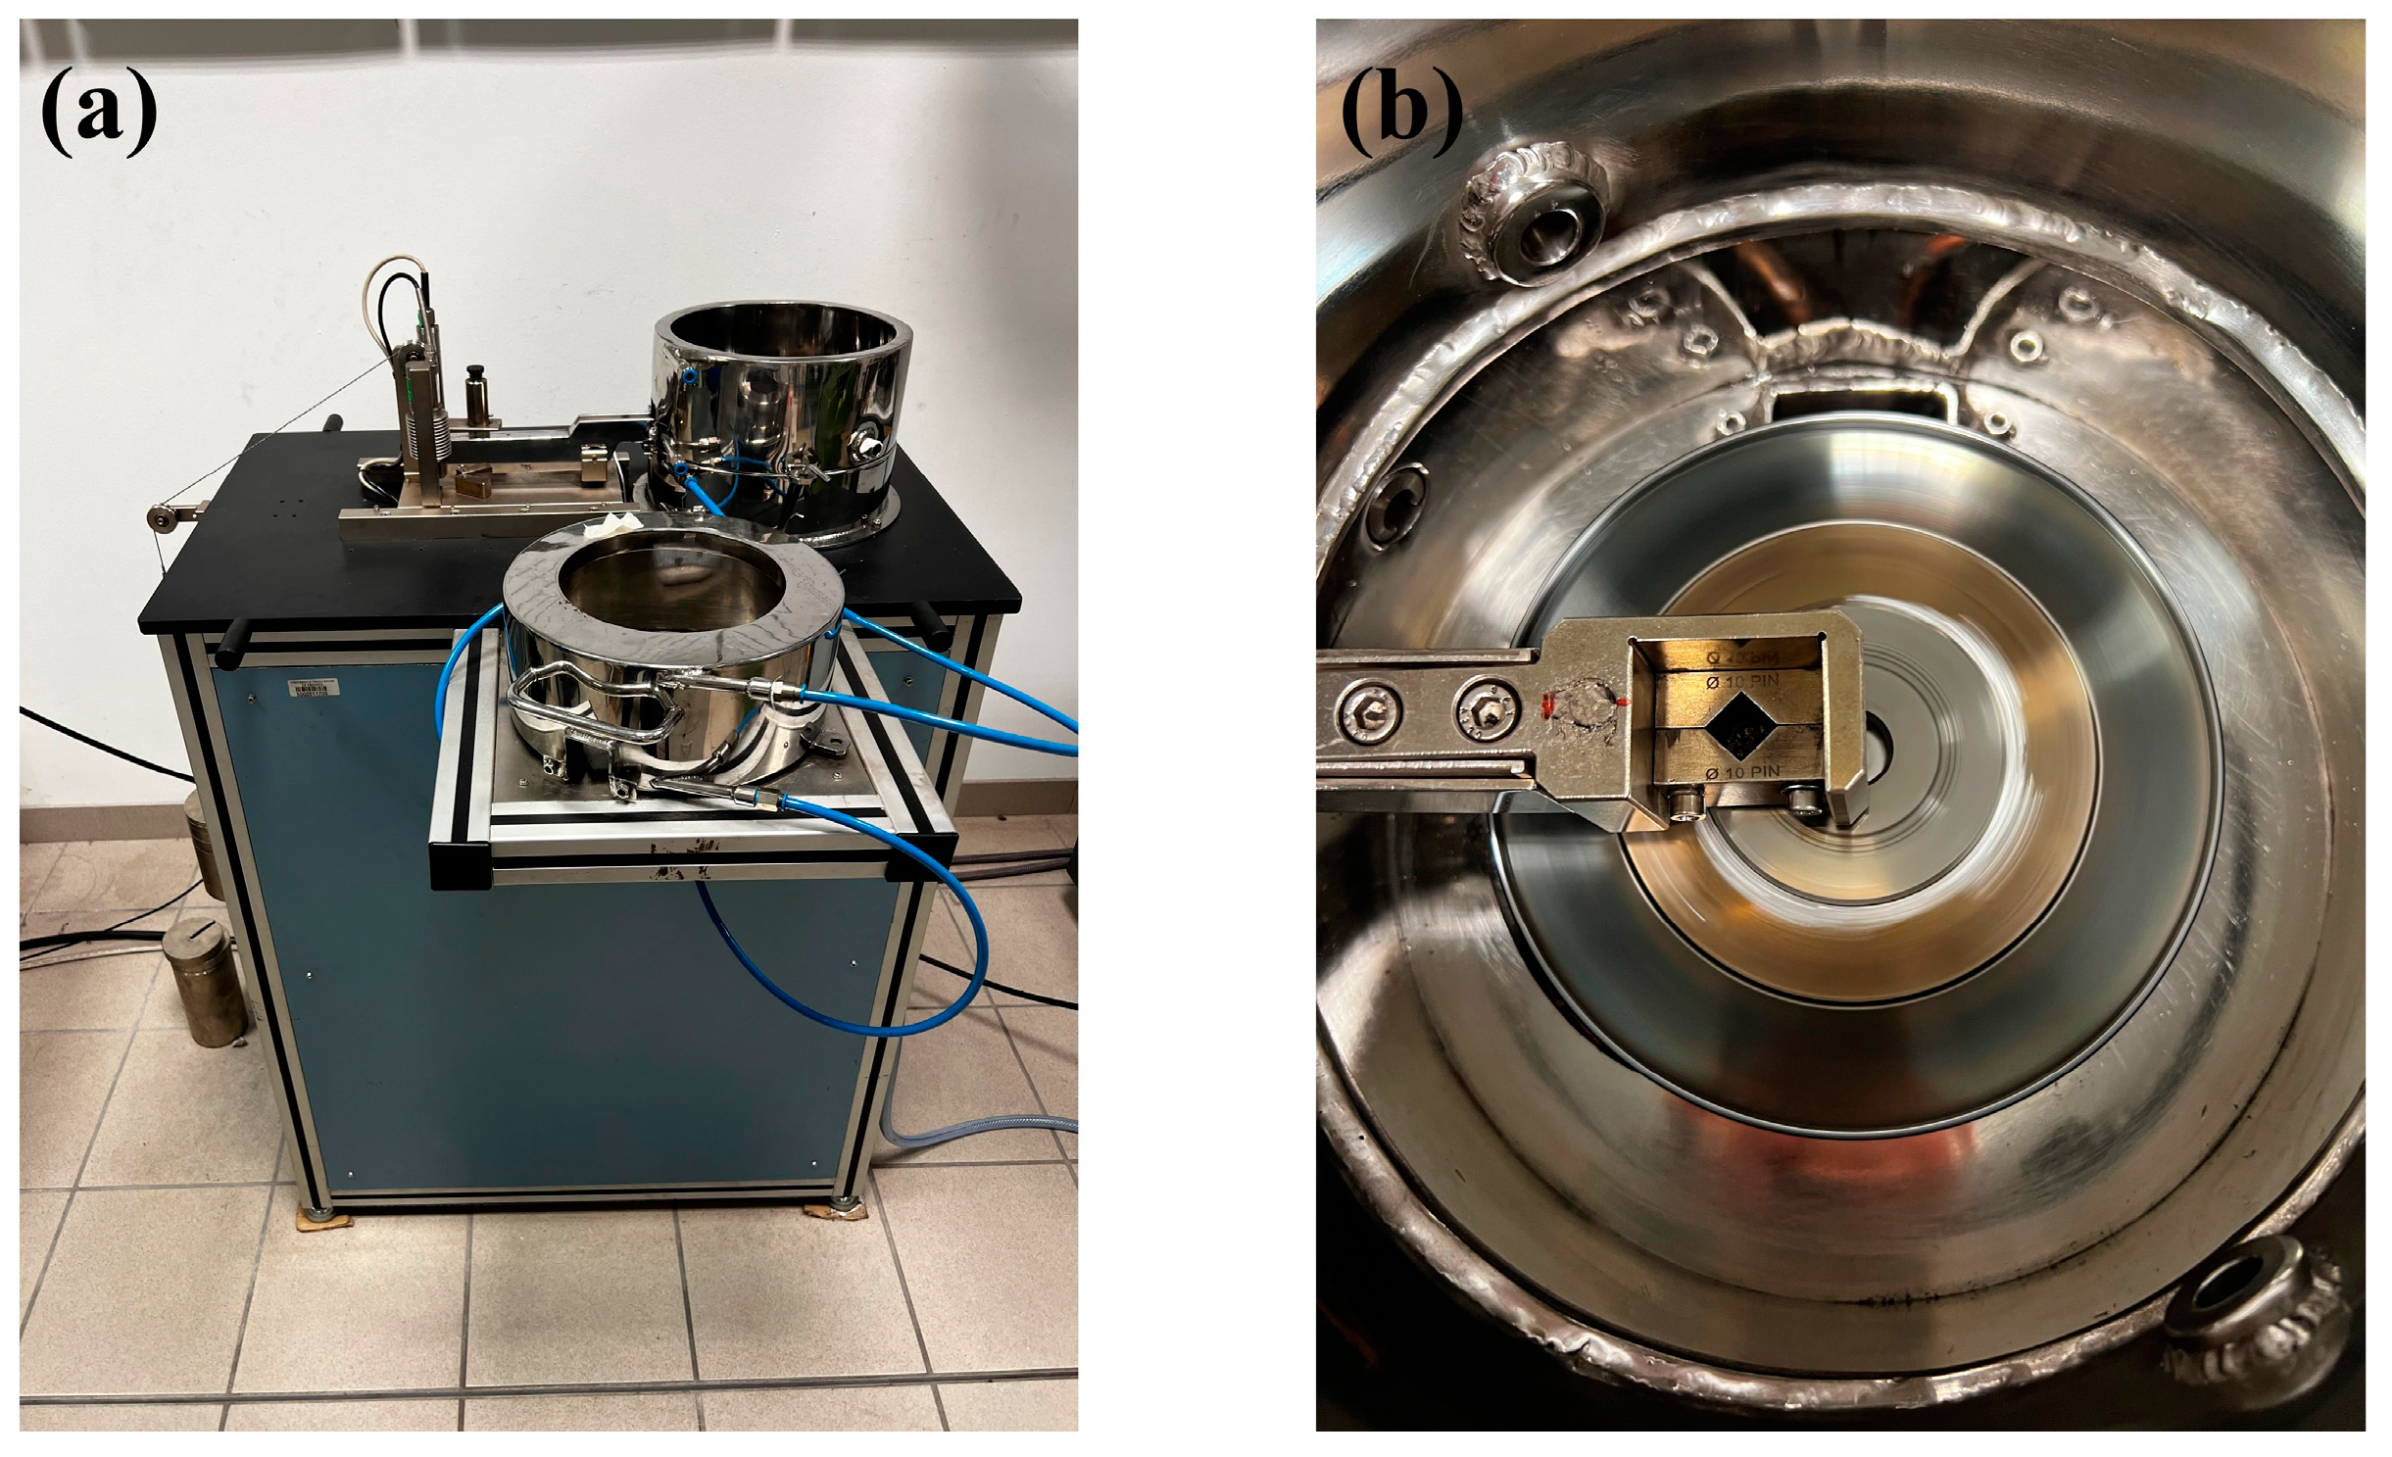
2.2. Pin-on-Disc (PoD) Tests

The pin-on-disc (PoD) test was used to characterize the friction–wear performance of the produced pins and to generate the wear particle emissions. Prepared ready-to-use pins with a diameter of 10 mm and a height of 8 mm were subjected to dry sliding against the disc with a diameter of 60 mm and a thickness of 6 mm made of pearlitic gray cast iron with a Vickers hardness of 232 HV10. Before wear tests, the surface of the discs was polished with SiC abrasive paper (180 grit) and cleaned with acetone. A freshly polished and cleaned disc was always used for a new trial. 2D and 3D images of the disc surface after polishing are shown in Figure 1. The calculated surface roughness Ra of the disc after polishing reached the value of 0.14 µm.
The testing of friction pairs was realized using a PoD tester (Ducom, Karnataka, India), which is shown in Figure 2. Before each test, 30 min long bedding was run to achieve the proper conformity of the pin and disc surfaces. The 90 min long test was run after the bedding period. Both the bedding and the actual tests were conducted at a constant sliding velocity of 1.51 m∙s−1, and the contact load was 79 N. These parameters were selected with the aim of obtaining mild wear conditions [34,35]. The tests were conducted at laboratory temperatures and relative humidity in the ranges of 25–27 °C and 40–45%, respectively. Each formulation was tested three times, always with a new pin and a freshly polished and cleaned disc, to obtain repeatability in the results.
The instantaneous magnitude of CoF during the trials was directly procured from software dedicated to the PoD tester. The mass loss of the pins after the test was obtained as the difference in the weight of the pins before and after the PoD test, and the weight of the pins was registered using an analytical balance with a precision of 10−4 g. The specific wear coefficient of the pin (Ka) was calculated using Equation (1):
Ka = V/ (F × d)
where V is the wear volume loss (calculated as V = m/ρ); F is the load applied; and d is the sliding distance (~8140 m).
To characterize the wear particle emissions generated during the PoD test, the testing chamber was enclosed. In a typical experiment, the air taken from the laboratory was passed thorough the HEPA filter and enter the enclosed PoD chamber, and the air velocity was set to 11.5 m∙s−1 (the magnitude obtained from our previous studies). A TSI® Optical Particle Sizer Spectrometer (OPS, model 3330, TSI Incorporated, Shoreview, MN, USA) connected to the outlet of the testing chamber was used for measurement of the particle number concentrations. Details regarding the set-up of the PoD tester used for the measurement of the particle number concentrations were described in our previous work [33].
To obtain the relevant information regarding the friction–wear performance and the production of wear particles, all tests were repeated three times, always with a new friction couple.

2.3. Characterization of Materials and Worn Surfaces

The chemical composition of the SFS and MFS samples was measured on a SuperMini200 wave-dispersive X-ray fluorescence spectrometer (Rigaku, Tokio, Japan) equipped with a Pd tube (50 kV, 200 W). The samples in the form of pressed tablets were prepared from the mixture of 4 g of sample and 1 g of wax. For the evaluation of the results, a standard-less method was used.
The phase composition of the samples was characterized using X-ray powder diffractometer MiniFlex600 (Rigaku, Tokio, Japan) equipped with a Co tube (600 W) and a D/teX Ultra detector. The samples were pressed in a rotational holder. Registered diffraction patterns were evaluated using SmartLab Studio II software (Rigaku, Tokio, Japan), and the database PDF 2 release 2019 (International Centre for Diffraction Data, Philadelphia, PA, USA) was used for the identification of the crystalline phases.
The morphologies of alumina, SFS, and MFS particles and the worn pin surfaces were analyzed using the scanning electron microscope Explorer 4 Analyser (ThermoFisher Scientific, Eindhoven, The Netherlands).
2D images of the surface of the prepared pins were obtained using the OLYMPUS SZX10 stereomicroscope (Olympus, Tokio, Japan).
The 3D topography of the worn surfaces was obtained using a laser scanning confocal microscope (LSCM) OLYMPUS Lext 3100 (Olympus, Tokio, Japan).
The Brinell hardness of the surface of the prepared pins was measured using the hardness tester Zwick/Roell Z2.5 (Zwick/Roell, Ulm, Germany) with a ball with a diameter of 1 mm made of tungsten carbide. The compressive strength of pins was characterized using the testing machine Zwick/Roell Z150 (Zwick/Roell, Ulm, Germany) with a strain rate of 0.05 mm∙s−1. The Vickers hardness HV10 of the disc was tested using the device Qness 60 A + EVO (QATM GmbH, Mammelzen, Germany).

3. Results and Discussion

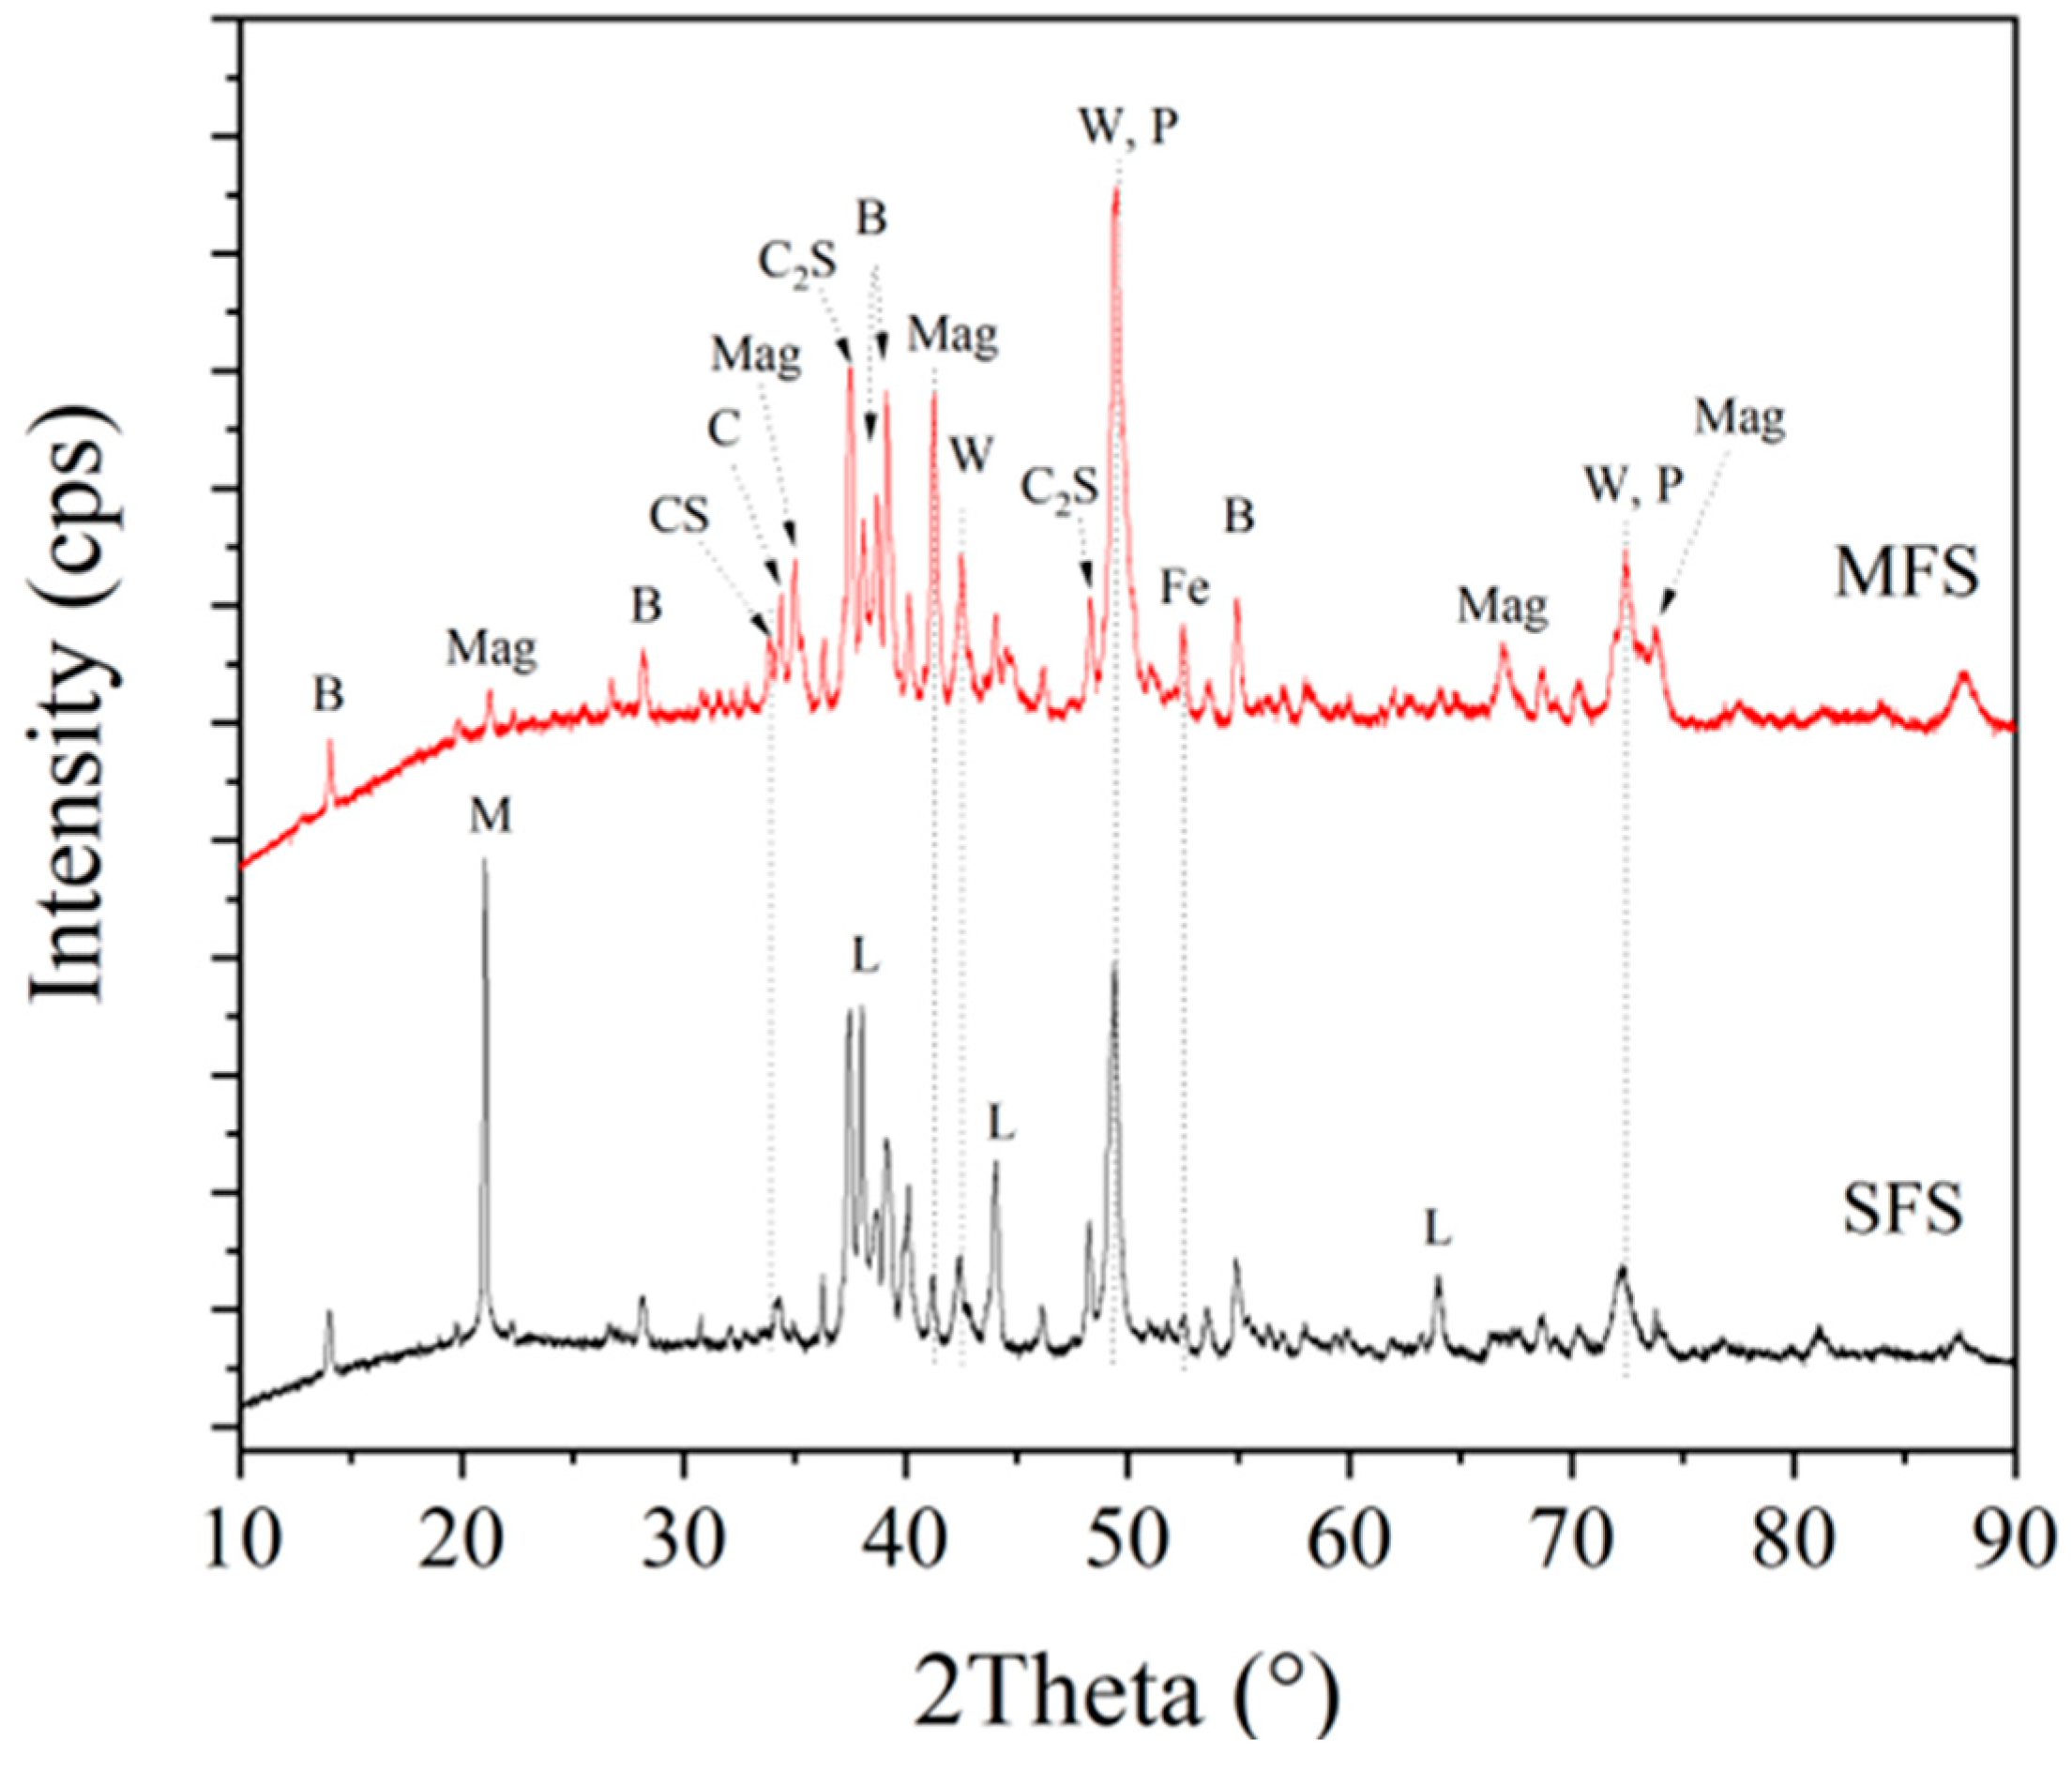
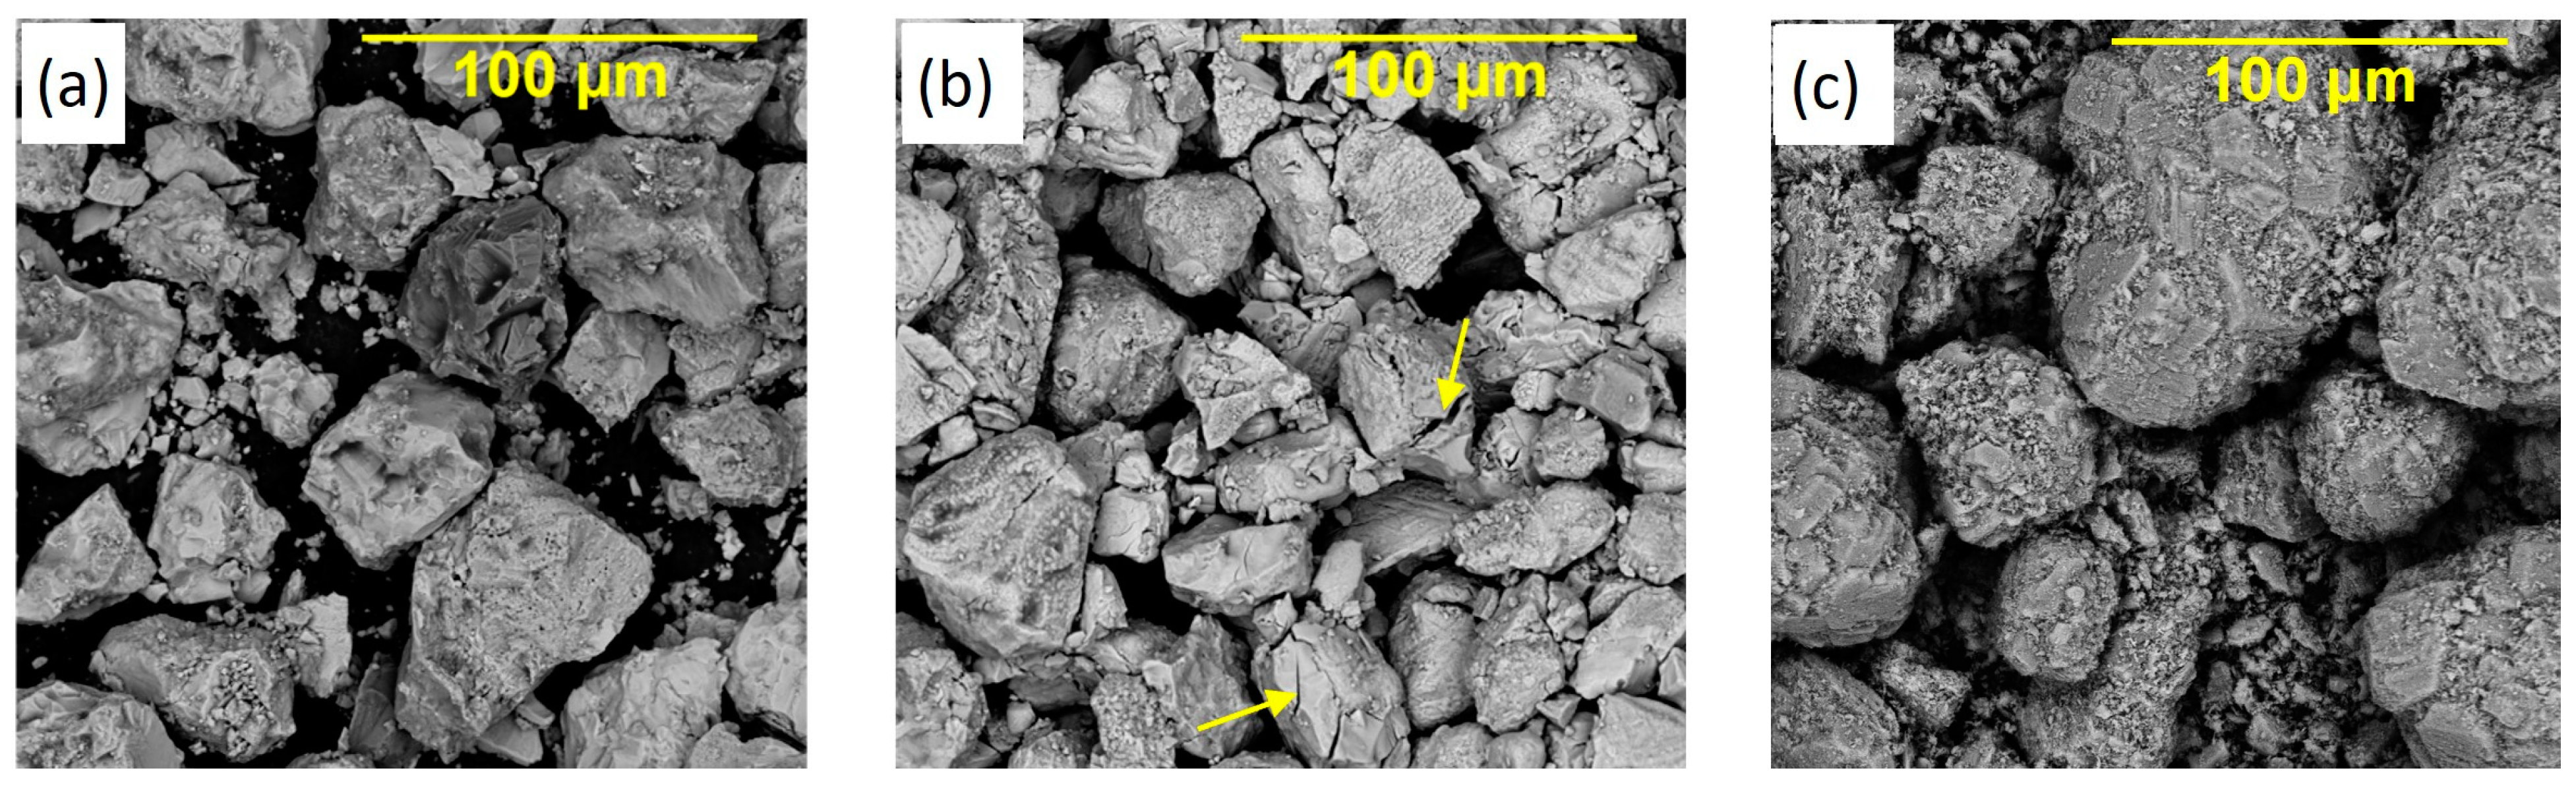
3.1. Characterization of SFS and MFS and Prepared Pins

The chemical composition of SFS and the obtained magnetic fraction MFS is shown in Table 2.
The significantly increased amount of iron (expressed as Fe2O3 in Table 2) measured for the MFS sample shows that the used wet magnetic separation process was successful. Together with iron, only the manganese and magnesium content increased in MFS. On the other hand, the amounts of calcium, silicon, aluminum, phosphorus, and titanium decreased in the MFS sample, indicating both the dissolution of certain phases during the wet separation process as well as the dilution of the given phases, especially with iron-rich phases.
To reveal the phase composition of the original SFS and MFS samples, XRD analysis was used, and diffraction patterns of both samples are compared in Figure 3. In comparison to MFS, the sample SFS consists of a high amount of mayenite (labeled as M, PDF card No. 01-076-7125) and lime (labeled as L, PDF card No. 01-076-1226). The MFS sample consists of calcite (labeled as C, PDF card No. 01-080-2795) as a result of the carbonation of portlandite that originated from lime and mayenite during the reaction of these phases with water used for the wet magnetic separation process. Both SFS and MFS consist of brownmillerite (B, PDF card No. 01-071-0667), magnetite (Mag, PDF card No. 01-089-0691), wollastonite (CS, PDF card No. 00-066-0271), larnite (C2S, PDF card No. 00-009-0351), wüstite (W, PDF card No. 01-074-1880), periclase (P, PDF card No. 01-076-6599) and metallic iron (α-Fe, PDF card No. 01-076-6588). The intensity of the diffraction lines of magnetite, wüstite, and metallic iron is pronouncedly increased in MFS due to the enrichment of MFS with these phases after the wet magnetic separation process (see Figure 3).
The morphology of the SFS, MFS, and alumina particles observed with SEM is shown in Figure 4.
Back-scattered electron images of SFS and MFS particles (Figure 4a,b) reveal an uneven shape of their particles. Visible cracks are evident in the MFS particles because of the intensive action of powerful ultrasound during the magnetic separation process. The presence of a fine fraction of particles is observable in both SFS and MFS samples. The SEM image of alumina particles (Figure 4c) shows a wider particle size distribution and a significantly higher portion of fine particles agglomerated to larger rounded aggregates with a diameter of around 100 microns.
The surface of the prepared pins was observed using a stereomicroscope, and the obtained images are shown in Figure 5. The presence of small pores was observed on the surface of the prepared pins, and the examples of these pores are marked with orange arrows in the images in Figure 5.
The character of the pins’ surfaces close to the steel fibers observed using the LSCM technique is shown in Figure 6. 2D images of the surface of the pins are shown in the upper part of Figure 6; the 3D images obtained for the given areas are shown directly below and accompanied by the values of the surface roughness. The images indicate that the surface of the freshly prepared pins was not ideally smooth, with the surface roughness ranging from 0.8 to 1.59 µm.
The bulk density, the Brinell hardness of the pins, and their compressive strength values are listed in Table 3.
As evident from Table 3, the bulk density of the samples increased in the order of FC–Al < FC–SFS < FC–MFS. The higher bulk density of the composites FC–SFS and FC–MFS is related to the higher iron content in these samples as a consequence of its higher content in SFS and MFS components. Composites FC–SFS and FC–MFS show significantly higher hardness of the surface and compressive strength in comparison to FC–Al (Table 3), and the SFS and MFS can be also considered as particulate reinforcement in these composites. Higher values of mechanical properties could be related to the character of the particles of these components. The alumina particles appear in the form of agglomerates (Figure 4c), while the SFS and MFS particles occur as large and compact particles (Figure 4a,b).

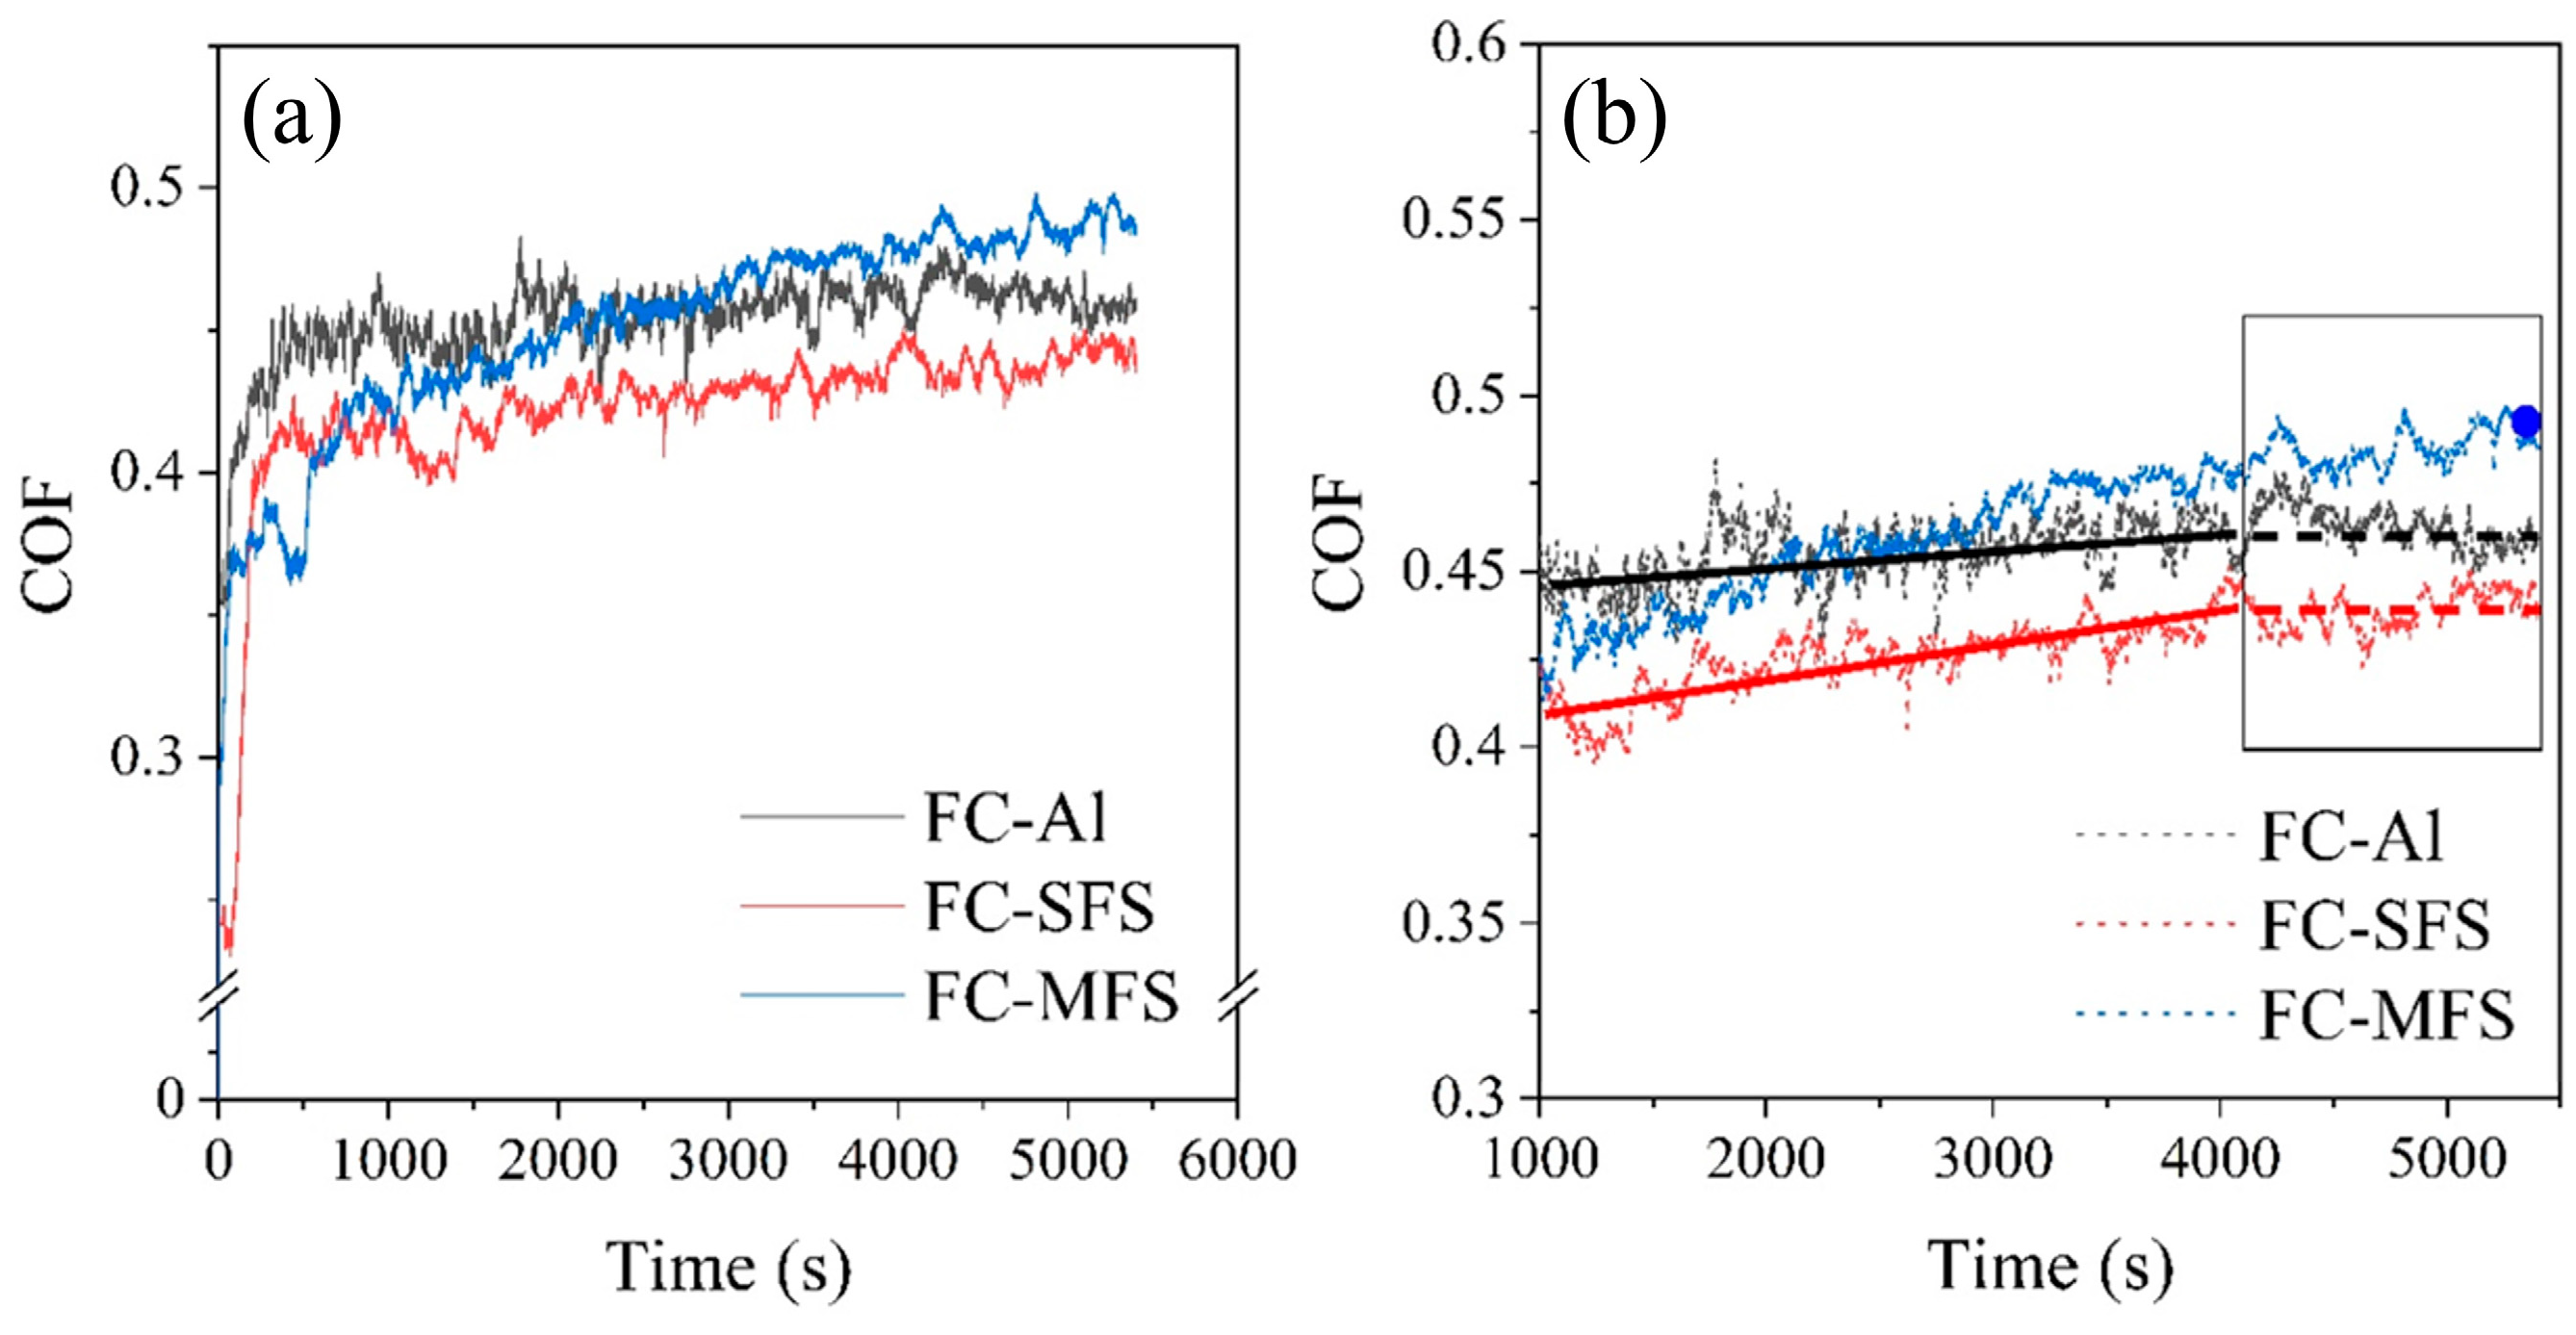
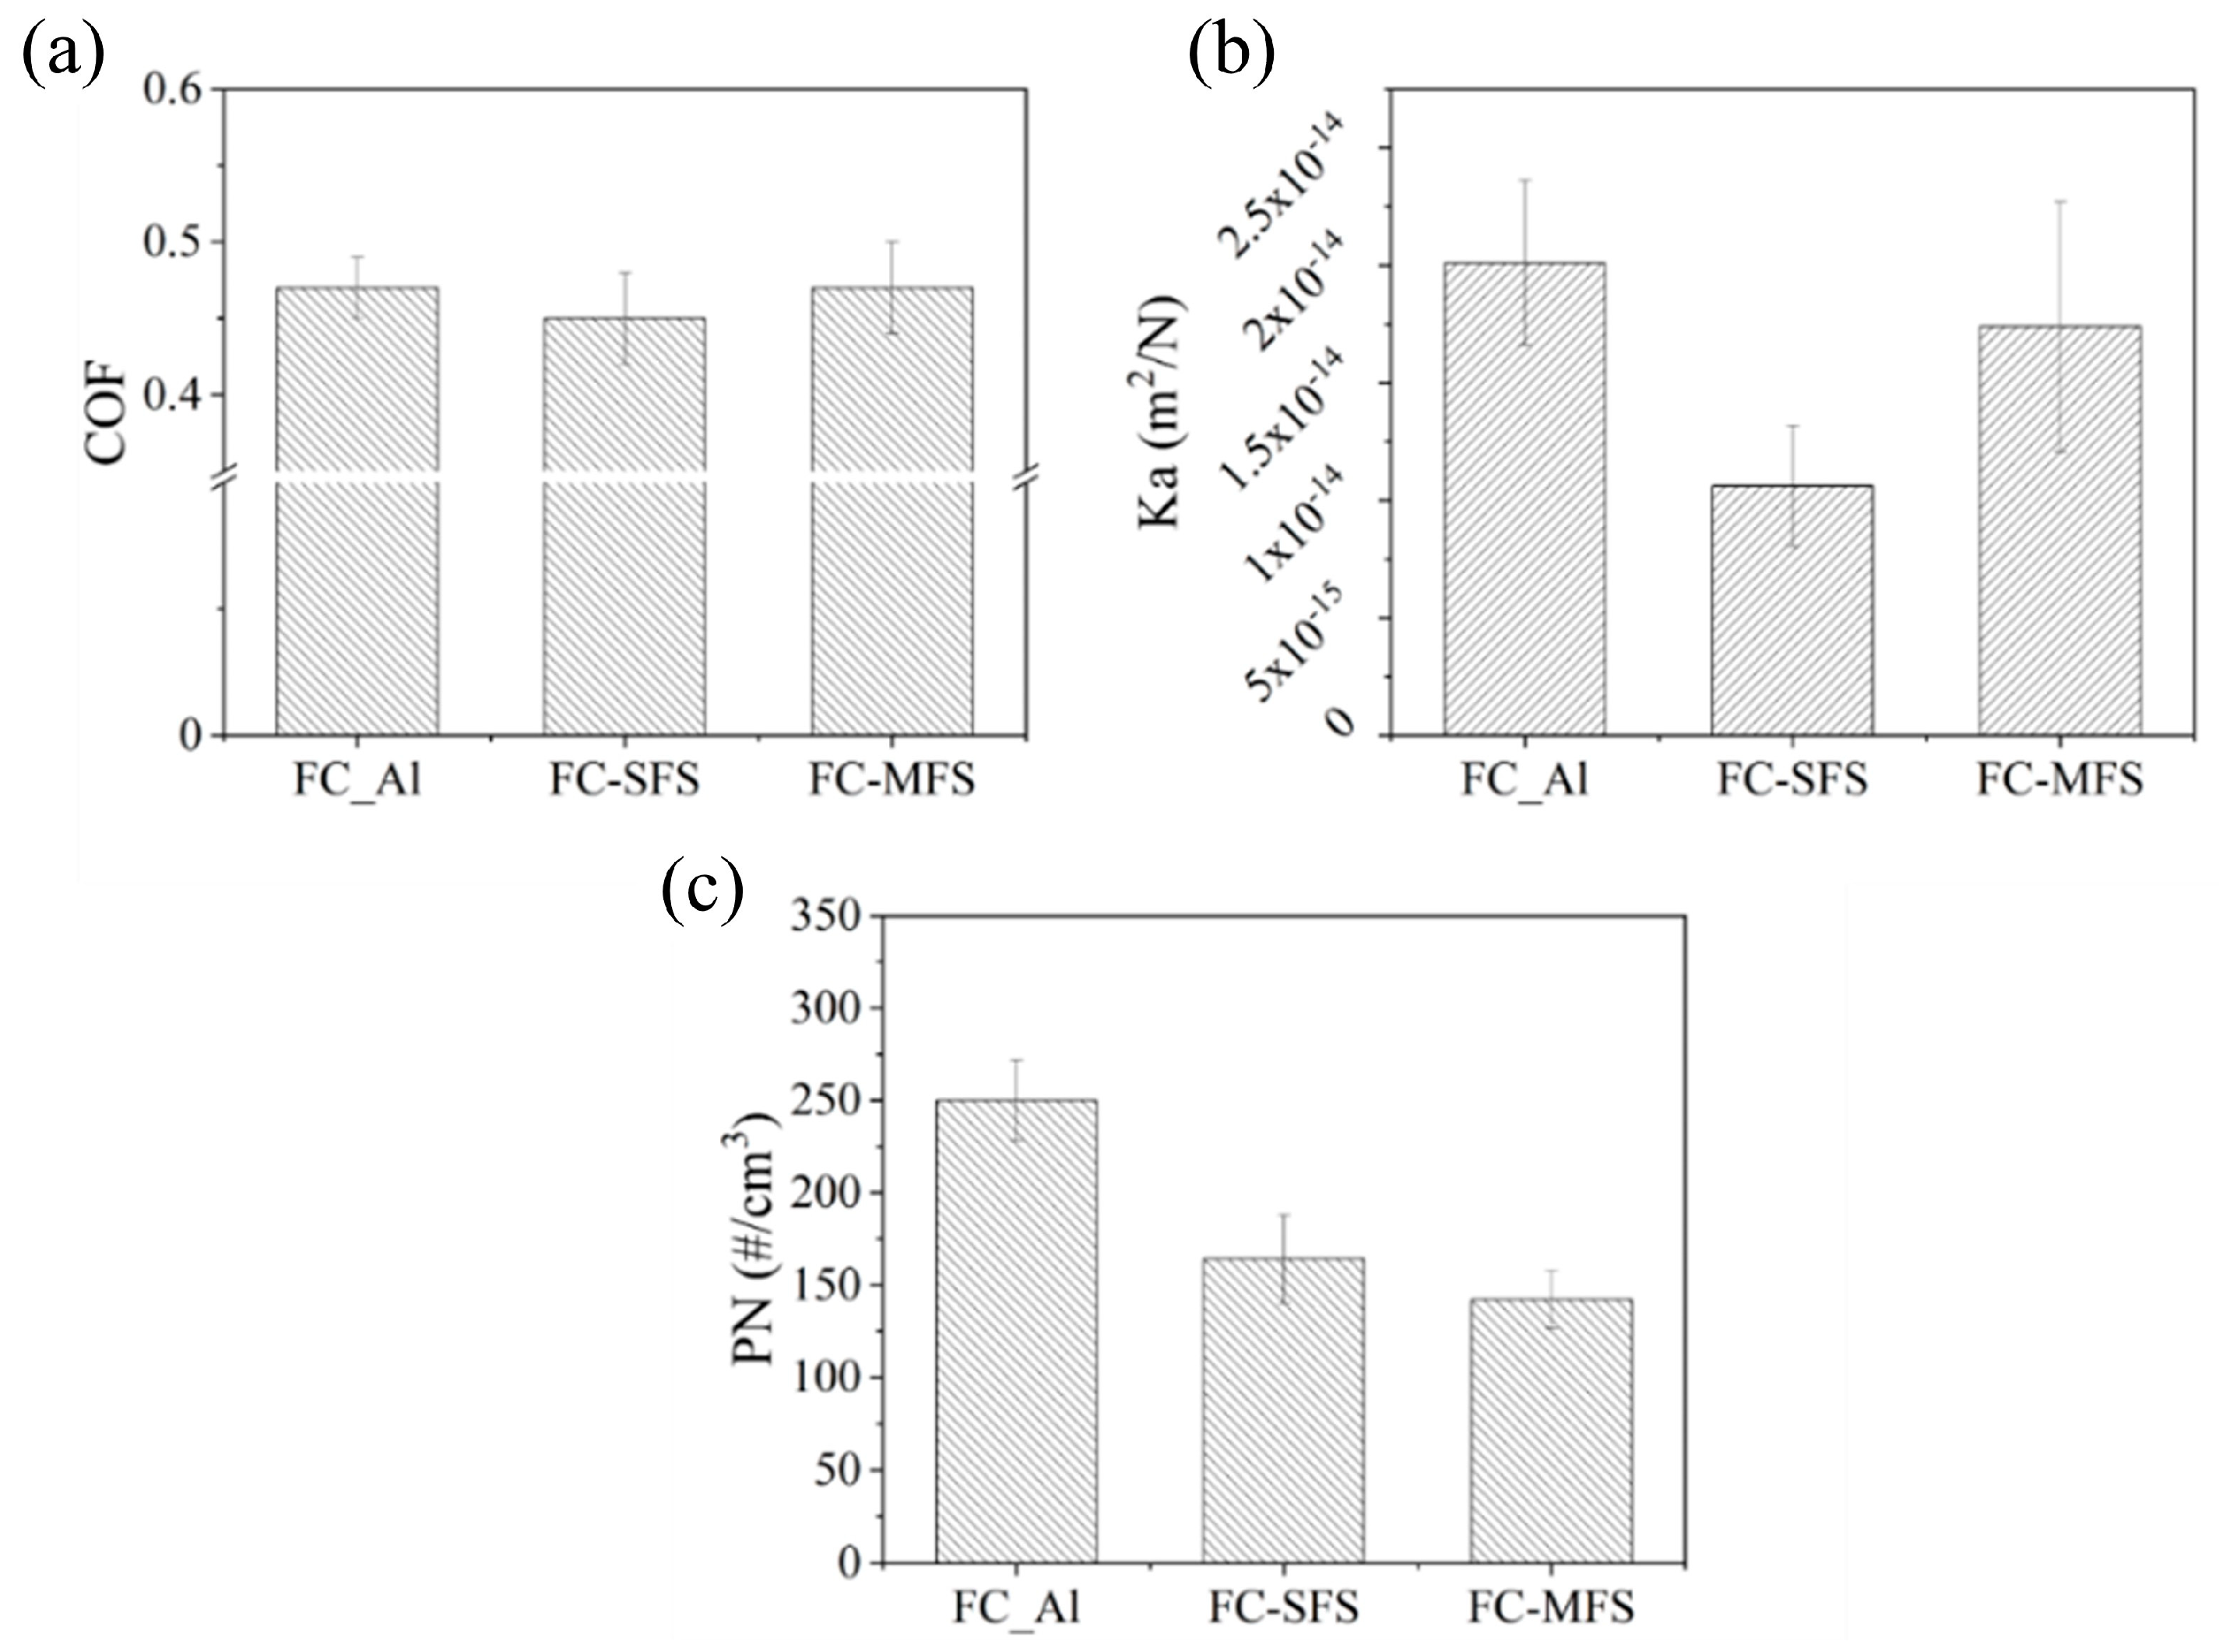
3.2. Friction–Wear Performance and Wear Particle Emissions Tested on PoD

The typical profiles of instantaneous CoF values for tested formulations obtained during the PoD test are shown in Figure 7.
Although the instantaneous CoF values obtained for the FC–Al composite are higher than the values obtained for the FC–SFS composite (Figure 7a), the CoF curves obtained for these samples show a very similar run and reached steady state. The CoF curve of FC–MFS shows an ever increasing character (Figure 7a), and no steady state was observed for this sample. The drag type of testing typical for the PoD test means that the pin and disc are instantly in contact during the test at a constant load and velocity. During this type of test, the friction interface usually became stable, reflected in the stabilization of the CoF values [36]. The stabilization of the friction behavior in this kind of the test is most probably connected to reaching the equilibrium between the build-up and the degradation of the secondary contact plateaus described by, for example, Eriksson et al. [37]. In the case of FC–MFS, the steady state was not reached, and the CoF grew even during the final period of the test. This fact could signal the progressive formation of secondary contact plateaus favorable for the adhesive character of the friction contact or the progressive enrichment of secondary contact plateaus with fragments of MFS, which increased the abrasive character of the friction film.
The average values of the friction coefficient (CoF), the specific wear coefficient, and the particle number concentrations (PN) obtained for the studied samples during PoD tests are compared in Figure 8. The values presented in Figure 8 represent the average of the values obtained during the individual PoD tests (see Section 2.2). In the case of CoF, for composites FC–Al and FC–SFS, the average value was obtained from the average CoF value in steady-state regions, while in the case of FC–MFS the CoF value was obtained as the average of the last CoF values in all three repetitions.
The average CoF values obtained for FC–Al and FC–SFS at the steady states of all trials (steady-state regions are documented with dashed straight lines in Figure 7b), and the value obtained for FC–MFS as the average of the final CoF values (indicated by the blue point on the CoF curve in Figure 7b), fall within the error range (Figure 8a), and thus the difference of CoF cannot be reliably stated. As evident from Figure 8b, the lowest value of the specific wear coefficient of the pin was observed for the FC–SFS composite, followed by the FC–MFS sample, and the highest value of the specific wear coefficient was obtained for the FC–Al sample. The higher value of the specific wear coefficient observed for the FC–Al sample is associated with the presence of alumina, which has a significantly higher hardness compared to the hardness of the mineral phases in SFS and MFS.
Recently, the effect of zircon on friction–wear performance was studied by Park et al. [22]. Although the authors did not observe a clear relationship between the zircon particle size and the specific wear rate of pins, the authors provided evidence of its significant effect on the wear rate of the disc rotor. The authors observed that ZrSiO4 particles of a smaller size had a positive effect on the reduction of the disc wear rate. The positive effect of the larger SiC abrasive particles on the reduction of the specific wear rate of the pins was observed by Matějka et al. [15], and the published findings are in good agreement with the behavior of the samples studied within this research. The MFS particles show the presence of cracks, as documented in Figure 4b, and during the friction process, these particles are easily fragmented, contrary to compact SFS particles. In accordance with the observation of Matějka et al., the fragments of fine MFS particles are responsible for the increased value of the specific wear rate observed for FC–MFS pins in comparison with this value obtained for FC–SFS pins. The MFS fragments became part of the third body and finally participated in the formation of compacted secondary contact plateaus. The most pronounced effect of the studied abrasives is reflected in the PN values (Figure 8c). The lowest wear particle emissions were produced with samples containing the slags in the order FC–MFS < FC–SFS << FC–Al (Figure 8c). The highest production of wear particles in the case of FC–Al was expected considering the highest wear rate of pins observed for this sample. In the case of slag-containing samples, the sample FC–MFS shows lower wear particle production, although it exhibits a higher pin wear rate in comparison to the sample FC–SFS. As already proven by several authors, both the friction material and the disc rotor equally participate in the production of wear particles. The friction composite with MFS, which consists of a higher amount of iron-based phases, was less aggressive toward the disc rotor, and thus the participation of the disc rotor in wear particle production was suppressed. The smaller size of the MFS abrasive fragments also positively influenced the wear rate of the disc rotor, as previously described by Park et al. [22] for zircon abrasive.

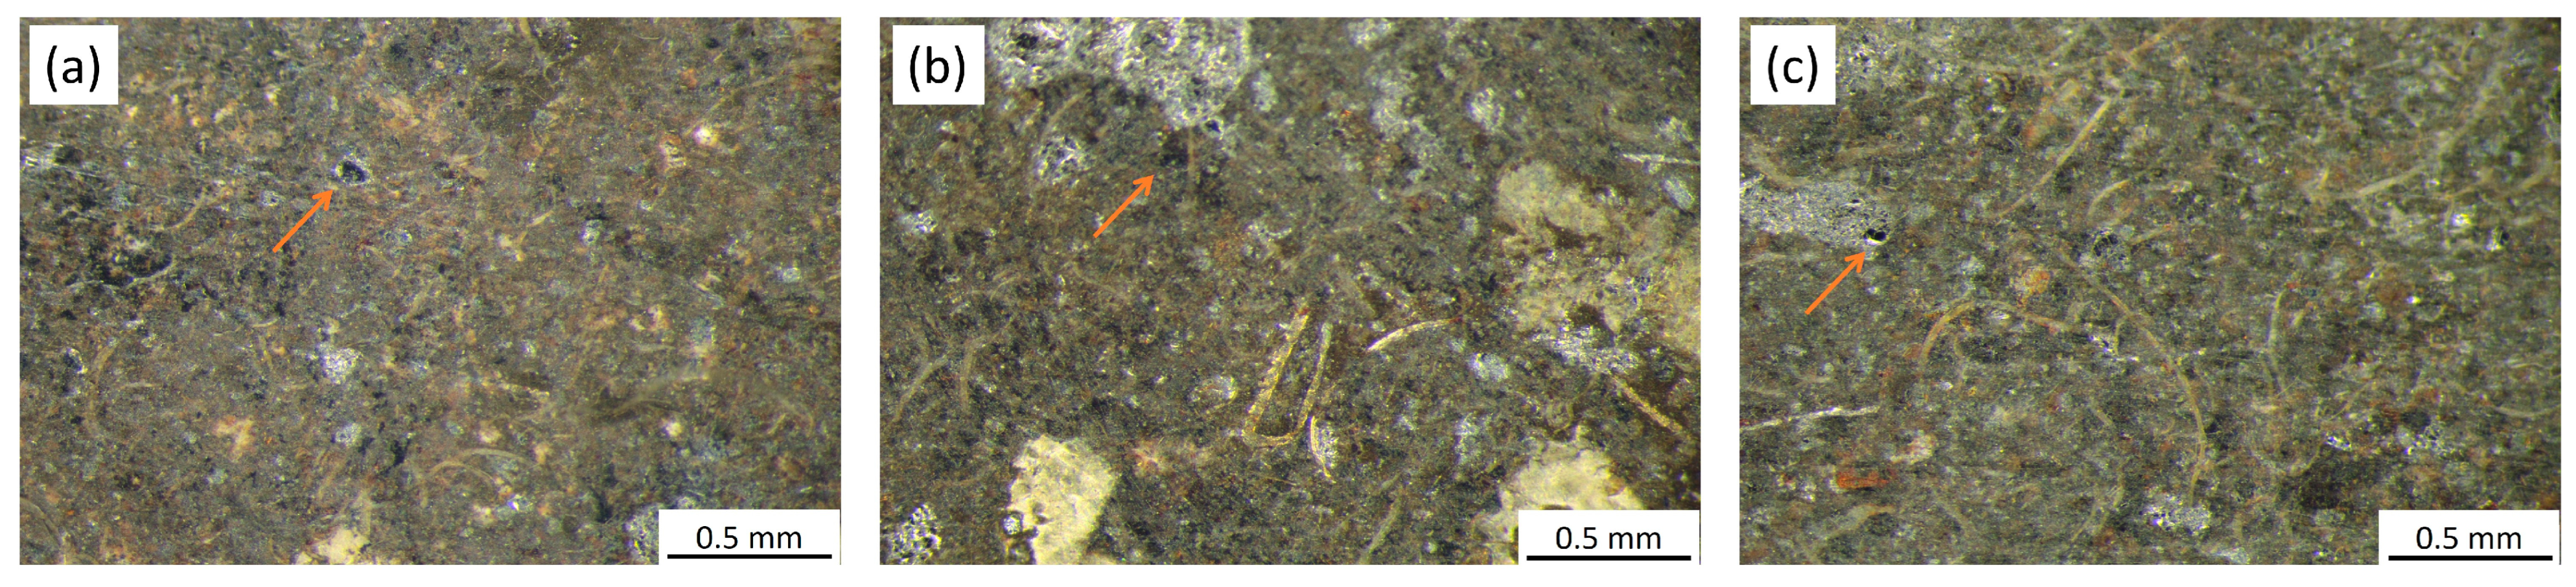
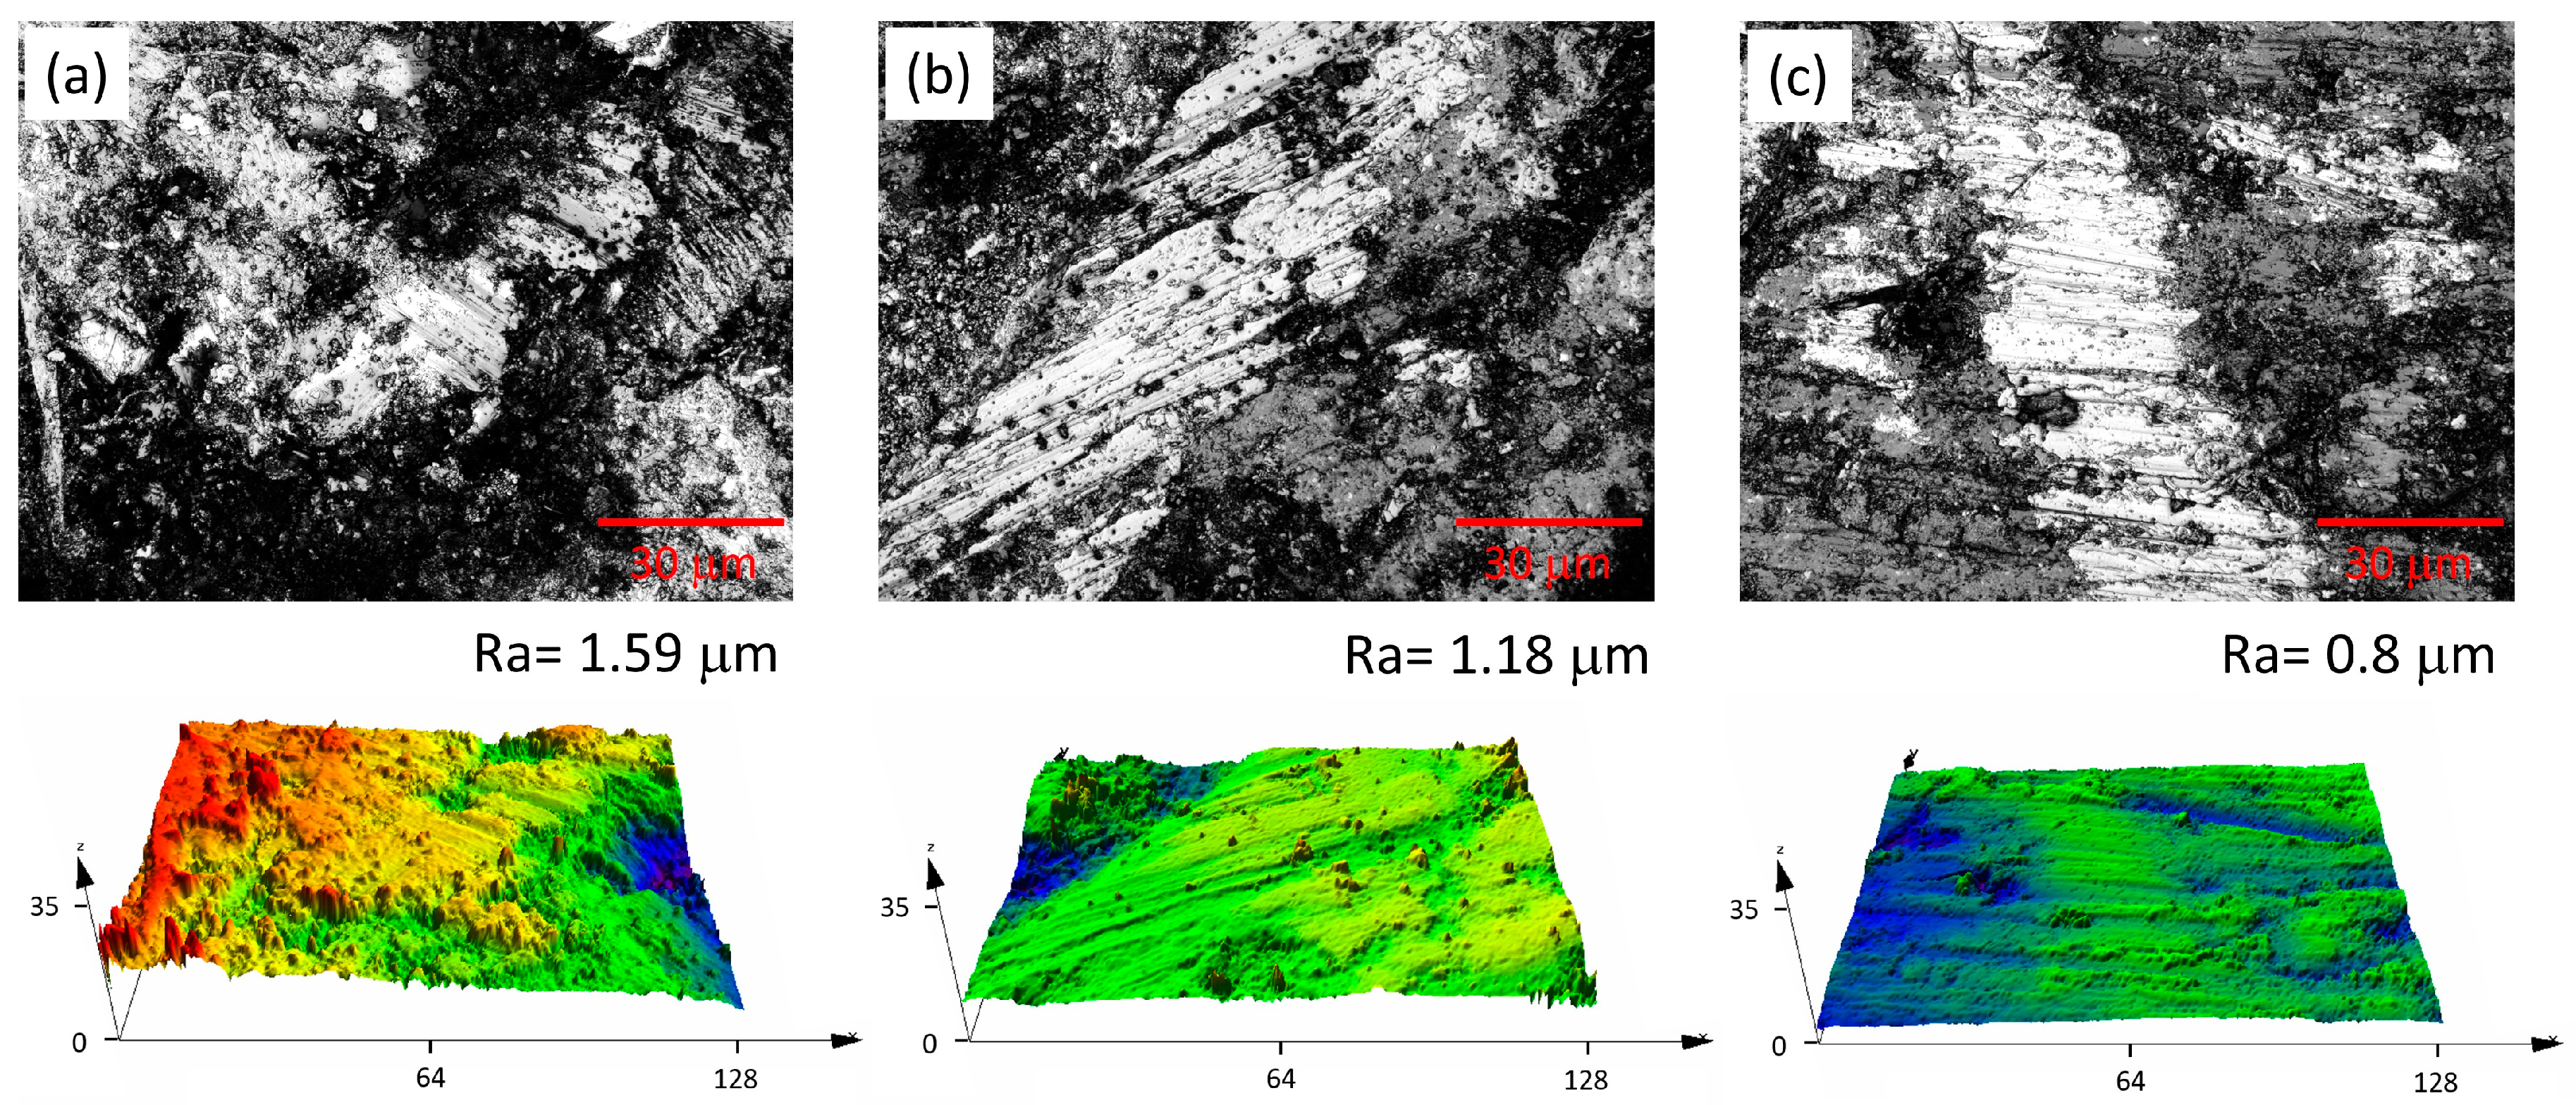
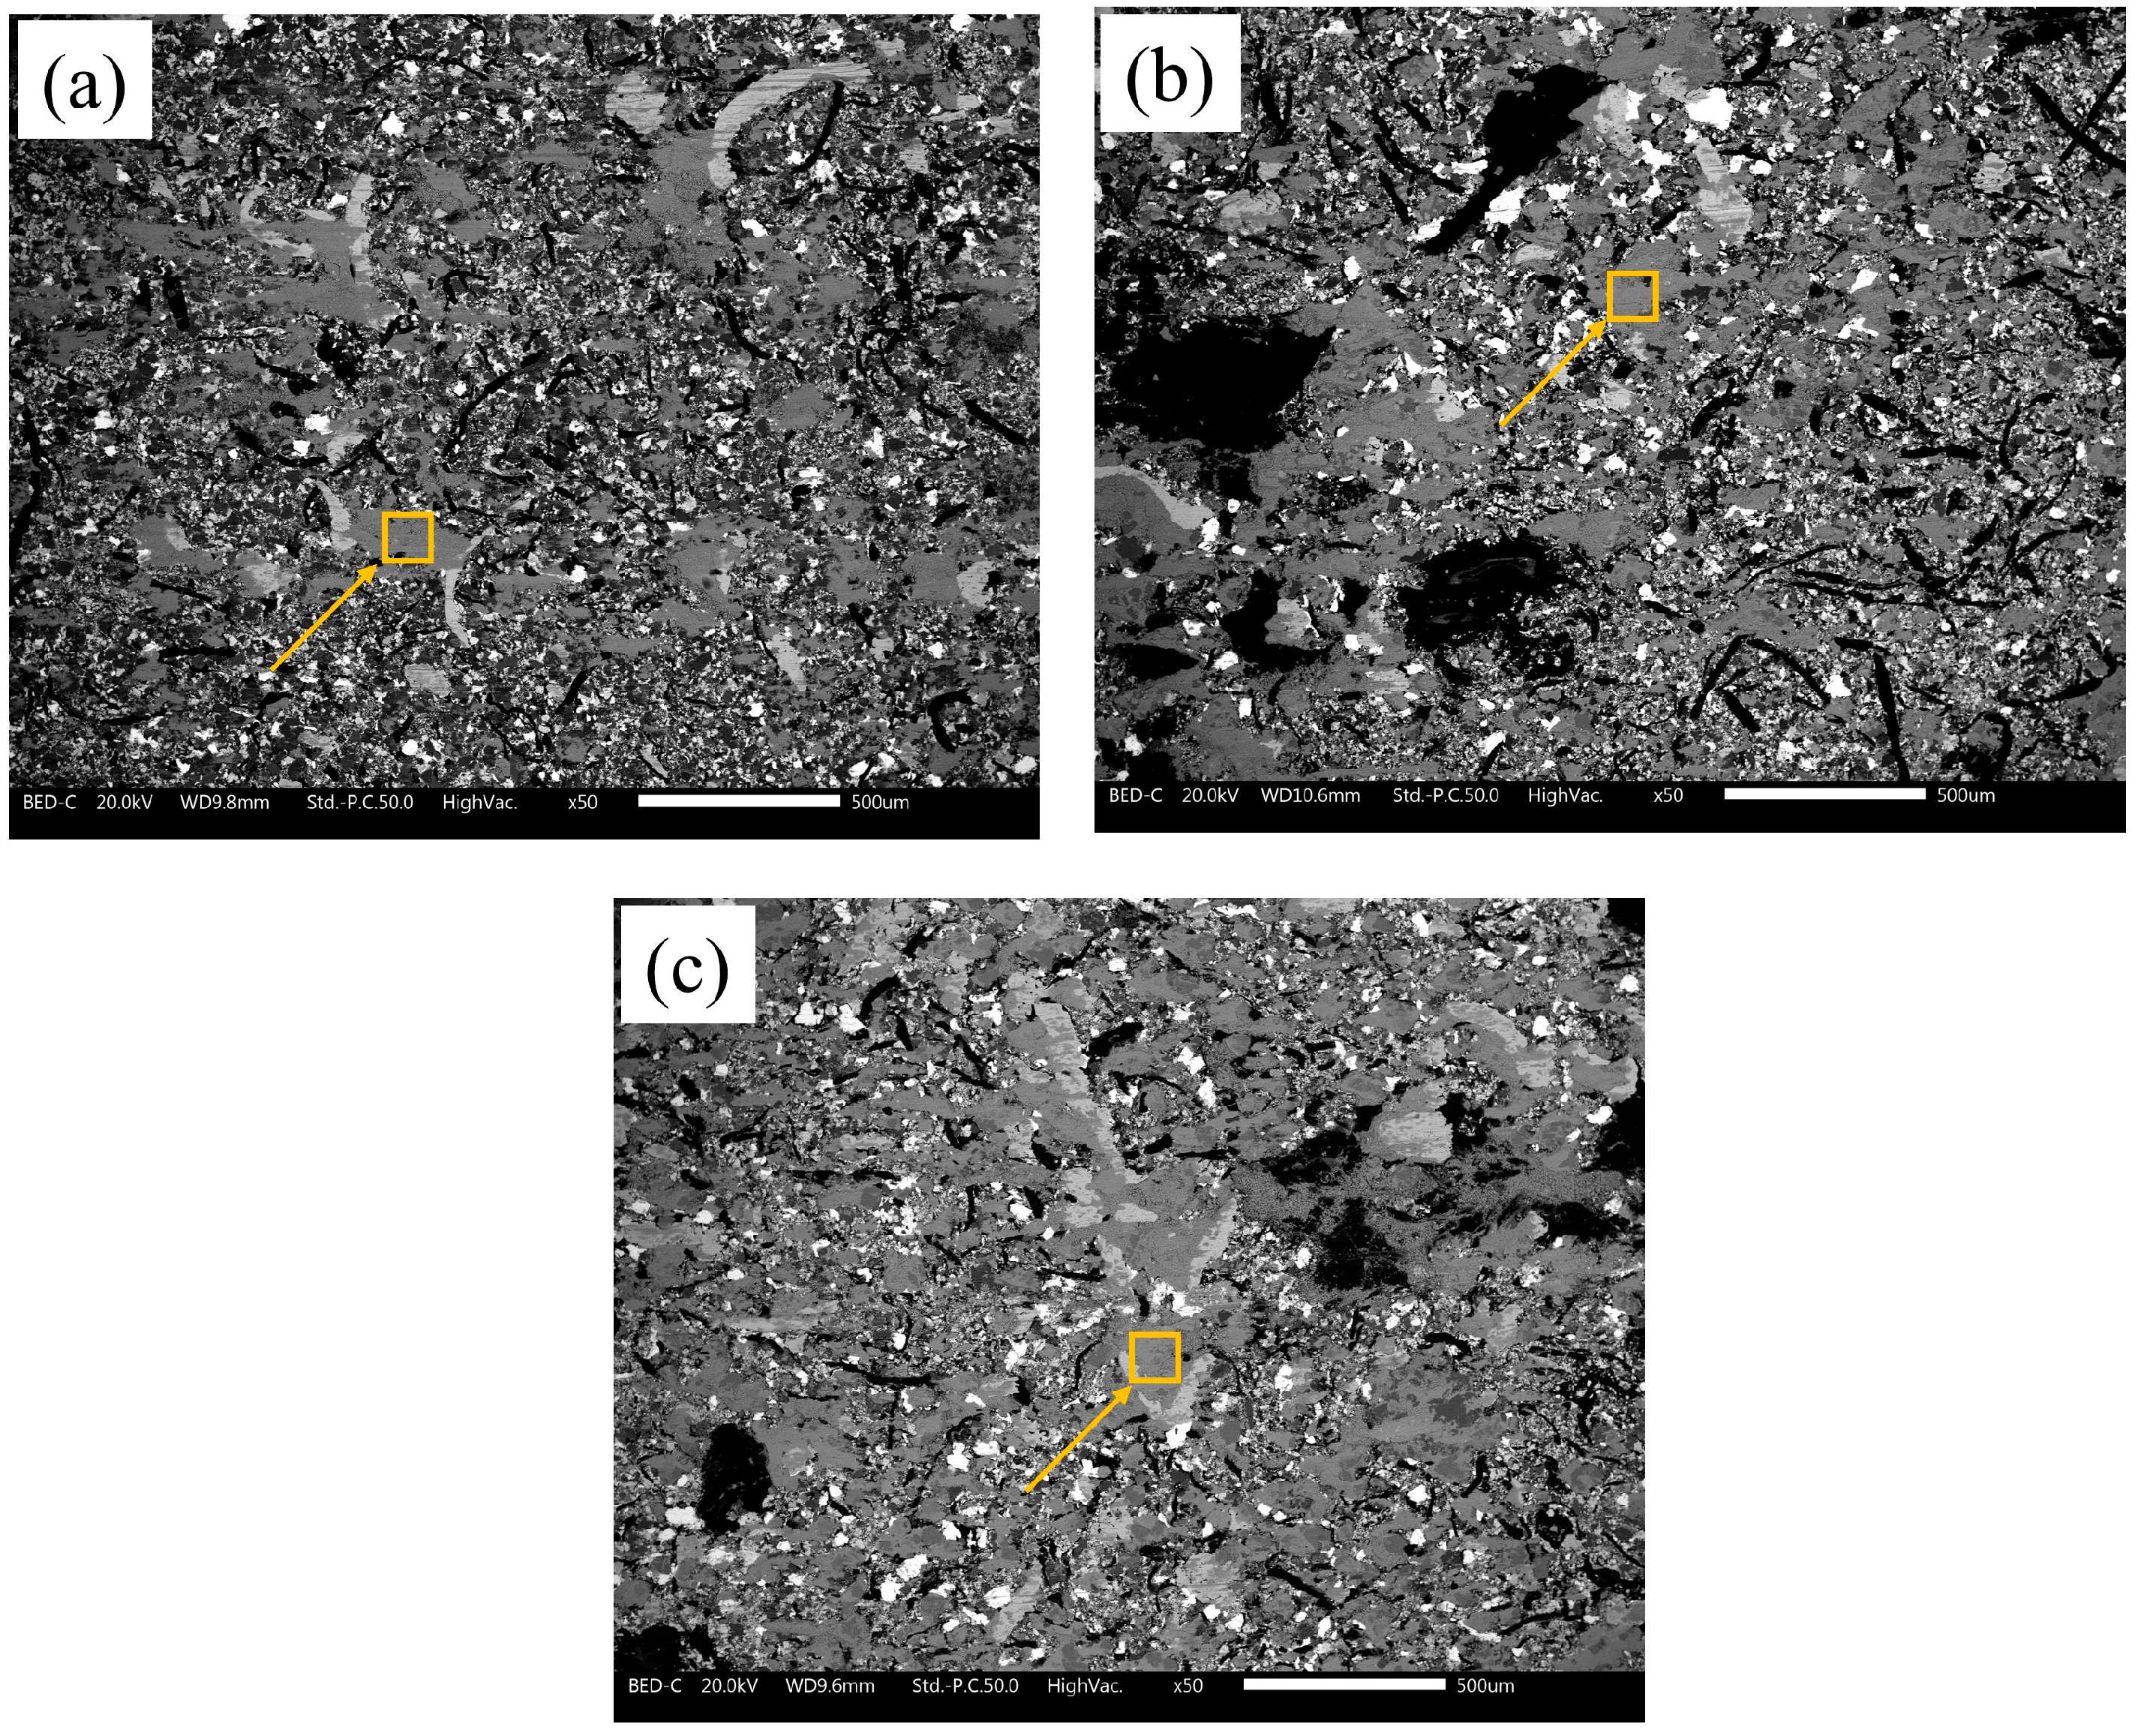
3.3. Characteristics of Worn Pin and Disc Surfaces

The character of the friction surfaces of FC–Al, FC–SFS and FC–MFS pins is shown in Figure 9. For the area covered with secondary contact plateaus, an example of their appearance is indicated with orange arrows in Figure 9. It increases in the order of FC–Al < FC–SFS < FC–MFS. The PoD test was conducted under constant load, and the real contact area of the pin to the disc significantly influences the real contact pressure at this interface. The pronounced formation of the secondary contact plateaus caused the contact pressure to decrease with the same load, which could also have an important influence on the local temperature at the interface of the pin´s contact plateaus with the disc.
The chemical composition of secondary contact plateaus was analyzed using EDX analysis implemented using a SEM microscope, and the measured contents of the elements are listed in Table 4.
The chemical composition of secondary contact plateaus (Table 4) clearly divides the samples into alumina-based (FC–Al) and slag-based (FC–SFS and FC–MFS) groups. As expected, the content of aluminium in FC–Al is the highest due to the presence of alumina abrasive. The higher content of iron in secondary contact plateaus analyzed in FC–SFS and FC–MFS reflects both the contribution of iron-containing phases in friction composites as well as the contribution of the disc rotor on their formation. The highest content of iron was determined in the secondary contact plateaus of the FC–MFS sample, which is in alignment with the fact that magnetic fraction MFS is significantly enriched with iron in comparison to the original SFS (see Table 2). On the other hand, the enrichment of secondary contact plateaus with iron in the case of MFS was expected to be higher because MFS consists of more than 20% higher iron content compared to SFS (Table 2). This fact indicates a suppressed transfer of iron from the disc rotor to the pin’s friction surface of FC–MFS due to the lower aggressiveness of MFS toward the disc compared to SFS and alumina abrasives. Contrary to Zheng et al. [38], who observed the delamination of the friction layer for composites with the same amount (20 wt.%) of waste foundry sand, we observed a compact character of the friction surface, which is evident in LSCM images in Figure 10.
LSCM was further used to obtain 3D images of secondary contact plateaus (Figure 10), and the surface roughness of the observed secondary contact plateaus was quantitatively expressed as Ra values. These values are shown in Figure 10. Upon comparing the Ra values, it is evident that the secondary contact plateaus of the sample FC–SFS are rougher in comparison to the plateaus of composites with smaller alumina particles (FC–Al) or cracked MFS particles (FC–MFS).
The wear tracks formed on discs tested with SFS and MFS abrasives are shown in Figure 11. 2D and 3D images of the surface topography of wear tracks are shown in Figure 12.
Both Figure 11 and Figure 12 confirm the rougher character of the wear track observed on the cast iron disc slid against FC–SFS. The smoother character of the wear track on the disc paired with FC–MFS confirms the previous statement about the positive effect of MFS with smaller particles on the decreased wear rate of the disc. The dark gray areas observed on the friction surfaces of the discs (Figure 12) represent the friction film transferred from the surfaces of the pins. Figure 12a documents the fragmented character of the transferred film, while Figure 12b shows the well-compacted and smooth character of the transferred friction film. The film transferred to the disc surface represents the secondary contact plateaus formed on the surface of the pin during friction contact with the disc. This observation supports the previously mentioned fact that there is equilibrium between the formation and deformation of secondary contact plateaus in the case of the FC–SFS composite, and it implies a greater contribution of the abrasive character of the pin to disc contact in the case of this composite. On the other hand, the observed smooth and compact friction film on the cast iron disc paired with FC–MFS supports the assumption regarding the progressive formation of secondary contact plateaus on the surface of FC–MFS pins. As evident in Figure 12b, the adhered friction film transferred from the FC–MFS pin to the disc surface was not destroyed, as in the case of a friction pair disc/FC–SFS (Figure 12a), which proves the less abrasive character of the pin to disc friction contact. The growing trend of instantaneous CoF values over the duration of the PoD test observed in the case of FC–MFS (see Figure 7) is related to the growing formation of secondary contact plateaus and their larger transfer to the disc, causing the increase in the adhesive character of the friction contact. The enhanced transfer of material from the pin to the disc is associated with the higher specific wear rate observed for the FC–MFS composite (Figure 8b).
Figure 13 and Figure 14 summarize the main features of the FC–SFS and FC–MFS pins’ surfaces and the wear track on the surface of the given disc after the PoD test.
The surface of both discs presented in Figure 13a and Figure 14a shows the presence of craters (the examples of these craters are marked as yellow rectangles in these images). It was observed that the craters presented on the surface of the disc paired with FC–MFS are filled with the wear particles (in craters, the areas with a typical dark brown color) to a much greater extent compared with the craters on the surface of the disc paired with FC–SFS. Figure 13b,c confirm the discontinuous character of the relatively thick transferred layer deposited on the friction surface of the disc paired with FC–SFS; this feature was also previously observed with the 2D LSCM technique (see Figure 12a).
The main difference in the chemical composition of the secondary contact plateaus formed on the surface of both pins can be addressed by comparing the intensities of the peaks in the EDS spectra obtained from the areas marked with yellow rectangles (Figure 13d,f and Figure 14d,f). Secondary contact plateaus that formed on the surface of FC–SFS (Figure 13e) consist of a much higher content of calcium and aluminium content (Figure 13f) compared to their content in the secondary contact plateaus deposited on the surface of the composite FC–MFS (Figure 14f). The original SFS consists of a large amount of lime (CaO) and mayenite (Ca12Al14O33), as observed in the diffraction pattern of this sample in Figure 3. As evident from the chemical formulas of these phases, they contribute significantly to the calcium content, which is much higher in SFS than in MFS (see Table 2). Both lime and mayenite are not stable in water environments, and they were not identified in the diffraction pattern of MFS (see Figure 3) obtained from SFS using wet magnetic separation. Lime and mayenite are known for their reactivity with water, which is connected to the formation of portlandite or calcium–alumino hydrates [39,40]. During the friction process, the thermal degradation of phenolic resin used as the binder in the friction mixtures occurs, and this process is also accompanied by the release of water [41]. The released water can further react with lime and mayeneite, and Ca(OH)2 is formed. The originated Ca(OH)2 further acts as a ‘glue’ in the mixture with wear particles and causes their compaction in the form of relatively thick layers adhered to the disc surface if paired with FC–SFS (Figure 13b). It can be assumed that Ca(OH)2 was not formed during the test with FC–MFS due to the absence of lime and mayenite in MFS. The absence of Ca(OH)2 caused the formation of a thinner friction film on the disc’s surface. The absence of Ca(OH)2 also caused lower cohesion of the wear particles, enabling them to fill the volume of the craters presented on the surface of the disc. The filled craters become the sources of the fine particles that periodically participated in the formation of a thin friction film between the disc and the pin during the PoD test and predetermined a smoother sliding of the pin to the disc. In the case of FC–MFS, the smoother character of the sliding is further reflected by the finer character of the groove wearing marks on the surface of the disc (compare Figure 13b and Figure 14b).

4. Conclusions

Steel furnace slag represents an abundant secondary product sometimes considered to be waste material. In this paper, we demonstrated that the magnetic fraction obtained from steel furnace slag could be used as a valuable component of Cu-free friction composites. The friction composite consisting of the magnetic fraction exhibited an instantly growing CoF, a lower specific wear rate compared to the composite with traditional alumina abrasive, and the lowest wear particle emission among all tested formulations. The improved performance of the composite with the magnetic fraction was mainly attributed to the following features:
(i)
The higher content of iron-based phases in MFS, which makes the pins more compatible with the cast iron disc rotor, causing its lower wear rate;
(ii)
The cracked structure of MFS particles, which are easily fragmented during the friction process and effectively enrich the friction film that is formed on the pin/disc interface during the friction process;
(iii)
The positive effect of the absence of water-reactive phases in MFS, causing better distribution of the friction film over the pin to surface contact;
(iv)
The greater extent to which the craters were filled with wear particles on the disc surface, which makes the craters effective sources of particles for friction film formation.
The results presented show that steel furnace slags, especially magnetic fractions isolated from these slags, are good candidates as components of Cu-free friction composites. The tests of friction–wear performance using the sub-scale and full-scale dynamometers need to be performed to strengthen confidence in the suitability of the magnetic fraction as a valuable component of Cu-free friction mixtures.

Author Contributions

Conceptualization, V.M. and G.S.; methodology, V.M., G.S., P.J. and P.M.; validation, J.V., P.M. and K.F.; formal analysis, V.M. and G.S.; investigation, P.J., K.F. and P.M.; data curation, V.M., P.J. and P.M.; writing—original draft preparation, V.M.; writing—review and editing, V.M., P.J. and G.S.; supervision, G.S. and J.V.; funding acquisition, G.S., V.M. and J.V. All authors have read and agreed to the published version of the manuscript.

Funding

This work was supported by the project ‘Research on the management of waste, materials and other products of metallurgy and related sectors’, project No. CZ.02.1.01/0.0/0.0/17_049/0008426, granted by the Ministry of Education, Youth and Sports of the Czech Republic, and project SP2024/025 (VSB—Technical University of Ostrava). The European Just Transition Fund supported this work within the Operational Program Just Transition under the aegis of the Ministry of the Environment of the Czech Republic, project CirkArena, number CZ.10.03.01/00/22_003/0000045.

Data Availability Statement

The original contributions presented in this study are included in the article. Further inquiries can be directed to the corresponding author.

Acknowledgments

The authors thank the Ministry of Industry and Trade of the Czech Republic for their support of the project ‘Institutional support for long-term and conceptual development of a research organization Material and Metallurgical Research Ltd.’ in 2024.

Conflicts of Interest

Author Jozef Vlček was employed by Material and Metallurgical Research Ltd. The remaining authors declare no conflicts of interest.

References

  1. Chan, D.; Stachowiak, G.W. Review of automotive brake friction materials. Proc. Inst. Mech. Eng. Part D J. Automob. Eng. 2004, 218, 953–966. [Google Scholar] [CrossRef]
  2. Sathyamoorthy, G.; Vijay, R.; Lenin Singaravelu, D. Brake friction composite materials: A review on classifications and influences of friction materials in braking performance with characterizations. Proc. Inst. Mech. Eng. Part J J. Eng. Tribol. 2022, 236, 1674–1706. [Google Scholar] [CrossRef]
  3. Pizzi, A.; Ibeh, C.C. Chapter 2—Phenol-formaldehyde resins. In Handbook of Thermoset Plastics, 4th ed.; Dodiuk, H., Ed.; William Andrew Publishing: Boston, MA, USA, 2022; pp. 13–40. [Google Scholar]
  4. Vijay, R.; Singaravelu, D.L.; Jayaganthan, R. Development and characterization of stainless steel fiber-based copper-free brake liner formulation: A positive solution for steel fiber replacement. Friction 2020, 8, 396–420. [Google Scholar] [CrossRef]
  5. Singh, T.; Pruncu, C.I.; Gangil, B.; Singh, V.; Fekete, G. Comparative performance assessment of pineapple and Kevlar fibers based friction composites. J. Mater. Res. Technol. 2020, 9, 1491–1499. [Google Scholar] [CrossRef]
  6. Mehta, V.; Kumar, N.; Algahtani, A.; Tirth, V.; Al-Mughanam, T.; Chau, K.-W. Comparative Study of Chemically Treated Sugarcane and Kevlar Fiber to Develop Brake Resistance Composites. Molecules 2023, 28, 4861. [Google Scholar] [CrossRef]
  7. Machado Pinto, R.L.; Horta Gutiérrez, J.C.; Pereira, R.B.D.; de Faria, P.E.; Rubio, J.C.C. Influence of Contact Plateaus Characteristics Formed on the Surface of Brake Friction Materials in Braking Performance through Experimental Tests. Materials 2021, 14, 4931. [Google Scholar] [CrossRef]
  8. Eriksson, M.; Bergman, F.; Jacobson, S. On the nature of tribological contact in automotive brakes. Wear 2002, 252, 26–36. [Google Scholar] [CrossRef]
  9. Akıncıoğlu, G.; Akıncıoğlu, S.; Öktem, H.; Uygur, I. Wear response of non-asbestos brake pad composites reinforced with walnut shell dust. J. Aust. Ceram. Soc. 2020, 56, 1061–1072. [Google Scholar] [CrossRef]
  10. Park, J.; Gweon, J.; Seo, H.; Song, W.; Lee, D.; Choi, J.; Kim, Y.C.; Jang, H. Effect of space fillers in brake friction composites on airborne particle emission: A case study with BaSO4, Ca(OH)2, and CaCO3. Tribol. Int. 2022, 165, 107334. [Google Scholar] [CrossRef]
  11. Ammar, Z.; Ibrahim, H.; Adly, M.; Sarris, I.; Mehanny, S. Influence of Natural Fiber Content on the Frictional Material of Brake Pads—A Review. J. Compos. Sci. 2023, 7, 72. [Google Scholar] [CrossRef]
  12. Vineeth, V.K.; Senthil, S.K. Characterization of Various Properties of Chemically Treated Allium sativum Fiber for Brake Pad Application. J. Nat. Fibers 2022, 19, 523–535. [Google Scholar]
  13. Österle, W.; Dmitriev, A.I. The Role of Solid Lubricants for Brake Friction Materials. Lubricants 2016, 4, 5. [Google Scholar] [CrossRef]
  14. Baskara Sethupathi, P.; Chandradass, J. Effect of zirconium silicate and mullite with three different particle sizes on tribo performance in a non-asbestos brake pad. Proc. Inst. Mech. Eng. Part J J. Eng. Tribol. 2022, 236, 314–325. [Google Scholar] [CrossRef]
  15. Matejka, V.; Lu, Y.F.; Jiao, L.; Huang, L.; Martynkova, G.S.; Tomasek, V. Effects of silicon carbide particle sizes on friction-wear properties of friction composites designed for car brake lining applications. Tribol. Int. 2010, 43, 144–151. [Google Scholar] [CrossRef]
  16. Russo, C.; Gautier di Confiengo, G.; Magnacca, G.; Faga, M.G.; Apicella, B. Insights on non-exhaust emissions: An approach for the chemical characterization of debris generated during braking. Heliyon 2023, 9, e20672. [Google Scholar] [CrossRef]
  17. Zhang, Q.; Liu, H.; He, Z.; Mo, J.; Jin, W.; Shen, M.; Zhao, C. Impact of initial braking temperature on thermal-induced brake fade during long-downhill operations. Eng. Fail. Anal. 2025, 167, 109077. [Google Scholar] [CrossRef]
  18. Lee, W.K.; Rhee, T.H.; Kim, H.S.; Jang, H. Effects of antimony trisulfide (Sb2S3) on sliding friction of automotive brake friction materials. Met. Mater. Int. 2013, 19, 1101–1107. [Google Scholar] [CrossRef]
  19. Perricone, G.; Matějka, V.; Alemani, M.; Valota, G.; Bonfanti, A.; Ciotti, A.; Olofsson, U.; Söderberg, A.; Wahlström, J.; Nosko, O.; et al. A concept for reducing PM10 emissions for car brakes by 50%. Wear 2018, 396–397, 135–145. [Google Scholar] [CrossRef]
  20. Song, W.; Gweon, J.; Park, J.; Kwon, S.U.; Lee, J.J.; Kim, Y.C.; Jang, H. Effects of abrasive particles on the particulate matter emission of brake friction composites. Wear 2022, 504–505, 204436. [Google Scholar] [CrossRef]
  21. Song, W.; Park, J.; Choi, J.; Lee, J.J.; Jang, H. Effects of reinforcing fibers on airborne particle emissions from brake pads. Wear 2021, 484–485, 203996. [Google Scholar] [CrossRef]
  22. Park, J.; Song, W.; Gweon, J.; Seo, H.; Lee, J.J.; Jang, H. Size effect of zircon particles in brake pads on the composition and size distribution of emitted particulate matter. Tribol. Int. 2021, 160, 106995. [Google Scholar] [CrossRef]
  23. Rees, D.; Murray, J. Silica, silicosis and tuberculosis. Int. J. Tuberc. Lung Dis. 2007, 11, 474–484. [Google Scholar] [PubMed]
  24. Chauhan, V.; Bijwe, J.; Darpe, A. Functionalization of alumina particles to improve the performance of eco-friendly brake-pads. Friction 2021, 9, 1213–1226. [Google Scholar] [CrossRef]
  25. Etemadi, H.; Shojaei, A.; Jahanmard, P. Effect of alumina nanoparticle on the tribological performance of automotive brake friction materials. J. Reinf. Plast. Compos. 2014, 33, 166–178. [Google Scholar] [CrossRef]
  26. Chauhan, V.; Darpe, A.; Bijwe, J. Susceptibility of eco-friendly brake-pads to noise-vibration emanation due to siloxane treatment on alumina particles. Appl. Acoust. 2022, 185, 108377. [Google Scholar] [CrossRef]
  27. Giergiczny, Z. Fly ash and slag. Cem. Concr. Res. 2019, 124, 105826. [Google Scholar] [CrossRef]
  28. López-Perales, J.F.; Contreras, J.E.; Vázquez-Rodríguez, F.J.; Gómez-Rodríguez, C.; Díaz-Tato, L.; Banda-Muñoz, F.; Rodríguez, E.A. Partial replacement of a traditional raw material by blast furnace slag in developing a sustainable conventional refractory castable of improved physical-mechanical properties. J. Clean. Prod. 2021, 306, 127266. [Google Scholar] [CrossRef]
  29. Wang, J.; Yang, L.; Luo, W.; Yang, G.; Miao, C.; Fu, J.; Xing, S.; Fan, P.; Lv, P.; Wang, Z. Sustainable biodiesel production via transesterification by using recyclable Ca2MgSi2O7 catalyst. Fuel 2017, 196, 306–313. [Google Scholar] [CrossRef]
  30. Santos, W.F.; Schollbach, K.; Melzer, S.; van der Laan, S.R.; Brouwers, H.J.H. Quantitative analysis and phase assemblage of basic oxygen furnace slag hydration. J. Hazard. Mater. 2023, 450, 131029. [Google Scholar] [CrossRef]
  31. Wang, G.C. Ferrous metal production and ferrous slags. In The Utilization of Slag in Civil Infrastructure Construction, 1st ed.; Wang, G.C., Ed.; Woodhead Publishing: Sawston, UK, 2016; pp. 9–33. [Google Scholar]
  32. Matějka, V.; Jayashree, P.; Leonardi, M.; Vlček, J.; Sabovčík, T.; Straffelini, G. Utilization of Metallurgical Slags in Cu-free Friction Material Formulations. Lubricants 2022, 10, 219. [Google Scholar] [CrossRef]
  33. Jayashree, P.; Matějka, V.; Leonardi, M.; Straffelini, G. A novel path towards limiting non-exhaust particulate matter emissions of a commercial friction material through the addition of metallurgical slag. Sci. Rep. 2023, 13, 666. [Google Scholar] [CrossRef] [PubMed]
  34. Jayashree, P.; Matejka, V.; Sinha, A.; Gialanella, S.; Straffelini, G. A comprehensive study on the particulate matter characteristics of a friction material containing blast furnace slags. Tribol. Int. 2023, 186, 108567. [Google Scholar] [CrossRef]
  35. Chandra Verma, P.; Menapace, L.; Bonfanti, A.; Ciudin, R.; Gialanella, S.; Straffelini, G. Braking pad-disc system: Wear mechanisms and formation of wear fragments. Wear 2015, 322–323, 251–258. [Google Scholar] [CrossRef]
  36. Österle, W.; Dörfel, I.; Prietzel, C.; Rooch, H.; Cristol-Bulthé, A.L.; Degallaix, G.; Desplanques, Y. A comprehensive microscopic study of third body formation at the interface between a brake pad and brake disc during the final stage of a pin-on-disc test. Wear 2009, 267, 781–788. [Google Scholar] [CrossRef]
  37. Eriksson, M.; Lord, J.; Jacobson, S. Wear and contact conditions of brake pads: Dynamical in situ studies of pad on glass. Wear 2001, 249, 272–278. [Google Scholar] [CrossRef]
  38. Zheng, K.; Lin, Y.; Lai, T.; Gao, C.; Liu, M.; Ren, Z. Replacing copper in composites with waste foundry sand: A novel approach for Cu-free resin-based braking material. Tribol. Int. 2024, 191, 109110. [Google Scholar] [CrossRef]
  39. Singh, V.K. Hydration and setting of Portland cement. In The Science and Technology of Cement and Other Hydraulic Binders, 1st ed.; Singh, V.K., Ed.; Woodhead Publishing: Sawston, UK, 2023; pp. 423–466. [Google Scholar]
  40. Koehler, A.; Neubauer, J.; Goetz-Neunhoeffer, F. How C12A7 influences the early hydration of calcium aluminate cement at different temperatures. Cem. Concr. Res. 2022, 162, 106972. [Google Scholar] [CrossRef]
  41. Křístková, M.; Filip, P.; Weiss, Z.; Peter, R. Influence of metals on the phenol–formaldehyde resin degradation in friction composites. Polym. Degrad. Stab. 2004, 84, 49–60. [Google Scholar] [CrossRef]
Figure 1. 2D (a) and 3D (b) images of the disc surface after polishing.
Lubricants 12 00440 g001
Figure 2. Images of (a) the PoD tester used for tests and (b) details of the chamber.
Lubricants 12 00440 g002
Figure 3. X-ray diffraction patterns of SFS and MFS.
Lubricants 12 00440 g003
Figure 4. SEM micrographs of (a) SFS, (b) MFS, and (c) alumina.
Lubricants 12 00440 g004
Figure 5. Images of the surfaces of the prepared pins (a) FC–Al, (b) FC–SFS, and (c) FC–MFS. (Orange arrows show the presence of pores).
Lubricants 12 00440 g005
Figure 6. 2D images of the surfaces of the prepared pins of composites FC–Al (a), FC–SFS, (b) and FC–MFS (c), and respective 3D images of the given area with the calculated roughness values below the 2D images.
Lubricants 12 00440 g006
Figure 7. Typical CoF curves of FC–Al, FC–SFS, and FC–MFS (a); details of the instantaneous CoF values in the region of 4000–5400 s (b).
Lubricants 12 00440 g007
Figure 8. Comparison of CoF values (a), values of specific wear coefficients (b), and particle number concentrations (c).
Lubricants 12 00440 g008
Figure 9. Worn pin surfaces of (a) FC–Al, (b) FC–SFS, and (c) FC–MFS. (The orange arrows show the typical areas covered by secondary contact plateaus, and the orange rectangles indicate the area selected for EDX analysis).
Lubricants 12 00440 g009
Figure 10. The typical LSCM images of secondary contact plateaus observed for (a) FC–Al, (b) FC–SFS, and (c) FC–MFS and respective 3D images of these areas.
Lubricants 12 00440 g010
Figure 11. Wear track on the disc surface after the test with FC–SFS (a) and FC–MFS (b).
Lubricants 12 00440 g011
Figure 12. Details of the 3D topography of the discs’ surfaces after the PoD test with MC–SFS (a) and MC–MFS (b).
Lubricants 12 00440 g012
Figure 13. Comparison of the worn disc and the FC–SFS pin surface after PoD test. (a) Image of the wear track on the disc surface, (b) SE image of the details, showing a thick layer of friction film deposited on the wear track, (c) BSE image of the same area, (d) EDS spectrum obtained from the marked area, (e) BSE image of the details of the surface of the FC–SFS pin after PoD test showing typical secondary contact plateau, and (f) EDS spectrum obtained from the marked area.
Lubricants 12 00440 g013
Figure 14. Comparison of the worn disc and the FC–MFS pin surface after PoD test. (a) Image of the wear track on the disc surface, (b) SE image showing collected wear particles deposited in the craters, (c) BSE image of the same area, (d) EDS spectrum obtained from the marked area, (e) BSE image of the details of the surface of the FC–MFS pin after PoD test showing a typical secondary contact plateau, and (f) EDS spectrum obtained from the marked area.
Lubricants 12 00440 g014
Table 1. Composition of FC–Al, FC–SFS, and FC–MFS (wt.%).
ComponentSpecimen Code Name
FC–AlFC–SFSFC–MFS
Phenolic Binder888
Graphite101010
Tin Sulfide101010
Barite and Calcite252525
Vermiculite101010
Steel Wool555
Iron Powder555
Aramid Fibers777
Alumina2000
SFS0200
MFS0020
Table 2. Chemical composition of SFS and MFS (wt%).
SampleFe2O3CaOSiO2MnOMgOAl2O3P2O5TiO2
SFS31.248.68.834.593.001.401.010.683
MFS52.529.93.787.593.710.7240.7460.385
Table 3. Selected physical and mechanical characteristics of prepared specimens.
ParameterSpecimen Code Name
FC–AlFC–SFSFC–MFS
Bulk density (g∙cm−3)2.4192.6612.683
Hardness, HBW1/10415751
Compressive strength (MPa)89.9146.8153.9
Table 4. EDXS point analysis of the main elements in the secondary contact plateaus (in wt.%).
CompositeFeBaAlSnSCaMgSiO
FC–Al38.07.297.355.403.322.551.611.6119.8
FC–SFS50.75.310.213.562.334.261.111.5318.6
FC–MFS57.34.940.213.782.263.591.411.4216.4
Disclaimer/Publisher’s Note: The statements, opinions and data contained in all publications are solely those of the individual author(s) and contributor(s) and not of MDPI and/or the editor(s). MDPI and/or the editor(s) disclaim responsibility for any injury to people or property resulting from any ideas, methods, instructions or products referred to in the content.

