Article

Towards a Model-Based Methodology for Rating and Monitoring Wear Risk in Oscillating Grease-Lubricated Rolling Bearings

1
Large Bearing Laboratory, Fraunhofer Institute for Wind Energy Systems—IWES, 21029 Hamburg, Germany
2
Institute for Electrical Drives, Power Electronics and Devices, University of Bremen, 28359 Bremen, Germany
*
Author to whom correspondence should be addressed.
Lubricants 2024, 12(12), 415; https://doi.org/10.3390/lubricants12120415
Submission received: 26 September 2024 / Revised: 16 October 2024 / Accepted: 22 November 2024 / Published: 26 November 2024
(This article belongs to the Special Issue Modeling and Characterization of Wear)

Abstract

Oscillating grease-lubricated slewing bearings are used in several applications. One of the most demanding and challenging is the rotor blade bearings of wind turbines. They allow the rotor blades to be turned to control the rotational speed and loads of the complete turbine. The operating conditions of blade bearings can lead to lubricant starvation of the contacts between rolling elements and raceways, which can result in wear damages like false brinelling. Variable oscillating amplitudes, load distributions, and the grease properties influence the likelihood of wear occurrence. Currently, there are no methods for rating this risk based on existing standards. This work develops an empirical methodology for assessing and quantifying the risk of wear damage. Experimental results of small-scale blade bearings show that the proposed methodology performs well in predicting wear damage and its progression on the raceways. Ultimately, the methods proposed here can be used to incorporate on-demand lubrication runs of pitch bearings, which would make turbine operation more reliable and cost-efficient.

1. Introduction

1.1. Oscillating Bearings in Wind Turbines and False Brinelling

Oscillating grease-lubricated slewing bearings are used in several applications. One of them is the rotor blade bearing of wind turbines. Like many other components of wind turbines, blade bearings can be subject to premature failures due to different failure modes. Especially noticeable is the fact that failure rates for this component are increasing for modern and larger wind turbines considered in Haus et al. [1]. Blade bearings carry all combined loads transmitted by the rotor blades and enable the rotation of these around their longitudinal axis and thus the adjustment of the angle of attack of the inflow. This rotation is called pitching and is a fundamental feature of modern wind turbines. In general, pitch control can be distinguished in two different philosophies—collective pitch control (CPC) and individual pitch control (IPC) [2].
Implementing IPC has become more widespread with increasing wind turbine sizes and rotor diameters. However, besides having the ability to have a positive impact on structural fatigue loads, IPC can also increase the number of oscillation cycles and therefore can have a negative impact on blade bearing failure modes like rolling contact fatigue and raceway wear [3]. Raceway wear only occurs in a rolling contact bearing under starved contact lubrication, which is promoted by oscillating operating conditions of the blade bearing or operational standstill [4,5,6,7]. As wear damages of the raceways are influencing the overall fatigue and service life of a bearing [8,9,10], wear should be avoided in any case. The prediction of starved contact lubrication is therefore useful for informing preventive actions that can stop wear from developing.
Typically, wear damage in oscillating bearings can be distinguished into two different phenomenological failure modes—false brinelling and standstill marks. Both failure modes are caused by the same wear mechanisms. These are tribo-corrosion, adhesion, and abrasion. The major differences between the two failure modes are the visual appearance and the operation conditions that cause them. While standstill marks can happen under load changes and very small oscillation angles with an amplitude ratio x 2 b < 1 , false brinelling is happening under oscillating movements with an x 2 b > 1 . x is the translational movement of the Hertzian contact on the raceway and 2 b is the load-dependent width of that same contact. La Presilla et al. [11] give more information and explanations on the typical wear failure modes in oscillating bearings.
The focus of this work is on the wear failure mode of false brinelling in grease-lubricated bearings due to oscillating motion. La Presilla et al. [11] also give a comprehensive overview of the research topic of false brinelling and list tests and test conditions of several investigations in this manner. Besides testing, it encompasses modeling of oscillating rolling bearings. They conclude that currently there is no reliable, analytical, or numerical model available to predict the occurrence or the progression of wear in oscillating bearings.
We seek to resolve this issue by presenting an empirical model approach for predicting the spatially resolved risk of false brinelling on the raceways and its progression by combining a friction work and hence energy-based approach with lubrication-specific characteristics. The following subsection provides the background of this work. Section 2 describes the materials used and methods developed for predicting the occurrence and the progression of false brinelling in oscillating bearings based on small-scale blade bearings. Section 3 shows the results of the wear model based on analytical calculations and experimental results. Section 4 discusses the findings, and Section 5 concludes this paper and gives an outlook for future works on the presented topic.

1.2. Background on Model-Based Wear Assessment

Recent research by Cubillas et al. [12] focuses on an energy-based methodology to rate the risk of creating wear damage in the form of standstill marks within blade bearings of wind turbines. They propose a semi-analytical model to calculate friction energy in the contacts of a blade bearing during operational standstill. The philosophy behind their approach is very similar to the one presented in this work; however, they focus on friction energy dissipated in the raceways due to dynamic load changes without pitch movement. In addition, their approach does not consider any lubricants and hence does not take into account replenishment mechanisms of the contact. Schwack et al. [13] presented a friction work density-related approach to describe false brinelling. They found a good consistency when comparing finite element model-based results of friction work density in the contact areas with experimental results on angular contact ball bearings under dry contact lubrication conditions. These works highlight that the general idea of a friction work-related wear model could help us understand wear-critical operating conditions.
In general, numerous wear models with an experimental or theoretical background can be found in the literature [14]. One of the classical models is the Archard model [15], which also defines the basis of other models that even incorporate nonstationary velocities under oscillating motion [16]. In general, it says that the wear volume is proportional to the product of sliding distance and normal load. Fouvry et al. [17] elaborated on this approach and its shortcomings with respect to a not constant coefficient of friction by correlating the wear volume with the dissipated energy in reciprocating sliding conditions. Besides being influenced by different effects, the study showed a good correlation between wear volume and dissipated energy in experiments with different materials. However, no lubrication and only pure sliding between the contacting bodies was covered. Lubrication in general is used to reduce or prevent wear and damage propagation. Grease lubrication is an especially complex topic in the field of elastohydrodynamic lubrication. With respect to wear damage, grease-specific lubrication mechanisms play an important role and must be accounted for when assessing the risk of producing such damage due to unfavorable operating conditions. Hart et al. [18] give a comprehensive overview of lubrication and grease lubrication in particular. Based on the review of several investigations, they state that close-to-contact replenishment is the dominant reflow mechanism for grease-lubricated bearings. Therefore, local replenishment phenomena should be considered when assessing the risk of wear damage in grease-lubricated bearings.
The contact conditions in rolling element bearings and especially in blade bearings are different to the ones in the former mentioned wear models, which focus on dry contacts. Wandel et al. [19] investigated several experimental results of grease-lubricated rolling bearings using a comparable energy-based approach to assess the development and progression of wear under starved contact lubrication conditions. They found that the energy-based approach and the introduced energy–wear factor (ratio of wear volume and friction work) are good indicators for different and consecutive wear mechanisms. For their experimental results on grease-lubricated angular contact ball bearings, they concluded that false brinelling initiation starts from adhesion and corrosion after a certain incubation period. Within this incubation period, the lubricant provides sufficient protection against wear damage. However, with an increasing number of oscillations, the contact runs dry, and friction energy activates the wear process. Damage initiation is then followed by a steep increase in friction torque and wear volume. Due to the experimental basis with bearings of different sizes, they found that the incubation phase is shorter in terms of wear-relevant cycles with larger bearings. They assume that this correlates with a worse lubricant supply to the contact due to the larger contact area and prolonged reflow times. This phenomenon has also been shown and described by Bayer et al. [20].
To prevent wear, it seems crucial to gain knowledge about the initiation phase, which is influenced by lubricant properties and operating conditions. Wandel et al. [6] showed the results of several experiments with grease-lubricated angular contact ball bearings of type 7208 with respect to false brinelling and friction torque development under changing oscillation angles, oscillation frequencies, and two different greases. They found that the experimental results with respect to the severity of the damage and the friction torque development are in good agreement—a high increase in friction torque equals more severe wear damage. In addition, the friction torque increases throughout the experiments, and, depending on the experimental parameters, it correlates with the empirical prediction of starvation based on the so-called starvation degree originally described by Cann et al. [21]. They extended the definition of the starvation number with grease-specific properties as it originally was described for oil lubrication. Wandel [22] gives a more in-depth overview of his concept of the henceforth named starvation number, which describes the replenishment of the contact due to surface tension effects in the vicinity of the contact as well as secondary replenishment mechanisms due to interactions of the rolling elements with the cage pockets. He used various tests with different greases and angular contact ball bearings of type 7208 as well as experiments on an EHL tribometer to show the validity of the starvation number to indicate operating conditions that are critical in terms of producing false brinelling. His objective was to establish a critical starvation number to distinguish between critical and non-critical operating conditions in grease-lubricated and oscillating bearings. The basic ideas of his empirical description of the starvation number will be used in the methodology section of this paper as part of the proposed wear model.
Bayer et al. [20] showed results from experiments on bearings of different sizes and types. They found that the starvation number shows a good performance in predicting wear-critical operation conditions even for larger size bearings, which are also the basis of this work and line contacts in roller bearings. Friction torque measurements were used to identify the influence of several parameters of oscillating operating conditions. In general, higher oscillating frequencies lead to more pronounced friction torque increase and thus more severe false brinelling on the raceways. In addition, the three distinctive regimes described by Wandel [22] were also detectable in these experiments by changing the oscillating angles and thus the amplitude ratios x 2 b . From their experimental results, they concluded that a critical starvation number of 1 delivered good results in the prediction of wear throughout all different bearings.
All prior mentioned publications show promising conformity of friction work evolution and wear damage in conjunction with wear risk estimation based on the starvation number. However, all findings are based on experiments with constant operating conditions in terms of oscillating frequency, angle, and load. Operating conditions in a blade bearing are different, as all these parameters are changing constantly. This results in potentially wear-critical operating conditions alternating with such, possibly preventing wear by contact relubrication and redistribution of the grease. The latter are called protection runs in [23]. Stammler et al. [24] showed that random oscillation cycles with varying double amplitude were able to produce a significant false brinelling while larger movements—e.g., protection runs—were able to prevent wear from forming. Stammler et al. [24] performed comparable tests on angular contact ball bearings of type 7220. Behnke and Schleich [25] used the same approach and incorporated protection runs in tests with real-scale blade bearings. They interrupted sequences of cycles with small oscillation amplitudes ( θ = 0.4 ° ;   x 2 b = 2.9 ) which are critical for the occurrence of false brinelling with larger movements ( θ = 4 ° ) after 10, 50, and 100 cycles. Protection runs after 10 and 50 cycles prevented false brinelling on the raceway. However, protection runs every 100 cycles did not lead to the same level of protection as 10 and 50, and false brinelling occurred on the raceways. 100 oscillations between protection runs was also the largest interval analyzed by Schwack et al. [26]. They incorporated protection runs in the simulation of a wind turbine on fixed intervals of 25, 50, and 100 IPC cycles, regardless of any analysis of the risk of wear damage. In their wind turbine model-based study, they found generally less negative influence on structural loads of the wind turbine when fewer protection runs are conducted based on fixed intervals. Optimizing the schedule of protection runs to be only conducted when needed could potentially help minimize the negative influence on the structural loads of a wind turbine while preventing wear damage.
Due to the random nature of oscillation cycle amplitude and frequency during wind turbine operation, it is necessary to find a method that can predict the risk of wear damage even under dynamically changing conditions. All the prior mentioned works do not answer the question about how many wear-critical cycles with respect to false brinelling are permissible during operation and how variable oscillation cycles can be assessed in this manner. This makes the prediction of wear-critical operation conditions for blade bearings impossible. The present work aims at solving these issues by providing an empirical model approach for predicting the spatially resolved risk of wear damage of the raceways and its progression by combining a friction work and hence energy-based approach with the concept of the starvation number to consider lubricant-specific properties.

2. Materials and Methods

This section describes the fundamentals of the empirical wear model as well as the experimental setup that has been used to derive certain parameters of the model. The model considers the operation history and sums up friction work incorporated into segments of the bearing rated by the estimated degree of starvation as a measure for the risk of producing false brinelling on the raceways. The model is empirically tuned with experiments on small-scale blade bearings, and the risk assessment is based on a threshold value derived from those experiments.

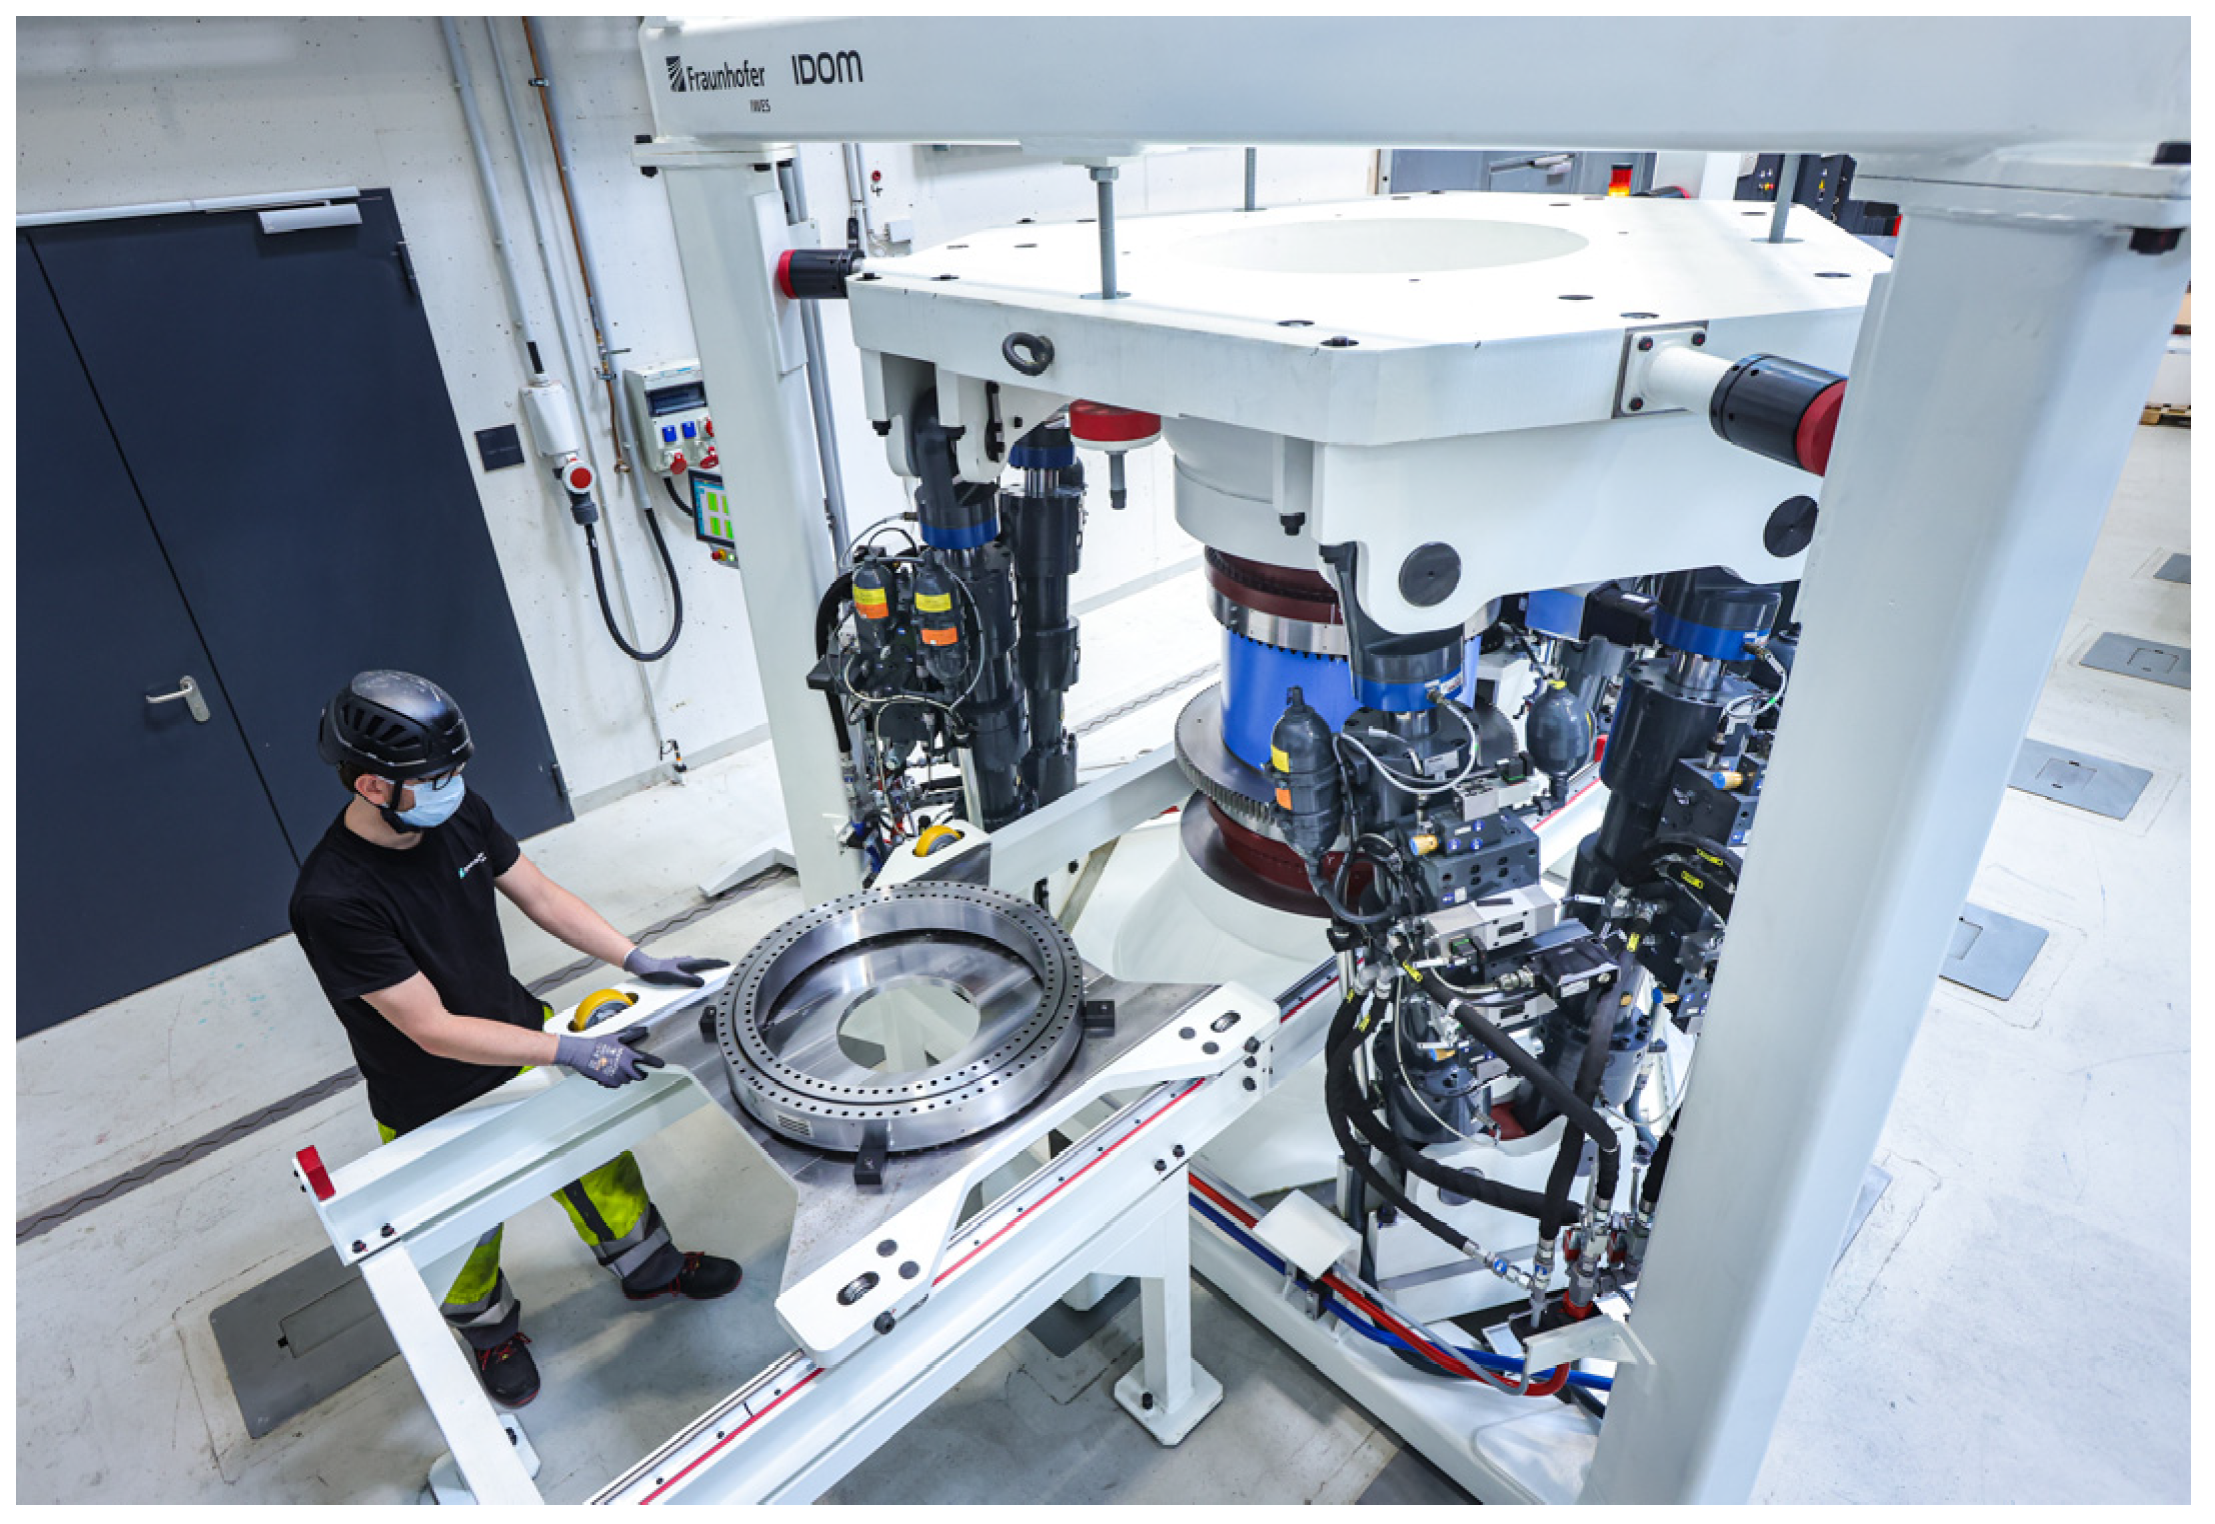
2.1. Experimental Setup

This section describes the test rig, the bearings, the grease, and the testing procedure in general. All experiments have been performed using the BEAT1.1 (Bearing Endurance and Acceptance Test Rig 1.1) (see Figure 1). The BEAT1.1 uses a hexapod construction and hydraulic actuators for the load application to the bearings under test. It can apply static and dynamic load cases in 5 DOF (degrees of freedom). In addition, it uses an electrical pitch system equipped with torque transducers for accurate position control of oscillating movements of the bearing and monitoring of the friction torque. The test rig tests small-scale blade bearings with an outer diameter of 750 mm. More details on these bearings are given in Table 1. The bearings are smaller than modern blade bearings but are manufactured in the same way and have the same design philosophy as the full-scale ones. Due to their size and the abilities of the test rig, the setup provides a more cost-effective possibility to do tests dedicated to fundamental aspects of wear while incorporating comparable operating conditions and the same design as real-scale blade bearings. More information about the test rig and its functionality and the bearings used for this work can be found in various publications [20,27,28,29,30].
The bearings in the test are lubricated with two different greases. However, grease No. 1 has been used for all experiments and test parameters given in Table 2, while grease No. 2 has only been used for selected test parameters to investigate the differences in their individual performance and to validate the proposed methodology. Table 3 lists specific properties of the greases that are used in the base oil flow-specific term of the starvation number.
As mentioned in the introduction, the experiments and their data in this work have been described before in Bayer et al. [20]. For the sake of completeness, they are briefly described in the following.
Two bearings are tested at the same time. After installation of the bearings, they are subject to a running-in procedure based on comprehensive friction torque-related experiments incorporating multiple degrees of freedom in terms of loads and oscillation speeds. More details on these tests and their results can be found in [27,30,31]. After these tests, the two bearings are subject to a series of oscillation cycles with parameters given in Table 2. For each combination of amplitude ratio x 2 b and oscillation frequency, several sequences of oscillation cycles are conducted. Each sequence is separated by a large oscillation movement of ± 180 ° to not only redistribute the grease in the bearings but also derive data like vibration signals and the torque signal while overrolling possible false brinelling damages on the raceways. In addition, the mean angle of oscillation is changed after each sequence to avoid overlapping and to gain distinguishable results. After finishing this wear-dedicated test, the bearings are disassembled from the test bench and evaluated by means of visual inspection and, in case of damage, laser scanning microscopy to gain quantifiable results in terms of wear volume. These experiments are used as screening tests to investigate the influence of different parameters on the development and progression of false brinelling. The friction torque measurements throughout these experiments as well as the results from the visual inspections after the tests are used to tune and validate the presented methodology.
The parameters of the screening tests have been derived from aeroelastic simulations of the IWT-7.5-164 reference turbine and IPC-specific operation conditions near rated wind speeds. The parameters have been scaled to the small-scale blade bearing by maintaining the same x 2 b . The aim is to represent a broad range of parameter combinations that describe oscillating operation conditions when using IPC. In addition to these screening tests, experiments with parameters from Table 2 have been conducted with the consideration of protection runs. In this work, critical parameter combinations with respect to false brinelling from the screening tests have been interrupted by larger oscillation angles after sequences of 10 and 100 cycles. Table 4 lists the parameters of the tests, including protection runs. The oscillation angle of the protection run has been changed to find an effective value for a sufficient amount of protection after 100 cycles, which is in line with the longest intervals mentioned in the parameter studies on protection runs (see Section 1.2).
In addition to the screening tests and the ones with protection runs, this work uses experiments with wind turbine-specific operation conditions characterized by variable oscillating amplitudes and dynamic load application. These experiments have been described in detail in [29]. The measurement data and results of the visual inspections of the tests on the BEAT1.1 test rig are used to validate the wear model presented in this work (see Section 2.1) and its ability to predict the occurrence of false brinelling damage based on friction torque measurements, oscillating movements, and grease properties.

2.2. Empirical and Energy-Based Wear Model

The proposed wear model combines an energy and a lubricant/starvation-related part. The model is meant to be used for analyzing time series derived from measurements at test rigs or other real-world applications as well as simulation data derived from models such as aeroelastic simulations of wind turbines. It is designed to be able to analyze operating conditions characterized by oscillations with variable amplitude and dynamic load conditions and is especially meant to assess the risk of false brinelling.
The fundamental idea is that friction works as a product of oscillating motion, and friction dissipates in the contact between the rolling elements and the raceways of the bearing. Hence, each movement of the bearing results in a certain amount of dissipated energy. Loading, coefficient of friction, and the motion itself influence the amount of dissipated energy. However, if there is no starvation and only mixed lubrication in the contacts between rolling elements and raceways, the friction work does only account for negligible amounts of tribologically transformed structure and tribochemical transformations that lead to wear damage. Only if starved contact lubrication conditions are existing and almost no lubrication film is separating the contact partners, friction work and wear are correlated as proposed by different wear models (e.g., [17]). Hence, the friction work-related term is accompanied by the starvation number to account only for dissipated energy that forms under wear-critical and presumably starved contact lubrication conditions. The starvation number is used as a multiplier for the friction work to rate its contribution to wear damage. Other ways of using the starvation number to rate the friction work could be possible but have not been investigated in this work.
θ_crit denotes the oscillation angle of the inner raceway relative to the outer raceway for which the center of the contact of one rolling element moves to the initial center of contact of the adjacent rolling element [32]. During an oscillation with a double amplitude being smaller than the critical angle θ c r i t , not all parts of the raceways in a bearing are in contact, and thus no energy is dissipated in these areas. Under those oscillating operation conditions, which are typical for blade bearings, the dissipated energy is not evenly distributed over all parts of the raceways. Menck [32] proposed a segment-wise calculation method of rolling contact fatigue life of an oscillating bearing. He discretizes the bearing raceways into several segments to perform individual calculations regarding their stress cycles and their individual damage to calculate the overall bearing life. The same idea of using a segment-wise calculation is used in this wear model to consider the uneven distribution and load conditions in the bearing, especially for small oscillating angles. Equation (1) combines the beforementioned fundamental aspects of the wear model.
E m o d , m = n = 1 n m E d e n s , m , n S N m , n 1 = n = 1 n m E f , m , n A m S N m , n 1
E m o d , m is the henceforth called the modified friction work density (MFD) per finite segment m of the bearing raceway. It describes the sum over all oscillation cycles n m of dissipated energy density E d e n s , m , n multiplied by the starvation number S N m , n corresponding to the individually estimated degree of starvation based on the previous oscillation cycle n 1 and segment m . E f , m , n describes the friction work/energy per segment and oscillation cycle and A m denotes the area of a segment. An oscillation cycle is defined by the time between two consecutive overrollings of a segment by a rolling element. Hence, it is determined by the rolling element movement relative to each of the rings of the bearing. The definition is similar to the one introduced and explained in more detail by Menck [32]. The individual terms of the MFD are explained in more detail in the following subsections divided by the main parts.

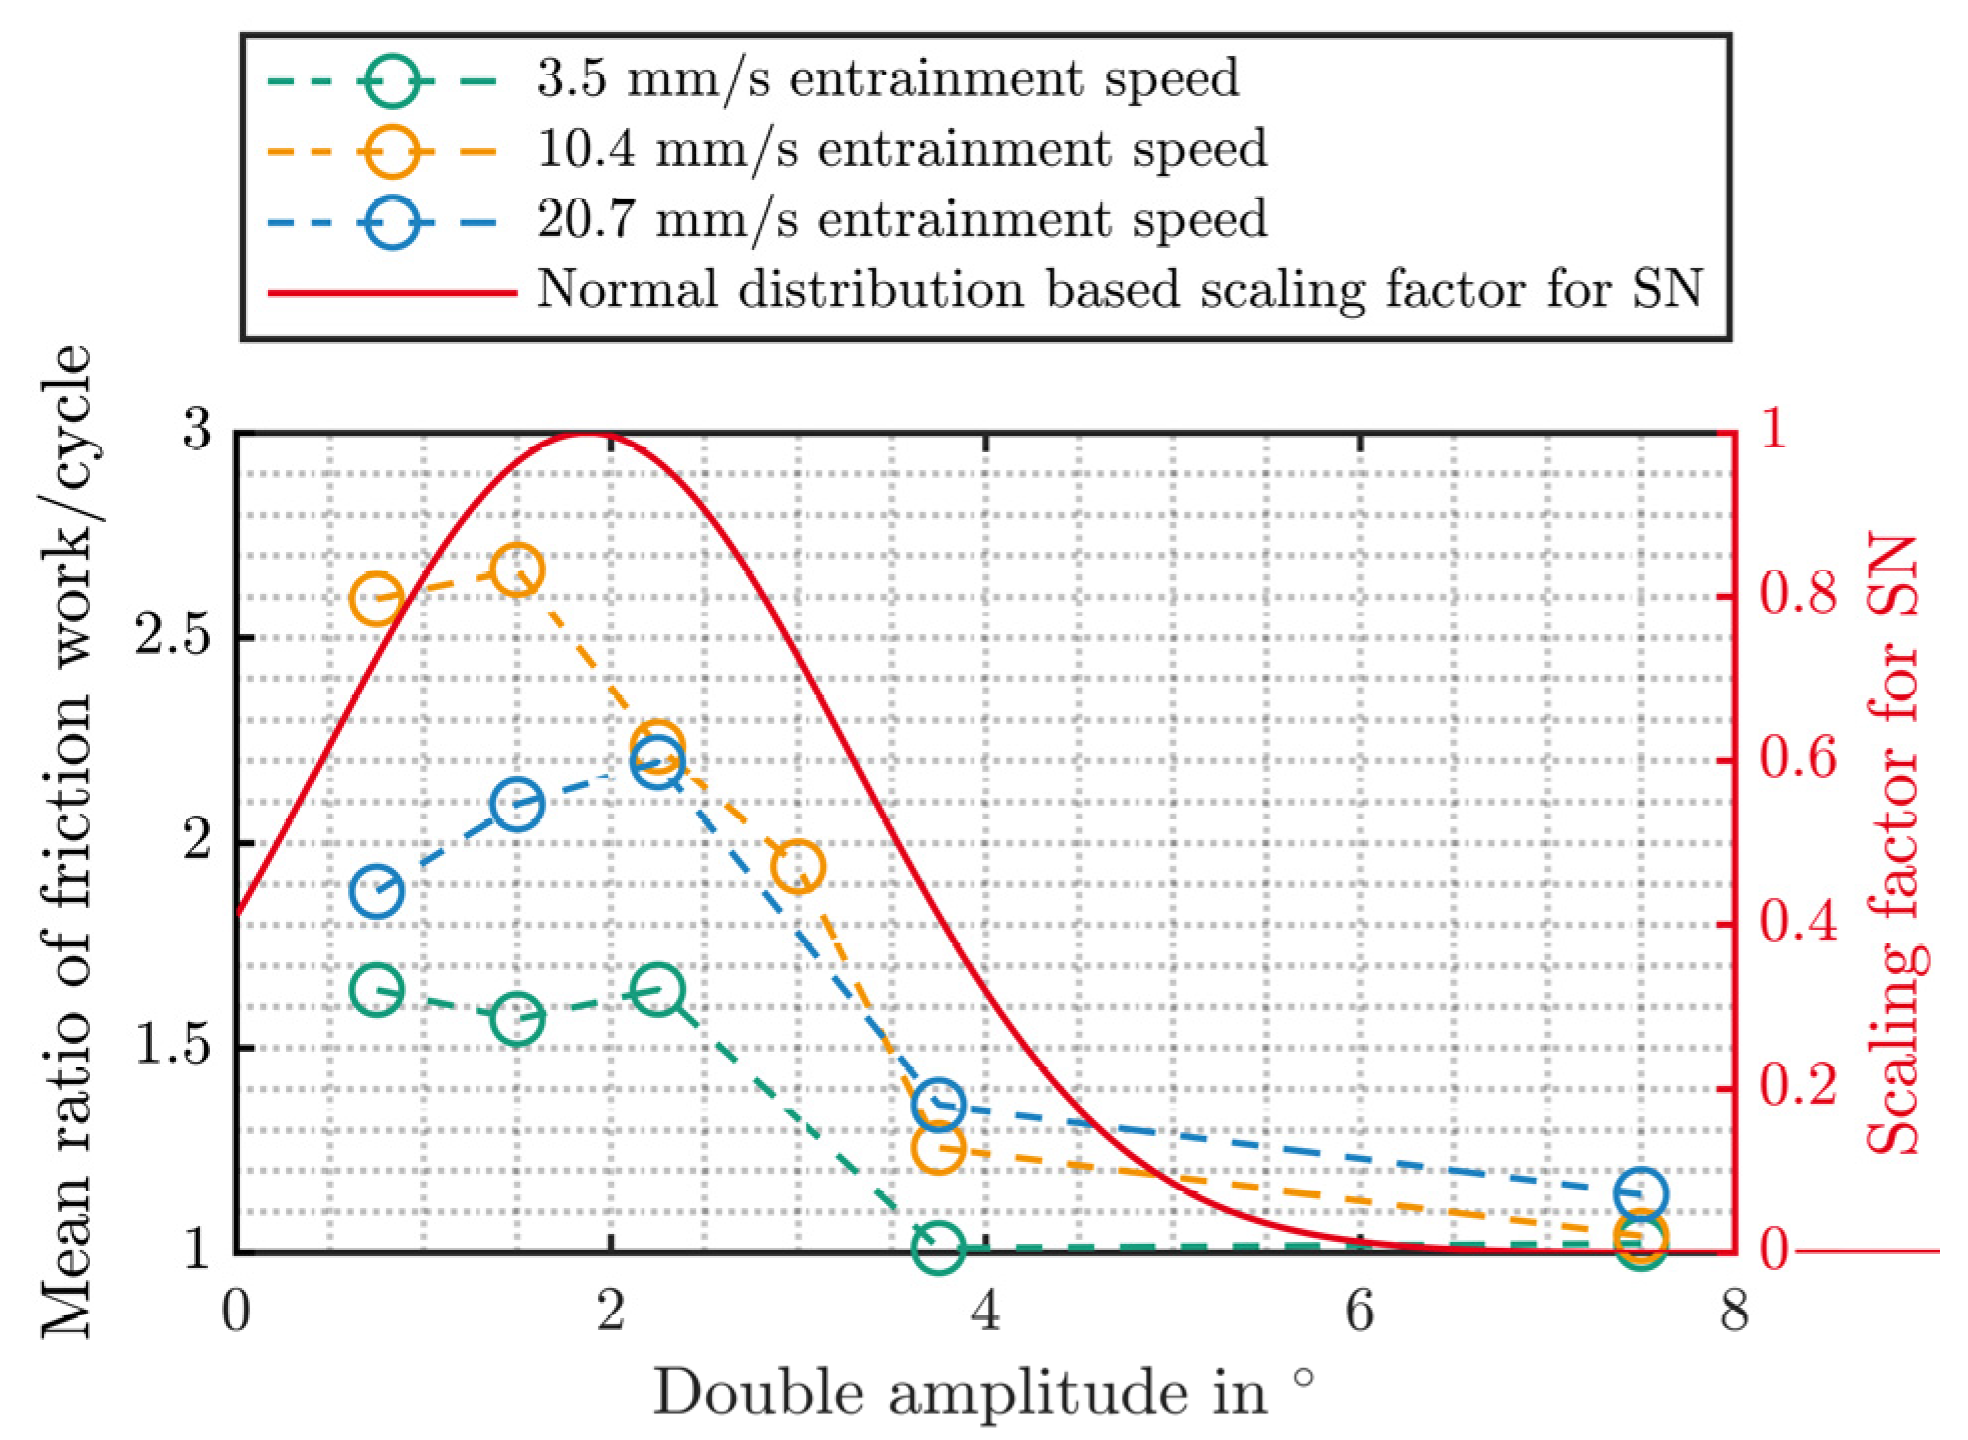
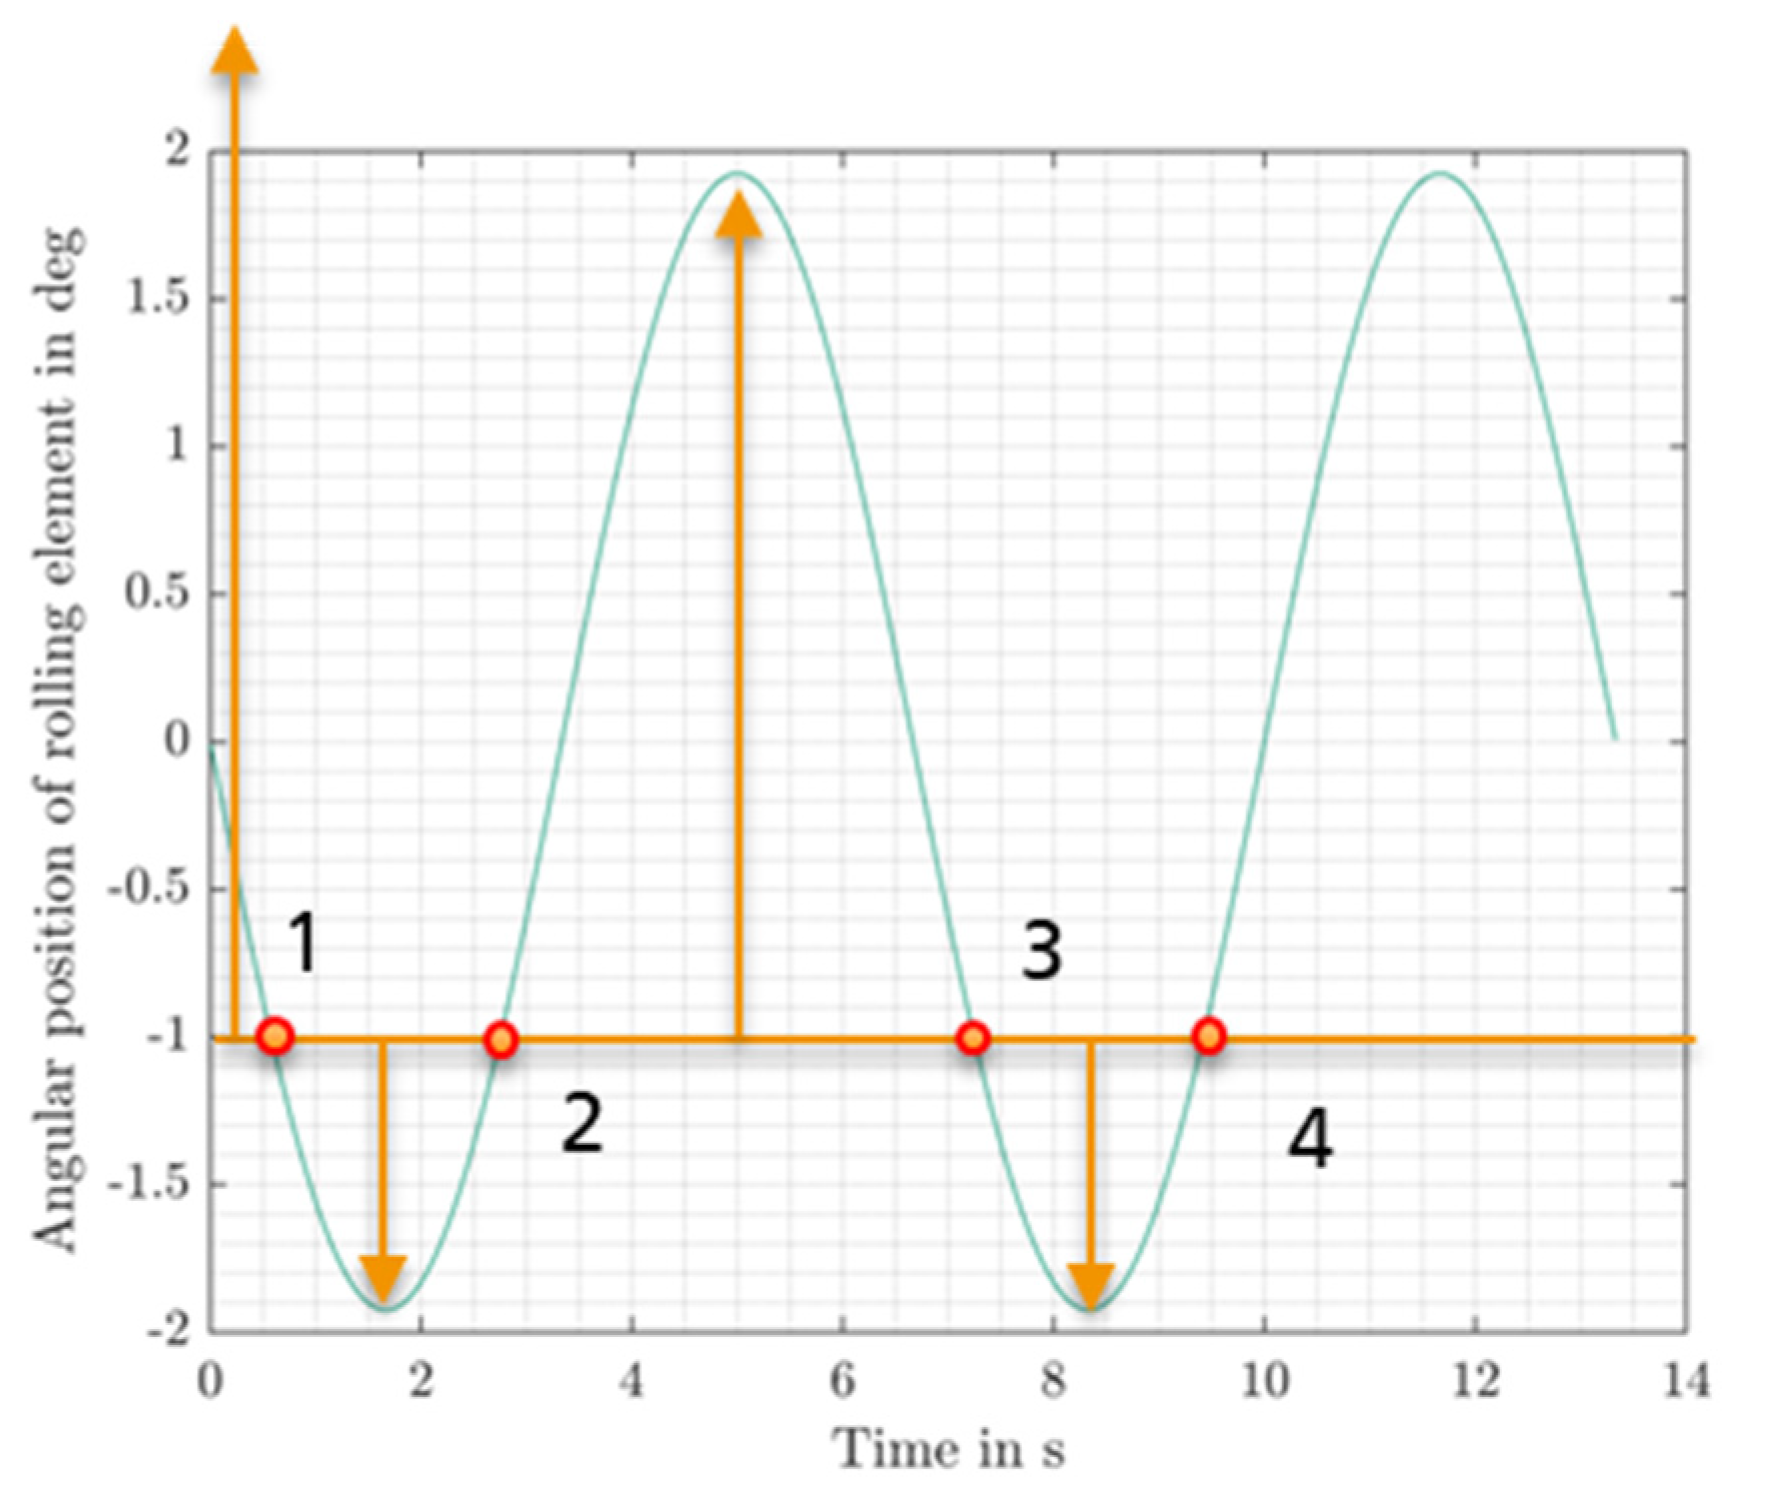
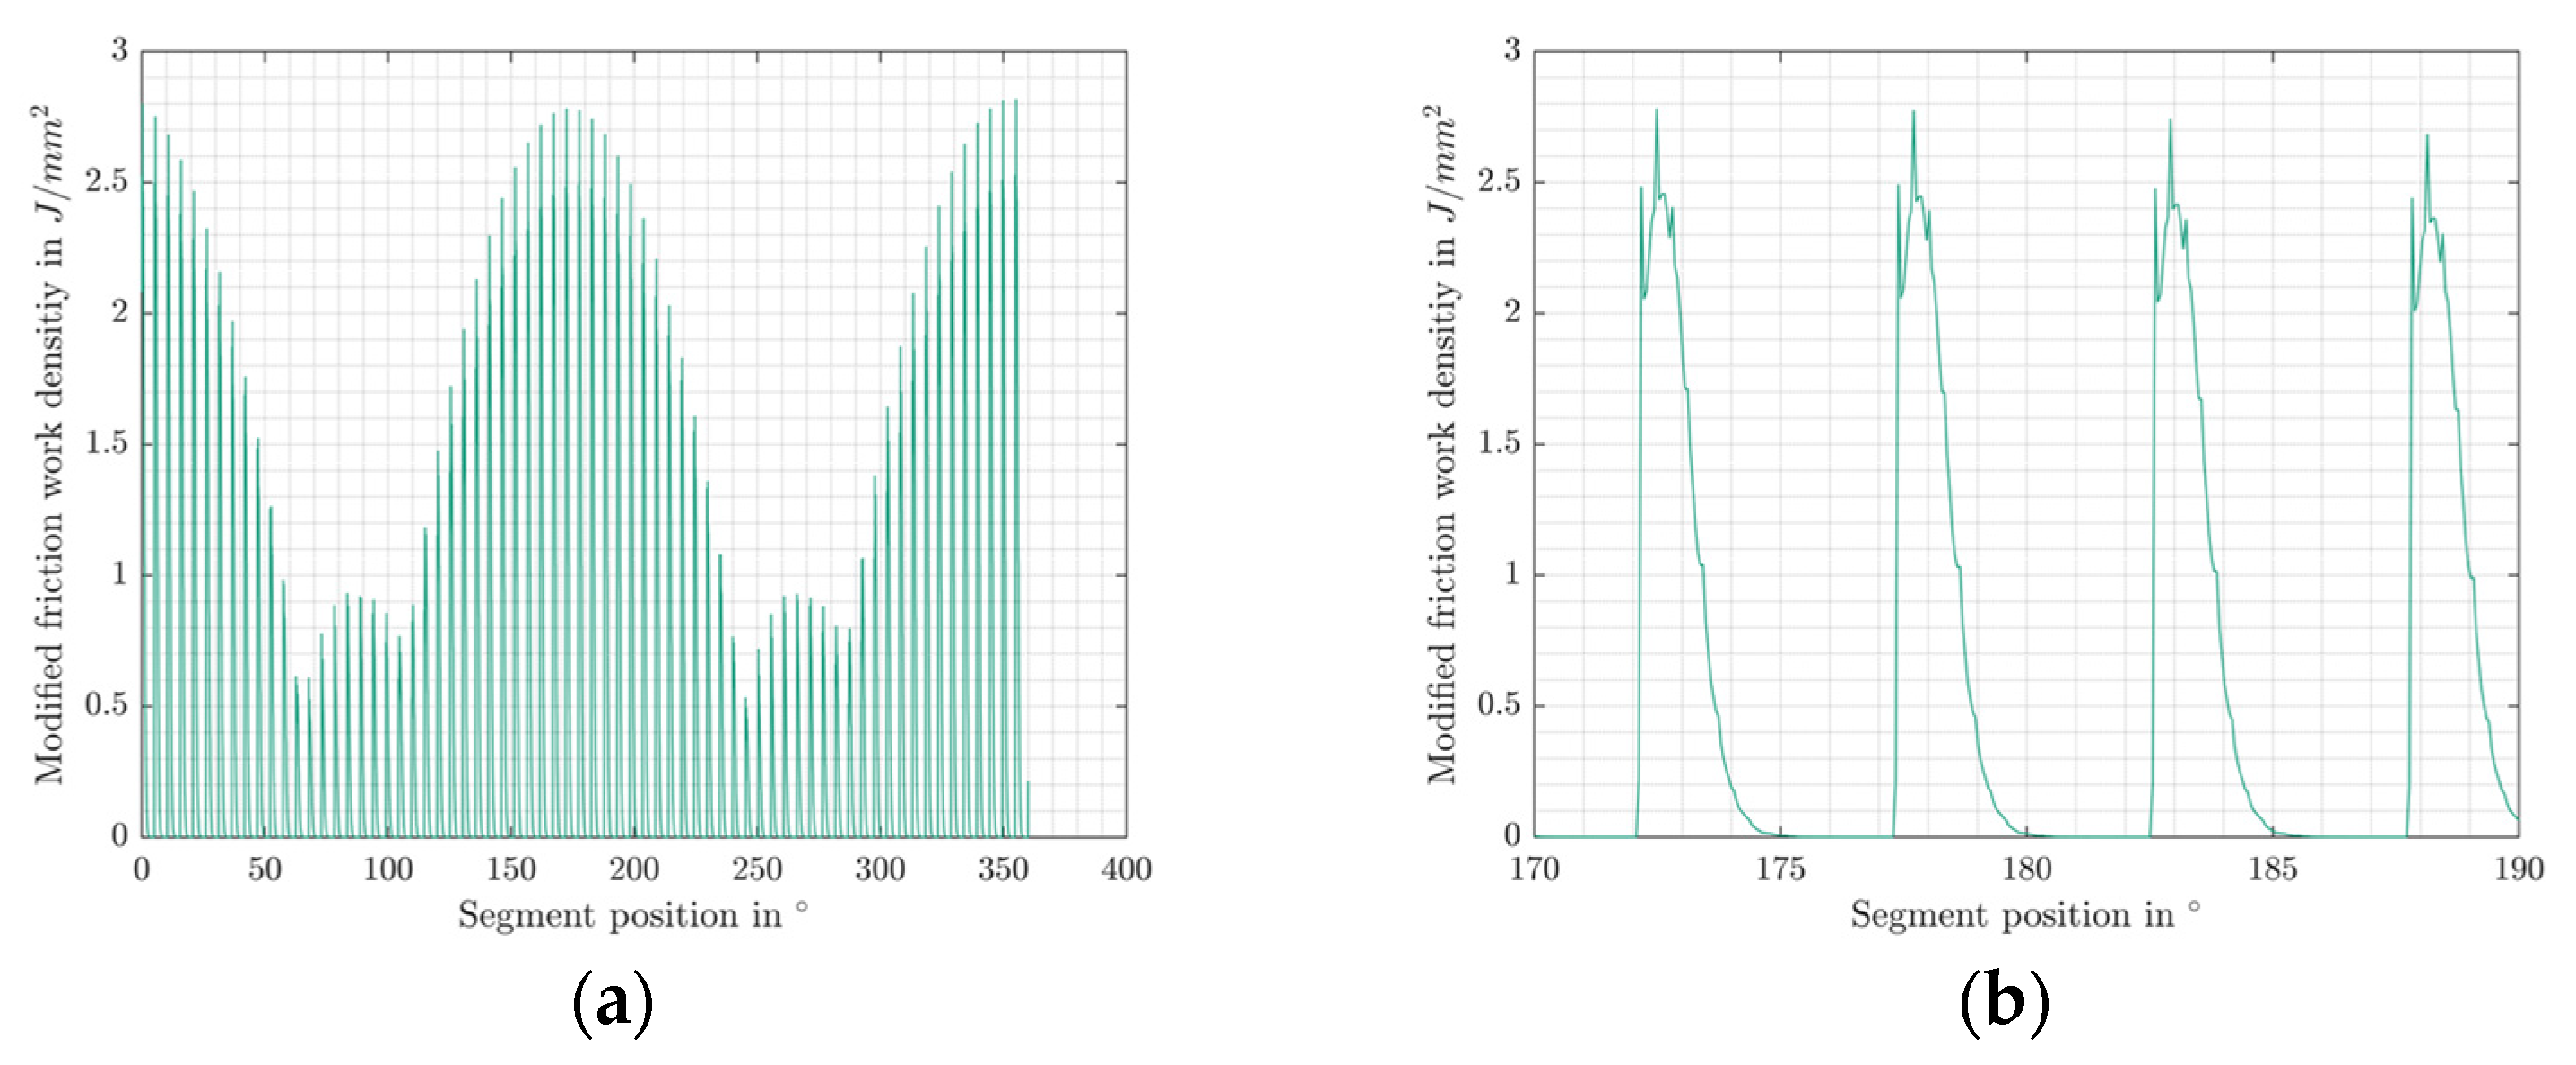
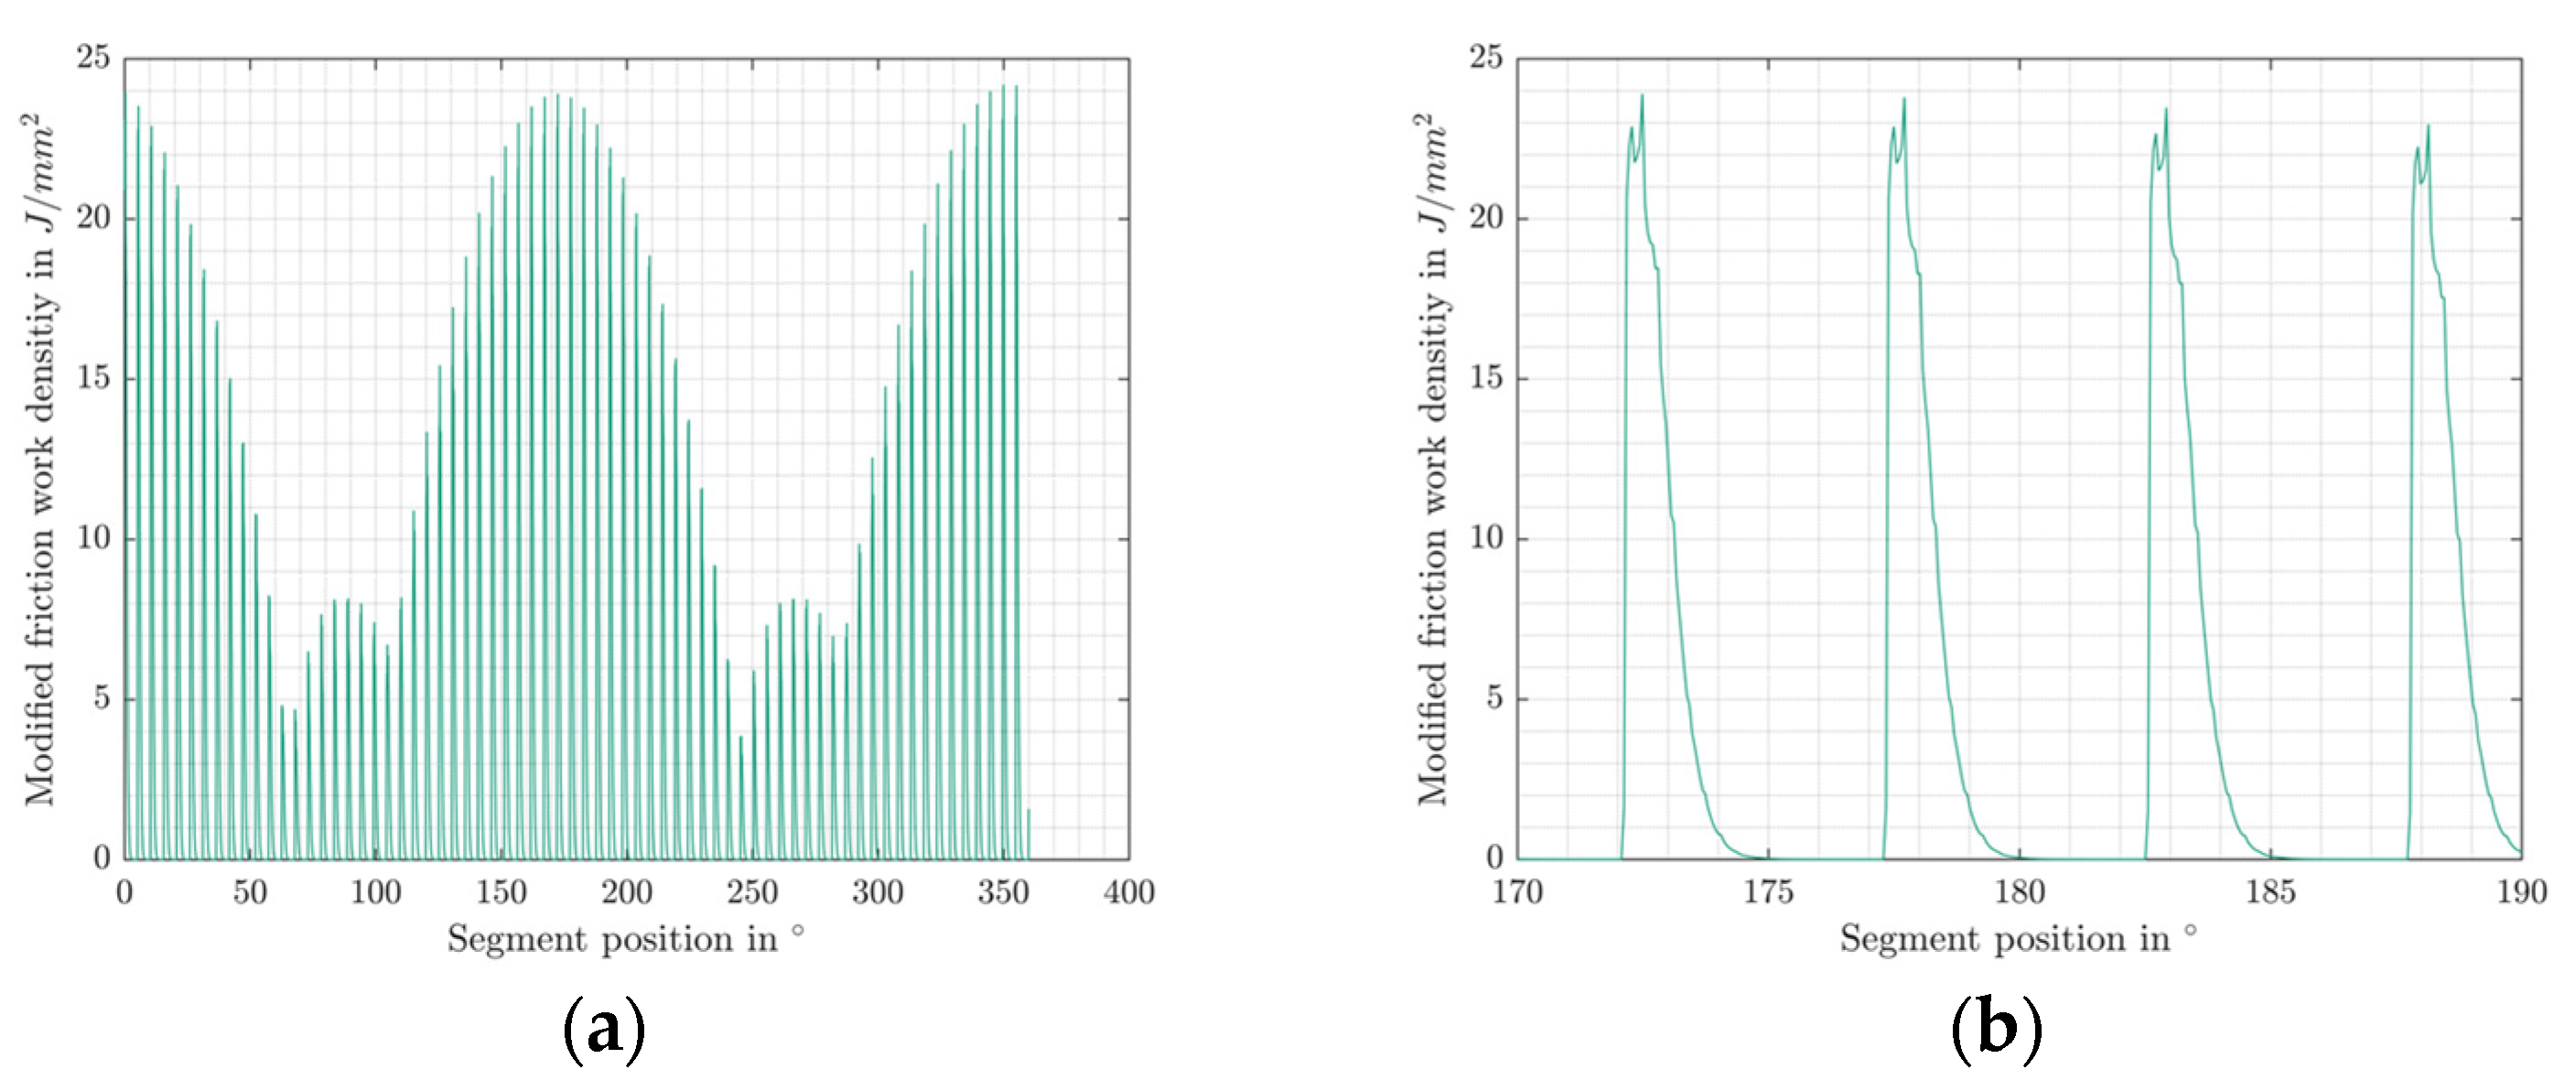
2.2.1. Friction Work Density

The idea of a friction work density is to obtain a value that does not depend on the total number and therefore size of segments. Hence, it can be compared between different bearing sizes. The friction work density E d e n s , m , n is determined by the area of a finite segment of the bearing raceway. Equation (2) defines how the friction work density is calculated.
E d e n s , m , n = E f , m , n A m , I R = t m , i n t m , o u t T F ω p i t c h 1 f s Q w k , m 1 z Q w k φ m 360 π D p w cos α D w 2 a
The friction work E f , m , n incorporated in a segment is calculated by the sum of the friction work per time step using the friction torque T F and the angular speed ω p i t c h multiplied by the sampling frequency of the torque signal 1 f s during a cycle n , which is defined by the time a rolling element enters the certain segment, denoted by t m , i n , and till it leaves the segment at t m , o u t . As the friction torque signal T F is the combined bearing friction torque, it must be estimated how much friction work is caused by a single rolling element and its contacts during a cycle n . This work is using a simplified load distribution within the bearing, assuming that the friction work per rolling element is proportional to its load Q w k . Friction torque in general is often split into several contributing parts with load-dependency and without, e.g., [33,34]. Most of the influencing factors stem from the conditions in the contact areas of the bearing. However, it shall be noted that especially for large-scale slewing bearings, a significant and most likely load-independent amount of friction torque can be caused by the seals. Within this work, no further separation of the term T F is considered. Q w k , m denotes the mean load of a rolling element in a segment. It is divided by the sum of all mean rolling element loads Q w k to result in a normalized value representing the load distribution within the bearing. The rolling element loads Q w k can be calculated by means of various approaches—e.g., finite element models being the most accurate and computationally heavy or using simplified equations assuming stiff rings and linear springs for the rolling elements as a simplified representation of the stiffness of the Hertzian contact. The latter one has been used throughout this investigation due to the high stiffness of the experimental setup. Especially for large blade bearings, load distributions are heavily depending on the stiffness of surrounding structures and the bearings [35]. Hence, high-accuracy finite element-based calculations are recommended. To weigh the contribution of each rolling element to the sum of the combined friction torque, only the normal force Q w k is used because the estimation of the distribution of friction per contact would enhance the complexity to a large extent. While E f , m describes the friction work incorporated into a segment of a bearing, A m , I R describes the area of the segment on the inner ring of the bearing. It is calculated by using φ m as the angle corresponding to the width of the segments, the pitch diameter of the bearing D p w , the contact angle α , the rolling element diameter D w , and the height of the Hertzian contact 2 a .
Figure 2 gives an illustration of the segmented raceway and spatially calculated friction work density given with Equation (2).

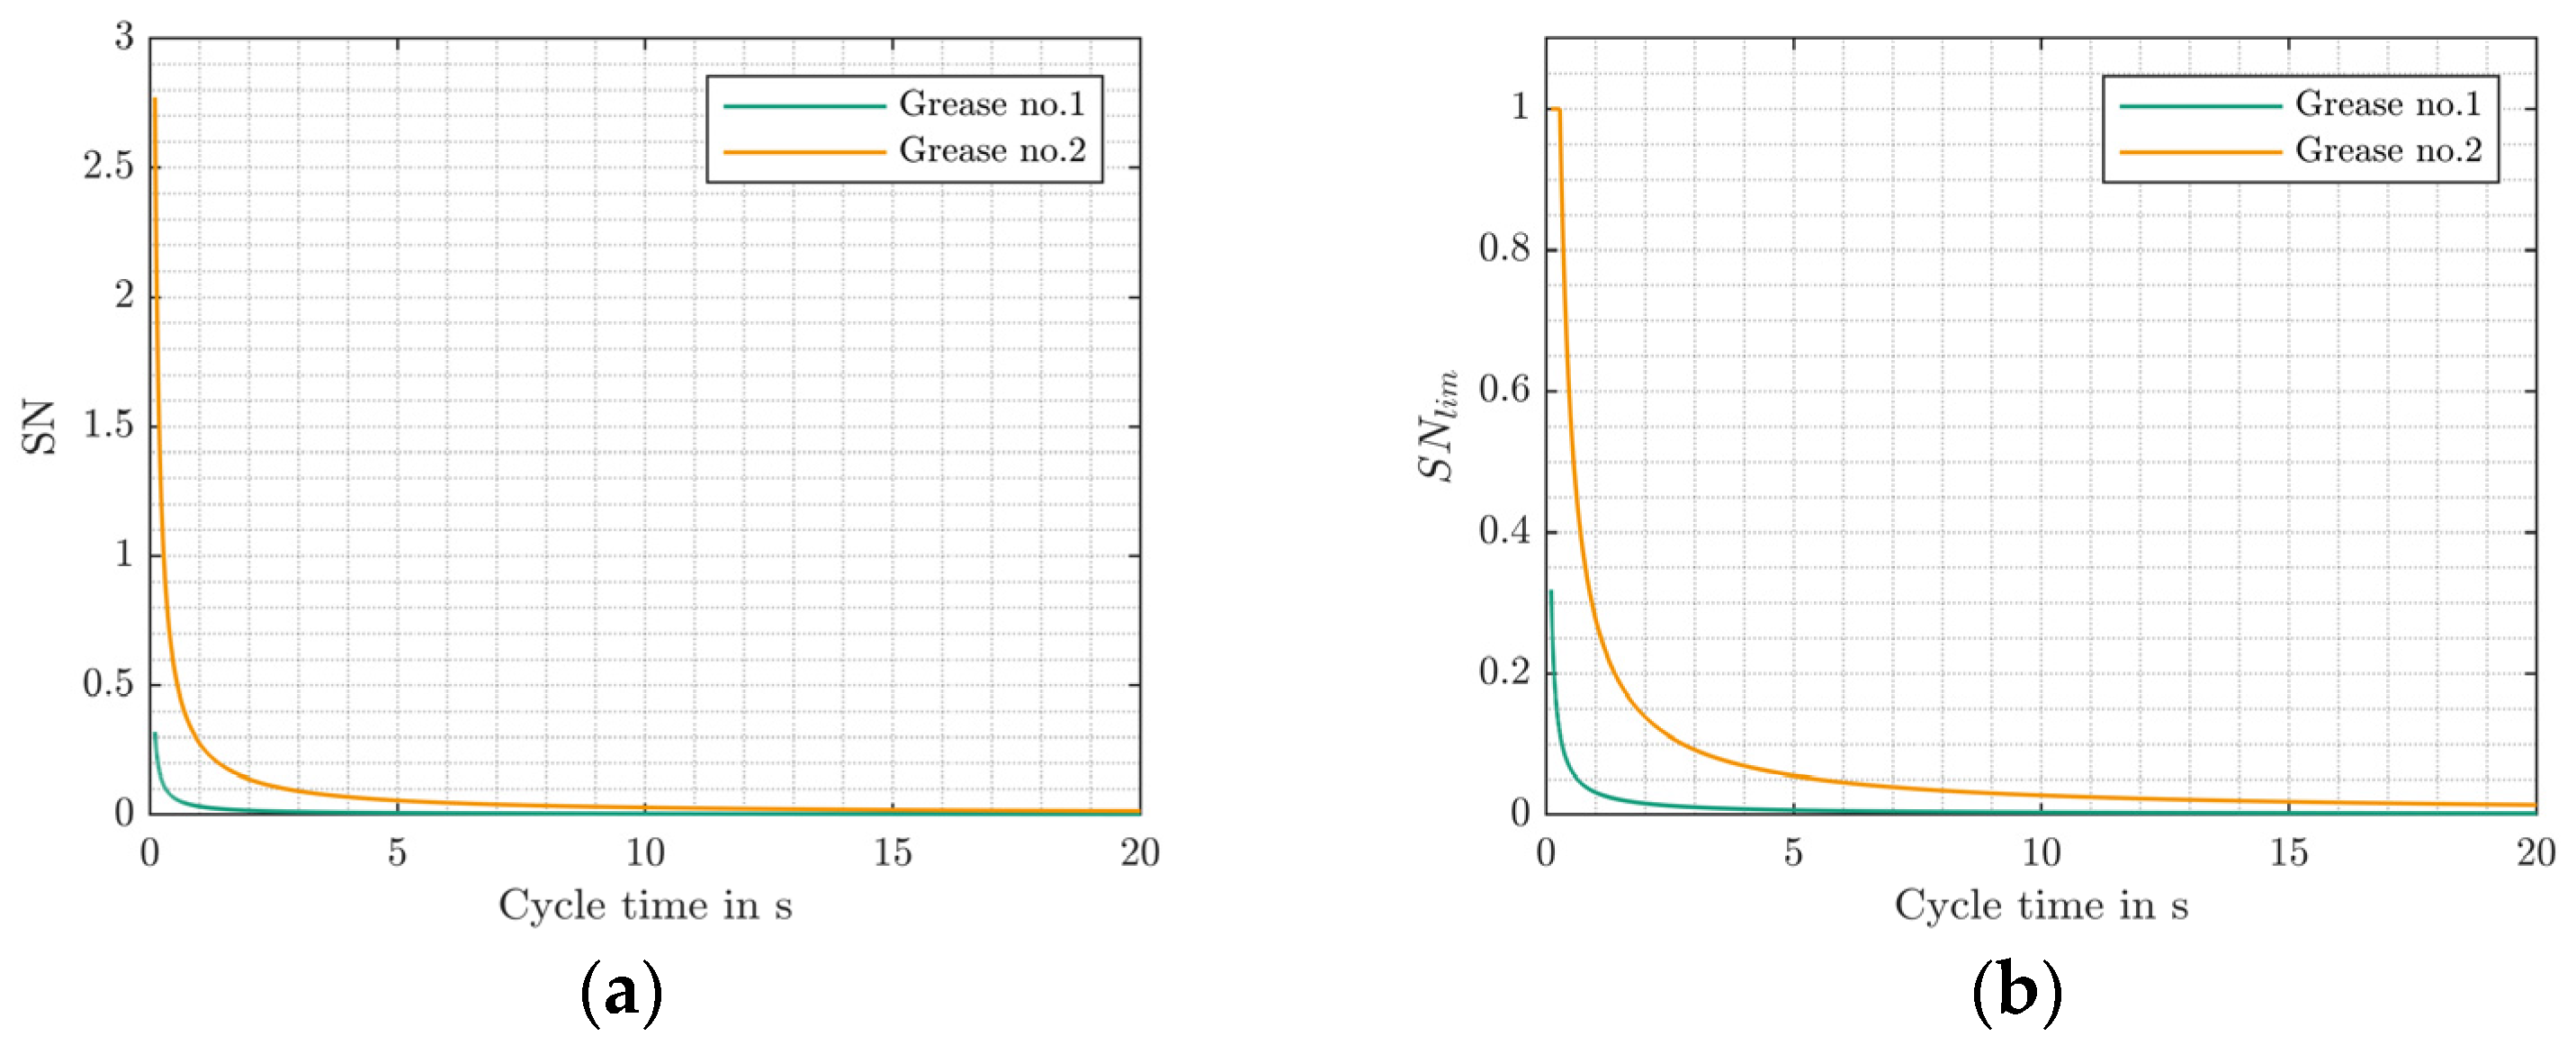
2.2.2. The Starvation Number

The next part covers the starvation number S N m , n . The starvation number considers several parameters of oscillating operation and lubricant properties, and it correlates with the probability of starvation as a function of these.
S N = D 1 D 2 = η 0 a f c σ s O s D 2
It consists of two terms: D 1 , which describes the base oil flow in the contact, and D 2 , which aims at describing the influence of secondary relubrication mechanisms like the contact replenishment by the cage. D 1 uses lubricant properties such as the dynamic base oil viscosity η 0 , the oil separation rate O s , and the surface tension of the oil σ s , as well as the contact and operating specific parameters like the half height of the Hertzian contact a and the oscillating frequency f c . Wandel [22] gives more details on the composition of these individual parameters to become a measure for the base oil flow. The term D 2 is originally divided into 4 different regimes separated by weighting of the translational motion of the Hertzian contact x with empirical thresholds derived from experiments. These thresholds must be individually found by experiments for changing bearing designs and lubricants. The present work uses a slightly different approach for D 2 as originally proposed by Wandel [22], described later in this section.
Because of the variable nature of oscillation amplitudes and speeds in blade bearing applications, the oscillating frequency f c in term D 1 is replaced by the time between two consecutive overrollings of a segment, which defines the replenishment time. Therefore, the term D 1 is dependent on the history of motion of the present cycle n . t m , o u t defines the time when a rolling element leaves a certain segment, m , during a former cycle, n 1 , and t m , i n is the time a rolling element re-enters the same segment during the present cycle n .
D 1 = η 0 a 1 t m , i n     t m , o u t σ s O s
It must be noted that the starvation number can result in values greater than 1, with higher numbers referring to a higher likelihood of starved contact lubrication conditions. However, being used as a multiplication factor for the friction work, the value range must be limited to a maximum value of 1 to not lead to physically implausible results of the MFD. Derived from the fundamental theory provided by Cann et al. [21], a starvation number S N = 1 indicates the transition from fully flooded to starved contacts. In addition to the findings of Wandel [22], Bayer et al. [20] also showed that a value of S N 1 delivered good results in predicting the occurrence of wear throughout their experiments. Hence, a case differentiation is implemented as a simple way to limit the maximum starvation number to a value of 1 to predict wear-critical operating conditions. It shall be noted that other methods of applying scaling functions to the starvation number could be possible. However, they have not been investigated in this work. In this case, the grease-specific differences regarding the base oil flow capabilities denoted by η 0 /( σ s O s ) are maintained for a broad period of cycle times or cycle frequencies.
S N m , n = D 1 D 2                         i f   D 1 1                 D 2                           i f   D 1 > 1
Figure 3 gives an example of the results when using the proposed cut-off method.
Lastly, the term D 2 must be defined. This term shall describe the influence of secondary replenishment mechanisms, which cannot be described by the base oil flow capabilities. Wandel [22] observed a strong influence of the cage pocket design for experiments on small angular contact ball bearings. Secondary relubrication mechanisms have been observed with the small-scale blade bearings used in this work as well. Bayer et al. [20] firstly showed the results of these experiments and found that three distinctive regimes separated by the oscillation angles have been visible—increasing damage with increasing double amplitudes till reaching a threshold value for highest damage followed by a decrease in damage for larger and lastly no damage for very large double amplitudes. They calculated the friction work per oscillation cycle as a measure of the wear damage in the form of false brinelling in various experiments to show the general performance of the starvation number. Figure 4 compiles the test results of these small-scale blade bearings. It shows the mean increase in friction work per cycle throughout the complete tests with 10,000 oscillation cycles each. The test setup is the same as described in the previous chapter. It is visible that small oscillation angles with 0.75° tend to cause a less pronounced increase in friction work per cycle than amplitudes with about 2°. For amplitudes of 7.5°, almost no increase in friction work per cycle is noticeable, which matches the results of the evaluation of those bearings, as they showed almost no false brinelling. Besides the oscillation angle, the frequency and thus the entrainment speed have been changed in the experiments. It has been noted that the entrainment speed also has a threshold value, as higher velocities can also have a positive influence and cause less damage and friction work increase. This specific effect is not covered by the starvation number, as it would predict worse starvation conditions with higher frequencies. However, the primary intention of the starvation number is to predict the general occurrence of starvation and not to quantify the damage produced. This is part of the friction work-related term E d e n s , m , n .
To incorporate the effects of secondary lubrication mechanisms, the shape of the experimental results shown in Figure 4 is approximated with the function of a normal distribution to obtain a continuously defined scaling of the starvation number without case differentiation. The fundamental idea is to maintain the three previously mentioned regimes. The tuning parameters have been chosen to result in meaningful representation of the underlying test results. Equation (6), as follows, gives the function of the normal distribution and the scaling parameters derived from the experiments:
D 2 = e 0.5 θ θ p e a k σ c r i t 2 w i t h θ p e a k = 2.25 ° + 1.5 ° 2 a n d σ c r i t = θ c r i t θ p e a k σ = 7.5 2.25 ° + 1.5 ° 2 4 .
The normal distribution as a scaling function for the oscillation angle θ is tuned with the oscillation angle corresponding to the highest friction work increase θ p e a k and a standard deviation σ c r i t . This so-called critical standard deviation is tuned by using a critical angle θ c r i t and setting the normal standard deviation σ to a high value like 4. Hence, the scaling function has a peak value of 1 at the worst oscillation angle θ p e a k and gives almost 0 for angles larger than 7.5°. Note that the specific values have been found by experiments with the small-scale blade bearings, and they probably must be adjusted for other bearing designs. The cage design and the rolling element rotation are parameters affecting the secondary replenishment mechanism and could potentially be used to calculate values for the angles θ c r i t and θ p e a k .
While the term D 1 depends on the time between consecutive overrollings to consider the flow-depending replenishment mechanisms, the term D 2 is using the history of oscillating motion before an overrolling of a segment. That means that the oscillating movement of the recent cycles n-1 and n-2 is affecting the lubrication conditions during the present cycle n. Figure 5 gives an example for deriving the oscillation angle θ . The figure shows the movement of a rolling element inside a bearing with the starting point at 0°. The red circles indicate the overrollings of a segment m at a position of −1°. As the operational history of the first overrolling n = 1 is unknown, the oscillation angle θ n = 1 is set to i n f , which results in D 2 = 0 . Hence, a starvation number of 0 is suggested for the first cycle, and no wear-dedicated friction work is calculated. For the second overrolling, n = 2 , only half of the oscillation is known and θ n = 2 is again set to inf. At the third overrolling n = 3 the complete history is known and θ n = 3 is set to 3.8° according to the peak-to-peak value of two consecutive oscillation amplitudes. Hence, the term D 2 gives a scaling value of 0.39 for this example. The same applies to n = 4 .
With the scaling function D 2 , the starvation number for the empirical wear model becomes the following:
S N m , n = η 0 a 1 t m , i n t m , o u t σ s O s e 0.5 θ θ p e a k σ c r i t 2   i f   D 1 1 e 0.5 θ θ p e a k σ c r i t 2                                                               i f   D 1 > 1 .
With both cut-off and scaling methods applied, the normalized starvation number, depending on cycle frequency and double amplitude value of oscillation, is shown in Figure 6. The plots are calculated for the two greases used in the experiments of this work (see Table 3). The influence of the different grease formulations and properties on the base oil flow dependent term D 1 is clearly visible. Especially the higher base oil viscosity of grease No. 2 leads to higher starvation numbers for lower frequencies. The term D 2 has been tuned for experiments conducted with grease No. 1 only. As it is primarily supposed to describe the influence of secondary relubrication effects caused by the bearing design, the scaling should be transferable to grease No. 2, and the same values are used for both greases. However, Wandel et al. [6] found different critical angles for two different greases using the same bearings and test setup. Hence, the grease probably has an influence on the secondary replenishment mechanisms which to this point only can be determined by experiments.

2.2.3. Reset Feature and Threshold Value

The introduced method calculates the MFD in a finite segment of a bearing under oscillating operation conditions. The MFD is the sum of weighted friction work density. As mentioned before, wear initiation is characterized by an incubation phase, where even under operating conditions that have a high risk of starvation, no wear damage occurs. Hence, from a wind turbine perspective, even wear-critical operation can be tolerable for a certain amount of time before damage initiates. Therefore, the MFD needs a threshold value that is associated with a high likelihood of wear initiation. This threshold value is defined by experimental results, which are described in the following chapter.
Besides this threshold value, the method needs another essential feature. As mentioned in the introduction, protection runs can prevent wear during oscillating operation. Protection runs are oscillation cycles with a larger amplitude, which can redistribute the grease in a bearing and lead to contact replenishment. Due to the oscillation with a larger amplitude, they are related to the beforementioned secondary replenishment mechanisms. They can occur due to the normal behavior of a wind turbine as a reaction to gusts or during start-ups of the turbine. Besides these random protection runs, they could also be performed intentionally. In both cases, a protection run lowers the risk of wear as it renews the lubrication conditions in the contacts. In the model proposed herein, a reset criterion of the accumulated MFD accounts for the wear-preventing nature of a protection run. Hence, every time a protection run is performed, the MFD is set to a value of E m o d , m = 0 . A protection run is characterized by an oscillation cycle with a sufficiently large angle θ p r o t e c t i o n .
In this case, the angle was found by experiments that combined wear-critical oscillation cycles with larger oscillation amplitudes (see Table 4). Grease properties, filling rate, and internal design of a bearing are factors that influence this angle in general. Therefore, this angle is probably not a universal value, and it must be defined for every application individually. Like the term D 2 of the starvation number, the reset criterion is based on the history of overrollings of a segment in the bearing (compare Figure 5). Therefore, the angular distance of a rolling element is tracked for the last 2 overrollings to define the oscillation angle θ . Once a protection run is conducted and the reset criterion is triggered, the MFD is reset, and the accumulation begins from 0 for the next consecutive cycles.
E m o d , m = E m o d , m   i f   θ < θ p r o t e c t i o n   0                       i f   θ θ p r o t e c t i o n

3. Results

This section presents the experimental results and derived parameters for tuning the wear model based on test conditions listed in Table 2 and Table 4. In addition, some results from tests with wind turbine-specific operating conditions are analyzed by using the MFD.

3.1. Results from False Brinelling Screening Tests

The presence of small oscillations leads to an incubation phase, in which the contacts dry out. Starvation is happening, and wear starts to form. From this point on, there is a direct correlation between friction work/energy and wear damage. As mentioned in Wandel et al. [19], the incubation phase is probably related to the operating conditions and grease properties and was different for the two bearing types in their experiments, ranging from as low as 50 cycles for the larger bearings and up to 3000 cycles for the smaller ones. As the aim of the model is to predict wear-critical operation, an empirical threshold value is introduced in the model. Overreaching this threshold value is associated with a very high likelihood of producing wear damage on the raceways. The following results are the basis of this threshold value.
Figure 7a shows an example picture of the raceways of an inner bearing ring after a test. The test is divided into several sequences with increasing numbers of oscillation cycles (see Table 2). The sequences are labeled with numbers from one to five to indicate the corresponding wear mark. In the case of this test, sequences with 500 (1), 1000 (2), 3000 (3), 5000 (4), and 10,000 (5) cycles have been running. The amplitude ratio and frequency are kept constant during these sequences, while the mean angle of oscillation is changed after each sequence to avoid overlapping of the contact areas. The raceway shows several wear damages characterized as false brinelling grouped into local patterns. Each pattern results from one rolling element. If every sequence caused false brinelling at the raceways, a total of five marks would have been visible for each pattern. However, based on a visual inspection, the patterns show only three to four wear marks. Hence, the sequences with 10,000 (5), 5000 (4), 3000 (3), and partially 1000 (2) cycles have been able to produce a false brinelling with decreasing severity. 500 (1) cycles have not produced any visible damage. The false brinelling is characterized by adhesive damages and fretting corrosion, as well as some early abrasive wear regions indicated by a more polished appearance. During the test, the friction torque of the bearing has been measured. The MFD, as introduced in the former section, is calculated with these torque measurements and bearing and grease properties given in Table 1 and Table 3. Figure 7b shows the spatially resolved MFD at a position from 170° to 190° of the bearing inner ring. The analogy to the wear mark patterns and the corresponding sequences in Figure 7a is clearly visible. Hence, with an increasing number of oscillations the dissipated and accumulated friction work increases in locally separated parts of the bearing ring. Considering that at least three wear marks are clearly visible in the patterns, wear initiation probably has been resulting between 3000 (3) and 1000 (2) oscillations. The MFD from Figure 7b for a segment that is located in the middle of the corresponding oscillations is 4.59   J m m 2 for 3000 (3) cycles and 1.2   J m m 2 for 1000 (2) cycles. Hence, it is assumed that the aforementioned incubation phase for the wear damage initiation lies between those two values.
Figure 8a shows the result of a visual inspection from a test with identical test parameters as in Figure 7. However, in this case the bearings have been lubricated with grease no. 2. Four to five wear marks are clearly visible in the patterns. Hence, almost every sequence with 10,000 (5), 5000 (4), 3000 (3), 1000 (2), and 500 (1) cycles has been able to produce false brinelling with decreasing severity. In addition, especially the very shiny appearance of the wear mark resulting from 10,000 (5) cycles shows almost no reminiscence of corrosion. This is a sign that the wear damage is characterized strongly by abrasion, and that it has been progressing a lot more in comparison to the damage in Figure 7a and grease No. 1. Figure 8b shows the MFD of the bearing inner ring calculated with properties of grease No. 2 and the measured friction torque signal from the test. In comparison with Figure 7b, and therefore the test with grease No. 1, the friction work density is much higher for every sequence of cycles. This matches not only the further progressed wear damage but also the finding that 500 (1) cycles have been able to produce early signs of fretting corrosion. For 500 (1) cycles and grease No. 2, the MFD is calculated with 3.3   J m m 2 . This value is in line with the results of the test with grease No. 1, where damage initiation started between 4.59   J m m 2 and 1.2   J m m 2 .
To obtain values for the definition of the incubation phase and to derive a threshold value for wear initiation, all tests described in Table 2 have been analyzed in the aforementioned way. Hence, a visual inspection after the test has been used to find the number of oscillations that characterize the transition from no damage to damage. In addition, the MFD has been calculated by using the torque signals from the tests and the grease properties. Table 5 compiles the findings of this investigation. Besides the modified friction torque densities, it gives the mean value of the readings for damage and no damage as an approximation for the individual wear initiation for each test. Tests with an amplitude ration of 20.1 were causing damage on the raceways.

3.2. Results from Test with Protection Runs

Protection runs facilitate the grease redistribution and relubrication of the contacts in oscillating rolling element bearings as part of secondary replenishment mechanisms. The test parameters from Table 4 have been used to find an oscillation angle θ d A , p r o t e c t i o n that is able to prevent wear damage if conducted at least every 100 wear-critical oscillation cycles. Figure 9 shows the exemplary results of a test that incorporated protection runs with a double amplitude of θ p r o t e c t i o n = 7.5 ° every 10 (a) and every 100 (b) wear-critical cycles with a double amplitude of θ = 2.25 ° . While a protection run every 10 cycles shows only very mild wear in the form of slight changes in surface roughness, an execution every 100 cycles leads to false brinelling damage in the highly loaded regions of the bearing. Hence, a protection run with θ p r o t e c t i o n = 7.5 ° is not sufficient to protect the bearing.
All tested bearings have been analyzed with visual inspections after the test. Throughout all tests with protection runs, the parameter combination from the test results shown in Figure 9 was the most challenging in terms of wear prevention. The double amplitude of the protection run had to be increased to a value of θ p r o t e c t i o n = 12.5 ° to provide sufficient protection when executed every 100 cycles. This value is therefore chosen to be the effective protection run for the small-scale blade bearings of this investigation.

3.3. Results from Test with Wind Turbine-Specific Operation Conditions

Bartschat et al. [29] presented a test profile based on aeroelastic simulations and wind measurements. It emulates wear-critical operating conditions for blade bearings of a wind turbine. The test profile is characterized by oscillations with variable amplitudes and dynamic load conditions in five degrees of freedom and focuses on the damage mode false brinelling. To verify that false brinelling on the raceways in blade bearings can occur in rather short time frames of hours, the test profile was used with different test rigs and bearing sizes. The bearings used in this work (see Table 1) in combination with the two different greases have been tested in the same test campaign. The results are shown and discussed in detail in [29]. This work only refers to the results and analyzes data of the test by using the MFD.
Figure 10 shows the visual appearance of the bearing raceway at about 180° after the test with grease No. 1. The loaded areas of the raceway are visible by minor changes of the surface roughness, which also shows the distinct lower turning point at about 0° pitch angle caused by the controller characteristics and indicated by the hard stop to the left of the slightly duller-appearing areas. The right end of these areas appears more washed out, which again is a consequence of the distribution of the variable amplitudes of the test program. No signs of fretting corrosion are detectable. Figure 11a displays the MFD based on the measurements of the test and bearing and grease-specific parameters for all segments. Figure 11b is a zoomed image from 170° to 190°. Typically for a blade bearing, the bending moments lead to highly loaded regions at about 0° and 180°. The specific characteristics of the controller are visible in the modified friction torque density as well. In the highly loaded area of the bearing, the calculated value is in the region of 2 2.7   J m m 2 .
Figure 12 displays the visual appearance of the bearing raceway at about 180° after the same test but with grease No. 2. In contrast to the test with grease No. 1, false brinelling damages characterized by fretting corrosion and beginning abrasive wear are clearly visible in the highly loaded areas of the bearing. The corresponding MFD is shown in Figure 13b for all segments and in (a) for the part from 170° to 190°. Overall, the MFD reaches much higher values from 5 24   J m m 2 . This matches with the results obtained from the visual inspection and the already pronounced false brinelling, especially in the highly loaded areas of the bearing.

4. Discussion

The results from the screening tests with the small-scale blade bearings have been used to derive a threshold value for the MFD, which indicates wear initiation. Due to the design of experiments with a broad range of parameters and a rather course grid of oscillation cycles, wear initiation is sometimes hard to define. Throughout most experiments of this work, wear initiation probably happened sometime between 3000 and 1000 oscillation cycles. To consider this range of cycles, Table 5 gives the mean value of MFD corresponding to damage and to no damage. It is noticeable that these mean values show a broad distribution between the individual experiments. However, no clear trend is noticeable. A reason for this could be the friction torque itself. Besides being bearings from the same type and same series, they show differences not only in the absolute friction torque but also in the individual dependency of test parameters like the applied load. These results have been discussed in detail in [27,30,31]. It has been assumed that manufacturing tolerances that affect the preload and load distribution of the bearings are affecting the friction torque and the deviations between the experiments. As the friction torque is used as a signal for calculating the MFD, the same amount of scatter is likely to be found in this work with respect to the MFD. In addition, Wandel et al. [19] showed the strong increase in friction torque once adhesive damage is initiated after the incubation phase. As the MFD accumulates dissipated friction work per oscillation cycle, an increase in friction torque leads to an increased rate of MFD per cycle. Therefore, the MFD is rising exponentially once damage is initiated, which also matches the damage progression.
Equation (9) gives the mean value and the standard deviation of all MFD from Table 5 as an approximation for the threshold value for wear initiation for the experiments shown in this work.
E m o d , m , t h r e s h o l d = 2.21   ± 1.15   J m m 2 .
Comparing the results obtained with the two different greases, this mean value seems to indicate wear initiation in a sufficient way. Figure 8 shows early signs of false brinelling for grease No. 2 and an MFD value of about 3.3   J m m 2 . This value is in the range of the mean value plus the standard deviation and therefore within the range of damage initiation thresholds found in the experiments with grease No. 1. Besides being tuned with results from grease No. 1, the MFD seems to be able to indicate wear initiation for these grease properties as well. Hence, the different grease properties seem to be represented in the MFD in a sufficient way. The same conclusion can be found comparing the results from the tests with wind turbine-specific oscillations and dynamic load conditions. The mean value of the MFD with 2.21   J m m 2 seems to be a suitable threshold value for these experiments as well. For the experiment with grease No. 1, the MFD in the highly loaded areas of the bearing is only slightly higher than the threshold value and still in the range of mean value plus standard deviation (see Figure 11). The experiment has not been causing false brinelling. Only minor changes in the surface roughness have been detectable. So, it can be assumed that wear mechanisms have been present, but they were not able to produce more severe damage. However, when using grease No. 2, the MFD has been calculated with values of about 24   J m m 2 , which is well above the proposed threshold value. Fretting corrosion and early abrasive wear have been the resulting wear mechanisms of this experiment, leading to already pronounced false brinelling. The experiment is characterized by about 7500 oscillations with varying amplitude. The number of cycles is well above the number of cycles needed for damage initiation indicated by Table 5 and the results of the screening tests. However, not all oscillations are equally wear-critical. The MFD considers this difference by the two terms of the starvation number (see Equation (7)) and gives plausible results also for oscillating operating conditions with variable amplitudes.
The oscillation amplitudes throughout the screening tests as well as the tests with wind turbine-specific operation are smaller than the efficient protection run double amplitude θ p r o t e c t i o n = 12.5 ° . Hence, no reset of the MFD has been considered when analyzing the signals provided by the experiments. It shall be noted that this angle presumably must be adjusted for other bearing designs as it is related to the secondary replenishment mechanisms. However, it is in line with the theory provided by Wandel [22] with respect to his definition of the critical angle. He found that oscillation angles, which lead to complete immersion of the rolling element contact surface within the cage pockets, provide good protection against wear due to the secondary replenishment mechanisms provided by grease accumulating in these regions. Performing a protection run with a double amplitude of θ p r o t e c t i o n = 12.5 ° leads to rotation of the rolling elements within the small-scale blade bearings of about φ W K = 165 ° . Considering the thickness of the cage and the initial contact angle (see Table 1), this angle of rotation ensures that the parts of the rolling elements that are in contact during wear-critical cycles are fully submerged in the cage pockets during a protection run. The same fundamental idea could apply to the critical angle θ c r i t . The experimental basis of this work has been showing that oscillations with a double amplitude of 7.5° did not produce false brinelling. This amplitude is much smaller than the 12.5° protection run which leads to full immersion of the contact track of the rolling element in the cage pockets. Wandel [22] found that calculating the critical angle based on the geometrical properties of the bearing leads to good results. However, reducing the calculated values by about 40% yielded even better compliance between observed damage and damage prediction using the starvation number. He concluded that grease reservoirs forming at the cage could affect its relevant geometry and hence influence the critical angle by leading to a reduction of the required oscillation angle for relubrication. When transferred to the findings of this work, a 40% decrease in the effective protection run double amplitude results in an oscillation angle of 7.54°. This is remarkably close to the value obtained by the experiments. Wandel [22] also said that the angle corresponding to the worst operating conditions, which is θ p e a k in term D 2 in this work, can be estimated based on the critical angle. He suggested using a value of θ c r i t 2 which would result in an oscillation angle of about 3.77°, which is noticeably larger than the value obtained from the experiments of about 1.875°. Based on these findings, a more general and non-experimental-based definition of an effective protection run as well as the tuning parameters of the term D 2 of the starvation number seems possible, but more work is needed in this direction.
It should be noted that the proposed wear model based on the MFD has been tuned with experimental results of small-scale blade bearings and specifically grease No. 1. In addition, the threshold value for indicating wear initiation has been derived from those experiments. The experiments with grease No. 2 and the ones with variable oscillation amplitudes are used to validate the general applicability of the model with good results for this specific application. The performance of the model has not been fundamentally proven for other applications or real-scale bearings yet. Especially the scaling of the starvation number with respect to its term D 2 and secondary replenishment mechanisms is difficult for real-scale blade bearings or any other application because it is based on numerous experiments. Hence, a more general approach based on geometrical properties and the design of the bearings would be beneficial for an easy adaptation of the proposed method to other applications. As mentioned previously, the definitions proposed by Wandel [22] are in good agreement with the results of this work with respect to the critical angle and effective lubrication runs. However, more detailed investigations must be performed to derive a conclusion regarding the usage of the internal design of a bearing for defining the oscillation angle corresponding to the worst operating conditions. The validity of the term D 1 has been shown in several other publications, like [6,19,20,22], and is found to be a good estimation for the base oil flow-based replenishment mechanism.
The proposed model uses no sophisticated methods for refining the spatially resolved MFD because it uses a simplified load distribution in the bearing. It would be possible to further enhance the model by incorporating more detailed approaches like finite element simulation to assess a more realistic load distribution. The model-based approach presented by Cubillas et al. [12] is a good example of this. Also, the influence of local slip could be incorporated into the model by using suitable global models or sophisticated sub-models as used by other works before (e.g., [12,13]). However, using the methodology with more detailed models would also become much more computationally heavy. Considering the distribution of wear marks on the bearings from the screening tests, a more sophisticated model for the load distribution and the spatially resolved friction work density could help predicting local damage initiation in a better way.
To calculate the MFD, the more fundamental equations from Section 2 must be transferred into an algorithm. Likewise to the work from Menck [32], this algorithm needs starting conditions and equations for calculating the positions of rolling elements relative to the inner and outer ring of the bearing. These positions are needed to count cycles and consider time spans between consecutive overrollings of segments in the bearing. However, in this work, these equations are only considering fixed transmission ratios based on the bearing geometry. As mentioned in [23], changing load conditions and therefore changing contact angles during the pitching motion of a blade bearing influence those transmission ratios, which could lead to gross slippage of the complete rolling body set. This specific behavior has not been visible throughout all experiments of this work. Therefore, this additional motion is not considered but could be implemented in more advanced models as it would enhance the relubrication in a blade bearing and lower the risk of wear damage initiation.
The primary intention of the proposed method is to rate certain operating conditions, which can be characterized by variable oscillations with respect to their individual risk of initiating wear. In the case of the experiments and model setup discussed in this work, the local risk of producing wear damage on the raceways in the form of false brinelling rises when a threshold value of about 2.21   J m m 2 is overreached for a segment in the bearing. However, this value could also be adjusted by the standard deviation derived from the experiments to become more or less conservative. As the distribution and movement of grease inside a large slewing bearing are of a rather chaotic nature and the results of the experiments in this work show a broad distribution of wear initiation, a conservative threshold value is advised to indicate the risk of wear damage.

5. Conclusions

This work presents a methodology for assessing and rating the risk of false brinelling under oscillating operating conditions in grease-lubricated rolling bearings. The methodology is based on the spatially resolved friction work density, which is modified by incorporating the starvation number to consider grease-specific lubrication properties to become the MFD. The risk of producing false brinelling is determined by a threshold value, which has been derived from experiments. Once the accumulated and spatially resolved MFD passes this threshold, it is likely that damage initiates. Values highly above the threshold are indicative of more pronounced false brinelling. The experimental results and the MFD show good consistency for the validation tests with variable oscillations and different grease properties. Therefore, the method is especially suited for assessing the risk of wear initiation under blade bearing-specific operating conditions. This has the potential of closing a gap between recent and more fundamental research on false brinelling damages and real-world applications like blade bearings.
Future research activities with respect to the proposed method will focus on assessing the risk of false brinelling initiation under wind turbine-specific operating conditions. The MFD can be used to trigger protection runs to actively redistribute the grease in the bearing and replenish the contact tracks with new lubricant to prevent wear from occurring. Hence, the MFD can be used as the basis for an on-demand protection run strategy.

Author Contributions

A.B.: conceptualization, methodology, investigation, validation, formal analysis, writing—original draft and final version, project administration, and funding acquisition; M.S.: writing—review and editing, and funding acquisition; J.W.: funding acquisition. All authors have read and agreed to the published version of the manuscript.

Funding

This research has been supported by the German Federal Ministry for Economic Affairs and Climate Action with the project “iBAC—Intelligent Bearing Amplitude Control” (grant No. 0324344A). The project funding is kindly acknowledged.

Data Availability Statement

The raw data supporting the conclusions of this article will be made available by the authors on request.

Acknowledgments

The authors would like to thank the project partners for supporting the projects with knowledge and data. The authors would also like to thank Heinrich Drath and Nils Thormählen for their support in assembling and operating the test rigs for the experiments.

Conflicts of Interest

The authors declare no conflicts of interest.

Abbreviations

The following abbreviations are used in this manuscript:
MFDModified friction work density
SBBSmall-scale blade bearings
4P BB4-point contact ball bearing
CPCCollective pitch control
IPCIndividual pitch control
BEAT1.1Bearing Endurance and Acceptance Test Rig 1.1
DOFDegree of freedom

Nomenclature

A m Area of a segment T F Friction torque
a Half height of a Hertzian contact ellipse t m , o u t Time a rolling element leaves a segment
2 b Width of a Hertzian contact ellipse t m , i n Time a rolling element enters a segment
D p w Pitch diameter of a bearing x Translatory travel distance of rolling element
D w Pitch diameter of the rolling element x 2 b Amplitude ratio
E m o d , m Cumulative modified friction work density of a segment in of a bearing z Number of rolling elements
E m o d , m , t h r e s h o l d Threshold value of the modified friction work density of a segment of a bearing for wear initiation α Contact angle
E d e n s , m , n Dissipated energy density in a segment per cycle φ W K Angle of rotation of a rolling element
E f , m , n Friction work/energy per segment and oscillation cycle θ Double amplitude oscillation angle of the inner ring
f Frequency θ p r o t e c t i o n Double amplitude oscillation angle of the inner ring for a protection run
n Cycle of overrolling of a segment θ p e a k Worst double amplitude oscillation angle of a rolling element for wear initiation
m Finite segment of the bearing raceway σ c r i t Critical standard deviation
O s Bleeding rate of the grease σ s Surface tension between base oil and air
Q w k , m Normal load of a rolling element within a segment η 0 Dynamic base oil viscosity
Q w k Normal load of a rolling element ν Base oil viscosity
S N m , n Estimated degree of starvation per oscillation cycle and segment ω p i t c h Pitching speed

References

  1. Haus, L.; Sheng, S.; Polikollu, R.V. Wind Turbine Major Systems Reliability Trends and Mitigation Strategies. Presented at the Drivetrain Reliability Collaborative Workshop; Chicago, IL, USA, 12–14 March 2024. [Google Scholar]
  2. Bossanyi, E.A. Individual Blade Pitch Control for Load Reduction. Wind Energ. 2003, 6, 119–128. [Google Scholar] [CrossRef]
  3. Stammler, M.; Thomas, P.; Reuter, A.; Schwack, F.; Poll, G. Effect of load reduction mechanisms on loads and blade bearing movements of wind turbines. Wind Energ. 2020, 23, 274–290. [Google Scholar] [CrossRef]
  4. Stammler, M. Wear test programs for roller-type pitch bearings of wind turbines. Wind Energ. Sci. 2023, 8, 1821–1837. [Google Scholar] [CrossRef]
  5. Stammler, M. Endurance Test Strategies for Pitch Bearings of Wind Turbines. Ph.D. Thesis, Gottfried Wilhelm Leibniz University, Hannover, Germany, 2020. [Google Scholar] [CrossRef]
  6. Wandel, S.; Bader, N.; Schwack, F.; Glodowski, J.; Lehnhardt, B.; Poll, G. Starvation and relubrication mechanisms in grease lubricated oscillating bearings. Tribol. Int. 2022, 165, 107276. [Google Scholar] [CrossRef]
  7. Poll, G.; Li, X.; Bader, N.; Guo, F. Starved Lubrication in Rolling Contacts-A Review. Bear. World J. 2019, 4, 69–81. [Google Scholar]
  8. Olofsson, U. Fatigue life reduction due to wear in boundary lubricated spherical roller thrust bearings. Wear 1997, 207, 74–78. [Google Scholar] [CrossRef]
  9. Tetora, S. False Brinelling-Stillstehende Fettgeschmierte Wälzlager Unter Dynamischer Belastung; FVA 540 III, IGF-Nr. 19786-BR; FVA: Frankfurt, Germany, 2022. [Google Scholar]
  10. Schadow, C. False Brinelling-Stillstehende Fettgeschmierte Wälzlager Unter Dynamischer Beanspruchung: Abschlussbericht FVA-Nr. 540 II; FVA: Frankfurt, Germany, 2016. [Google Scholar]
  11. Presilla, R.D.L.; Wandel, S.; Stammler, M.; Grebe, M.; Poll, G.; Glavatskih, S. Oscillating rolling element bearings: A review of tribotesting and analysis approaches. Tribol. Int. 2023, 188, 108805. [Google Scholar] [CrossRef]
  12. Cubillas, D.; Olave, M.; Llavori, I.; Ulacia, I.; Larrañaga, J.; Zurutuza, A.; Lopez, A. Semi-Analytical Methodology for Fretting Wear Evaluation of the Pitch Bearing Raceways Under Operative and Non-Operative Periods. Wind. Energy Sci. Discuss. 2024, 2024, 1–23. [Google Scholar] [CrossRef]
  13. Schwack, F.; Prigge, F.; Poll, G. Finite element simulation and experimental analysis of false brinelling and fretting corrosion. Tribol. Int. 2018, 126, 352–362. [Google Scholar] [CrossRef]
  14. Meng, H.C.; Ludema, K.C. Wear models and predictive equations: Their form and content. Wear 1995, 181, 443–457. [Google Scholar] [CrossRef]
  15. Archard, J.F. Contact and Rubbing of Flat Surfaces. J. Appl. Phys. 1953, 24, 981–988. [Google Scholar] [CrossRef]
  16. Hanief, M.; Charoo, M.S. Archard’s wear law revisited to measure accurate wear coefficient considering actual sliding velocity. Mater. Today Proc. 2021, 47, 5598–5600. [Google Scholar] [CrossRef]
  17. Fouvry, S.; Liskiewicz, T.; Kapsa, P.; Hannel, S.; Sauger, E. An energy description of wear mechanisms and its applications to oscillating sliding contacts. Wear 2003, 255, 287–298. [Google Scholar] [CrossRef]
  18. Hart, E.; de Mello, E.; Dwyer-Joyce, R. Wind turbine main-bearing lubrication–Part 1: An introductory review of elastohydrodynamic lubrication theory. Wind Energ. Sci. 2022, 7, 1021–1042. [Google Scholar] [CrossRef]
  19. Wandel, S.; Bartschat, A.; Glodowski, J.; Bader, N.; Poll, G. Wear Development in Oscillating Rolling Element Bearings. Lubricants 2023, 11, 117. [Google Scholar] [CrossRef]
  20. Bayer, G.; Bartschat, A.; Wandel, S.; Baust, S.; Poll, G. Experimental Investigations on Wear in Oscillating Grease-Lubricated Rolling Element Bearings of Different Size and Type. Lubricants 2023, 11, 120. [Google Scholar] [CrossRef]
  21. Cann, P.; Damiens, B.; Lubrecht, A. The transition between fully flooded and starved regimes in EHL. Tribol. Int. 2004, 37, 859–864. [Google Scholar] [CrossRef]
  22. Wandel, S. Starvation in Oscillating Rolling Element Bearings. Ph.D. Thesis, Gottfried Wilhelm Leibniz University, Hannover, Germany, 2024. [Google Scholar] [CrossRef]
  23. Stammler, M.; Menck, O.; Guo, Y.; Keller, J. Wind Turbine Design Guideline DG03: Yaw and Pitch Bearings; NREL/TP-5000-89161; NREL: Golden, CO, USA, 2024. Available online: https://www.nrel.gov/docs/fy24osti/89161.pdf (accessed on 16 October 2024).
  24. Stammler, M.; Poll, G.; Reuter, A. The influence of oscillation sequences on rolling bearing wear. Bear. World J. 2019, 4, 19–25. [Google Scholar]
  25. Behnke, K.; Schleich, F. Exploring limiting factors of wear in pitch bearings of wind turbines with real-scale tests. Wind Energy Sci. 2023, 8, 289–301. [Google Scholar] [CrossRef]
  26. Schwack, F.; Stammler, M.; Bartschat, A. Solutions to Reduce Wear in Wind Turbine Blade Bearings. In Proceedings of the Bearing World Conference 2018, Kaiserslautern, Germany, 6 March 2018. [Google Scholar]
  27. Menck, O.; Behnke, K.; Stammler, M.; Bartschat, A.; Schleich, F.; Graßmann, M. Measurements and modeling of friction torque of wind turbine blade bearings. J. Phys. Conf. Ser. 2022, 2265, 22087. [Google Scholar] [CrossRef]
  28. Graßmann, M.; Schleich, F.; Stammler, M. Validation of a finite-element model of a wind turbine blade bearing. Finite Elem. Anal. Des. 2023, 221, 103957. [Google Scholar] [CrossRef]
  29. Bartschat, A.; Behnke, K.; Stammler, M. The effect of site-specific wind conditions and individual pitch control on wear of blade bearings. Wind Energ. Sci. 2023, 8, 1495–1510. [Google Scholar] [CrossRef]
  30. Hohmann, M.; Blechschmidt, E.; Menck, O. Prediction of the friction torque of scaled blade bearings in a test rig using machine learning. J. Phys. Conf. Ser. 2024, 2767, 52010. [Google Scholar] [CrossRef]
  31. Escanciano, I.; Heras, I.; Schleich, F.; Aguirrebeitia, J. Methodology for the assessment of the friction torque of ball slewing bearings considering preload scatter. Friction 2024, 12, 1838–1857. [Google Scholar] [CrossRef]
  32. Menck, O. The Finite Segment Method—A Numerical Rolling Contact Fatigue Life Model for Bearings Subjected to Stochastic Operating Conditions. J. Tribol. 2023, 145, 031201. [Google Scholar] [CrossRef]
  33. Palmgren, A. Neue Untersuchungen über Energieverluste in Wälzlagern; SKF Kugellagerfabriken: Gothenburg, Sweden, 1957. [Google Scholar]
  34. Stammler, M.; Schwack, F.; Bader, N.; Reuter, A.; Poll, G. Friction torque of wind-turbine pitch bearings–comparison of experimental results with available models. Wind Energ. Sci. 2018, 3, 97–105. [Google Scholar] [CrossRef]
  35. Rezaei, A.; Schleich, F.; Menck, O.; Grassmann, M.; Bartschat, A.; Nejad, A.R. Comparative analysis of rolling contact fatigue life in a wind turbine pitch bearing with different modeling approaches. J. Phys. Conf. Ser. 2024, 2767, 52036. [Google Scholar] [CrossRef]
Figure 1. BEAT1.1 test rig and 750 mm bearing ©Fraunhofer IWES/Ulrich Perrey.
Lubricants 12 00415 g001
Figure 2. Illustration of a segmented raceway of the inner ring with nomenclature.
Lubricants 12 00415 g002
Figure 3. (a) Examples of the starvation number depending on the cycle time t m , i n t m , o u t and using a = 1 mm as an arbitrary value for the half of the contact height for two different greases; (b) Starvation number after applying the case differentiation (Equation (5)).
Lubricants 12 00415 g003
Figure 4. Mean values of friction work increase per oscillation cycle over oscillation angles derived from experiments discussed in [20] on the left y-axis and value of proposed scaling function (Equation (6)) on the right y-axis.
Lubricants 12 00415 g004
Figure 5. Angular position of a rolling element within the bearing with the starting position at 0° (green line) and indicated overrollings/cycles (n = 1, 2, 3, 4 indicated with red dots) of a segment at −1° position in addition to the oscillation amplitudes between the overrollings (orange arrows).
Lubricants 12 00415 g005
Figure 6. (a) Normalized starvation number S N for different double amplitudes and cycle frequencies and grease No. 1; (b) Normalized starvation number S N for different double amplitudes and cycle frequencies and grease No. 2.
Lubricants 12 00415 g006
Figure 7. (a) Picture of a bearing inner ring after test with grease No. 1: Amplitude ratio x 2 b = 4.2 , frequency 0.75 Hz, and 500 (1), 1000 (2), 3000 (3), 5000 (4), and 10,000 (5) cycles (left to right with only 10,000 (5), 5000 (4), and 3000 (3) cycles produced false brinelling); (b) MFD based on torque measurement from the test with indication of the five sequences and corresponding cycle numbers.
Lubricants 12 00415 g007
Figure 8. (a) Picture of a bearing inner ring after test with grease No. 2: Amplitude ratio x 2 b = 4.2 , frequency 0.75 Hz, and 500 (1), 1000 (2), 3000 (3), 5000 (4), and 10,000 (5) cycles (left to right with 10,000 (5), 5000 (4), 3000 (3), 1000 (2), and partly 500 (1) cycles produced a false brinelling); (b) MFD based on torque measurement from the test with indication of the five sequences and corresponding cycle numbers.
Lubricants 12 00415 g008
Figure 9. Results of a test with sequences of wear-critical cycles and protection runs every 10 (a) and every 100 cycles (b); Test parameters: x 2 b = 6.3 ,   θ = 2.25 ° ,   f = 0.5   Hz ,   and   θ p r o t e c t i o n = 7.5 ° .
Lubricants 12 00415 g009
Figure 10. Results of the test with wind turbine-specific operating conditions, small-scale blade bearing and grease No. 1; Picture of the raceway from [29].
Lubricants 12 00415 g010
Figure 11. Results of the test with wind turbine-specific operating conditions, small-scale blade bearing and grease No. 1; (a) MFD based on torque measurements and loads; (b) Zoomed region from 170° to 190°.
Lubricants 12 00415 g011
Figure 12. Results of the test with wind turbine-specific operating conditions, small-scale blade bearing and grease No. 2; Picture of the raceway from [29].
Lubricants 12 00415 g012
Figure 13. Results of the test with wind turbine-specific operating conditions, small-scale blade bearing and grease No. 2; (a) MFD based on torque measurements and loads; (b) Zoomed region from 170° to 190°.
Lubricants 12 00415 g013
Table 1. Properties of the bearings.
PropertySmall-Scale Blade Bearing (SBB)
Bearing Type2 row 4P BB
Inner diameter596 mm
Outer diameter750 mm
Pitch diameter673 mm
Number of rolling elements2 × 69
Diameter rolling element25.4 mm
Grease volume per bearing600 mL
Initial contact angle45°
Cage designSheet metal
Cage thickness4.2 mm
Table 2. Parameters of the screening tests for false brinelling initiation and progression.
ParameterValue
Axial load0
Bending moment150 kNm
Maximum contact pressure2.5 GPa
Shape of oscillating movementSinusoidal
Operating temperatureAmbient temperature between 18 °C and 28 °C
Double amplitude of oscillation θ 0.75°–7.5°
Ratio of x/2b for 2.5 GPa of contact pressure2.1–21
Oscillation frequency0.05 Hz–3 Hz
Resulting max. entrainment speeds3.5 mm/s–20.7 mm/s
Oscillation cycles per testfor x/2b = 2.1–4.2: 500, 1000, 3000, 5000, 10,000
for x/2b = 6.3–21: 1000, 5000, 10,000
GreaseGrease No. 1 for all and grease No. 2 only for selected test parameters
Table 3. Properties of the greases used in the experiments.
PropertyGrease No. 1Grease No. 2
Base oil viscosity ν at 40 °C in cSt52473
Dynamic base oil viscosity η 0 at 40 °C in Pas0.04250.4163
Oil separation rate O s at 40° in %4.74.7
Surface tension σ s in N/m0.030.03
Table 4. Parameters of the tests for false brinelling initiation and protection runs.
ParameterValue
Axial load0
Bending moment150 kNm
Maximum contact pressure2.5 GPa
Shape of oscillating movementSinusoidal
Operating temperatureAmbient temperature between 18 °C and 28 °C
Double amplitude of wear-critical oscillation φ 0.75°–3.75°
Corresponding Ratio of x/2b2.1–10.5
Oscillation frequency of the wear sequences 0.3 Hz–1.5 Hz
Resulting max. entrainment speed of the wear sequences10.4 mm/s
Double amplitude of protection run φ p r o t e c t 7.5°, 10°, 12.5°
Oscillation cycles per test10,000 + protection runs
Grease Grease No. 1 only
Table 5. Test results regarding damage initiation and calculated MFD.
Test Condition x 2 b ,   f in HzCycles MFD   in   J m m 2 Mean   Value   in   J m m 2
DamageNo DamageDamageNo Damage
2.1, 0.5300010001.590.481.04
2.1, 1.5300010004.370.982.68
2.1, 3 300010006.571.744.16
4.2, 0.25300010001.910.491.20
4.2, 0.75300010004.591.202.90
4.2, 1.5300010002.761.742.25
6.3, 0.17500010002.220.421.32
6.3, 0.5500010005.570.833.20
6.3, 1500010007.101.104.10
8.4, 0.38500010001.250.220.74
10.5, 0.110,00050001.000.460.73
10.5, 0.310,00050002.471.031.75
10.5, 0.610,00050003.961.482.72
20.1, 0.05 ---
20.1, 0.15 ---
20.1, 0.3 ---
Disclaimer/Publisher’s Note: The statements, opinions and data contained in all publications are solely those of the individual author(s) and contributor(s) and not of MDPI and/or the editor(s). MDPI and/or the editor(s) disclaim responsibility for any injury to people or property resulting from any ideas, methods, instructions or products referred to in the content.

