Abstract
The oil-lubricated long-life aircraft valve is one of the most important components to ensure the safety of the entire aircraft system, and it needs to operate millions of times during the whole service life, significantly necessitating techniques to enhance its tribological performance. To this end, five different surface textures, i.e., spherical cap, ellipsoidal cap, tree-frog, grass-lip and nepenthes textures were introduced to the pin’s surface of an aircraft valve to improve the valve’s tribological performance. By numerically solving the Reynolds equation with the Jakobsson–Floberg–Olsson cavitation boundary conditions, the effect of the five textures on the tribological performance was simulated. To optimize the geometric parameters of the five textures for a better tribological performance, the Analytic Hierarchy Process was introduced to derive a coupled tribological parameter, which accounts for three classical tribological parameters, including load bearing capacity, friction and friction coefficient. The five textures with optimal values of geometric parameters were also compared to one another using the Analytic Hierarchy Process, and this finally led to a suggestion of the best surface texture for the aircraft valve. The parametric optimization approach proposed in this work can be widely applied for the parametric optimization of surface textures in other applications.
1. Introduction
Oil-lubricated long-life aircraft valves are significant for the protection of hydraulic systems from overpressure. A long-life valve may need to open and close millions of times during its whole service life, and this may lead to a high risk of large friction and severe wear of the valve, causing energy loss and even the failure of the whole hydraulic system. Hence, many efforts have been made to optimize the tribological performance of oil-lubricated long-life aircraft valves, and surface texture is one of most favorable techniques. Manufacturing specifically designed features (i.e., textures), such as grooves and pockets on the lubricated surfaces [,], introduces additional changes in the gradient of the oil film thickness and, thus, enhances the hydrodynamic effect of lubrication and load bearing capacity [,]. Additionally, the surface texture also acts as a lubricant reservoir that can trap wear particles to minimize abrasion and even maintain a continuous oil film under heavy load []. Therefore, surface texture has been widely used to improve the load bearing capacity, wear resistance, and friction coefficient of tribomechanical components [,,,,].
In the past decades, many studies of surface texture have been focused on reducing friction and wear between lubricated surfaces [], which necessitates a good understanding of the effect of texture parameters on lubrication performance [], and the outcomes have been widely applied in various mechanical systems for the improvement of lubrication status and tribological performance []. For instance, via a series of experimental tests, Kovalchenko et al. [] concluded that the use of laser concave texture under boundary lubrication conditions is effective in reducing the friction coefficient. Pettersson et al. [] observed that concave textures of specific dimensions can serve as tiny oil reservoirs and, thus, can effectively reduce the friction and wear, especially under boundary lubrication. Ryk et al. [] investigated the effect of a partial laser surface texture (LST) on the friction of piston rings and found it was reduced by a quarter.
Subsequently, many researchers found that different types of textures may lead to different influences on the lubrication performance [], and a good texture design can effectively reduce the friction coefficient and improve the load bearing capacity. For example, Qiu et al. [] conducted a study on the performance of parallel sliding bearings with spherical, ellipsoidal, circular, elliptical, and triangular textures and found that the ellipsoidal texture results in the highest load bearing capacity. Yu et al. [] investigated the effects of different texture shapes (circular, triangular, and elliptical) and their orientation on the pressure distribution between lubricated surfaces, with a particular focus on the effect of both the shape and the orientation of the spherical cap texture on the load bearing capacity. Costa and Hutchings [] studied the effects of different geometries of grooves, circular or herringbone, on the dynamic compressive properties of sliding contacts, and the results show that the circular texture is optimal. Shen and Khonsari [] investigated fully textured parallel slide bearings with optimal groove-shaped textures for one-way sliding and two-way sliding shapes, and also compared the performances of these optimized textures with those having normal geometrical textures (circular, elliptical, square, hexagonal, and rhombic shapes). These studies were focused on the influence of parameters of surface textures such as grooves and simple geometric polygons on the tribological properties of lubricated sliding surfaces. This implies the promising potential of using surface textures to enhance the tribological performance of aircraft valves, which are also formed by lubricated sliding surfaces. However, further in-depth investigations are still required to fully understand how textures can improve tribological performance in specific applications.
The tribological performances of lubricated surfaces with textures vary greatly with the texture’s geometric parameters. Hence, the optimization of textures is significant to further improve the tribological performance. In the past decades, optimization algorithms have been successfully applied in various engineering optimization problems, including the optimization of surface textures []. For instance, Zhang et al. [] used a Genetic Algorithm (GA) to optimize the shapes of elliptical, cylindrical and spindle surface textures to achieve low friction in reciprocating motion and experimentally compared the tribological performance between the optimized textures and the cylindrical surface texture. The results showed that elliptical and spindle surface textures are effective in increasing the load bearing capacity and reducing the friction coefficient compared to cylindrical textures. Shen et al. [] optimized the shapes of cylindrical, elliptical, trigonal, and herringbone groove surface textures using a Sequential Quadratic Programming (SQP)-based algorithm and compared the tribological performance with those of regular shapes. The results showed that the friction coefficient of the optimal texture is better than that of the regular shape. Chen et al. [] optimized the geometric parameters of asymmetric herringbone groove texture for dynamic radial bearing based on Taguchi’s algorithm. Wang et al. [] used a hybrid GA-SQP algorithm to optimize the parameters of straight, large-angle, and small-angle grooves to obtain the globally optimal shape of the surface texture. The groove texture optimized by the two hybrid methods can effectively reduce the friction coefficient of the specimen. Huang et al. [] used the Analytic Hierarchy Process (AHP), a method proposed for addressing multifactorial and multidimensional problems [,,], to optimize the effects of the tribological properties of AISI 4140 composites under different load, speed, and sliding distance conditions. The AHP method is particularly effective in quantifying opinions based on personal experience and knowledge and is a particularly useful way of quantifying and comparing subjective data [].
The operational mechanism of a certain type of component involves the axial reciprocating motion of a ring on a pin. The wear generated during this process can be mitigated by adding surface textures to the pin. Xu et al. [] machined rhomboid textures on the spool of a pilot valve, which effectively reduced friction and improved lubrication performance compared to a pilot valve without texture. Tao et al. [] applied hemispherical textures to the valve core to address the issues of poor lubrication performance and severe wear in water hydraulic slide valves. Chen et al. [] used rhombic and striped textures on the surface of a hydraulic cylinder, and found that under identical working conditions, the friction coefficient of the rhombic texture was only one-quarter of that of the striped texture, significantly enhancing the hydraulic cylinder’s frictional performance. Wang [] conducted a study on the hydrodynamic lubrication characteristics of composite textures (cylindrical, trapezoid prism, and quadrangular prism) on the valve spool of a hydraulic safety valve. The results demonstrated that incorporating composite textures on the valve spool effectively reduces friction and wear.
In the literature, many efforts have been made on investigating the effects of textures on lubricated surfaces, as well as optimizing the dimensions of textures. However, there seems to be very limited work on finding the optimal textures for oil-lubricated long-life aircraft valves, which also need a long-life reciprocating motion. In this work, two classical textures, i.e., spherical and ellipsoidal caps, and three bionic textures, tree-frog, grass-lip, and nepenthes textures, were considered to improve the tribological performance of an oil-lubricated long-life aircraft valve. The Reynolds equation for hydrodynamic lubrication was used to obtain the oil film pressure and derive other tribological parameters, such as friction and load bearing capacity, which were then incorporated into the AHP method to optimize the textures’ geometric parameters.
2. Lubrication Model
The oil-lubricated long-life aircraft valve considered in this work is shown in Figure 1. Both the ring and the pin are made of 1Cr18Ni10Ti stainless steel, due to its excellent corrosion resistance, high strength, and suitability for high-stress and high-friction environments, and its mechanical properties are shown in Table 1. The ring and pin have an initial roughness of , and were thus assumed to be smooth in this study. To turn the valve off or on, the ring needs to slide forward or backward on the pin, and this operation may need to repeat millions of times during the whole service life of the valve, making it important to improve the lubrication performance of the valve, although the radial load on the ring is small. As discussed above, introducing textures on the surface of the pin may reduce the friction and enhance the load bearing capacity, and this approach was thus adopted in this work. To calculate the oil film pressure between the pin’s surface and the ring’s inner surface, the Reynolds equation was used, whereby the deformation of surfaces is ignored because of the small radial load of the valve. This is detailed below.
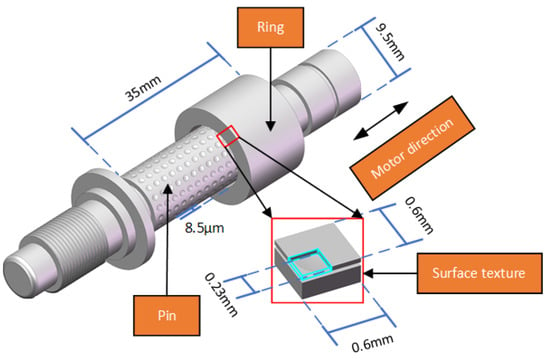
Figure 1.
Illustration of an oil-lubricated long-life aircraft valve studied in this work.

Table 1.
The mechanical properties of the ring and pin’s material 1Cr18Ni10Ti stainless steel.
2.1. Reynolds Equation with JFO Boundary Condition
Since the radial load of the valve is small, the elastic deformation of the pin and ring’s surfaces is negligible, and the viscosity of the lubricant can be considered as constant. If only a small region of the textured surface is considered, the Reynolds equation can be expressed in the Cartesian coordinate system as []
where is the sliding (or axial) direction between the pin and ring, corresponds to the circumferential direction, is the thickness of the oil film between the pin and ring, is the oil film pressure, is the dynamic viscosity of the lubricant, and is the relative sliding speed between the pin and ring. Relative rotation between the pin and ring is not allowed in this work.
Boundary conditions determining the rupture of oil film are important for solving the Reynolds equation, and the most common ones are Sommerfeld, Half–Sommerfeld, Reynolds, and Jakobsson–Floberg–Olsson (JFO) boundary conditions. The Sommerfeld and Half–Sommerfeld boundary conditions are easy to use, but their assumption of continuous oil film in the whole or half of fluid domain may lead to unacceptable errors. The Reynolds boundary condition accounts for cavitation by postulating that the oil film initiates at the point of maximum film thickness and ruptures at the location where both the film pressure and the pressure gradient normal to the -direction reach zero. While this model provides a more reasonable explanation at the point where the oil film ruptures, it cannot accurately describe the reformation of the oil film. The JFO cavitation boundary condition not only provides an accurate prediction of the oil film rupture location, but also gives the boundary of oil film reformation, and was thus adopted in this paper. The Reynolds equation based on the JFO cavitation boundary conditions can be expressed as []
where is the lubricant density ratio, defined as . Here, is a cavitation index defined as
and is a dimensionless parameter distinguishing the full film region (if is positive) and cavitation region (if is nonpositive), and usually defined by , where is the reference (atmosphere) pressure.
For ease of numerical calculation, the Reynolds equation is usually nondimensionalized by defining the following dimensionless parameters:
where represents the dimensionless oil film thickness, is the referenced oil film thickness, is the dimensionless oil film pressure, denotes the atmospheric pressure, and refer to the dimensionless coordinates in the and directions, respectively, and and denote the length and width of a unit cell of the texture, respectively. Substitution of these dimensionless parameters into the Reynolds equation (Equation (2)) enables it to be rewritten as
For such an equation, it is very challenging to obtain its analytical solution and, thus, numerical methods for partial differential equation (PDE) are usually preferred. Among the numerical methods for solving Reynolds equation, the Finite Difference Method (FDM) is a straightforward and well-established numerical approach frequently employed in many references [], and was also adopted in this work, whereby central differential scheme [] was used to derive the first and second partial derivatives. Following the FDM [], the discretized form of the dimensionless Reynolds equation (see Equation (5)), can be expressed as
where
where are coefficient matrices, subscripts refer to node , and and denote the distances in and directions between two neighboring nodes. The whole computational domain was discretized into an equally spaced grid, with nodes along the -direction and nodes along the -direction, resulting in a total of nodes within the entire computational domain.
The discretized Reynolds equation (see Equation (6)), can then be solved iteratively:
where denotes the iteration step, and denotes the value of at the -th iteration step at node . For a faster convergence of iteration, one may use Successive Over-Relaxation (SOR), as follows:
where is the super relaxation coefficient in the range (1, 2), and it was set to be in this work. The above iteration can be considered convergent when the following condition is satisfied:
Once the dimensionless parameter Φ is calculated, the cavitation index can be obtained from Equation (3), and the dimensionless film pressure can be obtained from Equation (4).
2.2. Parameters Evaluating Tribological Performance
Tribological performance of the aircraft valve can be evaluated using many parameters, while the load bearing capacity, friction and friction coefficient are of more interest during application [,,,]. Generally, a higher load bearing capacity implies a lower possibility of contact between the lubricated surfaces, while a lower friction and friction coefficient indicate a smaller energy loss and wear, respectively. Hence, these three parameters were used to evaluate the tribological performance in this work and defined as follows:
The load bearing capacity of the oil film can be obtained by integrating the oil film pressure over the entire fluid domain
by noting that the oil film pressure can be derived from the dimensionless oil film pressure, i.e., .
The friction at the lubricated surface of the aircraft valve can be obtained by integrating the shear stress over the entire fluid domain
where the shear stress can be obtained by .
The friction coefficient can then be expressed as
2.3. Optimization Using AHP
All the three parameters defined above, i.e., load bearing capacity, friction and friction coefficient, are important tribological indices, and thus need to be considered in finding the optimal surface texture. To this end, the three parameters were coupled together using the Analytic Hierarchy Process (AHP) to describe the coupled tribological performances of surface textures.
The AHP optimization generally consists of the following four steps:
- (1)
- Definition of degrees of importance
- The to-be-optimized system is generally affected by more than one factor, while some factors may affect the system more severely compared to other factors. Hence, AHP requires definition of degrees of importance to characterize the significance of each factor in affecting the system.
- (2)
- Construction of judgement matrix
- The judgement matrix facilitates pairwise comparison between any two studied factors, and each value in it is calculated based on the degrees of importance and defines the relative importance between two factors.
- (3)
- Consistency check
- Consistency check is used to ensure logical consistency in the pairwise comparison between any two factors, by calculating the consistency index (CI) and consistency ratio (CR) based on the judgement matrix. If the CR is less than the commonly accepted threshold of 0.1, the judgment matrix is considered to have acceptable consistency, indicating that the pairwise comparisons are logically coherent.
- (4)
- Optimization using a coupled factor
- A coupled factor can then be defined using weighted sum of all factors, whereby the weight of each factor takes the corresponding value in the normalized eigen factor of the judgement matrix. Parametric optimization accounting for multiple factors is then transformed to be maximizing or minimizing the coupled factor.
Following the AHP optimization process, parametric optimization of the tribological performance of the valve was conducted as follows:
For many valves, load bearing capacity is usually significant, but it is less important for the one studied in this study because the radial load applied to this type of valve is very small, as mentioned above. Since the ring needs to slide back and forth along the pin millions of times during the service life of the valve, a small friction coefficient and frictional force will be more favorable. This is because a higher friction coefficient generally leads to severer wear [], while a larger friction force means more energy loss when operating the valve. The ultimate goal of optimizing surface texture parameters for this aircraft valve is to minimize wear on the lubricated surface, thereby ensuring a long service life for the equipment. Thus, the friction coefficient seems to be more significant than the friction, while load bearing capacity is the least important for the aircraft valve learned in this work. The degrees of importance for the three tribological parameters, i.e., load bearing capacity, friction and friction coefficient, were finally defined as the following vector :
while the degrees of importance may be defined differently depending on the actual needs in applications. Next, a judge matrix needs to be defined to facilitate pairwise comparison between any two of the three parameters.
In traditional AHP, the 1–9 scale method [] is commonly used to establish the judgment matrix. Although this method provides excellent uniformity, it has certain drawbacks, such as poor consistency, which can lead to issues like rank reversal and a disconnect with logical consistency []. To this end, the exponential scale method was proposed in [], and this method was adopted to construct the judgment matrix .
The element in the judgment matrix denotes the relative importance of factor to factor .
where is obtained by normalizing the vector .
where and refer to the -th element in and , respectively. This enables the judgment matrix to be obtained as
Next, the consistency of the judgment matrix must be checked, to avoid possible logical contradictions of pairwise comparisons. This is performed as follows:
The eigenvectors of the judgment matrix are
The maximum eigenvalue of the judgment matrix can be obtained by solving the following equation:
The CI is given by [,]:
where is the order of the judgment matrix, which is in this work. The CR is defined as
where is the random consistency index []. For the judgement matrix in this work (see Equation (18)), its maximum eigenvalue , leading to a consistency index and consistency ratio . It is generally accepted that the judgment matrix has an acceptable consistency when [].
After checking the consistency of the judgement matrix , the eigenvector needs to be normalized to obtain the weights corresponding to the three parameters, i.e., load bearing capacity, friction and friction coefficient.
When conducting parametric optimization of a certain type of surface texture, a series of numerical simulations are conducted by varying the geometric parameters of the texture. Next, the three tribological parameters, i.e., load bearing capacity, friction and friction coefficient, can be evaluated and denoted as vectors , and , respectively. It should be noted that a larger load bearing capacity combined with a smaller friction and friction coefficient indicates a better tribological performance for the valve studied in this work. Therefore, vectors of the three tribological parameters can be normalized as follows:
where is the normalization of , . Next, a coupled tribological parameter accounting for load bearing capacity, friction and friction coefficient can be defined as
where
Hence, the goal of the parametric optimization in this work is to find the maximum value in the results of the coupled tribological parameter , and the corresponding values of geometric parameters of the texture are the optimal results.
3. Modeling of Surface Textures
In this work, five different surface textures, i.e., spherical cap, ellipsoidal cap, tree-frog, grass-lip and nepenthes, were considered to improve the tribological performance of the aircraft valve. Modelling of these surface textures is detailed below.
3.1. Geometric Models of Surface Textures
As shown in Figure 2, the surface textures are uniformly distributed both axially and circumferentially on the pin’s surface of the valve. For ease of explanation, only one unit cell of the texture is detailed below.
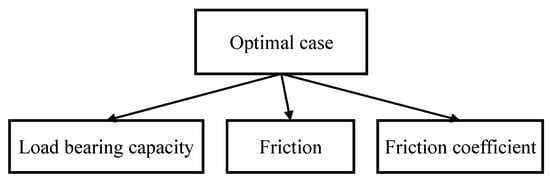
Figure 2.
Optimization system for texture friction performance.
3.1.1. Spherical Cap
Figure 3 illustrates the geometric shape of the spherical cap texture on the valve surface. The lower part in Figure 3a represents a unit cell of the texture on the pin’s surface, while the upper part, i.e., a rectangular plate, represents the simplified ring. Figure 3b details the three views of the spherical cap texture, while Figure 3c is the corresponding 3D model. In the diagrams, and denote radius and depth of the spherical cap, respectively, represents the radius of the cap base, and is the clearance between the lubricated surface (which is also the referenced oil film thickness).
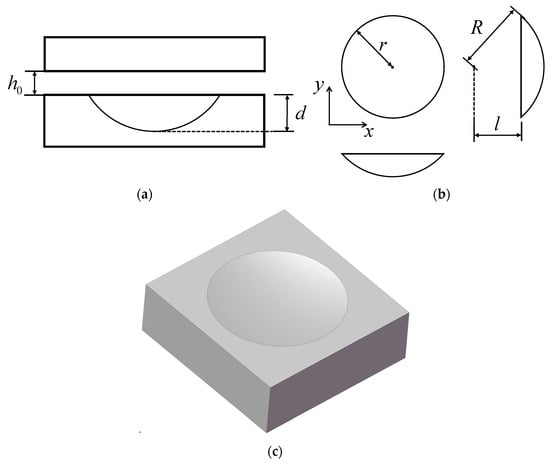
Figure 3.
Modeling of spherical cap texture: (a) Section view; (b) three views; (c) 3D model.
For this texture, the oil film thickness can be expressed as
where denotes the coordinates of the cap base center.
3.1.2. Ellipsoidal Cap
Figure 4 illustrates the geometric shape of a unit cell of an ellipsoidal cap texture on the pin’s surface, in which Figure 4a–c displays the front view of the lubricated surfaces, three views of the texture’s unit cell and the corresponding 3D model, respectively.
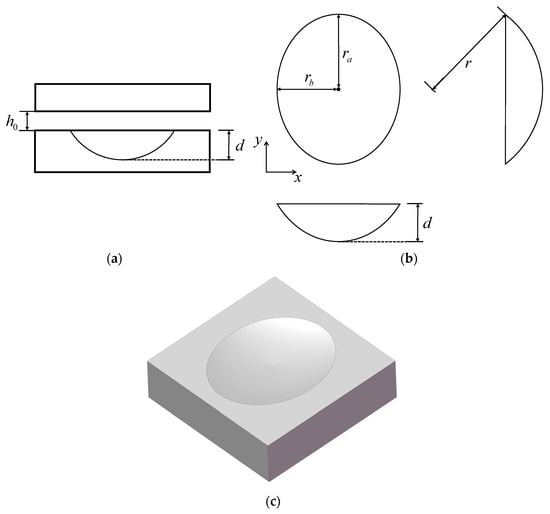
Figure 4.
Modeling of ellipsoidal cap texture: (a) Section view; (b) three views; (c) 3D model.
The ellipsoidal cap can be mathematically expressed as
where is the center of the ellipsoidal cap base, and
where are the long, middle and short semi-axes of the ellipsoid, respectively. and denote the half-lengths of the long and short axes of the ellipsoidal cap, respectively. d is the texture depth.
For this texture, the oil film thickness can be expressed as
3.1.3. Tree-Frog
Figure 5 illustrates the geometric shape of a unit cell of a tree-frog texture on the pin’s surface, in which Figure 5a–c displays the front view of the lubricated surfaces, three views of the texture’s unit cell and the corresponding 3D model, respectively.
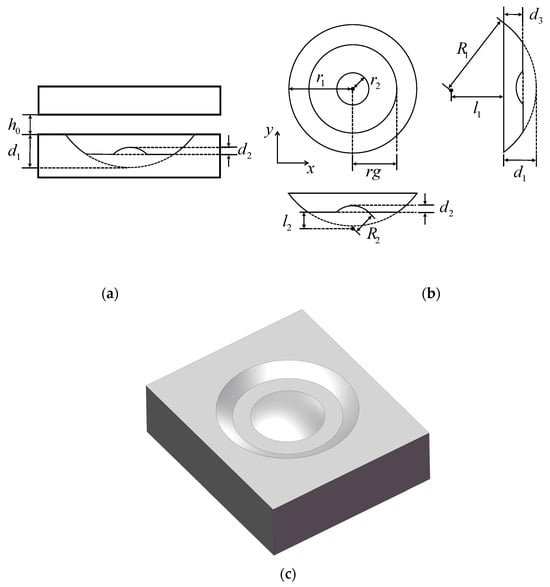
Figure 5.
Modeling of tree-frog texture: (a) section view; (b) three views; (c) 3D model.
The tree-frog texture is a combination of a large spherical cap with a radius of and depth of , a small spherical cap with a radius of R2 and depth of and a flat platform with a radius of and depth of . The radius of the base of the large spherical cap is , and that of the base of the small spherical cap is .
Therefore, the oil film thickness h can be expressed as
where denotes the coordinates of the center of the spherical cap base.
3.1.4. Grass-Lip
Figure 6 illustrates the geometric shape of the unit cell of a grass-lip texture on the pin’s surface, in which Figure 6a–c displays the front view of the lubricated surfaces, three views of the texture’s unit cell and the corresponding 3D model, respectively.
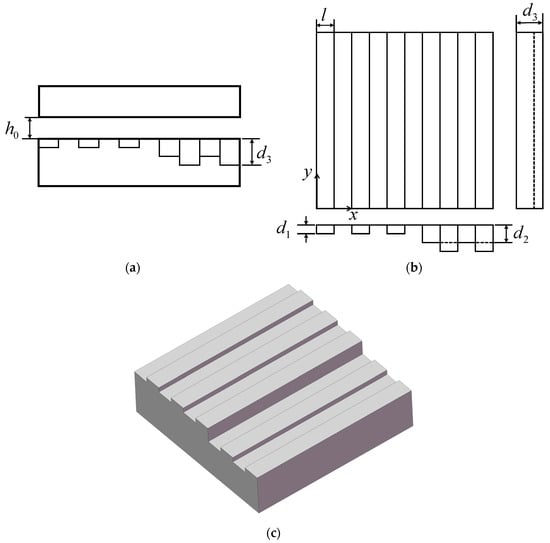
Figure 6.
Modeling of grass-lip texture: (a) section view; (b) three views; (c) 3D model.
The grass-lip texture in this work consists of several straight grooves perpendicular to the -direction (i.e., the direction of relative motion). These grooves have three different depths, as shown in Figure 6, where , and denote the maximum, intermediate and minimum depths respectively, while denotes the width of the straight grooves.
Therefore, the oil film thickness for the grass-lip texture can be expressed as:
3.1.5. Nepenthes
Figure 7 illustrates the geometric shape of a unit cell of a nepenthes texture on the pin’s surface, in which Figure 7a–c displays the front view of the lubricated surfaces, three views of the texture’s unit cell and the corresponding 3D model, respectively.
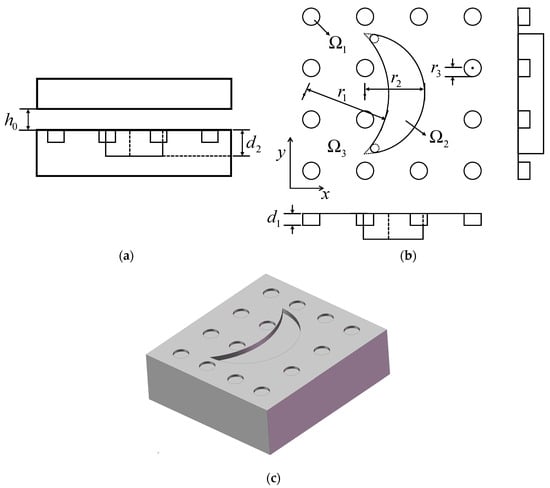
Figure 7.
Modeling of nepenthes texture: (a) section view; (b) three views; (c) 3D model.
The nepenthes texture in this work consists of 4-by-4 small cylindrical textures with a radius of and depth of , and a large crescent texture with radii of r1 for the outer circle and for the inner circle and depth of . For ease of mathematical expression, let , and be the regions of the cylindrical textures and crescent texture and the untextured region, respectively.
Therefore, the oil film thickness can be expressed as
3.2. Arrangements for Parametric Optimization
Since the texture’s unit cells are uniformly distributed on the pin’s surface in the valve and the radial load applied to the valve in this work is usually very small, it is reasonable to use the axial symmetry of the valve and simulate only a small region of the textured surface by assuming periodic boundary conditions in the circumferential direction of the pin, similar to the model in He’s study []. For instance, in this work, unit cells, i.e., unit cells uniformly distributed in the -direction, were simulated to reduce the computational cost, as shown in Figure 8, which takes the spherical cap texture as an example. During the numerical simulation, the upper and lower boundaries (boundaries perpendicular to the circumferential direction of the pin) were prescribed with periodic boundary conditions, while the left and right boundaries (boundaries perpendicular to the pin’s axial direction) were given the atmospheric pressure . In actual applications, more unit cells may be considered in x-direction (or pin’s axial direction), although this may significantly reduce the computational efficiency.
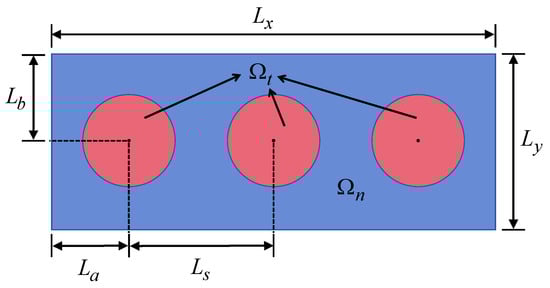
Figure 8.
Optimization of geometric parameters of surface texture (illustrated by an example of spherical cap texture).
In Figure 8, and represent the textured and untextured regions, respectively. The distance between two unit cells can be expressed as
where denotes the number of unit cells in the x-direction and is the length of the whole modeled region in the x-direction. Location of the left unit cell can thus be described using two distances, and , as
where is the length of the whole modeled region in the y-direction.
The center of each unit cell is
where denotes the -th texture in the -direction.
To optimize the geometric parameters, such as and , for the spherical texture (see Figure 3), a series of different values was defined for the geometric parameters and the corresponding numerical simulations were conducted using the lubrication model detailed in Section 2.1. The optimal geometric parameters could then be found using the AHP introduced in Section 2.3. A detailed flowchart is depicted in Figure 9.
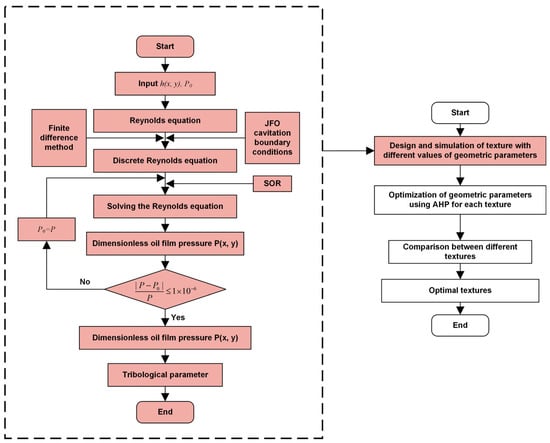
Figure 9.
Flowchart of parametric optimization of surface textures.
4. Parametric Optimization of Surface Textures: Results and Discussion
4.1. Convergence of Numerical Simulation Results
To conduct the parametric optimization of surface textures, the convergence of numerical simulation results needs to be verified. To this end, a unit cell of the spherical cap texture was modeled (see Figure 10) and discretized using different numbers of grid nodes (from 50 to 350 nodes along the edge). All the boundaries of the modeled region were prescribed with periodic boundary conditions. By solving the Reynolds equation detailed in Section 2.1, the oil film pressure can be obtained and the three tribological parameters (i.e., load bearing capacity, friction and friction coefficient) can be calculated, as shown in Figure 11. The lubricant used in this study is a specific gearbox oil with excellent anti-wear properties and oxidation stability, and its density and viscosity are about 0.94 g/mm3 and 0.4 Pa∙s, respectively. The values of the other parameters needed in the Reynolds equation are listed in Table 2.
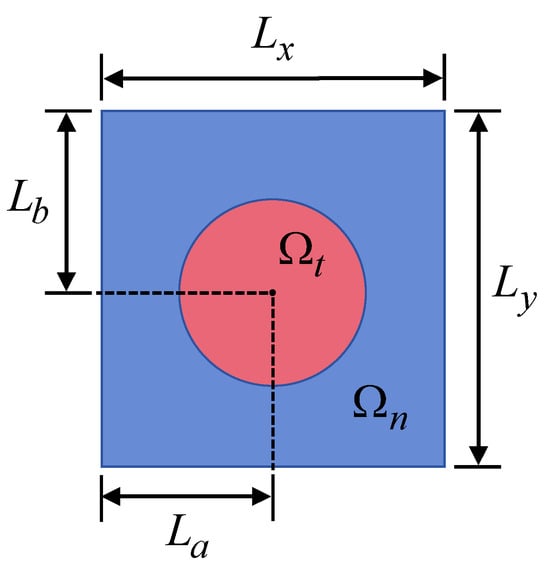
Figure 10.
A unit cell model of spherical cap texture to validate convergence of numerical simulations.
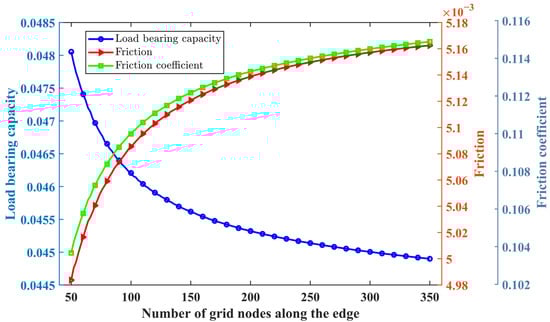
Figure 11.
Convergence of numerical results with grid nodes number.
Table 2.
Values of parameters needed for numerical simulations.
Figure 11 shows a clear convergence of the results, i.e., when the edge node number is more than 200, the change of the three results becomes negligible, indicating that the numerical results are trustable. Hence, this edge node number was adopted for all the following numerical simulations.
4.2. Optimization of Geometric Parameters
In this work, the width and length of the modeled region (see Figure 8) were set to be and , respectively. The relative velocity and clearance between the two surfaces, as well as the lubricant viscosity η0, assume the same values in Table 2.
The geometric parameters of each texture are presented in Table 3. For the spherical cap texture, five values were tried for each geometric parameter, leading to 25 numerical simulations. For textures with more geometric parameters, more numerical simulations are needed in general. In this work, 625 numerical simulations were conducted for the ellipsoidal cap texture, simulations for the tree-frog texture, for the grass-lip texture and 30 for the nepenthes texture (see details in Table 3). It may be noted that due to the geometric complexity of the grass-lip texture and nepenthes texture, only some of their geometric parameters were varied. One can also conduct a large number of numerical simulations to vary all the geometric parameters of these two textures and then optimize all the parameters using AHP.
Table 3.
Texture geometric parameters.
4.2.1. Effects of Geometric Parameters on Tribological Performance
After conducting all the numerical simulations, the tribological performance of the valve using different textures can be evaluated using the three parameters, i.e., load bearing capacity, friction and friction coefficient, defined in Section 2.2. For instance, Figure 12 depicts the effects of the two geometric parameters and of the spherical cap texture on the tribological performance. It shows that when the cap base radius is constant, the load bearing capacity increases with the cap depth , while the friction and friction coefficient decrease with . When the texture depth is constant, the load bearing capacity increases with the cap base radius , and the friction and friction coefficient decrease with . This indicates that and are the optimal dimensions among the pre-defined values of the two geometric parameters.
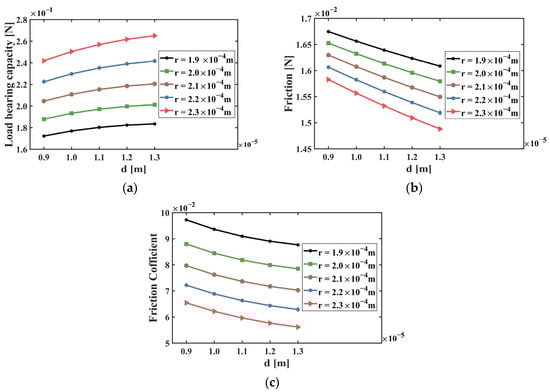
Figure 12.
Effects of the geometric parameters and of spherical cap texture on the tribological performance: (a) load bearing capacity; (b) friction; (c) friction coefficient.
Figure 12 also shows that the absolute gradient of the three tribological parameters decreases with the texture depth , implying that there may be an optimal value of larger than 13 . To this end, 27 more simulations were conducted using different values of the texture depth in the range of (see the last part of Table 4), while . The simulation results are depicted in Figure 13, in which the peak load bearing capability was observed at , the minimum friction coefficient was found at , while the friction gradually decreased with . A similar trend was also observed for the texture radius in the range of to . However, due to the limited size of the texture model (see Figure 8), the distance between boundaries of two adjacent textures will be too small, making the texture not manufacturable if the r value increases beyond , which is thus not considered in this work. Hence, the optimal values of the geometric parameters vary significantly, depending on which tribological parameter is considered. This is the main reason why the AHP method was introduced in this work to define a coupled tribological parameter. The parametric optimization of the five textures using AHP is detailed below.
Table 4.
Values of tribological parameters corresponding to different values of geometric parameters for the spherical texture.

Figure 13.
Effects of the spherical cap depth in range on the tribological performance: (a) load bearing capacity; (b) friction; (c) friction coefficient. The cap base radius .
4.2.2. Optimal Results of Geometric Parameters
For readers’ convenience of understanding, the parametric optimization of the spherical cap texture is detailed as follows:
As discussed above, 52 simulations were conducted for this type of texture. The values of the geometric parameters for these simulations are listed in Table 4, together with the load bearing capacity , friction and friction coefficient derived from the simulation results based on Equations (11)–(13). Following the AHP method introduced in Section 2.3, normalized vectors of the three tribological parameters, i.e., , and , could then be obtained to compute the coupled tribological parameter , and their values are also listed in Table 4. This table is divided into two modules. The first module consists of results for the 25 parametric designs generated in Table 3 for spherical cap, and the second module includes the results for the 27 parametric designs generated by expanding the value range of d. Consequently, the optimal values of the geometric parameters can be determined by finding the maximum value of .
The optimal values of the geometric parameters for all the five textures can be obtained similarly, and they are listed in Table 5, together with their tribological parameters.
Table 5.
Optimal values of geometric parameters for the five textures and values of the corresponding tribological parameters.
Figure 14 shows the oil film pressure of the five textures, with the optimal values of their geometric parameters. It clearly shows similar pressure profiles and peak values for the spherical cap, ellipsoidal cap and tree-frog textures, implying that the tribological performances of these three textures with optimized geometric parameters are similar to one another. The grass-lip and nepenthes textures result in a much smaller oil film pressure, and thus have a much lower load bearing capacity.
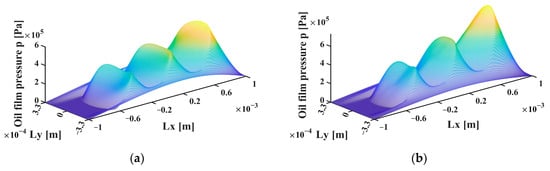
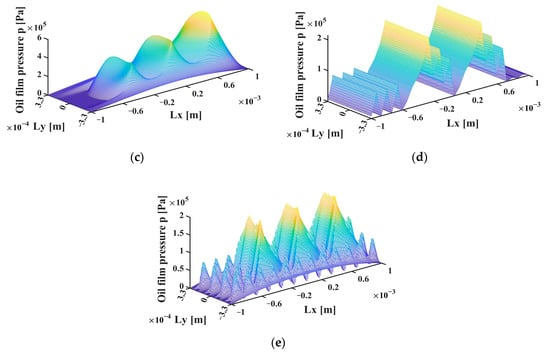
Figure 14.
Oil film pressure of the five textures with optimal values of their geometric parameters: (a) spherical cap; (b) ellipsoidal cap; (c) tree-frog; (d) grass-lip; (e) nepenthes.
4.2.3. Comparison of Tribological Performances Between Different Textures
It should be noted that the optimization of geometric parameters in Section 4.2.2 aims at finding the optimal results for one type of surface texture, while the values of the coupled tribological parameter (such as those in Table 4) for one type of surface texture cannot be used for comparison to another type of texture. To compare the tribological performances of the five surface textures, one can simply start from the textures with optimal values of the geometric parameters listed in Table 5 and use the AHP detailed in Section 2.3, whereby the vectors , and correspond to the last three columns in Table 5, respectively. Next, the coupled tribological parameters could be obtained using Equations (24)–(26), and they are listed in Table 6.
Table 6.
Coupled tribological parameter for comparison of tribological performances between different textures.
Table 6 shows the coupled tribological parameters for different textures, including both conventional textures (spherical cap and ellipsoidal cap) and biomimetic textures (tree-frog, grass-lip, and nepenthes). It indicates that the grass-lip texture is the most favorable texture for the aircraft valve considered in this work. This is because this texture exhibits a very small friction and friction coefficient, although its load bearing capacity is smaller than those of the spherical cap and ellipsoidal cap textures, while the friction and friction coefficient were prescribed with higher degrees of importance compared to the load bearing capacity (see Section 2.3). The nepenthes texture has the lowest value for the coupled tribological parameter , indicating that this texture is not a good choice for aircraft valves. For applications requiring a large load bearing capacity, the ellipsoidal cap texture may also be promising because of its high load bearing capacity and low friction and friction coefficient (see Table 5). The tree-frog may not be favorable due to its high friction and friction coefficient, although its load bearing capacity is the highest (see Table 5). A comparison between the conventional and biomimetic textures indicates that only proper biomimetic designs, such as the grass-lip texture, can lead to a favorable coupled tribological performance. A parametrically optimized conventional texture, such as the ellipsoidal cap, can also exhibit very good tribological performance, which is even better than those of some biomimetic textures. Hence, for surface texture design, parametric optimization is as important as the geometry (or shape) design.
It should be noted that users can vary the degree of importance for different parameters depending on the needs of their applications, and the final optimal results may also differ.
5. Conclusions
To improve the tribological performance of oil-lubricated long-life aircraft valves, five surface textures, namely, spherical cap, ellipsoidal cap, tree-frog, grass-lip,= and nepenthes, were introduced to the pin’s surface. Three classical tribological parameters, load bearing capacity, friction and friction coefficient, were obtained by solving the Reynolds equation based on the JFO cavitation boundary condition. Via using AHP, a coupled tribological parameter was defined to conduct parametric optimization of the five surface textures. The final optimization results indicate a ranking of grass-lip, ellipsoidal cap, tree-frog, spherical cap and nepenthes textures, from high to low tribological performance. This implies that for texture design, parametric optimization is as important as selecting a good geometry or shape. The AHP-based parametric optimization method proposed in this study can be widely used for surface textures in various applications, including bearings, shafts, gears and so on. It should also be noted that the degree of importance of tribological parameters in AHP is determined based on the demands of applications, and thus varies depending on the users and the problems studied.
Author Contributions
Conceptualization, P.L., Q.P. and Z.L.; methodology, P.L.; software, P.L. and Q.P.; validation, P.L., Q.P. and Z.L.; formal analysis, Q.P. and Z.L.; investigation, Q.P. and Z.L.; resources, P.L., S.L., L.Z., J.L. and L.C.; data curation, Q.P. and Z.L.; writing—original draft preparation, Q.P. and Z.L.; writing—review and editing, P.L.; visualization, Q.P. and Z.L.; supervision, P.L., J.L. and L.C.; project administration, P.L., S.L. and L.Z.; funding acquisition, P.L., S.L. and L.Z. All authors have read and agreed to the published version of the manuscript.
Funding
This research was funded by National Key Research and Development Program of China (2022YFB4601700).
Data Availability Statement
The raw data supporting the conclusions of this article will be made available by the authors on request.
Conflicts of Interest
The authors declare no conflicts of interest.
References
- Zhang, H.; Liu, Y.; Wang, W.; Qin, L.; Dong, G. Surface texture design and its tribological application. J. Mech. Eng. 2019, 55, 85–93. [Google Scholar]
- Khatri, C.B.; Sharma, S.C. Influence of textured surface on the performance of non-recessed hybrid journal bearing operating with non-Newtonian lubricant. Tribol. Int. 2016, 95, 221–235. [Google Scholar] [CrossRef]
- Costa, H.; Hutchings, I. Hydrodynamic lubrication of textured steel surfaces under reciprocating sliding conditions. Tribol. Int. 2007, 40, 1227–1238. [Google Scholar] [CrossRef]
- Greiner, C.; Merz, T.; Braun, D.; Codrignani, A.; Magagnato, F. Optimum dimple diameter for friction reduction with laser surface texturing: The effect of velocity gradient. Surf. Topogr. Metrol. Prop. 2015, 3, 044001. [Google Scholar] [CrossRef]
- Vrbka, M.; Šamánek, O.; Šperka, P.; Navrat, T.; Křupka, I.; Hartl, M. Effect of surface texturing on rolling contact fatigue within mixed lubricated non-conformal rolling/sliding contacts. Tribol. Int. 2010, 43, 1457–1465. [Google Scholar] [CrossRef]
- Tang, W.; Zhou, Y.; Zhu, H.; Yang, H. The effect of surface texturing on reducing the friction and wear of steel under lubricated sliding contact. Appl. Surf. Sci. 2013, 273, 199–204. [Google Scholar] [CrossRef]
- Sung, I.-H.; Lee, H.-S.; Kim, D.-E. Effect of surface topography on the frictional behavior at the micro/nano-scale. Wear 2003, 254, 1019–1031. [Google Scholar] [CrossRef]
- Qiu, Y.; Khonsari, M. Experimental investigation of tribological performance of laser textured stainless steel rings. Tribol. Int. 2011, 44, 635–644. [Google Scholar] [CrossRef]
- Ronen, A.; Etsion, I.; Kligerman, Y. Friction-reducing surface-texturing in reciprocating automotive components. Tribol. Trans. 2001, 44, 359–366. [Google Scholar] [CrossRef]
- Lu, P.; Wood, R.J.; Gee, M.G.; Wang, L.; Pfleging, W. The friction reducing effect of square-shaped surface textures under lubricated line-contacts—An experimental study. Lubricants 2016, 4, 26. [Google Scholar] [CrossRef]
- Gachot, C.; Rosenkranz, A.; Hsu, S.; Costa, H. A critical assessment of surface texturing for friction and wear improvement. Wear 2017, 372, 21–41. [Google Scholar] [CrossRef]
- Gropper, D.; Wang, L.; Harvey, T.J. Hydrodynamic lubrication of textured surfaces: A review of modeling techniques and key findings. Tribol. Int. 2016, 94, 509–529. [Google Scholar] [CrossRef]
- Wang, T.; Huang, W.; Liu, X.; Li, Y.; Wang, Y. Experimental study of two-phase mechanical face seals with laser surface texturing. Tribol. Int. 2014, 72, 90–97. [Google Scholar] [CrossRef]
- Kovalchenko, A.; Ajayi, O.; Erdemir, A.; Fenske, G.; Etsion, I. The effect of laser texturing of steel surfaces and speed-load parameters on the transition of lubrication regime from boundary to hydrodynamic. Tribol. Trans. 2004, 47, 299–307. [Google Scholar] [CrossRef]
- Pettersson, U.; Jacobson, S. Influence of surface texture on boundary lubricated sliding contacts. Tribol. Int. 2003, 36, 857–864. [Google Scholar] [CrossRef]
- Ryk, G.; Etsion, I. Testing piston rings with partial laser surface texturing for friction reduction. Wear 2006, 261, 792–796. [Google Scholar] [CrossRef]
- Wang, Z.; Hu, S.; Zhang, H.; Ji, H.; Yang, J.; Liang, W. Effect of surface texturing parameters on the lubrication characteristics of an axial piston pump valve plate. Lubricants 2018, 6, 49. [Google Scholar] [CrossRef]
- Qiu, M.; Delic, A.; Raeymaekers, B. The effect of texture shape on the load-carrying capacity of gas-lubricated parallel slider bearings. Tribol. Lett. 2012, 48, 315–327. [Google Scholar] [CrossRef]
- Yu, H.; Wang, X.; Zhou, F. Geometric shape effects of surface texture on the generation of hydrodynamic pressure between conformal contacting surfaces. Tribol. Lett. 2010, 37, 123–130. [Google Scholar] [CrossRef]
- Shen, C.; Khonsari, M. Numerical optimization of texture shape for parallel surfaces under unidirectional and bidirectional sliding. Tribol. Int. 2015, 82, 1–11. [Google Scholar] [CrossRef]
- Papadopoulos, C.; Efstathiou, E.; Nikolakopoulos, P.; Kaiktsis, L. Geometry optimization of textured three-dimensional micro-thrust bearings. J. Tribol. Oct 2011, 133, 041702. [Google Scholar] [CrossRef]
- Zhang, H.; Dong, G.-N.; Hua, M.; Chin, K.-S. Improvement of tribological behaviors by optimizing concave texture shape under reciprocating sliding motion. J. Tribol. 2017, 139, 011701. [Google Scholar] [CrossRef]
- Shen, C.; Khonsari, M. Texture shape optimization for seal-like parallel surfaces: Theory and experiment. Tribol. Trans. 2016, 59, 698–706. [Google Scholar] [CrossRef]
- Chen, C.; Liu, C.; Li, Y.; Mou, S. Geometry optimization for asymmetrical herringbone grooves of miniature hydrodynamic journal bearings by using Taguchi technique. Proc. Inst. Mech. Eng. Part J J. Eng. Tribol. 2015, 229, 196–206. [Google Scholar] [CrossRef]
- Wang, W.; He, Y.; Zhao, J.; Mao, J.; Hu, Y.; Luo, J. Optimization of groove texture profile to improve hydrodynamic lubrication performance: Theory and experiments. Friction 2020, 8, 83–94. [Google Scholar] [CrossRef]
- Huang, Q.; Shi, X.; Xue, Y.; Zhang, K.; Wu, C. Assessment and Optimization of Tribological Parameters for Bionic Textured AISI 4140-SnAgCu Self-Lubricating Composite Under Dry Sliding Conditions Using AHP and RSM. Tribol. Trans. 2022, 65, 479–491. [Google Scholar] [CrossRef]
- Sloane, E.B.; Liberatore, M.J.; Nydick, R.L.; Luo, W.; Chung, Q. Using the analytic hierarchy process as a clinical engineering tool to facilitate an iterative, multidisciplinary, microeconomic health technology assessment. Comput. Oper. Res. 2003, 30, 1447–1465. [Google Scholar] [CrossRef]
- Chatburn, R.L.; Primiano Jr, F.P. Decision analysis for large capital purchases: How to buy a ventilator. Respir. Care 2001, 46, 1038–1053. [Google Scholar]
- Turri, J. Program eases decision making. Health Prog. 1988, 69, 40–44. [Google Scholar]
- Kaplan, B.; Shaw, N. Future directions in evaluation research: People, organizational, and social issues. Methods Inf. Med. 2004, 43, 215–231. [Google Scholar]
- Xu, J.; Zhang, G.; Fan, S.; Ni, J.; Lian, J. Research on the Controllable Interface Response Enhancement of the Textured Pilot Valve. Machines 2022, 10, 357. [Google Scholar] [CrossRef]
- Tao, H.; Cao-feng, Y.; Chuan-li, W.; Hai-shun, D.; Hui, Z. Analyzing hydrodynamic bearing capacity and lubrication charac-teristics of micro-texture valve core friction pair. Mech. Sci. Technol. Aerosp. Eng. 2016, 35, 1829–1833. [Google Scholar]
- Chen, X.; Zeng, L.; Zheng, F. Friction performance and optimisation of diamond-like texture on hydraulic cylinder surface. Micro Nano Lett. 2018, 13, 1001–1006. [Google Scholar] [CrossRef]
- Wang, C.; Zhou, D.; He, T.; Hao, F.; MA, D.; Yang, L. Interactive Test Analysis of Dynamic Pressure Bearing Force for Valve Core Texturing. Chin. Hydraul. Pneum. 2019, 3, 8–13. [Google Scholar]
- Syed, N.R.; Kakoty, S.K. Influence of spherical protruded and dimple texture on the journal bearing performance: A comparative theoretical analysis implementing JFO boundary conditions. Ind. Lubr. Tribol. 2022, 74, 788–795. [Google Scholar] [CrossRef]
- Wang, L.; Wang, W.; Wang, H.; Ma, T.; Hu, Y. Numerical analysis on the factors affecting the hydrodynamic performance for the parallel surfaces with microtextures. J. Tribol. 2014, 136, 021702. [Google Scholar] [CrossRef]
- Zhang, K.; Yagi, K. Refined Hydrodynamic Lubrication Model with a High-Accuracy Numerical Algorithm for Starved Lubrication with Free Surfaces. Tribol. Lett. 2023, 71, 122. [Google Scholar] [CrossRef]
- Wen, S.; Huang, P. Principles of Tribology; John Wiley & Sons: Hoboken, NJ, USA, 2012. [Google Scholar]
- Wang, W.; He, Y.; Zhao, J.; Li, Y.; Luo, J. Numerical optimization of the groove texture bottom profile for thrust bearings. Tribol. Int. 2017, 109, 69–77. [Google Scholar] [CrossRef]
- Gherca, A.; Maspeyrot, P.; Hajjam, M.; Fatu, A. Influence of texture geometry on the hydrodynamic performances of parallel bearings. Tribol. Trans. 2013, 56, 321–332. [Google Scholar] [CrossRef]
- Uddin, M.; Ibatan, T.; Shankar, S. Influence of surface texture shape, geometry and orientation on hydrodynamic lubrication performance of plane-to-plane slider surfaces. Lubr. Sci. 2017, 29, 153–181. [Google Scholar] [CrossRef]
- Ünlü, B.S.; Atik, E. Determination of friction coefficient in journal bearings. Mater. Des. 2007, 28, 973–977. [Google Scholar] [CrossRef]
- Yang, S.; Wang, H.; Zhang, Y.; Zhang, L. Cutting performance evaluation of surface micro-texture ball end milling based on multi-objective decision making. J. Harbin Univ. Sci. Technol. 2016, 21, 1–5. [Google Scholar]
- Franek, J.; Kresta, A. Judgment Scales and Consistency Measure in AHP. Procedia Econ. Financ. 2014, 12, 164–173. [Google Scholar] [CrossRef]
- He, T.; Wang, C.L.; Deng, H.S.; Huang, Y.L.; Yu, C.F. Hydrodynamic Lubrication and Load Carrying Capacity Analysis of Laser Surface Texturing Valve Core. Key Eng. Mater. 2016, 693, 348–355. [Google Scholar] [CrossRef]
Disclaimer/Publisher’s Note: The statements, opinions and data contained in all publications are solely those of the individual author(s) and contributor(s) and not of MDPI and/or the editor(s). MDPI and/or the editor(s) disclaim responsibility for any injury to people or property resulting from any ideas, methods, instructions or products referred to in the content. |
© 2024 by the authors. Licensee MDPI, Basel, Switzerland. This article is an open access article distributed under the terms and conditions of the Creative Commons Attribution (CC BY) license (https://creativecommons.org/licenses/by/4.0/).