Abstract
To enhance the service life of shipping equipment and minimize surface wear, this study employs biomimetic principles, integrating fitted structures with jet dynamics to model three configurations: non-smooth structures, single jet structures, and non-smooth jet-coupled structures. We utilized the SST k-ω turbulence model for numerical simulations to investigate the drag reduction characteristics of these structural models. By varying the jet angle and speed, we analyzed the changes in viscous resistance, pressure differential resistance, and drag reduction rates at the wall surface. Furthermore, the mechanisms of compressive stress, velocity fields, vortex structures, and shear stress on drag-reducing surfaces were elucidated, revealing how these factors contribute to drag reduction in non-smooth jet-coupled structures. The results indicate that the non-smooth jet-coupled structure exhibits superior drag reduction performance at a main flow field velocity of 20 m/s. As the jet velocity increases, the viscous drag on the surface of the non-smooth jet-coupled structure decreases, while the pressure differential drag increases. Conversely, variations in the jet angle have a minimal effect on viscous drag but lead to a reduction in pressure differential drag. Specifically, when the jet velocity is set at 1 m/s, and the jet angle is 60°, the drag reduction achieved by the non-smooth jet-coupled structure peaks at 7.48%. Additionally, the non-smooth jet-coupled structure features a larger area characterized by low shear stress, along with an increased boundary layer thickness at the bottom; this configuration effectively reduces surface velocity and consequent viscous drag.
1. Introduction
In the dual-carbon context of shipping, energy loss, and surface wear due to frictional resistance are particularly serious in ships, craft, and submarines, which are significant means of transportation in the sea. Therefore, developments in drag reduction technology research are of great significance in enhancing shipping efficiency [1], extend the service life of marine equipment [2], reduce surface loss [3], and contribute to the achievement of energy efficiency and emission reduction goals.
The current mainstream drag reduction technologies are anti-fouling coating drag reduction, bionic non-smooth surface drag reduction, superhydrophobic drag reduction, and underwater jet drag reduction. Anti-fouling coatings for drag reduction [4] are mainly used to chemically obtain an anti-fouling coating agent and penetrate the ocean to prevent marine microorganisms from adhering to the surface, or to form a thin film to protect the surface of an object; water-resistant coatings are typical representatives [5]. The effect of bionic non-smooth surface drag reduction [6,7,8] is achieved by using some microstructures to control the turbulence structure within the boundary layer, especially the proposed order structure, to achieve the control of turbulence kinetic energy loss and ultimately achieve drag reduction. The most characteristic of microstructural drag reduction is the skin of sharks [9,10]. The superhydrophobic drag reduction [11] effect is achieved by using hydrophobic surfaces to reduce the fluid boundary velocity gradient, reduce shear stresses, delay the flow transition at the laminar attachment surface, increase the thickness of the laminar boundary layer, and form a shear-free fluid interface to achieve the drag reduction effect. A representative one is the self-cleaning effect of lotus leaves [12,13]. Underwater jet drag reduction technology [14,15] is a type of active control drag reduction technology; its drag reduction effect is achieved by spraying fluid medium on the surface of the object to achieve the control of the wall boundary layer and then form a method to reduce the drag. With the in-depth development of drag reduction technology, coupling different drag reduction technologies to achieve synergistic drag reduction [16,17] is the future development trend. Non-smooth surface drag reduction technology has been extensively employed in aerospace, ship design, and other fields due to simple processing and excellent drag reduction effect [18,19,20]. The effectiveness of the jet surface in reducing drag is evident [21], and active control can be achieved, which is also promising for diverse applications in the fields of aerospace and fluid mechanics.
To investigate the significance of the interaction between non-smooth structures and jet configurations on the drag reduction characteristics of the object’s surface, a non-smooth jet-coupled structure model has been developed. This model integrates jet drag reduction technology with findings from studies on the drag reduction of flat surface-fitting structures. By comparing it to a single jet model, this work examines and analyzes the resistance performance of the non-smooth jet-coupled structure across different jet structure parameters. This approach aims to elucidate the impact of various structural parameters on the drag reduction performance of the non-smooth jet-coupled model, thereby providing novel insights and a theoretical foundation for the design of surface drag reduction structures and internal flow components in maritime vehicles.
2. Modeling and Numerical Simulation of Non-Smooth Jet Coupling Structure
2.1. Structural Model and Numerical Calculation Model
For the results of drag reduction of the fitted structure on the surface of the flat plate, the fitted structure with a width of 30 mm and a depth of 0.7 mm demonstrated excellent drag reduction [22]. Therefore, this fitting structure was selected on the surface of the flat plate, and its arrangement position is shown in Figure 1. The jet outlet will be affected by the flow field environment, so the spreading width was selected as Y = 20 mm. Meanwhile, considering that the jet structure will be affected by the upper wall surface, the height of Z = 40 mm was selected. The arrangement area of the fitted structure was a rectangular plane intercepted on a flat plate with a length of l = 90 mm, and the layout was located at a distance of d1 = 15 mm from the inlet of the basin and d2 = 15 mm from the outlet. Rectangular jet holes were selected. Taking into account the stability of the jet and the effect of turbulence at the inlet, the rectangular jet holes were arranged at a distance of 12 mm from the velocity inlet, with a length a of 10 mm and a width b of 2 mm, and the rectangular jet holes were arranged at a distance of 15 mm from the velocity inlet. The distance r from the front of the non-smooth structure was set at 1 mm, the coordinate origin was located at the midpoint of the top of the bottom surface, the jet velocity v was perpendicular to the rectangular jet surface, and the angle of the jet a was the angle between the centerline of the rectangular jet hole and the middle plumb line, which was arranged at the front of the flat surface.

Figure 1.
Schematic diagram of non-smooth jet coupling structure model.
In the numerical simulation process, the medium in the fluid domain of the flat plate was water; the physical parameters of the water are listed in Table 1 below. When the Reynolds number reached 5 × 10⁵, the flow model of the flat plate surface in the rectangular pipe was turbulent flow. The formula for calculating the Reynolds number is as follows:
where U is the incoming velocity, m/s, and L is the characteristic length, m.

Table 1.
Physical parameters of water.
Since the ship’s sailing speed, in reality, was 12~16 m/s, when the minimum value of incoming velocity was taken as 12 m/s, it could be known through the Reynolds number calculation that the length of the computational domain flow direction had to be at least 50 mm or more to achieve the turbulent flow. At the same time, due to the existence of the fitted structure, the length of the computational domain flow direction was taken to be 120 mm in the modeling process.
Since the conventional k-epsilon model using wall function cannot simulate the boundary layer viscous substrate and transition layer, and the method of numerical simulation requires high computational accuracy of the boundary layer, the SST k-ω model based on Reynolds averaging method was taken as the choice of numerical simulation of the wall resistance in this study.
2.2. Numerical Simulation Equations
- (1)
- Governing equation
During computer simulations, water was reduced to an incompressible fluid. In this case, the density of the fluid could be considered as a constant throughout the fluid region as well as during the flow. Therefore, the governing equations used in this paper are the incompressible Navier–Stokes equations [23,24].
where u is the velocity direction vector.
The momentum conservation equation is as follows:
where p is the static pressure, Pa, and vx, vy, and vz represent the velocity in the x, y, and z directions, m/s, respectively.
- (2)
- Turbulence equation
The appropriate selection of turbulence equations is critical for numerical simulations, as a suitable turbulence model can significantly enhance computational accuracy while reducing simulation time. Among the available models, the Shear Stress Transport SST k-ω model is recognized for its broad applicability and effectiveness in addressing challenges such as counter-gradient pressure flows and airfoil flows. In the context of near-wall flow studies, the SST k-ω model demonstrates commendable accuracy and stability, particularly in predicting issues related to near-wall rounding, where it offers distinct advantages.
Consequently, this paper adopted the SST k-ω model as the numerical framework for analyzing wall frictional resistance [24,25]. Under no-buoyancy conditions, the transport equations for the turbulent kinetic energy (k) and the specific dissipation rate (ω) are given as follows [24,25]:
where k is the turbulent energy, m2/s−2, Pk is the turbulence generation rate, ω is the specific dissipation rate, σk is a constant, 0.85, σω1 is a constant, 0.5, σω2 is a constant, 0.856, and F1 is the mixing function.
2.3. Mesh Division and Boundary Condition Setting
Gridding is the key to the accuracy of numerical simulation calculations. For the near-wall resistance problem, the SST k-ω model was used to solve the problem. The minimum node spacing and nodes determine the grid quality, and grid quality determines the accuracy of numerical simulation calculations. So, the height of the first mesh layer is typically determined using the value of y+, with a general requirement that y+ should be less than 3 [22]. When y+ is below 3, the height of the first mesh layer can be estimated. Here, L represents the characteristic length of the feature in meters. The formula for Δy this is as follows:
The initial mesh layer’s height near the wall was strictly controlled to be 0.004 mm, and the mesh growth rate was 1.1 [22]. In addition, transverse encryption was applied to the non-smooth structure region, while local mesh encryption was applied near the rectangular jet hole, as shown in Figure 2. The inlet of the jet surface was configured with a velocity inlet condition, while the exit at the right end of the computational domain employed a mass outflow boundary condition. The upper wall of the computational domain, as well as the smooth flat plate surface, non-smooth structural surface, single jet structure surface, non-smooth jet-coupled structure surface, and the walls surrounding the jet aperture structure, were all designated with no-slip wall boundary conditions. Additionally, the left and right side walls were set as symmetry walls; the convergence residual was set to 10−6 [25].

Figure 2.
Schematic diagram of the model meshing. (a) General gridding; (b) Local meshing of jet holes.
Considering that the jet requires energy input, the jet velocity is too large for energy saving, so the jet parameters were initially selected to be 1 m/s, and the jet angle a was 0°. Considering that the sailing speed of the ship was 12~20 m/s, the main field velocities were selected to be 12 m/s, 16 m/s, and 20 m/s. In the following, a comparative analysis is conducted on the drag reduction effect of the non-smooth structure, the single jet structure, and the non-smooth jet coupled structure surface at the three main field velocities, respectively. In the subsequent analysis, the drag reduction effects on the surfaces of non-smooth structures, single jet structures, and non-smooth jet-coupled structures are compared at three primary flow velocities. For a main flow velocity of 20 m/s, a non-smooth jet-coupled structure with a jet velocity of 2.5 m/s and an angle of α = 0° was selected for a detailed examination of compressive stress, velocity fields, vortex structures, and wall shear stress, in comparison with other structural configurations. Meanwhile, to investigate the impact of various jet characteristics on the effect of drag reduction, the jet velocity v = 0.5 m/s, 1 m/s, 1.5 m/s, 2 m/s, and 2.5 m/s and the jet angle α = 0°, 15°, 30°, 45°, and 60° were set to conduct coupled numerical simulation analyses of various jet parameter structural models to look into the process of drag reduction of the non-smooth jet-coupled structural surfaces.
2.4. Wall Resistance, Calculation of Drag Reduction Rate, and Validation of Experimental Data
The total wall resistance consists of two components: viscous resistance and differential pressure resistance. The formula for calculating the viscous resistance [22] is as follows:
where f is the viscous resistance, N, τi is the discrete cell shear stress, N, and Ai is the discrete cell area of the wall, m2.
The differential pressure resistance [22] is formulated as follows:
where f* is the differential pressure resistance, N, σi is the discrete cell compressive stress, N, and is the projected area of the trench surface along the main flow field, m2.
The total wall resistance F includes viscous resistance f and differential pressure resistance f* and is formulated [22] as follows:
The damping rate λ is defined and formulated as follows:
where F1 is the total resistance of the smooth, flat surface, and F2 is the surface resistance of the non-smooth jet coupling structure.
In the Intelligent Manufacturing Laboratory at Harbin Engineering University, an experimental study was conducted to investigate the drag reduction characteristics of a rectangular jet orifice measuring 10 mm in length and 2 mm in width [26]. This study aimed to explore the variation in drag reduction as a function of different jet velocities, specifically under mainstream velocities ranging from 12 to 20 m/s. The dimensions of the rectangular jet orifice employed in this study were consistent with the experimental conditions [26]. Although the original experiment utilized a roller-like basin, this paper simplifies the configuration to a rectangular basin for the purposes of numerical simulation. The numerical simulations yield a variation in drag reduction that is in good agreement with the experimental results. The observed error in the drag reduction rate falls within a reasonable range, primarily due to the discrepancies between the simulated domain and the experimental setup, as well as potential numerical calculation errors. The comparison of the numerical simulation results with experimental data indicates that the error remains within acceptable limits, and the observed trends are analogous. The results of the comparison between the simulated and experimental values are plotted in Figure 3 below. These findings further validate the reliability of the numerical calculation methods employed in this study.

Figure 3.
Comparison of simulated and experimental values of jet-hole attenuation rate at three different flow velocities [26]. (a) 12 m/s; (b) 16 m/s; (c) 20 m/s.
3. Drag Reduction Effect of Non-Smooth Jet Coupling Structure
3.1. Comparative Analysis of Different Flow Rates
The comparative drag reduction effects of non-smooth structures, single jet structures, and non-smooth jet-coupled structures under the three main flow field velocities of 12 m/s, 16 m/s, and 20 m/s are presented in Figure 4. As depicted in Figure 4a, the drag reduction rate of the non-smooth structure remained relatively constant with increasing flow velocity, stabilizing at approximately 4%. The drag reduction rate of the single-jet structure tended to increase and then decrease as flow velocity increased, and the drag reduction rate of the non-smooth jet-coupled structure grew gradually as flow velocity increased. The viscous drag of different structures under three flow velocities is shown in Figure 4b, from which it can be observed that the viscous drag values of the three structures all increased gradually with the jet velocity, and the viscous drag value of the non-smooth jet coupling structure was always the smallest. The differential pressure resistance of different structures at three flow velocities is shown in Figure 4c, from which the findings indicate that the differential pressure resistance on the surfaces of the non-smooth structure and the non-smooth jet coupling structure gradually increased with the flow velocity, whereas that of the single-jet structure was close to 0. The non-smooth jet coupling structure had a better effect of reducing the resistance than that of the non-smooth structure and the single-jet structure at the main field flow velocity of 20 m/s because its viscous resistance decreased with the increase in differential pressure resistance. The difference between the reduction of viscous drag and the increase in differential pressure drag was larger than the difference between the remaining two. Meanwhile, the drag reduction mechanism of the non-smooth jet coupling structure was also investigated in the following section for a main field flow velocity of 20 m/s.

Figure 4.
Comparison of drag reduction effect at different flow rates. (a) Resistance reduction rate; (b) Viscous resistance; (c) Differential pressure resistance.
3.2. Comparative Analysis of Jet Angle and Velocity
Under a main flow field velocity of 20 m/s, the cloud diagrams of viscous drag (f) and pressure drag (f*) under varying jet angles and velocities are presented in Figure 5 and Figure 6. The analysis of these figures revealed that, regardless of the combination of jet angle and velocity, the viscous resistance on the surface of the non-smooth jet-coupled structure was consistently lower than that of the single jet structure, demonstrating the effectiveness of the non-smooth jet-coupled design in reducing wall surface viscous resistance.
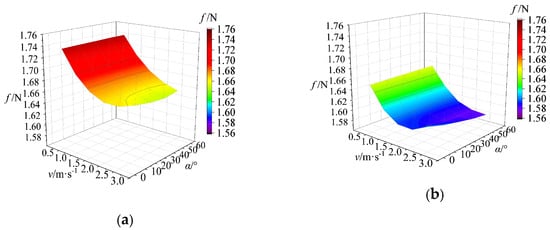
Figure 5.
Cloud diagram of viscous drag variation under jet angle and velocity coupling. (a) Single-jet structure; (b) Non-smooth jet coupling structure.
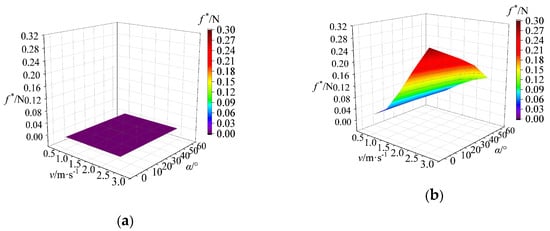
Figure 6.
Variation of differential pressure resistance under a jet angle and velocity coupling cloud diagram. (a) Single-jet structure; (b) Non-smooth jet coupling structure.
The differential pressure resistance on the surface of the single jet structure was on the order of 10−9, indicating that it had minimal impact on the overall resistance. Conversely, the differential pressure resistance of the non-smooth jet-coupled structure was directly proportional to the jet velocity. At higher velocities, it was observed that an increase in jet angle resulted in a reduction in differential pressure resistance, suggesting that optimizing jet angle can effectively enhance the drag reduction performance of the non-smooth jet-coupled structure.
In summary, while the viscous resistance of the non-smooth jet-coupled structure was lower than that of the single jet structure, its differential pressure resistance was comparatively higher. Therefore, enhancing the differential pressure resistance of its surface could further improve the overall drag reduction characteristics.
At a main flow field velocity of 20 m/s, the cloud diagram illustrating the drag reduction rate under varying jet angles and velocities is presented in Figure 7, with the drag reduction rate of the single jet structure serving as the control group. The results depicted in Figure 7 demonstrate that the single jet structure exhibited a drag reduction effect under the specified parameters, with drag reduction rates consistently increasing as jet velocity rises. These rates, however, showed minimal sensitivity to variations in the jet angle.
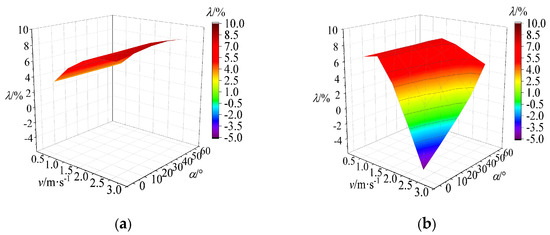
Figure 7.
Cloud diagram of drag reduction rate variation under jet angle and velocity coupling. (a) Single-jet structure; (b) Non-smooth jet coupling structure.
In contrast, the non-smooth jet-coupled structure exhibited a more complex relationship with jet velocity. Its drag reduction rate initially increased with rising jet velocity before subsequently decreasing, indicating a non-linear response. Additionally, at higher velocities, the drag reduction rate became significantly influenced by changes in the jet angle. Notably, when a jet velocity of v = 1 m/s was coupled with a jet angle of α = 60°, the non-smooth jet-coupled structure achieved a maximum drag reduction rate of 7.48%.
Overall, the drag reduction rate of the non-smooth jet-coupled structure exceeded that of the single jet structure at jet velocities of v = 0.5 m/s and 1 m/s across jet angles ranging from α = 0° to 60°.
4. Comparative Analysis of Flow Field Variation Characteristics of Non-Smooth Jet Coupled Structures
4.1. Characterization of Compressive Stress Variation
- (1)
- Effect of different structures on compressive stresses
In the analysis in Section 3, it is known that when the jet velocity is larger, the value of differential pressure resistance of the non-smooth jet coupling structure is significantly higher than that of the other two structures. Therefore, the non-smooth jet coupling structure with v = 2.5 m/s and α = 0° was selected for the compressive stress analysis to investigate the reason for the change of differential pressure resistance from the perspective of compressive stress. The parameters of the non-smooth structure and the single jet structure were set to match those of the non-smooth jet-coupled structure. Under a main flow field velocity of 20 m/s, the cloud diagrams illustrating the changes in compressive stress across different structures (extending to the center cross-section) are presented in Figure 8.
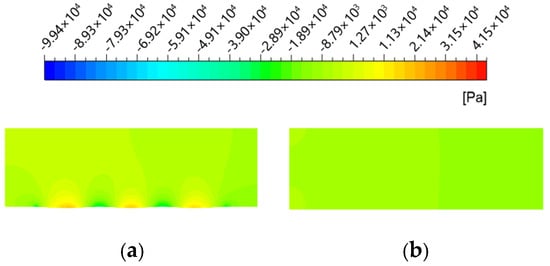

Figure 8.
Cloud diagram of compressive stress variation for different structures. (a) Non−smooth structures; (b) Smooth plate; (c) Non−smooth jet coupling structure; (d) Single−jet structures.
As depicted in Figure 8, the non-smooth jet-coupled structure and the single jet structure exhibited pronounced high-pressure and low-pressure regions near the front and back ends of the jet orifice, respectively. Notably, the gradient of compressive stress on the surface of the non-smooth jet-coupled structure exhibits a more gradual change compared to that of the non-smooth structure. The low-pressure stress region at the back end of the jet orifice in the non-smooth jet-coupled structure was similar to that observed in the non-smooth structure, especially when compared to the single jet structure.
Moreover, it is important to highlight that the stress region at the back end of the jet orifice on the non-smooth structure did not directly adjoin the high-pressure stress region at the depression of the non-smooth structure. This separation contributed to the excessive differential pressure resistance experienced by the non-smooth structure.
- (2)
- Effect of different jet speeds and angles on compressive stresses
Under a main flow field velocity of 20 m/s, the comparative cloud diagrams illustrating the compressive stress near the rear end of the jet orifice at different jet velocities and angles are presented in Figure 9. The left column corresponds to the non-smooth jet-coupled structure, while the right column represents the single jet structure.
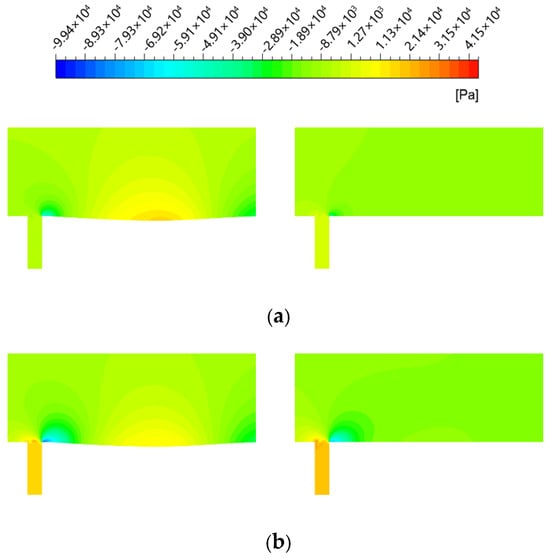
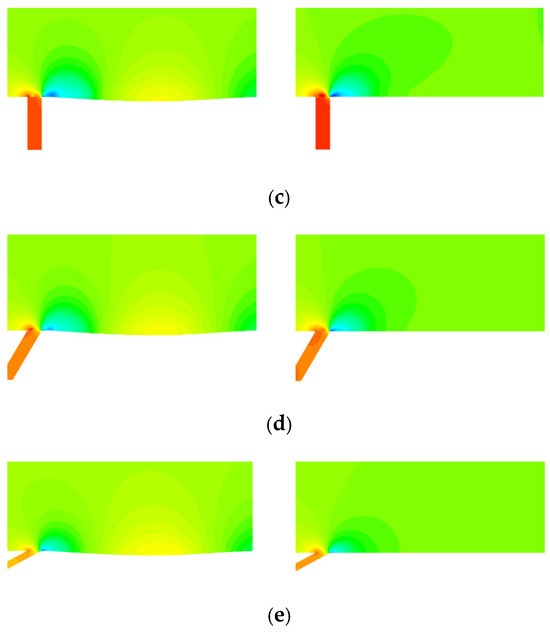
Figure 9.
Comparison of compressive stress near the back end of the jet hole for different jet velocities and angles cloud diagram. (a) v = 0.5 m/s, α = 0°; (b) v = 1.5 m/s, α = 0°; (c) v = 2.5 m/s, α = 0°; (d) v = 2.5 m/s, α = 30°; (e) v = 2.5 m/s, α = 60°.
From Figure 9a–c, it was evident that both structures exhibited a distinct high-pressure stress zone at the front end of the jet hole and a low-pressure stress zone at the rear end. As the jet velocity increased, the compressive stress value in the high-pressure zone gradually increased while the compressive stress value in the low-pressure zone decreased. This phenomenon contributed to the changes observed in the differential pressure resistance. Additionally, with the increase in jet velocity, the gradient of compressive stress within the non-smooth cells of the non-smooth jet-coupled structure tended to level off progressively.
From Figure 9c–e, it is observed that an increase in jet angle led to a reduction in the compressive stress gradient at both the front and rear ends of the jet orifices. However, the differential pressure resistance on the surface of the single jet structure remained nearly constant, indicating that the variation in the pressure stress gradient was not the primary factor influencing the changes in differential pressure resistance on its surface. Furthermore, it can be noted that as the jet angle increased, the average value of the low-pressure stress region increased while the average value of the high-pressure stress region decreased. This suggests that the decrease in the difference between these two values may be the primary cause of the reduction in differential pressure resistance observed with increasing jet angle.
4.2. Velocity Field Variation Characteristics
- (1)
- Effect of Different Structures on the Velocity Field
In the analysis presented in Section 3, it was observed that increased jet velocities result in significantly higher viscous drag for the non-smooth jet coupled structure compared to the other two structures. Therefore, to investigate the mechanism behind the reduction of viscous drag from a velocity field perspective, we selected the non-smooth jet-coupled structure at a velocity of v = 2.5 m/s and an angle α = 0°. The parameters for the non-smooth structure and the single jet structure were kept consistent with those of the non-smooth jet coupled structure.
Under a main flow field velocity of 20 m/s, we analyzed the velocity streamlines at the back end of the jet holes for both the non-smooth jet coupling structure (Figure 10a) and the single jet structure (Figure 10b). Observations from these figures revealed the formation of swirling low-velocity fluid at the rear of both jet orifices. This phenomenon is akin to a rolling bearing effect, where the swirling fluid elevates the high-velocity mainstream. Consequently, this interaction mitigates the down-sweeping impact of the high-velocity mainstream on the wall surface, ultimately leading to a reduction in the viscous resistance experienced by the wall.
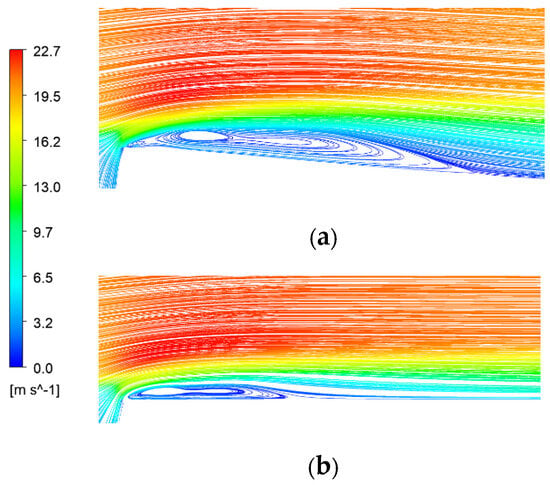
Figure 10.
Velocity streamlines at the back end of the injection hole. (a) Non-smooth jet coupling structure; (b) Single-jet structure.
Furthermore, the vortex generated at the rear of the non-smooth jet coupling structure was notably larger than that of the single jet structure, with the vortex center being displaced towards the rear end. The existence of the non-smooth structure promotes the downward development of the low-velocity fluid along its surface. This results in a reduced suppressive effect of the main flow velocity on the jet, which contrasts with the single jet structure. Consequently, the vortex generated by the non-smooth jet coupling structure was more pronounced, leading to an increase in boundary layer thickness and further diminishing the downward sweeping effect of the high-velocity mainstream on the wall.
Under a main flow field velocity of 20 m/s, the streamlines and velocity distribution diagrams of the flow cross-section at x = 30 mm are presented in Figure 11. The results illustrate that the boundary layer thickness on the surface of the non-smooth jet coupled structure was significantly greater than that of the single jet structure. This increase in boundary layer thickness resulted in lower velocities near the wall and a diminished velocity gradient, leading to a reduction in viscous drag. Analysis of the flow field streamlines indicated that the difference in velocity gradients contributed to pressure changes, thereby generating a vortex flow structure. Notably, the vortex near the wall of the non-smooth jet coupling structure was situated closer to the center, whereas the vortex in the single jet structure developed symmetrically on both sides. This variance in vortex configuration alters the strength of the incoming flow, subsequently influencing the viscous drag acting on the wall surface.
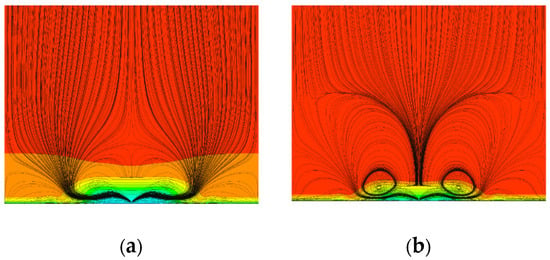
Figure 11.
Streamline and velocity cloud of the flow cross−section. (a) Non-smooth jet coupling structure; (b) Single-jet structure.
- (2)
- Effect of different jet speeds and angles on the velocity field
Under the condition of the main flow field velocity of 20 m/s, the velocity comparison cloud diagrams near the back end of the jet hole under different jet velocities and angles (spreading to the center cross-section) are shown in Figure 12, with the left column as a non-smooth jet coupling structure and the right column as a single jet structure.
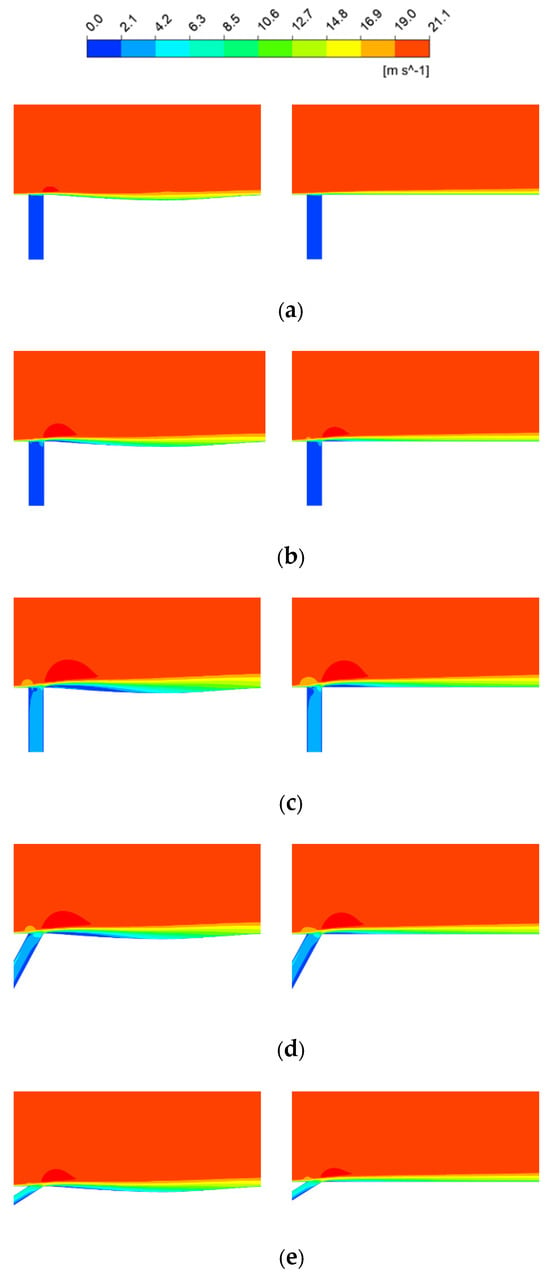
Figure 12.
Velocity comparison cloud near the back end of the jet hole for different jet velocities and angles. (a) v = 0.5 m/s, α = 0°; (b) v = 1.5 m/s, α = 0°; (c) v = 2.5 m/s, α = 0°; (d) v = 2.5 m/s, α = 30°; (e) v = 2.5 m/s, α = 60°.
From Figure 12a–c, the findings indicate that as the jet velocity increased, the low-velocity strips on the surface all became thicker gradually, and the low-velocity fluid region at the back end of the jet hole increased gradually, resulting in the decrease in viscous drag. The low-velocity stripes of the non-smooth jet coupling structure at any jet velocity were thicker than those of the single jet structure. In addition, the larger the jet velocity is, the more low-velocity fluid is enclosed in the boundary layer, the role of the low-velocity fluid in the boundary layer to isolate the wall from the high-velocity main flow is strengthened, and the corresponding viscous drag will be lower.
From Figure 12c–e, the findings indicate that with the growth of the jet angle, the low-velocity fluid region at the back end of the jet hole decreases gradually, resulting in the elevation of its surface viscous drag value. Compared with the single-jet structure, the reduction of viscous drag is favored thanks to the retention of low-velocity fluid by the non-smooth structure in the non-smooth jet coupling structure.
4.3. Characterization of Changes in Vortex Structure
- (1)
- Effect of different structures on the flow vortices
In the analysis presented in Section 3, it is evident that at higher jet velocities, the viscous drag of the non-smooth jet coupled structure was significantly lower than that of the other two structures. Consequently, to investigate the reasons for the observed reduction in surface viscous drag from a vortex structure perspective, we selected the non-smooth jet-coupled structure with parameters set to v = 2.5 m/s and α = 0°. The parameters for both the non-smooth and single jet structures were maintained to match those of the non-smooth jet coupled structure.
Under a main flow field velocity of 20 m/s, the distribution of vortex structures on the near-wall surface of the different configurations is illustrated in Figure 13. In this figure, the silver-gray regions denote the vortex structures generated within the boundary layer, while the blue corresponds to the wall surface. Compared to a smooth, flat plate, vortex structures formed at the surface protrusions of the non-smooth structure due to the instability of the velocity direction within the boundary layer, which was influenced by variations in the compressive stress gradient. The interaction between the low-velocity fluid ejected from the jet orifice and the high-velocity mainstream led to the formation of a distinct vortex structure surrounding it. Additionally, in contrast to the single jet structure, the vortex structure at the rear end of the jet orifice of the non-smooth jet coupling structure exhibited significant growth. The low-velocity jet modified the vortex structure on the surface of the non-smooth structural unit, allowing for the detachment of vortex generation and the formation of discrete vortices downstream.
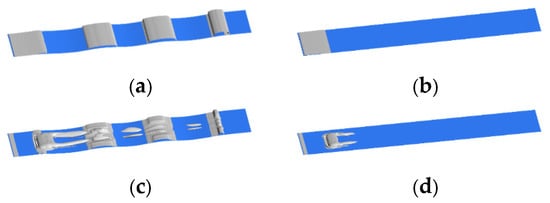
Figure 13.
Distribution of vortex structures near the wall with different structures. (a) Non-smooth structures; (b) Smooth plate; (c) Non−smooth jet coupling structure; (d) Single-jet structures.
Overall, the volume of vortex structures generated on the surface of the non-smooth jet coupling structure was the highest. This is primarily attributed to the interaction between the vortex structures and the high-velocity mainstream, which results in a weakening of the mainstream flow and consequently leads to a reduction in the viscous drag experienced on the surface.
- (2)
- Effect of different jet speeds and angles on the distribution of vortex structure
Under the condition that the velocity of the main flow field is 20 m/s, the distribution of vortex structures near the wall at different jet velocities and angles is shown in Figure 14. The left column is the non-smooth jet coupling structure, and the right column is the single jet structure.
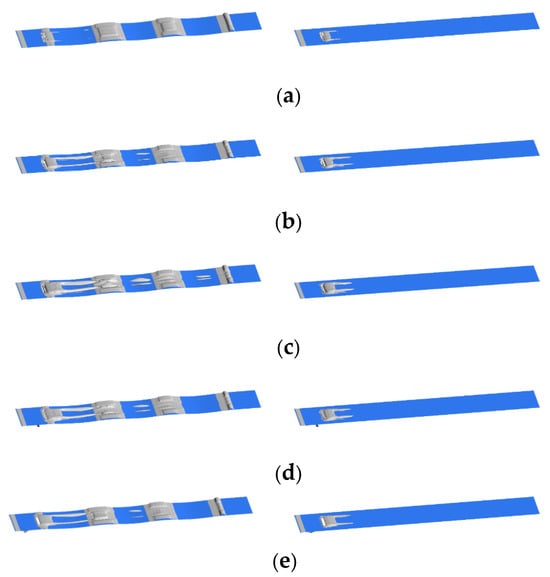
Figure 14.
Distribution of vortex structure near the wall for different jet velocities and angles. (a) v = 0.5 m/s, α = 0°; (b) v = 1.5 m/s, α = 0°; (c) v = 2.5 m/s, α = 0°; (d) v = 2.5 m/s, α = 30°; (e) v = 2.5 m/s, α = 60°.
From Figure 14a–c, the findings suggest that the extent of vortex structure distribution expands with an increase in jet velocity. The existence of non-smooth structural units allows the vortex structures generated by the jet to be derived, and the derived vortex structures become larger as the jet velocity increases, while the discrete vortices shed on the surface of the non-smooth structure gradually increase.
From Figure 14c–e, the vortex structures on the surface of the non-smooth jet-coupled structure diminish in intensity with increasing jet angles. However, it is noteworthy that the distribution range of vortex structures on the surface remained greater than that observed in the single jet structure at all examined jet angles. The reduction of the vortex structure on the surface of the non-smooth jet coupling structure will strengthen the interaction between the main flow stream and the wall, which will lead to the elevation of the surface viscous resistance.
4.4. Shear Stress Variation Characteristics
- (1)
- Surface shear stress analysis of different structures
In the analysis in Section 3, it is known that the viscous drag value on the surface of the non-smooth jet-coupled structure was significantly lower than that of the other two structures when the jet velocity was larger. So, the non-smooth jet coupled structure with v = 2.5 m/s and α = 0° was selected for the wall shear stress analysis to investigate the reason for the decrease in the viscous drag on the surface from the perspective of the wall shear stress. The structural parameters of the non-smooth structure and the single jet structure are consistent with the non-smooth jet coupled structure. Under the condition of the main flow field velocity of 20 m/s, the cloud diagram of the variation of wall shear stress of different structures (bottom surface of the basin) is shown in Figure 15.
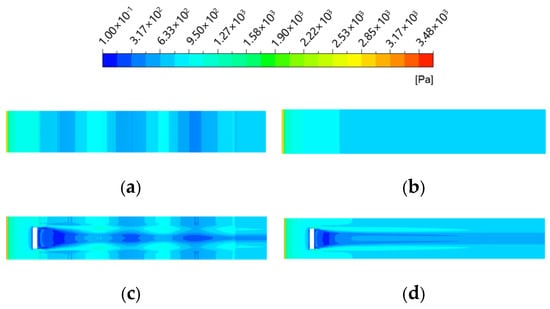
Figure 15.
Comparison of shear stress on the surface of different structures cloud diagram. (a) Non-smooth structures; (b) Smooth plate; (c) Non-smooth jet coupling structure; (d) Single-jet structures.
From Figure 15, the findings indicate that the area of the low shear stress region on the remaining structural surface was significantly larger than that of the smooth flat plate compared to the smooth flat plate. Due to the presence of the jet, strips of low-shear stress areas appeared at the back end of the jet hole, and the low-shear stress areas on the surface of the non-smooth jet-coupled structure were larger, with the main increase in the area being at the back end of the jet hole and the front end of the first non-smooth structural unit. This results in consistently lower viscous drag for the non-smooth jet-coupled structure.
- (2)
- Surface shear stress analysis at different jet speeds and angles
Under the condition that the velocity of the main flow field is 20 m/s, the comparative cloud diagrams of surface shear stress under different jet velocities and angles (bottom surface of the watershed) are shown in Figure 16, with the left column as a non-smooth jet coupling structure and the right column as a single jet structure.
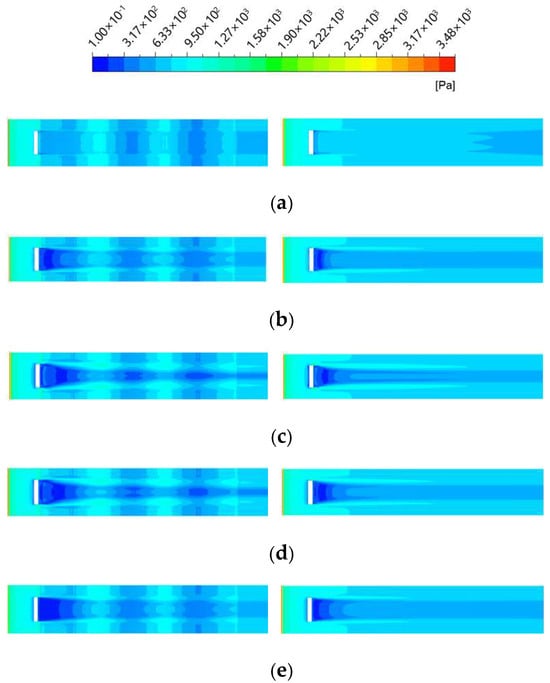
Figure 16.
Comparison of surface shear stress cloud for different jet speeds and angles. (a) v = 0.5 m/s, α = 0°; (b) v = 1.5 m/s, α = 0°; (c) v = 2.5 m/s, α = 0°; (d) v = 2.5 m/s, α = 30°; (e) v = 2.5 m/s, α = 60°.
From Figure 16a–c, the findings reveal that with an increase in jet velocity, the area of the low shear stress region on the surface progressively expanded, leading to a corresponding decrease in the surface shear stress and, consequently, a reduction in viscous drag. For all three jet velocities investigated, the non-smooth jet-coupled structure exhibited a larger area of low shear stress compared to the single jet structure. The primary regions contributing to this increase are located at the downstream end of the jet hole and the upstream end of the first non-smooth structural unit.
From Figure 16c–e, the analysis indicates that the width of the low shear stress strip at the rear end of the jet aperture increases as the jet angle increases. For the single jet structure, the region of lowest shear stress progressively converged towards the back end of the jet aperture. In contrast, although the region of the lowest shear stress in the non-smooth jet-coupled structure also converged to the back end of the jet aperture, its area expanded. Notably, the region of lowest shear stress associated with the non-smooth structural unit gradually decreased, leading to a reduction in the area of the first non-smooth structural unit as the jet angle increased. Furthermore, as the jet angle increased from 30° to 60°, the area of the lowest shear stress region within the non-smooth structural cell diminished, but the variation in shear stress values remained relatively minor.
5. Conclusions
(1) As the main flow field velocity increased, the drag reduction rate of the non-smooth structure remained approximately constant at around 4%. The single-jet structure achieved its maximum drag reduction rate at a main flow field velocity of 16 m/s. However, the non-smooth jet-coupled structure demonstrated a substantially improved drag reduction performance compared to both the non-smooth structure and the single-jet structure at a main flow field velocity of 20 m/s.
(2) At a main flow velocity of 20 m/s, an increase in jet velocity resulted in a gradual decrease in the viscous resistance on the surface of the non-smooth jet-coupled structure while the differential pressure resistance gradually increased. Conversely, variations in the jet angle had minimal impact on the viscous resistance of the non-smooth jet-coupled structure, with a slight decrease observed in the differential pressure resistance. Notably, when the jet velocity was set at 1 m/s, and the jet angle was 60°, the drag reduction rate of the non-smooth jet-coupled structure achieved a maximum value of 7.48% compared to both the non-smooth structure and the single jet structure.
(3) At a main flow velocity of 20 m/s, variations in jet angle and jet velocity for the non-smooth jet-coupled structure, compared to the single jet structure, resulted in a greater gradient of pressure stress. This led to an increased differential pressure resistance. Simultaneously, the non-smooth jet-coupled structure exhibited a larger area of low shear stress and an increased thickness at the bottom of the boundary layer, which effectively reduces surface velocity and viscous resistance.
Author Contributions
J.K.: methodology, data curation, formal analysis, writing—original draft; Q.L.: data curation, formal analysis, writing—review and editing; Y.G.: funding acquisition; J.Z.: resources; C.M. and J.Y.: supervision; Y.D. and C.X.: software. All authors have read and agreed to the published version of the manuscript.
Funding
This research was financially supported by the Zhejiang Provincial Natural Science Foundation of China (No. LY22E050015) and the Fundamental Research Funds for the Provincial Universities of Zhejiang (2023YW88).
Data Availability Statement
The data-supported results are included within this article.
Conflicts of Interest
The authors declare no conflicts of interest.
Nomenclature
| Y | Flatbed spreading width [mm] |
| Z | Flat-panel computing domain height [mm] |
| l | Length of intercepted rectangular plane [mm] |
| d1 | Distance to inlet basin [mm] |
| d2 | Distance to outlet basin [mm] |
| a | Jet hole length [mm] |
| b | Jet hole width [mm] |
| a | Jet angle [°] |
| r | Distance between the jet hole and non-smooth structure [mm] |
| v | Jet velocity [m/s] |
| v1 | Kinematic viscosity [m2/s] |
| Re | Reynolds number |
| ρ | Densities [kg/m3] |
| U | Incoming velocity [m/s] |
| L | Characteristic length [m] |
| μ | Dynamic viscosity [Pa·s] |
| u | Velocity direction vector |
| p | Static pressure [Pa] |
| vx, vy, vz | Velocity in the x, y and z directions [m/s] |
| k | Turbulent energy [m2/s−2] |
| Pk | Turbulence generation rate |
| ω | Specific dissipation rate |
| F1 | Mixing function |
| y+ | Dimensionless grid height [mm] |
| Δy | Height of the first layer of the grid [mm] |
| f | Viscous drag [N] |
| f* | Differential pressure resistance [N] |
| F | Total wall resistance [N] |
| τi | Discrete unit shear stress [N] |
| Ai | Wall discrete unit area [m2] |
| Ai* | Projected area of the jet hole and trench face along the main flow field [m2] |
References
- Wu, T.; Chen, W.; Zhao, A.G.; He, P.; Chen, H.A. Comprehensive investigation on micro-structured surfaces for underwater drag reduction. Ocean Eng. 2020, 218, 107902. [Google Scholar] [CrossRef]
- Luo, K.H.; Yan, L.; Zhu, Z.Y.; Wang, Z.Q.; Wang, H.R.; Jiang, F. Application of bionic technology in marine cruise equipment: Research progress and development trends. J. Bionic Eng. 2024, 21, 1117–1155. [Google Scholar] [CrossRef]
- Gu, Y.Q.; Ma, L.B.; Yan, M.H.; He, C.D.; Zhang, J.J.; Mou, J.G.; Wu, D.H.; Run, Y. Strategies for improving friction behavior based on carbon nanotube additive materials. Tribol. Int. 2022, 176, 107875. [Google Scholar] [CrossRef]
- Qin, L.G.; Ma, Z.Y.; Sun, H.J.; Lu, S.; Zeng, Q.F.; Zeng, Y.L.; Dong, G.N. Drag reduction and antifouling properties of non-smooth surfaces modified with ZIF-67. Surf. Coat. Technol. 2021, 427, 127836. [Google Scholar] [CrossRef]
- Li, C.; Nie, B.Y.; Ren, Y.J.; Chen, W.; Zhou, L.B.; Li, W.; Chen, J. Research status of anti-water erosion coatings for the final stage titanium blade in steam turbines. J. Chang. Univ. Sci. Technol. (Nat. Sci.) 2022, 19, 32–46. [Google Scholar] [CrossRef]
- Liu, G.J.; Yuan, Z.C.; Qiu, Z.Z.; Feng, S.W.; Xie, Y.C.; Leng, D.X.; Tian, X.J. A brief review of bio-inspired surface technology and application toward underwater drag reduction. Ocean Eng. 2020, 199, 106962. [Google Scholar] [CrossRef]
- Qin, L.G.; Gong, C.Y.; Sun, H.J.; Lu, S.; Zeng, Q.F.; Zhang, Y.L.; Dong, G.N. Review of research on drag reduction of non-smooth surface. Surf. Technol. 2022, 51, 107–122. [Google Scholar] [CrossRef]
- Tian, G.Z.; Zhang, Y.S.; Feng, X.M.; Hu, Y.S. Focus on bioinspired textured surfaces toward fluid drag reduction: Recent progresses and challenges. Adv. Eng. Mater. 2022, 24, 2100696. [Google Scholar] [CrossRef]
- Qi, J.Y.; Qi, Y.; Chen, Q.Y.; Yan, F. A study of drag reduction on cylinders with different V-groove depths on the surface. Water 2021, 14, 36. [Google Scholar] [CrossRef]
- Lloyd, C.J.; Peakall, J.; Burns, A.D.; Keevil, G.M.; Dorrell, R.M.; Wignall, P.B.; Fletcher, T.M. Hydrodynamic efficiency in sharks: The combined role of riblets and denticles. Bioinspiration Biomim. 2021, 16, 046008. [Google Scholar] [CrossRef] [PubMed]
- Ren, S.; Chen, J.W.; Jiang, M.; Wang, S.W.; Wan, Z.Y.; Xie, Y.; Li, L. The effect of drop volume on the apparent contact angle of hierarchical structured superhydrophobic surfaces. Colloids Surf. A Physicochem. Eng. Asp. 2021, 611, 125849. [Google Scholar] [CrossRef]
- Luo, N.; Qu, Z.; Cai, Q.J.; Peng, W.H.; Dong, J.W. Experimental study on microstructural characteristics of lotus leaf surface and droplet impact dynamics. Res. Explor. Lab. 2023, 42, 69–74. [Google Scholar] [CrossRef]
- Liu, L.X.; Wang, K.J.; Wang, X.W.; Tian, H.P.; Jiang, N. TRPIV experimental investigation of drag reduction mechanism inturbulent boundary layer over superhydrophobic-riblet surface. J. Exp. Fluid Mech. 2021, 35, 117–125. [Google Scholar] [CrossRef]
- Gu, Y.Q.; Yin, Z.F.; Yu, S.W.; He, C.D.; Wang, W.T.; Zhang, J.J.; Wu, D.H.; Mou, J.G.; Ren, Y. Suppression of unsteady partial cavitation by a bionic jet. Int. J. Multiph. Flow 2023, 164, 104466. [Google Scholar] [CrossRef]
- Zhang, J.; Li, J.Y.; Wang, T.; Qian, Z.S. Influence of nozzle structure on the flow field of the prestage of nozzle flapper servo valve. Int. J. Hydromechatronics 2023, 6, 59–75. [Google Scholar] [CrossRef]
- Cui, X.X.; Chen, D.K.; Chen, H.W. Multistage gradient bioinspired riblets for synergistic drag reduction and efficient antifouling. ACS Omega 2023, 8, 8569–8581. [Google Scholar] [CrossRef] [PubMed]
- Zhang, Y.S.; Fan, D.L.; Feng, X.M.; Hu, Y.S.; Shi, J.; Tian, G.Z. Drag reduction performance and mechanism of flexible conical microstructure film inspired by pufferfish epidermis. Ocean Eng. 2023, 271, 113760. [Google Scholar] [CrossRef]
- Han, Z.B.; Ma, L.J.; Zhao, Z. Study on the antifriction properties of laser processed nonsmooth surfaces with composite textures. Modul. Mach. Tool Autom. Manuf. Tech. 2023, 7, 57–60. [Google Scholar] [CrossRef]
- Wei, H.; Chen, G.J.; Chen, Z.; Yu, Z.W.; Huang, J.S. Progress on bionic textured cutting tools: A review and prospects. J. Bionic Eng. 2024, 21, 19–55. [Google Scholar] [CrossRef]
- Zheng, S.H.; Liang, X.; Li, J.Y.; Liu, Y.Y.; Tang, J. Drag reduction using bionic groove surface for underwater vehicles. Front. Bioeng. Biotechnol. 2023, 11, 1223691. [Google Scholar] [CrossRef] [PubMed]
- Zhao, Z.J.; Luo, Z.B.; Liu, J.F.; Deng, X.; Peng, W.Q.; Li, S.Q. Flight test of aircraft three-axis attitude control without rudders based on distributed dual synthetic jets. Chin. J. Theor. Appl. Mech. 2022, 54, 1220–1228. [Google Scholar] [CrossRef]
- Hu, C.X.; Gu, Y.Q.; Zhang, J.J.; Qiu, Q.F.; Ding, H.X.; Wu, D.H.; Mou, J.G. Research on the flow and drag reduction characteristics of surfaces with biomimetic fitting structure. J. Appl. Fluid Mech. 2024, 17, 1593–1603. [Google Scholar] [CrossRef]
- Ning, H.W.; Qian, S.Z.; Zhou, T. Applications of level set method in computational fluid dynamics: A review. Int. J. Hydromechatronics 2023, 6, 1–33. [Google Scholar] [CrossRef]
- Qu, K.; Xu, Y.; Huang, J.; Wen, H.B. Numerical simulation of hydrodynamic characteristics of submerged floating tunnels under the action of focused waves. J. Chang. Univ. Sci. Technol. (Nat. Sci.) 2023, 20, 127–141. [Google Scholar] [CrossRef]
- Li, F.; Zhao, G.; Liu, W.X. Research on drag reduction performance of turbulent boundary layer on bionic jet surface. Part M J. Eng. Marit. Environ. 2017, 231, 258–270. [Google Scholar] [CrossRef]
- Zhang, S. Study on the Size and Shape of Holes in Bionic Jet Drag Reduction Jets; Harbin Engineering University: Harbin, China, 2014. [Google Scholar]
Disclaimer/Publisher’s Note: The statements, opinions and data contained in all publications are solely those of the individual author(s) and contributor(s) and not of MDPI and/or the editor(s). MDPI and/or the editor(s) disclaim responsibility for any injury to people or property resulting from any ideas, methods, instructions or products referred to in the content. |
© 2024 by the authors. Licensee MDPI, Basel, Switzerland. This article is an open access article distributed under the terms and conditions of the Creative Commons Attribution (CC BY) license (https://creativecommons.org/licenses/by/4.0/).