Abstract
Research on White Etching Cracks (WEC) in multiple bearing applications has identified various drivers that cause them. Lubricants and electricity combined with contact mechanics have been proven to catalyze WEC significantly. However, none of these factors solely cause WEC on its own; instead, combinations of factors discretize whether WEC appears or not. Hence, the WEC phenomenon appears to be multidimensional, making WEC still unpredictable. The current paper is about a systematic study using a Deep Grove Ball Bearing test rig to investigate how lubricant chemicals, combined with electricity and variations in oil flow and pressure, lead to WEC formation. It becomes evident that even under critical conditions for WEC formation, increasing oil flow and decreasing contact pressure can prevent WEC.
1. Introduction
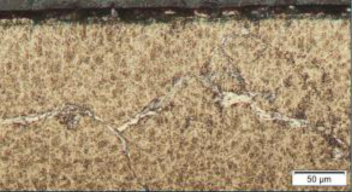
White Etching Crack (WEC) failures have been a long way through history until now. The name White Etching Crack originates from its appearance apparent in the subsurface of steel exposed to specific mechanical loading. After metallographic preparation, WECs appear as white-decorated flanks adjacent to crack networks after contrast etching with Nital (3% nitric acid in ethanol) and examined under a light microscope (see Figure 1).

Figure 1.
Evolving white etching cracks as subsurface features under operation.
As much as this topic has attracted researchers worldwide, until today, a concise understanding of WEC is still missing. Even before the WEC topic came to global attention, it is reasonable to assume that it was always present in the past as a hidden phenomenon. The history of WEC makes it difficult to record how the perception of traditional wear changed in a way to realize that WEC is a separate topic in material degradation [1]. The first observation of “White Etching” was reported in 1966 [2]. After a long period of silence, a series of activities started in the early 1980–1990s. However, at that time, researchers were not aware of White Etching Cracks as a specific topic. Earlier studies focused on material and surface material breakdown with respect to mechanical load under boundary lubrication (see, for example, [3]). Nevertheless, a detailed study of material response to different scenarios of load, e.g., contact pressure and tangential slip, showed that subsurface crack networks could appear as a consequence of load and slip—though not decorated by white matter [4]. Until that research was finished, WEC was not realized as a specific failure mode. The change in perception of WEC began in the middle of the 1990s with the steep increase in wind power installations, especially affecting generator bearings and, later, planetary stage and main bearings. WEC came up at the same time as a wave of field returns from component life cycles in automotive applications, namely in belt tensioner and generator bearings, as well as wheel bearings. As these failures became more prevalent in the industry, the perception of WEC as a separate topic, distinct from traditional material science concepts, slowly came up. However, the tendency to treat WEC in a classical sense via contact mechanics was still very strong. Numerous trials were made to bring the phenomenon down to parameter test rigs, especially those reflecting the sizes of bearings used in reality. The first successes came up when bearings under rolling contact conditions were brought to WEC failures, as reported by [5]. Years after [4], a concise report was published by Manieri, Stadler, Morales-Espejel, and Kadiric, discussing how materials exposed to mechanical impact are prone to WEC [6]. A numerical approach was published by [7]. Refs. [8,9] gave a broad overview of the status of WEC research related to wind turbine gearboxes. The connection between WEC and the electrification of bearings due to stray electrical currents has also been repeatedly found in the literature, as seen in [10,11,12]. Lubricants, with or without being connected to electricity and contact mechanics, are extensively reported in [13,14,15].
This paper is about the influence of a set of lubricants on the formation of White Etching Cracks in combination with electricity, varying contact pressure, and oil flow volume using a Deep Grove Ball Bearing (DGBB) test rig, extending a study that was published earlier by the authors (see [16,17]). This paper is structured as follows: Section 2 presents the experimental setup comprising the test rig with all relevant parameters. Section 3 presents the major results. Section 4 is about an interpretation and discussion of these results.
2. Materials and Methods
The test rig used in this study is schematically shown in Figure 2 and already published in [16].
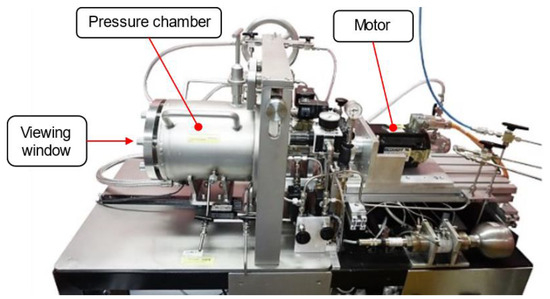
Figure 2.
Test rig.
Figure 3 shows the test rig components schematically.
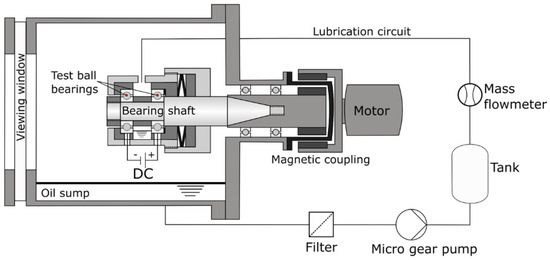
Figure 3.
Schematic representation of the test rig and its elements.
The shaft is connected via a magnetic coupling to an electric servomotor, type AM3052 (Beckhoff Automation GmbH, Verl, Germany), which can be accelerated up to 5500 rpm. The mounted bearings are inside the bearing block within the pressure chamber (see Figure 2).
A circulation system is used to supply oil to the bearings. Through the oil inlet, the lubricant is evenly distributed between both bearings. After leaving the bearing block through the oil outlet, the oil is collected in the oil sump. To avoid particles harming the bearings, 60 µm and 10 µm filters are installed in the lubrication circuit. During operation, a micro gear pump, type mzr-6355 (HNP Mikrosysteme GmbH, Schwerin, Germany), circulates the lubricant back to the oil inlet. A volume flow of up to 144 mL min−1 is possible. A mass flow meter, type SITRANS F C MASS 2100 1.5 (Siemens AG, München, Germany), is installed in the lubrication circuit to monitor the volume flow.
The two ball test bearings, type FAG 6203-C C3 (Schweinfurt, Germany), are mounted on a shaft within the pressure chamber. It is possible to apply pressures up to 5 bar and to visualize the bearing under operation through a Viewing Window using a High-Speed Camera.
Both test bearings are placed inside plastic cups to electrically isolate them from the bearing block. Holes in the cups and housing are available for temperature sensors and electrodes to record the temperature and apply an electric current (see Figure 4).
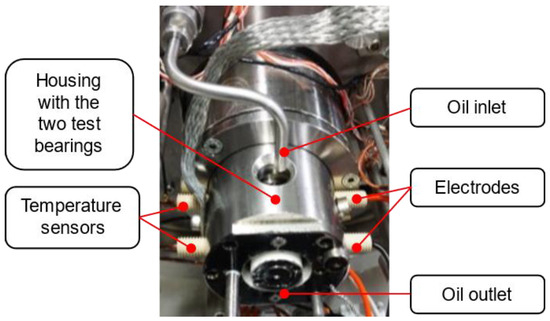
Figure 4.
Bearing setup within the pressure chamber comprising the oil inlet and sensor adjustments.
Figure 5 schematically presents the electrical setup used for the electrification of the bearings. A current of up to 15 V can be applied using a DC power supply. The circuit is connected in such a way that the positive pole is attached to the motor-side bearing and the negative pole to the front-end bearing. As a result, when voltage is applied, and a lubricating film is present, the outer ring of the front ball bearing is the cathode, and the inner ring is the anode. At the motor-side bearing, the situation is the opposite.
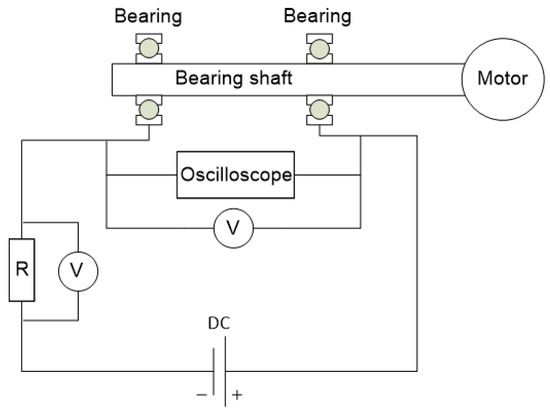
Figure 5.
Schematic representation of the electrical circuit for artificial charging of the bearings.
The resistor R is used to adjust the current in the system. The electrical load on the bearings is established through electrodes attached to the outer rings of the bearings. The electrical circuit between the inner rings of the bearings is closed via the shaft. The voltage is measured in parallel with the resistor and the bearings. In this way, the current in the system can be calculated. In addition, an oscilloscope is connected in parallel with the shaft in order to detect electrical discharges. A 75 kΩ resistor is installed to keep the current below 0.2 mA to protect the bearings from damage caused by the passage of high currents.
Electrification was carried out following a characteristic voltage curve similar to what was already reported in [14]. During 200 s, the voltage at the DC power supply (black) was increased in small increments, and the voltage drop across the two ball bearings (red) was measured. In addition, records from the oscilloscope were taken during the recording of the characteristic voltage curve (see Figure 6).
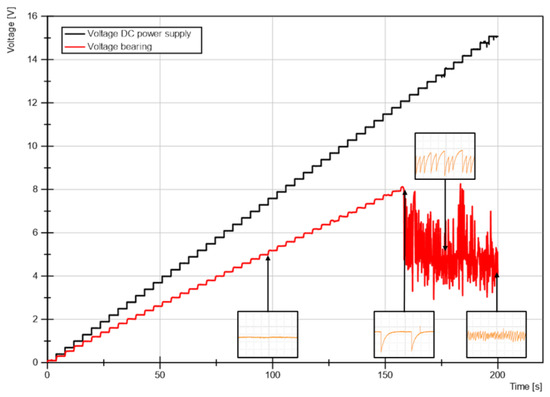
Figure 6.
Voltage recording at the bearing. The yellow lines represent a magnified region.
The curve implies that the manually increased voltage at the DC power supply rises more steeply compared to the voltage at the test bearing. The difference between the two curves is due to the voltage drop across the installed 75 kΩ resistor.
After 160 s, at a DC power supply voltage of 11.5 V, the voltage at the bearing starts to deviate from the steady increase of the DC power supply voltage. From this point onwards, electrical discharges occur in the bearings since the insulating effect of the lubricant in the lubrication gap is no longer sufficient.
In the beginning, only a few discharges are observed. However, due to the high voltages in this area, the energy of the breakdowns is high. With increasing voltage at the power supply, the number of discharges increases significantly. At the same time, the voltage amplitudes of the breakdowns, and hence, the energy of the discharges decrease. Therefore, a total of four different voltage-dependent areas can be defined during electrification. In the so-called Ohmic region, the voltage increases linearly without any discharges. In the second section, incidental breakdowns appear, and the amplitude of the discharges reaches a maximum. In the third phase, the frequency of breakdowns increases, but the amplitude decreases until, in the fourth phase, the amplitude reaches a minimum, and the discharge frequency reaches a maximum.
In all tests, the voltage was always set to 15 V in order to ensure discharges during the experiments. These electrical discharges can be observed “in situ” using an oscilloscope. The discharges are also visible in the voltage recording from the test rig, which is installed parallel to the roller bearings in the electrical circuit. Although the recording rate is only 1 Hz, the discharges are visible in the recording, even though the breakdown frequency is far higher. It is not possible to observe the individual discharges precisely due to the low sampling rate, but it is possible to assign the discharge areas from the voltage measured in parallel with the bearing setup (see Figure 7).

Figure 7.
A recording of the voltage present at the bearings applying 15 V. The yellow lines represent a magnified section.
After a running-in time of 2.3 h, the voltage at the DC power supply was set to 15 V. Immediately, high-frequency electrical discharges were visible on the oscilloscope. The electrical discharge condition appeared to be constant but started to change after 3.5 h running time. The discharge frequency decreased, and the discharge amplitude increased. This means that the system is moving to the Ohmic area, as presented in Figure 6. After a running time of 5 h, the electrical test condition stabilized, and only a few discharges were visible at the oscilloscope. This is also visible in the voltage measured at the bearing (see Figure 7). The bearing voltage stabilized at a value of approximately 11 V. This increased voltage drop at the bearing setup means that the electrical resistance of the bearing setup has increased. After a running time of 8 h, the electrical system changed back to high-frequency discharges. However, at a running time of 10 h, the discharge frequency decreased again. Just before the test run was terminated, the electrical discharge frequency increased again due to spalling at the bearing.
The changes in the frequency of discharges and fluctuations in voltage show that the electrical resistance at the bearings changed several times during operation.
The resistance at the bearing setup can be calculated using Ohm’s law, with the premise that the current in the system is the same across both the resistor and the bearing setup. The fixed 75 kΩ resistor is multiplied by the voltage , measured at the bearing setup, and divided by the measured voltage at the resistor:
The resulting resistance is smoothened to better illustrate the course of the resistance. The whole procedure is presented in Figure 8.

Figure 8.
Smoothening procedure according to an example of a test run.
The lubricants used in this study are listed below:
- ZnDTP—Zinc-2-ethylhexyldithiophospate, a commercial Antiwear/Extreme Pressure Additive 2% per weight (p.w.)
- PMMA—Polymethylmethacrylate, a commercial Viscosity Index Improver 5% p.w.
- BoAE—Boronic Acid Ester, a commercial Antiwear/Extreme Pressure Additive 2% p.w
- DCHA—Dicyclohexylamine, a Vapour-Based Anti-Corrosion Additive 2% p.w.
- PAO—Poly-alpha-Olefine, ISO VG 46, a commercial Base oil up to 100% p.w.
Blendings
- ZnDTP + PMMA
- ZnDTP
- PMMA
- PAO
- ZnDTP + DCHA
- ZnDTP + BoAE
To examine bearing damages and structural changes, it is important to carry out a metallographic preparation. By analyzing the raceway surfaces and the structure, conclusions can be drawn about the impact of mechanical loads and other factors. The work steps performed are shown in Figure 9.
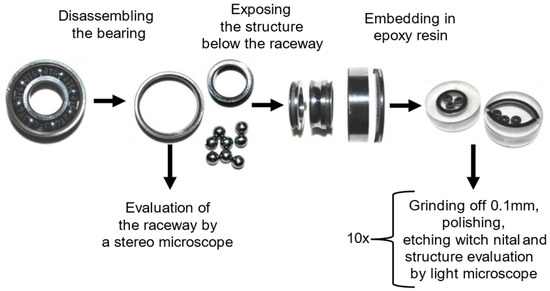
Figure 9.
Schematic representation of disassembling the bearing.
After the bearing was removed from the bearing test rig, it was cleaned, and the cage was removed. This first step left only the balls, the inner ring, and the outer ring. After halving the rings, the parts can be examined and photographed using a stereo microscope. This step allowed us to search for pitting, fluting, and other surface defects on the raceways of the balls and the rings. Next, a shoulder was cut off from the halved rings. The resulting half-ring and balls were embedded in epoxy resin in a way through which the structure beneath the raceway could be viewed. Since structural changes could occur at different depths in the structure, the raceway was removed layer by layer at 100 µm intervals through grinding and polishing. To analyze the structure, each layer was grounded, polished, and etched with 3% alcoholic nitric acid (Nital). A sample treated in this way could then be viewed under a light microscope. With the bearing raceway being approximately 1 mm wide, this procedure was repeated at least 10 times for each bearing being tested.
Figure 10 shows three images of bearing raceways in different states. The left image was taken from a new bearing. The middle image was taken after a test run without a bearing failure. In this picture, the raceway is not in the center. It is rather shifted to one side. The axial preload force is responsible for this shift. If the bearing were loaded in the radial direction, the raceway would be in the center. The right image presents a bearing surface after a bearing failure caused by WEC.

Figure 10.
New bearing raceway surface (left); after a test run without bearing failure (middle); after a bearing failure and spalling (right).
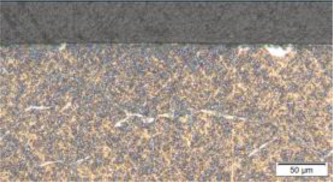
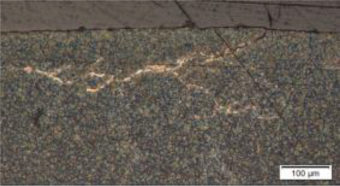
Figure 11 presents one image without a structure anomaly (left) and two images with WEC (middle—without and right—with spalling).
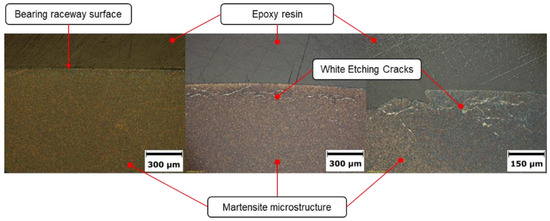
Figure 11.
Appearance of subsurface WEC features after etching with Nital.
3. Results
The following Section presents test rig results under an electrical impact (see Figure 6, Figure 7 and Figure 8). Tests 1–5 maintain constant contact pressure, oil flow, and speed constant while varying chemistry, with WEC yes/no as the outcome. Test 6 involves an increased oil volume flow while keeping speed, axial load, and chemistry, which leads to WEC. Tests 7 and 8 represent the results of reducing the load with low oil volume, constant speed, and pressure using low reference oil. Test 9 shows the results of varying the oil flow from low to high at a constant speed, high axial force, and low reference oil. The constant tests were accompanied by recording the temperatures (see Figure 4) as well as the resistance at the bearing (see Figure 5 and Figure 6). The maximum axial load is set to 1800 N, equal to 3781 MPa for the inner ring and 3109 MPa for the outer ring. For the bearing lifetime, the following calculation formula is used:
where Lna is the modified life, a1, a2, and a3 are parameters related to lifetime probability (a1) and to material and lubrication. L10 is calculated according to ISO 281 as the probability of 90% of the population to survive (with Cr as the dynamic load capacity, P as the contact pressure, and p10 as the exponent related to contact (set to 10 for point contact)):
The adjustment to the nominal hours is given using
where n is the rotational speed in min−1. The result is the extended modified lifetime Lnm, which equals to 380 h. The material used is AISI 52100 steel, martensitic heat-treated, with a roughness of 0.0223 µm for the inner ring, 0.0325 µm for the outer ring, and 0.0094 µm for the balls. The Young’s modulus is 210 GPa, the Poisson number is 0.3, and the retained austenite content is 10–12%. The typical film height is calculated to be 2.23 µm, with a minimum of 0.1 µm, indicating a full-film lubrication regime.
The high reference runs were switched off after a running time of at least 160 h. The time to stop differed because the shutdown was performed manually. A minimum runtime of 160 h was chosen because this is approximately 10 times the runtime of the Low Reference run (PAO + ZnDTP + PMMA), and it can be assumed that after this time, no more WECs would occur, even if not proven. The tests discussed in this work are presented in Table 1 for a better overview. In this table, the test parameters, the lubricants used, and the results (WEC/no WEC) are presented.

Table 1.
Overview of all tests in this work—presentation of the test parameters, the lubricant used, and whether WEC occurred during the test or not.
3.1. Test 1: Result: No WEC
Axial Load: 1800 N, 4500 rpm, 4 mL/min;
Lubricant: Poly-α-olefine (viscosity at 40 °C: 48 mm2/s).
3.2. Test 2: Result: No WEC
Axial Load: 1800 N, 4500 rpm, 4 mL/min;
Lubricant: Poly-α-olefine (viscosity at 40 °C: 48 mm2/s, 95% per weight) and PMMA (5% per weight).
3.3. Test 3: Result: WEC
Axial Load: 1800 N, 4500 rpm, 4 mL/min;
Lubricant: Poly-α-olefine (viscosity at 40 °C: 48 mm2/s, 98% per weight) and ZnDTP (2% per weight).
3.4. Test 4: Result: WEC
Axial Load: 1800 N, 4500 rpm, 4 mL/min;
Lubricant: Poly-α-olefine (viscosity at 40 °C: 48 mm2/s, 93% per weight), ZnDTP (2% per weight), and PMMA (5% per weight).
3.5. Test 5: Result: No WEC
Axial Load: 1800 N, 4500 rpm, 4 mL/min;
Lubricant: Poly-α-olefine (viscosity at 40 °C: 48 mm2/s, 96% per weight, and Boron Acid Ester (2% per weight) and ZnDTP (2% per weight).
The possibility of the occurrence of White Etching Cracks has often been connected to specific lubricants and, in this context, with lubricant additives. An often-named additive is Zinc dialkyldithiophosphate when discussing WEC propagation. To further investigate the connection between ZnDTP and the occurrence of WEC, the base oil PAO 8 was tested without any additives in Test 1 (Figure 12). The second additive, which is Polymethylmethacrylate, was tested as a single additive in PAO 8 in Test 2 (Figure 13). ZnDTP was also examined separately in PAO 8 within Test 3 (Figure 14). Additionally, Boric acid ester was tested in combination with Zinc dialkyldithiophosphate. The lubricants were examined under the following test parameters: Axial preload was 1800 N, speed was 4500 rpm, volume flow was 4 mL min−1, running-in time was 2–3 h, and DC power supply voltage was 15 V.
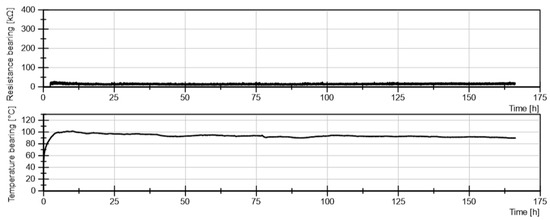
Figure 12.
Test 1: Result for PAO (pure base oil) showing the temperature graph and resistance at the bearing.
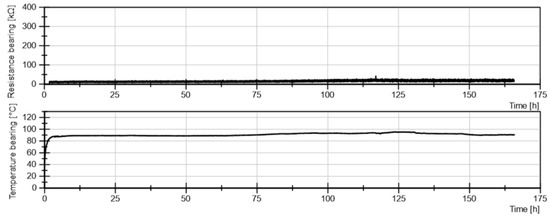
Figure 13.
Test 2: Result for PAO (base oil) and PMMA as a viscosity index improver showing the temperature graph and resistance at the bearing.
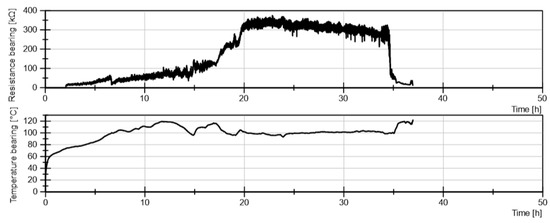
Figure 14.
Test 3: Result for PAO (base oil) and ZnDTP as an Anti-Wear Additive showing the temperature graph and resistance at the bearing.
The results show that only the lubricants containing ZnDTP caused WEC. Interestingly, the combination of ZnDTP + BoAE did not cause WEC to occur within the runtime of 164 h.
Tests 1 to 4 (Figure 12, Figure 13, Figure 14, Figure 15 and Figure 16) show that WEC occurs only if there is an increase in electrical resistance at the location of the bearing. In Test 3, the increase in electrical resistance occurs over a longer period than in Test 4.
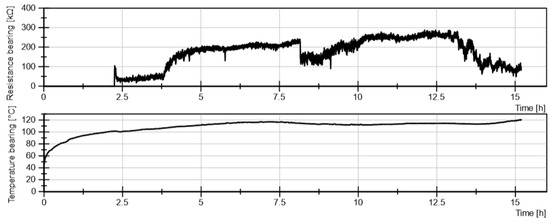
Figure 15.
Test 4: Result for PAO (base oil), ZnDTP as an Anti-Wear Additive, and PMMA showing the temperature graph and resistance at the bearing.
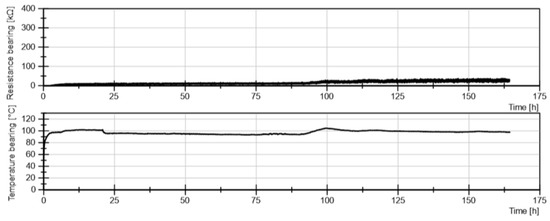
Figure 16.
Test 5: Result for PAO (base oil), ZnDTP as an Anti-Wear Additive, and Boron Acid Ester showing the temperature graph and resistance at the bearings.
ZnDTP + BoAE did not increase the electric resistance compared to ZnDTP + PMMA So, the lubricant ZnDTP + BoAE does not form an insulating tribofilm, which can be attributed to the Boric acid ester. BoAE is an extreme pressure additive like ZnDTP and forms surface layers to protect the raceways. Test 5 gives the impression that the Boric acid ester may seal the surfaces even before ZnDTP can react. This results in no electrical influence reactions involving ZnDTP and no unwanted formation of an additional insulating layer. However, after a running time of 90 h, the temperature in Test 5 increases slightly. At the same time, there is also a slight increase in electrical resistance, which means that over time, the BoAE is depleted, and more ZnDTP reacts with the surfaces, which could lead to the formation of an isolating tribofilm.
3.6. Test 6: Increase in the Oil Flow: Result: No WEC
Axial Load: 1800 N, 4500 rpm, 40 mL/min;
Lubricant: Poly-α-olefine (viscosity at 40 °C: 48 mm2/s, 93% per weight), ZnDTP (2% per weight), and PMMA (5% per weight).
In test 6 (Figure 17) a volume flow of 40 mL min−1 resulted in neither bearing damage nor WEC. Since there was no external heating, the bearing temperature decreased due to the increase in volume flow. Also, no increase in electrical resistance was detected.
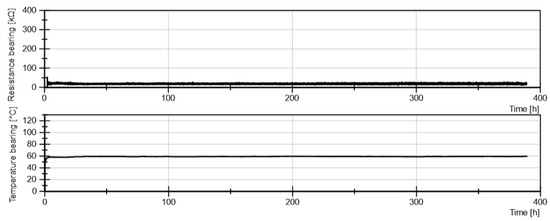
Figure 17.
Test 6: Result for PAO (base oil), ZnDTP as an Anti-Wear Additive, and PMMA showing the temperature graph and resistance at the bearing under an increased oil flow.
3.7. Test 7: Reducing Load to 1200 N: Result: WEC
Axial Load: 1200 N, 4500 rpm, 4 mL/min;
Lubricant: Poly-α-olefine (viscosity at 40 °C: 48 mm2/s, 93% per weight), ZnDTP (2% per weight), and PMMA (5% per weight).
3.8. Test 8: Reducing Load to 800 N: Result: No WEC
Axial Load: 800 N, 4500 rpm, 4 mL/min;
Lubricant: Poly-α-olefine (viscosity at 40 °C: 48 mm2/s, 93% per weight), ZnDTP (2% per weight), and PMMA (5% per weight).
Reducing the axial preload from 1800 N to 1200 N increases the modified lifetime from 380 h to 1900 h. Test 7 (Figure 18) ended after a running time of 62 h, during which WEC was found in the structure. Compared to Test 4, the running time has quadrupled, but the running time is still well below the theoretical service life. Further reducing the axial preload to 800 N in test 8 (Figure 19) increases the theoretical service life. Since such a long test duration cannot be carried out with the test rig, Test 8 ended after 237 h. WEC was not found despite the electrical voltage being applied.
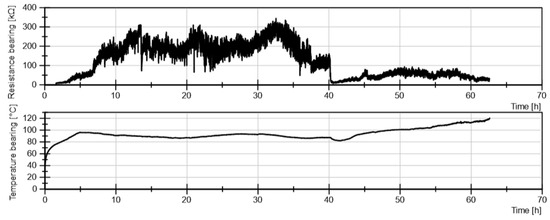
Figure 18.
Test 7: Result for PAO (Baseoil), ZnDTP as an Anti-Wear Additive, and PMMA showing the temperature graph and resistance at the bearing under a lower 1200 N axial load.
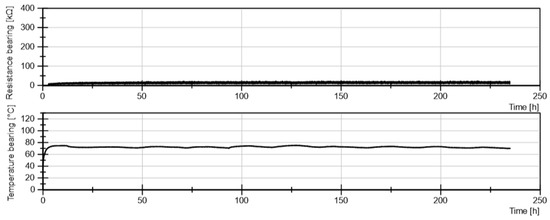
Figure 19.
Test 8: Result for PAO (Baseoil), ZnDTP as an Anti-Wear Additive, and PMMA showing the temperature graph and resistance at the bearing under 800 N axial load.
3.9. Test 9: Starting with Low Oil Flow (4 mL/min), Then Increasing to 40 mL/min: Result: No WEC
Axial Load: 1800 N, 4500 rpm, 4 mL/min at start for 12 h, then increased to 40 mL/min for the remaining time.
Lubricant: Poly-α-olefine (viscosity at 40 °C 48 mm2/s, 93% per weight), ZnDTP (2% per weight), and PMMA (5% per weight).
Test 9 was carried out based on Test 4. However, the volume flow was increased after 15 h. The test was stopped manually and metallographically analyzed: No WEC was found. The bearing temperature, electrical resistance, and measured volume flow during the test run are presented in Figure 20. The electrical resistance and temperature were like Test 4 until the volume flow was increased. The temperature in Test 9 dropped to 60 °C, and the electrical resistance also decreased. This shows that the isolating layer cannot be chemically bonded toward the surface since it can be washed off by increasing the volume flow.
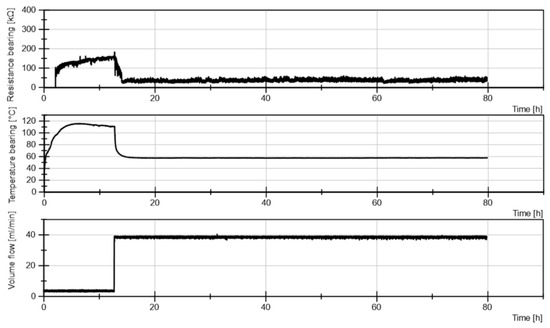
Figure 20.
Test 9: Result for PAO–ZndtP–PMMA as the lubricant started with 4 mL/min oil flow, then increased to 40 mL/min at 1800 N.
4. Discussion
The tests reflect different dimensions related to the appearance of White Etching Cracks, keeping the speed constant as well as the electrical impact. The least favorable combination, which is represented by the lubricant containing PAO (base oil), ZnDTP, and PMMA, resulted in repeated WEC failures in a short time frame under a pressure range of 1800 N to 1200 N with an oil flow of 4 mL/min. The failure was mitigated by reducing the load to 800 N and, at 1800 N, by increasing the oil volume flow. The mixture of PAO base oil with ZnDTP led to WEC under the most critical conditions (1800 N load and 4 mL/min oil flow). WEC could not be detected when using a mixture of boronic acid ester with PAO and pure base oil, even under the most critical conditions (1800 N, 4 mL/min). All tests that resulted in WEC showed an increase in resistance at the bearing, while all tests that did not lead to WEC did not exhibit this behavior. A similar pattern was observed when temperature was monitored. In tendency, all tests leading to WEC failure showed an ascent in the temperature at the beginning, which then stabilized throughout the test. It becomes evident that even under critical WEC conditions, the situation can become WEC-free simply by increasing the oil flow and decreasing the contact pressure. An important aspect to note is that the pre-stages of WEC formation are accompanied by the formation of additional resistance at the bearings. This resistance persists for a while before collapsing. It should be emphasized that this phenomenon is not related to the formation of reaction layers, as it vanishes when the oil flow is increased. Therefore, it is more likely that transient molecular aggregations (Clusters) are the cause, and the creation of WEC arises from charge accumulation on the Cluster surface. The initiation of WEC would then be caused during this “silent” charging phase, while the collapse reflects the outbreak of WEC. The hypotheses behind this are part of a recent study [18].
5. Conclusions
Research on White Etching Cracks (WECs) apparent in multiple bearing applications has identified various drivers that contribute to their occurrence. Lubricants and electricity combined with parameters to be defined by contact mechanics are proven to catalyze WEC significantly. However, none of them solely causes WEC on its own; instead, combinations discretize whether WEC appears or not. Hence, the WEC topic appears to be multidimensional, which makes WEC still unpredictable. The current paper is about a systematic study using a DGBB test rig on how lubricant chemicals, combined with electricity and varying oil flow and pressure, lead to WEC. In order to identify the critical components within the lubricant, a well-known industrial gear oil that has been associated with WEC both in test rigs and in the field was selected. The different components were tested separately, starting with the pure base oil and sequentially adding the different additives identified in the original gear oil. As ZNDTP is well known to cause WEC under various conditions, it was not surprising to observe WEC within this test procedure. As an important result it came out that a considerable acceleration in the onset of WEC was observed by combing the VI Improver PMMA with ZnDTP. This result is important, as PMMA-based VI Improvers are used worldwide in Gear Oils, while their contribution to WEC has not been reported until now. It clearly proves the assumption that WEC is a multidimensional problem being very sensitive to lubricant components. Drive train refill should consider the residual chemicals that may remain in the lubricant. Long-term reliability predictions should be based on serial analytics, for example, refractive index, in order to assess the condition of the oil compared to the fresh oil. Chemically sensitive sensors that monitor composition could be installed in a bypass with low construction effort. Apart from the sensitivity of WEC creation toward yet unexplored chemicals, the fact that WEC can be removed by simply increasing the oil flow is of considerable practical importance. It would, however, need an oil flow meter placed close to the critical bearing rather than relying solely on the setting of the pump installed in the tank, which is away from the bearing. The current results become important for the use of bearings under electrical exposure, like within Wind Power Installations and E-Mobility, in detail by surveying the chemicals and the oil flow.
Author Contributions
Conceptualization, M.Z. and W.H.; methodology, M.Z.; validation, M.Z.; formal analysis, M.Z.; investigation, M.Z.; resources, C.S.; data curation, M.Z.; writing—original draft preparation, W.H.; writing—review and editing, M.Z.; visualization, M.Z.; supervision, E.S. and W.H.; project administration, E.S.; funding acquisition, E.S. and W.H. All authors have read and agreed to the published version of the manuscript.
Funding
This research was funded by the German Research Center, Julich, at the Section of the Bavarian Ministry of Economics.
Data Availability Statement
The data are available at manuel.zuercher@gmx.de.
Conflicts of Interest
Author Eberhard Schlücker was employed by the Lehrstuhl für Prozessmaschinen und Anlagentechnik. Author Christian Spaeth was employed by the TUNAP GmbH & Co. KG. Author Walter Holweger was employed by the company Technology Consultant. The remaining authors declare that the research was conducted in the absence of any commercial or financial relationships that could be construed as a potential conflict of interest.
References
- ISO 281; Rolling Bearings—Dynamic Load Ratings and Rating Life. ISO: Geneva, Switzerland, 2007.
- Scott, D.; Loy, B.; Mills, G.H. Paper 10: Metallurgical Aspects of Rolling Contact Fatigue. In Proceedings of the Institution of Mechanical Engineers, Conference Proceedings; SAGE Publications: London, UK, 1966; Volume 181, pp. 94–103. [Google Scholar]
- Wang, Q.J.; Netzel, J.; Sadeghi, F. (Eds.) The Advancing Frontier of Engineering Tribology; STLE/ASME: New York, NY, USA, 1999. [Google Scholar]
- Ilg, U. Einfluß von Normal-/Gleitbeanspruchung auf Gefüge und Eigenspannungsänderungen von Wälzelementen unterschiedlicher Eigenspannungszustände; Heft 103; Forschungsvereinigung Antriebstechnik: Frankfurt am Main, Germany, 1981; p. 188. [Google Scholar]
- Ruellan, A.; Kleber, X.; Ville, F.; Cavoret, J.; Liatard, B. Understanding white etching cracks in rolling element bearings: Formation mechanisms and influent tribochemical drivers. Proc. Inst. Mech. Eng. Part J J. Eng. Tribol. 2015, 229, 886–901. [Google Scholar] [CrossRef]
- Manieri, F.; Stadler, K.; Morales-Espejel, G.E.; Kadiric, A. The origins of white etching cracks and their significance to rolling bearing failures. Int. J. Fatigue 2019, 120, 107–133. [Google Scholar] [CrossRef]
- Leimann, O.D. Calculation Method to Evaluate the Risk of WEC Occurrence in Industrial Application. Bear. World J. 2020, 5, 19–39. [Google Scholar]
- Liu, Z.; Zhang, L. A review of failure modes, condition monitoring and fault diagnosis methods for large-scale wind turbine bearings. Measurement 2020, 149, 107002. [Google Scholar] [CrossRef]
- López-Uruñuela, F.J.; Fernández-Díaz, B.; Pagano, F.; López-Ortega, A.; Pinedo, B.; Bayón, R.; Aguirrebeitia, J. Broad review of “White Etching Crack” failure in wind turbine gearbox bearings: Main factors and experimental investigations. Int. J. Fatigue 2021, 145, 106091. [Google Scholar] [CrossRef]
- Loos, J.; Bergmann, I.; Goss, M. Influence of Currents from Electrostatic Charges on WEC Formation in Rolling Bearings. Tribol. Trans. 2016, 59, 865–875. [Google Scholar] [CrossRef]
- Loos, J.; Bergmann, I.; Goss, M. Influence of High Electrical Currents on WEC Formation in Rolling Bearings. Tribol. Trans. 2021, 64, 708–720. [Google Scholar] [CrossRef]
- Gould, B.; Demas, N.; Erck, R.; Lorenzo-Martin, M.C.; Ajayi, O.; Greco, A. The effect of electrical current on premature failures and microstructural degradation in bearing steel. Int. J. Fatigue 2021, 145, 106078. [Google Scholar] [CrossRef]
- Richardson, A.D.; Evans, M.H.; Wang, L.; Wood, R.J.K.; Ingram, M.; Meuth, B. The Evolution of White Etching Cracks (WECs) in Rolling Contact Fatigue-Tested 100Cr6 Steel. Tribol. Lett. 2018, 66, 6. [Google Scholar] [CrossRef] [PubMed]
- Smelova, V.; Schwedt, A.; Wang, L.; Holweger, W.; Mayer, J. Microstructural changes in White Etching Cracks (WECs) and their relationship with those in Dark Etching Region (DER) and White Etching Bands (WEBs) due to Rolling Contact Fatigue (RCF). Int. J. Fatigue 2017, 100, 148–158. [Google Scholar] [CrossRef]
- Evans, M. White Structure Flaking Failure in Bearings under Rolling Contact Fatigue. Ph.D. Thesis, Faculty of Engineering and the Environment, University of Southampton, Southampton, UK, 2013. [Google Scholar]
- Esmaeili, K.; Zuercher, M.; Wang, L.; Harvey, T.; Holweger, W.; White, N.; Schlücker, E. A study of white etching crack bearing failure detection using electrostatic sensing in wind turbine gearboxes. Int. J. Cond. Monit. 2018, 8, 82–88. [Google Scholar] [CrossRef]
- Esmaeli, K. Influence of Electrical Discharges on White Etching Crack Formation and Their Detection Using Electrostatic Sensing Technique. Doctoral Dissertation, National Center of Advanced Tribology, University of Southampton, Southampton, UK, 2021. [Google Scholar]
- Holweger, W.; Bobbio, L.; Mo, Z.; Fliege, J.; Goerlach, B.; Simon, B. A Validated Computational Study of Lubricants under White Etching Crack Conditions Exposed to Electrical Fields. Lubricants 2023, 11, 45. [Google Scholar] [CrossRef]
Disclaimer/Publisher’s Note: The statements, opinions and data contained in all publications are solely those of the individual author(s) and contributor(s) and not of MDPI and/or the editor(s). MDPI and/or the editor(s) disclaim responsibility for any injury to people or property resulting from any ideas, methods, instructions or products referred to in the content. |
© 2024 by the authors. Licensee MDPI, Basel, Switzerland. This article is an open access article distributed under the terms and conditions of the Creative Commons Attribution (CC BY) license (https://creativecommons.org/licenses/by/4.0/).
