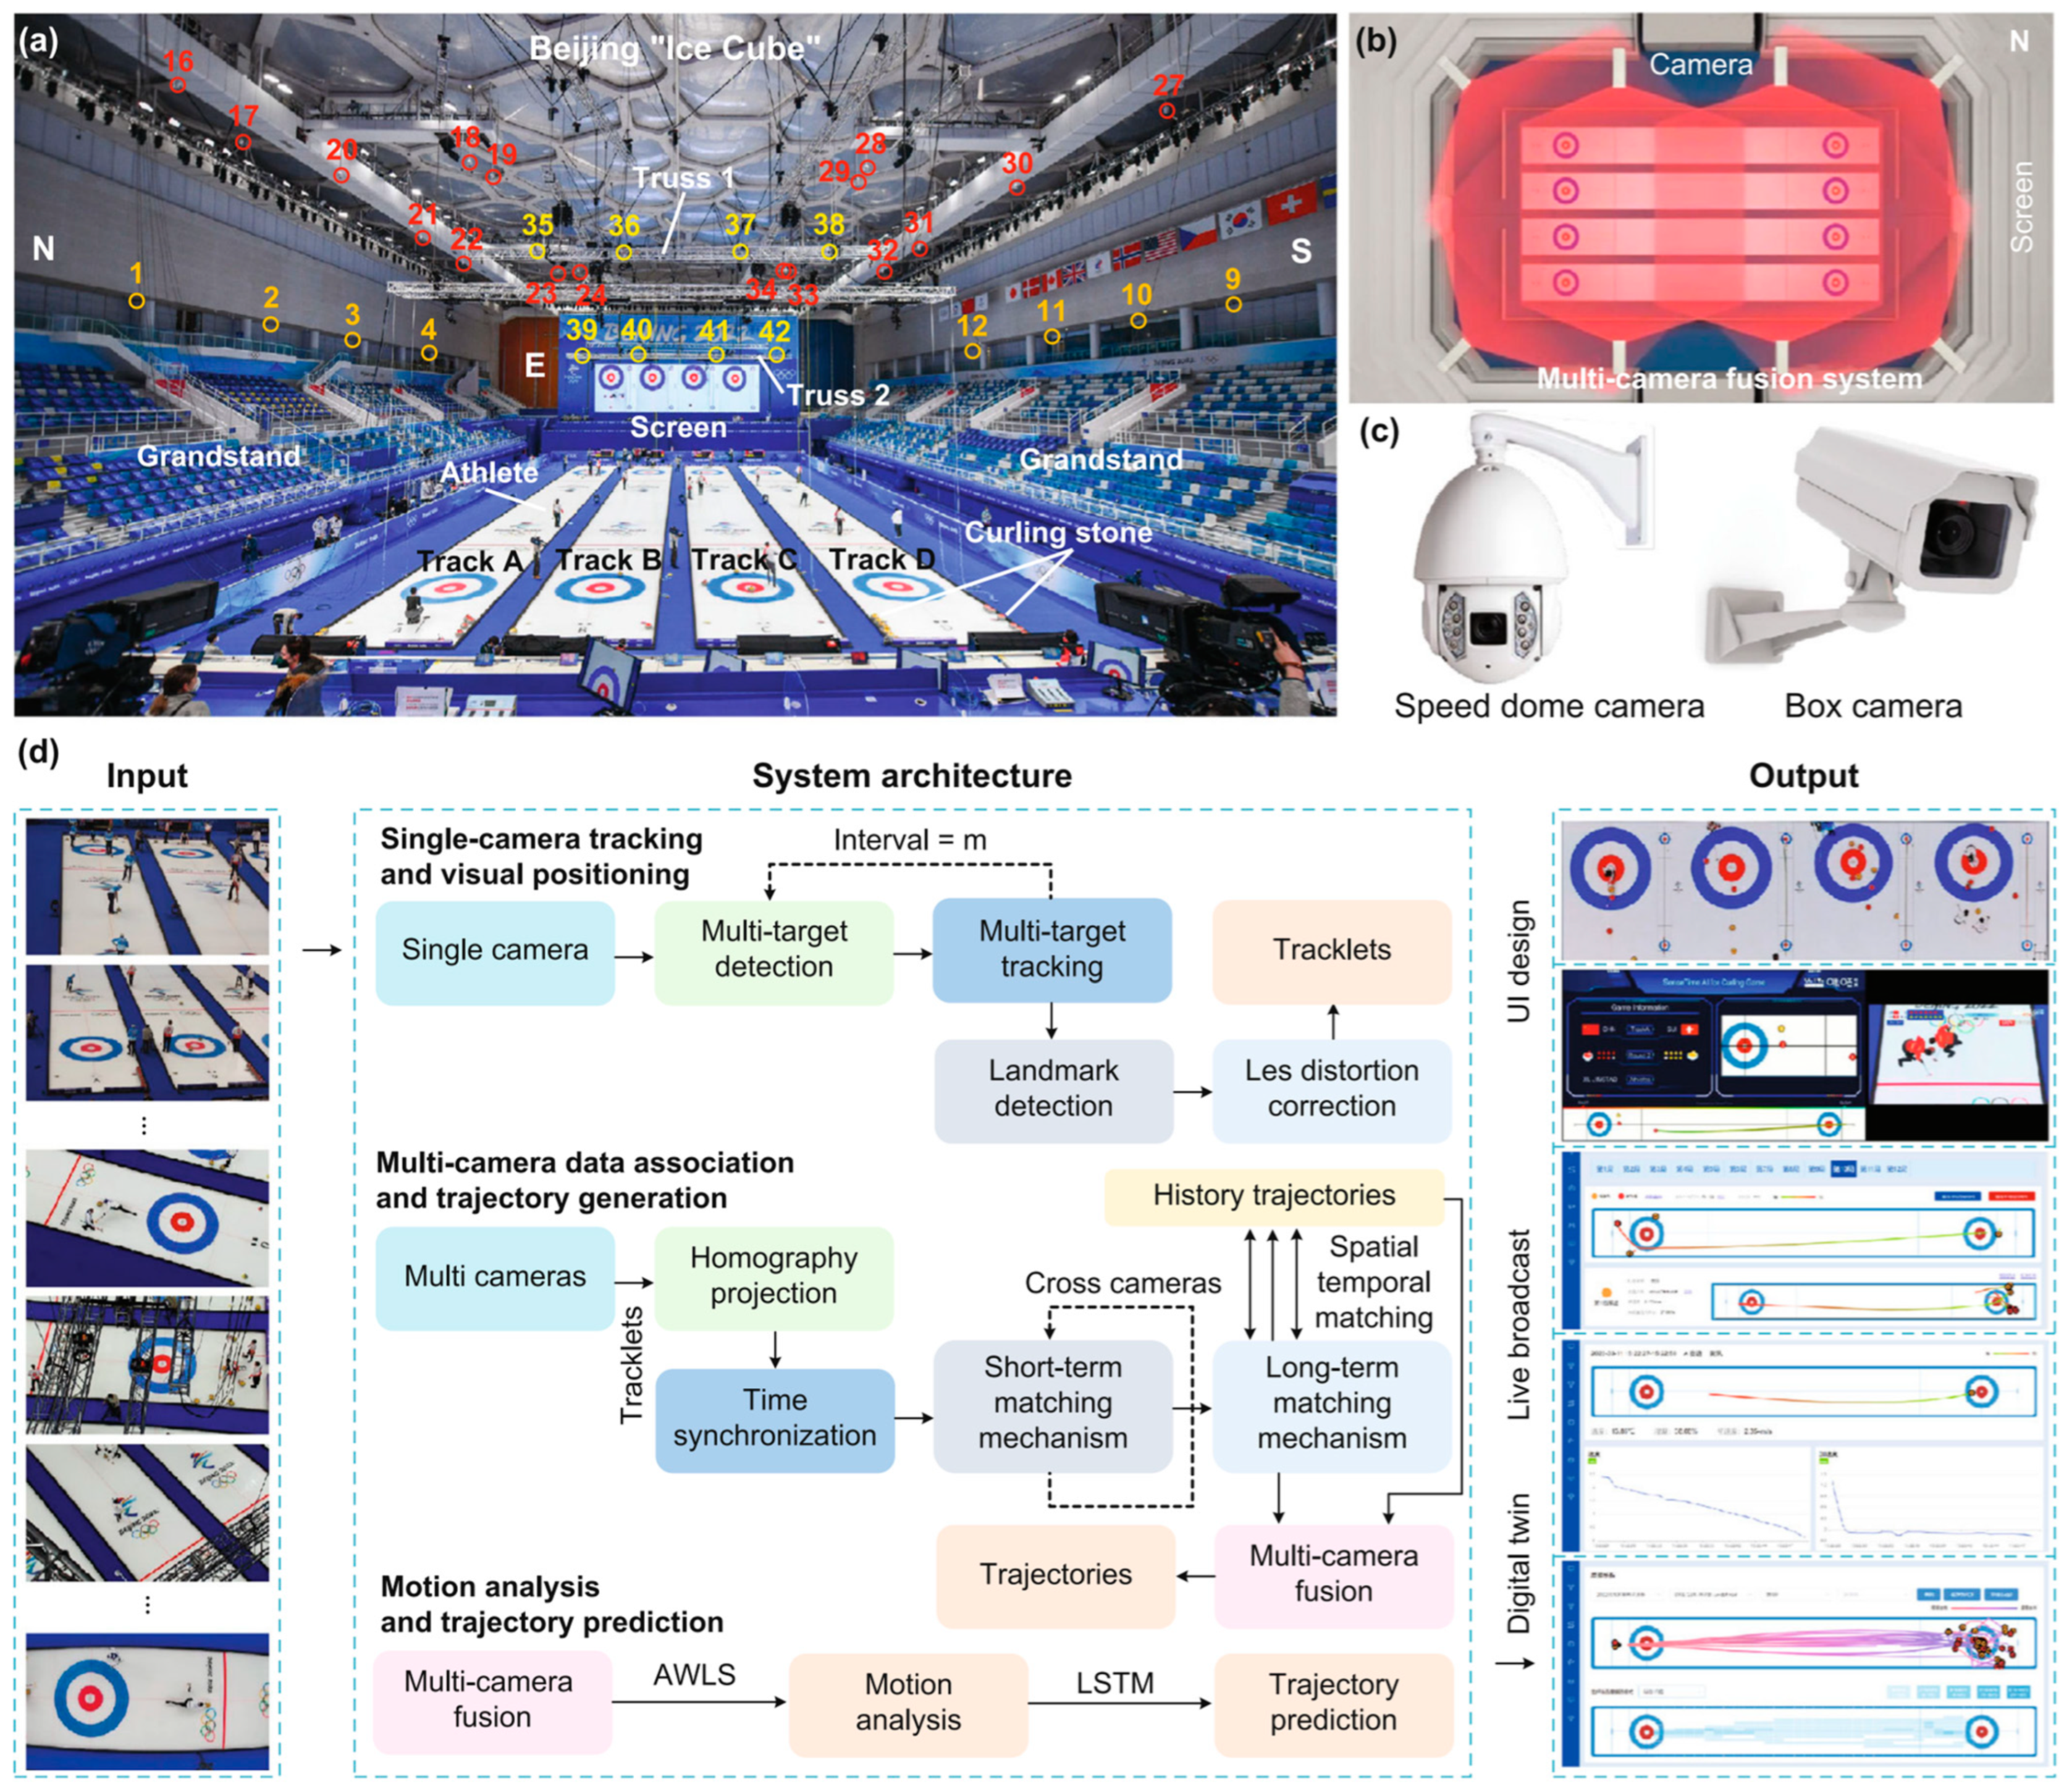
4.1. Relationship between the Friction Coefficient and Speed
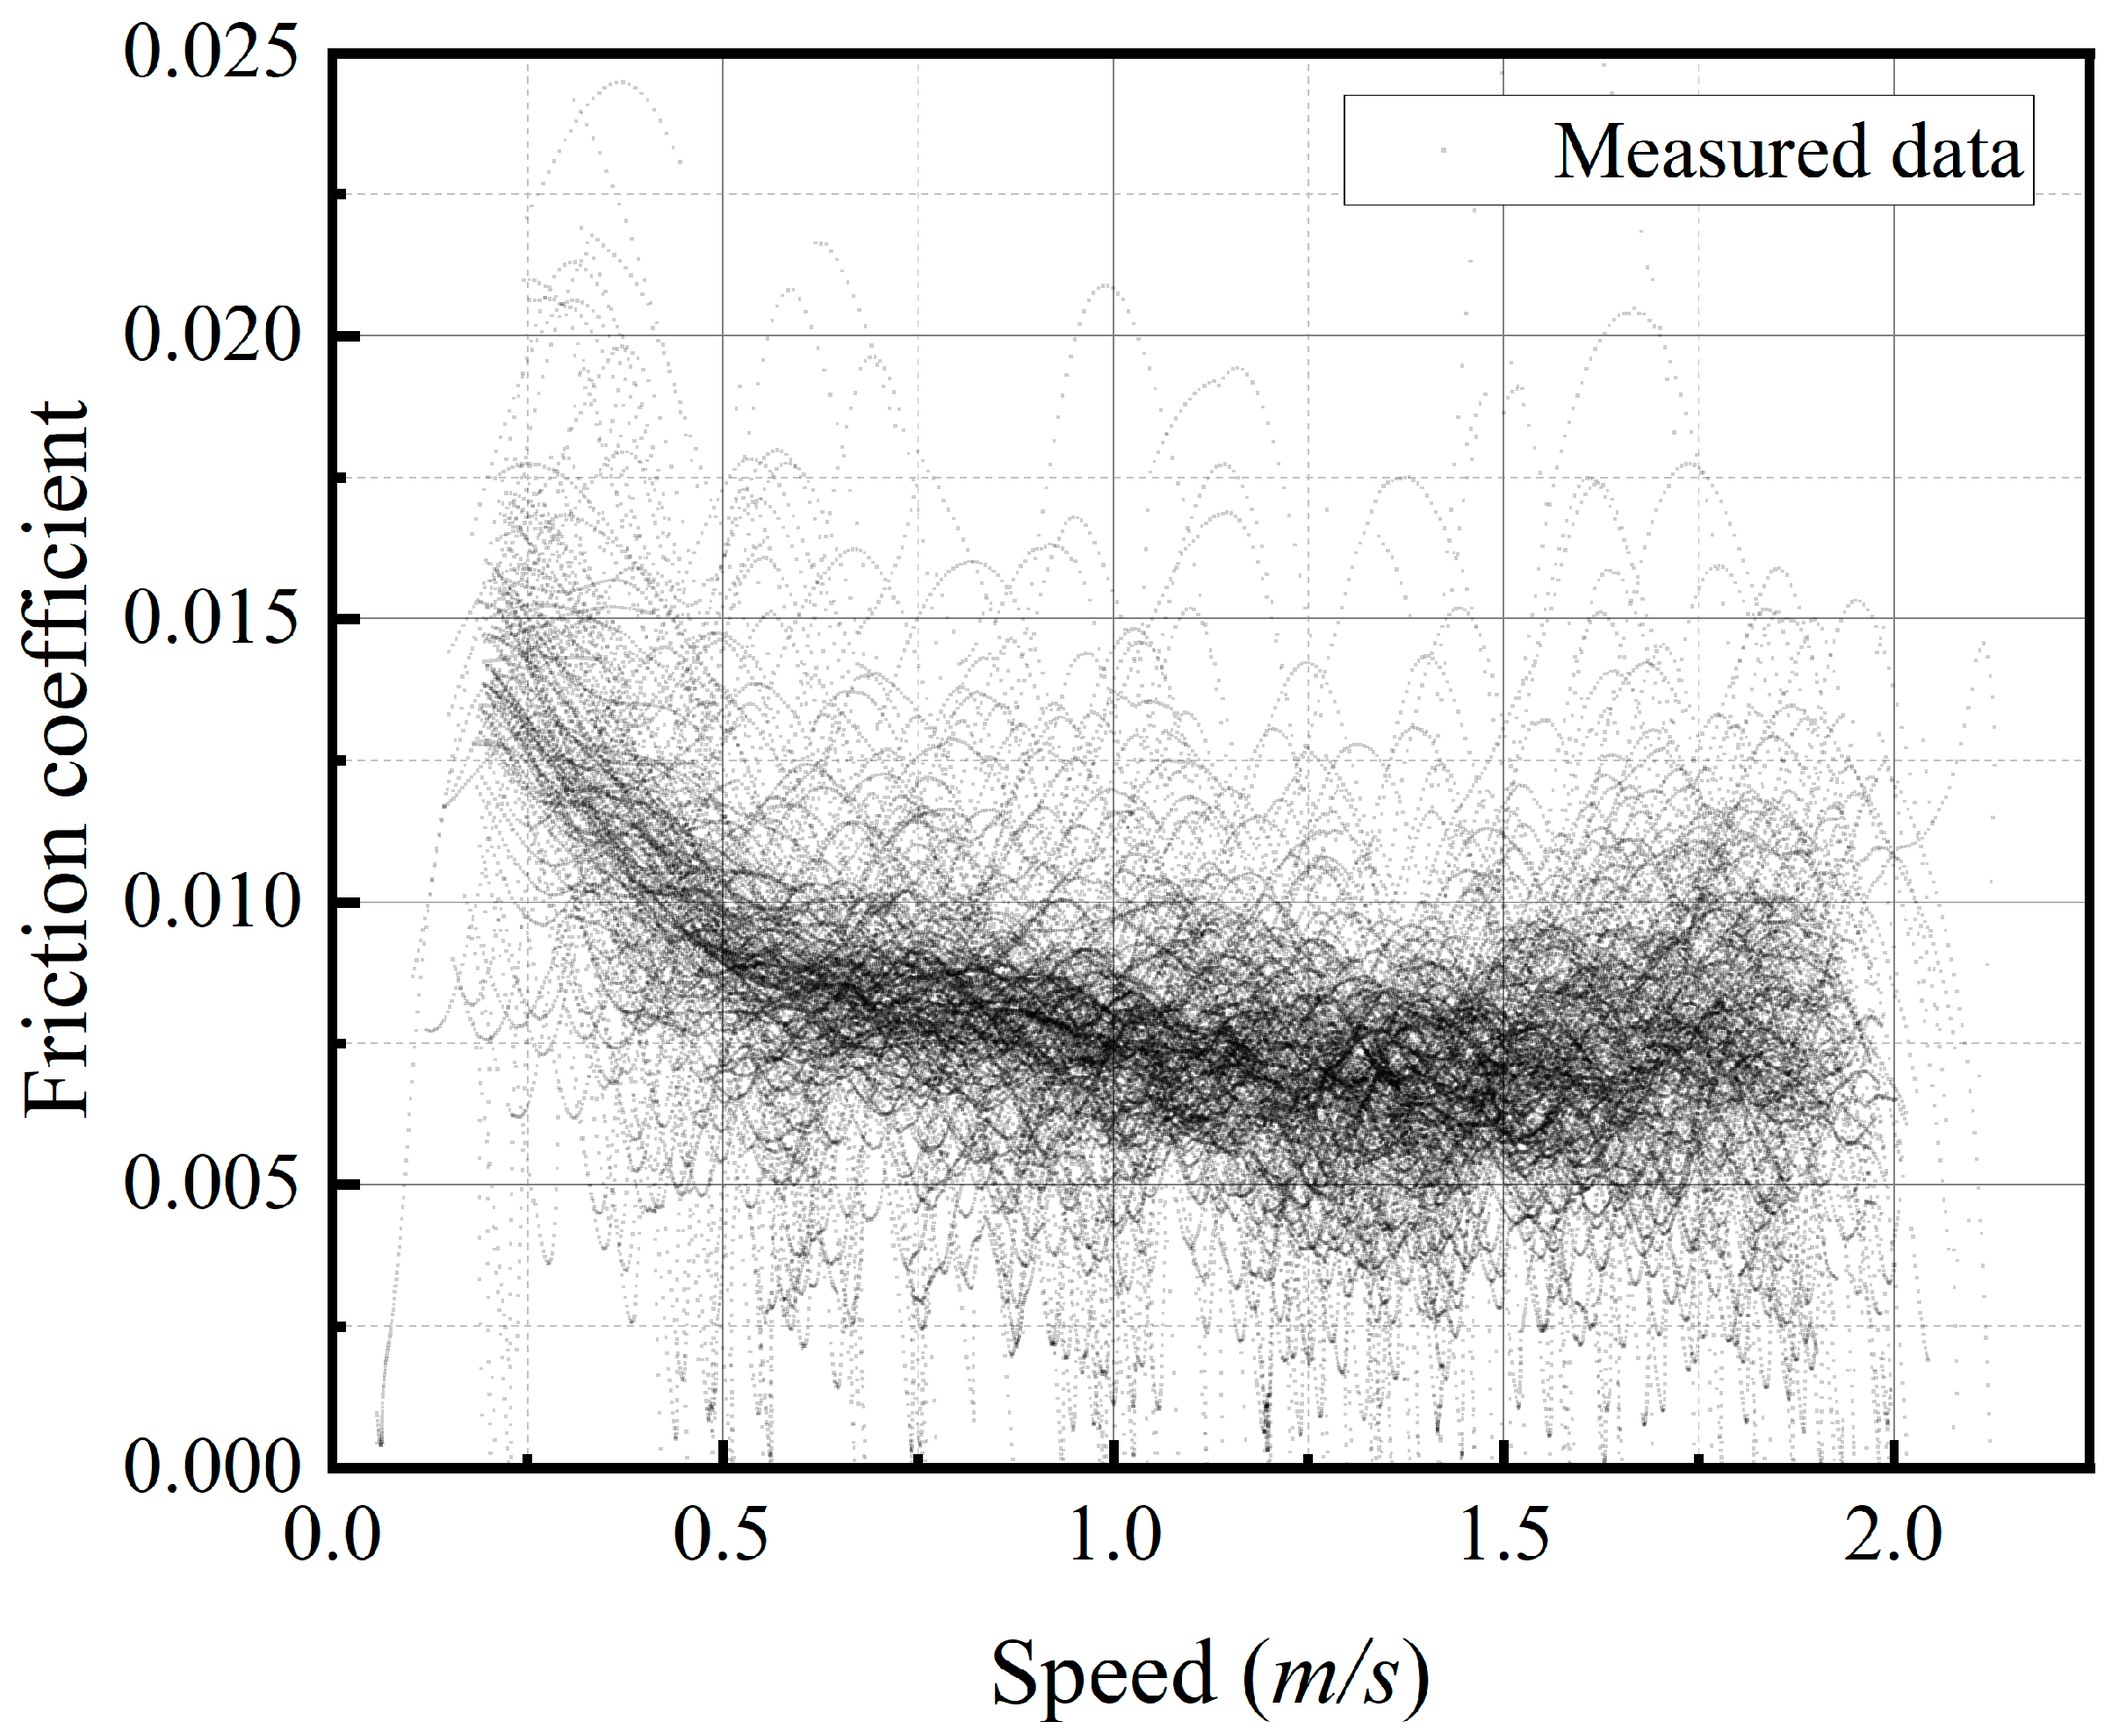
Figure 5 presents the influence of the sliding velocity on the friction coefficient between the ice and the curling stone. An extensive database containing 110,000 data points was plotted in this figure. Most of the measurement results fluctuate in the dark area, showing that local non-uniform factors strongly influence the coefficient of friction. The ice surface quality is determined by the ice maker, the ice surface wearing is caused by the overlapped curling trajectory, and the tracking error on the coordinates described in the CurlingHunter system all affect the local, instantaneous coefficient of friction. The friction coefficient and acceleration are extremely sensitive to error because they result from differentiating twice over time. It is more practical to use average friction coefficients for sub-regions.
Therefore, statistical methods were adopted to present video recognition results better, as shown in
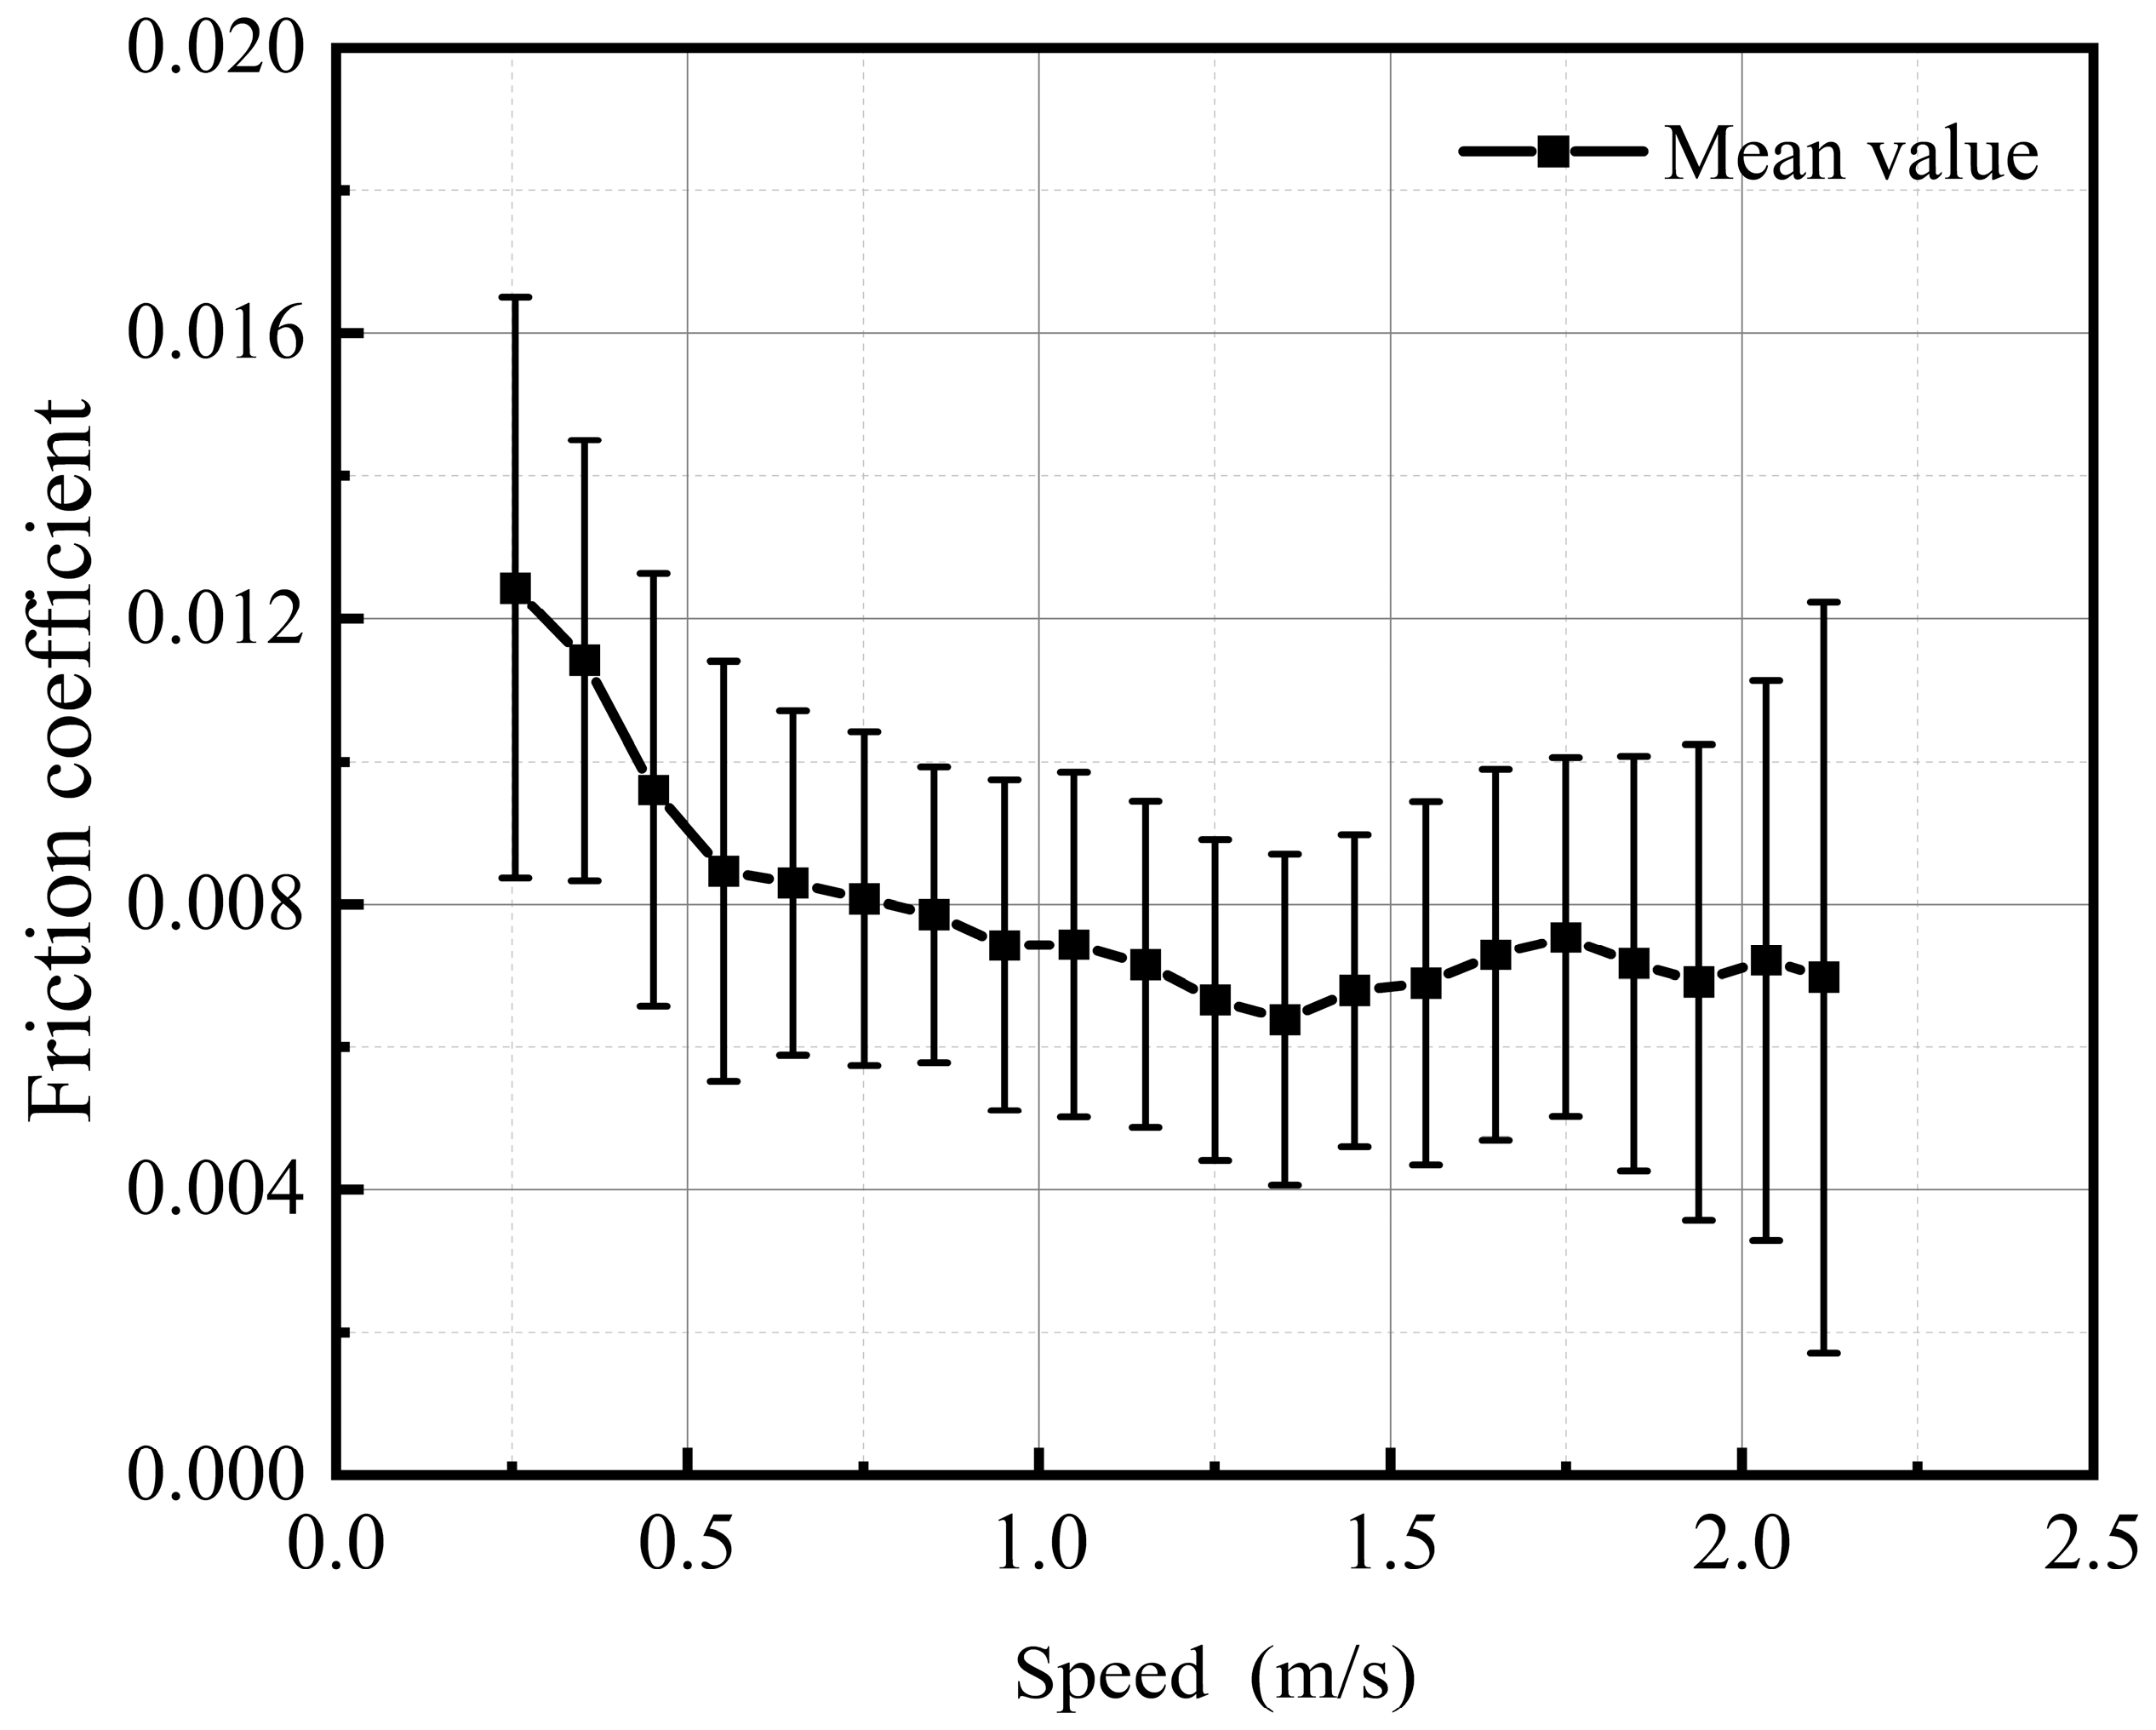
Figure 6. The speed range was divided into 20 groups (0.2~0.3 m/s, 0.3~0.4 m/s, …, 2.1~2.2 m/s), and the average value and corresponding standard deviation of the friction coefficient in each interval were calculated. It can be seen from
Figure 6 that the curling stone on the ice had a low coefficient of friction, ranging from 0.007 to 0.012. The friction coefficient, belonging to a mixed lubrication regime, showed descent as the curling stone sliding velocity increased. This is consistent with the law of the effect of speed on the friction coefficient as described by Li [
28], indicating the reliability of the measurement method based on artificial intelligence.
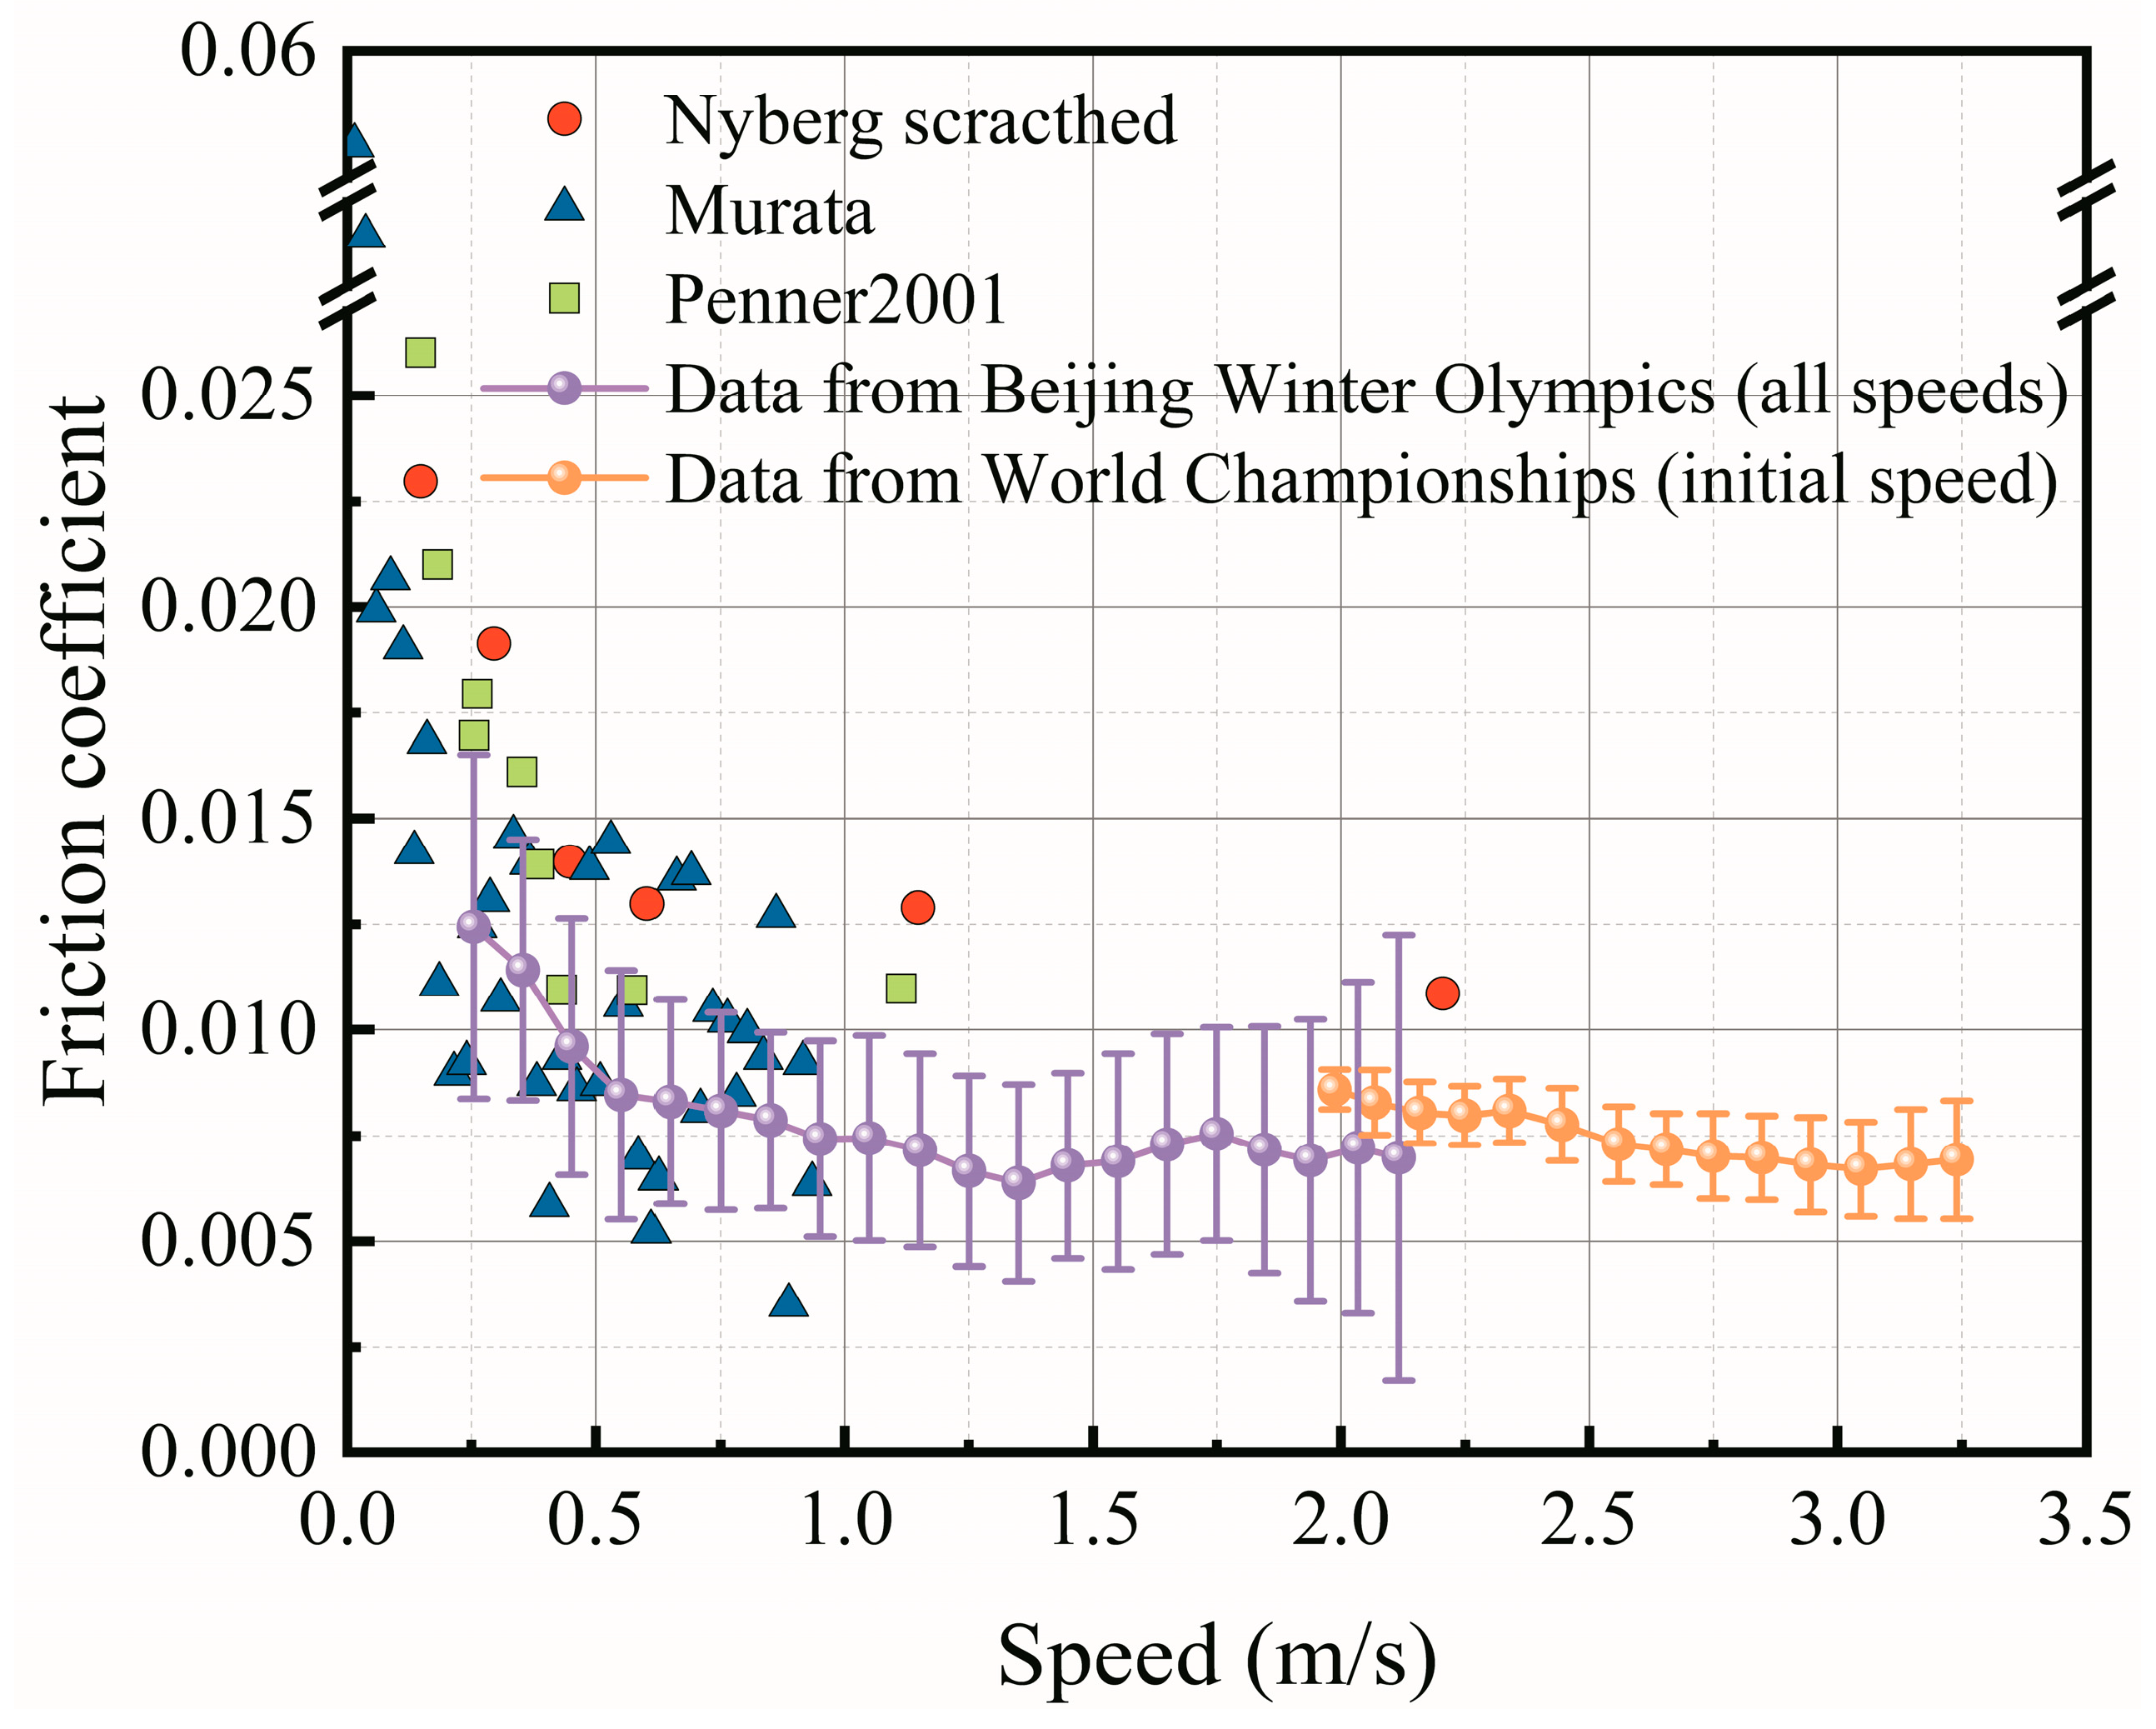
As presented in
Figure 7, this research obtained the relationship data from the World Championship. It can be noticed that the data from the World Championship and those from the Beijing Winter Olympics show the same trend of variation. Because the ice rink quality of the Beijing Winter Olympics is better than that of the World Championship (proved in
Section 4.4), the relationship curve of the Beijing Winter Olympics is lower than that of the World Championship. In addition, publicly available friction data of curling stones based on experimental measurements were also collected to compare with our obtained values. It can be noted that the friction coefficient in our work was mainly measured at speeds of 0.25 m/s to 3.25 m/s, whereas the literature data were primarily obtained at speeds of less than 1.0 m/s. Regarding the speed dependency of friction, the literature data agreed with our measured results. This research obtained a large amount of data on the relationship between the friction coefficient and speed, which provides an abundant reference for future relevant research.
4.2. Quality Assessment Indicator of the Curling Ice Rink—α
Lozowski et al. [
25] derived a friction coefficient function based on thermodynamic equilibrium without considering the details of dry and wet friction. Based on the assumption that the total friction force exerted on the curling stone is composed of the shear stress force and the plowing force, the numerical model of the stone–ice friction coefficient is expressed as Equation (1). Although this model bypasses the role of periodic roughness of the running band, which is an essential aspect of the actual game, it is still enough to model the sliding process of the curling stone in the case of only translation without rotation.
with
where the variables and parameters are defined in
Table 1. Units, ranges, and standard values are indicated in square brackets.
According to the research results of Barnes and Tabor [
30], at temperatures lower than about −1.2 °C, the indentation hardness (
H) of the ice obtained with a spherical indenter is approximately linearly correlated with the temperature. As a result, the hardness of the ice can be expressed as Equation (8), a relationship only related to the temperature. It is convenient to use this relationship because the temperature can be directly obtained from the monitoring data of Olympic games and post-Olympic games.
where
H is the hardness of the ice in MPa,
Ti is the temperature of the ice in °C, and
C1 = −3.43 and
C2 = 16.34 (by linear fitting) with a minimum contact time of 10 s [
30].
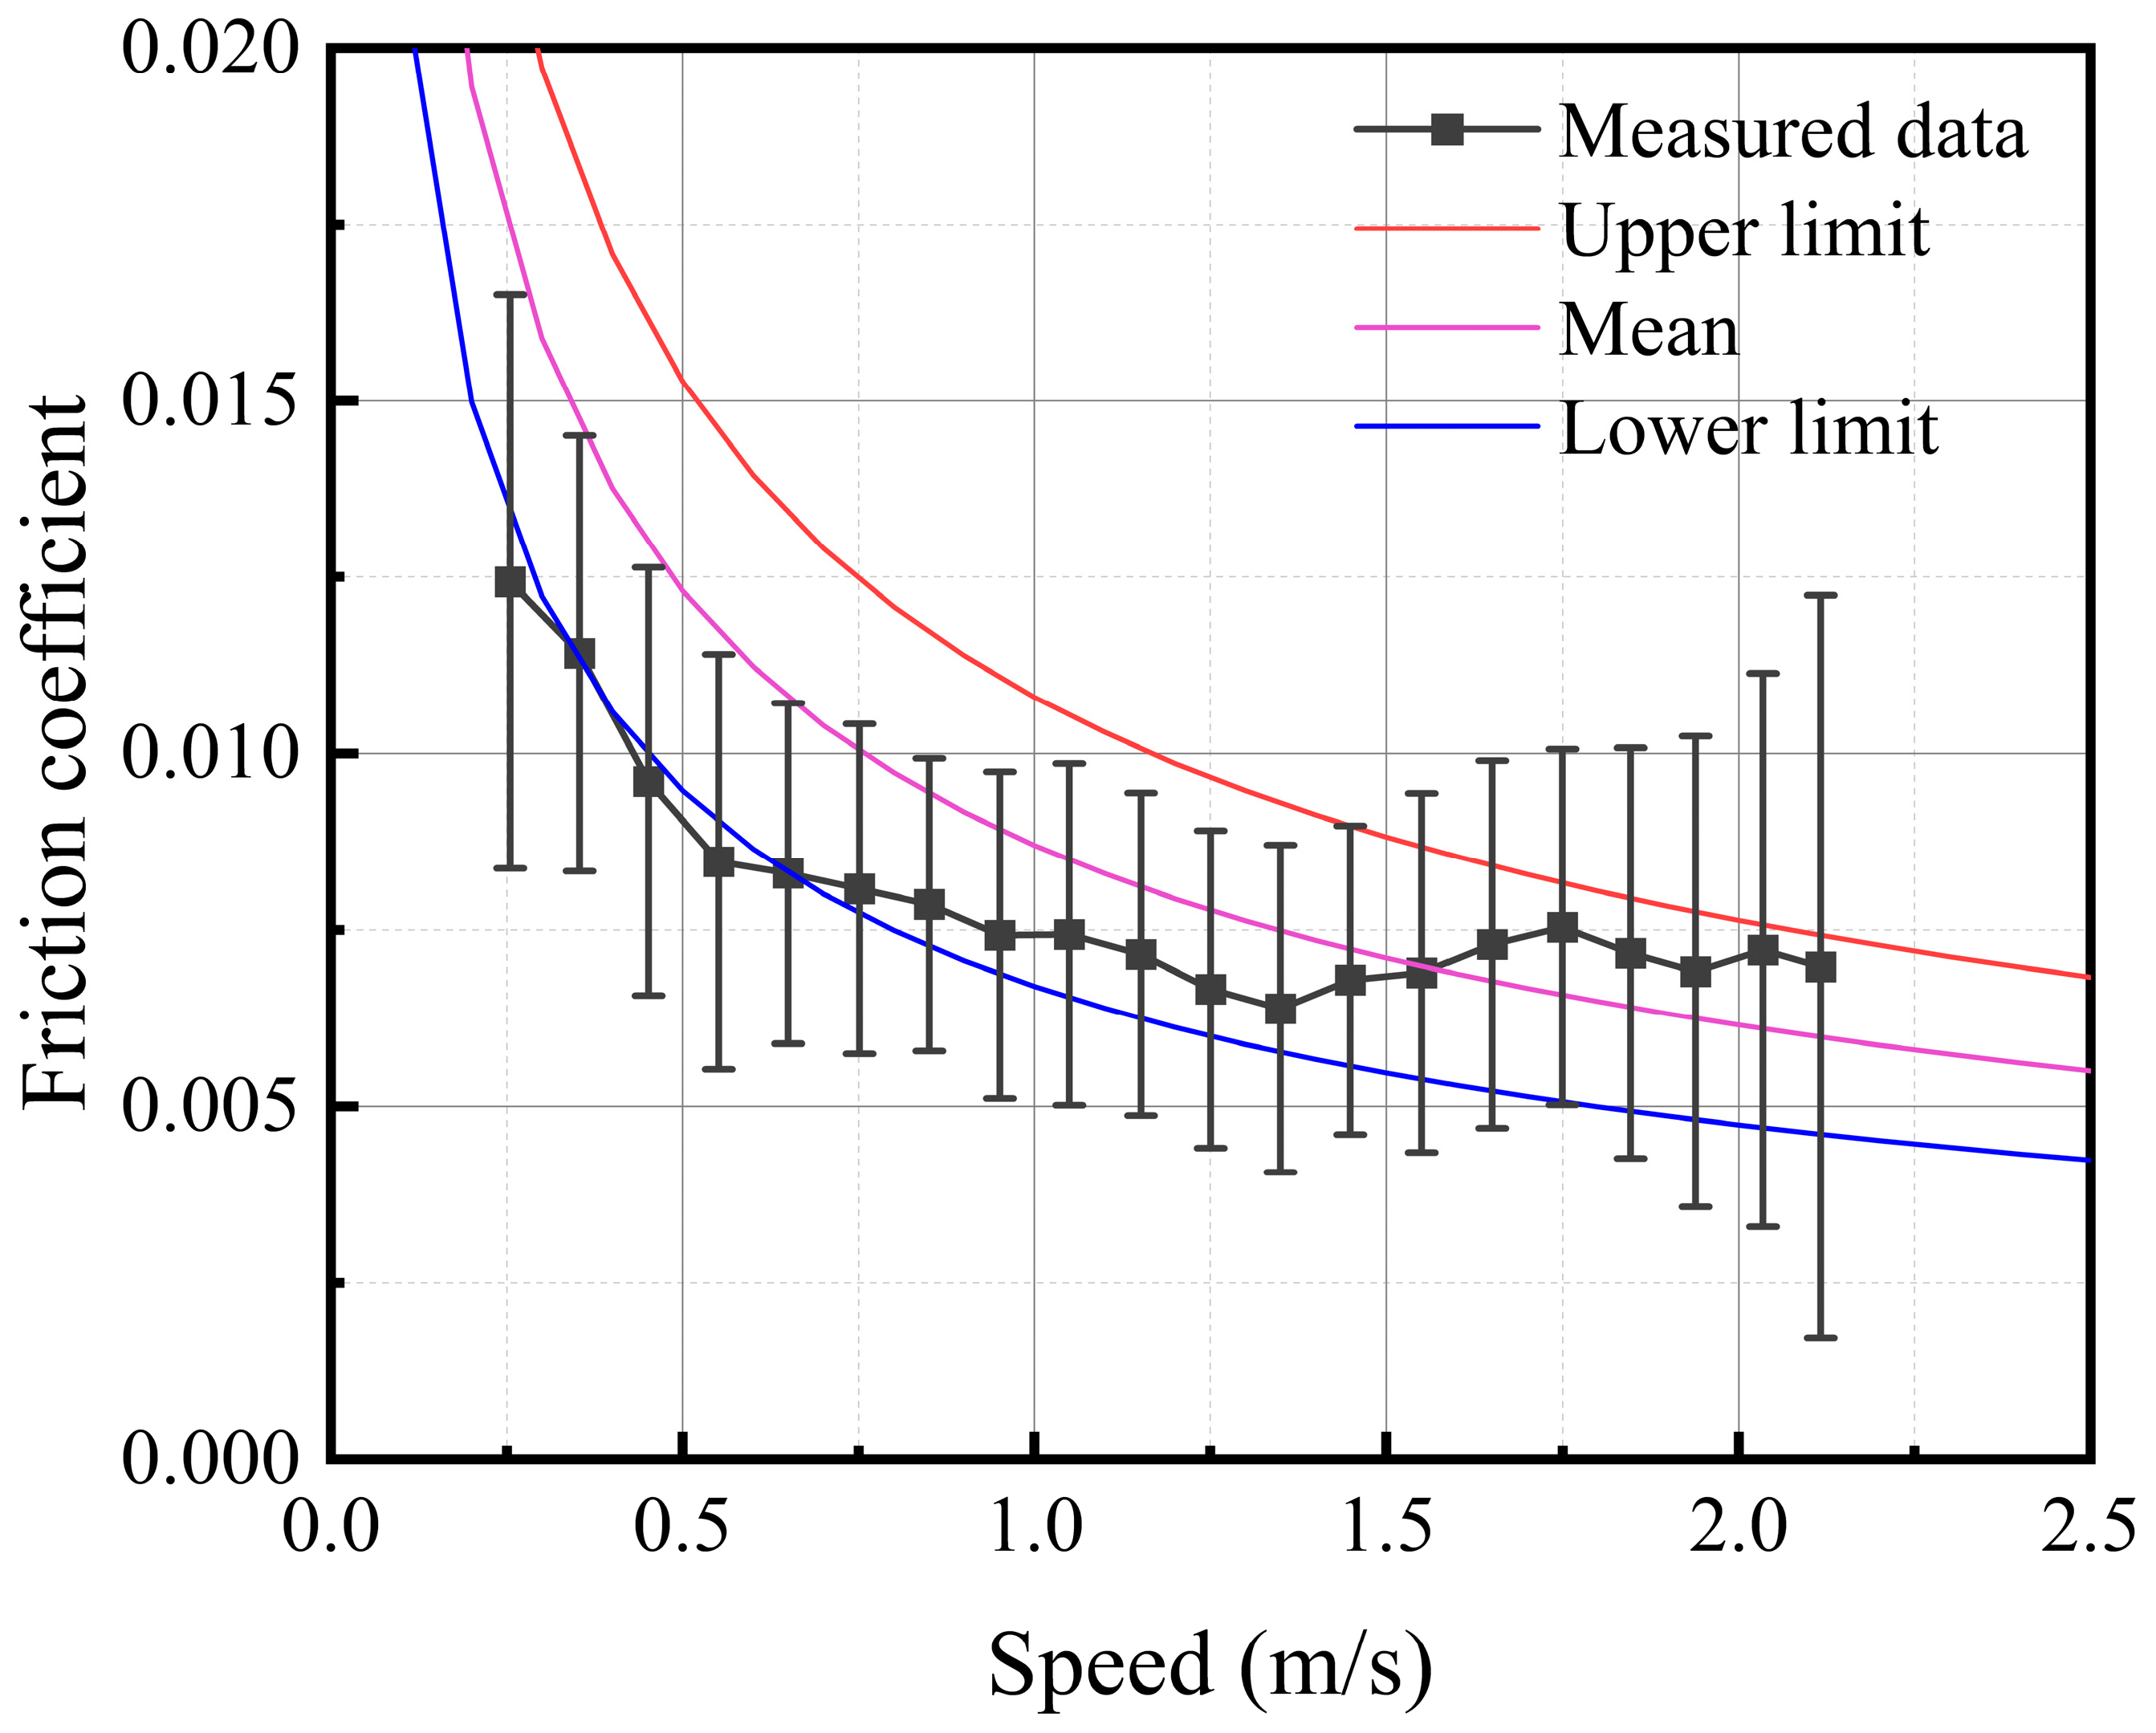
Figure 8 presents the obtained results from on-site measurement (the same as
Section 4.1) and the values calculated by the Lozowski model [
25]. It can be noticed that when the stone’s speed is slow, the measured data are close to the lower limit, and when the stone’s speed is high, the measured data are close to the upper limit. Most of the video recognition results in this study are within the range of the upper and lower limits predicted by the Lozowski model, demonstrating that the model can quantitatively describe the relationship between the friction coefficient of the ice rink surface and the speed of the curling movement. However, the Lozowski model still deserves further improvement.
It can be noticed from Equation (5) that the calculation result of
tb is a range of values. As a result, the calculation result of
μ is also a range of values, and it is inconvenient to assess the value of the friction coefficient on different curling rinks. In this case, the average of the upper and lower limits during the
μ calculation is taken as the representative value of the friction coefficient for curling rinks. By substituting Equations (2)–(8) into Equation (1), the expression for the coefficient of friction can be obtained as Equation (9).
With
where
α is defined as the quality evaluation indicator of the curling ice rink. It can be used to comprehensively assess the ice quality of a curling rink and reflects the effect of all aspects on the friction coefficient, other than the speed of the curling stone.
α is calculated based on a number of important factors, including the temperature of the ice surface, the radius of the top contact of a pebble, the width of the curling stone RB, the inner radius of the curling stone RB, and some constants related to heat conduction. This indicator is essential because it can be used as a critical assessment of the quality of different curling ice rinks, and it provides a standardized method of assessing ice quality for the sport of curling, ensuring fairness and consistency of play.
According to Equations (9) and (10), it can be noticed that the higher ice surface temperature, the softer ice, the bigger pebble size, as well as the wider curling stone RB, all result in a smaller α. The smaller the value α is, the lower the friction coefficient μ at the same speed, and the higher the manufacturing quality of the curling ice rink. The calculation of specific α will be based on actual field measurements, but, in practice, it can help curling venue managers to monitor and improve the ice quality to ensure consistent playing conditions. This parameter will play an important role in curling.
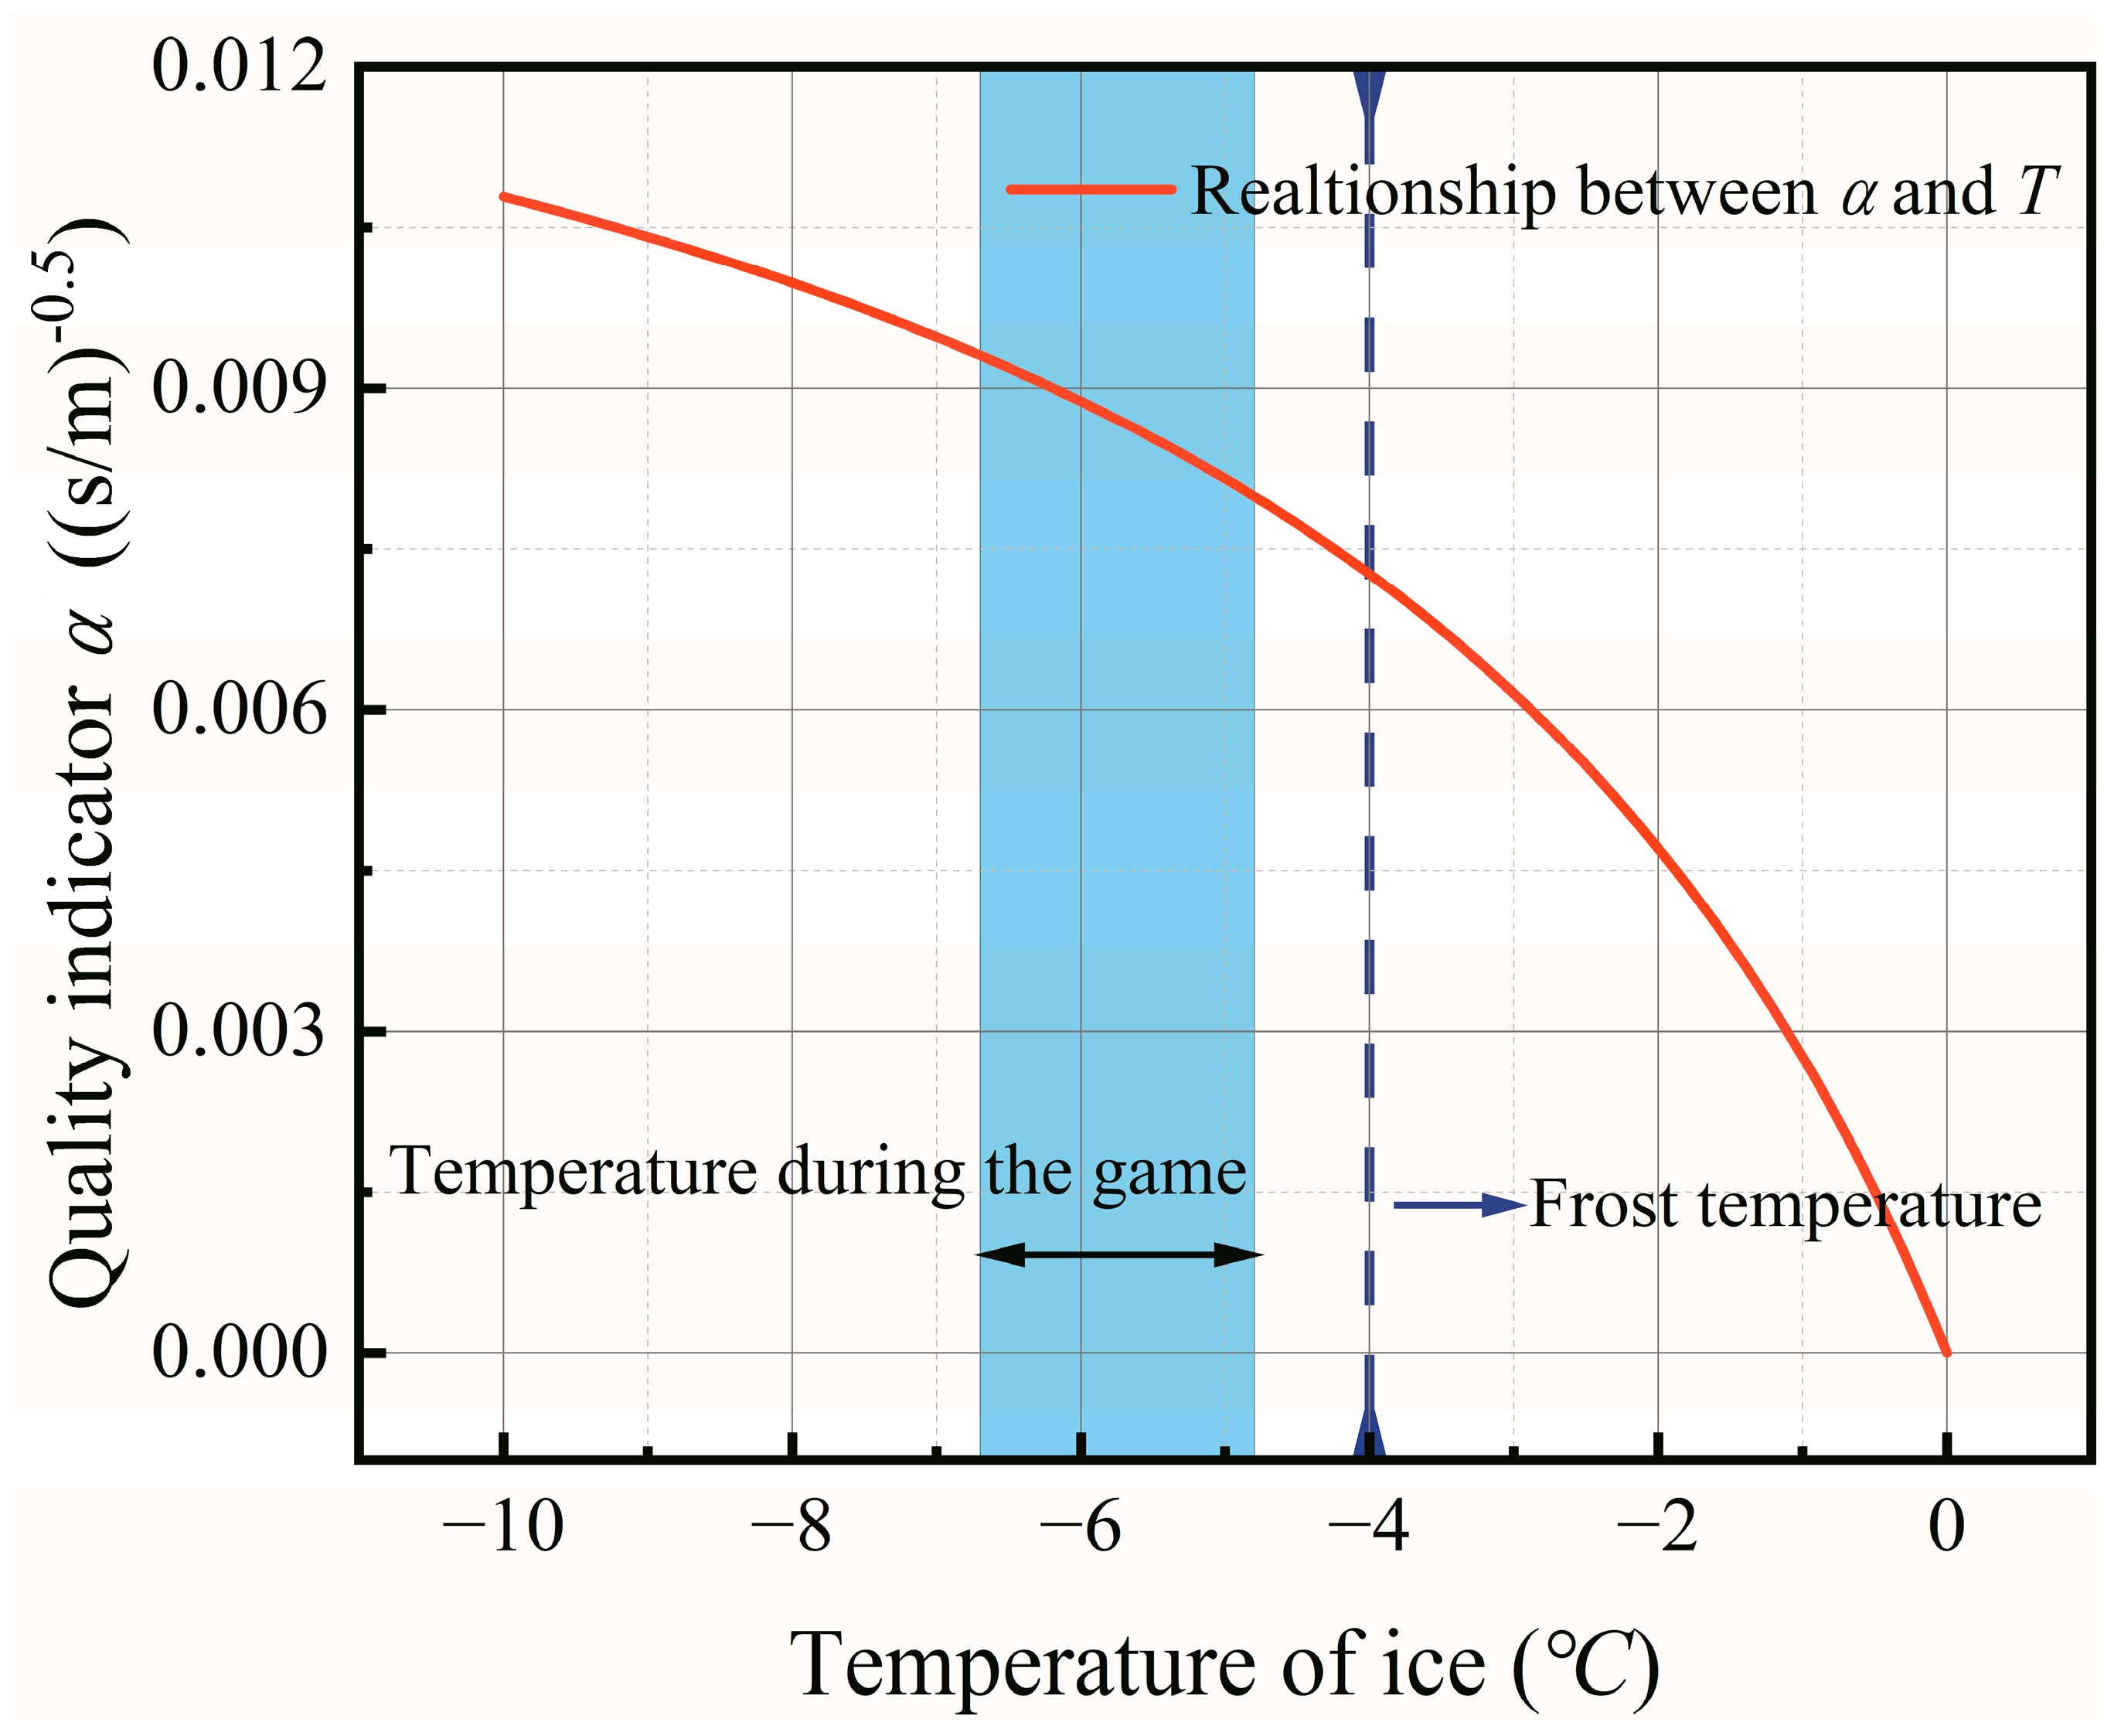
According to the descriptions of the national team athletes, the factors affecting the quality of the curling rink were ranked from most significant to most minor, among which the most influential was temperature. Therefore, it was necessary to study the relationship between the quality evaluation indicator
α and the ice temperature, as shown in
Figure 9. As the temperature
T increases, the quality evaluation indicator
α decreases, and the rate of decrease continues to increase. When the temperature is high, the hardness of the ice is low, and the ice rink is slippery, the quality evaluation indicator is small. However, when the temperature exceeds −4 °C, it involves the issue of whether there is frost. If there is less frost, the ice rink will be very slippery; on the contrary, if there is more frost, the ice rink will not be slippery at all. The situation will become very complicated, and it is beyond the normal temperature of curling competitions. This part is out of the research scope of this paper.
By substituting the variables and parameters mentioned above into Equations (9) and (10), the quality evaluation indicator
α range can be found to be from 0.0083 to 0.0158, which is consistent with the value of
α (0.0087 for the Winter Olympics, 0.0119 for the World Championships) obtained by database fitting in
Section 4.4. It can also be found here that the quality evaluation indicator
α for the 2022 Beijing Winter Olympics is close to the lower limit of the theoretical calculation, indicating that smoother ice is produced at a specific temperature, which is close to the perfect ice surface expected by ice makers.
4.3. A Simplified Physical Model of the Stone-Sliding Process
Generally speaking, the motion of a curling stone on an ice rink is under the combined action of the translational and angular velocities. The translational motion of the stone is considered here, and it can be described as follows:
with
where
is the frictional force exerted on the stone;
m is the mass of the stone;
a is the acceleration of the stone;
is the friction coefficient between the stone and the pebbled ice;
g is the gravitational acceleration; and
L is the sliding distance until time
t.
Assuming that the friction coefficient is related to the sliding speed in the form of
μ = α v−0.5, we can rewrite Equation (11) as Equation (14)
in consideration of the initial physical condition of the stone sliding process in the actual situation (that is, first, at
t = 0, the sliding distance
L is 0; and, second, the speed at
t = 0 is
v0), which can be expressed as Equation (15):
By solving Equation (14), the sliding distance
L, the sliding time
t, the sliding velocity
v, and the sliding acceleration
a can be expressed as Equations (16)–(19), respectively.
4.4. Validation of the Physical Model
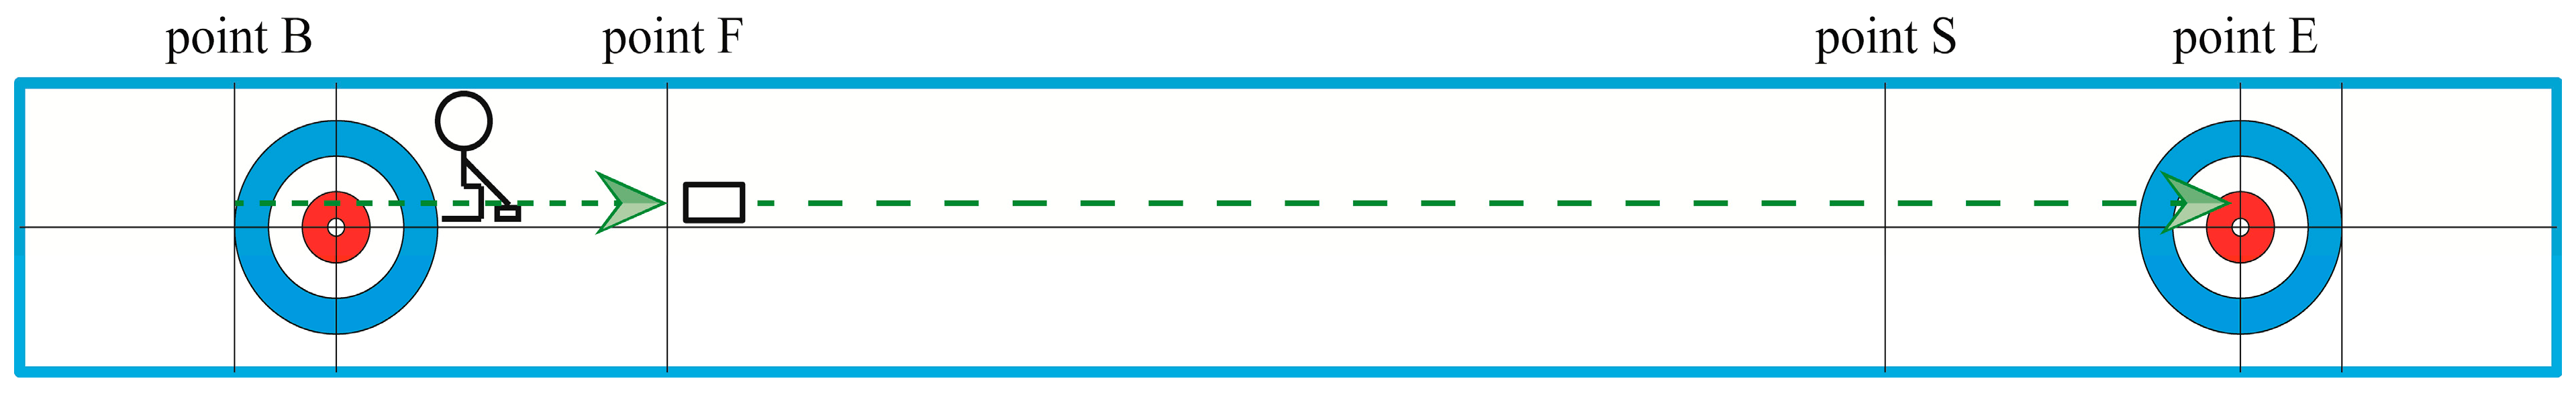
The diagram of the sliding process of the stone is shown in
Figure 10. The process corresponding to the long-time (the time it takes for the curling stone to travel between the two hog lines) is the stone sliding from point F to point S. Based on the previous simplified physical model, the relationship between the long-time and the initial speed and the relationship between the initial acceleration and the initial speed can be expressed as Equations (20) and (21), respectively.
where
tL is the long-time,
LL is the distance corresponding to
tL,
v0 is the initial velocity of the stone at the first hog line (point F),
αL is the quality evaluation indicator of the curling ice rink, and
a0 is the initial acceleration.
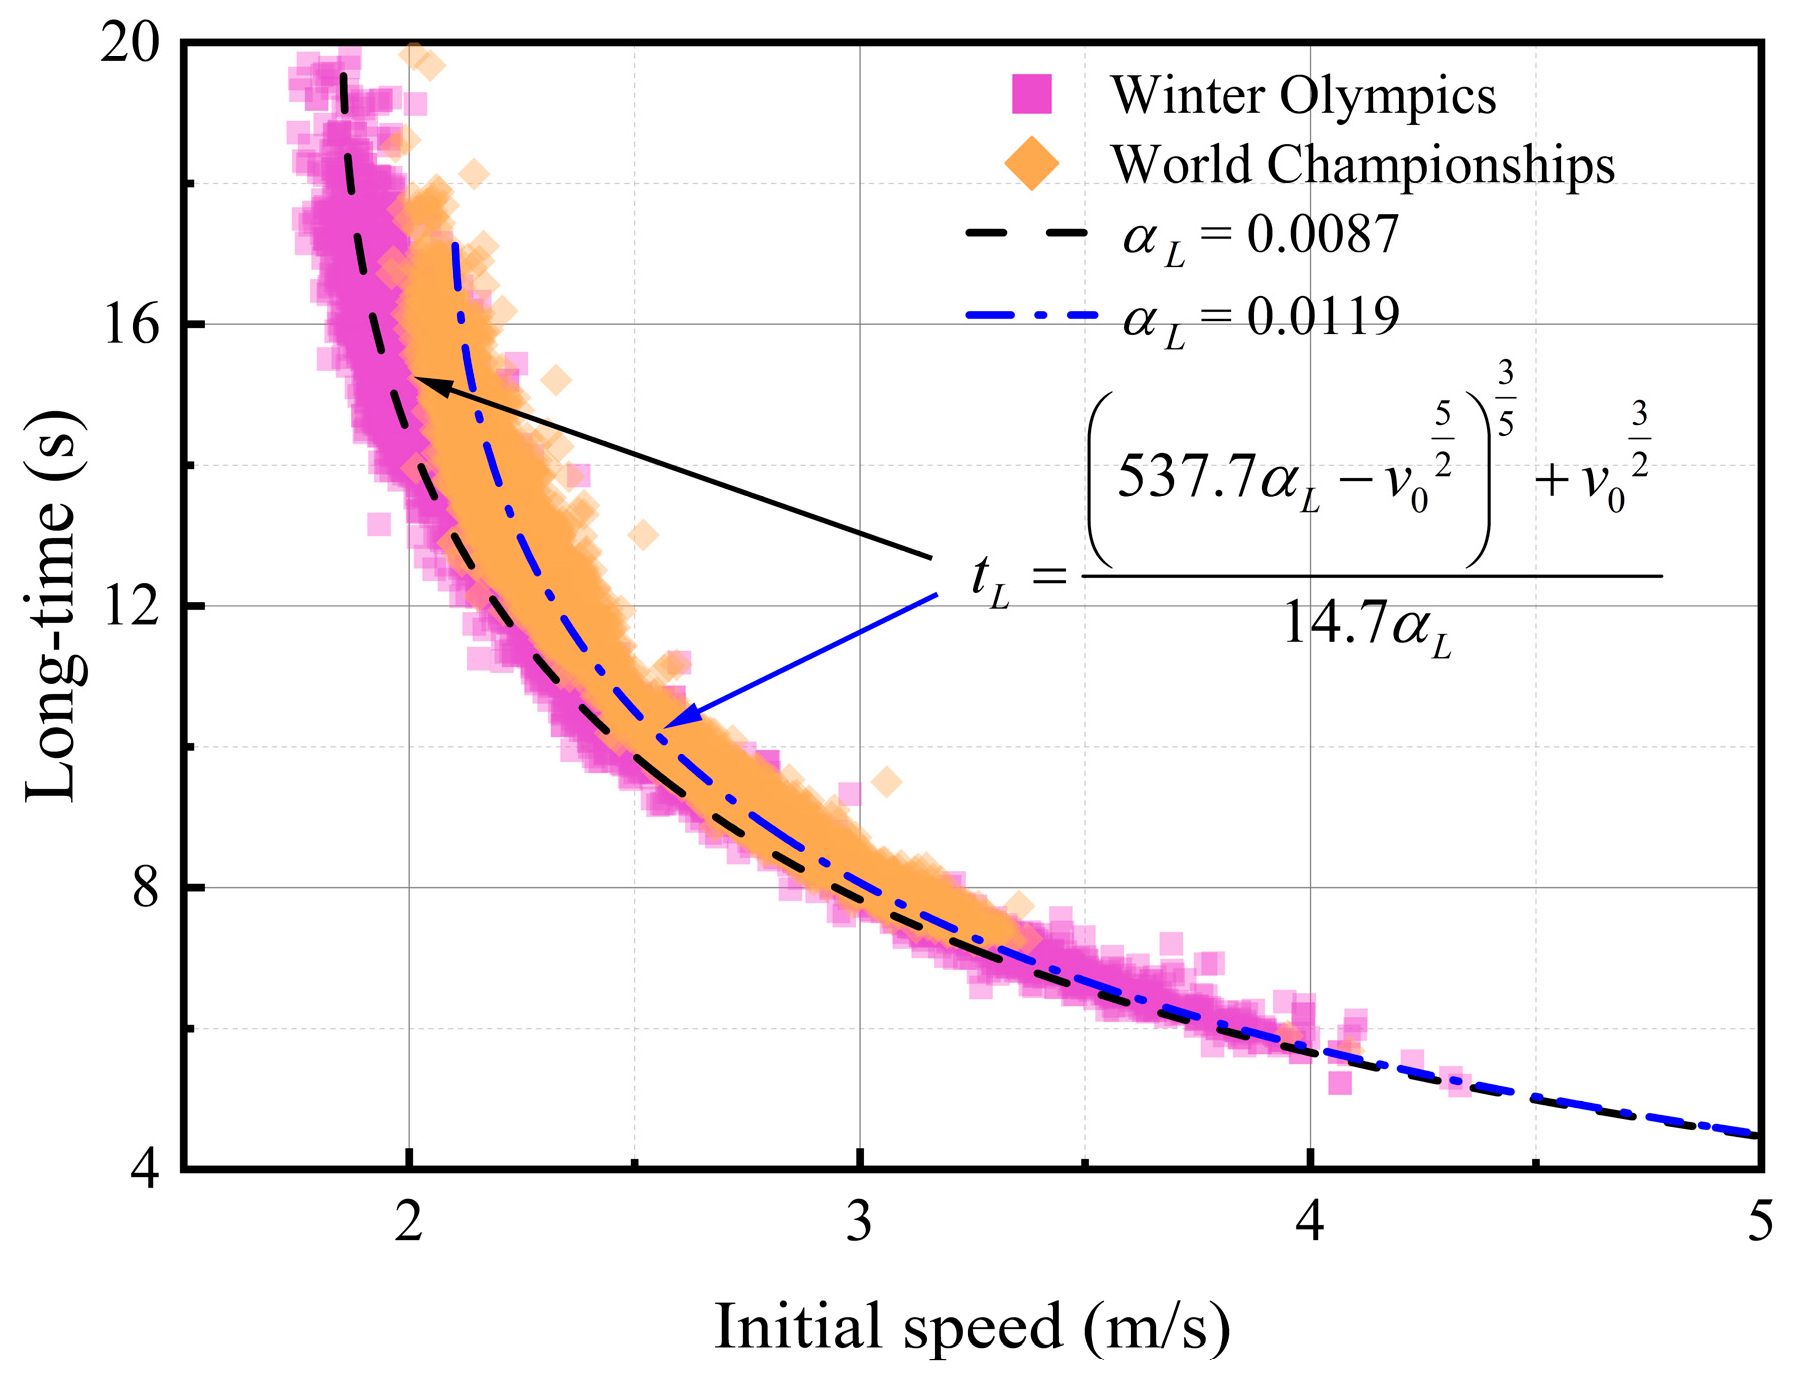
The results of 13,862 curling competitions from the database of the Beijing Winter Olympics and the World Championships are taken as examples.
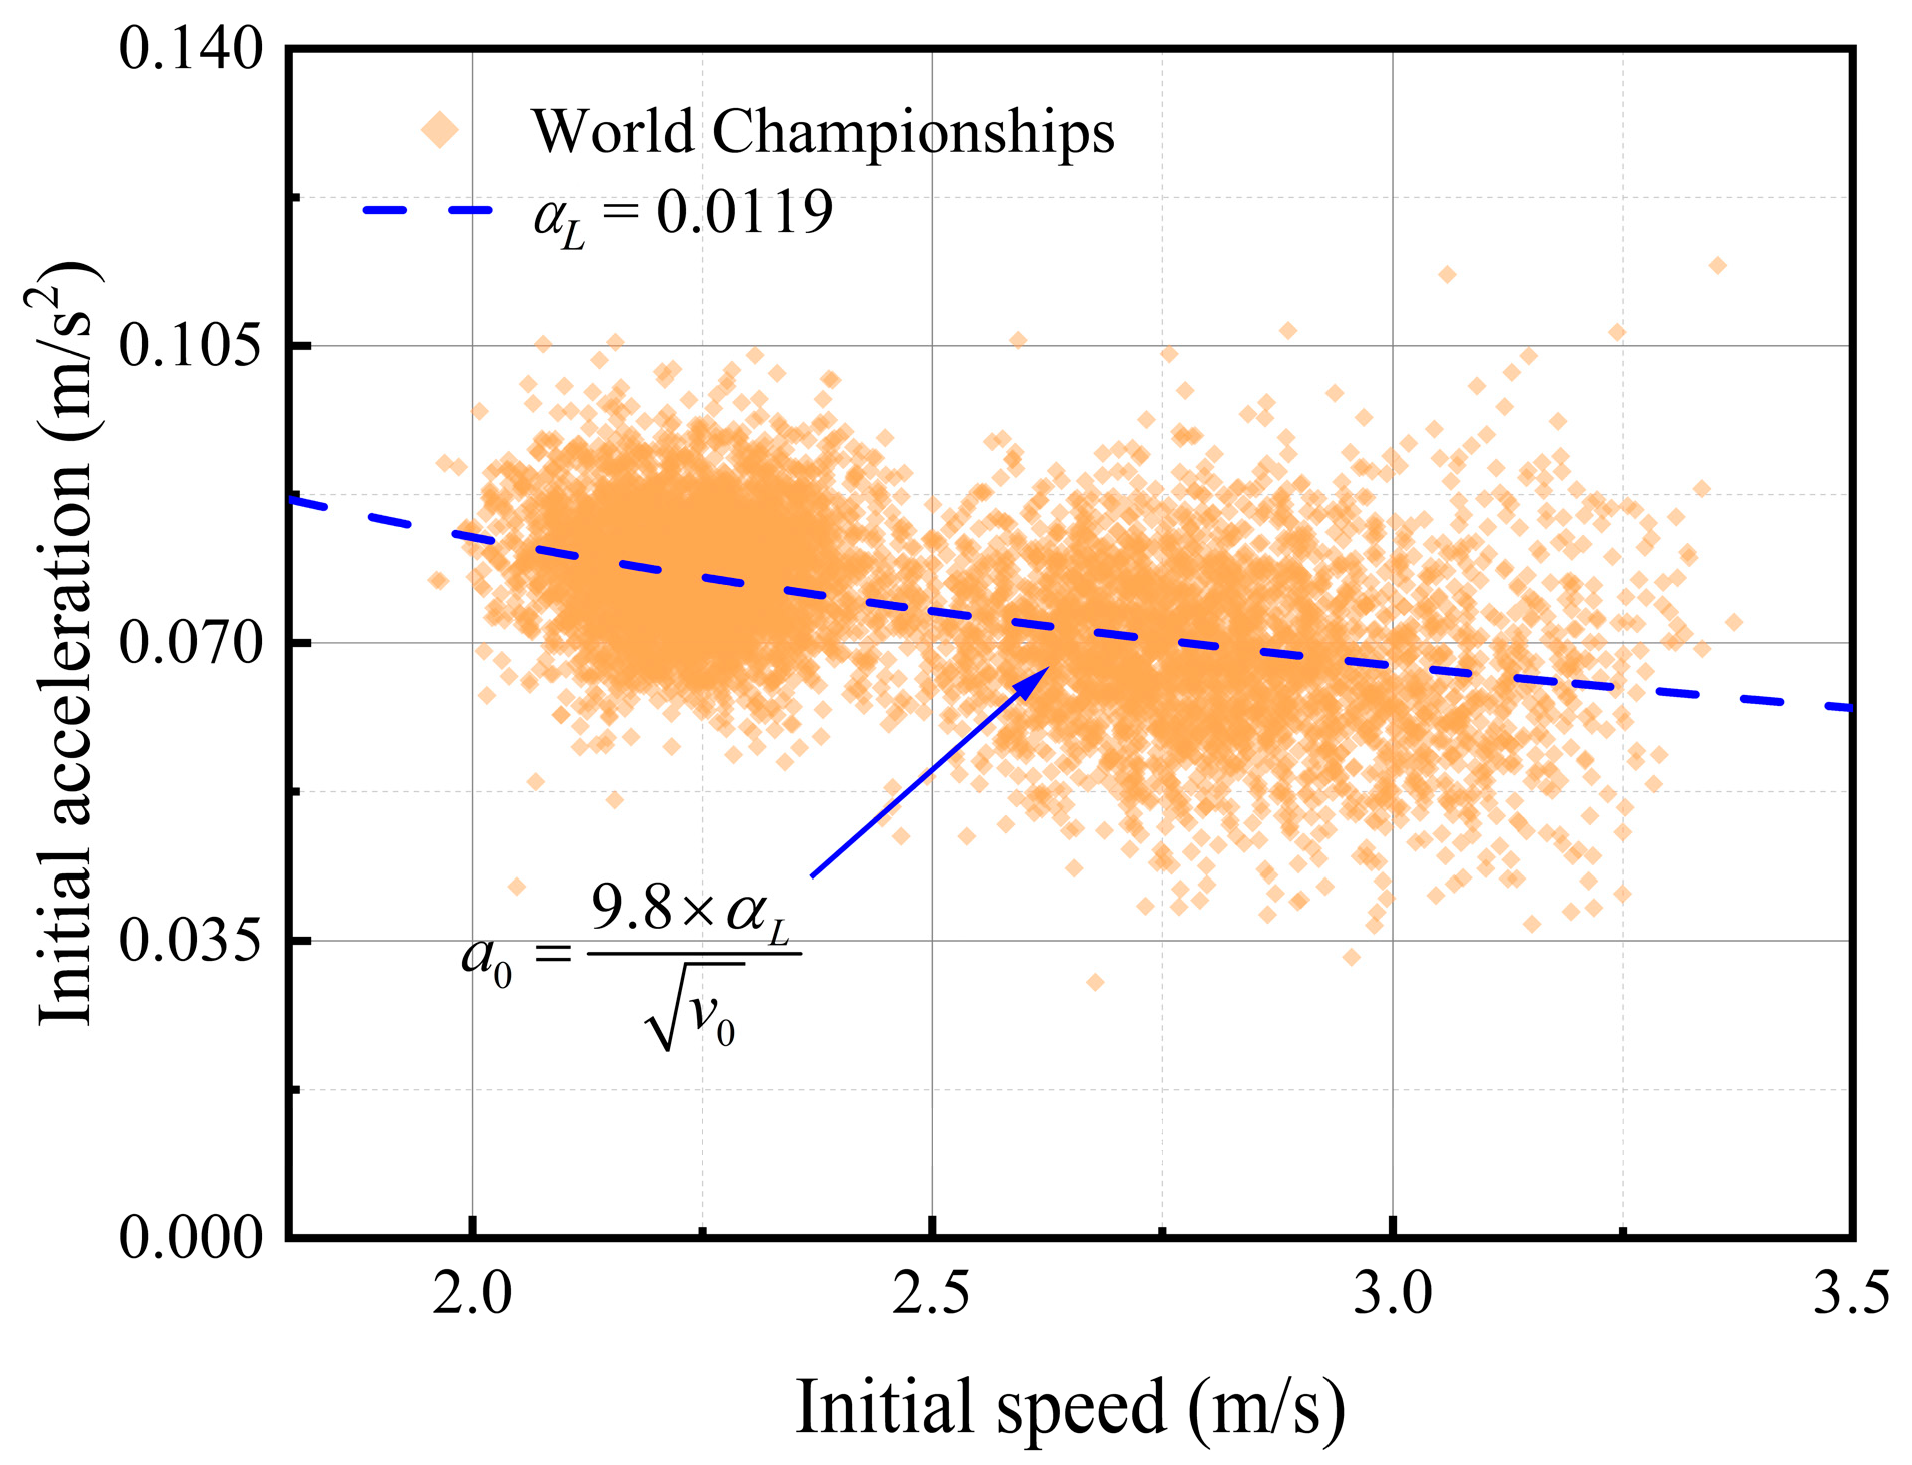
Figure 11 shows the relationship between the long-time and the initial speed, and
Figure 12 shows the relationship between the initial acceleration and the initial speed (the same data with
Figure 7). On the one hand, it can be found that when
αL is 0.0119, the results of Equations (20) and (21) can stay in good agreement with measured data from the World Championships simultaneously, which proves that the physical model can be used to describe the movement process. On the other hand, in
Figure 11, the two curves represent the Equation (20) calculation results corresponding to different coefficients
α. The
αL of the Beijing Winter Olympics is 0.0087, which is smaller than that of the World Championships, indicating that the level of craftsmanship of the ice rink of the Beijing Winter Olympics is better.
4.5. Relationship between the Long-Time and the Stop Location
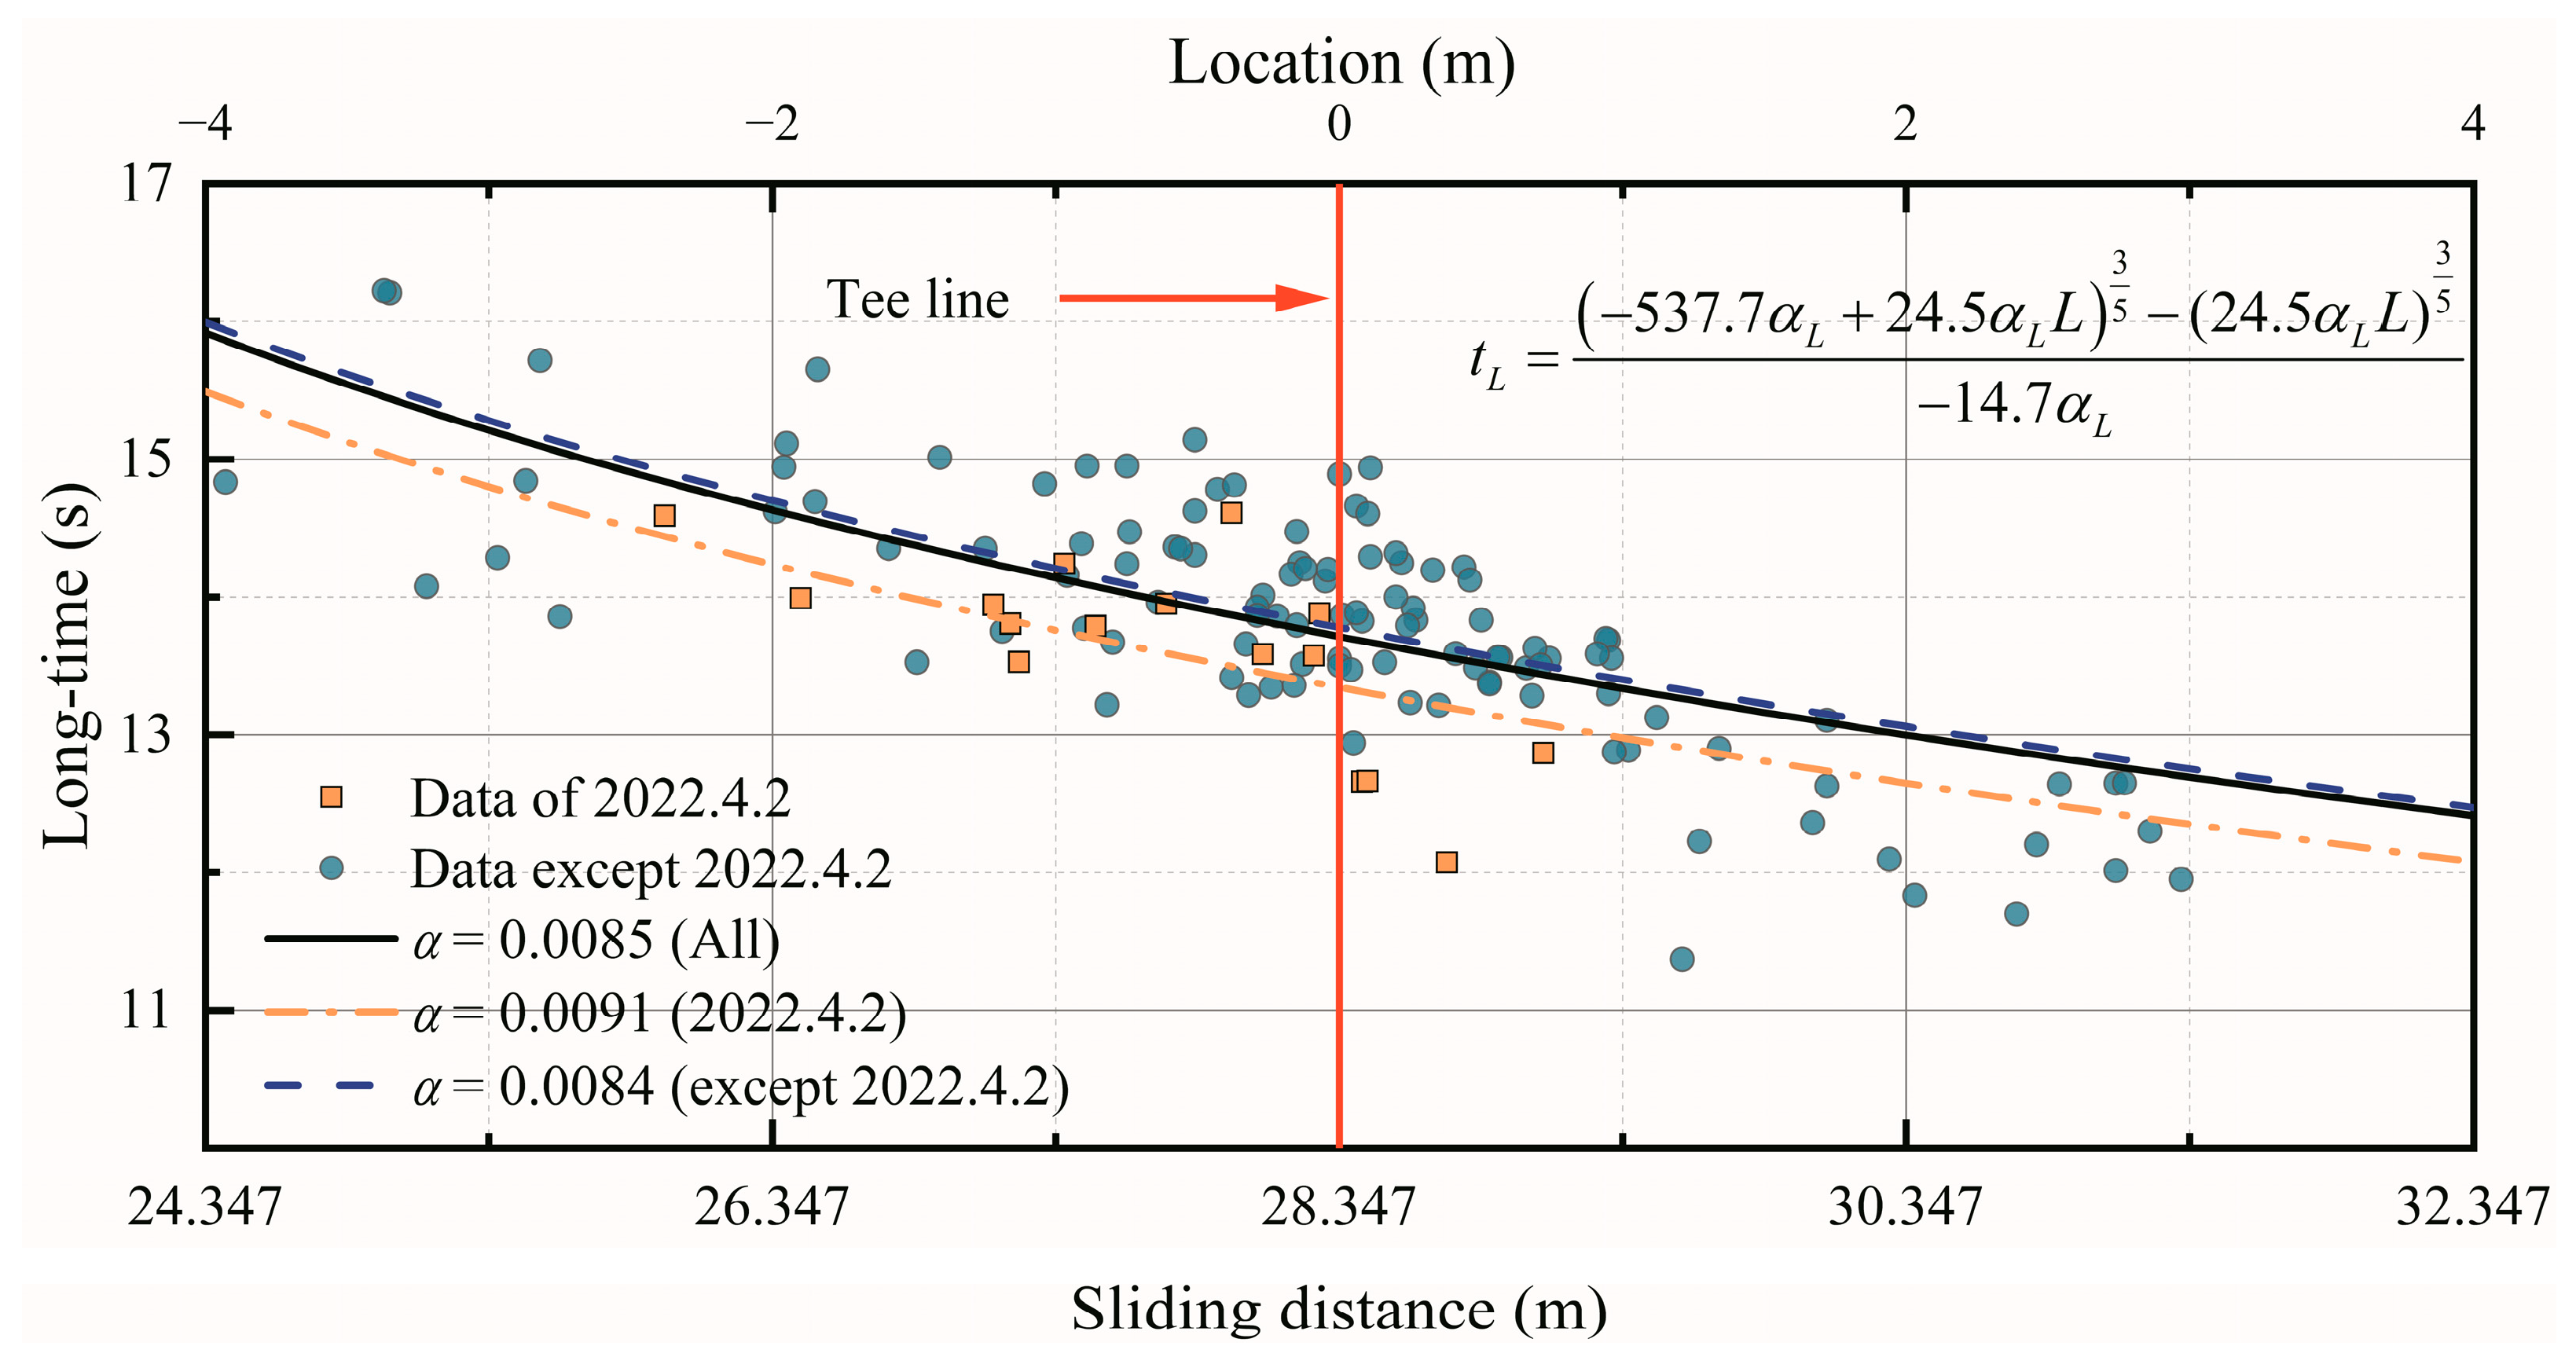
From 1 April to 10 April 2021, the curling venue held a youth curling competition, and 130 LSDs’ (the abbreviation of last stone draws) curling data were obtained during the competition. During the LSD throwing, the curling stone slides without athletes sweeping the ice, representing fewer anthropic factors in the stone’s motion. As a result, the LSD database can be used to study the average friction coefficient and other laws.
Figure 13 presents the relationship between the long-time and the stop location of the curling stone during the LSD throw. It can be found that the long-time decreased with the increase of the slipping distance. Those stones with a longer long-time tend to fall within the tee line and run shorter; those with a shorter long-time tend to fall outside the tee line and run longer. In Equation (18), if we let
v = 0, then we can obtain the relationship between the total sliding distance (from start to stop) and the initial speed, which can be expressed as
. By substituting the relationship into Equation (20), the relationship between the long-time and the sliding distance can be expressed as Equation (22), which can be used to predict the stop location, provided that the long-time is measured. For the time at about 13.71 s, the stone will stop at the center of the button; for the time shorter than the critical value, the stone will stop behind the button; for the times higher than the critical value, the stone will stop earlier.
where
L is the sliding distance from the first hog line to the stop location.
It should be noted that the air humidity was high due to the rain on 2 April 2021, resulting in frosting on the individual tracks. The ice condition on that day was different from other days. Therefore, the relationship between the stop position and the long-time between 2 April and other dates of the same schedule is compared, as shown in
Figure 13. It can be found that the
α on 2 April 2021 is 0.0091, which is distinctively larger than that of other dates of the same schedule, while the relationships on other dates of the same schedule stay in good agreement with all data. The stones at 2 April 2021 slid a shorter distance in the same long-time interval, which reflected a stronger kinetic resistance and a higher friction coefficient. The quality of the ice rink can be compared directly with the value of the ice rink quality evaluation indicator
α.
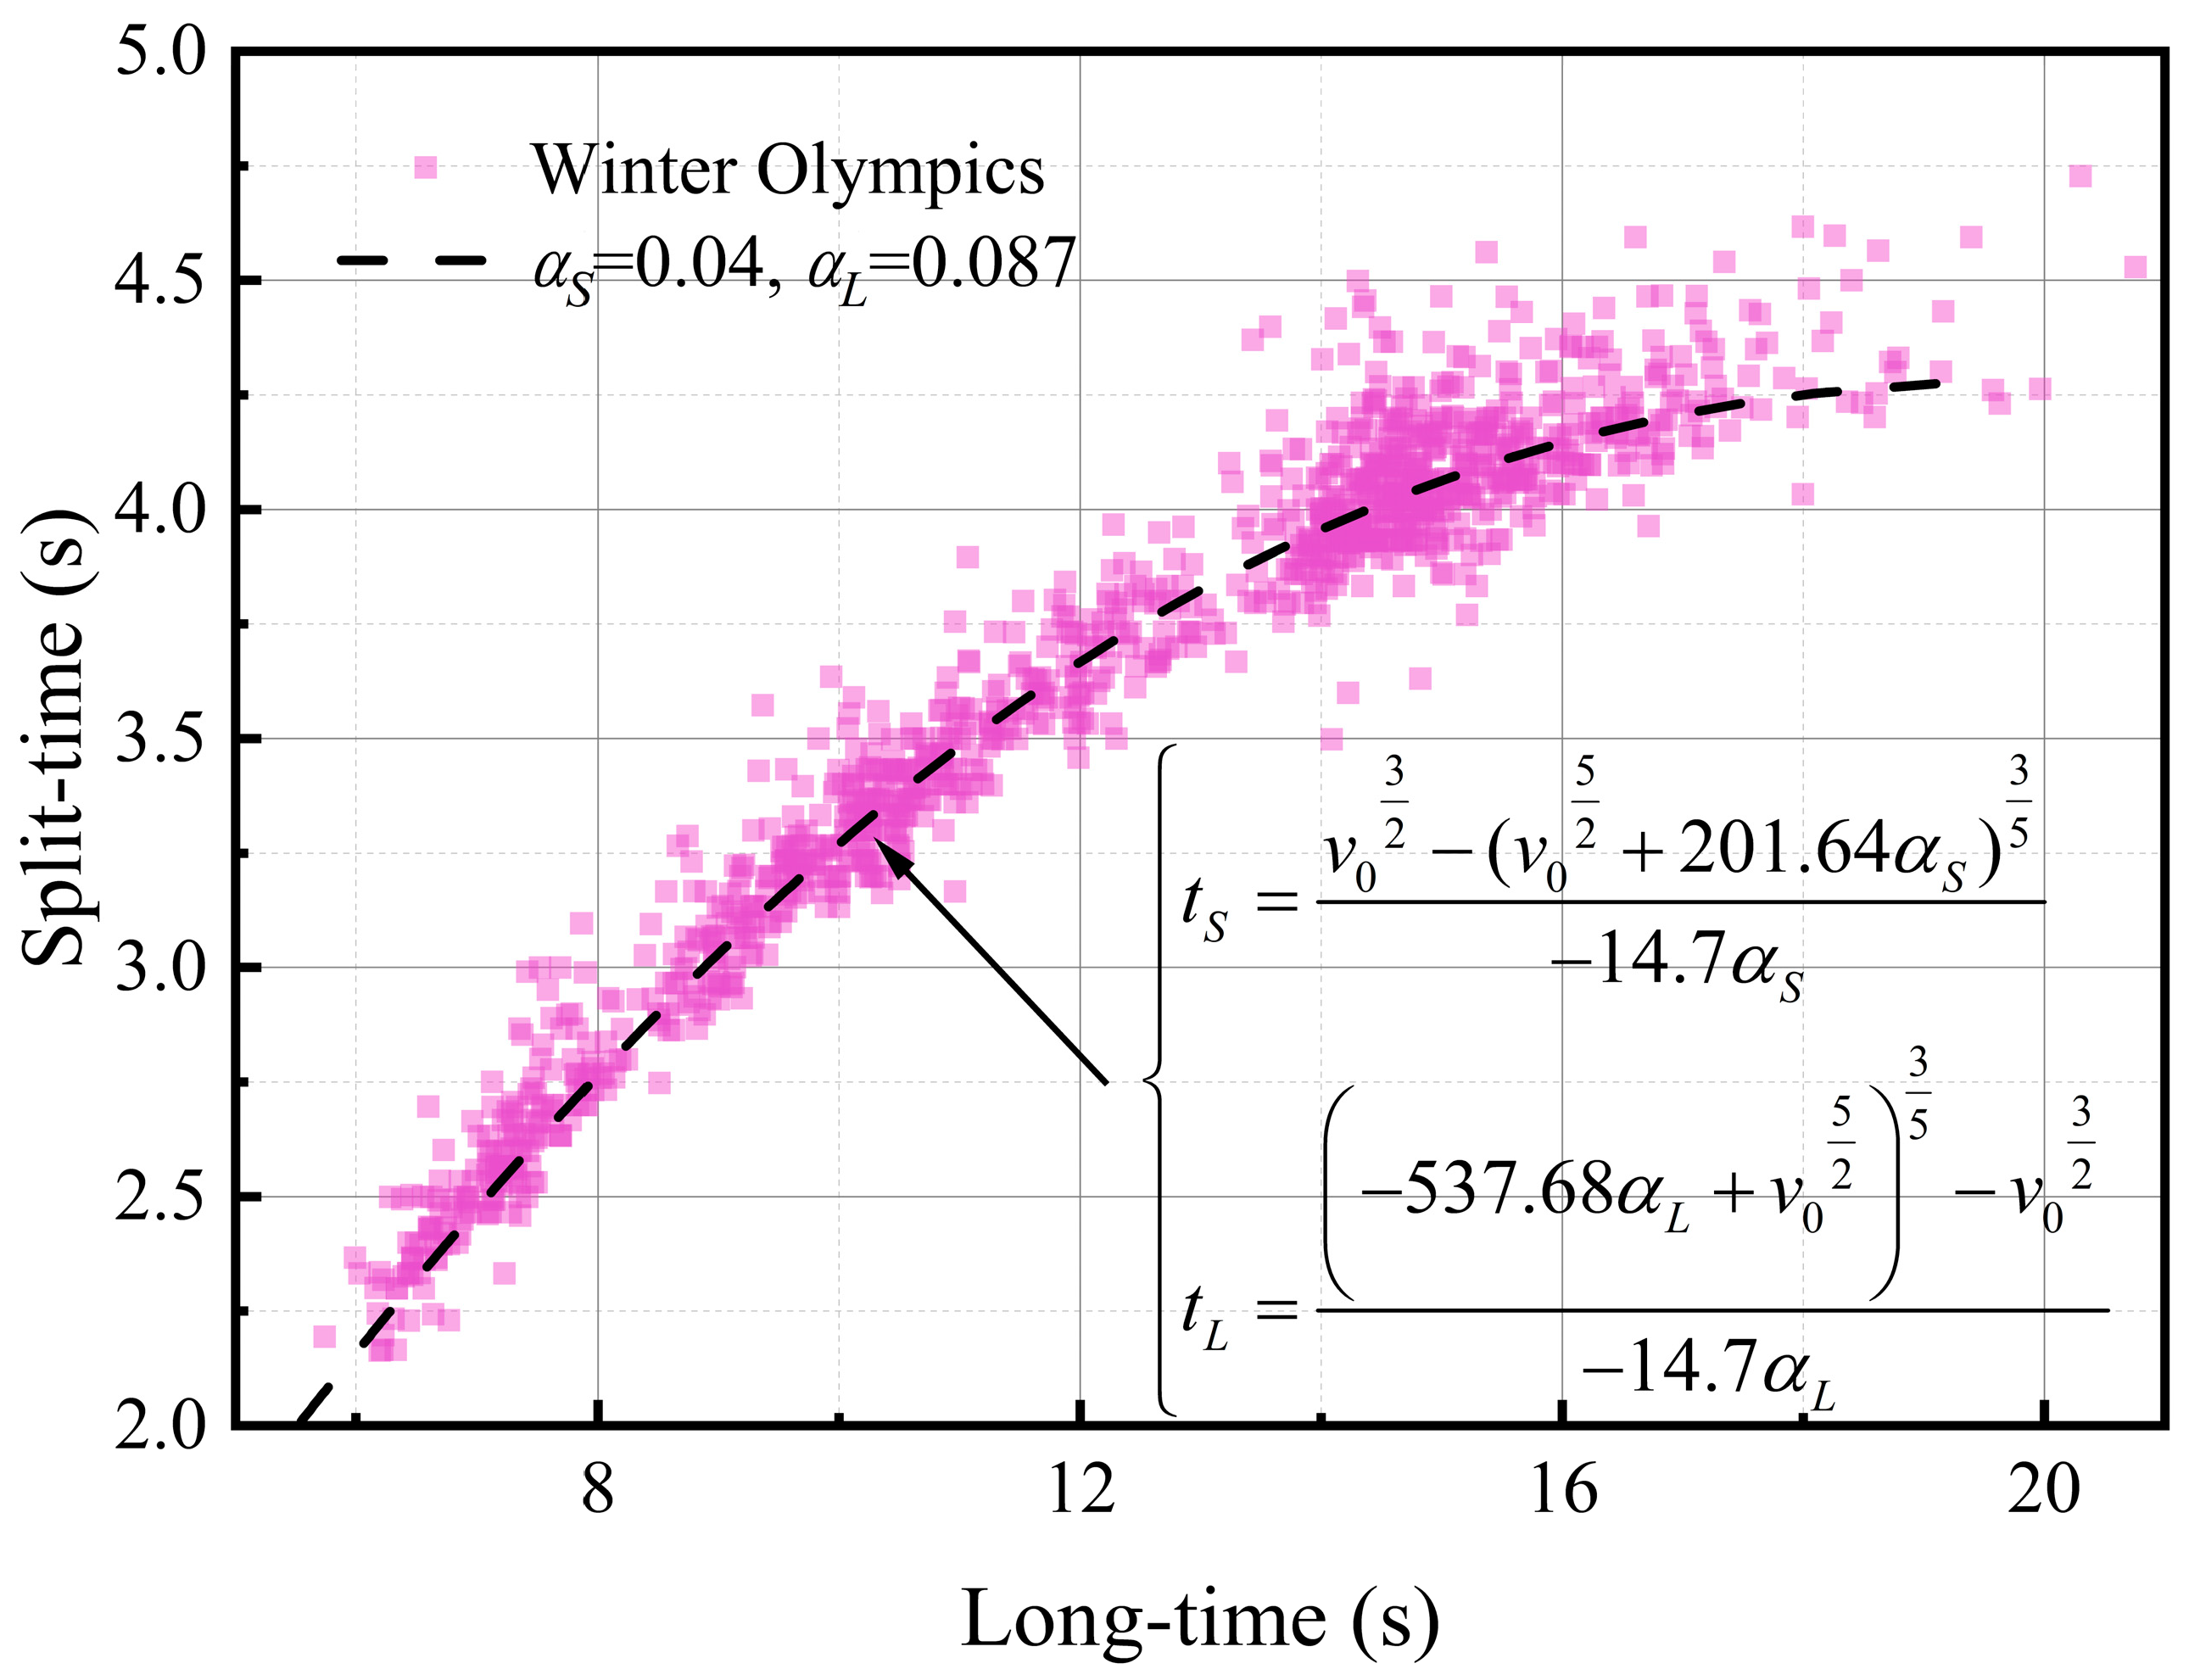
4.6. Relationship between the Split-Time and the Long-Time
Although the long-time can be related to the position where the stone will end up, it is not a suitable ice assessment tool for sweeping judgment because the remaining distance after the last hog line is too small. As a result, it is not long enough for sweepers to adjust the stone motion. The relationship between the split-time and the long-time is explored to help the athletes assess the sliding distance before throwing stones in this section.
During the split-time (the time it takes for the curling stone to travel from the back line to the hog line), the main body sliding on the ice rink is the athlete plus the stone, but after throwing the stone at the first hog line, the main body sliding is only the stone. The soles of curlers’ shoes are made of professional plastic with a slippery surface and a minimal coefficient of friction. Therefore, the coefficients of friction for these two parts may be different, and they need to be considered in segments. The diagram of the sliding process of the stone is shown in
Figure 10. The split-time and long-time intervals can be expressed as Equations (23) and (24), respectively. At the same time, the velocity at point B and point F satisfies the relationship in Equation (25). As a result, the relationship between the split-time and the long-time can be expressed as Equation (26), which is a parametric equation about
v0.
where
ts is the split-time,
Ls is the sliding distance during the split-time, and
αs is the quality evaluation indicator during the split-time, which is a mean value in consideration of the stone and the slippery soles of the curlers’ shoes.
Taking 9 February 2022 and 10 February 2022 during Beijing Winter Olympics as examples,
Figure 14 presents the extracted split-time and long-time. Because
αL is already known as 0.087 through the relationship between the long-time and the initial speed,
αs can be obtained by data fitting as 0.04, which is smaller than
αL. This indicates that the combination of the athlete and the stone has a smaller friction coefficient than the stone alone, because the sole of the shoe is made of special plastic and has a smaller friction coefficient. It can be found from
Figure 14 that there is a clear relationship between the split-time and the long-time, which means that the long-time can be accurately converted to the split-time. In this way, the split-time provides the earliest information for sweepers, who can react immediately with this number.
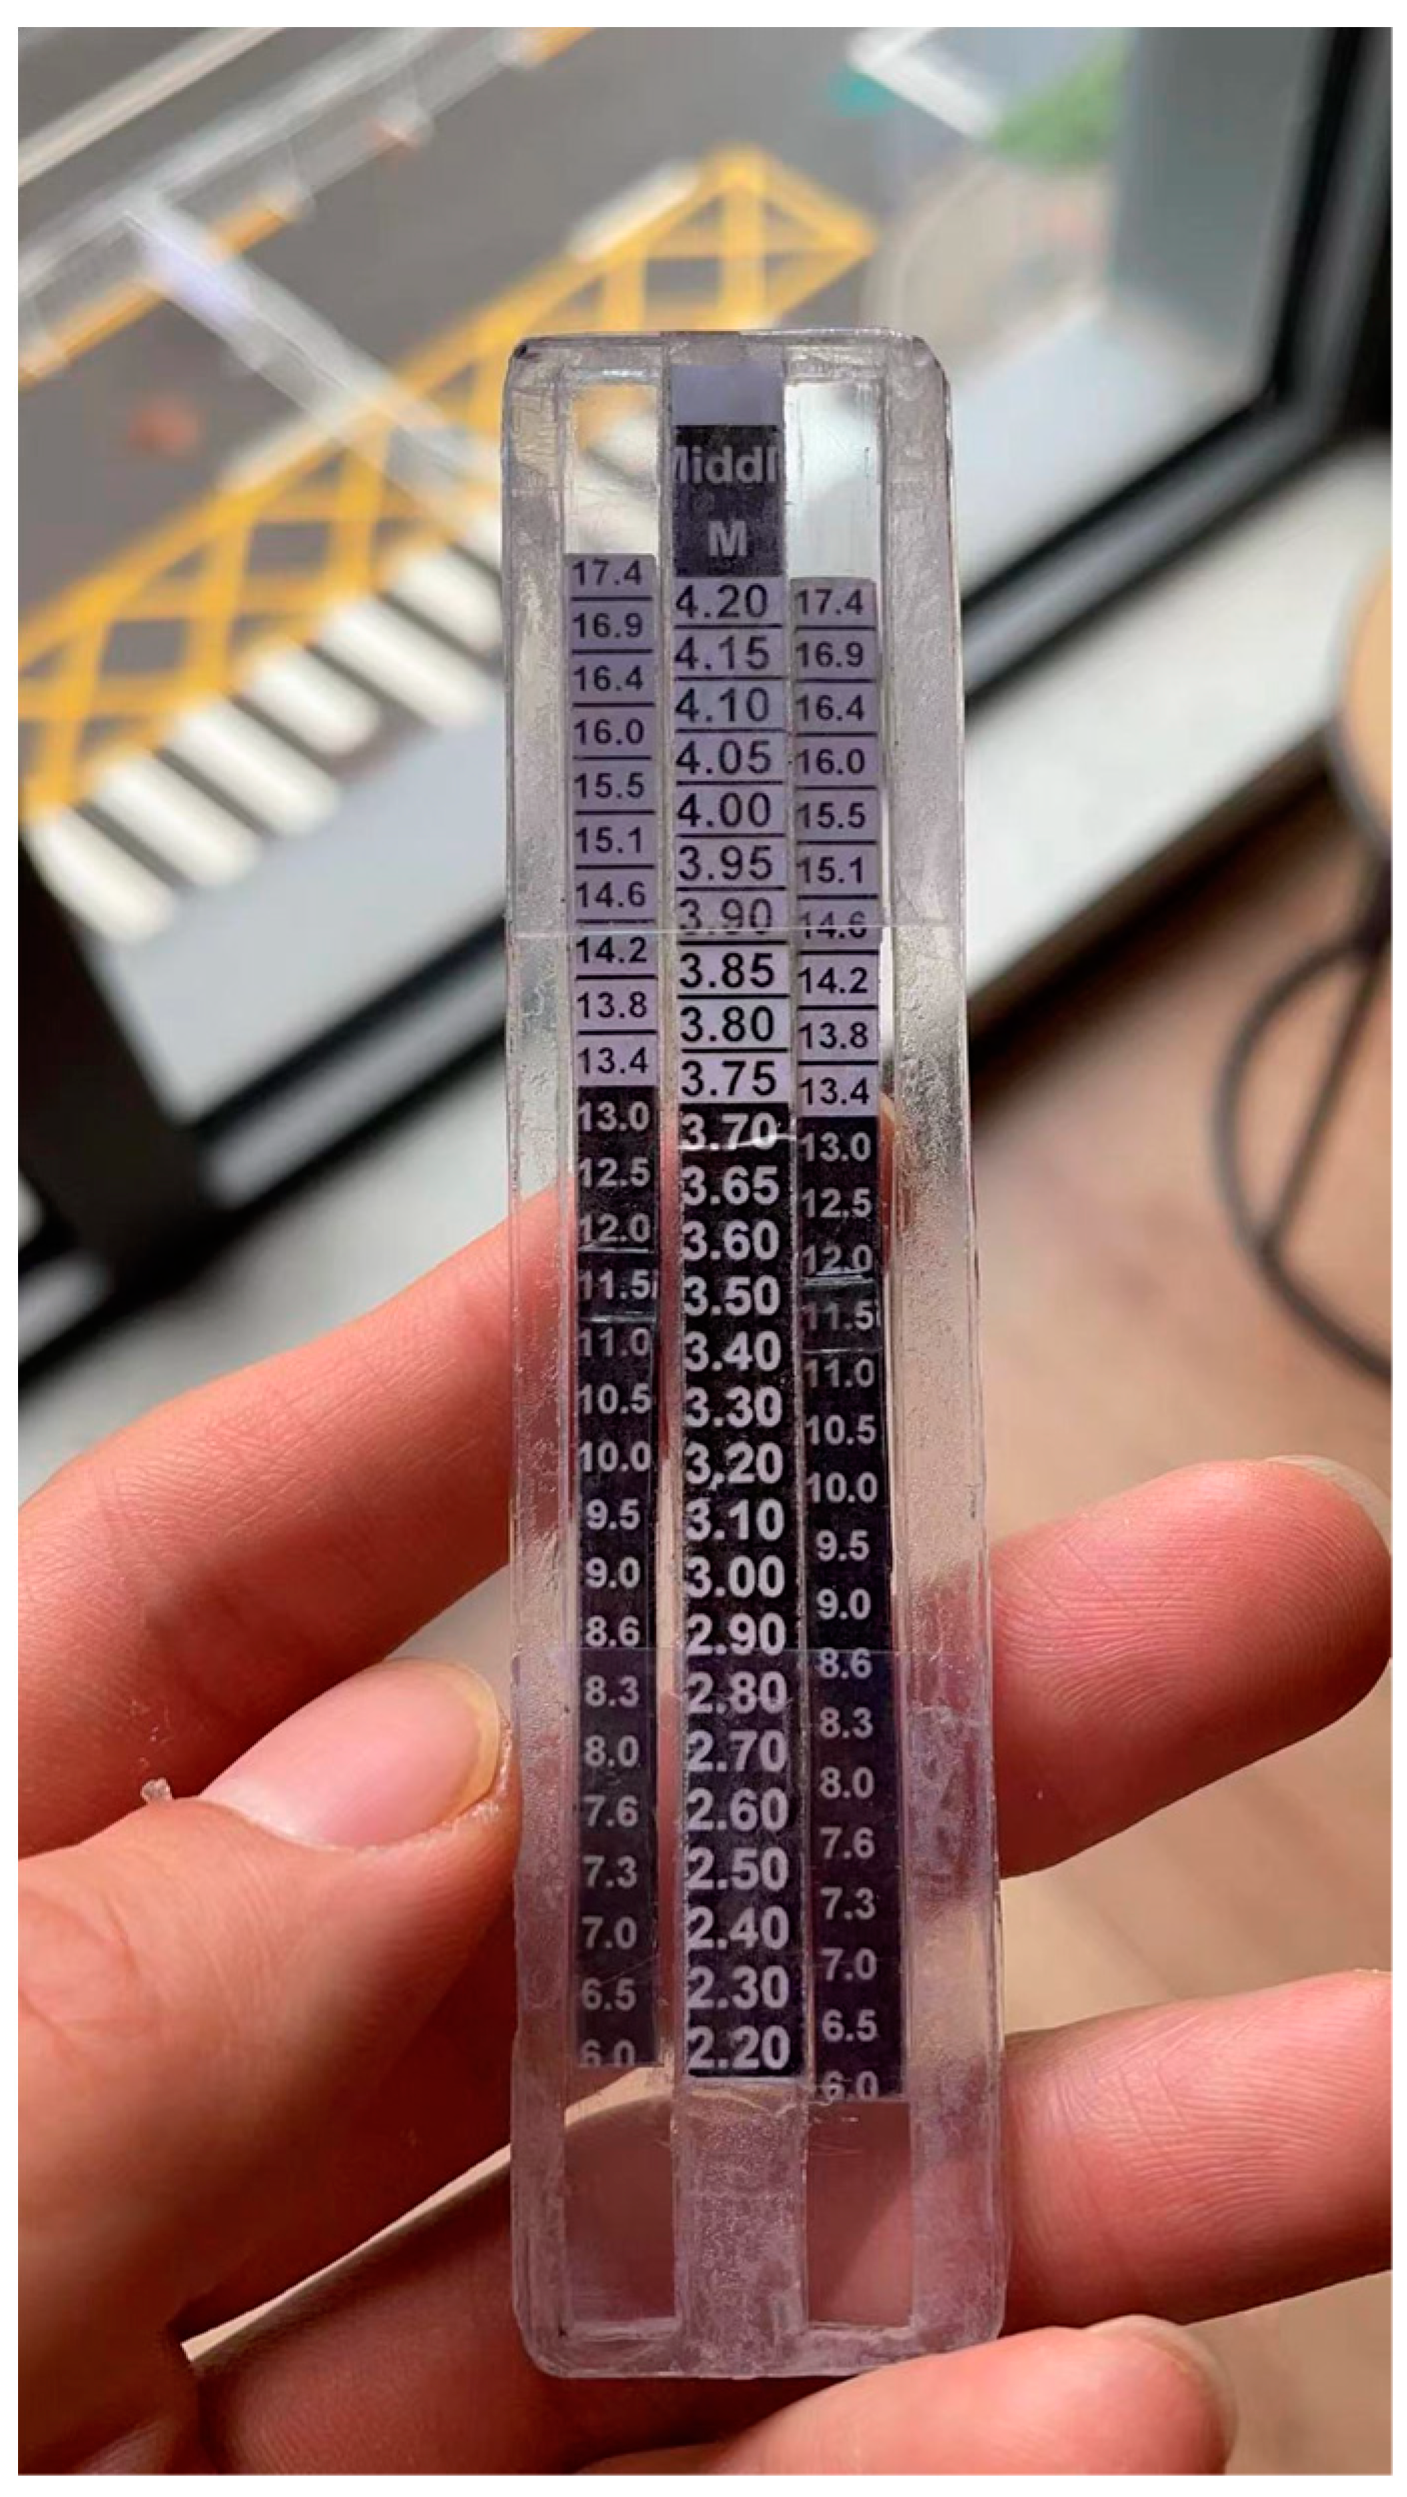
Skip, the fourth base player of the Chinese national curling men’s team, proposed the idea of making a sliding calculating ruler to record the size table time of the ice rink, as shown in
Figure 15. When athletes are training in different ice rinks, or training at different times, this ruler can record the correspondence of the split-time and the long-time, which makes it easier for athletes to observe the change of the correspondence and adjust the strength of the curling throw. The findings of this section prove that this idea is correct. The change in the split-time and the long-time correspondence reflects the change in the ice rink quality, and the understanding of this law is called the “ice reading ability” of the athletes. In the future, ice rink quality control can also be realized by recording the split-time and the long-time through video capture or magnetic induction to form a curve. By observing the change of the curve at different times, the change in ice quality can be evaluated.
4.7. A Practical Method to Evaluate the Quality of the Ice Rink
Section 4.2 and
Section 4.3 established a physical model of the stone sliding process by introducing the curling quality evaluation indicator
α. In
Section 4.4,
Section 4.5 and
Section 4.6, this model can describe the state of the curling stone in each stage of the sliding process and agrees well with the measured data. Although the quality of different ice rinks can be assessed by comparing the quality evaluation indicator
α, it is inconvenient, because its implementation relies on a large amount of pre-measurement data.
In this section, a practical method for assessing the quality of the ice rink is used. Athletes are asked to throw the curling stone, and the total time it takes for the curling stone from starting at the back line to stopping at the center of the last button (that is, in
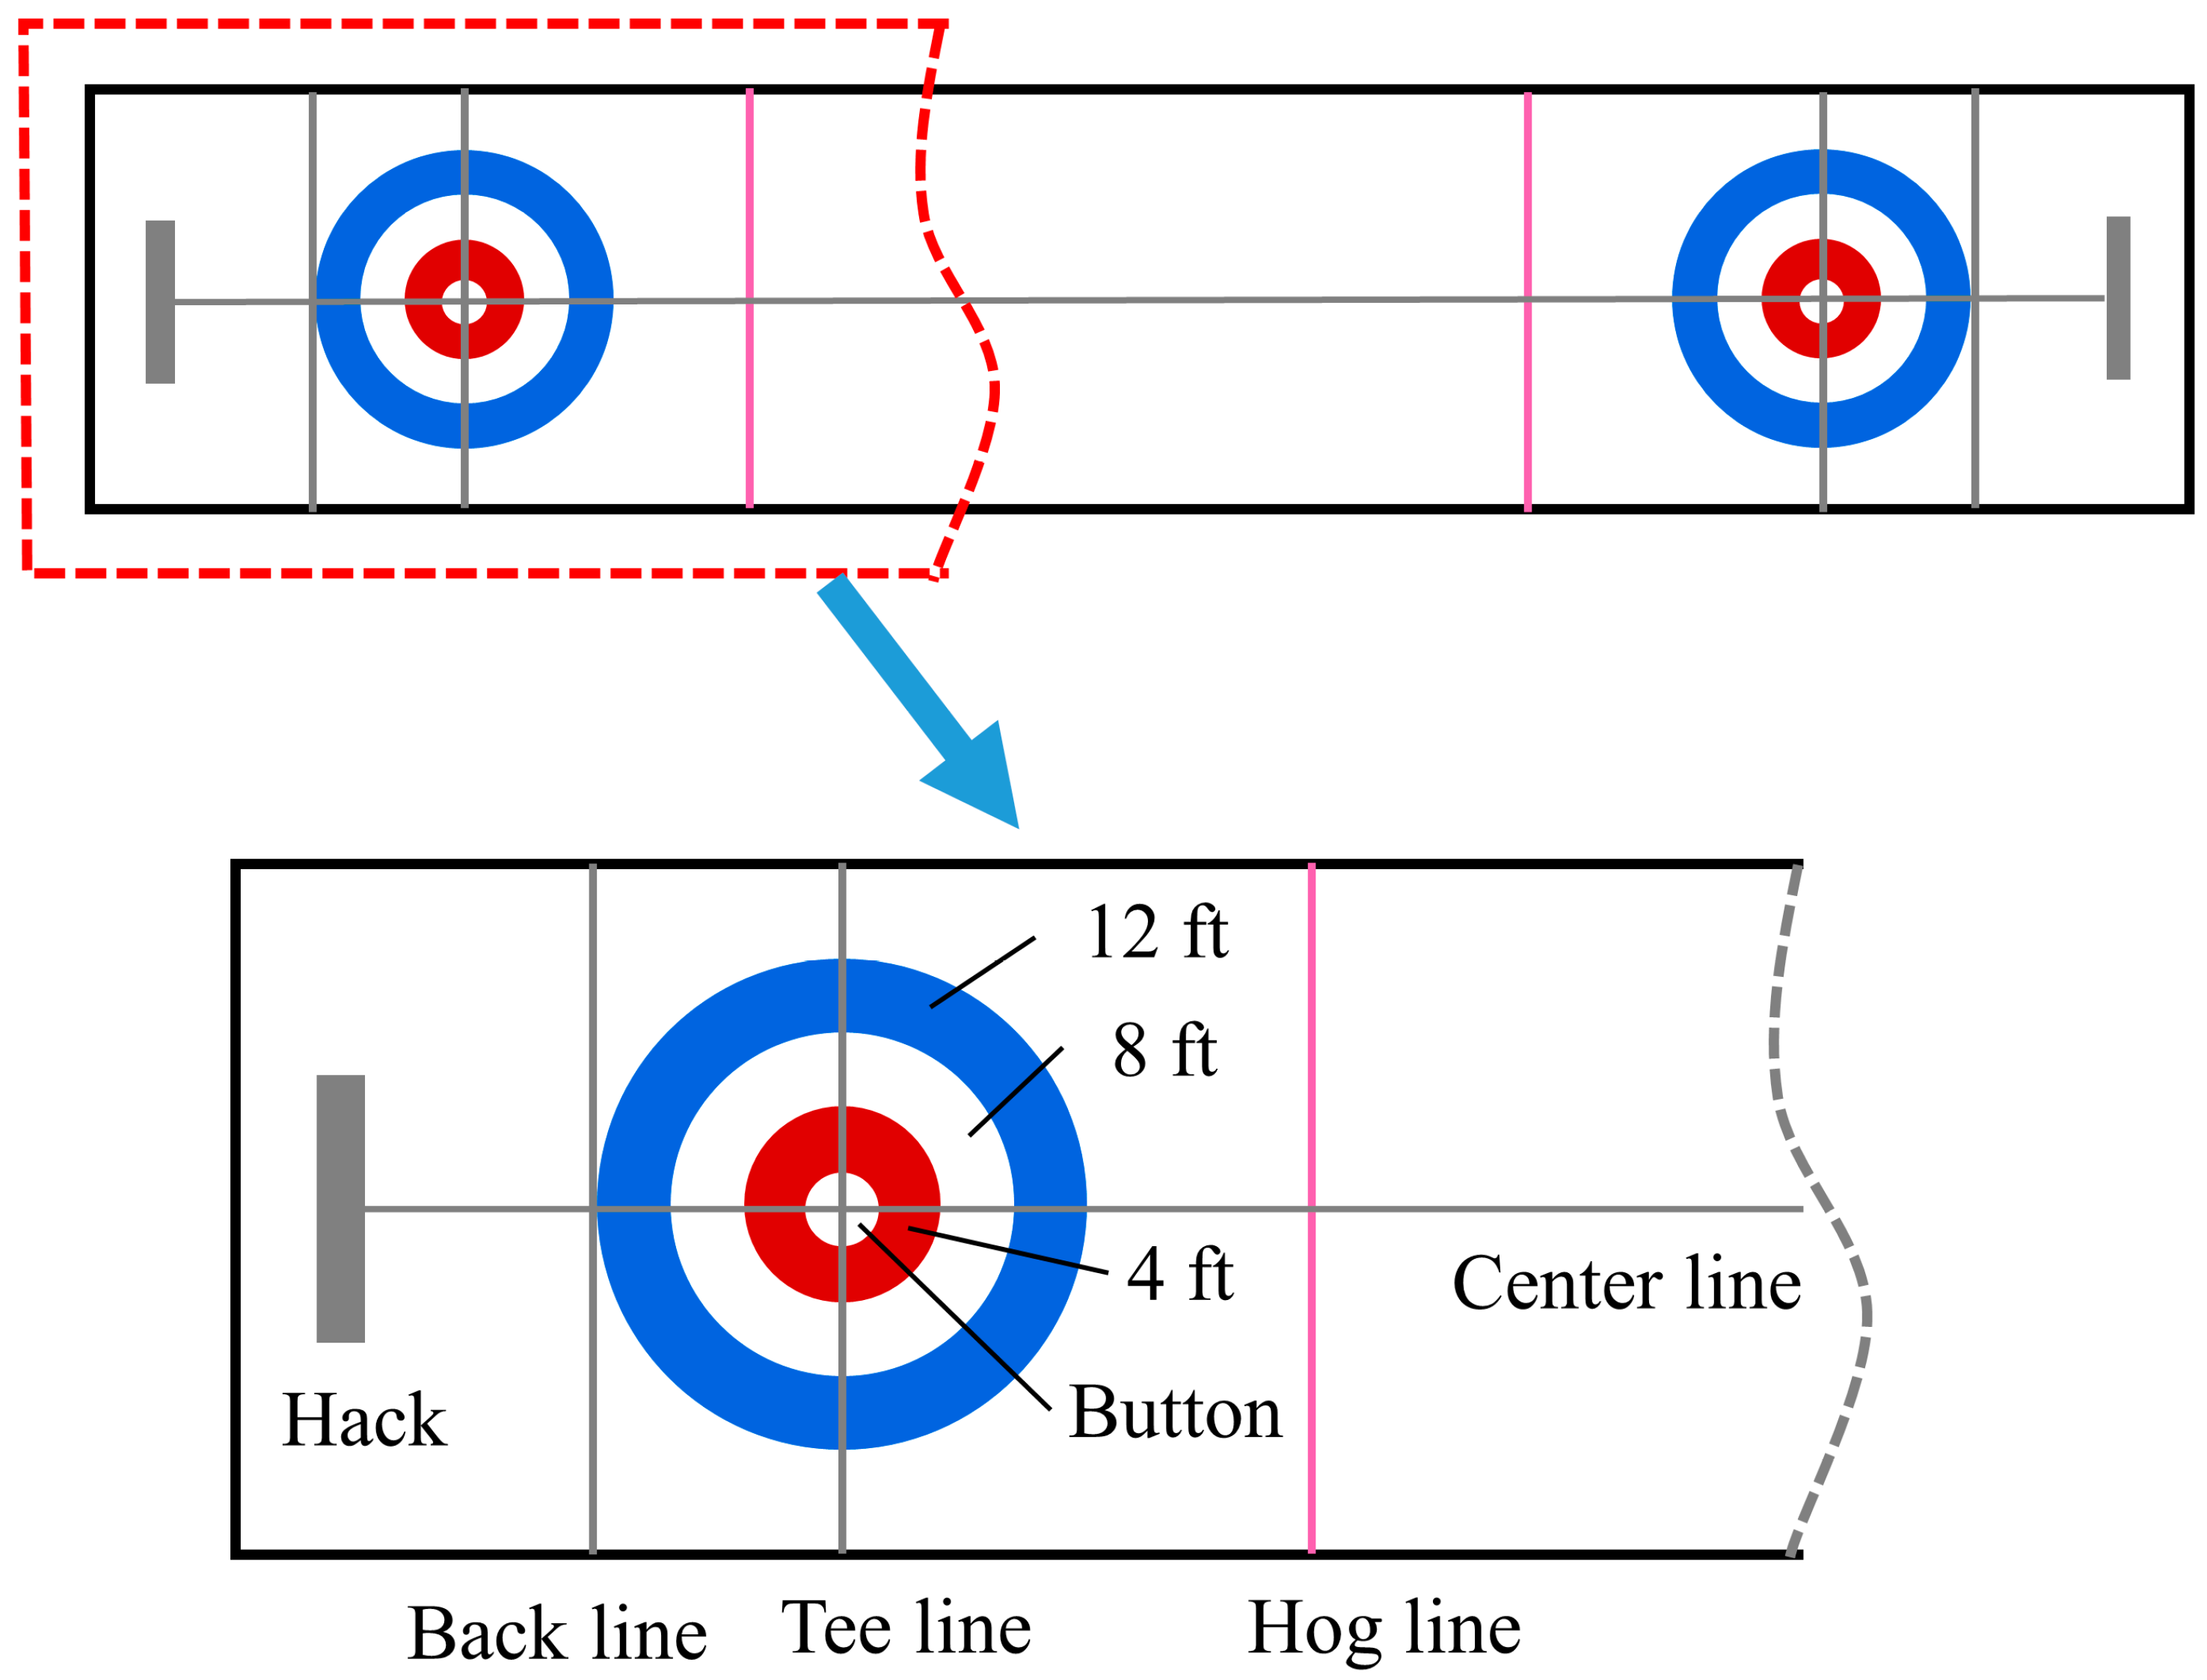
Figure 5, from point B to point E) is used as the measurement indicator. Under the same sliding distance, a longer time means the smaller the friction coefficient of the ice rink and the higher the quality of the ice rink. Therefore, the quality of the ice rink can be assessed by directly comparing this special total time for different ice rinks.
Based on Equation (18), if we let
v = 0 and eliminate
v0, the relationship between the sliding time and the sliding distance after the first hog line can be deduced as Equation (27). As a result, the time from point F to point S (the long-time) and the time from point F to point E can be calculated as 13.52 s and 22.90 s. By substituting the long-time into Equation (26), the split-time can be calculated as 3.88 s. Thus, the total sliding time can be summed as 26.78 s. Nowadays, for most curling ice rinks, the total time ranges from 24 s to 26 s, which proves that the curling ice rink of the 2022 Beijing Winter Olympics is better than the vast majority and close to the perfect ice rink; the same conclusion was reached in
Section 4.2.
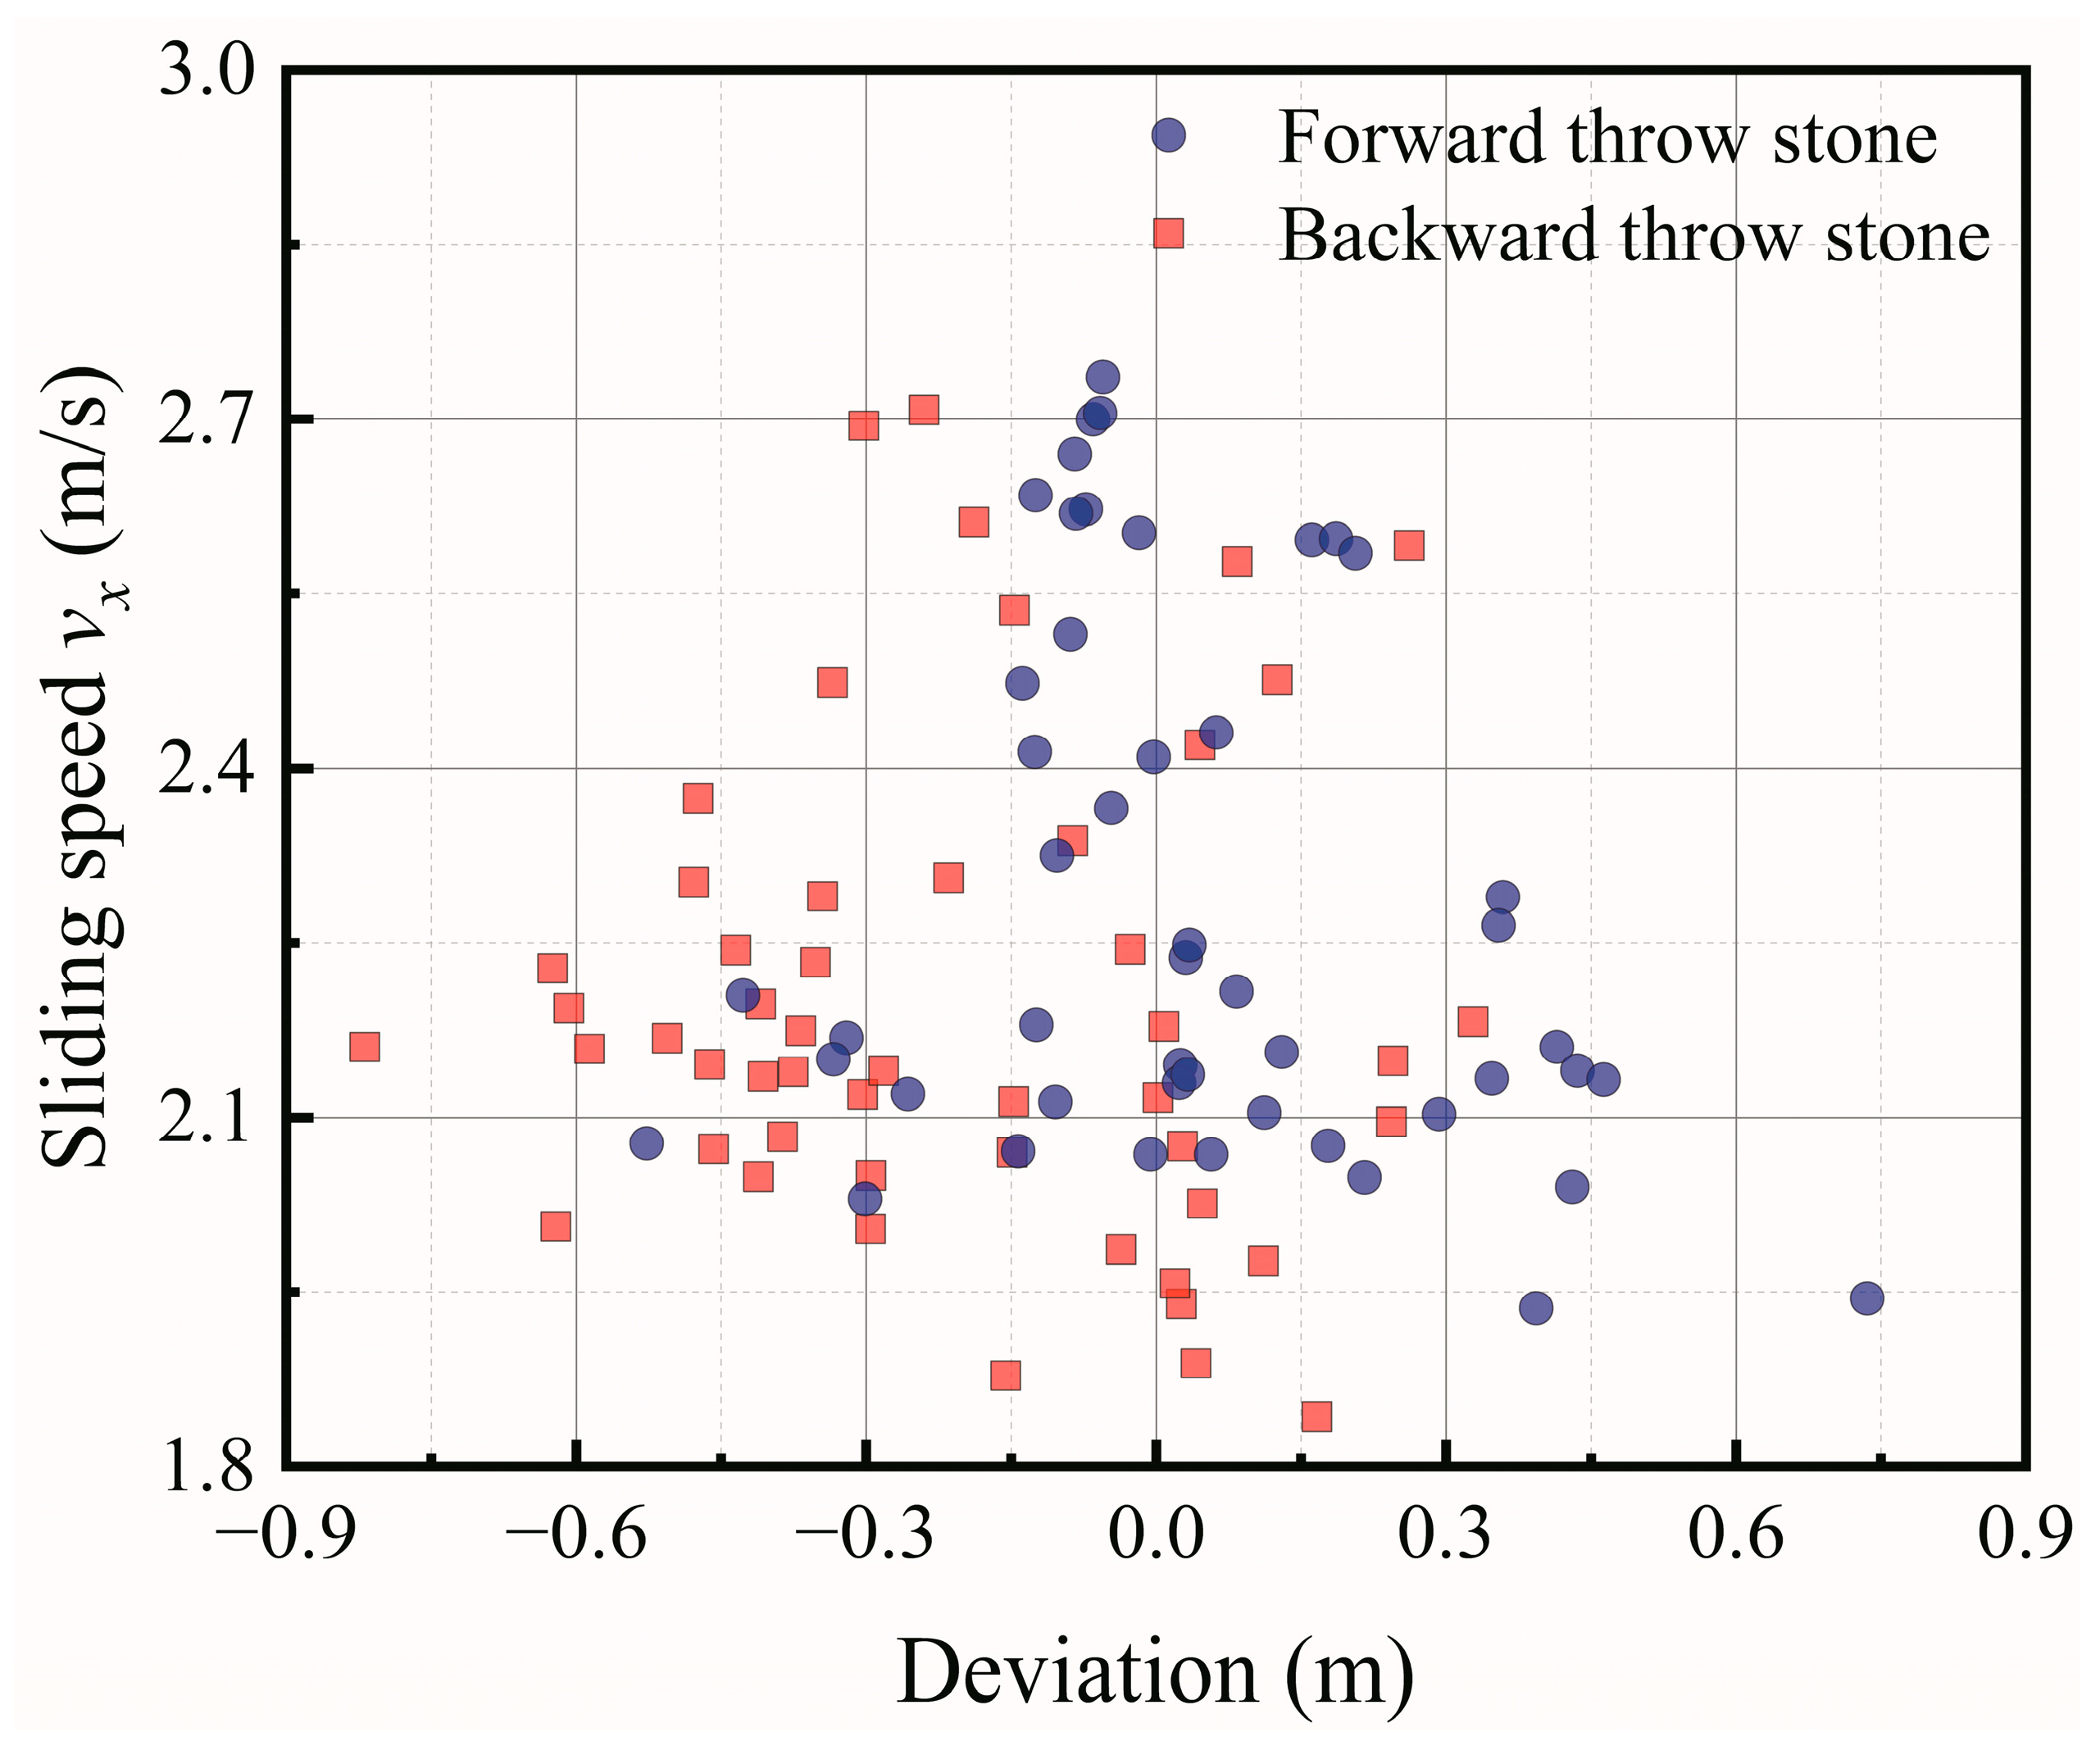
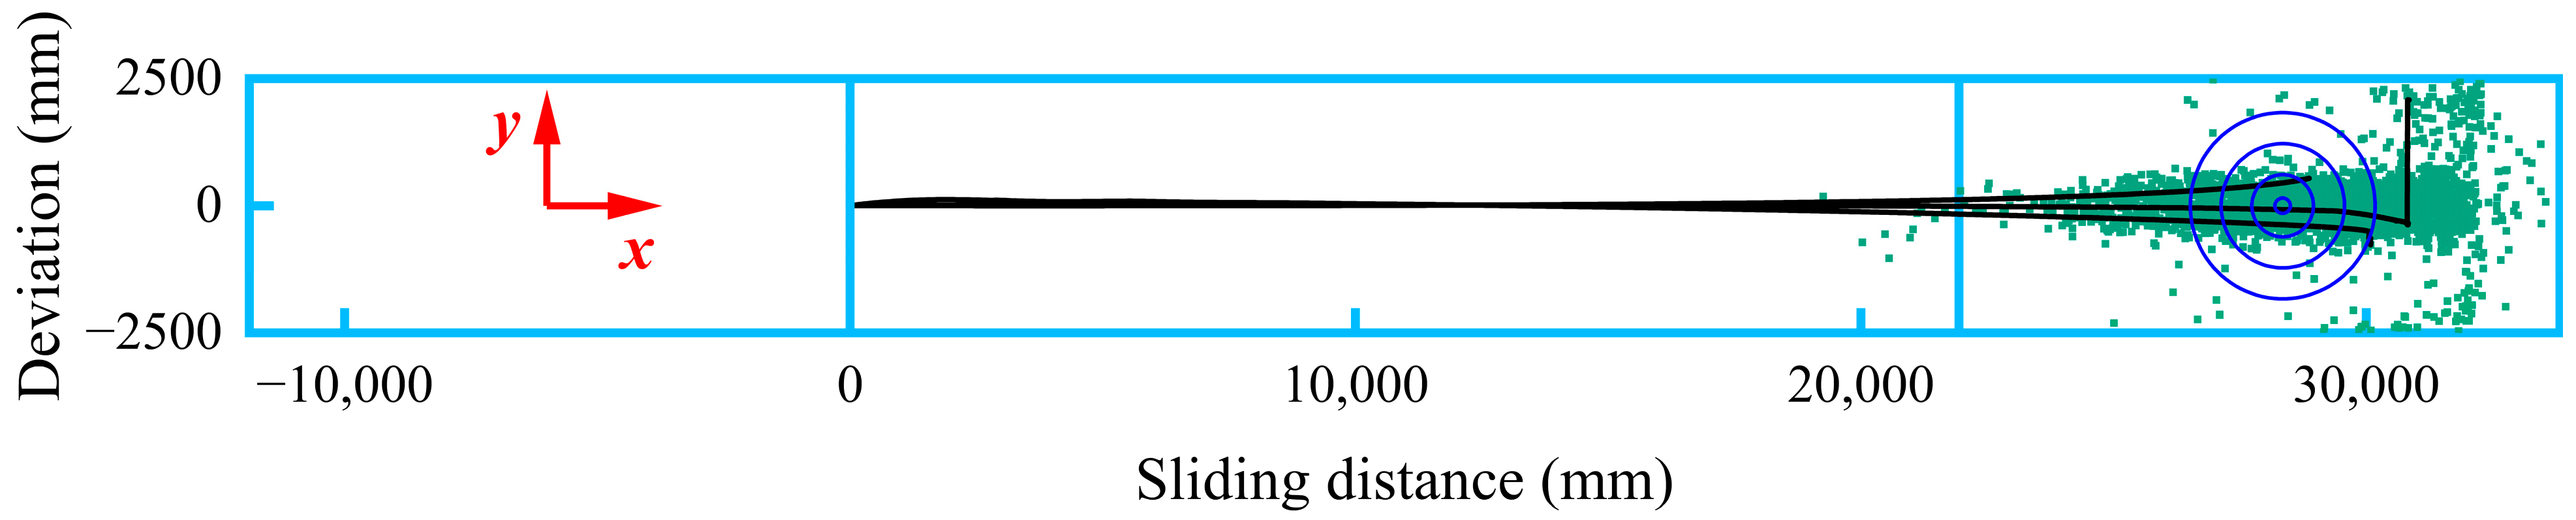
4.8. Relationship between Deviation and the Initial Speed
According to the study above, it is possible to help players estimate the sliding distance of the stone in the
x-direction. However, the final position of the curling stone is also closely related to the deviation in the
y-direction, as shown in
Figure 16. Taking the results of curling competitions from the database of the World Wheelchair Curling Championships as an example, this section explores the relationship between deviation and the initial speed. The green scattered dots represent the stop locations of the stones, and the solid black lines represent the trajectory of some curling sliding. It can be noticed that some stones have sudden
y-direction deviation due to the collision with the stones that already stopped at the end position, so these results are not considered in the analysis.
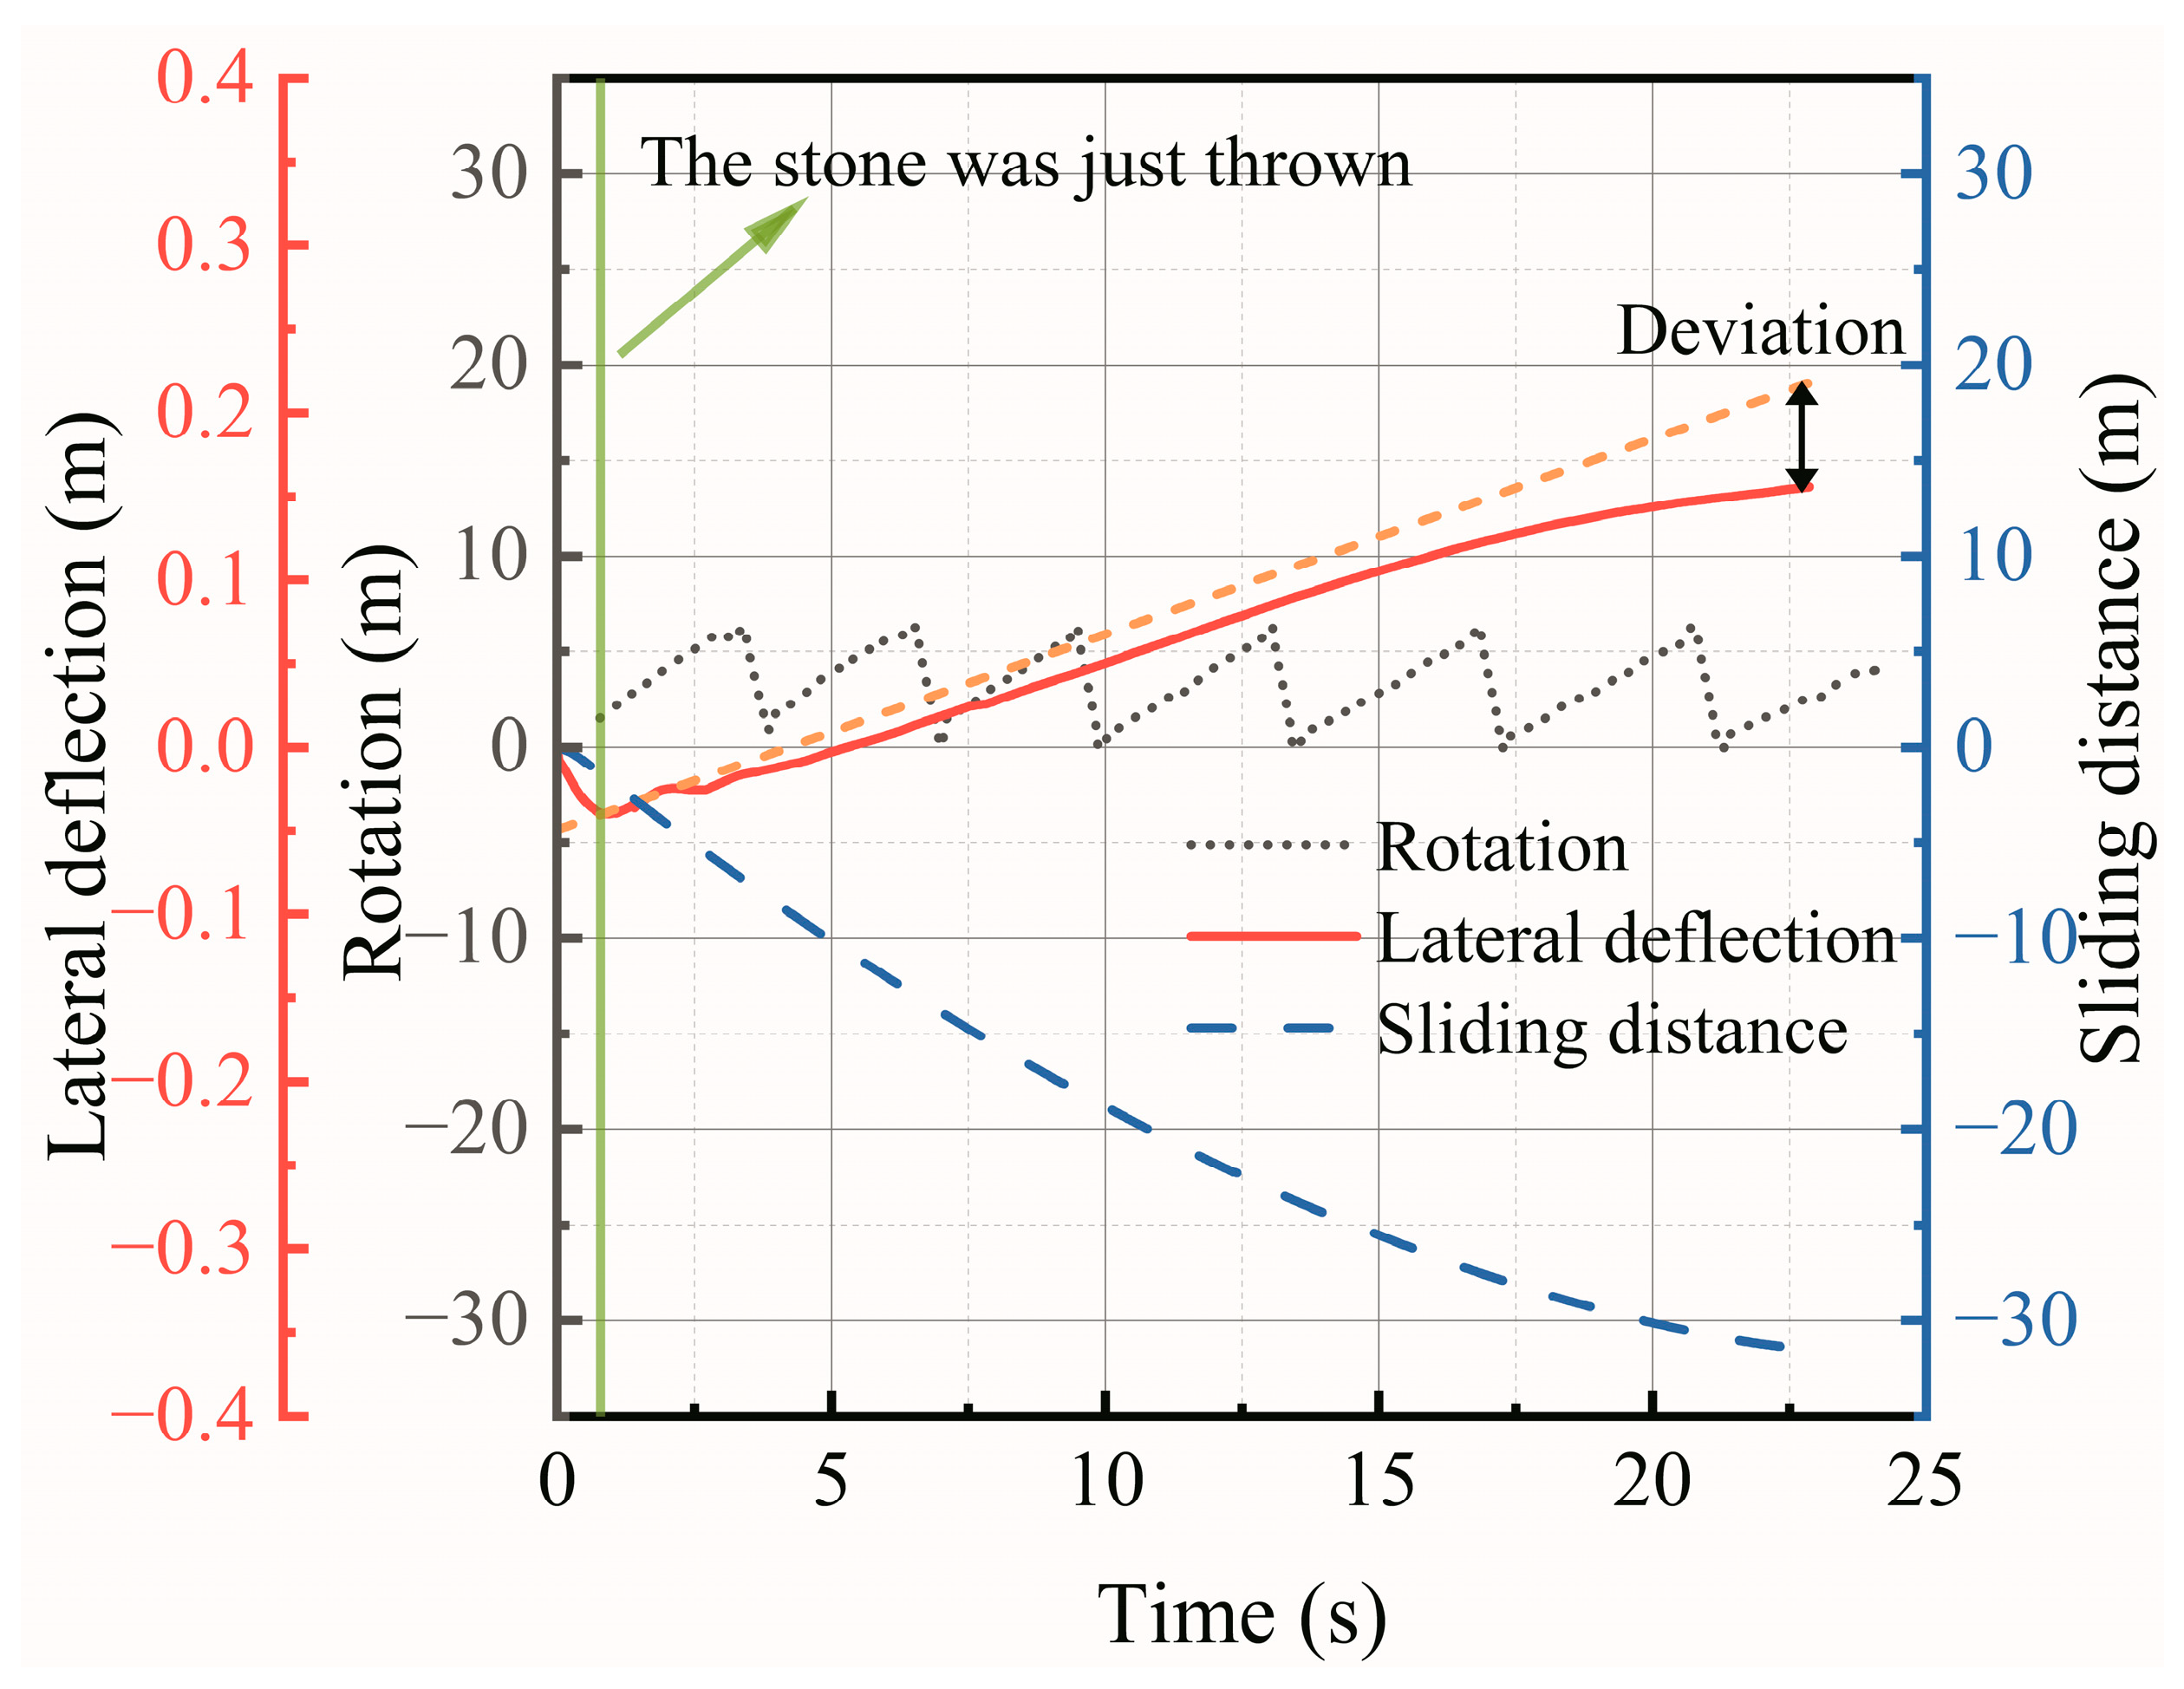
During the World Wheelchair Curling Championships, there are no athletes sweeping the ice, so the only control athletes have is what happens before the stone leaves their hand. Once the stone leaves the hand, then the motion of the stone is only influenced by the rink factors. The moment the stone leaves the hand, the stone is affected by the sliding speed in the
x-direction, the angular speed, and a tiny lateral deflection speed (which is ignored by the athletes) in the
y-direction, as shown in
Figure 17. The deviation is defined as the distance of the actual lateral deflection minus the distance at which the stone maintains its initial lateral speed. The relationship between these three factors and the deviation of the stone is studied in turn.
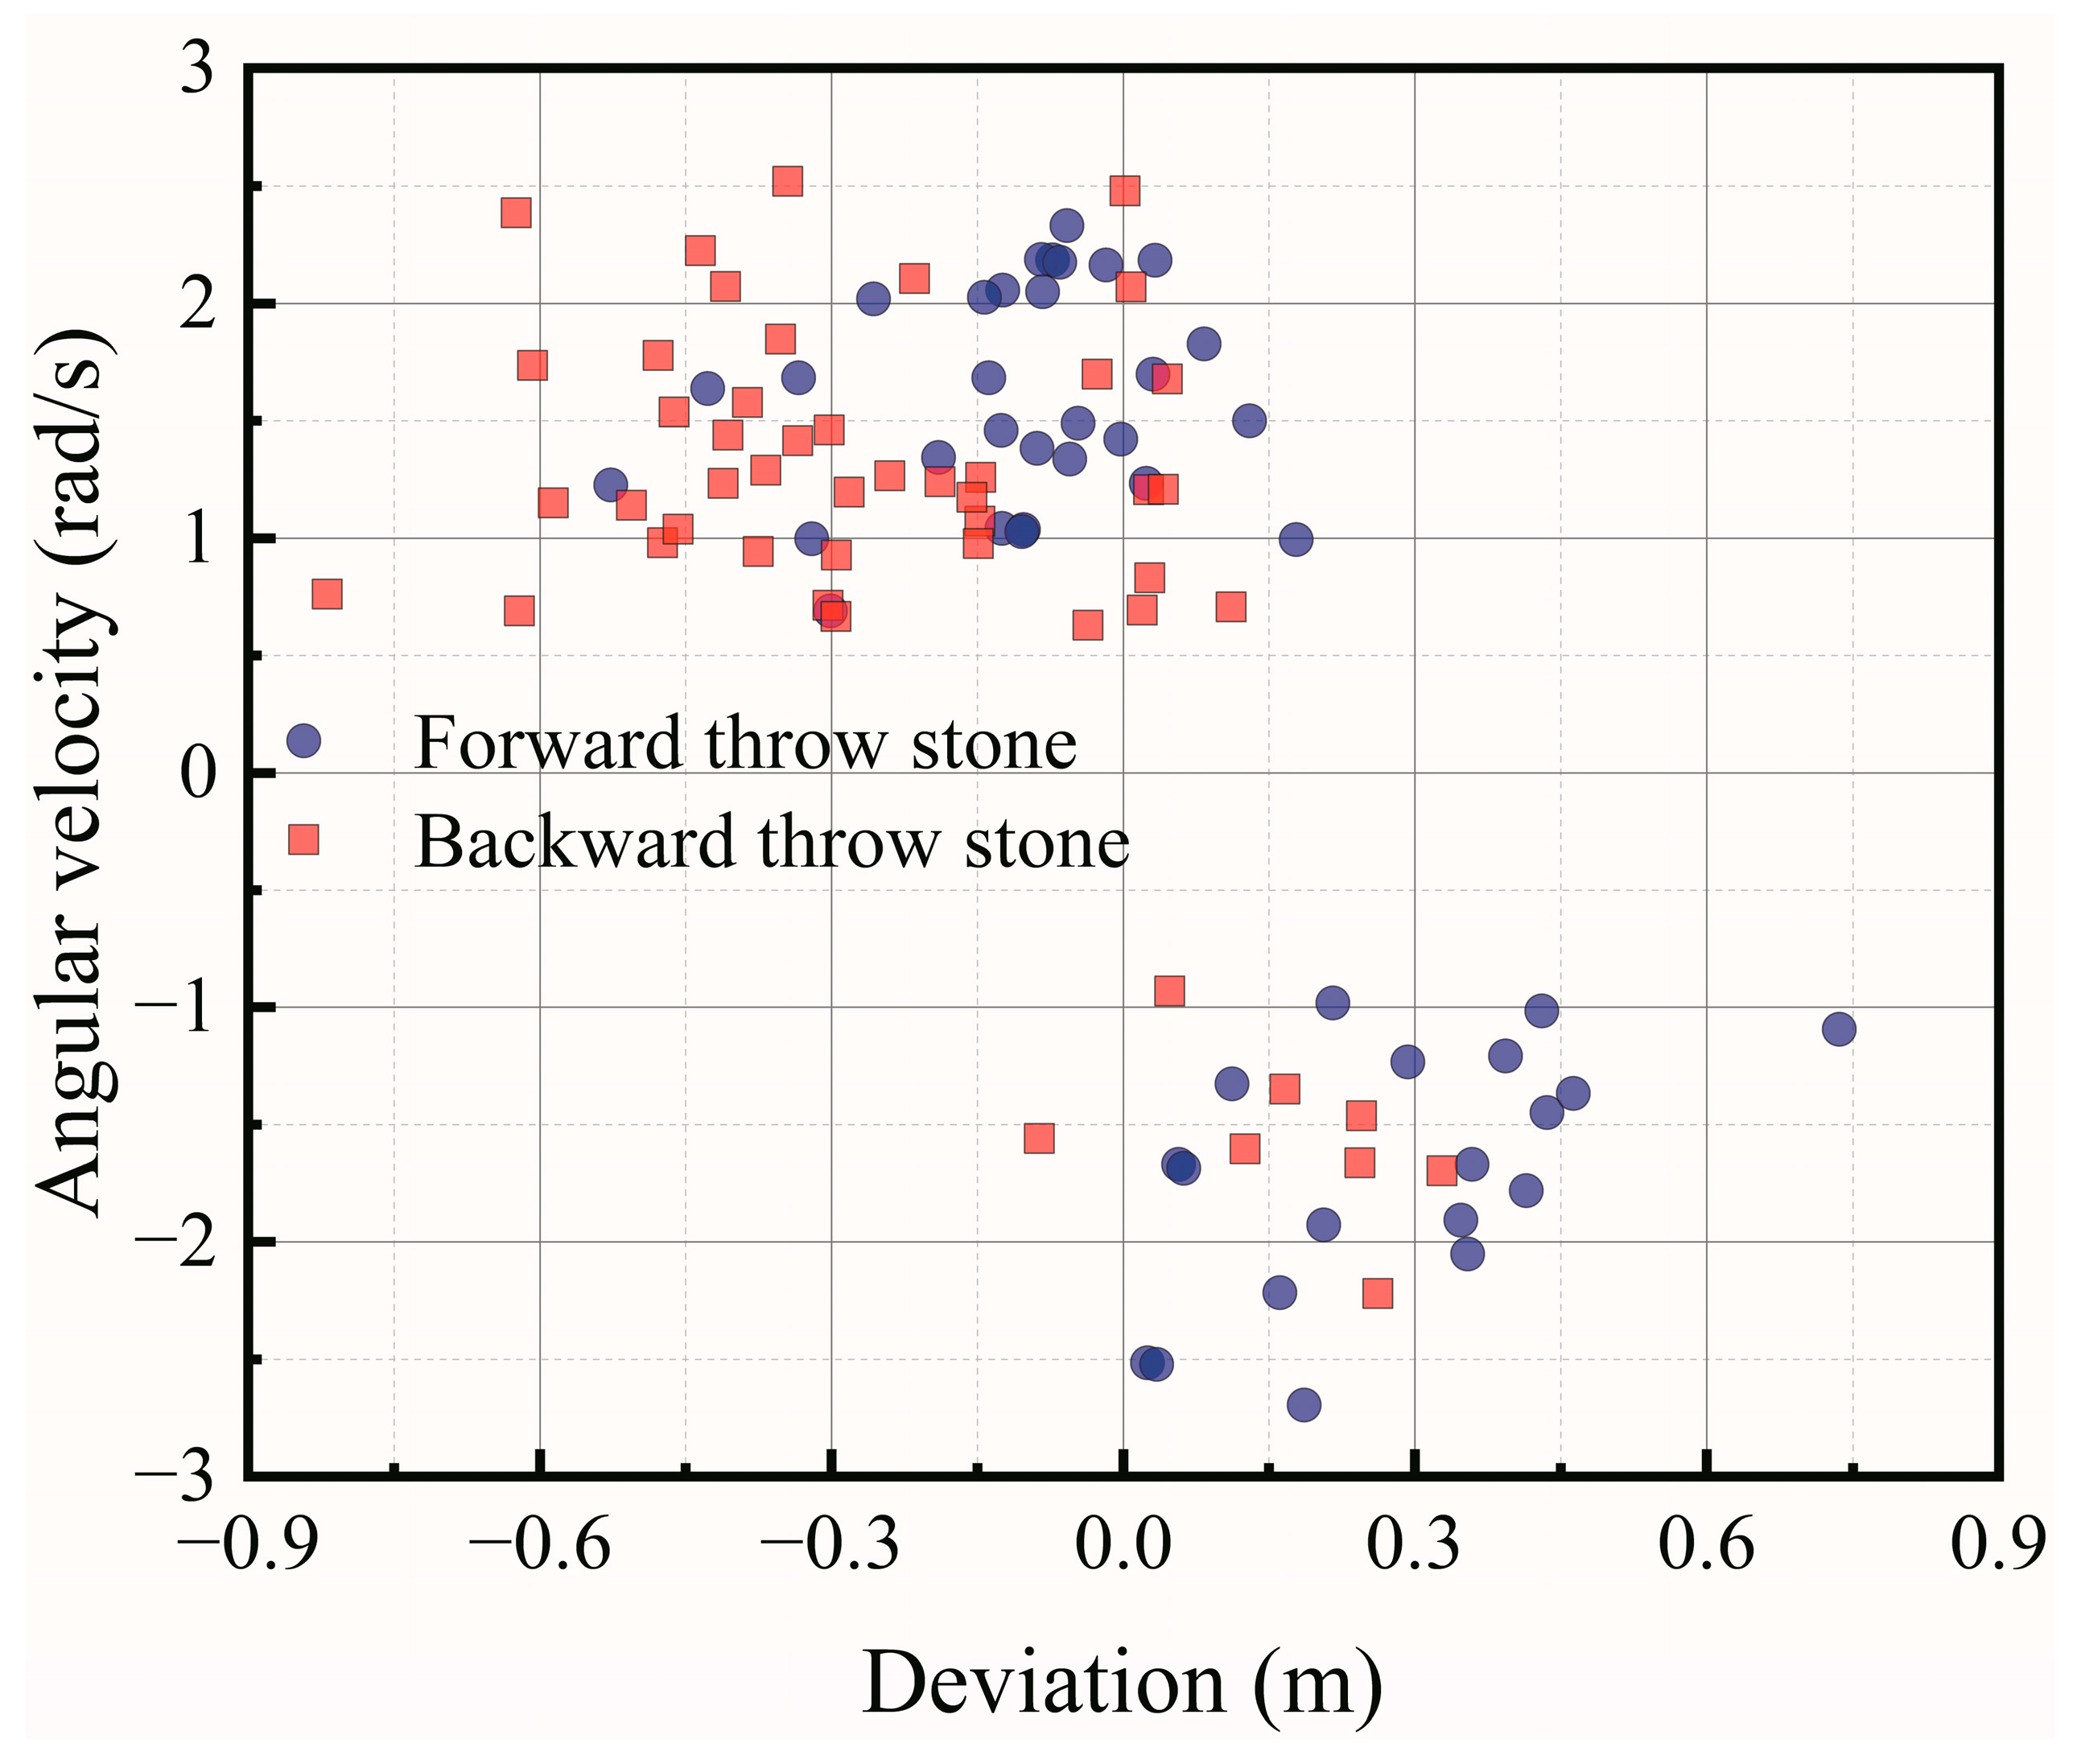
As shown in
Figure 18,
Figure 19 and
Figure 20, here are the video recognition data of the first track of the first race. Because two adjacent games required adjustment of the direction of the stone throw, data were extracted for each of the two directions. It can be noticed from
Figure 18 that the deviation is approximately symmetric at about 0. When the sliding speed in the
x-direction is slow, the deviation is scattered, but when the sliding speed is fast, the deviation is relatively concentrated, indicating that the faster the sliding speed, the smaller the deviation.
As shown in
Figure 19, there is a strong correlation between the direction of rotation and the direction of the deviation. If the stone rotates clockwise, then it will deflect to the right of the forward direction; but if the stone rotates counterclockwise, then it will deflect to the left of the forward direction [
5,
6]. However, there is no clear numerical relationship between the magnitude of the rotation speed and the magnitude of the deviation. Some literature [
5,
14] suggests that stone deviation is related to its angular rotation speed and the direction of rotation, but there is serious disagreement about the relationship between the value of deviation and the angular speed of rotation. Some literature suggests that there is no direct correspondence between deviation and the value of the rotation speed, and that the direction of rotation affects the direction of deviation. The deviation is due to incidental factors, such as asymmetric friction between the bottom surface of the curler and the ice point. This research proves this argument.
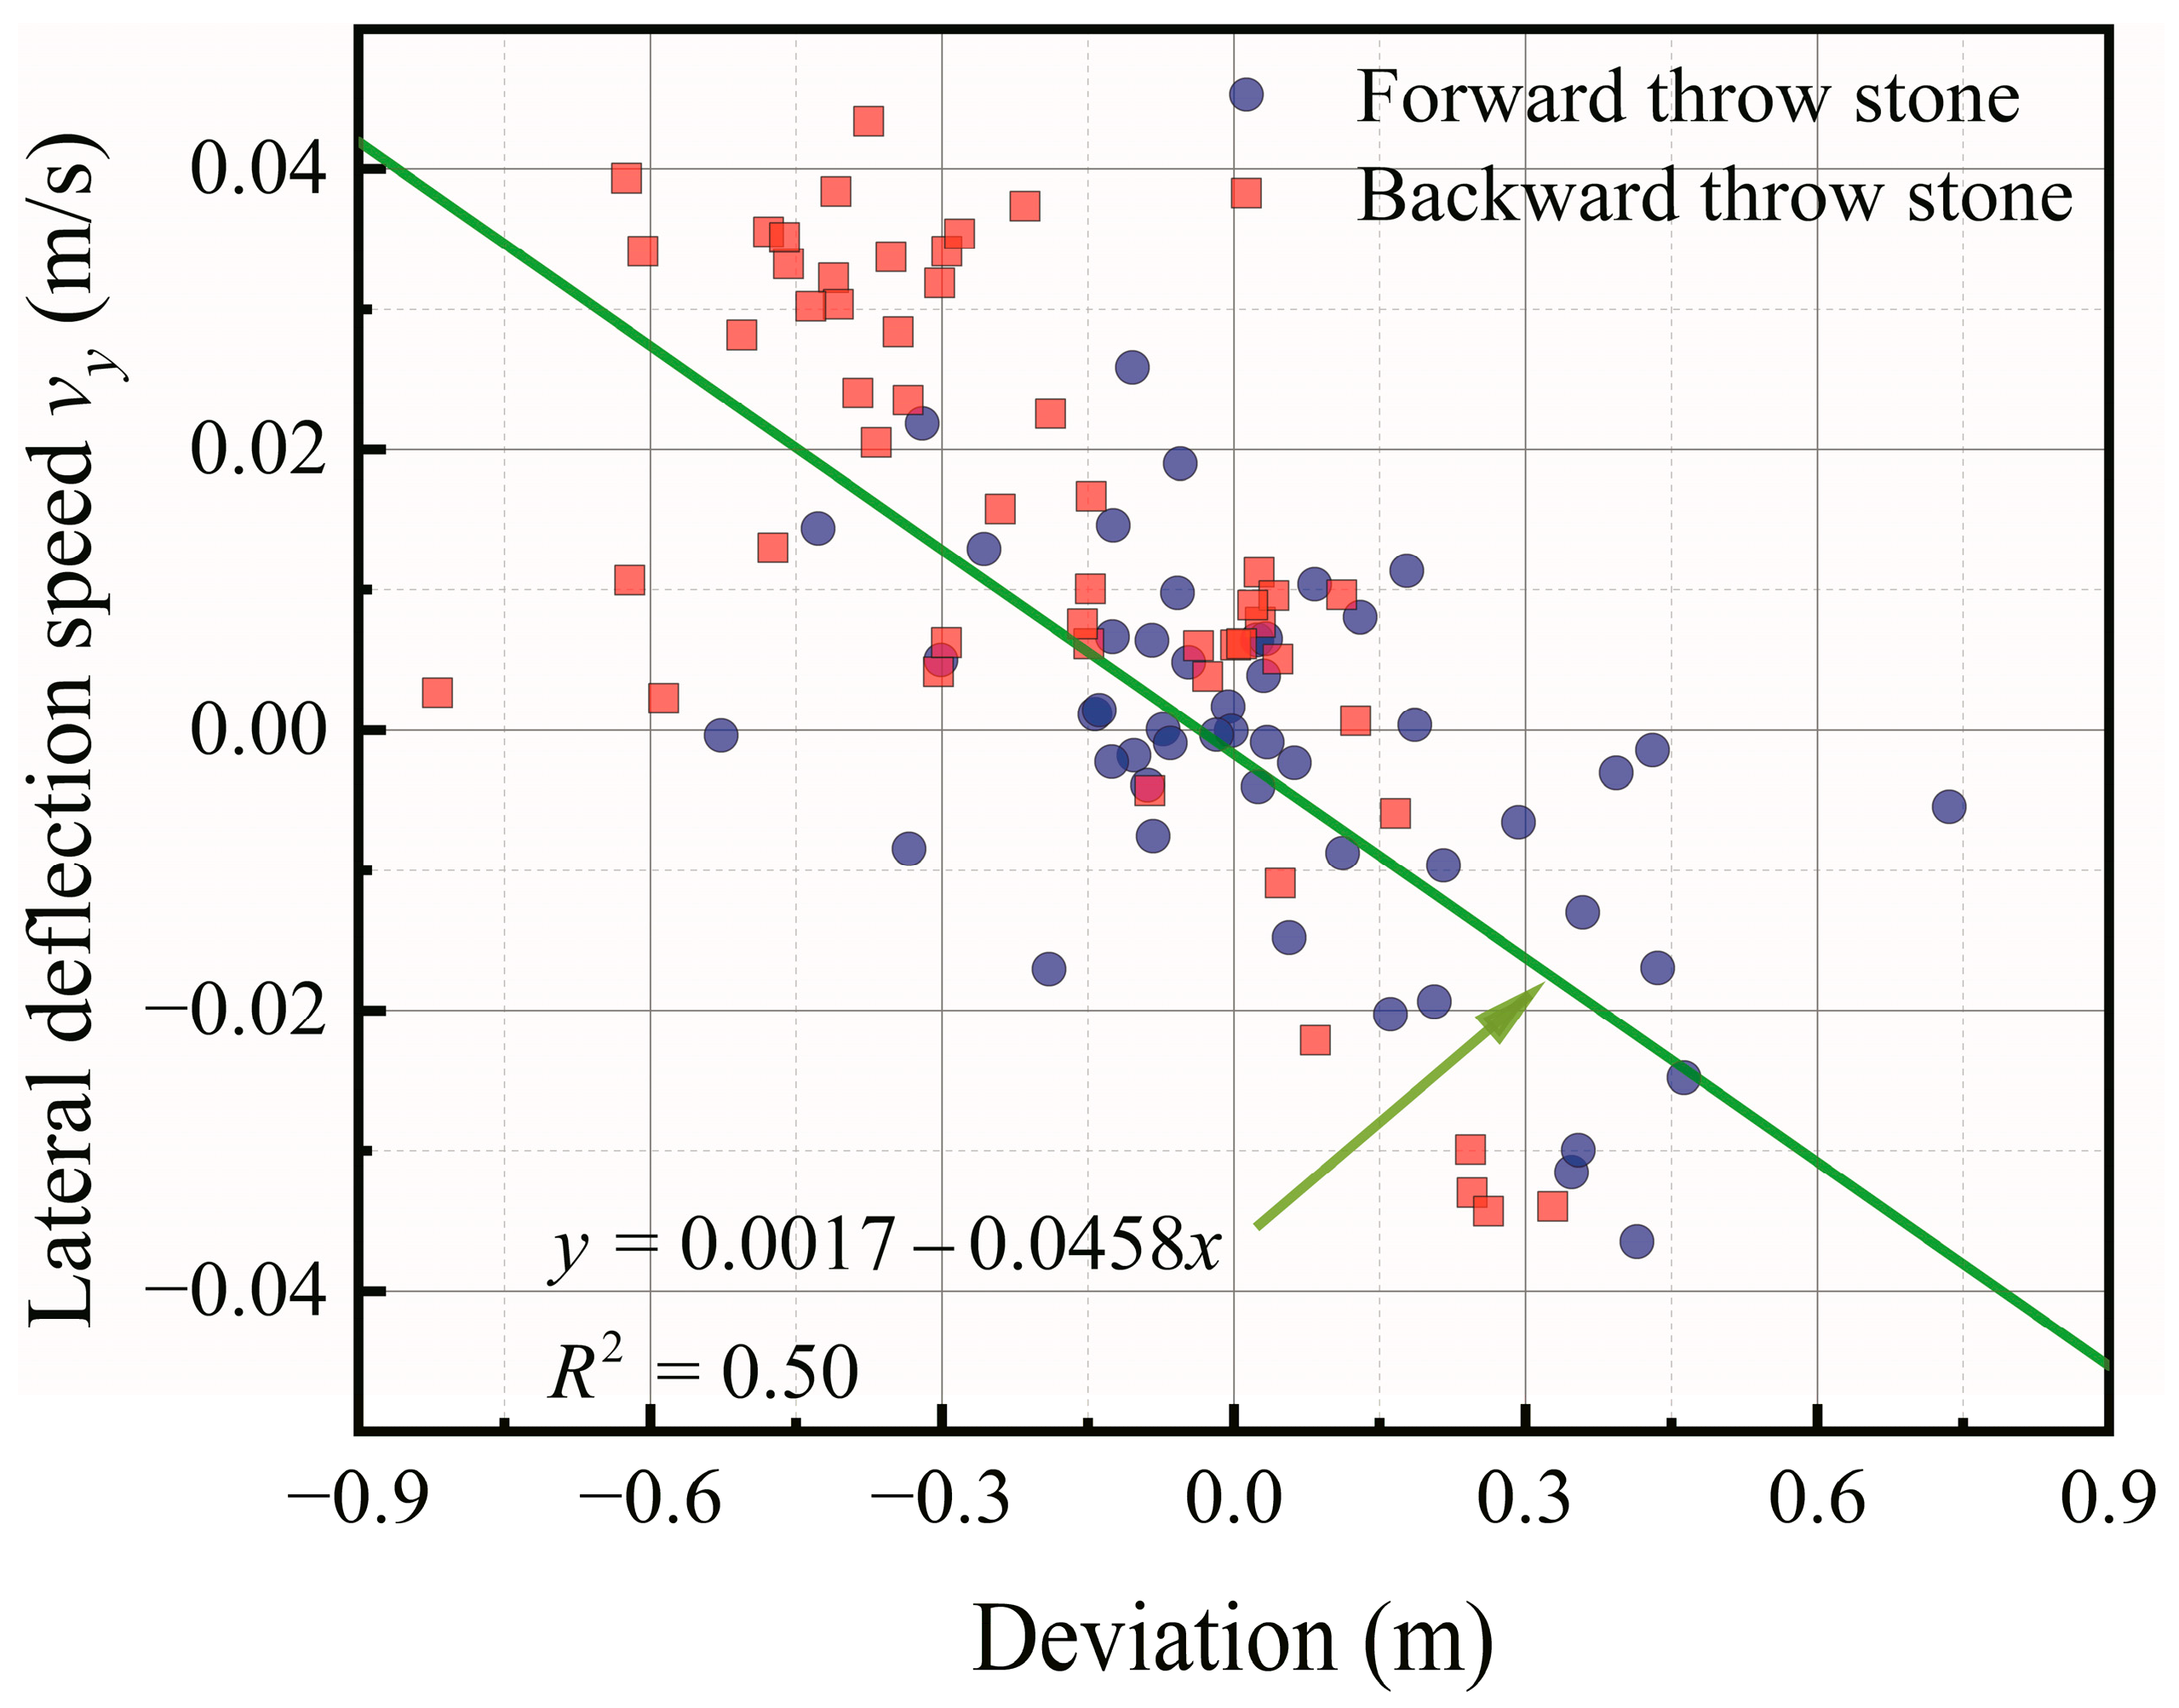
The initial lateral deflection speed provides an alternative way of thinking for determining the stone’s deviation. It can be noticed from
Figure 20 that the lateral deflection speed in the
y-direction and the deviation are linearly related with
R2 = 0.50, indicating that the higher the lateral deflection speed of the stone in the
y-direction when thrown, the greater its deviation in the opposite direction. Therefore, it is crucial for the athletes to control the lateral deflection speed of the stone.
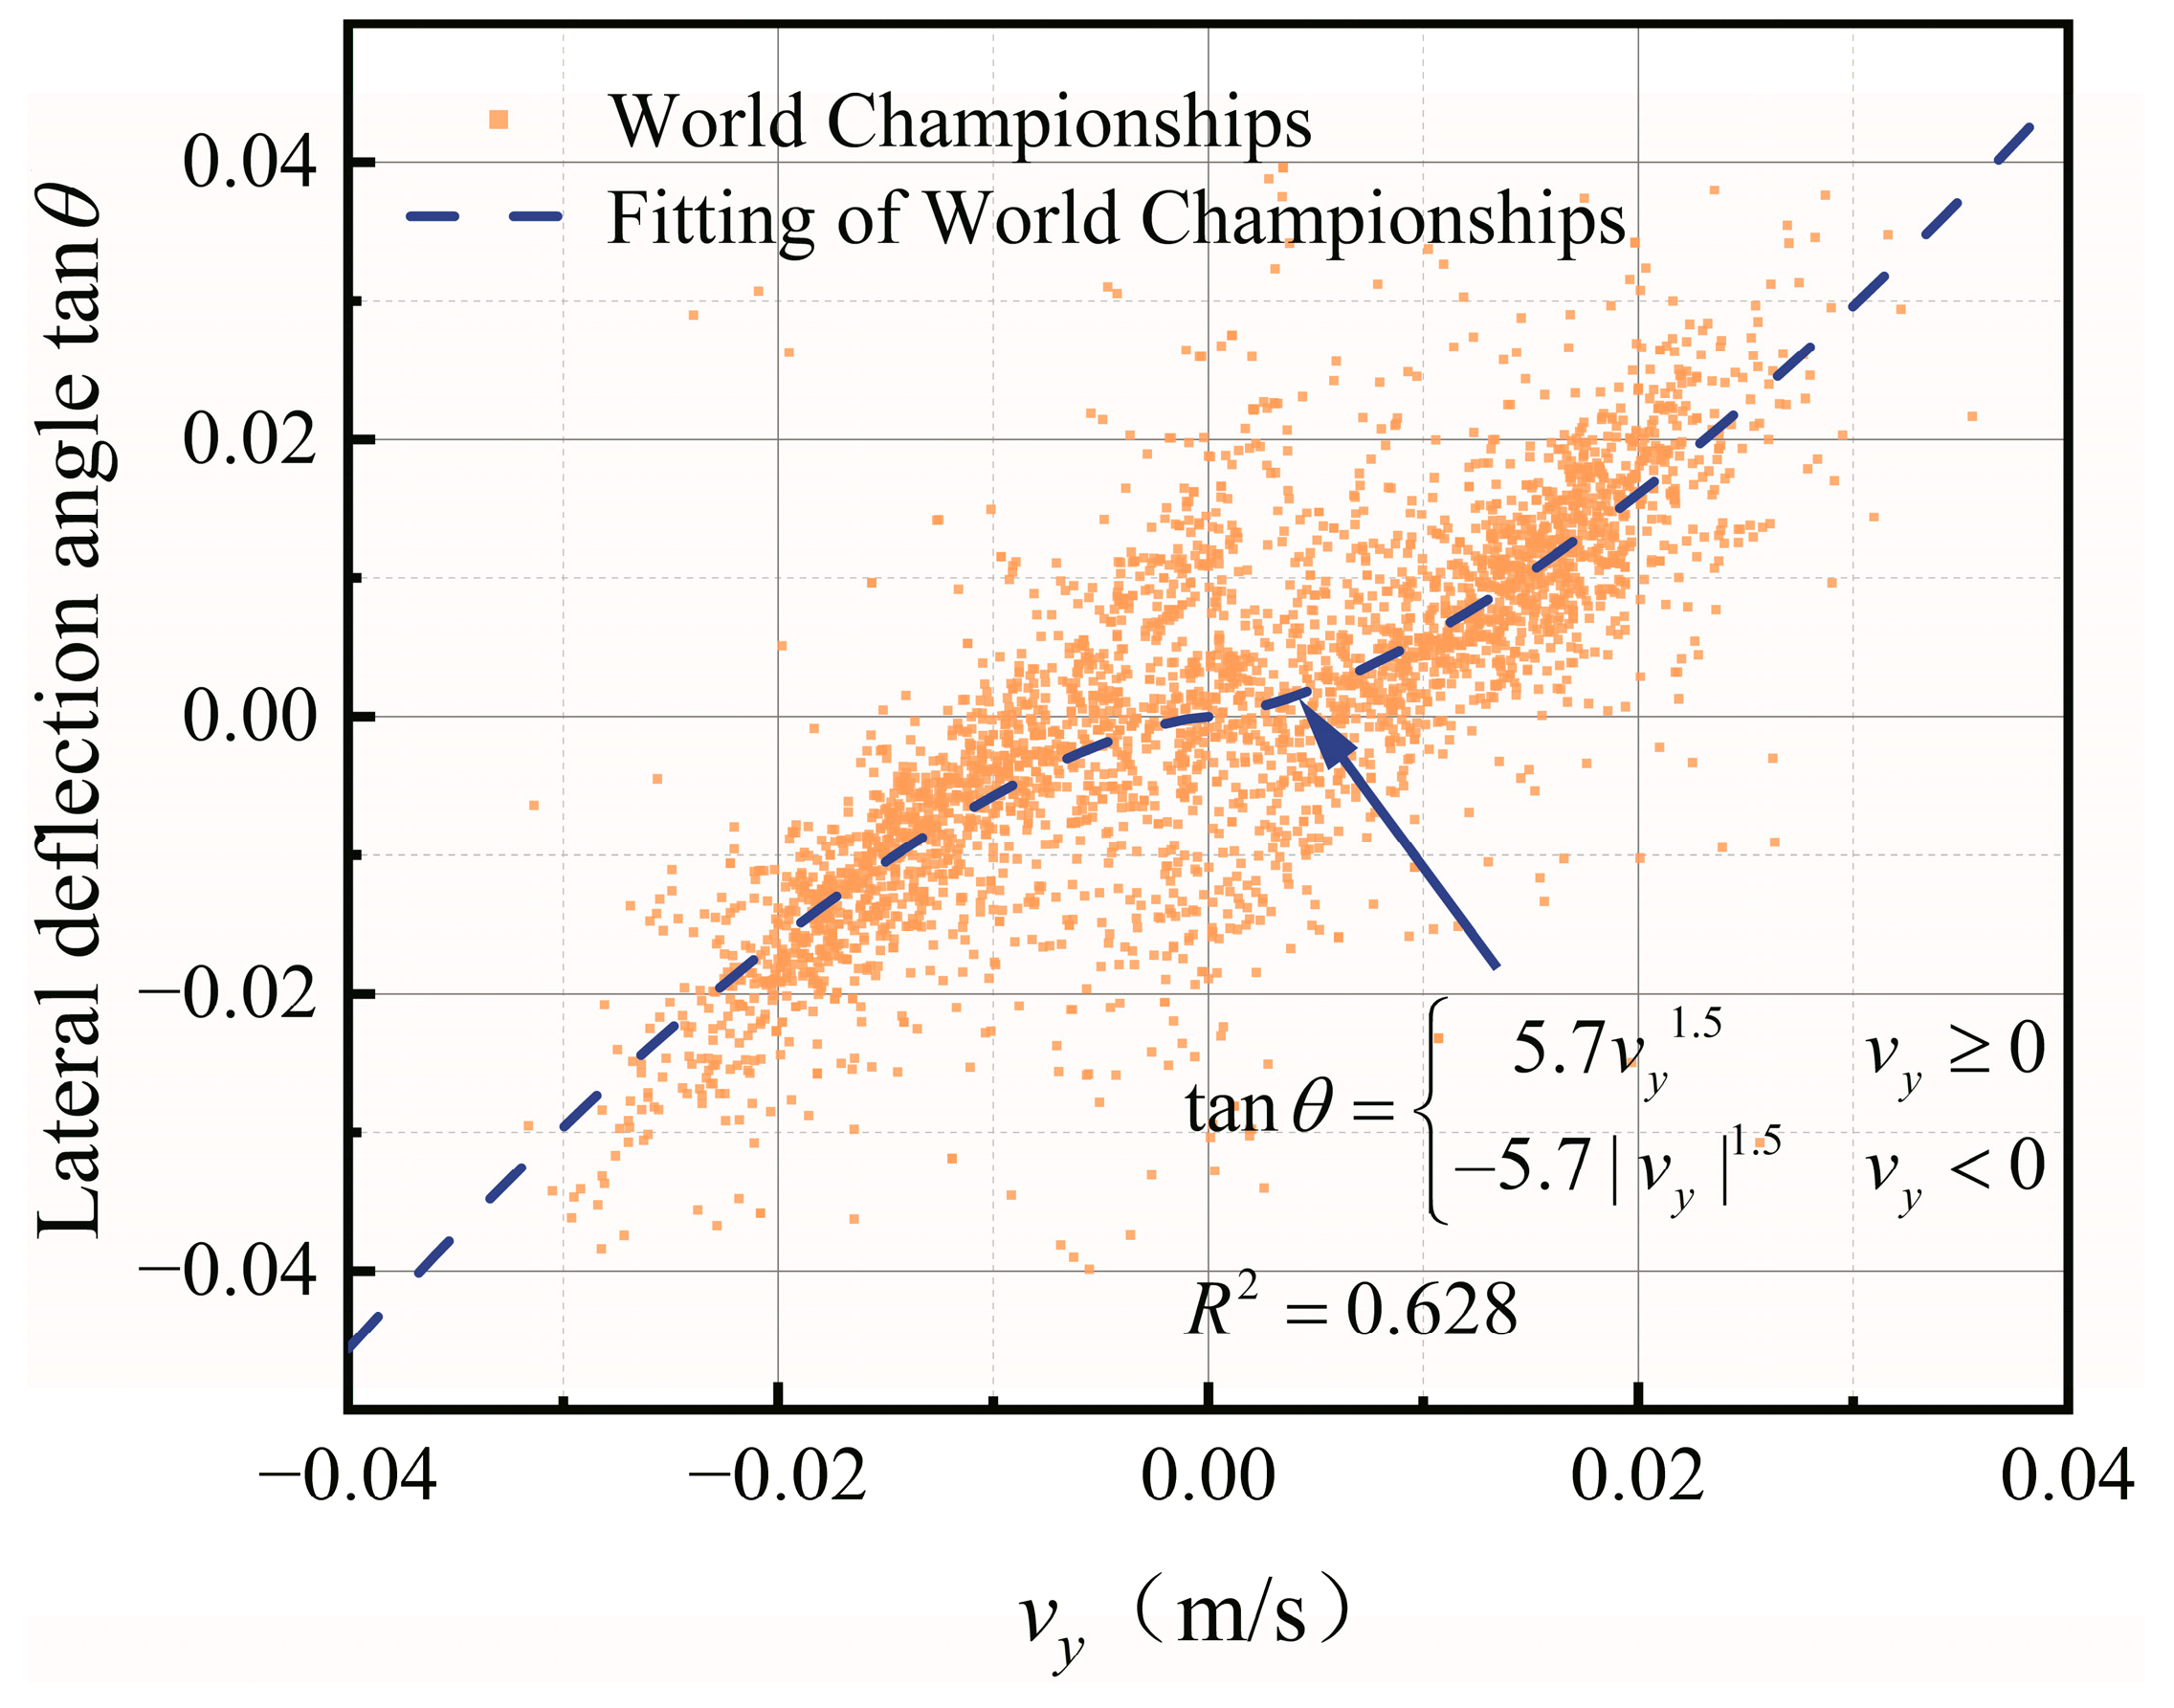
4.9. Relationship between Lateral Deflection and the Initial Speed
In order to help athletes determine the stop location of the stone, this section studies the relationship between lateral deflection, which is a more practical parameter compared to the deviation, and the initial speed.
According to
Section 4.7, the lateral deflection of the curling stone in the
y-direction between its final stop position and the initial position at the first hog line should be related to the initial lateral deflection speed
vy. In addition, according to
Figure 16, the lateral deflection in the
y-direction of the curling stone increases as the sliding distance increases. Therefore, the relationship between tan
θ (the tangent of the lateral deflection angle, that is, the ratio of the
y-direction lateral deflection of the curling stone to the
x-direction sliding distance) and the initial speed in the
y-direction
vy is analyzed to assist athletes in determining the final stop position. The relationship, similar to the power function, can be expressed as Equation (28).
where tan
θ is the tangent of the lateral deflection angle,
vy is the initial speed in the
y-direction at the first hog line, and
A and
B are constants to be determined.
When
A = 5.7 and
B = 1.5, the calculation results of Equation (28) can fit well with the World Championships’ measured data, as shown in
Figure 21. It can be noticed that the lateral deflection angle ranges in [−0.04, 0.04] increase as the initial speed
vy increases. The greater the absolute value of the initial speed in the
y-direction, the greater the rate of increase of the lateral deflection angle.
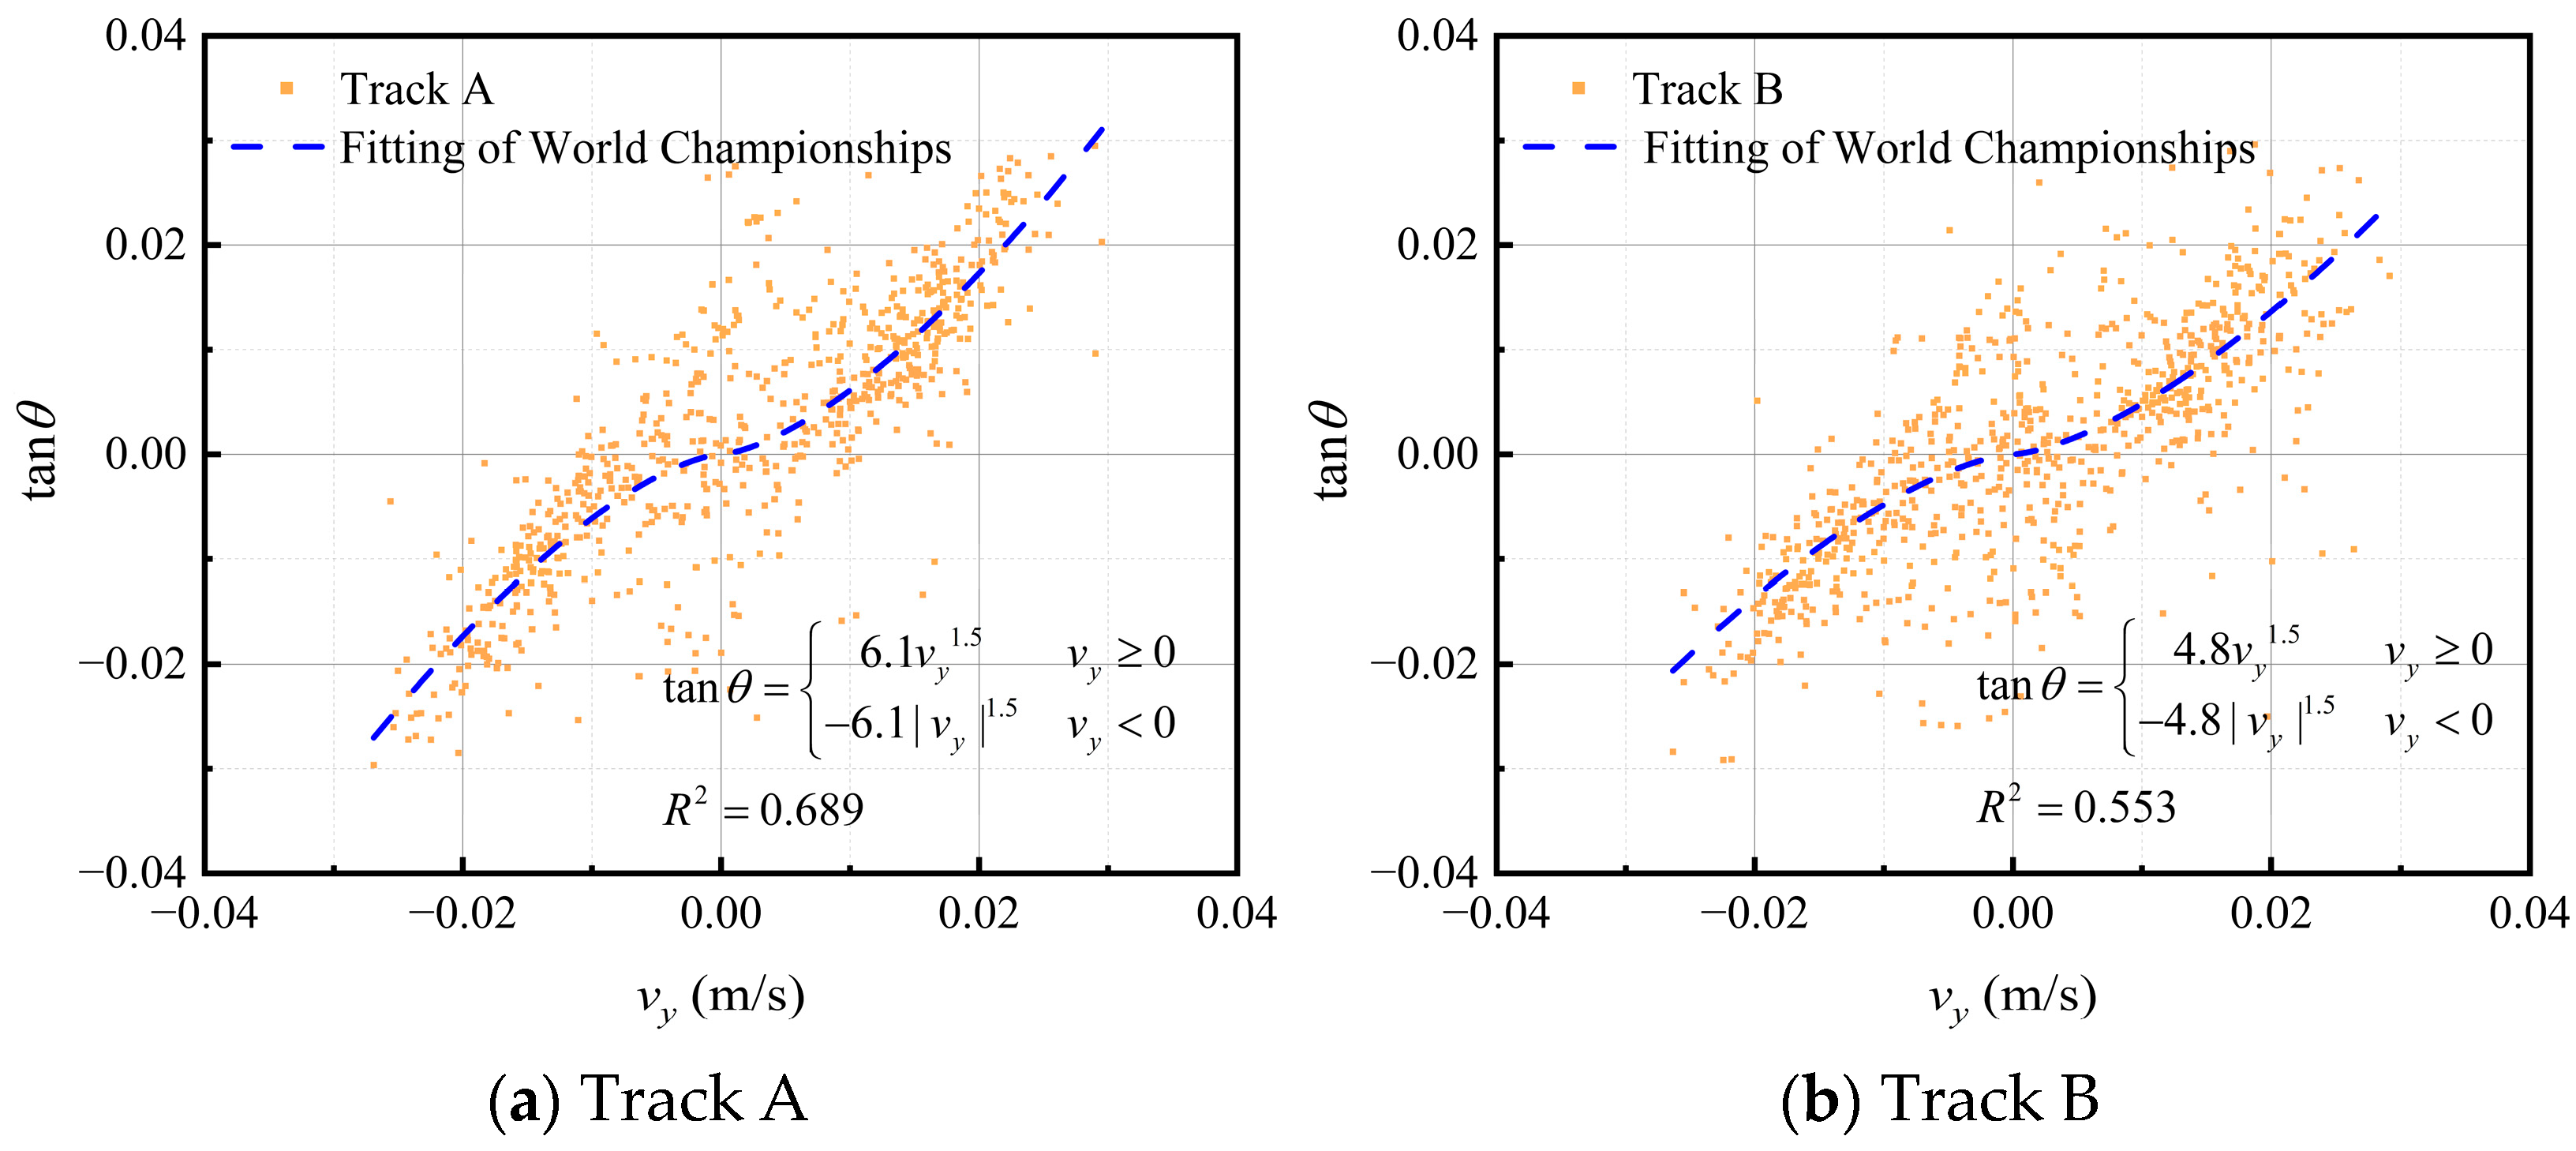
For the four tracks of the curling rink, the fitting results of lateral deflection at the same speed are not the same. This is shown in
Figure 22, with track A and track D having more significant lateral deflections, and track B and track C having more minor lateral deflections. Considering the proximity of the two outside tracks to the dehumidification ventilation ducts, as shown in
Figure 3, the results agree with the ice maker’s expectations.
Although the fitting results of Equation (28) agree with the measured data, this method still has an obvious drawback. The initial lateral speed in the y-direction is minimal, and the video recognition error dramatically impacts the results, which puts forward very high requirements for the precision and accuracy of video recognition.
4.10. Application
The results described above have been applied in the post-match operation of the National Aquatics Center to guide the production of Olympic-grade ice surfaces and to guide athletes to “read ice” accurately during training. Our research goes beyond theoretical analysis and has had a positive impact on practical applications. It has already changed the way curling venues are managed, enhancing athlete performance and the overall curling game experience.
For ice fabrication, curling venue operators and facility managers utilize our findings to fine-tune ice surfaces. By keeping the ice in the optimal temperature range, controlling the level of hardness, and adjusting the bump texture size to meet specific requirements, they provide curlers with consistently ideal playing conditions. This increases athlete satisfaction and enhances the quality of play. For athlete training, curling coaches and trainers incorporate our research into their training programs. They use the α parameter to assess ice conditions during training. Athletes received targeted coaching based on the specific ice conditions they encountered, resulting in improved overall performance levels.
These results highlight the importance of considering subtle differences in ice quality in curling and demonstrate the broader implications for sustainability and competitive excellence.

 ,
, 


