Article

Tribological Behavior of Ice on Rough Surfaces

Korea Research Institute of Ships and Ocean Engineering, 1312-32, Yuseongdaero, Yuseong-gu, Daejeon 305-343, Republic of Korea
*
Author to whom correspondence should be addressed.
Lubricants 2023, 11(8), 314; https://doi.org/10.3390/lubricants11080314
Submission received: 9 June 2023 / Revised: 12 July 2023 / Accepted: 14 July 2023 / Published: 25 July 2023
(This article belongs to the Special Issue Marine Tribology)

Abstract

:
Ice is a very unusual material that can not be explained by the basic physics of adhesion and friction when the ice contacts other solid materials. Several studies are being conducted to reduce resistance due to friction with sea ice during the design and construction of icebreakers that break sea ice and operate. However, fundamental studies on the frictional phenomenon of ice are very lacking because not only the frictional behavior is different depending on the shape of the hull, the coating condition, the ice state, and the speed of the ship, but also it is difficult to test and measure in actual sea areas. In this study, a test method for frictional force and coefficient using ice was introduced to accurately estimate the frictional resistance of icebreakers. The frictional characteristics of model ice and freshwater ice on various rough plates were investigated, and the frictional behavior under various test conditions was measured and evaluated. In particular, the friction change according to the difference in material and the roughness change in the same material, and the friction behavior according to the test conditions were measured. Test results show that the frictional coefficient of ice depends on the material of the plate, the roughness of the plates, lubrication conditions, and ice types. In addition, the tribological behavior of ice on rough surfaces is greatly influenced by the height characteristics parameters as well as the amplitude parameters of the roughness.

1. Introduction

Ice is water, frozen into a solid state; ice on land covers about 10% of the Earth’s land mass [1], while sea ice covers about 12% of the world’s oceans [2]. This ice not only disobeys the principles of basic physics of adhesion and friction when the ice contacts other solid materials but also is unusual in that the melting curve has a negative slope with the melting point at atmospheric pressure being at 273.15 K since ice increases in volume when water freezes. In addition, the elastic modulus and strength of ice show very different behaviors that depend on temperature, loading rate, impurity content, and ice formation history, so ice is a very difficult material to carry out the computational fluid dynamics (CFD) and the result of CFD with ice commonly makes many of error.
This strong adhesion of ice to other materials is a unique property of the ice-solid interface and greatly depends on their interface condition, such as the surface finish, the type of material, and the angle of contact between them. In contrast, there have been attempts to develop fast and effective instruments by using a property of low frictional coefficient, such as skates and skis [3]. Research on the adhesion and friction of ice, however, is still in its early stage.
James Thomson [4] insisted that a low frictional coefficient is caused by the pressure melting of ice due to the linear dependence of the freezing point depression on pressure. Michael Faraday [5], on the other hand, hypothesized that a thin film of liquid covered the surface of ice even at temperatures below freezing in 1859. John Joly [6] calculated that an ice sheet can melt and create a film of water at −3.5 °C when the skater skates because a skater’s blade contacts the ice over so small an area and the pressure of the blade edge is so great. But he could not figure out how to skate at temperatures lower than −3.5 °C. Osborne Reynolds [7] also explained frictional heating between ice and other materials to understand ice skating instead of pressure melting. Bowden et al. [8] published a paper associated with ice friction, focusing on the lubrication effect of pressure melting and frictional heat on ice. Evans et al. [9] developed semi-quantitative models for the frictional melting process, which predict the dependence of sliding speed and temperature.
Much of the literature related to ship-ice friction based on a low frictional coefficient with ice has been published. Enkvist [10] measured the frictional coefficient of ice with metal plates, and presented that the frictional coefficient of plates on ice decreases as the normal load increases. Ryvlin [11] carried out with freshwater ice, and presented that the coefficient of friction decreases at a load of 10 kPa or less. Vuorio [12] also showed that the coefficient of ice over a hull surface increases as the velocity increases. On the other hand, the coefficient of hull surface over ice remains constant when the velocity increases. Moreover, Vuorio stated that the surface roughness would affect the coefficient of friction greatly; however, it can not be applied in all cases. For instance, a plate coated by Inerta160 paint for ice-class vessels had a lower coefficient than an aluminum plate, even though the roughness of the plated coated by Inerta160 paint (1.6 μm, Ra) was much higher than that of the aluminum plate (0.3 μm, Ra). However, he never showed how the low frictional phenomena might be possible on a rough surface.
In 1991, Bell and Newbury [13] developed a coating method for ship models of ice tank using magnesium silicate (MgSi) powders to control the hull roughness, and Colbeck [14] also carried out many series of friction tests between snow and other materials. In recent, Somorjai [15] discovered that ice has a quasi-fluid layer that covers the surface of the ice, even when the ice is −129 °C, and Watanabe [16] conducted research on the influence of environmental conditions on road friction characteristics. Consequently, the layer makes the friction force on ice slippery, and he finally evaluated Faraday’s hypothesis.
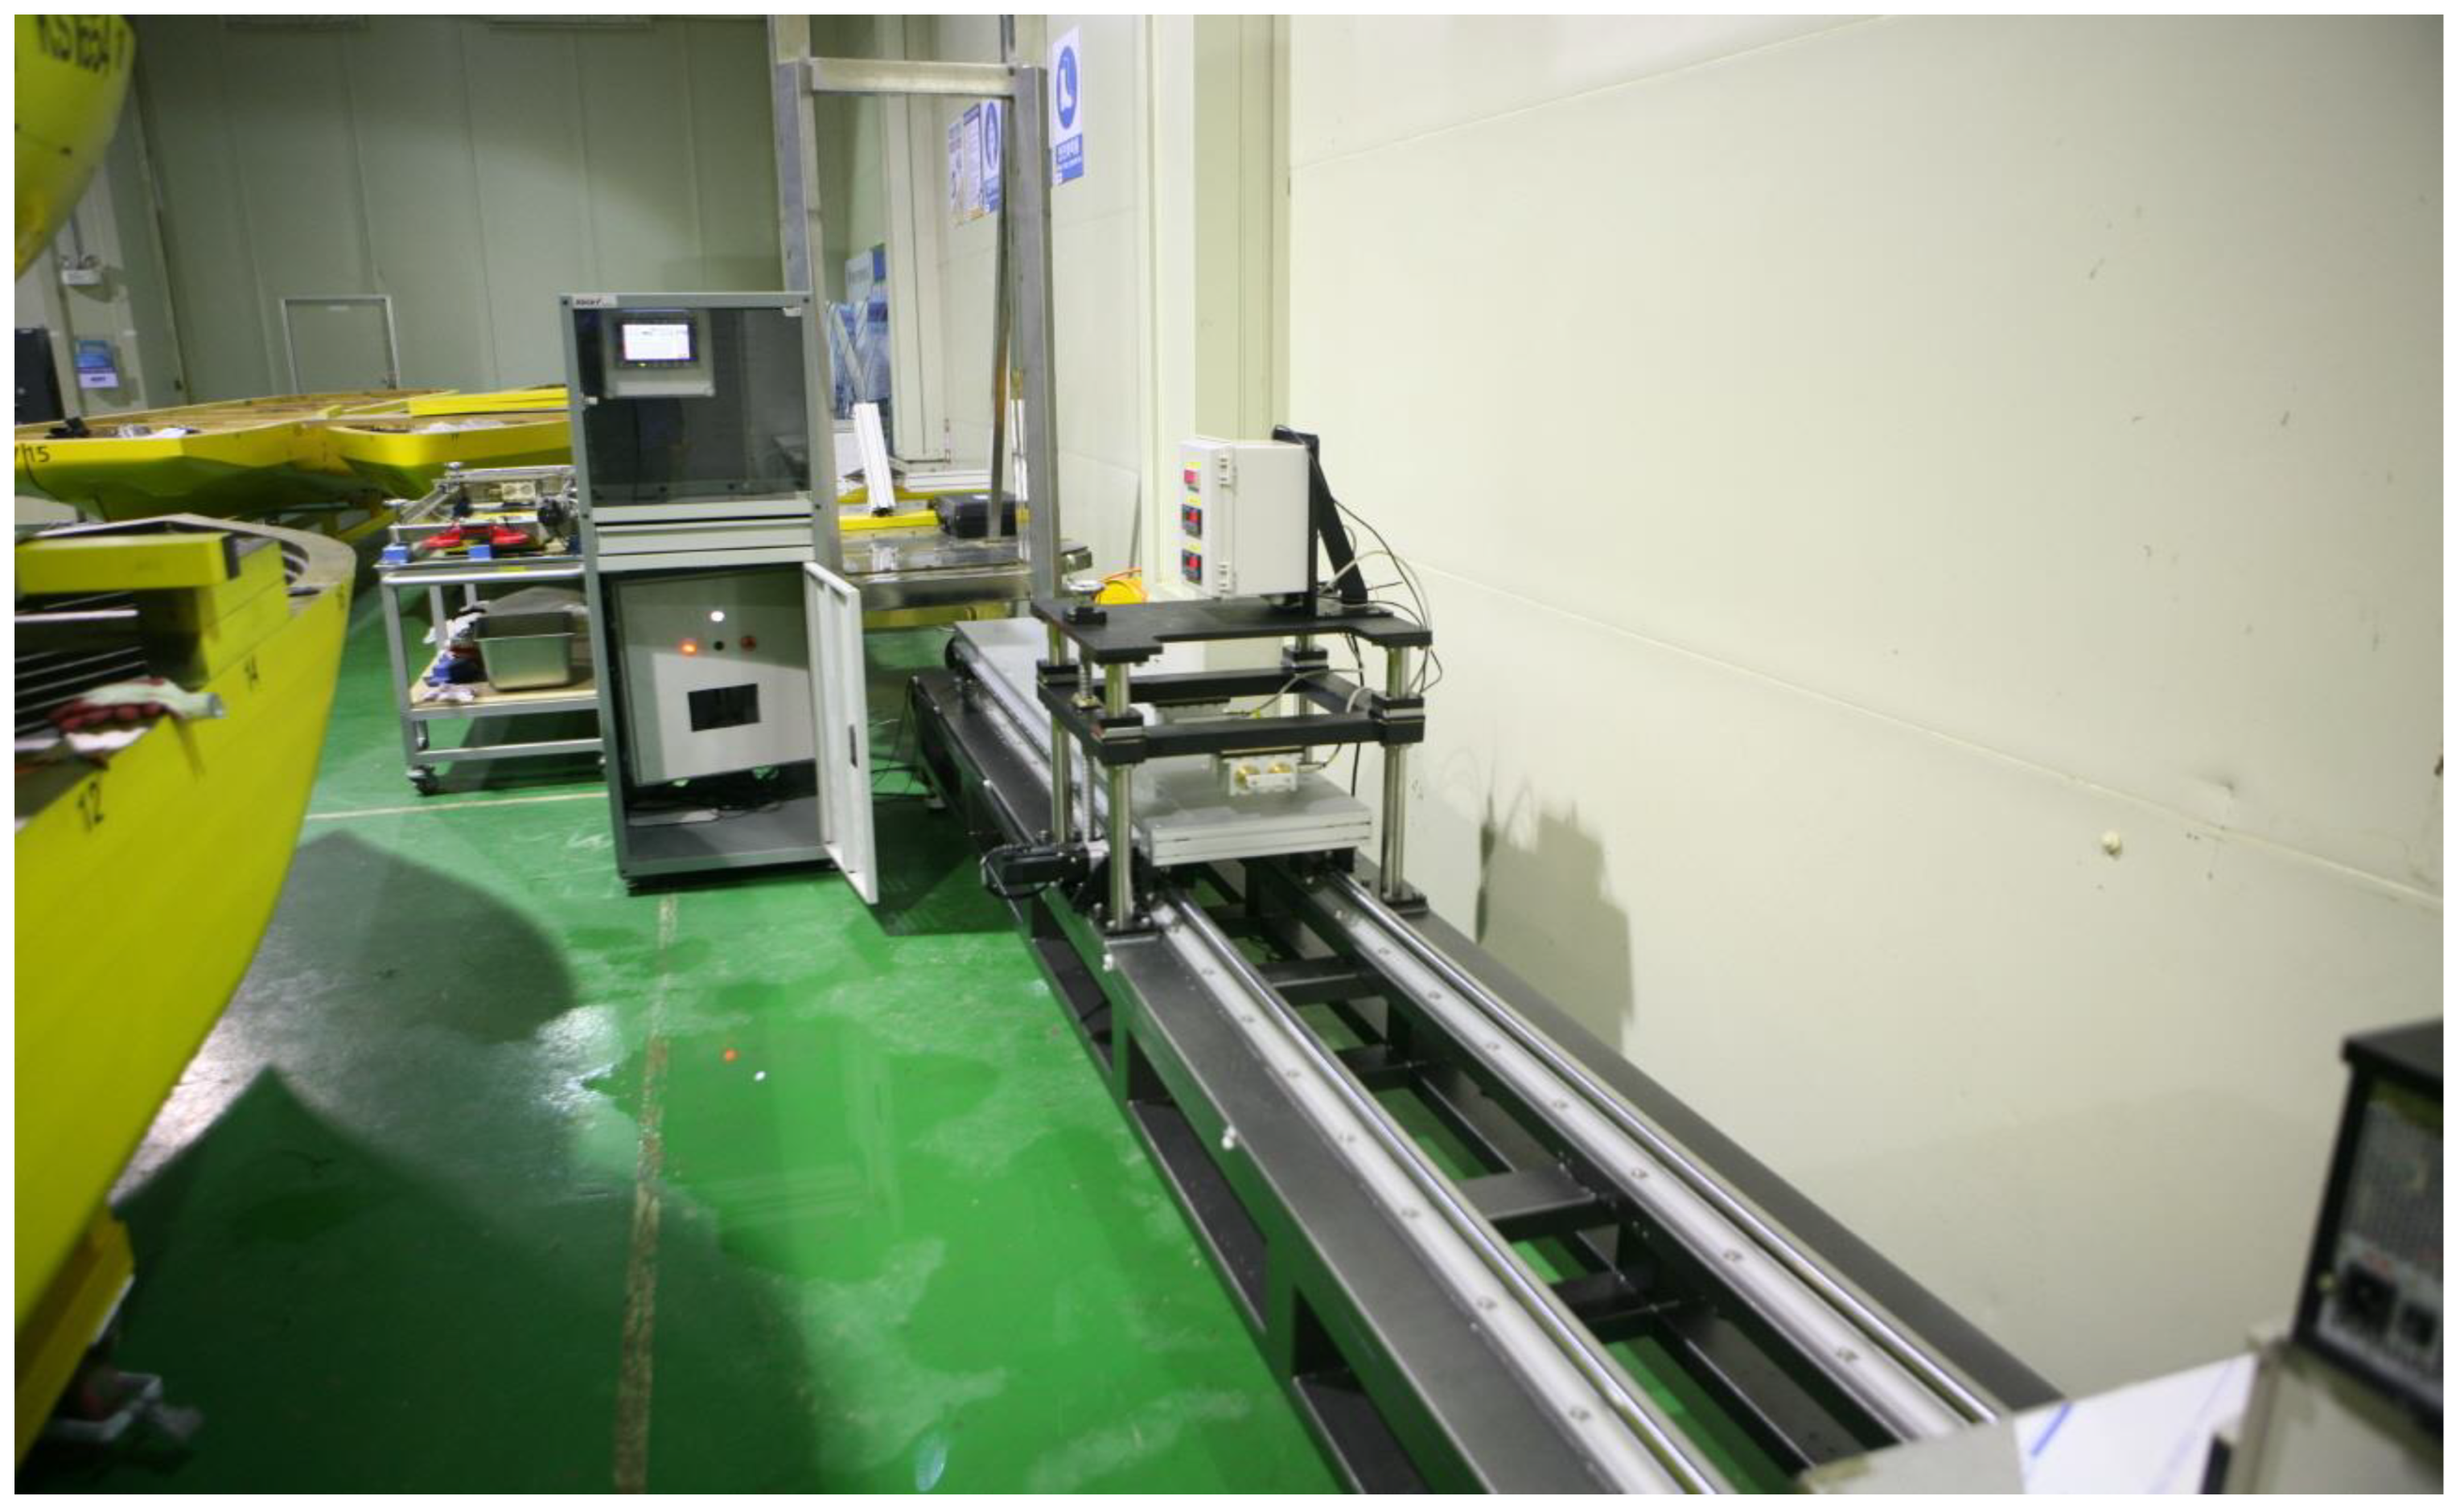
In this paper, various friction tests using freshwater ice and ethylene glycol/aliphatic detergent (EG/AD) model ices in the Korea Research Institute of Ships and Ocean Engineering (KRISO) ice tank [17] were conducted. The purpose of this study is to develop a test method to understand the friction behavior of ice on various plates and to find the friction mechanism of ice through the measured friction force. As a result of tests, the frictional coefficient of ice depends on the roughness of plates, lubrication condition, and ice types. In addition, the correlation between ice and various rough plates is studied, and we found that the friction with an ice greatly depends on the height characteristics roughness of the material (Rsk, Rku) as well as the amplitude roughness of the material (Ra, Rt, etc.). This study is intended to contribute to the development of painting materials and methods for ice-breaking vessels because these parameters are affected by surface finishing and painting.

2. Experimental Setup

2.1. Ice

In this study, two types of ice, EG/AD model ice and freshwater ice, are used. The model ice (see Figure 1a) is a special ice; that has uniform mechanical and physical properties for model tests, and of which the strength and elastic modulus are weaker than those of freshwater ice. Moreover, micro-bubbles are put in order to adjust the density of model ice during its creation in the ice tank. In addition, the roughness of EG/AD model ice is generally more rugged than it freshwater ice because of micro-bubbles and a layer of frost, which adhered to the top of the model ice. The thickness of the model ice was more than 35 mm, and its flexural strength was greater than the target strength (30 kPa) because the specimen of model ice was cut from the ice tank and moved to a friction force measurement device. To evaluate the effect of the surface of the model ice, we tested both the top and bottom surfaces; the top surface comes into contact with the air, whereas the bottom surface is immersed in the tank water [18]. As a result, we carried out the test with the top surface in this study because there was no difference between the top and bottom surfaces.
Some freshwater ice sheets were also used to understand accurate friction phenomena with ice, as shown in Figure 1b. It is too difficult to prepare a flat and uniform freshwater ice sheet in a water tank because the volume of freshwater ice expands a little when the water is frozen into a solid state. Therefore, we first refrigerated water in a square bucket in the freezer, and all the water was frozen for 20 h. Second, we sawed the whole piece of ice into several sheets with an electric sawing machine. Then, we ground each ice sheet on the stainless steel to prepare them equally, as shown in Figure 1b.

2.2. Rough Plates

The test plates were classified into two groups. The first group was selected to verify the frictional coefficient of various materials, such as a steel plate with powder coating, uncoated stainless steel plate, glass plate, and rubber pad, as shown in Figure 2. Their length is bigger than 1 m, and their surfaces were cleaned with water and were dry carefully. Before the tests, the plates were kept at 0–3 °C of air temperature for 1 day.
The second group consisted of a conventional painting plate applied to a commercial ship model at the KRISO towing tank, 8 plates containing various amounts of magnesium silicate (MgSi), and two gel coat plates. The conventional painting method is spraying a mixture that consists of clear lacquer and diluent in a ratio of 1:4, and the MgSi painting method injects the conventional mixture with various amounts of MgSi two times. The gel coat solid plate is sprayed in the air and coated as a solid type; meanwhile, the gel coat liquid is directly dispensed in close proximity to the surface of the sample and coated as a liquid type. The size of all plates in the second group is 1000 mm long by 300 mm wide by 40 mm thick (Figure 3).

2.3. Friction Measurement Device

We developed a friction force measurement device to measure the coefficient of friction between the hull sample and ices, as shown in Figure 4 [18]. This device measures the friction force of the test sample over the ice as well as the force directly over the ice touching the flat part of the model ship. The normal load is provided by a deadweight. The tray that holds the specimen of ices is moved along a track by a motor. The tray speed can be automatically controlled in a range of 0.01–0.9 m/s by a computer. The friction force is measured with a sample rate of 100 Hz by a load cell that is attached to the tray when a sample of the ices moves on a test sample. The coefficient of friction between ice and the tested plate can be expressed as a combination of the measured friction force F f , the weight of deadweight W d , and the weight of ice W i .
μ = F f W d + W i
The ice friction test was performed by placing ice on the plate and adding weight to it, and there was no significant difference from the test result by placing the plate on the ice. In addition, the moving speed of the ice was selected considering the speed at which ships operate in the ice-covered water.

2.4. Roughness Measurement Device

We measured and acquired the hull roughness of the tested plates by using the Mitutoyo SJ-210. The Surftest SJ-210 is a shop-floor type of surface roughness measuring instrument that traces the surfaces of various machine parts, calculates their surface roughness based on roughness standards, and displays the results. Before the test, we conducted the calibration of the SJ-210 with a calibration stage. The measurement length (λc) and the measurement number in this test were 0.8 mm and five times, respectively. Figure 5 shows how to actually measure the hull roughness using simple probe of the SJ-210.
We measured the amplitude parameters, such as R a , R q , R t , height characteristic parameters such as R s k , R k u , spacing parameter R s m , and hybrid parameter R Δ q , etc. Each parameter can be defined as dictated in Table 1.
The roughness of all sample plates was measured with every 50 mm interval in width and length. Therefore, approximately 100 points were measured for each sample plate, and we took the mean of the roughness.

3. Results and Discussion

3.1. Surface Roughness Parameters

The results of the measurement of surface roughness are dictated in Table 2. We did not measure the roughness of two plates that are painted with 5 g and 36 g of MgSi because of the damage to the plates after the friction test. The height characteristics, spacing, and hybrid parameters were measured for only major plates since the measuring and analyzing time were needed for a long time.
The amplitude parameters from Ra to Rt were measured with a consistency; namely, the glass plate had the smallest Ra and Rt in prepared rough plates. What is noticeable here is that the amplitude parameters increase as the amount of MgSi increases, and the coated plate with a MgSi of 2 g would not be prepared correctly. On the other hand, RSk, which is one of the height characteristic parameters, varied regardless of the amount of MgSi according to the painting situation. A small RSk means the positive range of the roughness profile, which is higher than the mean line and is bigger than the negative range of the roughness profile in the whole roughness profile. In addition, the RSk of other material plates would be determined according to the painting method and condition. Moreover, Rku, which is the other height characteristic parameter, changed from 2.25 to 5.05 related to the painting condition. As the amount of MgSi increases, the Rku generally grows bigger, and a probability density of the roughness profile focuses on the mean line. Hence, the roughness profile is sharp. In the case of the spacing parameter, RSm is independent of the amount of MgSi and depends on the painting condition. The RΔq, which is the hybrid parameter, increases as the amplitude parameter is bigger or the amount of MgSi increases.

3.2. Frictional Coefficient with Different Materials

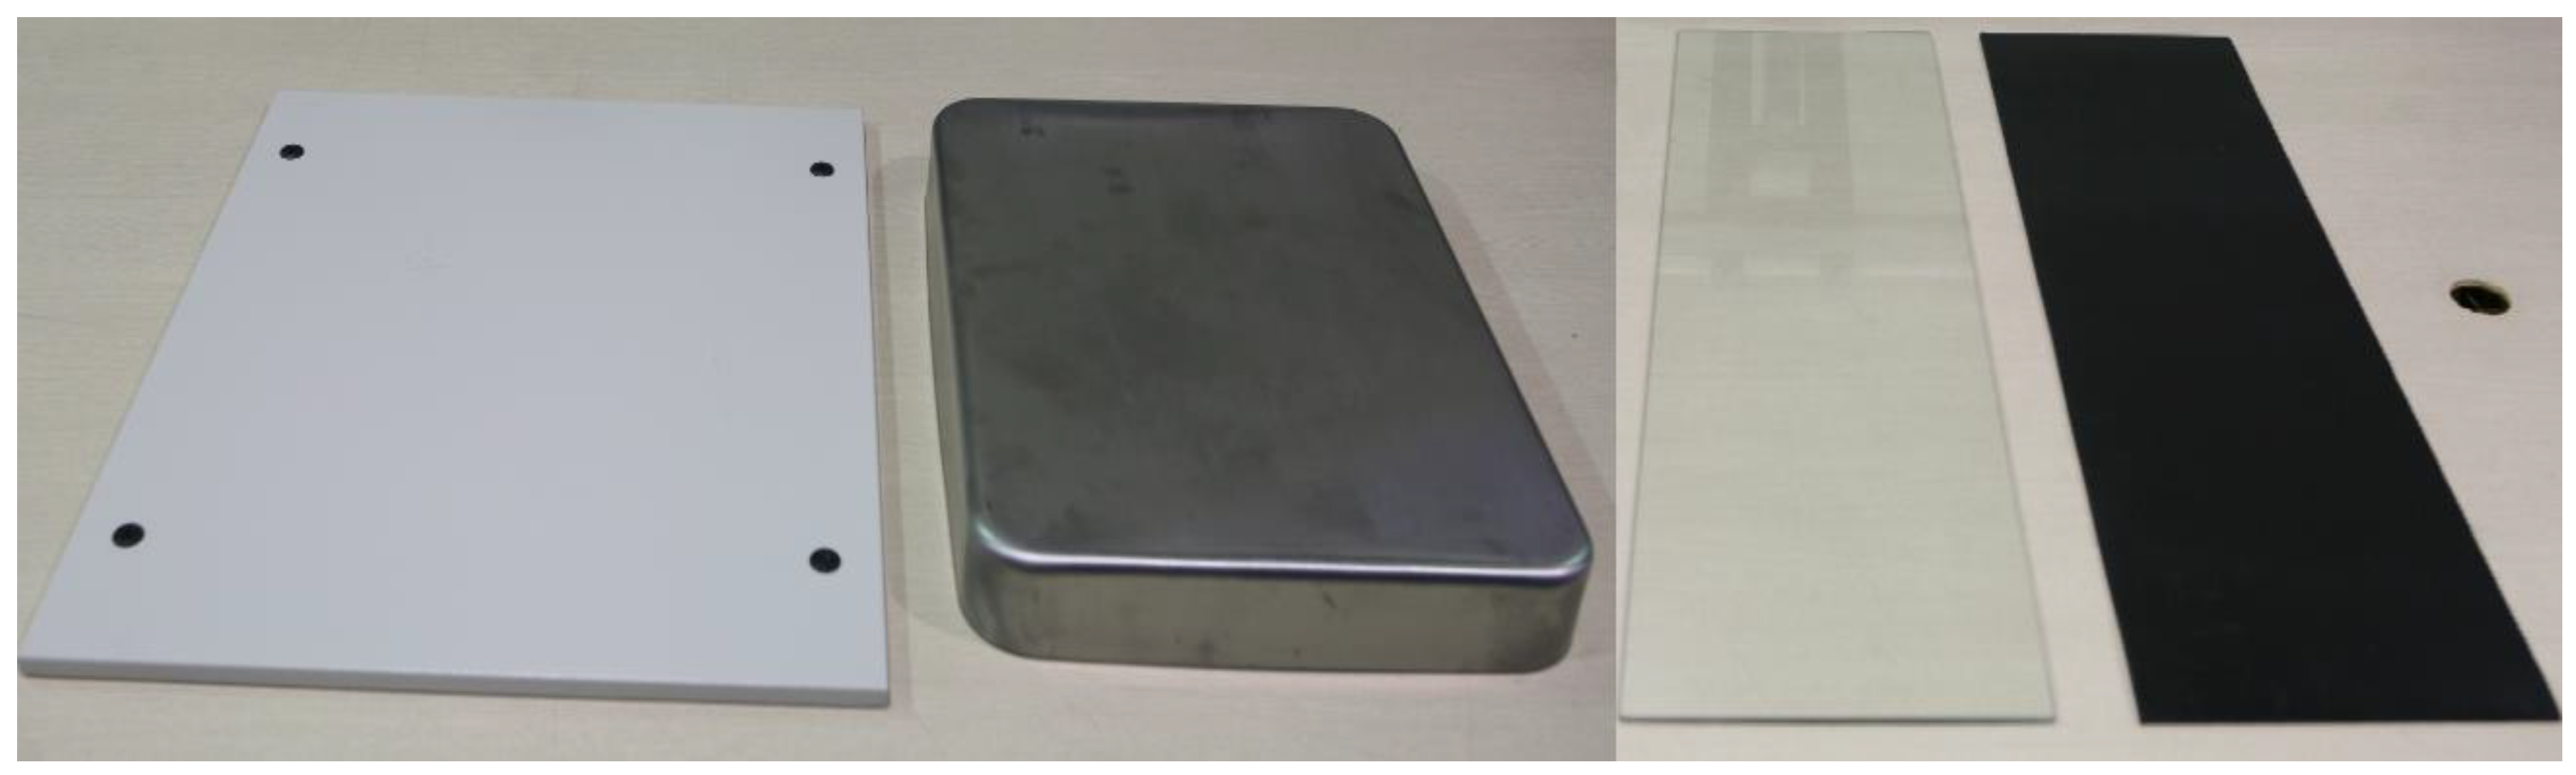
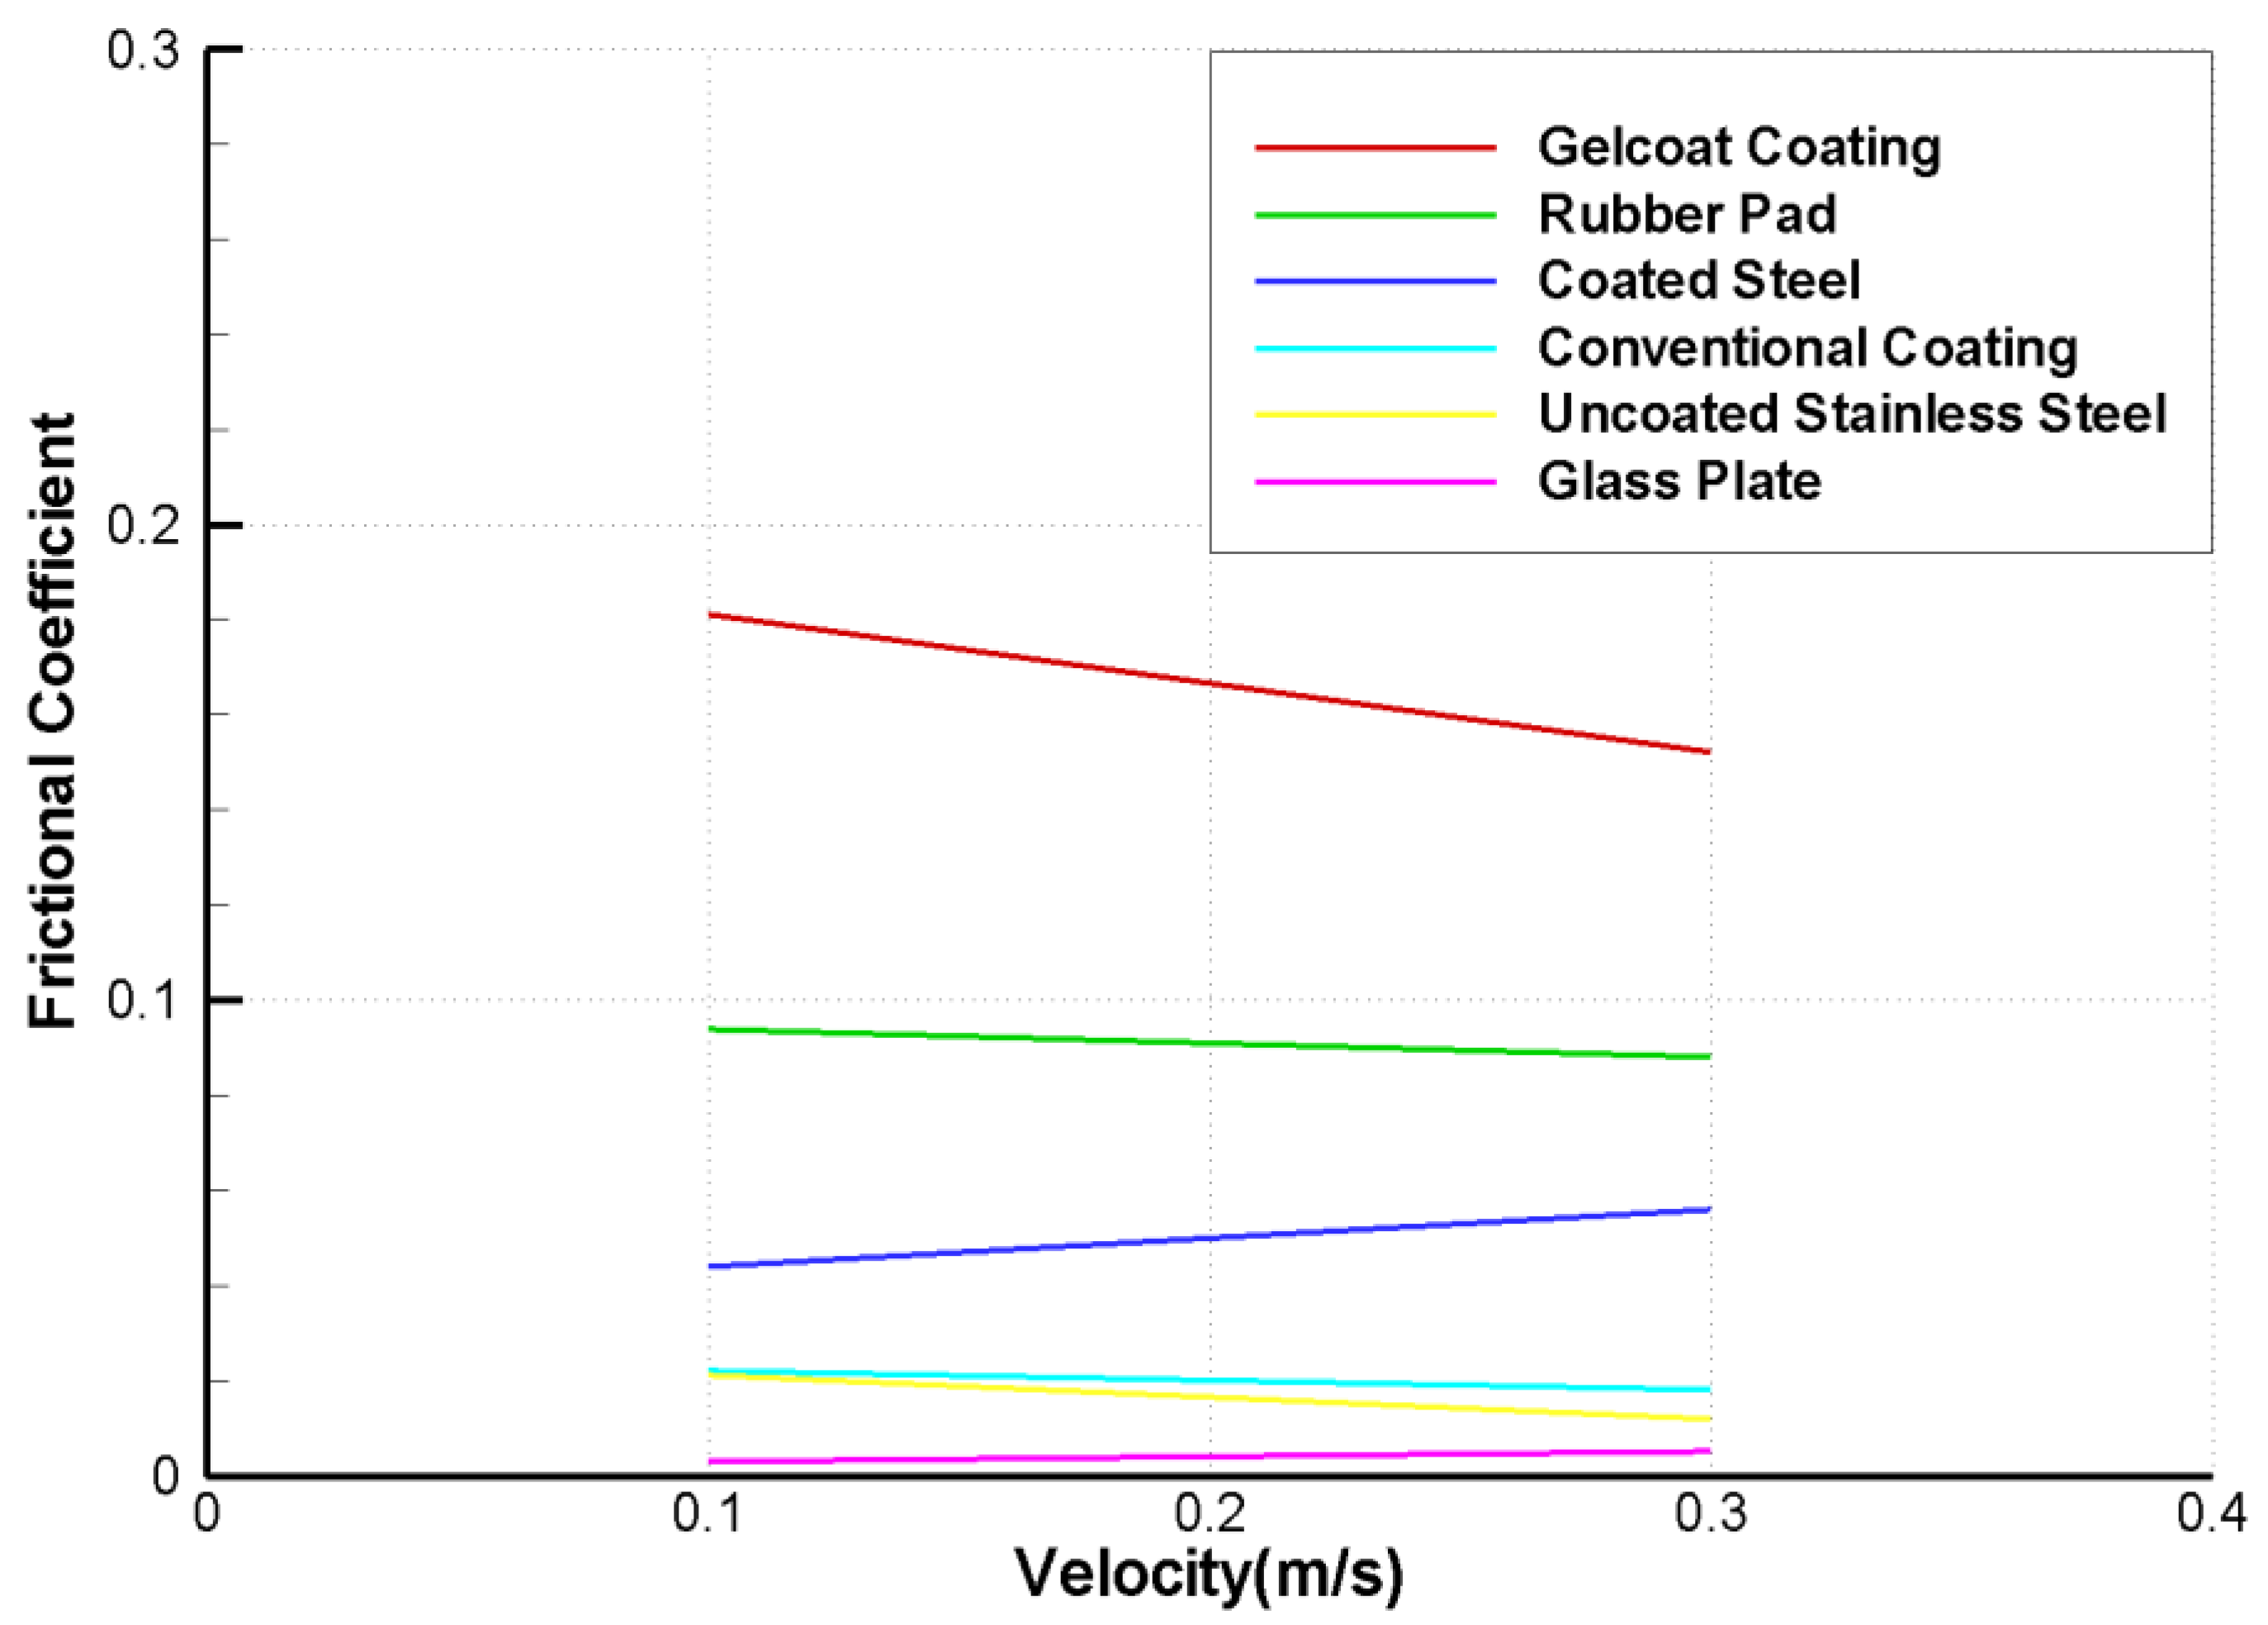
Some friction forces with various materials were measured, and their frictional coefficients were calculated in order to study a fundamental mechanism of ice friction. The EG/AD model ice was used, and the friction tests were conducted at an ambient temperature of 0 °C with two speeds (0.1 and 0.3 m/s). By using two weights of 5 kg and 10 kg, two repeat tests were carried out, and each frictional coefficient was taken on an average from four values, as shown in Figure 6. The glass plate, which had the smallest surface roughness in amplitude parameters, shows the lowest frictional coefficient of the tested plates. Generally, the frictional coefficient increases as the surface roughness increases; however, the coefficients of the rubber pad and coated steel have no concern with their amplitude parameters. In addition, the frictional coefficient with ice would not depend on the moving speed, excluding a gelcoat coating plate. The coefficient of the coated steel was near 0.05, and we realized that many ice tanks use 0.05 to 0.10 as a standard ice frictional coefficient [19].

3.3. Frictional Coefficient with Changing Velocity

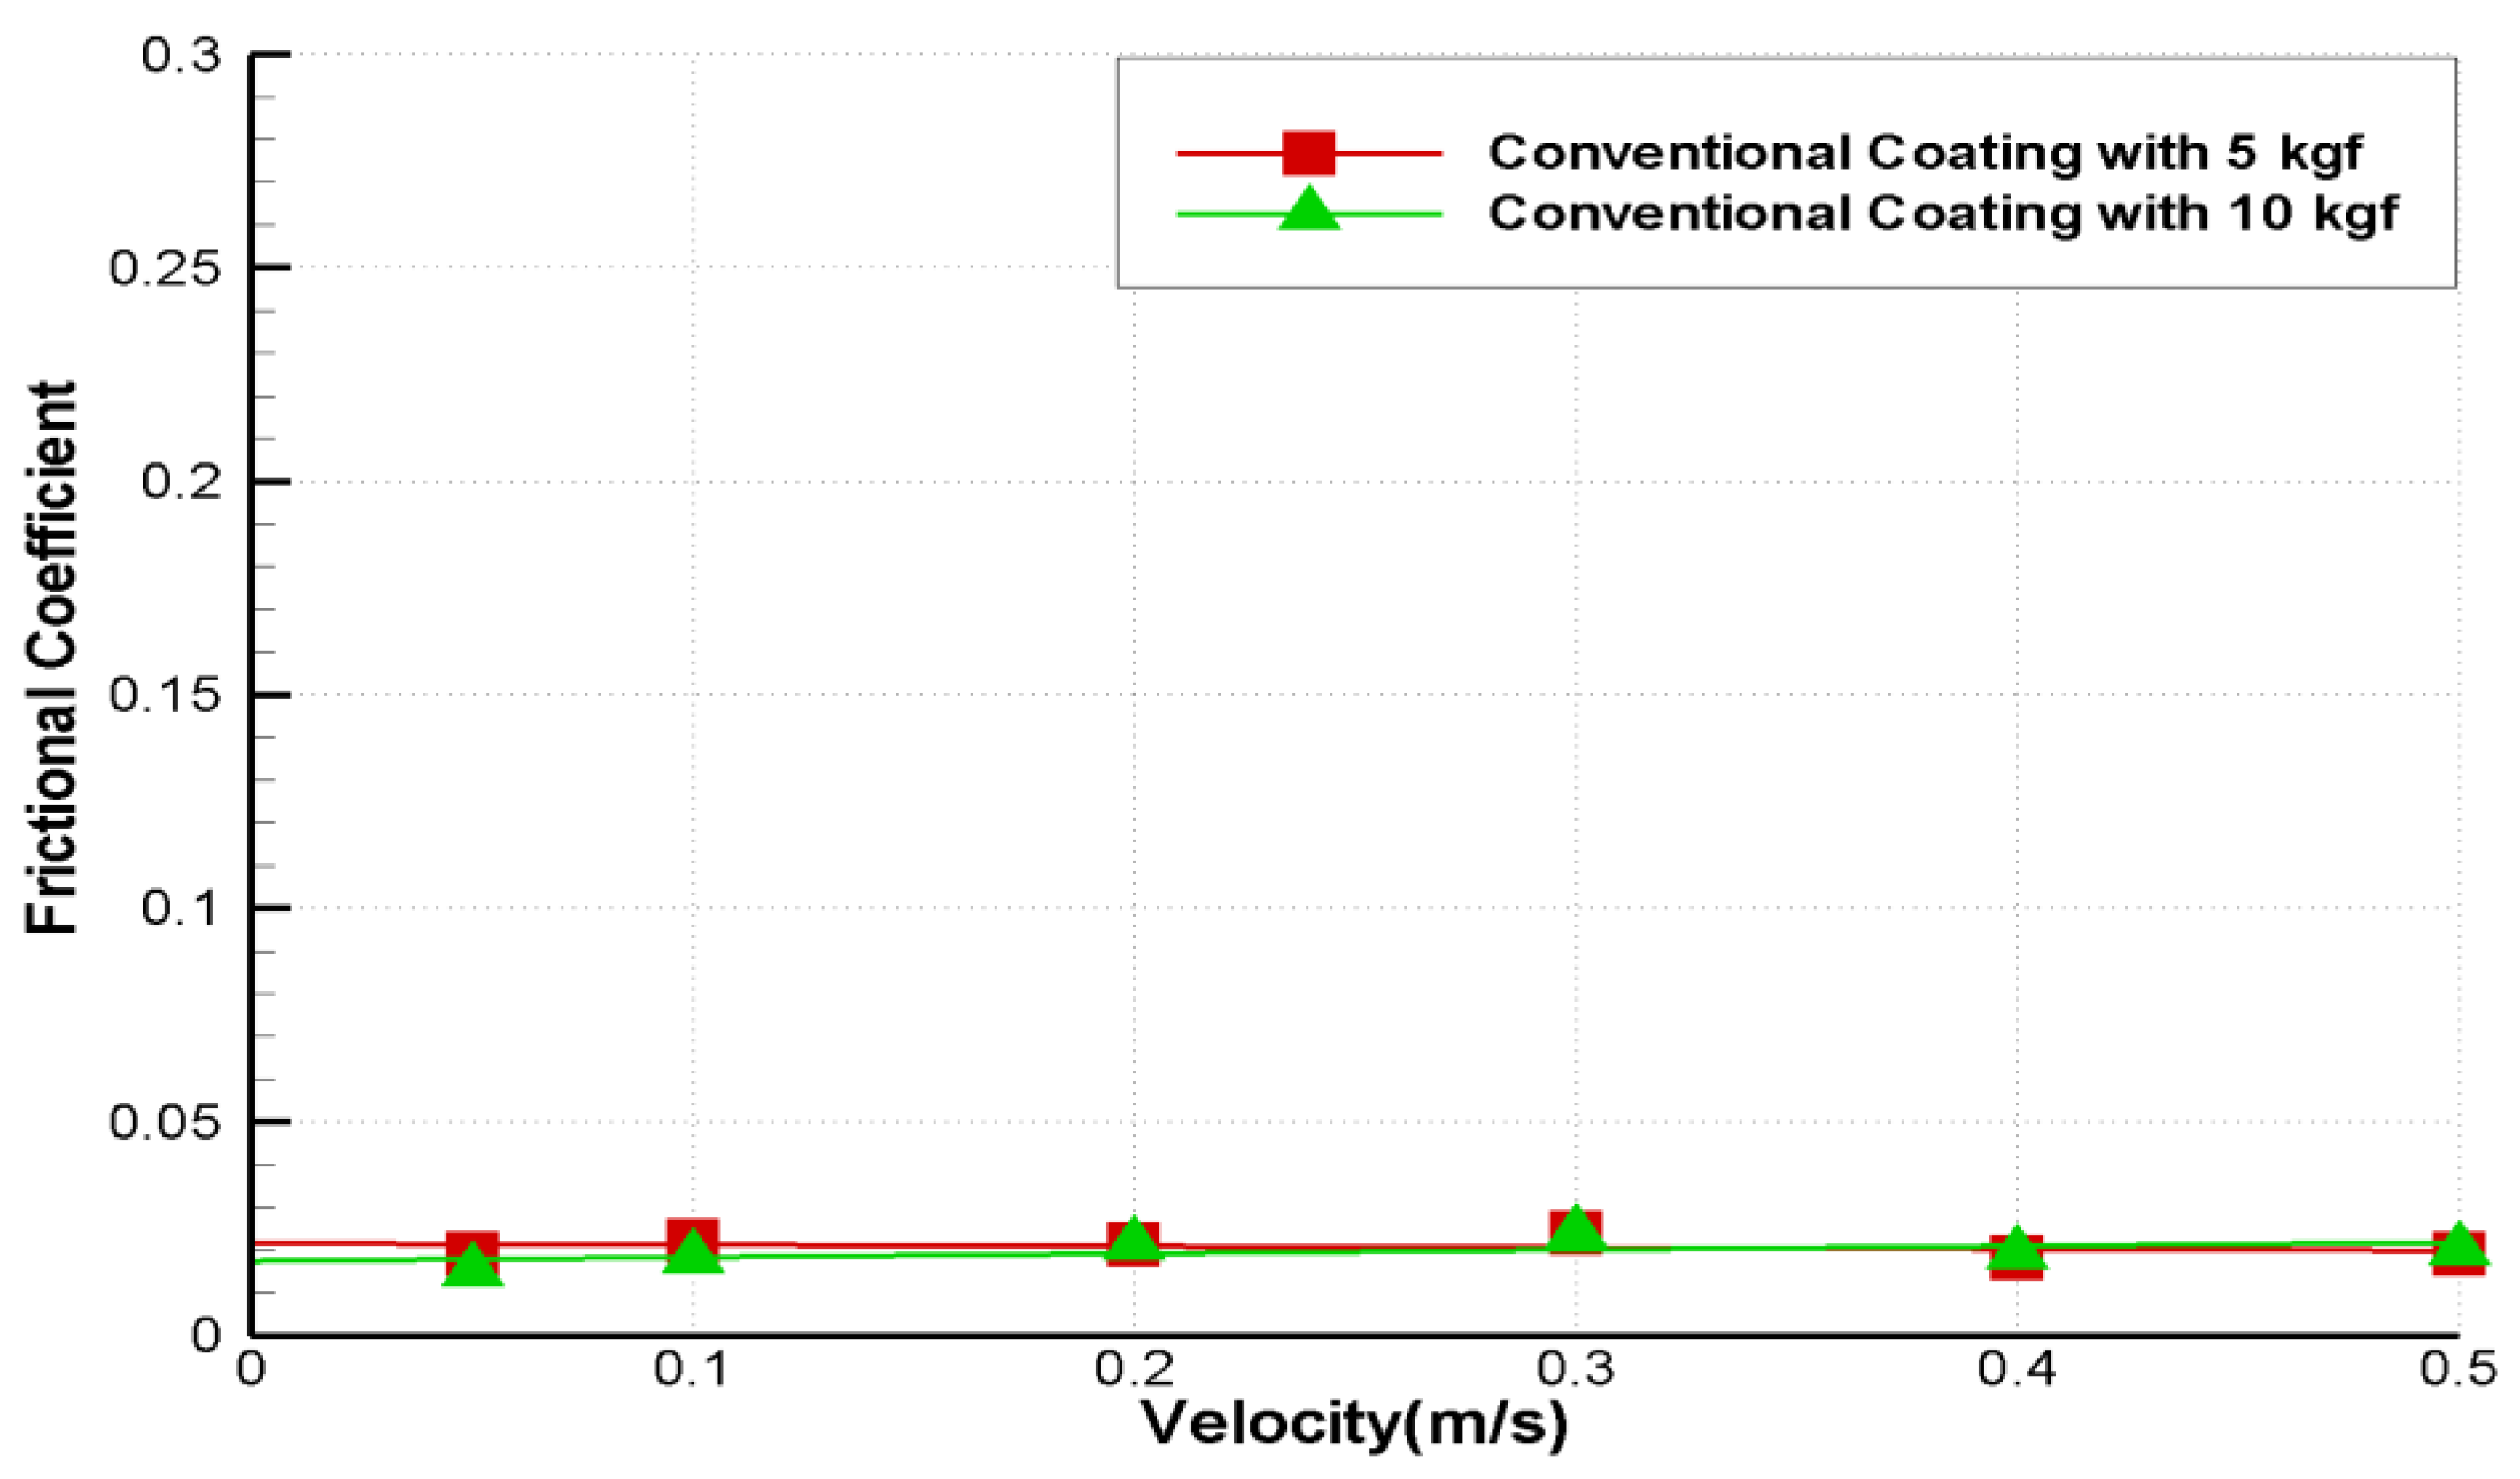
Figure 7 shows the frictional coefficient of a conventional coating plate with ice at various moving velocities. Some researchers [12,20,21] reported that the frictional coefficient depends on the moving velocity, while others [10,11,22] presented that there is no effect at a velocity of 0.1–0.5 m/s. In this test, the coefficient was not changed in a speed range of 0.05–0.5 m/s and with normal loads of 5 kg and 10 kg.

3.4. Frictional Coefficient with Freshwater Ice

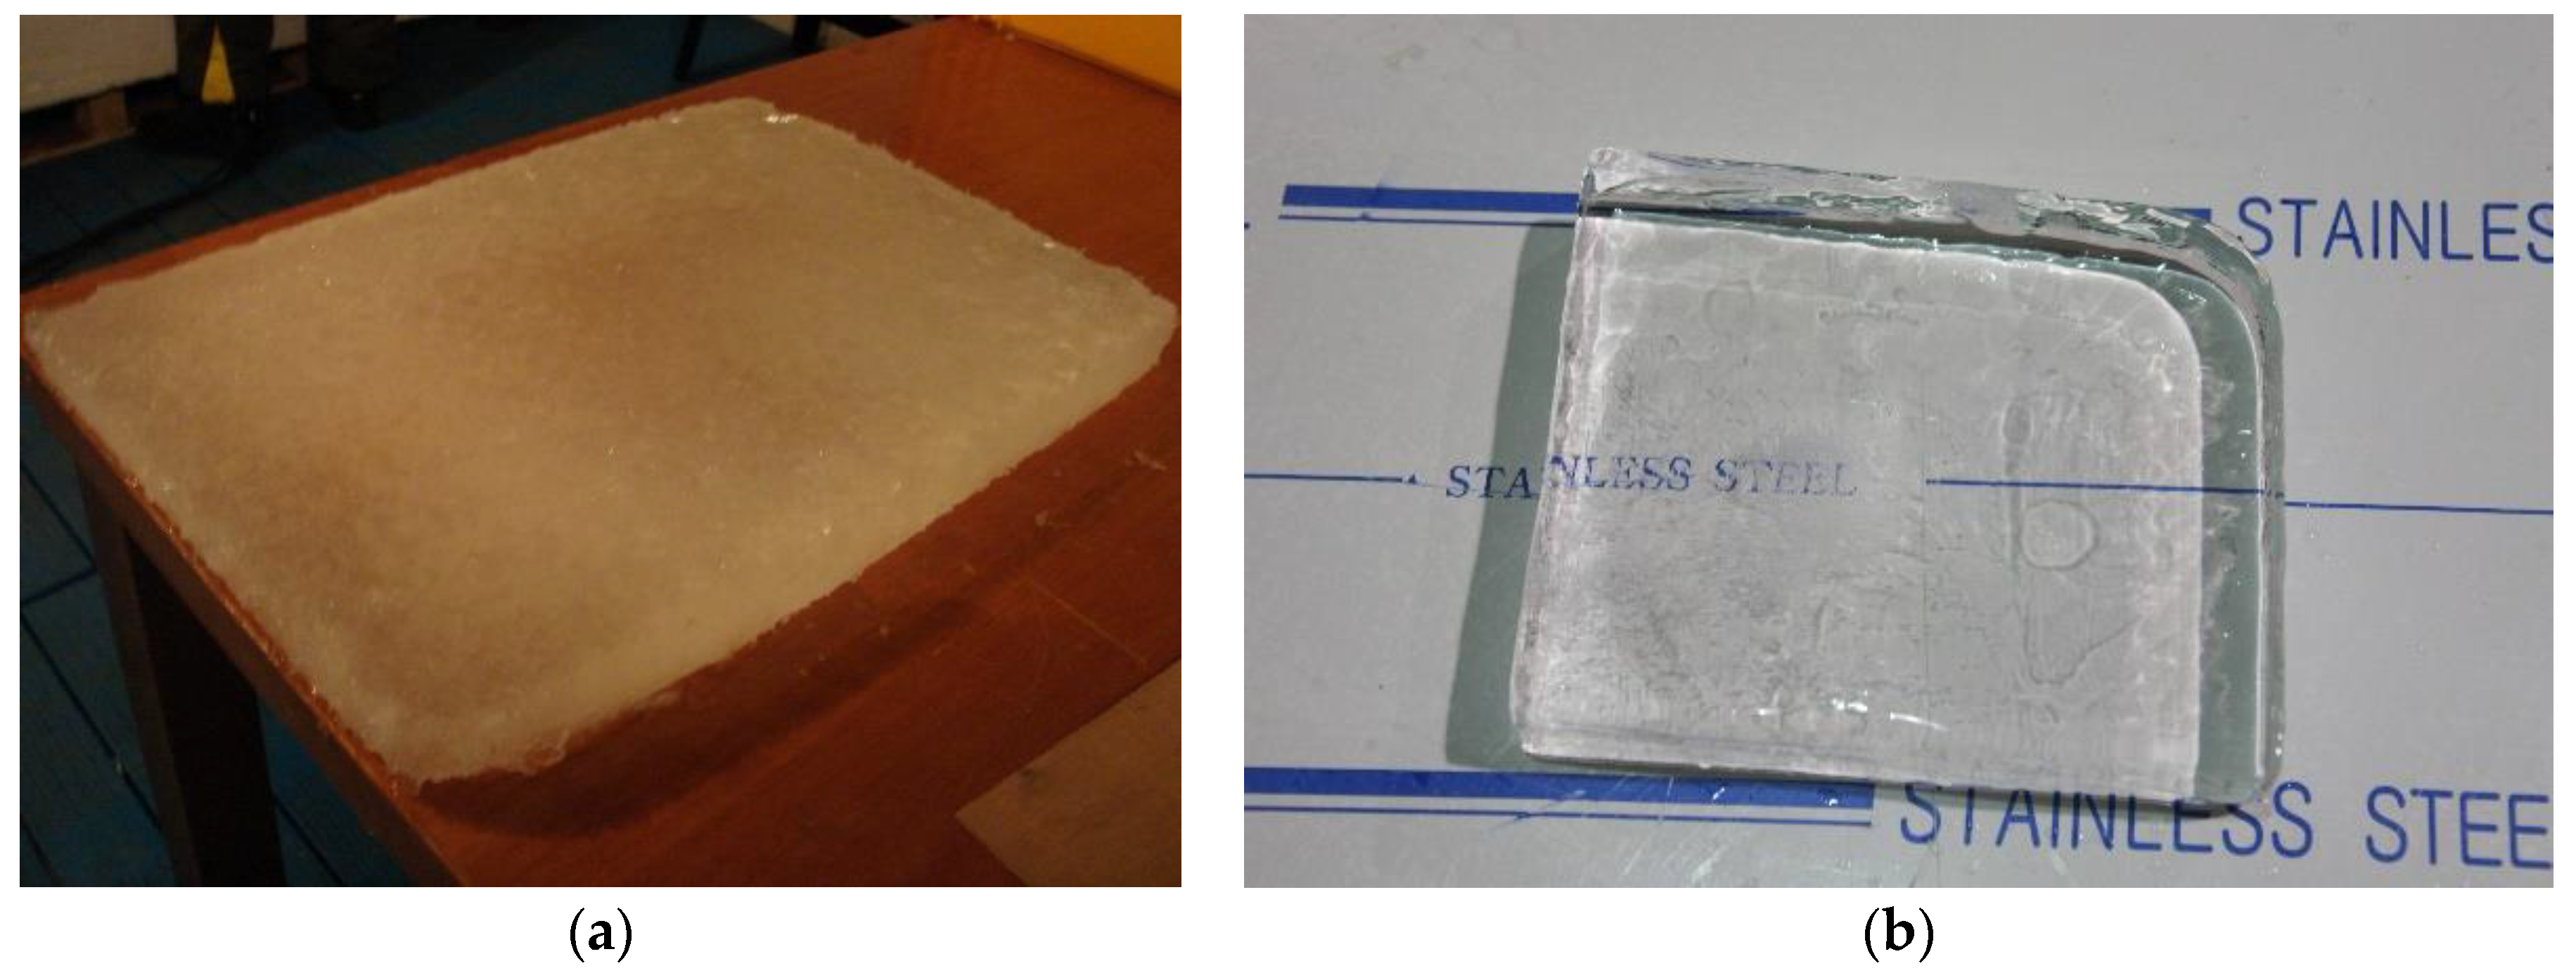
Figure 8 shows the frictional coefficient of various materials with freshwater ice and EG/AD model ice against moving speed. The result was measured near the frictional coefficient with EG/AD model ice (Figure 6), and the trend was also similar. However, the coefficient of the rubber pad, which had high surface roughness, decreased to 0.04 because the roughness of freshwater was so smooth. The freshwater was ground with a stainless steel plate in order to make uniform freshwater ice specimens; meanwhile, the EG/AD model ice was prepared with micro-bubbles for controlling its density, and the roughness of EG/AD model ice was rougher than one of freshwater ice. This caused the coefficient to decrease a little.

3.5. Discussion

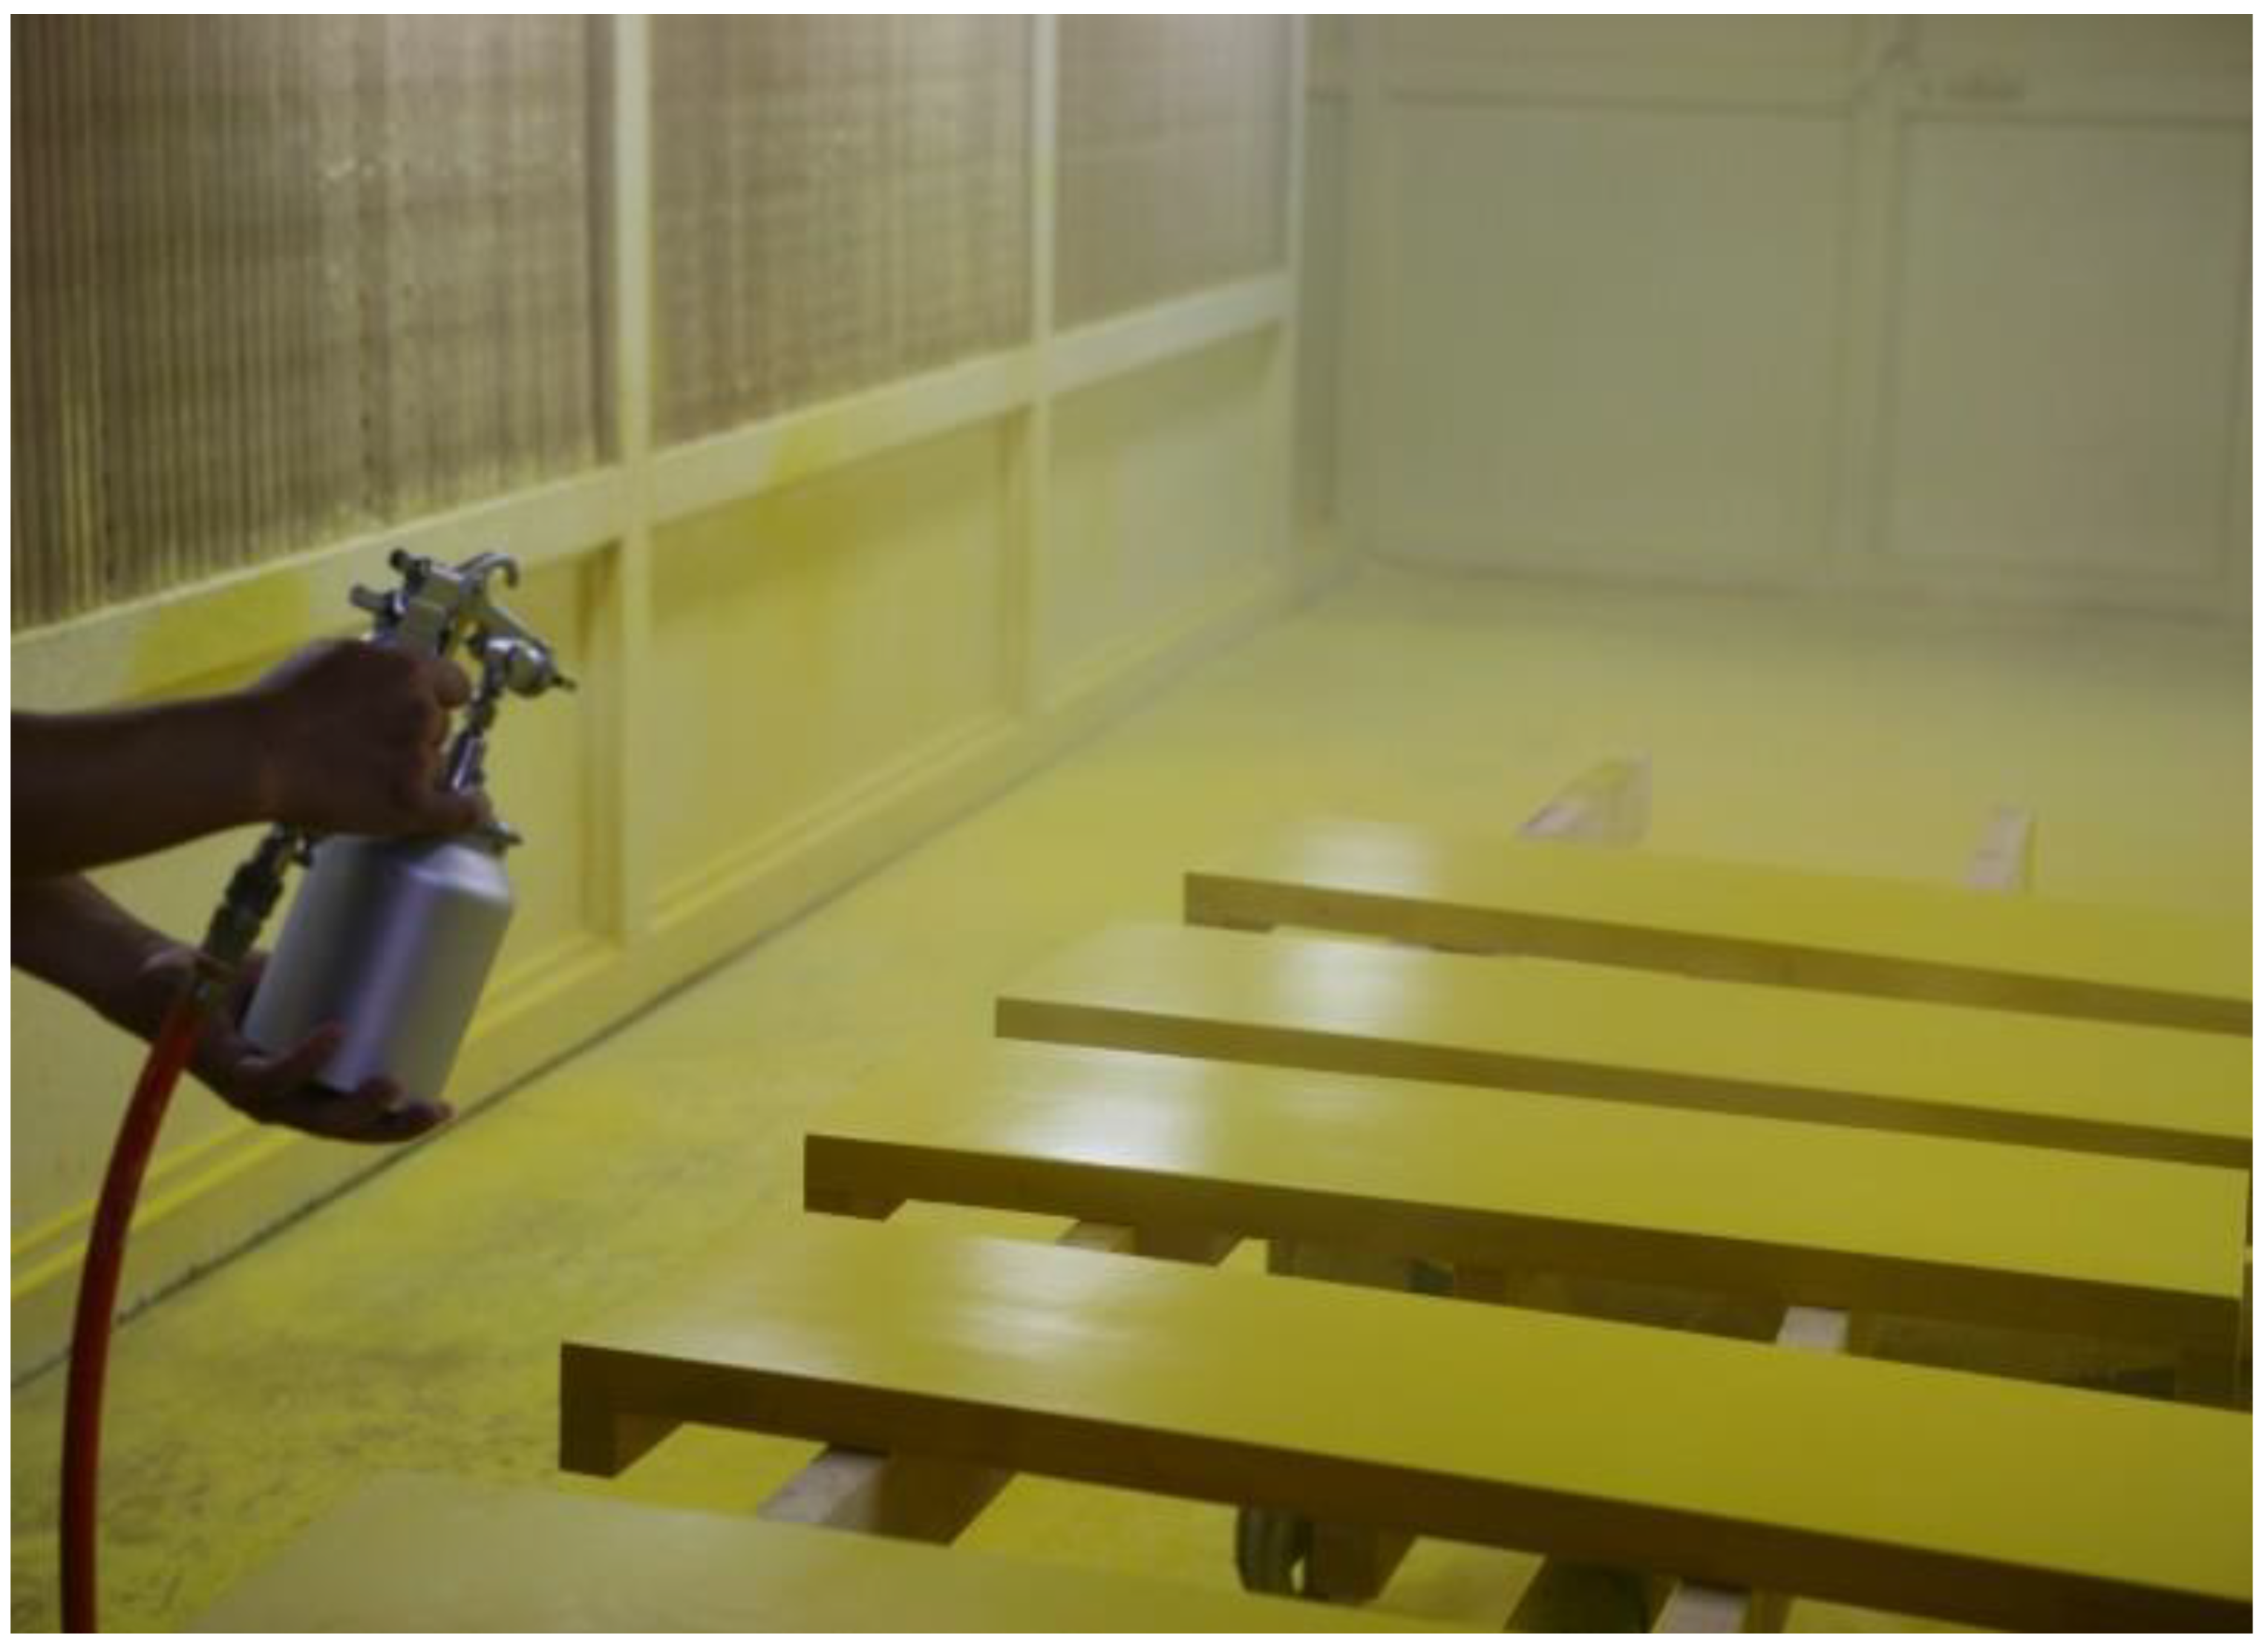
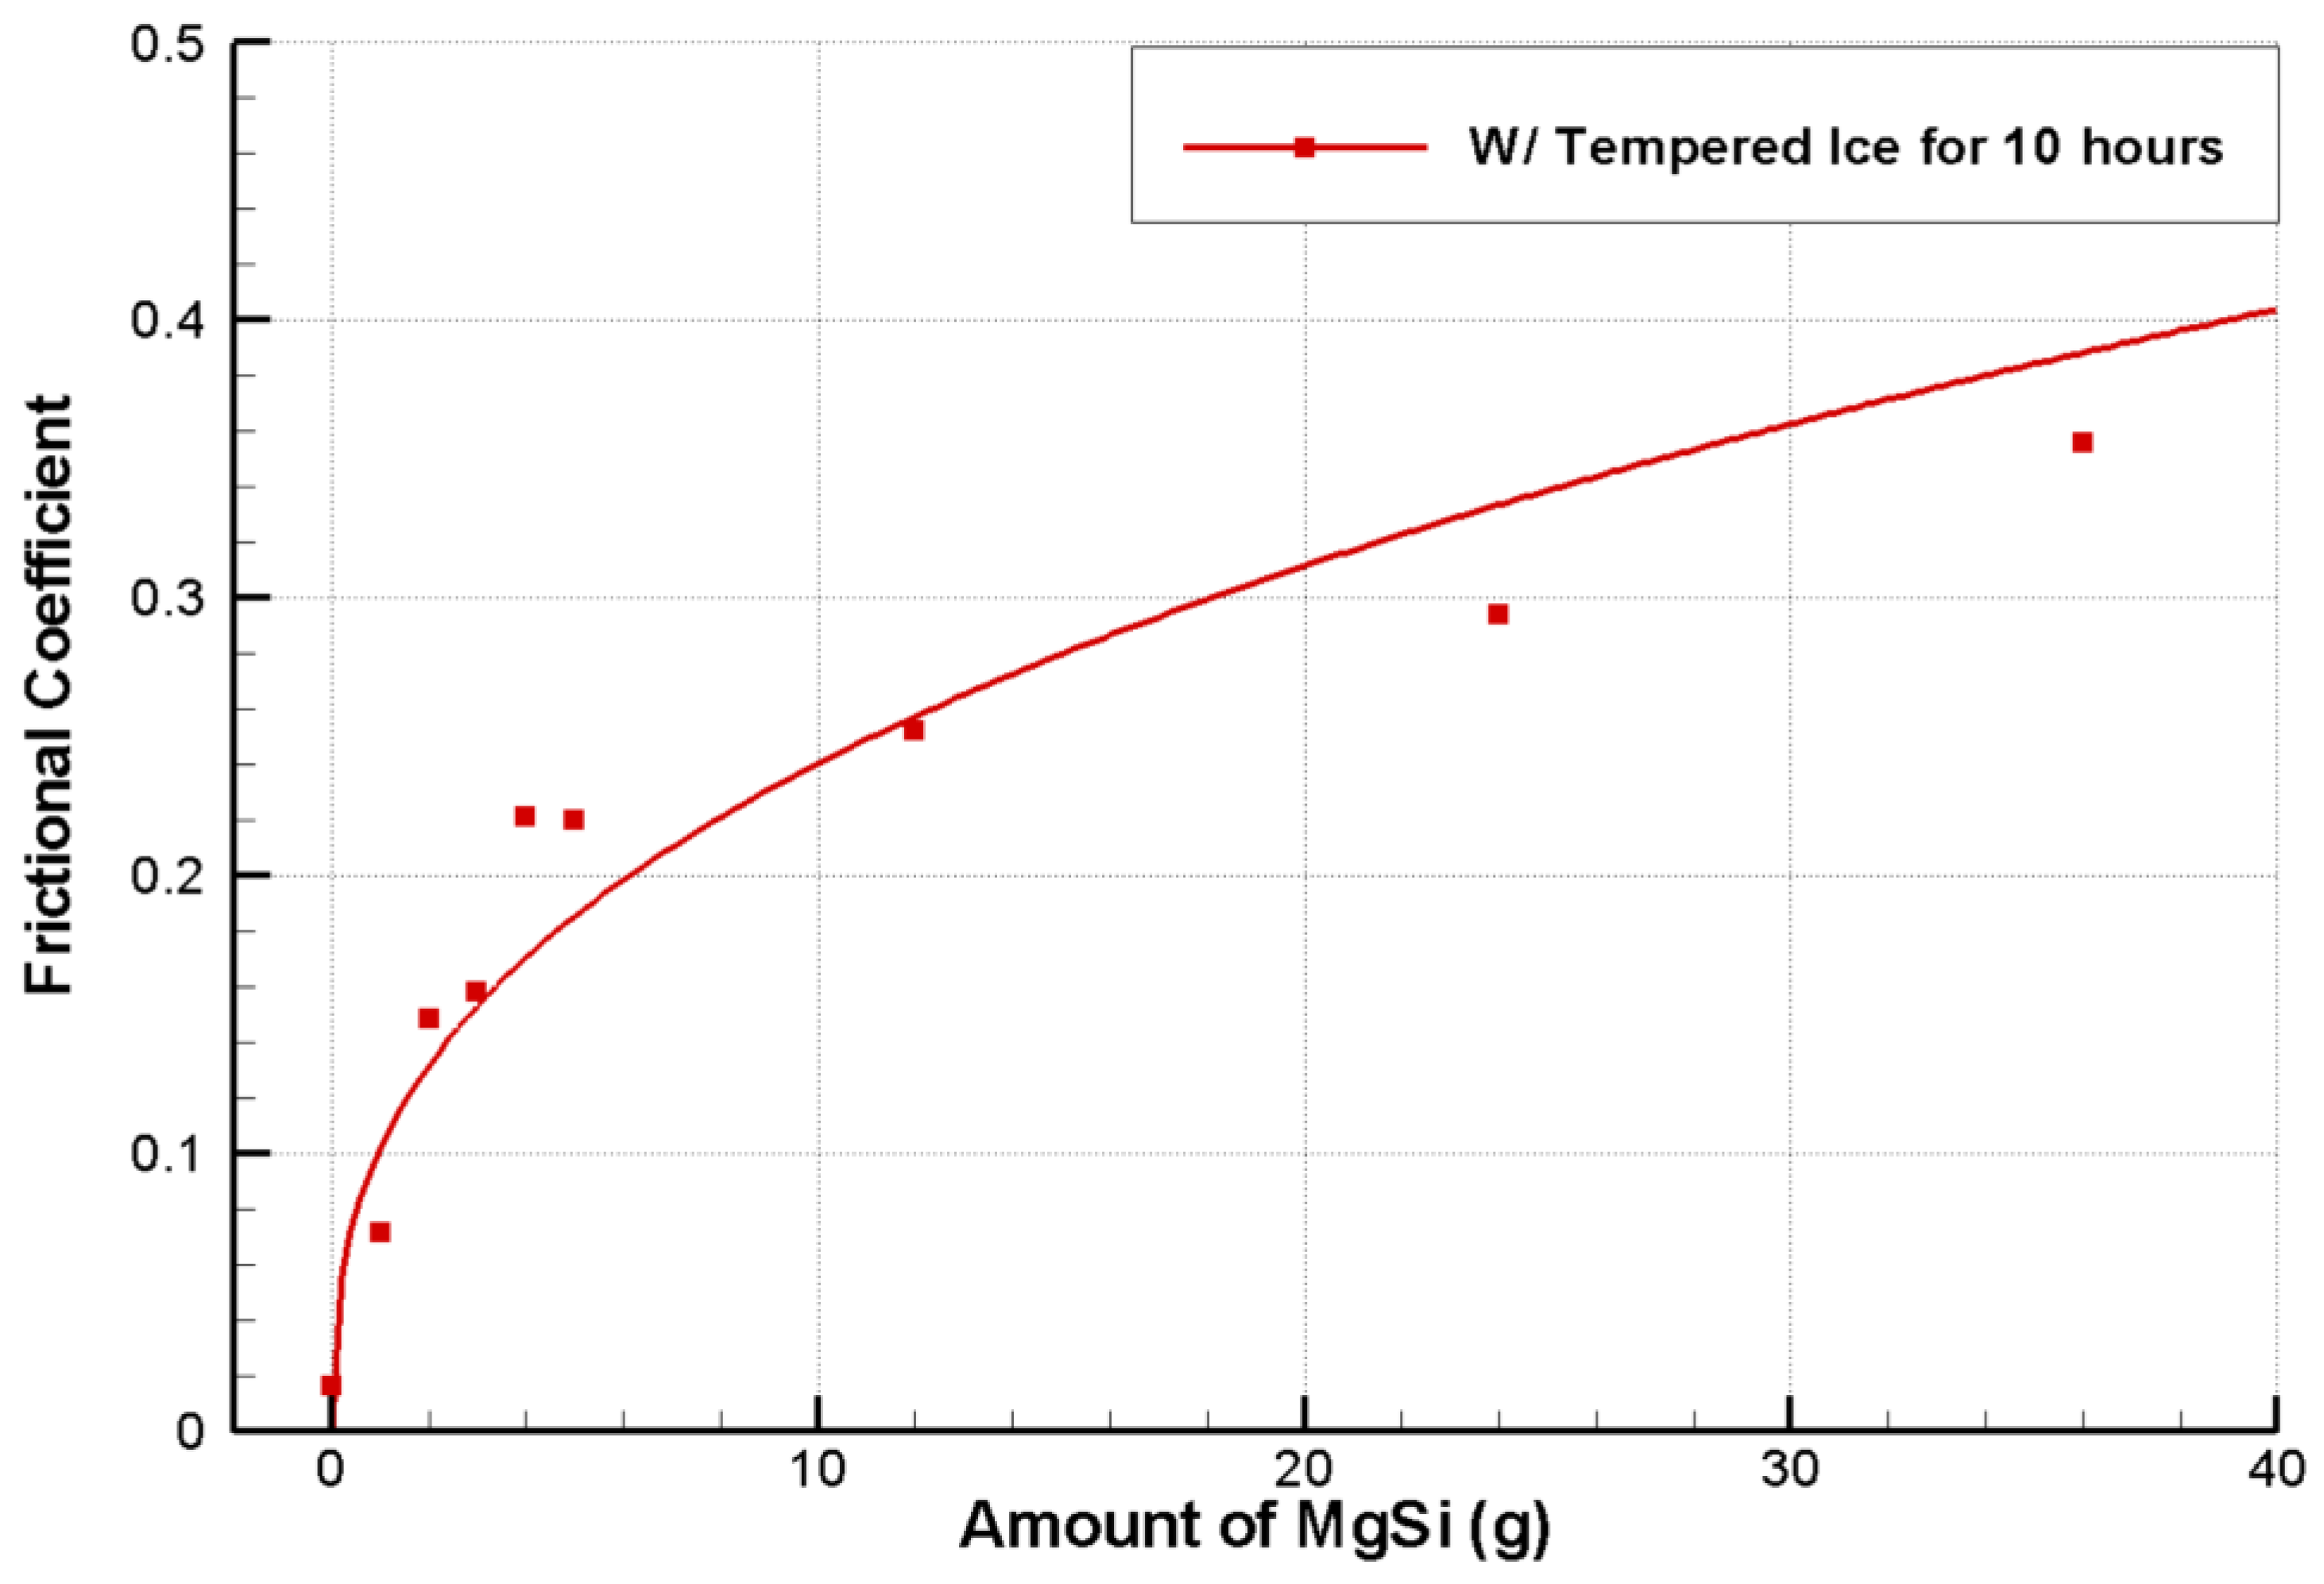
Figure 9 shows the measured frictional coefficient for the painted plate while varying the amount of MgSi in the paint to adjust the roughness of the model ship. Based on 5 g of MgSi, it can be seen that the friction coefficient changes with two slopes, and the trend line is plotted using Power-Fit. Although we did not measure the roughness of two plates that are painted with 5 g and 36 g of MgSi, overall, it can be seen that an increase in the amount of MgSi results in an increase in roughness, and, finally, an increase in the coefficient of friction.
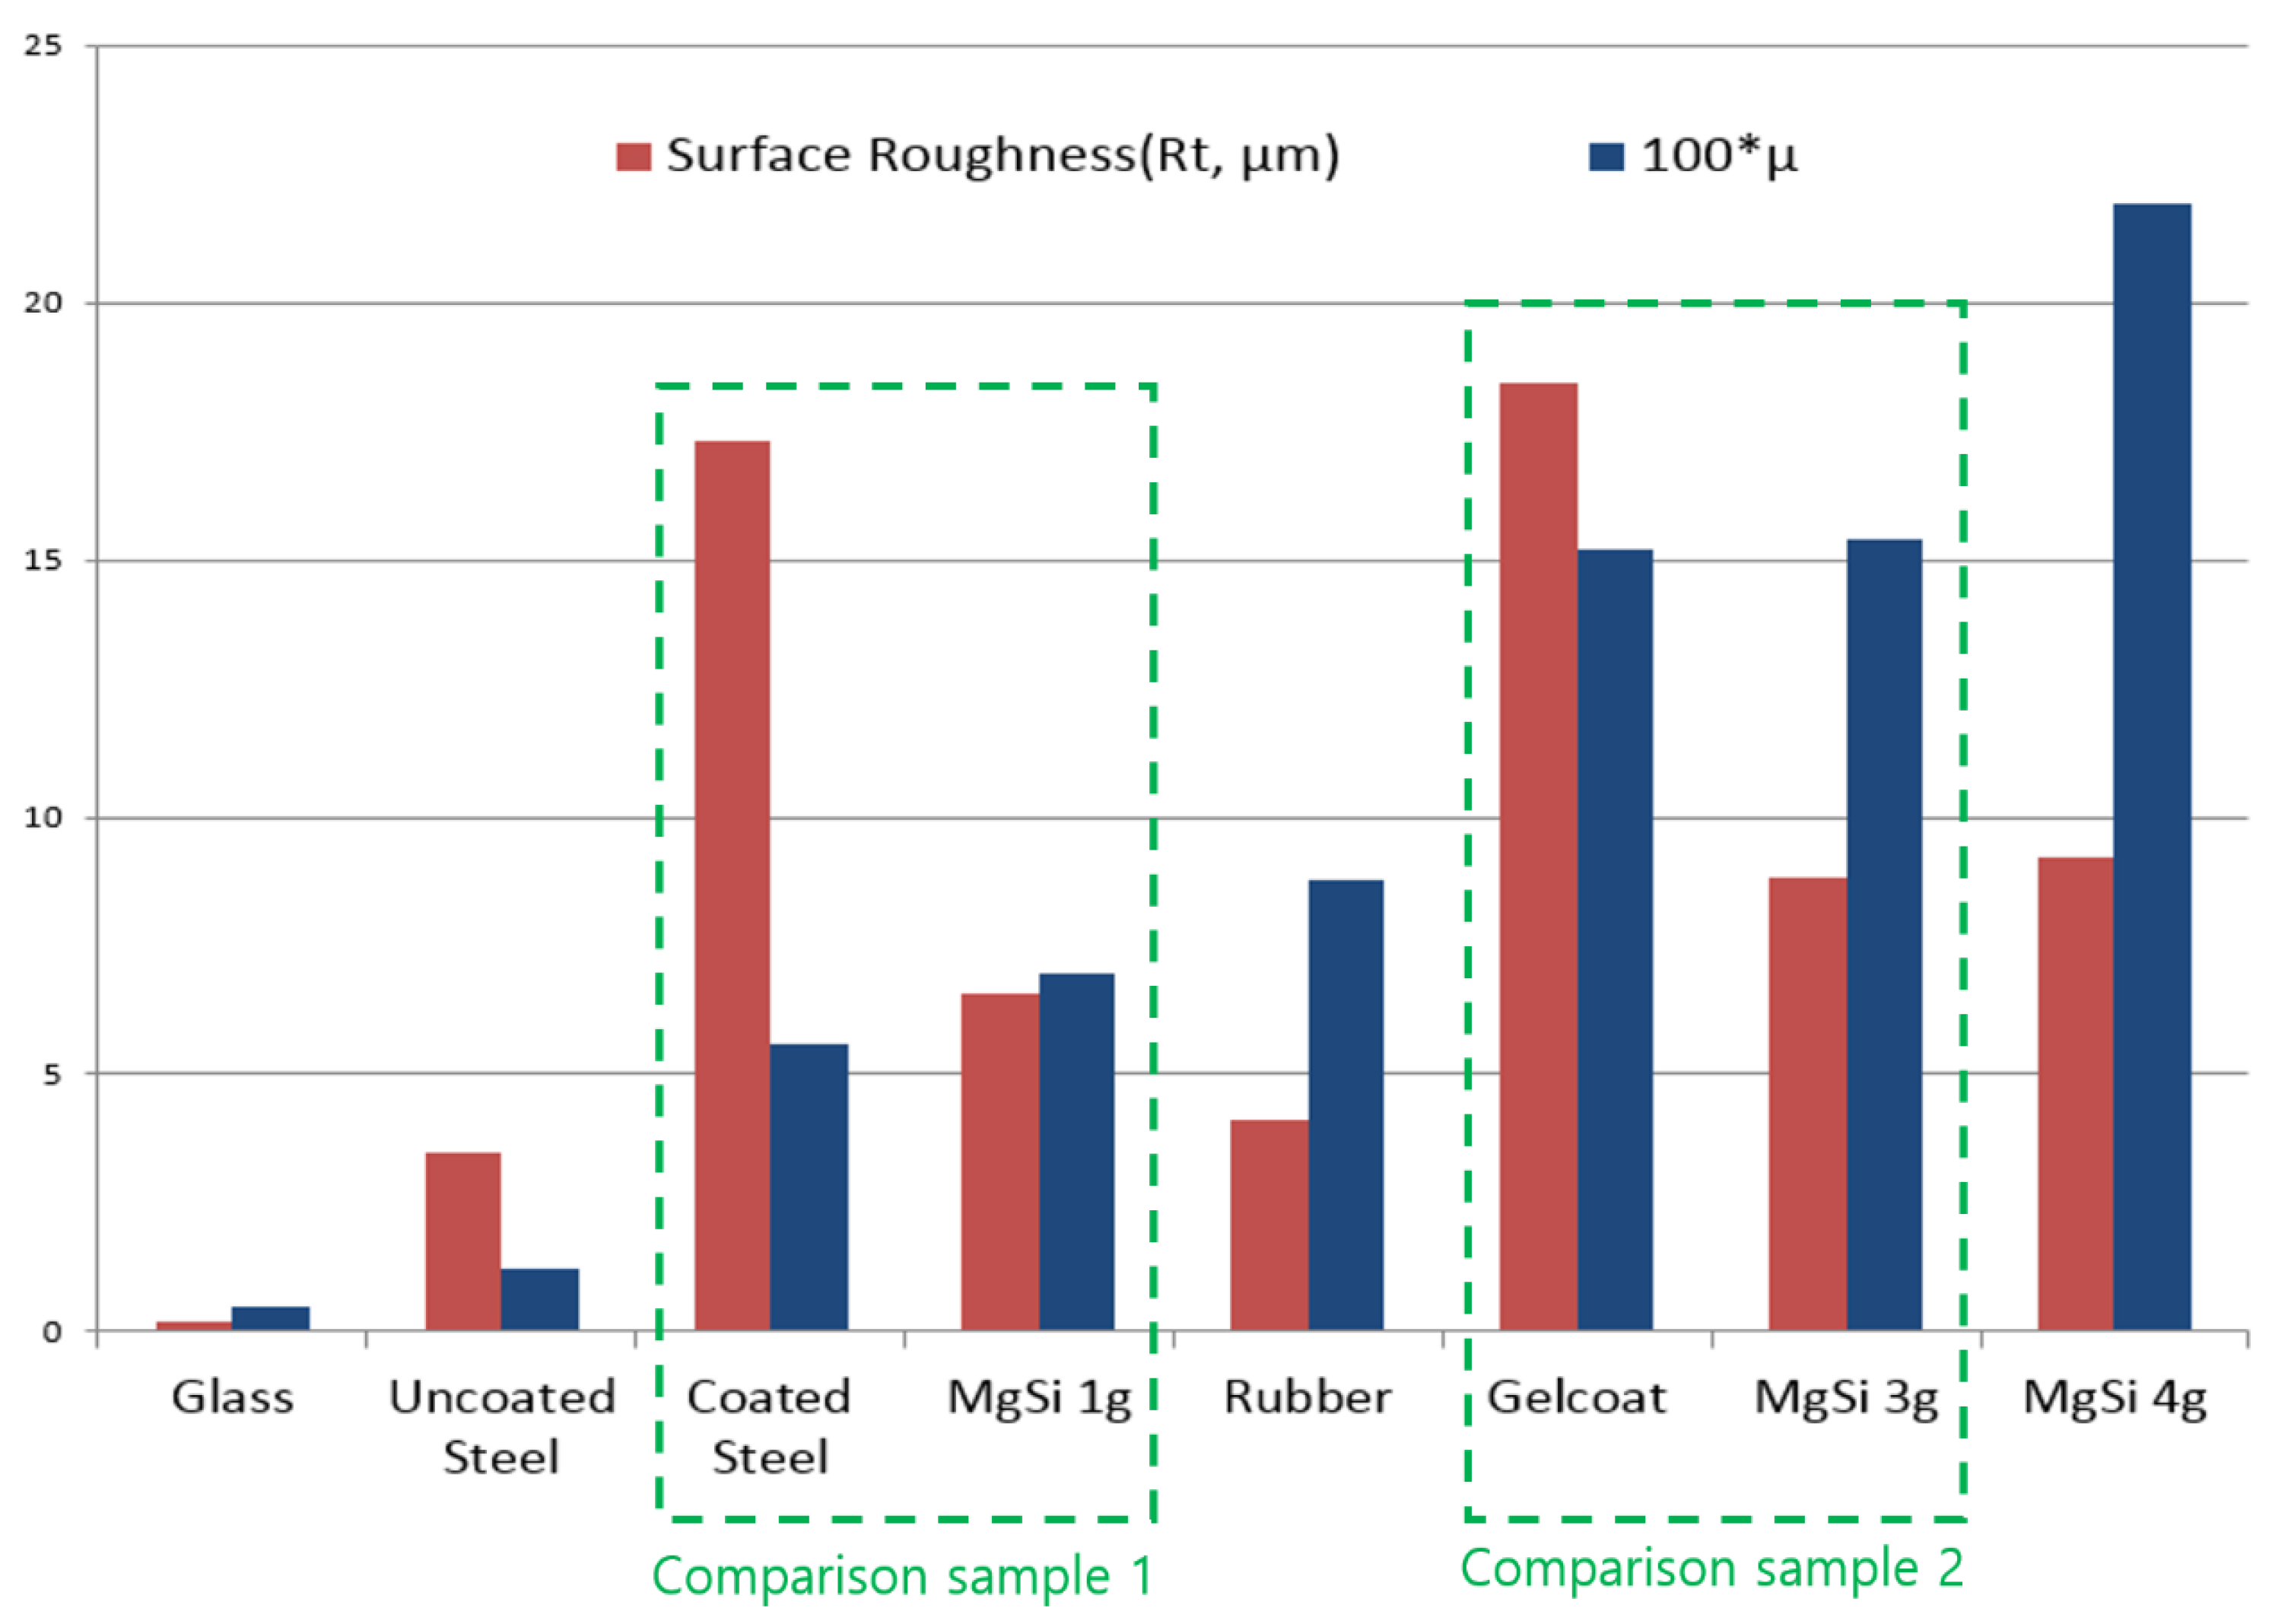
Figure 10 shows the relation between the fundamental roughness of the plates, especially the total height of the profile (Rt), and their frictional coefficients. All the tests were carried out with a weight of 5 kg at 0.2–0.36 m/s. In addition, we measured about 100 points for each test plate and obtained the average value, as shown in Table 2.
First of all, most of the frictional coefficient depends on the surface roughness of plates, especially the amplitude parameter; namely, the coefficient increases as the total height of the profile increases. These results show a tendency similar to the frictional behavior of other common materials and seem to be equally applicable to the frictional behavior of ice; however, it is not absolute. The total roughness of coated steel and MgSi 1 g is quite different, even though the frictional coefficients are similar. A similar phenomenon occurs with Gelcoat and MgSi 3 g. Also, Vuorio’s results, discussed above, could be from the same phenomenon here as well. Vuorio never showed how the low frictional phenomena might be possible on a rough surface. No one has proposed and explained the principle behind this strange frictional behavior of ice.
To explain phenomena that do not satisfy these basic physical laws in the frictional behavior of ice, we analyzed the supplementary roughness of the test plates (height characteristics, spacing, and hybrid parameters) in Table 2. Rsk is the skewness of the roughness surface elevation probability density function, and Rku is the kurtosis of the surface elevation distribution. If the Rsk > 0, the peak of the roughness profile is higher than the average line. If the Rku > 3, the roughness profile is generally sharp, and if the Rku < 3, the roughness profile is blunt. RSm is the mean spacing between peaks, and RΔq is the RMS average of the absolute value of the slope of the roughness profile over the evaluation length.
In Table 2, the height characteristics parameters of coated steel and coated plate with Gelcoat were smaller than those of MgSi 1 g and MgSi 3 g, respectively, even though the amplitude parameters of coated steel and gelcoat plate were higher. That is, the Rsk of coated steel, MgSi 1 g, and coated plate with Gelcoat had a negative value, so we can estimate that their roughness profile is round. In addition, the Rku of coated steel is also small, and this means that the top of the roughness profile is not sharp but blunt in the whole roughness surface elevation probability density function. We also checked the similar phenomenon between coated plated with Gelcoat and MgSi 3 g (comparison sample 2 in Figure 10). In addition, there is no consistency in the roughness data (Rt) according to the change in the amount of MgSi (Table 2), but the friction coefficient increase linearly (Figure 9), so it is judged that not only the amplitude parameter but also the height characteristic parameter are related and affect the friction behavior of ice. Therefore, we found that the friction of ice depends on both the amplitude and height characteristics of the material.

4. Conclusions

This study was first conducted to understand basic frictional characteristics and phenomena with ice. We tested and evaluated the frictional coefficients of various materials, as well as the measuring methods with freshwater ice and model ice. Thus, we found a fundamental mechanism and tribological behavior of ice on various materials.
Figure 10 shows that Amonton’s law of friction, that the frictional coefficient increases with increasing roughness, does not hold for ice. Through this research, we also confirmed that the frictional coefficient of ice depends on the surface roughness of the test plate, but that this is not absolute. We found the main influencing factors affecting ice friction phenomena through ice friction tests of various materials and precise roughness measurement of test plates. Finally, we conclude that the coefficients of ice is contingent on the amplitude parameters, but also the skewness of the roughness surface elevation probability density function and the kurtosis of the surface elevation.
This study can be valuably utilized in the design phase of ice-class vessels, the coating phase of the hull, and the sea trial tests. The coating method, as well as the basic characteristics of the paint, can change the amplitude and height characteristics parameters of the hull surface; therefore, a study of the tribological behavior of ice must be a core technology for reducing the frictional resistance of an ice-class vessel. Finally, we expect the findings of this study to improve the efficiency and economics of operation for ice-class vessels.

Author Contributions

Conceptualization, S.-R.C. and B.-G.P.; methodology, S.-R.C. and B.-G.P.; validation, S.-R.C.; visualization, B.-G.P.; project administration, S.-R.C. All authors have read and agreed to the published version of the manuscript.

Funding

This research is a part of the “Development of ice performance test and evaluation technology for icebreaking ships (PES4700)”.

Data Availability Statement

The datasets generated and/or analysed during the current study are not publicly available due to the ongoing project, but are available from the corresponding authors upon reasonable request.

Acknowledgments

Special thanks are also due to the technical personnel of the Korea Research Institute of Ships & Ocean Engineering for their contributions to the model tests.

Conflicts of Interest

The authors declare no conflict of interest.

References

  1. Engelbert, P. UXL Science Fact Finder, 1st ed.; Gale Cengage: Farmington Hills, MI, USA, 1997. [Google Scholar]
  2. Weeks, W.F. On Sea Ice; University of Alaska Press: Fairbanks, AK, USA, 2010; p. 2. [Google Scholar]
  3. Croutch, V.K.; Hartley, R.A. Adhesion of ice to coatings and the performance of ice release coatings. J. Coat. Technol. 1992, 64, 41–53. [Google Scholar]
  4. Thomson, J. On Recent Theories and Experiments Regarding Ice at or near Its Melting-Point. Proc. R. Soc. Lond. 1859, 10, 151–160. [Google Scholar] [CrossRef]
  5. Faraday, M. Experimental Researches in Chemistry and Physics; Taylor and Francis: London, UK, 1859; p. 372. [Google Scholar]
  6. Joly, J. The Phenomena of Skating and Professor J. Thermodynamic Relation; The Scientific Proceedings of the Royal Dublin Society: Dublin, Ireland, 1886. [Google Scholar]
  7. Reynolds, O. Paper on Mechanical and Physical Subjects; Cambridge University Press: New York, NY, USA, 1899; p. 734. [Google Scholar]
  8. Bowden, F.P.; Hughes, T.P. The mechanism of sliding on ice and snow. Proc. R. Soc. Lond. 1939, 172, 280–298. [Google Scholar]
  9. Evans, D.C.B.; Nye, J.F.; Cheeseman, K.J. The kinetic friction of ice. Proc. R. Soc. Lond. 1976, 347, 493–512. [Google Scholar]
  10. Enkvist, E. On the Ice Resistance Encountered by Ships Operating in the Continuous Mode of Ice Breaking; Report No. 24; The Swedish Academy of Engineering Sciences in Finland: Helsinki, Finland, 1972; pp. 54–64. [Google Scholar]
  11. Ryvlin, A. Experimental Studies of the Friction of Ice; CREEL Draft Translation 417; UA Army Corps of Engineers: Washington, DC, USA, 1973; pp. 217–234. [Google Scholar]
  12. Vuorio, J. Kitkamittaukset JM Alella; WIMB Selvitys D 13; Ice Committee: Toronto, ON, Canada, 1975. [Google Scholar]
  13. Bell, J.; Newbury, S. Kinetic Coefficient of Friction Measurement of EG/AD/S Ice on Filled IMRON Paint; NRC Report LM-1991-26; NRC-IOT: New Fundland, NL, Canada, 1991. [Google Scholar]
  14. Colbeck, S.C. A Review of the Processes That Control Snow Friction; Monograph 92-2; US Army Cold Regions Research and Engineering Laboratory: Hanover, NH, USA, 1992. [Google Scholar]
  15. Somorjai. Slippery All the Time. Interview Posted. 2004. Available online: http://www.exploratorium.edu/hockey/ice2.html (accessed on 21 November 2004).
  16. Watanabe, A. Study on the influence of environmental conditions on road friction characteristics. Lubricants 2023, 11, 277. [Google Scholar] [CrossRef]
  17. Cho, S.R.; Lee, C.J.; Jeong, S.Y. An Efficient EG/AD Model Ice for the MOERI Ice Tank. In Proceedings of the 20th International Offshore and Polar Engineering Conference, Beijing, China, 20–25 June 2010; pp. 1183–1187. [Google Scholar]
  18. Cho, S.R.; Chun, E.J.; Yoo, C.S.; Jeong, S.Y.; Lee, C.J. The Measuring Methodology of Friction Coefficient between Ice and Ship. J. Soc. Nav. Archit. Korea 2011, 48, 363–367. [Google Scholar] [CrossRef]
  19. Jones, S.J. Ice Tank Test Procedures at the Institute for Marine Dynamics; NRC Report LM-VR-20; NRC-IOT: New Fundland, NL, Canada, 1993. [Google Scholar]
  20. Akkok, M.; Ettles, C.M.; Calabrese, S.J. Parameters Affecting the Kinetic Friction of Ice. J. Tribol. 1987, 109, 552–559. [Google Scholar] [CrossRef]
  21. Kajita, S.; Washizu, H.; Ohmori, T. Deep bulk atoms in a solid cause friction. Europhys. Lett. 2009, 87, 66002. [Google Scholar] [CrossRef]
  22. Saeki, H.; Ono, T.; Ozaki, A. Experimental Study on Ice Forces on a Cone-Shaped and an Inclined Pile Structures; POAC79: Trondheim, Norway, 1979; pp. 1081–1095. [Google Scholar]
Figure 1. Two types of ice (a): EG/AD model ice, (b): freshwater ice.
Lubricants 11 00314 g001
Figure 2. Tested rough plates (from left: steel plate with powder coating, uncoated stainless steel plate, glass plate, and rubber pad).
Lubricants 11 00314 g002
Figure 3. Coated plates with MgSi powder.
Lubricants 11 00314 g003
Figure 4. Friction measurement device of KRISO.
Lubricants 11 00314 g004
Figure 5. Surface roughness measurement device.
Lubricants 11 00314 g005
Figure 6. Frictional coefficient of various materials with EG/AD model ice.
Lubricants 11 00314 g006
Figure 7. Frictional coefficient with changing velocity.
Lubricants 11 00314 g007
Figure 8. Frictional coefficient of various materials with freshwater ice and model ice.
Lubricants 11 00314 g008
Figure 9. Frictional coefficient according to amount of MgSi.
Lubricants 11 00314 g009
Figure 10. The relation between frictional coefficient and surface roughness.
Lubricants 11 00314 g010
Table 1. Definition of major roughness parameters.
ParameterDefinitionDefault UnitDescription
R a 1 n i = 1 n y i μm y i is the vertical distance from the mean line to the ith data point.
R q 1 n i = 1 n y i 2 μm
R p max i y i μm
R v min i y i μm
R t R p R v μm
R s k 1 R q 3 1 n i = 1 n y i 3 -
R k u 1 R q 4 1 n i = 1 n y i 4 -
R Δ q 1 L 0 L ( d y i d x ) 2 d x -
R S m 1 n i = 1 n S m i μm S m i is the horizontal distance between profile irregularities to the ith data point
Table 2. Result of roughness measurement of various plates.
MaterialSurface Roughness
Amplitude Para.Height Characteristic Para.Spacing ParaHybrid Para
Ra (μm)Rq
(μm)
Rz
(μm)
Rv
(μm)
Rt
(μm)
RskRkuRSm
(μm)
Rq
Coated steel
with powder
3.2063.95015.1588.79425.450−0.0892.246495.80.060
Uncoated
SUS
0.1530.1981.0960.5801.533−0.3755.053151.20.045
Glass plate0.0110.0140.1110.0690.1600.124 3.694 61.10.011
Rubber pad0.7660.9414.7222.1016.6620.2772.51593.80.096
Conv. paint0.5100.6202.2921.2343.4200.2562.539398.00.021
MgSi_1 g0.5520.6872.9301.0905.486−0.0172.756190.70.033
MgSi_2 g0.9761.3496.6311.91516.599----
MgSi_3 g0.8881.1094.9482.2787.2610.4463.395337.70.055
MgSi_4 g0.9771.2525.3432.1558.788−0.0152.681301.10.066
MgSi_5 g---------
MgSi_12 g1.2391.5647.3192.74911.8071.0094.767211.0670.072
MgSi_24 g1.7922.27710.3674.71713.3710.3613.227253.3750.103
MgSi_36 g---------
Coated plate with Gelcoat2.2091.5716.4527.46818.429−0.3153.085140.10.216
Disclaimer/Publisher’s Note: The statements, opinions and data contained in all publications are solely those of the individual author(s) and contributor(s) and not of MDPI and/or the editor(s). MDPI and/or the editor(s) disclaim responsibility for any injury to people or property resulting from any ideas, methods, instructions or products referred to in the content.

