Article

Numerical Simulation of the Lubricant-Solid Interface Using the Multigrid Method

1
NanoCorr, Energy & Modelling (NCEM) Research Group, Department of Design and Engineering, Bournemouth University, Poole BH12 5BB, UK
2
Schaeffler Technologies AG & Co. KG (Schaeffler Group), 91074 Herzogenaurach, Germany
*
Author to whom correspondence should be addressed.
Lubricants 2023, 11(6), 233; https://doi.org/10.3390/lubricants11060233
Submission received: 11 April 2023 / Revised: 15 May 2023 / Accepted: 19 May 2023 / Published: 23 May 2023

Abstract

:
Solid asperity interactions are common and inevitable under severe loading conditions for any lubricated contact. Heavy-duty machine components (gears, bearings, etc.) generally operate under Mixed Lubrication (ML), where uneven surface features contact each other when the generated fluid pressure is not enough to support the external load. The Reynolds equation is commonly used to simulate smooth lubricated contacts numerically. In rough lubricated interfaces where opposite surface asperities make contact, the Reynolds equation alone cannot accurately predict pressure using the traditional numerical simulation method. In this paper, lubrication–contact interface conditions (LCICs) have been implemented and extended to solve the multiple asperity contact problem using the full-multigrid approach. The developed novel algorithm has significantly accelerated the solution process and improved the accuracy and efficiency of pressure calculation for fluid–solid sub-interactions that can occur in ML regions. The results of the finite difference method (FDM) results have been compared with those of computational fluid dynamics (CFD) simulation to validate the newly developed model. Hence, the proposed optimized solution method will provide valuable insight to researchers and industry engineers interested in simulating the ML problem where the effect of the fluid–solid interface can be captured effectively to improve reliability in the calculation of the life expectancy of the lubricated parts.

1. Introduction

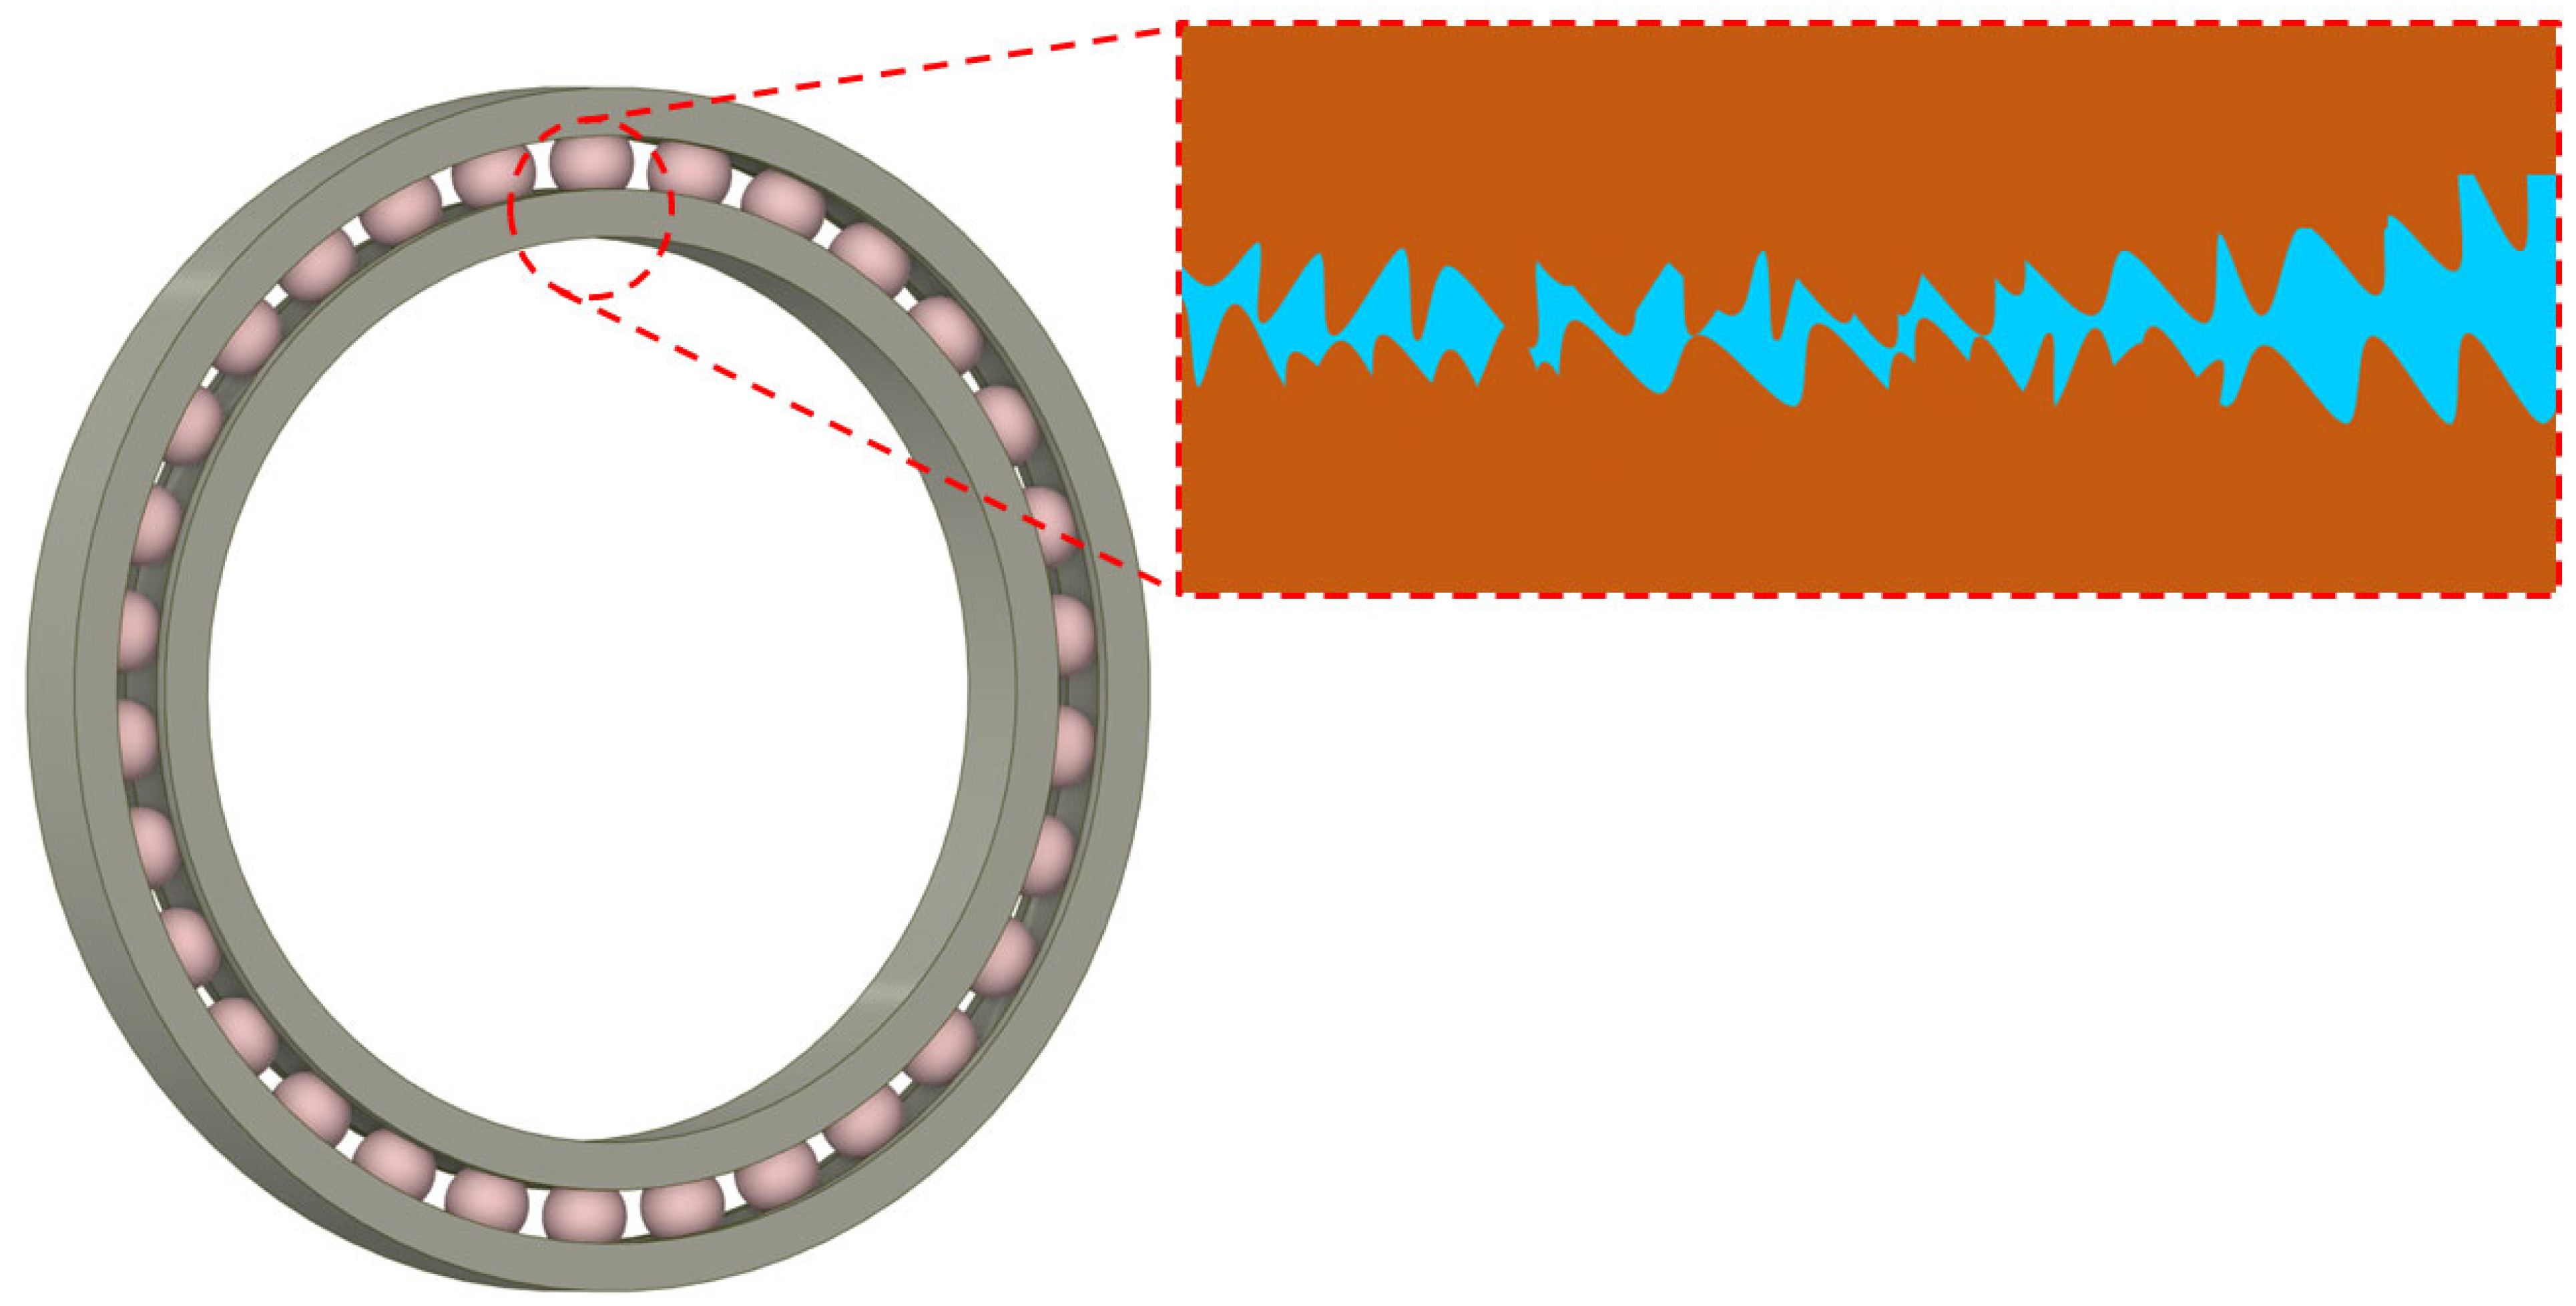
The lubrication of machine components is critical for the reliable and long-term performance of any mechanical system. Numerical simulation is a more cost-effective method than experimental methods for designing and investigating lubricated systems for a variety of applications. In lubrication, the hydrodynamic effect generates internal fluid pressure, which maintains separation between relatively moving surfaces. The traditional Reynolds equation is employed for calculating fluid pressure in most cases. The basis for this is founded on the fact that the film thickness is relatively smaller compared to the length of smooth and near-parallel interacting surfaces. The Reynolds equation can be applied in situations when the opposite surfaces and their topographical features can be completely pushed away by the developed lubricating film, in full-film lubrication and elasto-hydrodynamic lubrication (EHL) regions. However, the majority of the lubricated machine components change their lubrication regime as the external load and speed vary. In engineering applications, rough surfaces are common (see Figure 1), which results in an inevitable effect on lubrication performance, especially when concentrated contacts operate under heavy-load and low-speed conditions, known as ML conditions. Many power and motion transition components, for example, gears, cams, followers, and bearings, generally work in the mixed region of lubrication (ML) where solid and fluid contacts coexist. Therefore, proper boundary conditions are required to numerically simulate the ML using the Reynolds equation.
In the worst circumstances of lubrication where different surface features take part to support the external load, local experimentation is nearly impossible or very expensive, even though expensive ML experimentation can only yield a general trend of contact performance and behaviors. In this case, simulation must be used to acquire precise information about what actually occurs at the roughness scale. The field of EHL numerical simulation has met with great success when used in many problems, for example, the development of efficient simulation algorithms for the precise study of film thickness and deformation calculations. The available EHL and ML models are based on assumptions that are not valid when roughness features (asperities) make contact, resulting in an inaccurate calculation of pressure and external load-carrying capacity. In this study, a new model for predicting the pressure distribution in asperity contact has been proposed and verified using CFD simulation.
Several studies are reported in the literature focusing on surface roughness effects on the functionality and lifespan of lubricated contact, and this topic is currently a priority in tribology industries [1,2,3,4]. A thorough assessment of the history of numerical simulation of the ML is well documented in the literature [5,6,7,8]. To numerically simulate the rough lubricated contacts, stochastic and deterministic models have been used in past. Patir and Cheng [9] developed a famous stochastic average flow model for rough lubricated surfaces, where the traditional Reynolds equation has been modified by including both pressure and shear flow factors that will be the functions of surface roughness characteristics. In the average flow model, a separate deterministic sub-model is required for determining the flow factors, which will provide a general effect exhibited by surface roughness when using the average flow model. However, this model is unable to give specific details regarding the elevated pressure areas where roughness peaks of the opposite surface contact with each other [10,11,12,13]. Later, deterministic models were introduced for robust design calculations, whereby local variation in tribological parameters can be predicted. The deterministic ML study begins with the simulation of simple irregularities in the form of sinusoidal roughness [14], and progresses to the digital real rough surface simulation [15]. Zhu et al. [16] proposed a unified numerical approach for Mixed Lubrication in 1999. They suggested that the Reynolds equation can be used in both hydrodynamic and contact regions. To avoid the need for information related to the fluid–solid interaction border position and related boundary conditions, the pressure flow terms in the Reynolds equation can be removed when the film thickness is zero. This approach can simplify numerical calculations and avoid the potential errors caused by inaccurate boundary conditions. Later, a similar model was also applied for the mixed elasto-hydrodynamic simulation of hypoid gears [17,18].
There have been various challenges in numerically simulating the ML and asperity contact problem. The most fundamental problem is the boundary conditions (BC), which have been resolved by introducing the LCICs conditions [11] and are applicable for surfaces where the ε = dh/dL ratio is far less, and velocity changes in the film thickness direction can be ignored. However, the model has limitations, since it can only be applied to a limited range of mesh sizes. In the case of multiple solid blocks, a fine mesh will be required, and this algorithm is ineffective in providing accurate solutions. Similarly, Deolalikar et al. [19] adopted the no-flow BC by treating the fluid and solid contact zones separately. Many authors have used this method to some extent [20,21]. The other problems are that we need a high degree of discretization to capture the local physical reality, which will further require high computational power. The calculation of micro-deformation, thermal, non-Newtonian and transient effects complicates the problem in terms of calculation time and effort required.
The MG (multigrid) technique has been an important part of numerically solving problems related to lubricated contacts for decades, ever since Lubrecht et al. [22] first used it in 1986 in their EHL solution. Later, Venner [23] significantly enhanced the relaxation method by utilizing the multigrid approach for isothermal EHL problems. Liu, Wang et al. [24] investigated the impacts of various differential schemes on EHL calculations using the semi-system approach [25]. Various differential schemes have no effect when sufficient film thickness is achieved to keep the contacting surfaces apart. However, for ultra-thin film thickness, e.g., below 10–20 nm, the influence becomes more significant because truncation errors are large for higher-order discretization (2C) in the case of sharp gradients [24] whereas truncation errors are low for low-order discretization schemes (1B). Hence, the literature provides evidence that the first-order backward scheme (1B) solves the problem more accurately compared to the second-order central (2C) schemes [11,24].
This paper’s main goal is to numerically simulate the impact of asperity contact operating under ML conditions. In order to make multiple asperities, the solution grid should be fine enough to capture the geometrical configuration of the gap between the contact accurately. Liu, Wang et al. have used the LCICs boundary conditions for a single block of the square and cylindrical cross-section with a mesh size of 128 × 128 nodes [11]. For multiple solid contacts, however, the method is limited because of computational efficiency and accuracy requirements, since multiple asperities would need to be represented with a fine grid to get the local pressure distribution. The fine grid has a low residual reduction rate compared to the coarse grid, and with the increasing number of unknowns (n), the asymptotic convergence speed slows [23]. In this paper, to predict the pressure distribution in multiple asperity contact, a full multigrid (FMG) method has been implemented, and the produced results have been verified using the CFD simulation. The shear flow term of the Reynolds equation has been solved by using the 1B differential scheme to improve the accuracy, and it has also been demonstrated that the conventionally used 2C differential scheme cannot accurately estimate the hydrodynamic effect of asperity contact that may occur under ML conditions.

2. Modeling Approach

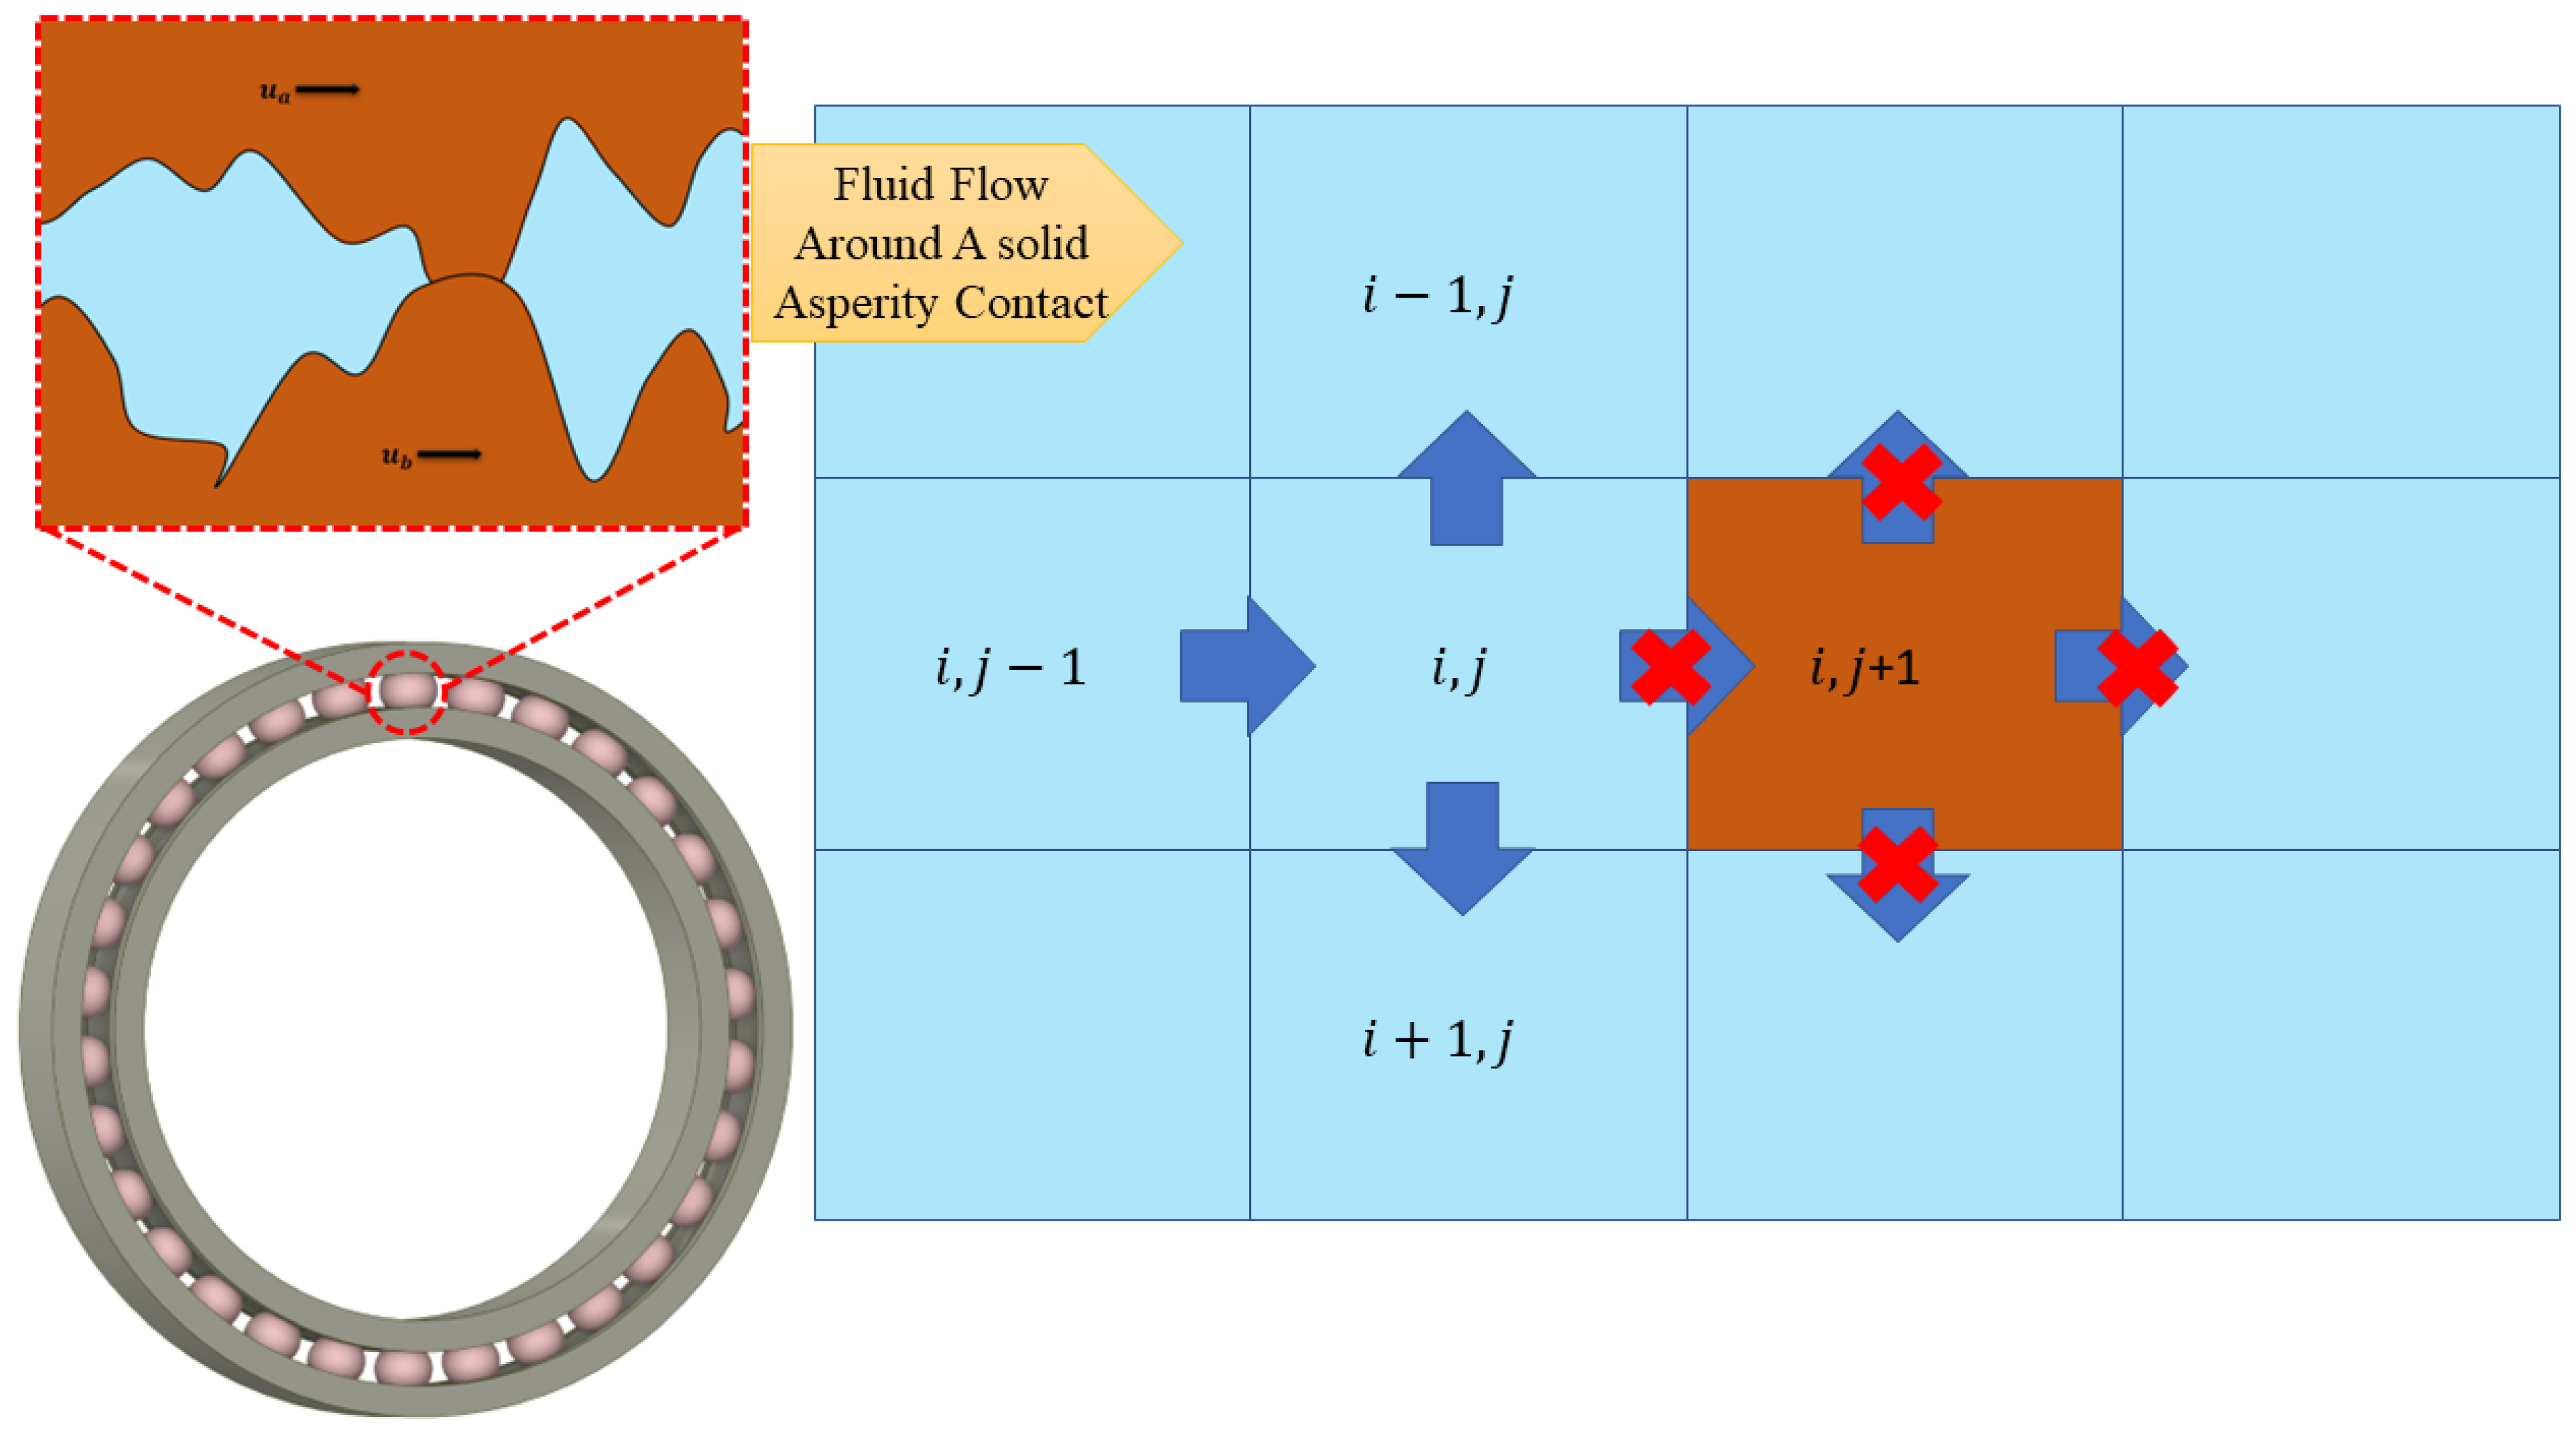
ML occurs when surfaces in contact are not perfectly smooth and are subjected to high loads and low speeds, such as in journal bearings and gears. It is a combination of hydrodynamic lubrication and boundary lubrication. To study this phenomenon, a hydrodynamic lubricated contact is simplified into a simple wedge problem.. To represent direct solid-to-solid contact in this simplified wedge, a rigid solid asperity that blocks the flow of lubricant is modeled. The effect of solid asperities blocking the lubricant flow at the interface of the converging wedge is numerically calculated without considering deformation. The traditional Reynolds equation alone cannot accurately solve this problem due to its unrealistic assumptions, so the LCIC’s boundary conditions [3] have been adopted at the boundary of the fluid–solid interaction (Figure 2, around the brown box). These conditions ensure that no physical flow can pass through the interface [5]. Additionally, algorithms have been developed using the multigrid method to solve the multiple asperity contact problem efficiently and accurately. Hence, a novel and advanced deterministic model has been designed to numerically simulate the converging wedge film with solid asperity contact to determine the fluid pressure using the Reynolds equation. Below, Figure 2 illustrates the phenomenon of fluid–solid interaction. It consists of blue boxes, representing fluid elements, and brown boxes, representing solid elements. The arrows in Figure 2 depict the fluid flow, whereas the same arrows with a red cross represent the location of the no-flow boundary condition that has been enforced at the interface of the fluid–solid contact.
To simplify the problem, it has been assumed that the solid pressure is greater than the pressure generated in the fluid film. Hence, it allows the solid asperities to make contact with the bottom surface. Therefore, the model is a simplified version of ML that does not consider the solid contact pressure. The Reynolds equation in the traditional solution process is discretized using high-order schemes such as 2C to discretize each term of the equation. However, in this study, to numerically simulate the problem of asperity contact, the Reynolds equation 1B finite difference discretization method has been utilized for the Couette Flow (CF) terms, which produced more accurate results compared to the 2C scheme. FDM-generated pressure has been compared with the CFD model in verifying the results. CFD uses Navier–Stokes equations to solve the model using the Finite Volume Method (FVM) [26]. To deal with cavitation during the flow simulation, a multiphase mixture model has been used, where the mass transfer between the two phases is governed by the Schnerr and Sauer cavitation model [27]. When the pressure of any liquid reduces to a level below its saturation pressure (Ps = 13 Pa), the liquid will start to enter into a vapor phase.

3. CFD Model Setup

The design modeler application of the ANSYS software has been used to construct the 3D model of converging wedge film thickness with variously shaped contacting solid asperities. In all the CFD models used in this study, it has been assumed that the upper and lower contact surfaces are smooth with no-slip boundary conditions, and to represent fluid–solid interaction (see Figure 3), solid asperities have been designed at the middle of the fluid domain. According to previous research [28,29], it is generally advised to use structural quadrilateral meshes instead of unstructured triangular meshes in fluid simulation using CFD, because they provide better stability, accuracy, and convergence. Therefore, in our CFD models, we have employed a quadrilateral mesh type, which was created using ICEM CFD software (ANSYS 2022). This software uses a multiblock structured mesh approach that generates a grid from the block, which is further subdivided into smaller blocks. The structured mesh developed using this software generally has well-defined elements, and can be used for complex geometries with varying boundary conditions. This meshing software is based on the FVM for generating mesh, and it also offers advanced mesh editing tools for adjusting mesh properties and resolving issues such as skewness and aspect ratio. The mesh sensitivity analysis has been conducted for each model and a range of elements has been utilized for the sensitivity testing of the CFD models varying between 1 × 10⁵ and 1 × 10⁸. However, the specific number of elements used for each model is displayed in the figures of the corresponding CFD sensitivity analysis. The CFD solution has been obtained using double precision, a pressure-based model where flow is considered laminar. The momentum and continuity equations have been solved using the Semi-Implicit Method for Pressure Linked Equations (SIMPLE) algorithmic approach. Pressure inlet and outlet boundary conditions have been applied during the CFD simulation. Table 1 lists the various parameters that have been used to model the problem [30].

4. FDM Model

Equation (1) shows the dimensionless Reynolds equation:
X ¯ ξ P ¯ X ¯ + K 2 Y ¯ ξ P ¯ Y ¯ = H ¯ X ¯
where ξ = H ¯ 3 , K = L x L Y , P ¯ = hydrodynamic pressure, H ¯ = film thickness, X ¯ = direction of flow, and Y ¯ = lateral axis to the flow direction. Here, the left-hand side (LHS) terms are known as the Poiseuille terms, and the right-hand side (RHS) term is called the wedge term. In wedge terms, H (film thickness) can be defined analytically. Equation (2) shows the dimensionless film thickness used for the converging simple wedge geometry.
H ¯ = H 0 + 1 X ¯
The Reynolds equation has been discretized using the 2C discretization scheme, as shown in Equation (3):
ξ i + 0.5 , j P ¯ i + 1 , j ξ i + 0.5 , j + ξ i 0.5 , j P ¯ i , j + ξ i 0.5 , j P ¯ i 1 , j X ¯ 2 + K 2 ξ i , j + 0.5 P ¯ i , j + 1 ξ i , j + 0.5 + ξ i , j 0.5 P ¯ i , j + ξ i , j 0.5 P ¯ i , j 1 Y ¯ 2 = H ¯ i + 1 , j H ¯ i 1 , j 2 X ¯
The higher-order discretization scheme (e.g., 2C) provides close to exact results for thick fluid films. Hence, both the Poiseuille terms and wedge terms have been discretized using 2C discretization. However, for ultra-thin fluid films or where a large gradient of film thickness exists, using the 1B scheme for the wedge term provides a more accurate solution than the 2C scheme, because truncation errors are significant with higher-order schemes in the case of sharp gradients [24]. Lui et al. has suggested using the 1B scheme for the RHS of the Reynolds equation [11]. Hence, following the recommendations of Ref. [11], Equation (1) can also be discretized as Equation (4), where the Couette flow or wedge flow term has been discretized using the 1B scheme.
ξ i + 0.5 , j P ¯ i + 1 , j ξ i + 0.5 , j P ¯ i , j ξ i 0.5 , j P ¯ i , j + ξ i 0.5 , j P ¯ i 1 , j X ¯ 2 + K 2 ξ i , j + 0.5 P ¯ i , j + 1 ξ i , j + 0.5 P ¯ i , j ξ i , j 0.5 P ¯ i , j + ξ i , j 0.5 P ¯ i , j 1 Y ¯ 2 = H ¯ i , j H ¯ i 1 , j X ¯
Below, Equation (5) shows the different terms of the Reynolds equation in the form of flow continuity, as suggested by Liu et al. [31], where P refers to the Poiseuille flow terms and C refers to Couette flow terms. Equation (4) can also be presented considering the right-hand side function f ( i , j ) when applying the FMG approach.
Q P X i + 0.5 , j Q P X i 0.5 , j X ¯ + K 2 Q P Y i , j + 0.5 Q P Y i , j 0.5 Y ¯ Q c X i + 0.5 , j Q c X i 0.5 , j X ¯ = f i , j
The above Equation (5) shows the discretized Reynolds equation in the form of flow continuity, as suggested by Liu et al. [11].

5. Relaxation

While solving the Reynolds equation, negative pressure has been kept equal to zero, because the Reynolds equation is not valid in the cavitation region. The problem has been solved on a unit square domain Γ = [0, 1] × [0, 1]. In this paper, the model is assumed to have smooth contacting surfaces producing a converging wedge-shaped film thickness where the inclined upper wall is stationary with the moving lower surface at 1 m/s velocity. The inlet height is 10 μm, the outlet height is 6 μm, and the length of the converging wedge is 600 μm. At the boundaries, the pressure is assumed to be zero, and any predicted negative pressure during iteration is also considered zero. Furthermore, the residuals are only calculated for positive pressure regions; hence, cavitated regions should have zero residuals. To define the interface boundary condition between the fluid and solid, it has been assumed that the external load is larger than the hydrodynamic pressure generated in the lubricated contact, and the fluid will flow around the solid asperity contact. On the other hand, if the fluid pressure is higher than the external load, the fluid will lift the solid asperity contact and begin flowing in without making any solid contact. Hence, to mathematically define the solid contact, we must ensure that the fluid–solid interface does not allow any physical flow to pass through it. As a result, the no-flow restriction has been incorporated into the Reynolds equation with zero film thickness. For more information on the application of LCICs, readers are referred to reference [11].
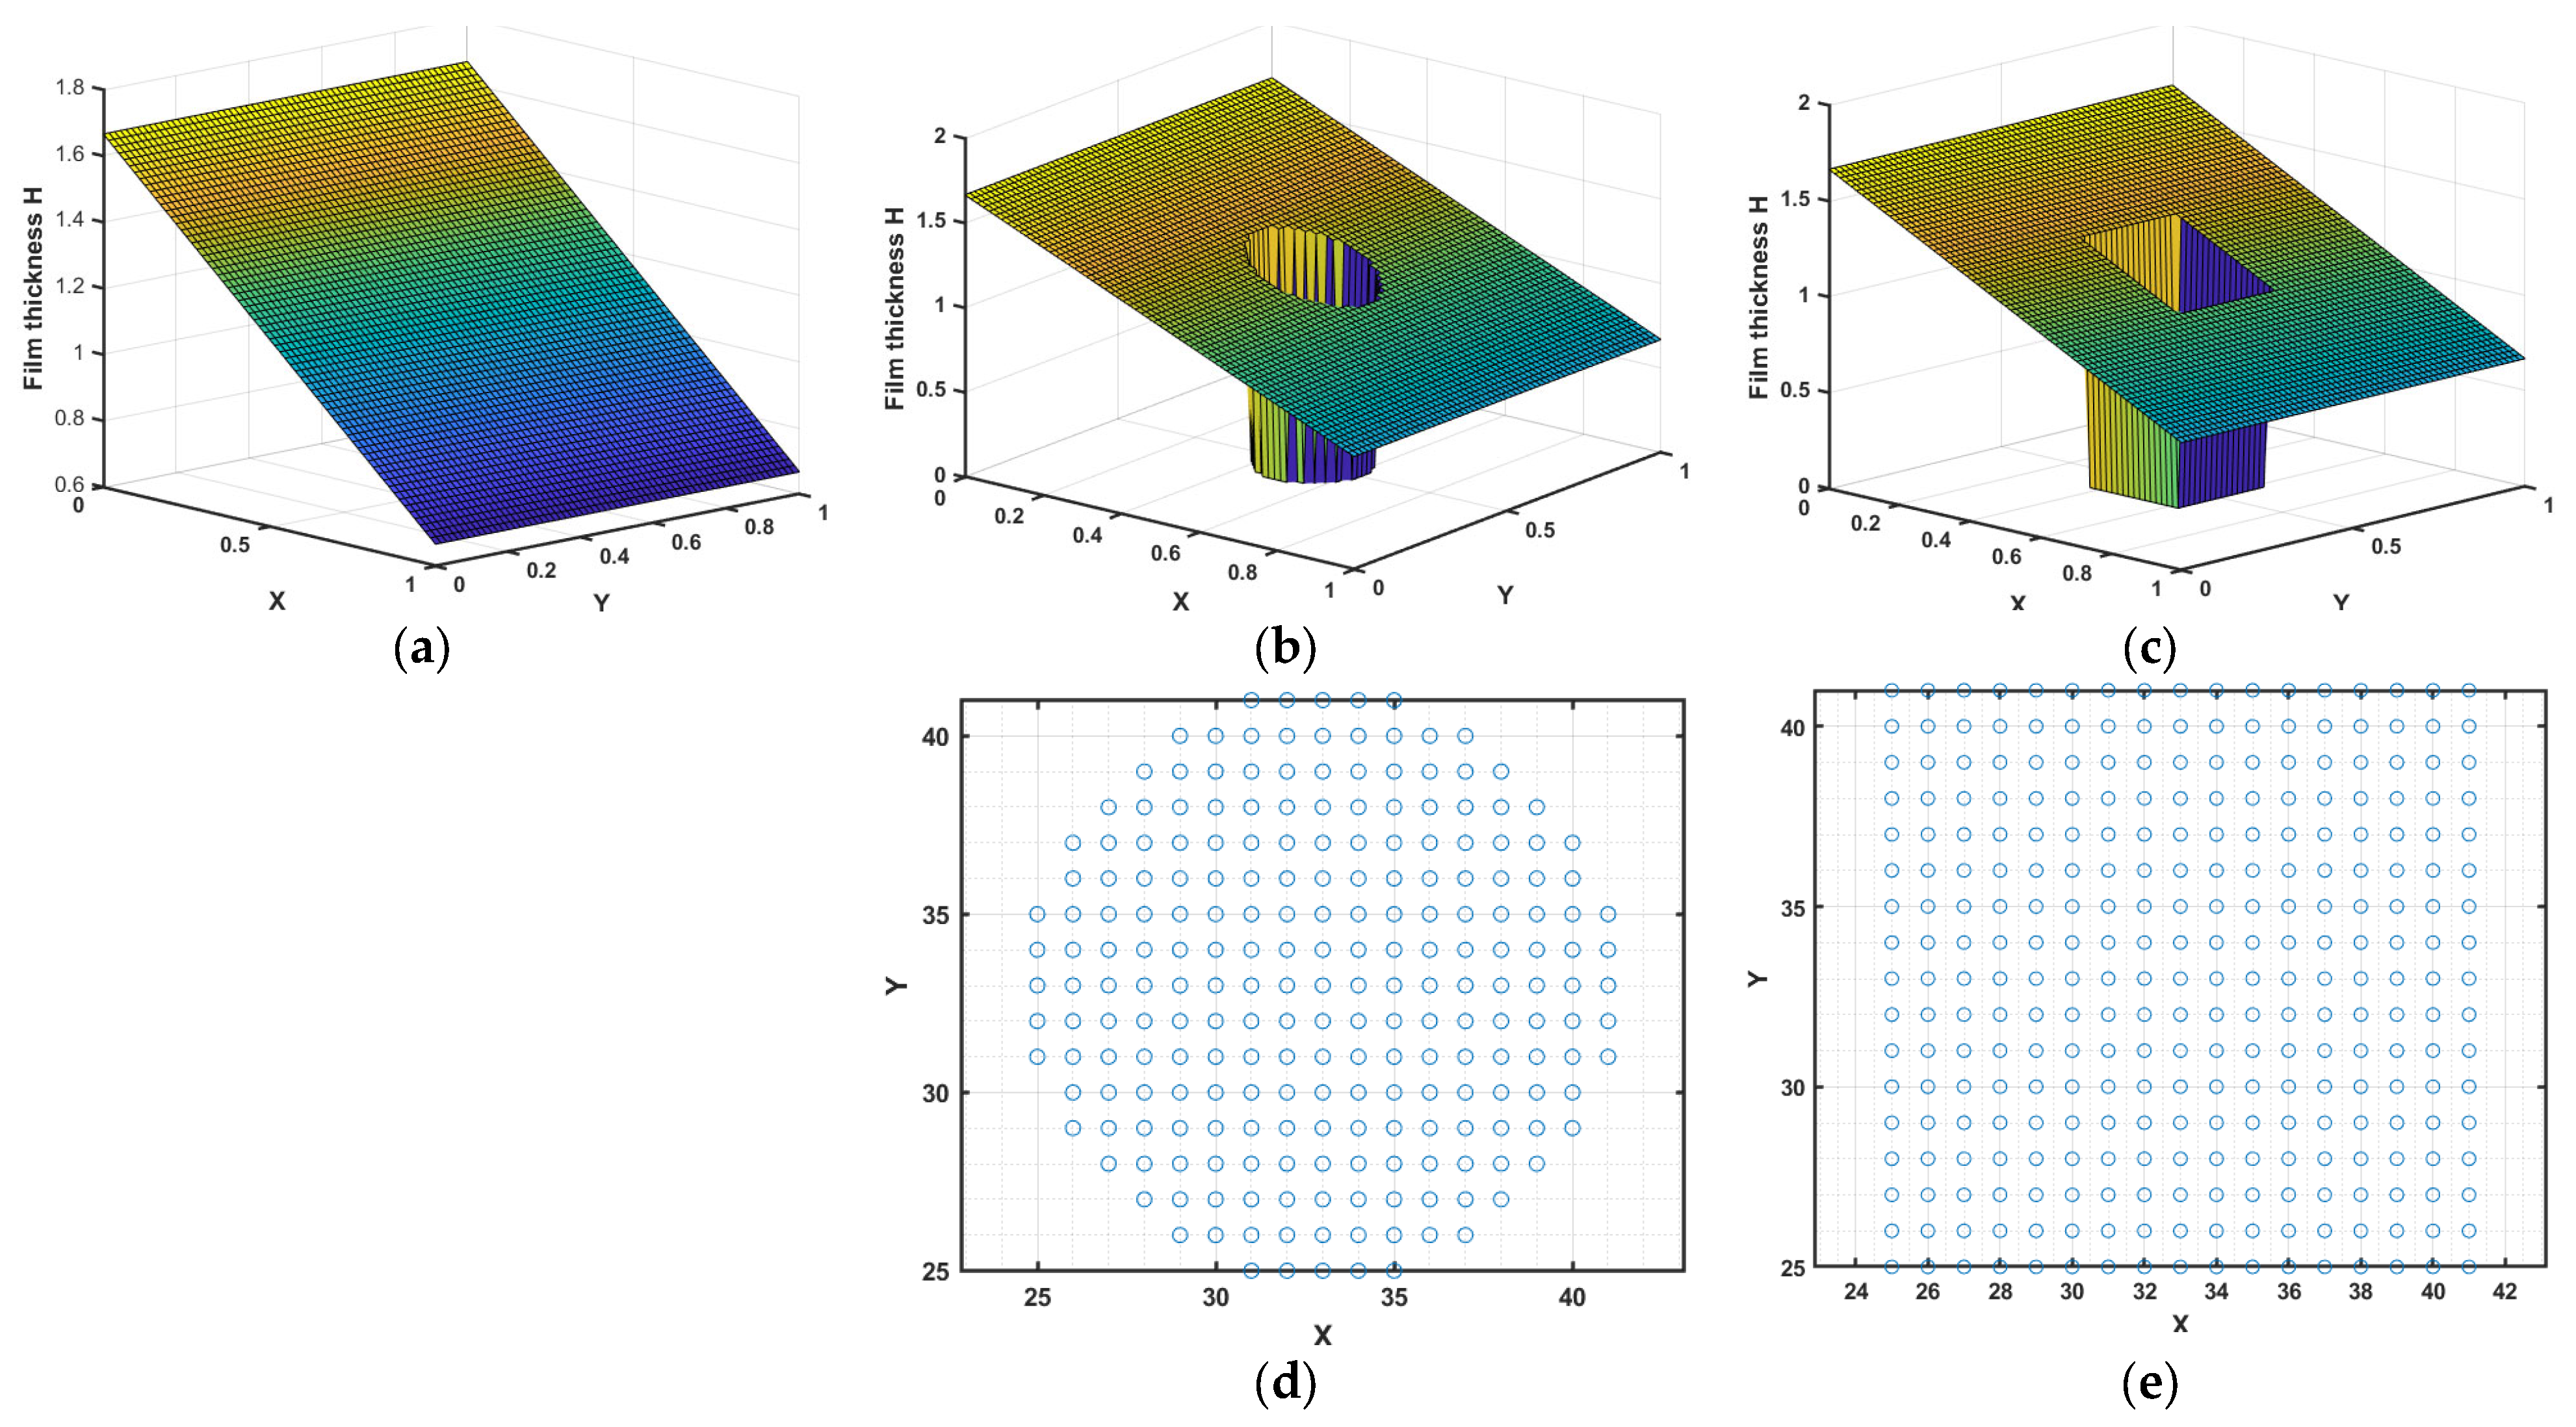
Figure 3 shows the three types of film thickness, considering the inlet height is 1 mm and outlet height is 4 mm, and the length and width of the converging wedge is 30 mm. At the boundaries, the pressure is assumed to be zero, and any predicted negative pressure during iteration is also considered zero. Furthermore, the residuals are only calculated for positive pressure regions; hence, cavitated regions should have zero residuals. Figure 3a depicts the simple wedge film thickness, whereas Figure 3b displays the wedge with a single cylindrical asperity contact problem. Figure 3c illustrates the wedge with a single square asperity contact problem. In addition, Figure 3d,e demonstrate the cross-sectional area of the cylinder and square solid asperity, and corresponding elements that make contact with the lower wall, where the film thickness is zero.
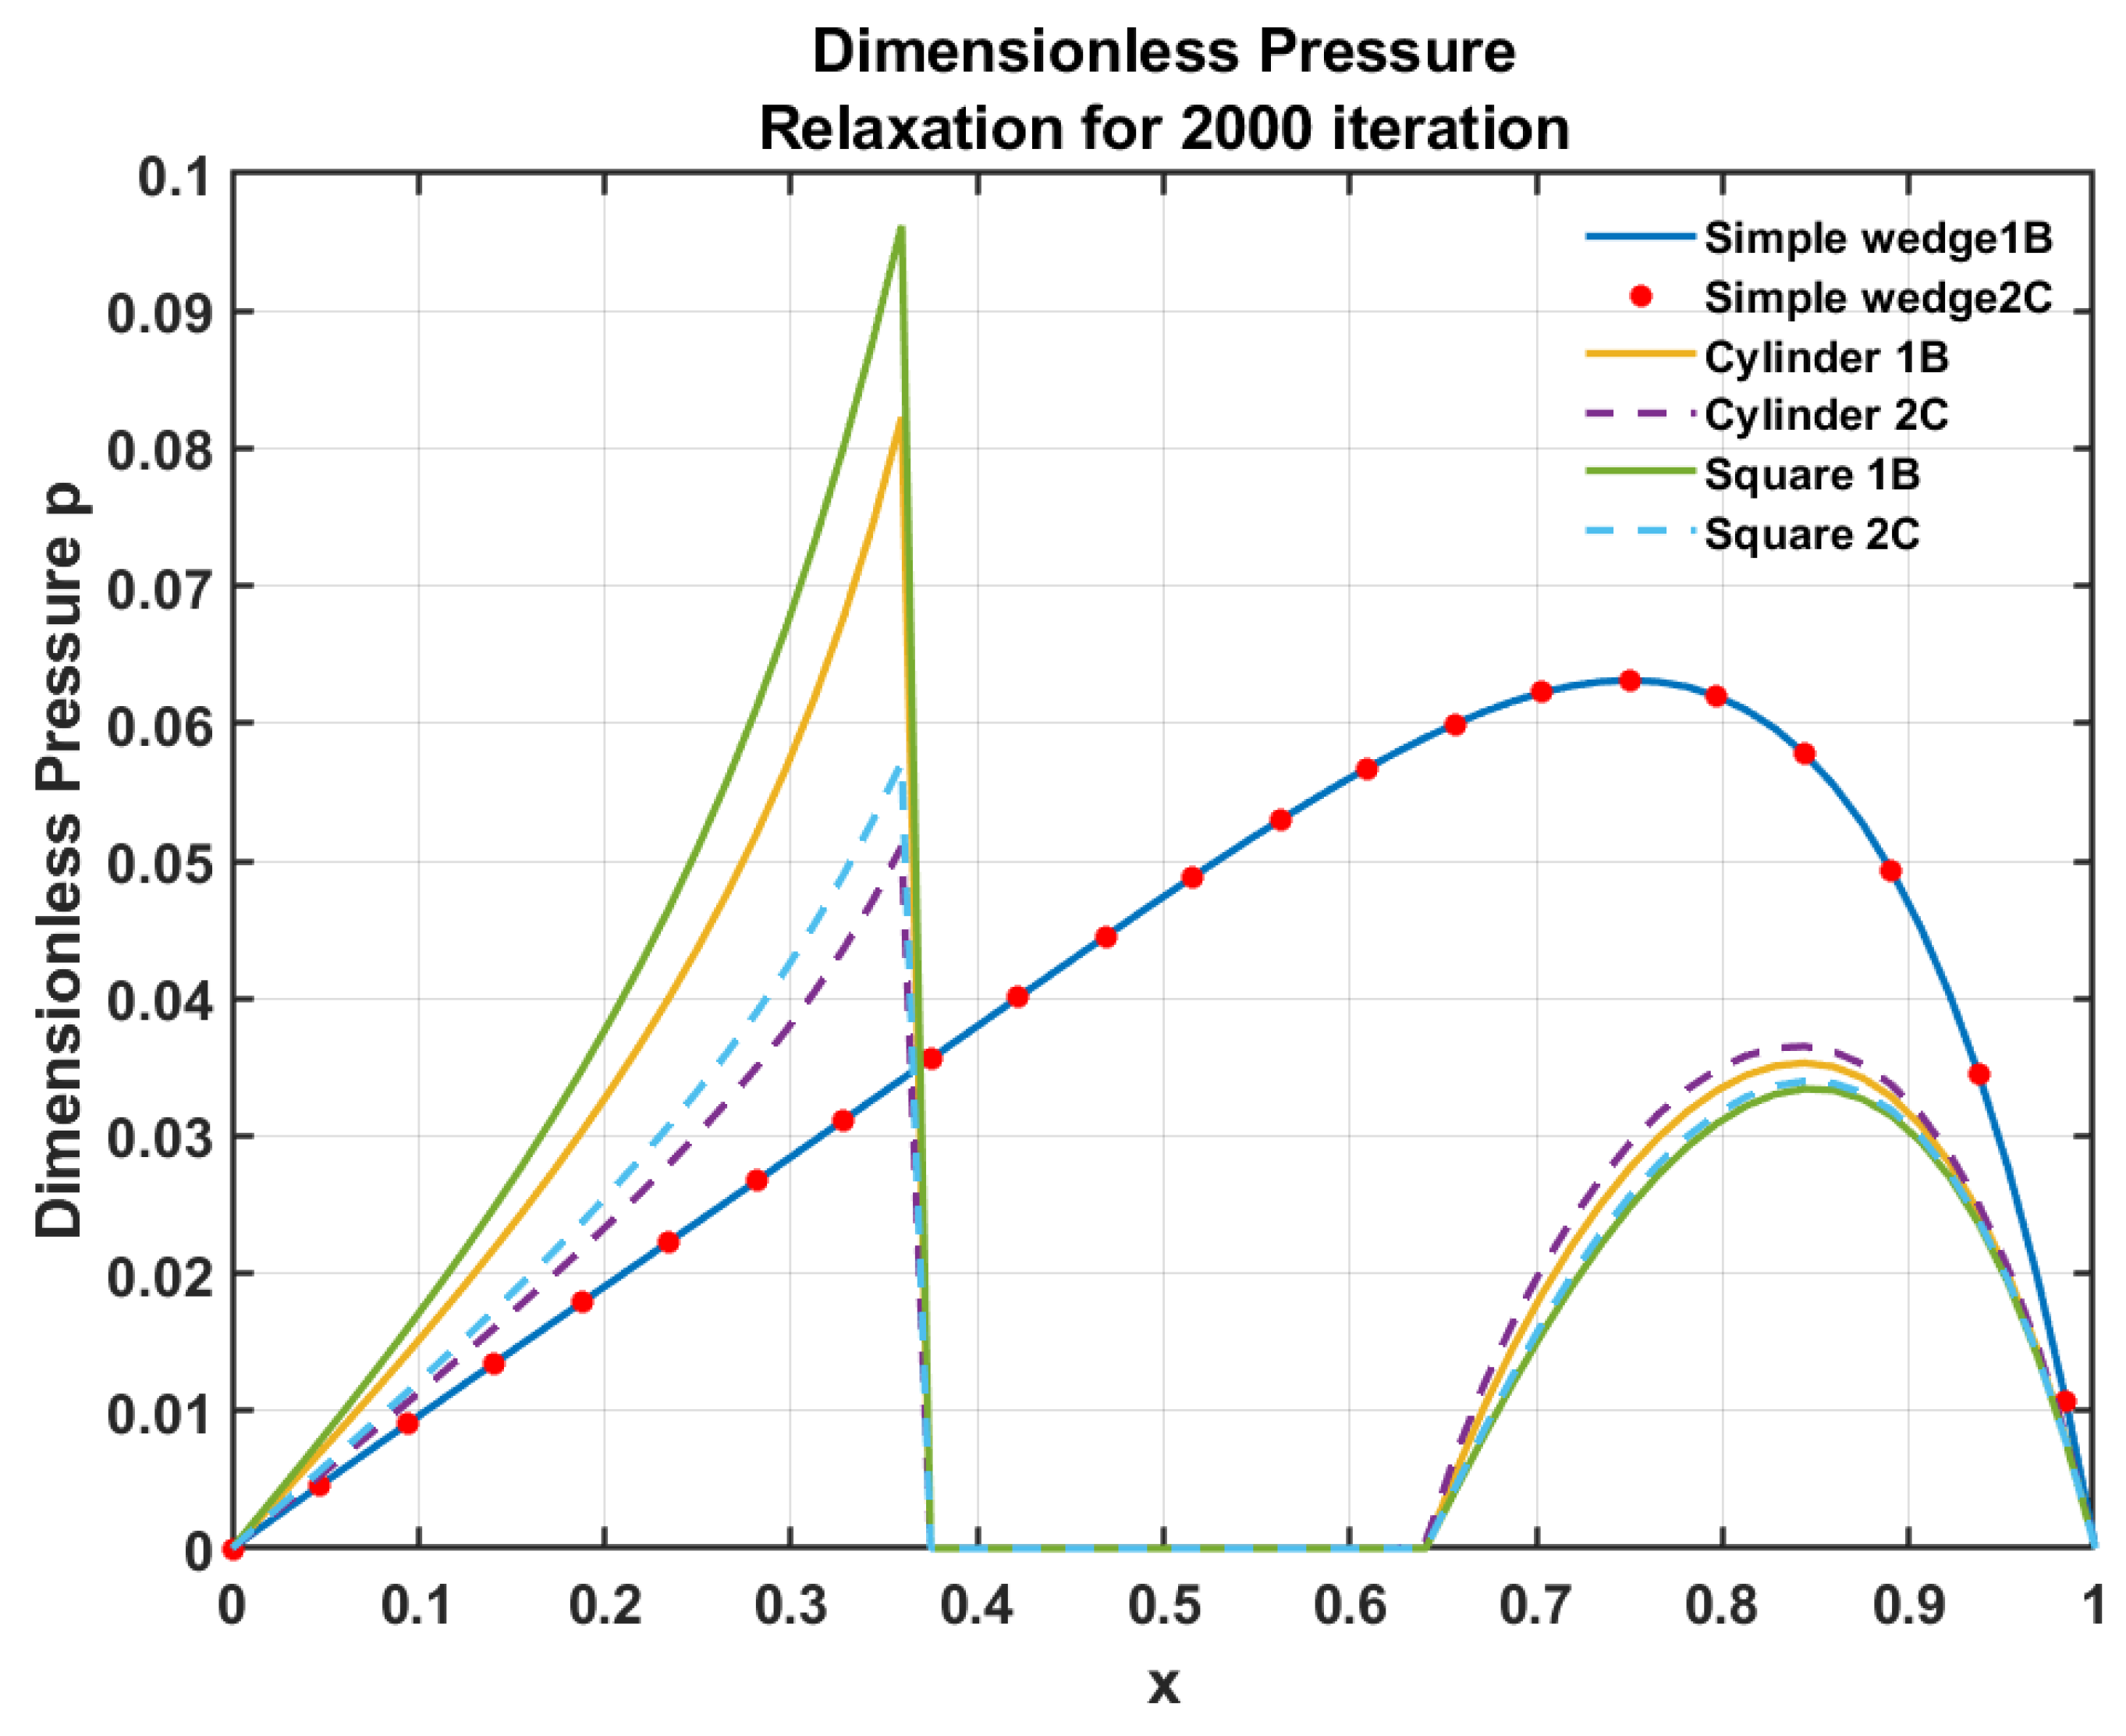
Figure 4 represents the pressure distribution calculated using Gauss–Seidel relaxation. Additionally, the LCIC boundary conditions have been adopted to calculate pressure when the fluid flow is blocked by the solid obstacle of the square and cylindrical cross-section [11]. In Figure 4, initially, the simple wedge problem (shown in Figure 3a) has been solved using both 1B and 2C discretization schemes. The result shows (Figure 4) that the discretization schemes (1B and 2C) do not affect pressure when the fluid film is uninterrupted. For instance, in the case of a converging simple wedge, both the discretization schemes produce an equal pressure profile. Secondly, an identical simple wedge problem with cylindrical (see Figure 3b,d) and square (see Figure 3c,e) asperity contacts in the middle of the domain has been solved using both 1B and 2C discretization schemes. In these cases, fluid flow is blocked using an 8 mm-long square and an 8 mm-diameter cylindrical asperity. The results in Figure 4 show that different discretization schemes gives different results, especially in the case when fluid flow is interrupted by solid asperity. The 1B scheme accurately captures the increase in pressure when the fluid hits a solid asperity. However, 2C cannot accurately predict the pressure variation. Liu, Wang et al. have effectively explained why different discretization schemes give rise to different pressures [2]. As the fluid flows towards the solid obstacle, the pressure increases sharply, and at this point, the fluid’s kinetic energy is converted into pressure energy.
Liu, Wang et al. have solved the same geometrical problem [11], where cylindrical and square pillar blocks have been numerically simulated for many iterations to get the converged solution for a particular grid size (128 × 128 or 256 × 256). For greater grid sizes, the iteration will require a long time to calculate the accurate solution. Furthermore, if multiple asperity contacts are to be simulated, a fine grid must be used. Consequently, the convergence rate will be reduced, and an accurate solution will be less likely to be obtained within a short timeframe. Therefore, a new approach is needed that can simulate the asperity contact problem efficiently, accurately and in less time. A common technique to increase the overall efficiency of the process is the multigrid method. In the next section, we use the full multigrid method together with the LCIC’s boundary conditions around the solid object.

6. Full Multigrid Approach

The current paper employs the FMG algorithm, which solves the discretized Reynolds equation starting from the coarsest grid and reaching to the finest grid, while interpolating the solution from the current grid to the subsequent finer grid. The main aim of the algorithm is to quickly reduce the algebraic errors below discretization errors on a given grid before actually moving to the next finer grid [23]. To get the convergence acceleration, full multigrid methods described by Venner [23] have been used. The simulations were performed using eight levels with 512 × 5120 discretization points on the finest grid. The produced results have been compared with a 3D CFD model for validation. To compare results with CFD, we must make sure that the flow is laminar. It has recently been reported that in order to compare FDM with CFD for simple wedge problems, we require the wedge problem be solved for the line contact [28].

7. Results and Discussion

Various results produced using the FDM and CFD are shown below. The outcomes have been examined using a pressure contour plot, which has been created on the middle plane passing through the center of the domain. Similarly, the pressure has also been compared on the line that passes through the middle of the inlet and goes out the middle of the outlet.

7.1. Simple Wedge Problem

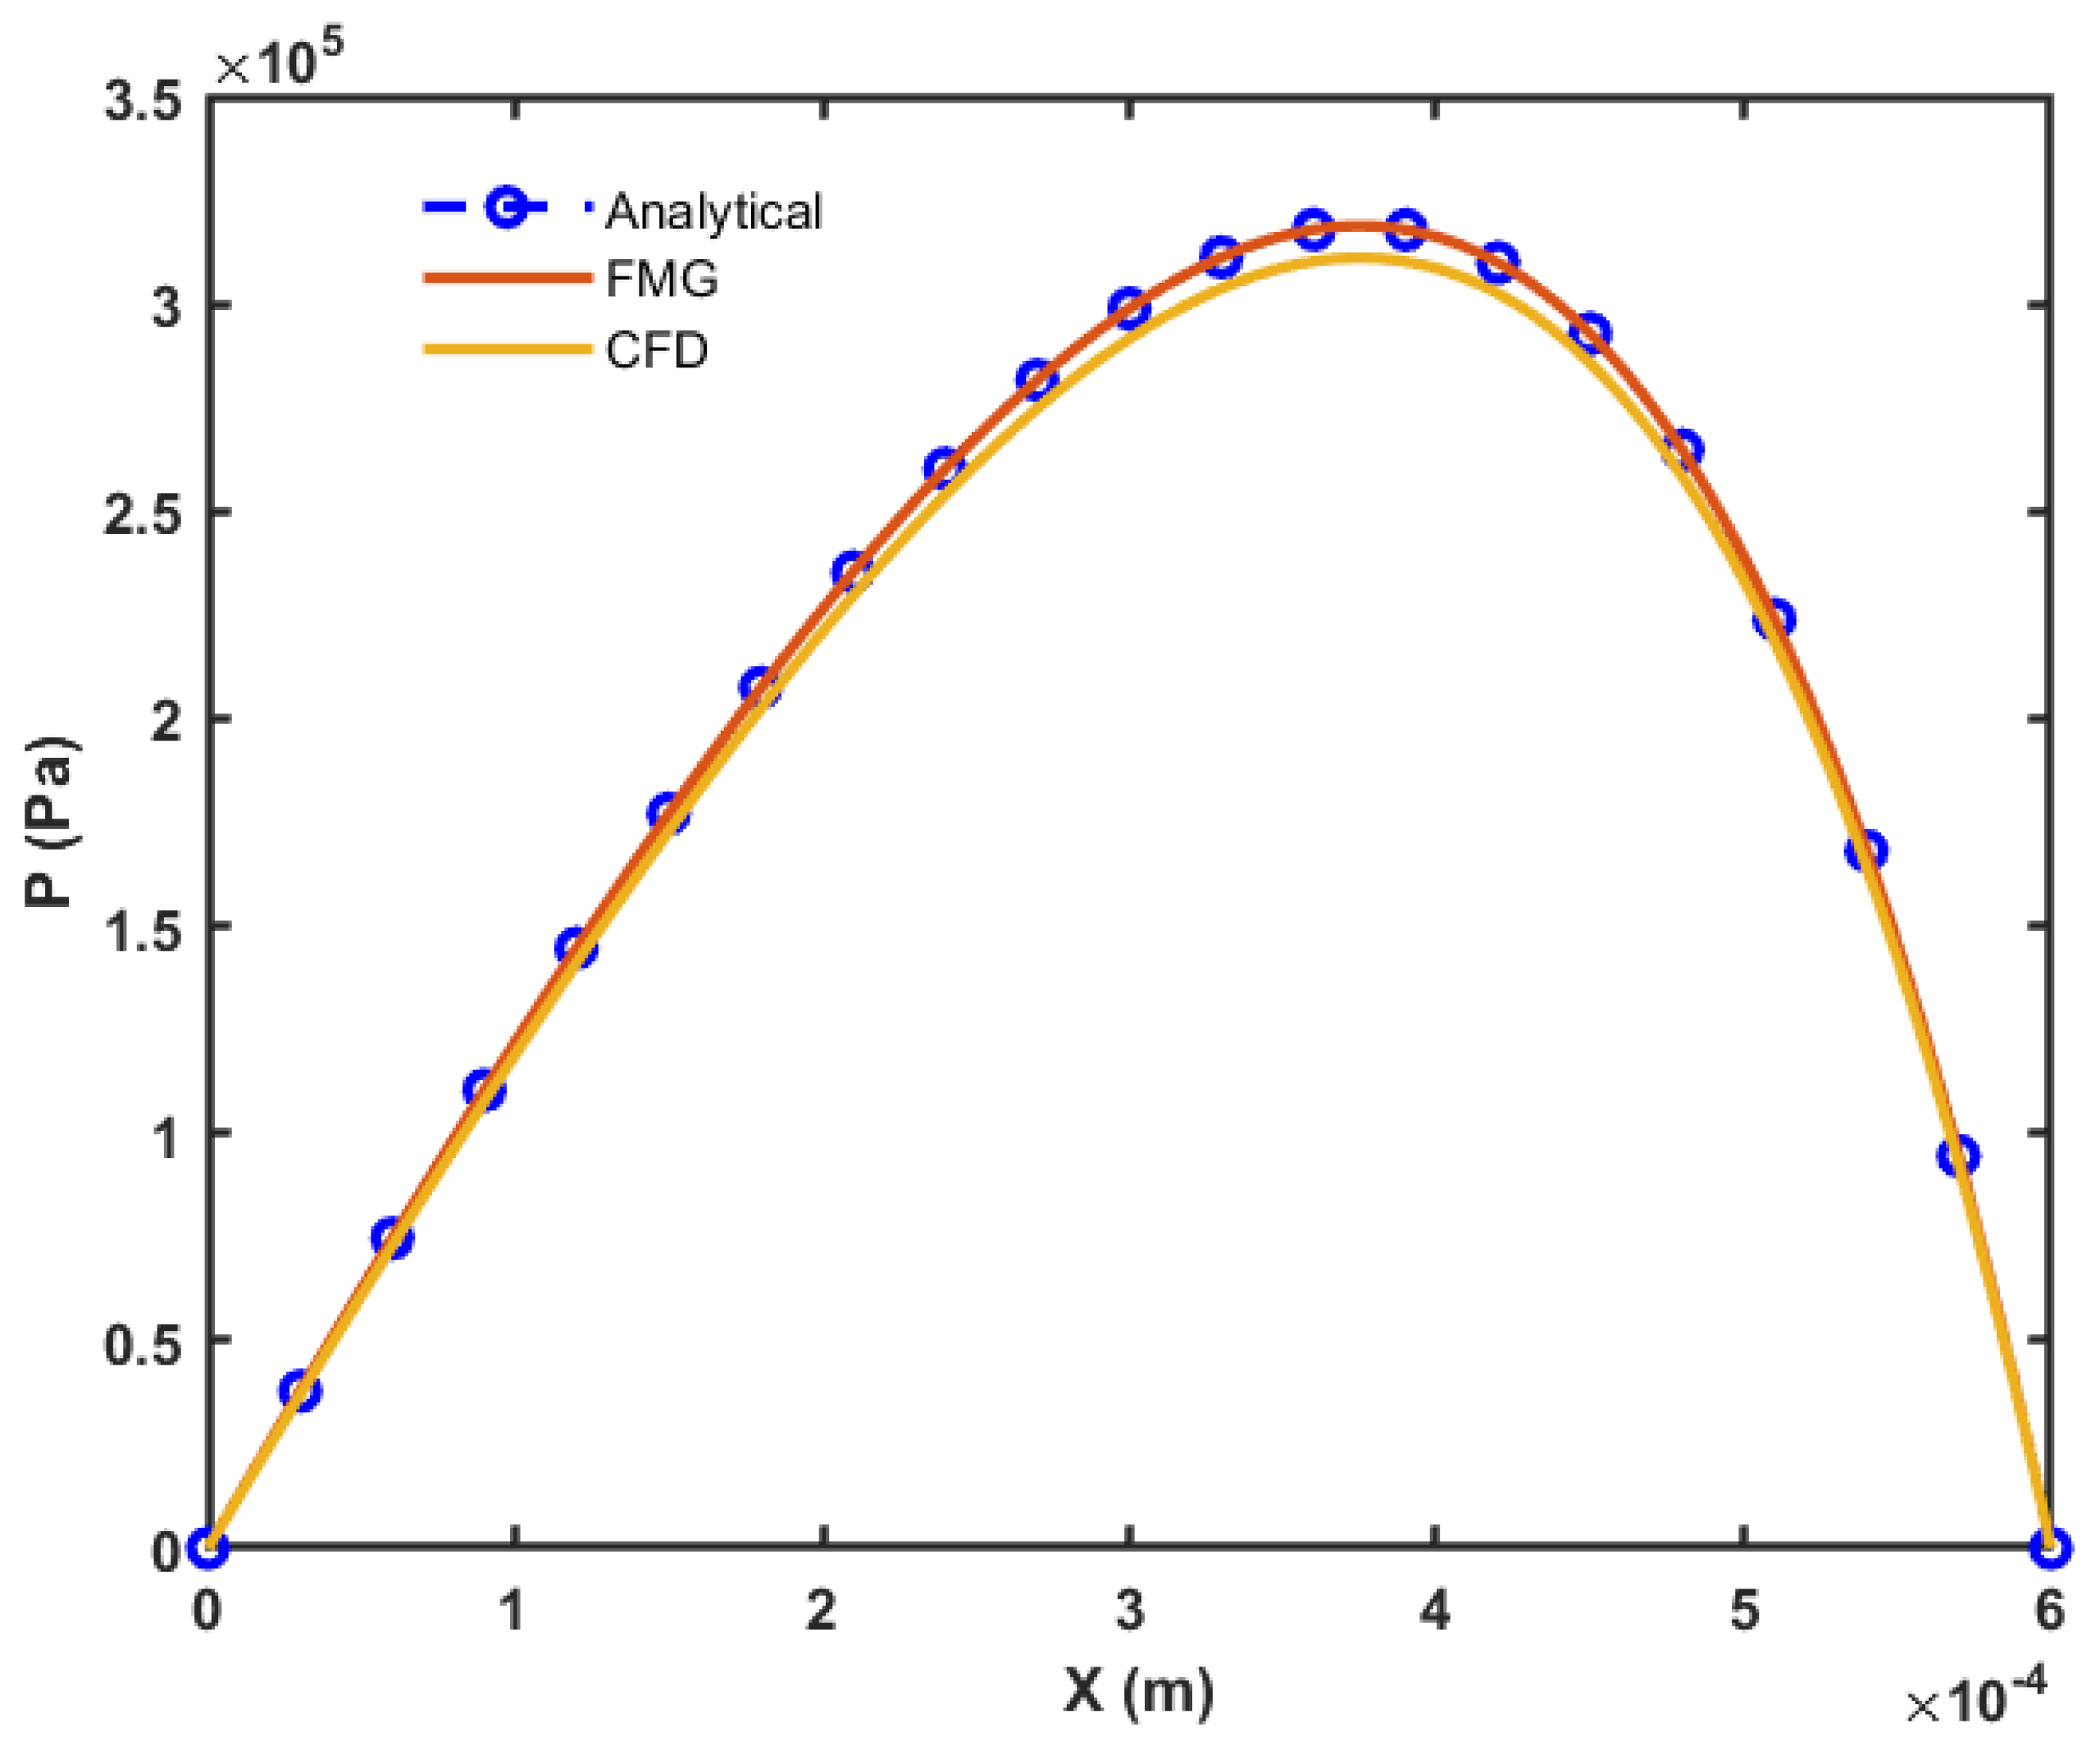
The analytical equations for a 2D simple wedge problem have been described in the literature [28]. For the parameters shown in Table 1, a simple wedge problem has been solved using three different methods. Here, the inlet height is 10 μm and the outlet height is 6 μm, and the length of the converging wedge is 600 μm. At the boundaries, the pressure is assumed to be zero, and any predicted negative pressure during iteration is also considered zero. Furthermore, the residuals are only calculated for positive pressure regions; hence, cavitated regions should have zero residuals. The 1D analytical results overlap with the FDM results; however, there is a maximum difference of 2.3545% between the FDM and CFD. Based on this, the pressure distribution (see Figure 5) shows excellent agreement between the results obtained using the three different methods. The contour plots (Figure 6) have also been compared for the FDM and CFD methods.

7.2. One Cylindrical Solid Asperity

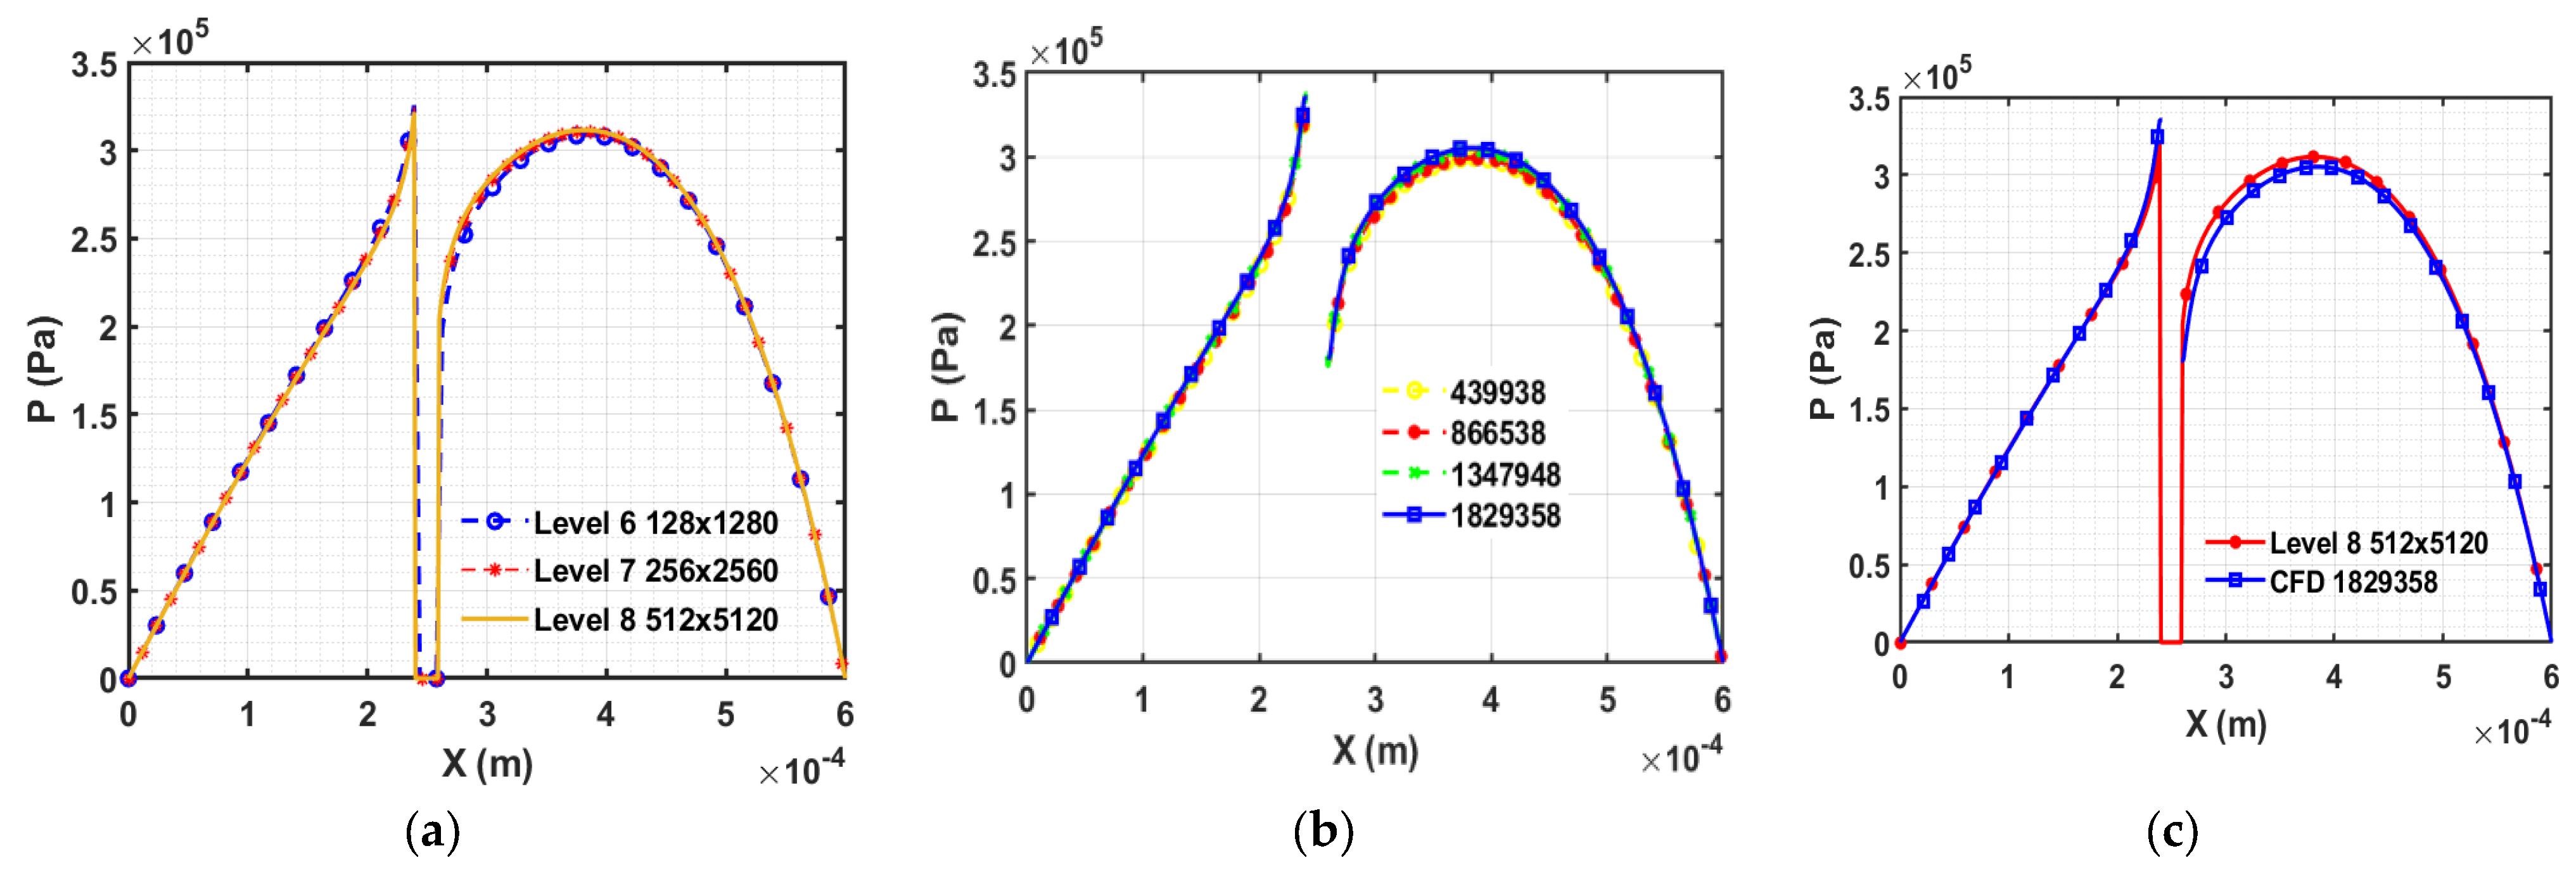
In this section, one solid cylindrical asperity has been simulated using the full multigrid method. The length of the domain is 600 μm and the width of the domain is 6000 μm; hence, the length-to-width ratio (K) is equal to 0.1. The radius of the cylindrical asperity is 10 μm and the position of the center of the asperity is at (250, 3000) μm. Below, Figure 7a shows the mesh convergence analysis conducted using the FDM. Figure 7b shows the mesh convergence analysis performed using CFD simulation for various mesh sizes. And Figure 7c represents the comparison of the pressure profiles produced using the FDM and CFD methods with the converged mesh size. The pressure comparison on a line shows a less than 4% difference in the results behind the cylindrical asperity. It is evident from the contour plots produced in Figure 8a,b that the developed algorithm, which uses the full multigrid method to solve fluid–solid interactions in lubrication, can be used to calculate the correct pressure on a standard personal computer with ease.

7.3. Two Cylindrical Solid Asperity

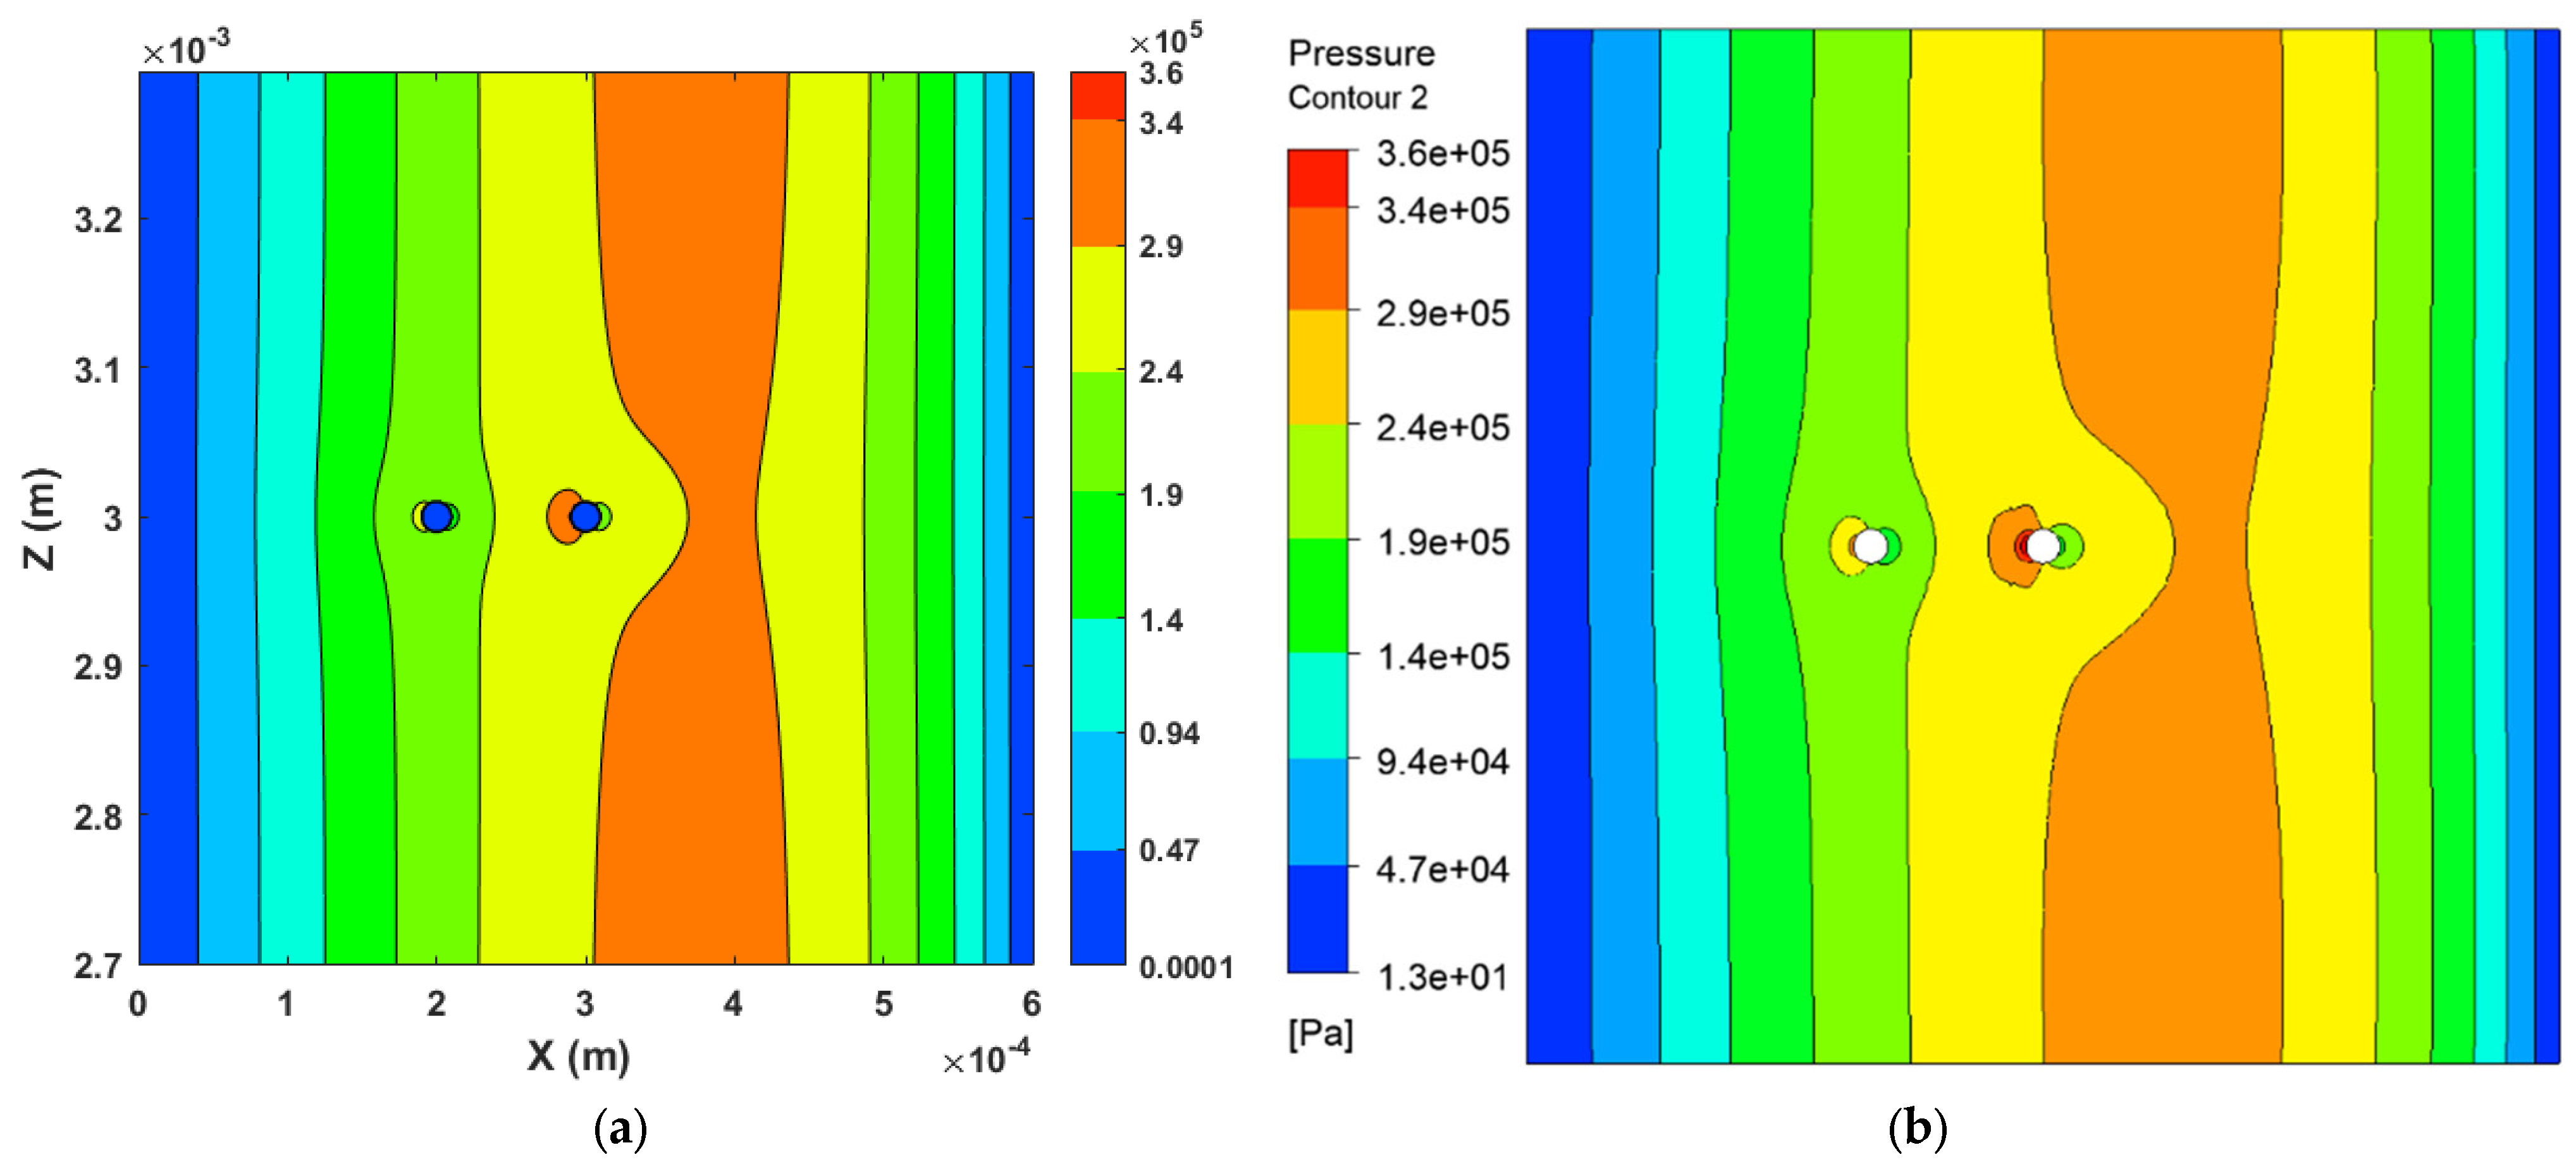
Similar to the above section, two cylindrical asperities have been made with 10 μm radii, which are 100 μm apart from each other and placed one behind the other. The two cylinders have been positioned at 200 μm and 3000 μm and 300 μm and 3000 μm, respectively. The mesh sensitivity analysis has been performed using both methods, and the results are shown in Figure 9a,b. The pressure comparison on the middle line for the FDM and CFD methods shows a less than 5% difference in Figure 9c. The pressure contour plots (see Figure 8a and Figure 10b) produced using both methods give comparable results.

7.4. Three Cylindrical Solid Asperity

In this section, three cylindrical asperities of 10 μm have been simulated, which are placed in a straight line and 75 μm apart from each other. The positions of the cylinders are 175 μm and 3000 μm, 250 μm and 3000 μm, and 325 μm and 3000 μm, respectively. The mesh sensitivity results produced using both methods (FDM, CFD) are acceptable (Figure 11a,b). The pressure comparison on the line passing through the middle of the domain (Figure 11c) shows an approximate 5% difference in the results. The comparison of the pressure contour plots shown in Figure 12a,b demonstrates acceptable variation in the pressure profile (Figure 10).

7.5. Five Cylindrical Solid Asperity

In this section, five cylindrical asperities (see Figure 13) with a 10 μm radius have been simulated, which are placed 75 μm apart from each other as shown in Figure 13. The middle cylinder is 250 μm away from the inlet.
The mesh sensitivity analyses via both methods have been performed by comparing the pressure with different mesh sizes, and the results are shown in Figure 14a,b. The pressure comparison on the mid-line shows an approximate 5% difference in the results, as is depicted in Figure 14c. The pressure contour plots (Figure 15) produced using the FDM and CFD match each other, just before the solid contact. However, there are a few areas where differences are apparent. These differences can be attributed to the two different meshing techniques used in each method. A uniform mesh is used in FDM for the entire domain, whereas a high grid resolution is used in CFD around the asperity contact as compared to the rest of the fluid domain. The fine mesh near the solid walls allows us to accurately capture the flow in CFD. Additionally, in CFD, the number of elements is very high compared to the FDM. Another reason is the treatment of the boundary conditions at the wall. In CFD Fluent, the wall functions method [32] is commonly used to model the flow near the wall, while in FDM, the no-slip boundary condition is applied. The difference in these methods can lead to discrepancies in the predicted flow near the wall. Additionally, the numerical scheme used in both CFD Fluent and FDM can also contribute to the discrepancies.

8. Conclusions

This paper describes a solid–fluid interaction model that simulates ML contacts under severe conditions. The model uses LCIC boundary conditions and the FMG method to solve the Reynolds equation via the finite difference method. Two different discretization schemes, 1B and 2C, are used to discretize the wedge term in the Reynolds equation. Numerical experiments are performed on circular cross-sections with single and multiple asperity contacts, and the fluid pressure distribution is compared with the 3D CFD simulation of laminar flow under the same working conditions.
The study reveals that the traditional Reynolds equation and the 2C scheme are unreliable when used in mixed lubrication scenarios where fluids and solids interact at the interface. The influence of different differential schemes is insignificant when the contacting surfaces are fully separated with sufficient lubricant film. However, a significant difference in the pressure distribution is observed when using the 1B versus the 2C scheme for discretizing the Couette flow term in the Reynolds equation when solid asperity contacts block the fluid flow. The proposed model offers reasonable computational efficiency on a standard personal computer to get detailed solutions related to solid asperity contact. Additionally, the developed novel multigrid algorithms significantly reduce the code execution time. Additionally, the robustness of the model has been validated by testing with single and multiple asperity contacts of circular cross-sections. The model can be easily extended to EHL, thermal and transient calculations, where the ε = dh dL ratio is smaller than or equal to 0.01, and velocity changes in the film thickness direction can be ignored.
Author Contributions

R.P.: writing—original draft, methodology, conceptualization, software, formal analysis, visualization, investigation, writing—review and editing; Z.A.K.: resources, writing—review and editing, supervision, funding acquisition, and project administration; A.S.: supervision; V.B.: conceptualization, formal analysis, validation, and supervision. All authors have read and agreed to the published version of the manuscript.

Funding

This research was funded by SCHAEFFLER TECHNOLOGIES AG & CO. KG, GERMANY, grant number/grant ID: 12064.

Data Availability Statement

The data presented in this study are available on request from the corresponding author. The data are not publicly available due to the privacy policy.

Acknowledgments

The present work is part of a project that has been funded by Schaeffler technology AG under agreement ID: 12064. The authors would like to express their gratitude to Schaeffler Technologies AG & Co. KG, Germany, for providing in-kind support for this study at Bournemouth University in the United Kingdom.

Conflicts of Interest

The authors declare no conflict of interest.

Nomenclature

hFilm thickness ξ H ¯ 3
nNumber of unknowns ε dh/dL
u, u0Velocity of the lower wall ρ Density of oil
LxLength of the fluid domain η Dynamic viscosity of oil
LyTransverse direction length P ¯ Dimensionless pressure
X ¯ Element size in x direction Y ¯ Element size in Y direction

References

  1. Wang, Y.; Azam, A.; Zhang, G.; Dorgham, A.; Liu, Y.; Wilson, M.C.T.; Neville, A. Understanding the Mechanism of Load-Carrying Capacity between Parallel Rough Surfaces through a Deterministic Mixed Lubrication Model. Lubricants 2022, 10, 12. [Google Scholar] [CrossRef]
  2. Lv, F.; Zhang, X.; Ji, C.; Rao, Z. Theoretical and experimental investigation on local turbulence effect on mixed-lubrication journal bearing during speeding up. Phys. Fluids 2022, 34, 113104. [Google Scholar] [CrossRef]
  3. Shi, X.J.; Lu, X.Q.; He, T.; Sun, W.; Tong, Q.S.; Ma, X.; Zhao, B.; Zhu, D. Predictions of friction and flash temperature in marine gears based on a 3D line contact mixed lubrication model considering measured surface roughness. J. Cent. South Univ. 2021, 28, 1570–1583. [Google Scholar] [CrossRef]
  4. Rajput, H.; Atulkar, A.; Porwal, R. Optimization of the surface texture on piston ring in four-stroke IC engine. Mater. Today Proc. 2021, 44, 428–433. [Google Scholar] [CrossRef]
  5. Dobrica, M.B.; Fillon, M.; Maspeyrot, P. Mixed Elastohydrodynamic Lubrication in a Partial Journal Bearing—Comparison Between Deterministic and Stochastic Models. J. Tribol. 2006, 128, 778–788. [Google Scholar] [CrossRef]
  6. Spikes, H.A. Mixed lubrication—An overview. Lubr. Sci. 1997, 9, 221–253. [Google Scholar] [CrossRef]
  7. Spikes, H.A.; Olver, A.V. Mixed lubrication—Experiment and theory. Tribol. Ser. 2002, 40, 95–113. [Google Scholar] [CrossRef]
  8. Patel, R.; Khan, Z.A.; Saeed, A.; Bakolas, V. A review of mixed lubrication modelling and simulation. Tribol. Ind. 2021, 44, 150–168. [Google Scholar] [CrossRef]
  9. Patir, N.; Cheng, H.S. An Average Flow Model for Determining Effects of Three-Dimensional Roughness on Partial Hydrodynamic Lubrication. J. Lubr. Technol. 1978, 100, 12–17. [Google Scholar] [CrossRef]
  10. Patir, N.; Cheng, H.S. Application of Average Flow Model to Lubrication Between Rough Sliding Surfaces. J. Lubr. Technol. 1979, 101, 220–229. [Google Scholar] [CrossRef]
  11. Liu, S.; Wang, Q.J.; Chung, Y.-W.; Berkebile, S. Lubrication–Contact Interface Conditions and Novel Mixed/Boundary Lubrication Modeling Methodology. Tribol. Lett. 2021, 69, 164. [Google Scholar] [CrossRef]
  12. Pusterhofer, M.; Bergmann, P.; Summer, F.; Grün, F.; Brand, C. A Novel Approach for Modeling Surface Effects in Hydrodynamic Lubrication. Lubricants 2018, 6, 27. [Google Scholar] [CrossRef]
  13. Sahlin, F.; Larsson, R.; Almqvist, A.; Lugt, P.M.; Marklund, P. A mixed lubrication model incorporating measured surface topography. Part 1: Theory of flow factors. Proc. Inst. Mech. Eng. Part J J. Eng. Tribol. 2010, 224, 335–351. [Google Scholar] [CrossRef]
  14. Burton, R.A. Effects of Two-Dimensional, Sinusoidal Roughness on the Load Support Characteristics of a Lubricant Film. J. Basic Eng. 1963, 85, 258–262. [Google Scholar] [CrossRef]
  15. Zhu, D.; Jane Wang, Q. Effect of Roughness Orientation on the Elastohydrodynamic Lubrication Film Thickness. J. Tribol. 2013, 135, 031501. [Google Scholar] [CrossRef]
  16. Zhu, D.; Hu, Y. The study of transition from full film elastohydrodynamic to mixed and boundary lubrication. In Proceedings of the 1999 STLE/ASME H.S. Cheng Tribology Surveillance, New York, NY, USA, 10 October 1999; pp. 150–156. [Google Scholar]
  17. Simon, V.V. Improved mixed elastohydrodynamic lubrication of hypoid gears by the optimization of manufacture parameters. Wear 2019, 438–445. [Google Scholar] [CrossRef]
  18. Simon, V. Elastohydrodynamic Lubrication of Hypoid Gears. J. Mech. Des. 1981, 103, 195–203. [Google Scholar] [CrossRef]
  19. Deolalikar, N.; Sadeghi, F.; Marble, S. Numerical Modeling of Mixed Lubrication and Flash Temperature in EHL Elliptical Contacts. J. Tribol. 2008, 130, 011004. [Google Scholar] [CrossRef]
  20. Jiang, X.; Hua, D.Y.; Cheng, H.S.; Ai, X.; Lee, S.C. A Mixed Elastohydrodynamic Lubrication Model With Asperity Contact. J. Tribol. 1999, 121, 481–491. [Google Scholar] [CrossRef]
  21. Zhang, S.; Zhang, C. A New Deterministic Model for Mixed Lubricated Point Contact With High Accuracy. J. Tribol. 2021, 143, 102201. [Google Scholar] [CrossRef]
  22. Lubrecht, A.A.; ten Napel, W.E.; Bosma, R. Multigrid, An Alternative Method for Calculating Film Thickness and Pressure Profiles in Elastohydrodynamically Lubricated Line Contacts. J. Tribol. 1986, 108, 551–556. [Google Scholar] [CrossRef]
  23. Venner, C.H. Multilevel Methods in Lubrication; Elsevier: Amsterdam, The Netherlands, 2000; Volume 37, p. 400. [Google Scholar]
  24. Liu, Y.C.; Wang, Q.J.; Wang, W.Z.; Hu, Y.Z.; Zhu, D. Effects of differential scheme and mesh density on EHL film thickness in point contacts. J. Tribol. 2006, 128, 641–653. [Google Scholar] [CrossRef]
  25. Wang, Y.C.; Dorgham, A.; Liu, Y.; Wang, C.; Wilson, M.C.T.; Neville, A.; Azam, A. An Assessment of Quantitative Predictions of Deterministic Mixed Lubrication Solvers. J. Tribol. 2021, 143, 011601. [Google Scholar] [CrossRef]
  26. Meng, Y.; Xu, J.; Ma, L.; Jin, Z.; Prakash, B.; Ma, T.; Wang, W.J.F. A review of advances in tribology in 2020–2021. Friction 2022, 10, 1443–1595. [Google Scholar] [CrossRef]
  27. Singh, K.; Sadeghi, F.; Russell, T.; Lorenz, S.J.; Peterson, W.; Villarreal, J.; Jinmon, T. Fluid–Structure Interaction Modeling of Elastohydrodynamically Lubricated Line Contacts. J. Tribol. 2021, 143, 091602. [Google Scholar] [CrossRef]
  28. Patel, R.; Khan, Z.A.; Saeed, A.; Bakolas, V. CFD Investigation of Reynolds Flow around a Solid Obstacle. Lubricants 2022, 10, 150. [Google Scholar] [CrossRef]
  29. Hajishafiee, A.; Kadiric, A.; Ioannides, E.; Dini, D. A coupled finite-volume CFD solver for two-dimensional elasto-hydrodynamic lubrication problems with particular application to rolling element bearings. Tribol. Int. 2016, 109, 258–273. [Google Scholar] [CrossRef]
  30. Safety Data Sheet According to 1907/2006/EC, Article 31; Lubricating Oil ISO VG 46; Alfa Laval Corporate AB: Lund, Sweden, 4 June 2015.
  31. Liu, S.; Qiu, L.; Wang, Z.; Chen, X. Influences of Iteration Details on Flow Continuities of Numerical Solutions to Isothermal Elastohydrodynamic Lubrication With Micro-Cavitations. J. Tribol. 2021, 143, 101601. [Google Scholar] [CrossRef]
  32. ANSYS FLUENT 12; ANSYS Fluent User Manual; 4.12.4 Enhanced Wall Treatment. Available online: https://www.afs.enea.it/project/neptunius/docs/fluent/html/th/node101.htm (accessed on 1 November 2022).
Figure 1. Magnified view of roughness features representing Mixed Lubrication.
Lubricants 11 00233 g001
Figure 2. A 2D fluid–solid contact interface.
Lubricants 11 00233 g002
Figure 3. Shows the film thickness used for the solution of the Reynolds equation using LCICs boundary conditions.
Lubricants 11 00233 g003
Figure 4. Shows the dimensionless pressure calculated using Gauss–Seidel relaxation on a single level for 2000 iterations, where K = 1, length = 30 mm, width = 30 mm, inlet height = 1 mm, outlet height = 0.4 mm, side of square = 8 mm, and diameter of the circle = 8 mm.
Lubricants 11 00233 g004
Figure 5. Pressure comparison for simple wedge model.
Lubricants 11 00233 g005
Figure 6. Pressure contour plots were created using (a) the FDM method and (b) the CFD method.
Lubricants 11 00233 g006
Figure 7. Results for one cylindrical asperity. (a) Mesh sensitivity analysis of FDM (K = 0.1). (b) Mesh sensitivity analysis for CFD model of one cylindrical asperity. (c) Comparison of FDM (level 8) and CFD results.
Lubricants 11 00233 g007
Figure 8. Pressure contour plots were created using (a) the FDM method and (b) the CFD method.
Lubricants 11 00233 g008
Figure 9. Results for two cylindrical asperities. (a) Mesh sensitivity analysis of FDM (K = 0.1). (b) Mesh sensitivity analysis for CFD model of two cylindrical asperities. (c) Comparison of FDM (level 8) and CFD results.
Lubricants 11 00233 g009
Figure 10. Pressure contour plots were created using (a) the FDM method and (b) the CFD method.
Lubricants 11 00233 g010
Figure 11. Results for three cylindrical asperities. (a) Mesh sensitivity analysis of FDM (K = 0.1). (b) Mesh sensitivity analysis for CFD model of three cylindrical asperities. (c) Comparison of FDM (level 8) and CFD results.
Lubricants 11 00233 g011
Figure 12. A pressure contour plot comparison has been produced using (a) the FDM and (b) the CFD method for three cylindrical asperities’ contacts.
Lubricants 11 00233 g012
Figure 13. 3D CFD model of the simple wedge with five cylindrical asperities.
Lubricants 11 00233 g013
Figure 14. Results for five cylindrical asperities. (a) Mesh sensitivity analysis of FDM (K = 0.1). (b) Mesh sensitivity analysis for CFD model of five cylindrical asperities. (c) Comparison of FDM (level 8) and CFD results.
Lubricants 11 00233 g014
Figure 15. A pressure contour plot comparison has been produced using (a) the FDM and (b) the CFD methods for five cylindrical asperities’ contacts.
Lubricants 11 00233 g015
Table 1. The below table shows the parameters used in the CFD model.
ParametersValueUnit
Velocity, u1m/s
Inlet height, h i 1010−6 m
Outlet height, h o 610−6 m
Solid Properties
Solid Elastic Modulus210G Pa
Solid Poisson’s Ratio0.3-
Solid Density 7850kg/m3
Lubricant Properties
Viscosity of the lubricant, η0.085Pa∙s
Kinematic viscosity, ν100mm2/s
Reynolds number, Re0.1 or less-
Oil density ρ 850kg/m3
Vapor density0.0288kg/m3
Vapor viscosity8.97 × 10−6Pa∙s
Disclaimer/Publisher’s Note: The statements, opinions and data contained in all publications are solely those of the individual author(s) and contributor(s) and not of MDPI and/or the editor(s). MDPI and/or the editor(s) disclaim responsibility for any injury to people or property resulting from any ideas, methods, instructions or products referred to in the content.