Article

A Parametric Study on the Effect of FSW Parameters and the Tool Geometry on the Tensile Strength of AA2024–AA7075 Joints: Microstructure and Fracture

by
Reza Beygi
1,2,*,
Majid Zarezadeh Mehrizi
1,
Alireza Akhavan-Safar
2,*,
Sajjad Mohammadi
1 and
Lucas F. M. da Silva
3
1
Department of Materials Engineering and Metallurgy, Faculty of Engineering, Arak University, Arak 38156-8-8349, Iran
2
Institute of Science and Innovation in Mechanical and Industrial Engineering (INEGI), Rua Dr. Roberto Frias, 4200-465 Porto, Portugal
3
Department of Mechanical Engineering, Faculty of Engineering of the University of Porto, Rua Dr. Roberto Frias, 4200-465 Porto, Portugal
*
Authors to whom correspondence should be addressed.
Lubricants 2023, 11(2), 59; https://doi.org/10.3390/lubricants11020059
Submission received: 28 December 2022 / Revised: 26 January 2023 / Accepted: 30 January 2023 / Published: 31 January 2023
(This article belongs to the Special Issue Friction Stir Welding and Processing of Alloys)

Abstract

:
Friction stir welding (FSW) is a process by which a joint can be made in a solid state. The complexity of the process due to metallurgical phenomena necessitates the use of models with the ability to accurately correlate the process parameters with the joint properties. In the present study, a multilayer perceptron (MLP) artificial neural network (ANN) was used to model and predict the ultimate tensile strength (UTS) of the joint between the AA2024 and AA7075 aluminum alloys. Three pin geometries, pyramidal, conical, and cylindrical, were used for welding. The rotation speed varied between 800 and 1200 rpm and the welding speed varied between 10 and 50 mm/min. The obtained ANN model was used in a simulated annealing algorithm (SA algorithm) to optimize the process to attain the maximum UTS. The SA algorithm yielded the cylindrical pin and rotational speed of 1110 rpm to achieve the maximum UTS (395 MPa), which agreed well with the experiment. Tensile testing and scanning electron microscopy (SEM) were used to assess the joint strength and the microstructure of the joints, respectively. Various defects were detected in the joints, such as a root kissing bond and unconsolidated banding structures, whose formations were dependent on the tool geometry and the rotation speed.

1. Introduction

Friction stir welding (FSW) is a solid-state joining process in which two materials are stirred by a rotating tool in the abutting surfaces of two metals [1]. This process has the advantage of welding different materials that cannot be welded using fusion welding processes such as AA2024 and AA7075 aluminum alloys [2,3]. These alloys are widely used in the aerospace industries. The quality of the weld seam is determined by several parameters such as tool speed, travel speed, and tool geometry [4]. Understanding the effect of each individual parameter as well as the combination of the parameters on the weld seam quality can help to optimize the process regarding the weld seam quality [5]. This requires a thorough analysis of the microstructure and the effect of the process on the microstructure [6].
The artificial neural network (ANN) is an alternative method that can analyze materials processing without having to know the complex physical phenomena that are present during the process [7,8,9]. In the FSW process, the joint properties of the weld are largely influenced by the material flow during welding, which, in turn, depends on the welding parameters and tool design [10,11]. The tool geometry influences the grain size, hardness, and wear of the tool [12]. Several attempts have been made to model the FSW. Babu et al. [13] modeled the mechanical properties of AA2024 welds using ANN. They used welding speed and rotation speed as the input parameters and found a precise prediction of the mechanical properties by ANN. Orazio [14] used ANN to predict axial force during the welding of AZ31 magnesium alloy. They used processing time and rotational speed as the input parameters and obtained an accurate prediction of vertical force. Tansel et al. [15] used ANN to model the mechanical properties of AA1080 weld and then applied a genetic algorithm to optimize the process. Dehabadi et al. [16] used ANN to predict hardness values of the weld zone using tilt angle, thread, and distance from the weld as input data. They also investigated different tool geometries by using separate ANNs for each tool profile. Palanivel et al. [17] employed different tool profiles as input parameters in a single ANN and predicted the mechanical properties of the joint between AA6351 and AA5083. However, they did not use the pin characteristics as input values but instead used coded numbers as representatives of the tool profile. Shojaeefard et al. [18] investigated the effect of tool dimensions on the thermal distribution around the weld region by using ANN. Manvatkar et al. [19] used the shoulder and pin diameter of the tool as the input parameters in ANN to predict the peak temperature, torque, traverse force, and bending stress during FSW of the AA7075 alloy and obtained an accurate model.
The modeling of a process offers the possibility to use optimization methods to achieve the optimal output. The optimized condition gives the most reliable weld which can be considered for further processing, as was previously performed in deep drawing of the welded sheets [20]. Simulated annealing (SA) is an optimization algorithm that is inspired by the slow cooling and annealing of metals. Sudhakaran [21] used ANN and SA to model and optimize the depth of penetration in TIG welding of stainless steel. Padmanaban [22] used SA to optimize the UTS of friction stir welded AA2024-AA7075 joints by using the welding speed and the rotation speed as the input parameters. Joseph et al. [23] used SA to optimize the UTS and elongation of the steel joint made by pulsed TIG welding. Torabi et al. [24] used the SA algorithm to optimize the UTS of laser-welded stainless steel sheets.
The most important deficiency of ANN models is their inability to explain the physical phenomena during the processes. In the present study, the aim was not only to model the process by ANN but also to investigate the physical phenomena that occur during the process to support the ANN model. Although the FSW parameters have been used in the ANN model, there are only a few studies which consider the tool geometry as a parameter for the ANN modeling. This may be due to the difficulty in quantifying the tool geometry. In the present study, an attempt is made to select the most appropriate feature of the tool that is quantifiable. The objective of the present study is to model the FSW of AA2024-AA7075 with ANN and then to use this model as an input function in SA to optimize the process. Tool geometry is a determinant factor in weld quality. As outlined in the previous paragraph, ANN can be used to model the FSW to understand the effect of welding parameters such as tool geometry. However, the quantification of the FSW tool to be used as a meaningful variable in the ANN is not yet explored. To the best of the authors’ knowledge, there have been no studies on the feature selection of the tool to be used as input data for modeling the FSW. In the present study, 3 different pin profiles were used for friction stir welding of the AA2024 to AA7075 alloys. The feature of the pins used in the ANN to model the tensile strength (UTS) was the effective volume of the pin, which represents the dynamic volume. Finally, the obtained ANN model was implemented into the SA algorithm to optimize the UTS process. A microstructural analysis by SEM and optical microscopy was used to analyze the weld quality.

2. Materials and Methods

The summary of the procedure of the present study is presented in Figure 1 as a flowchart. The details are explained in the following subsections.

2.1. Experimental Procedure

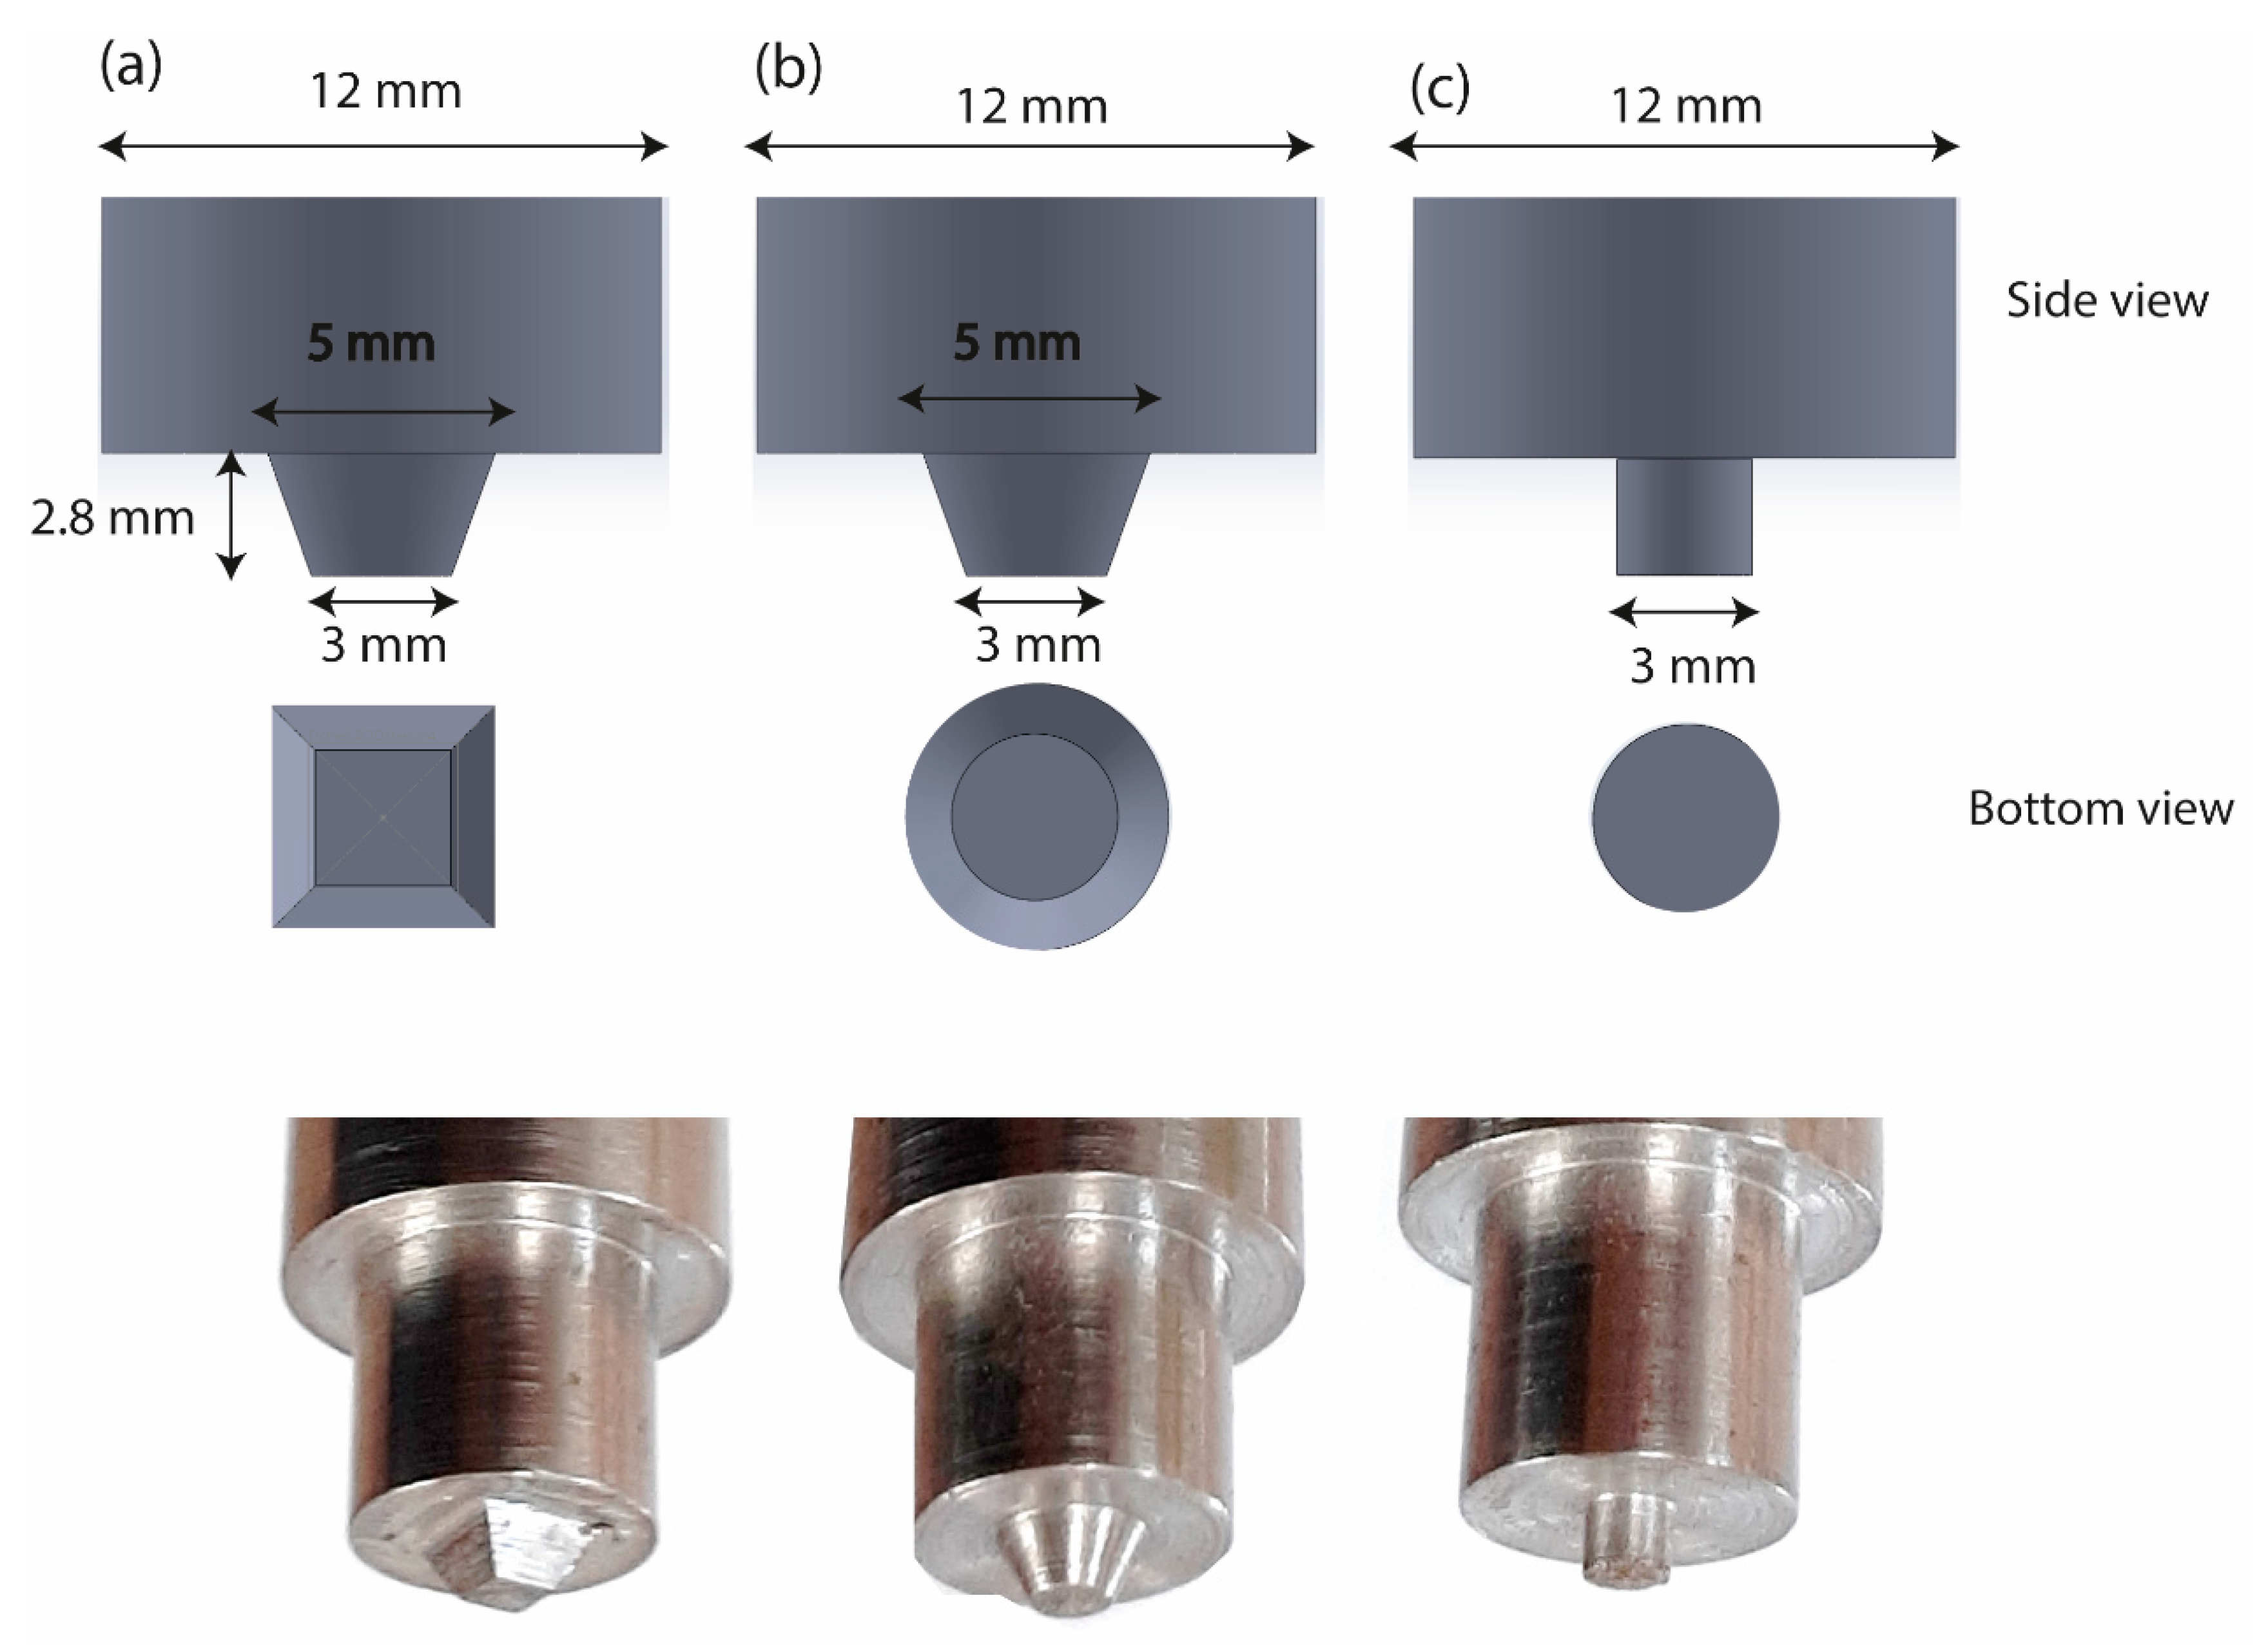
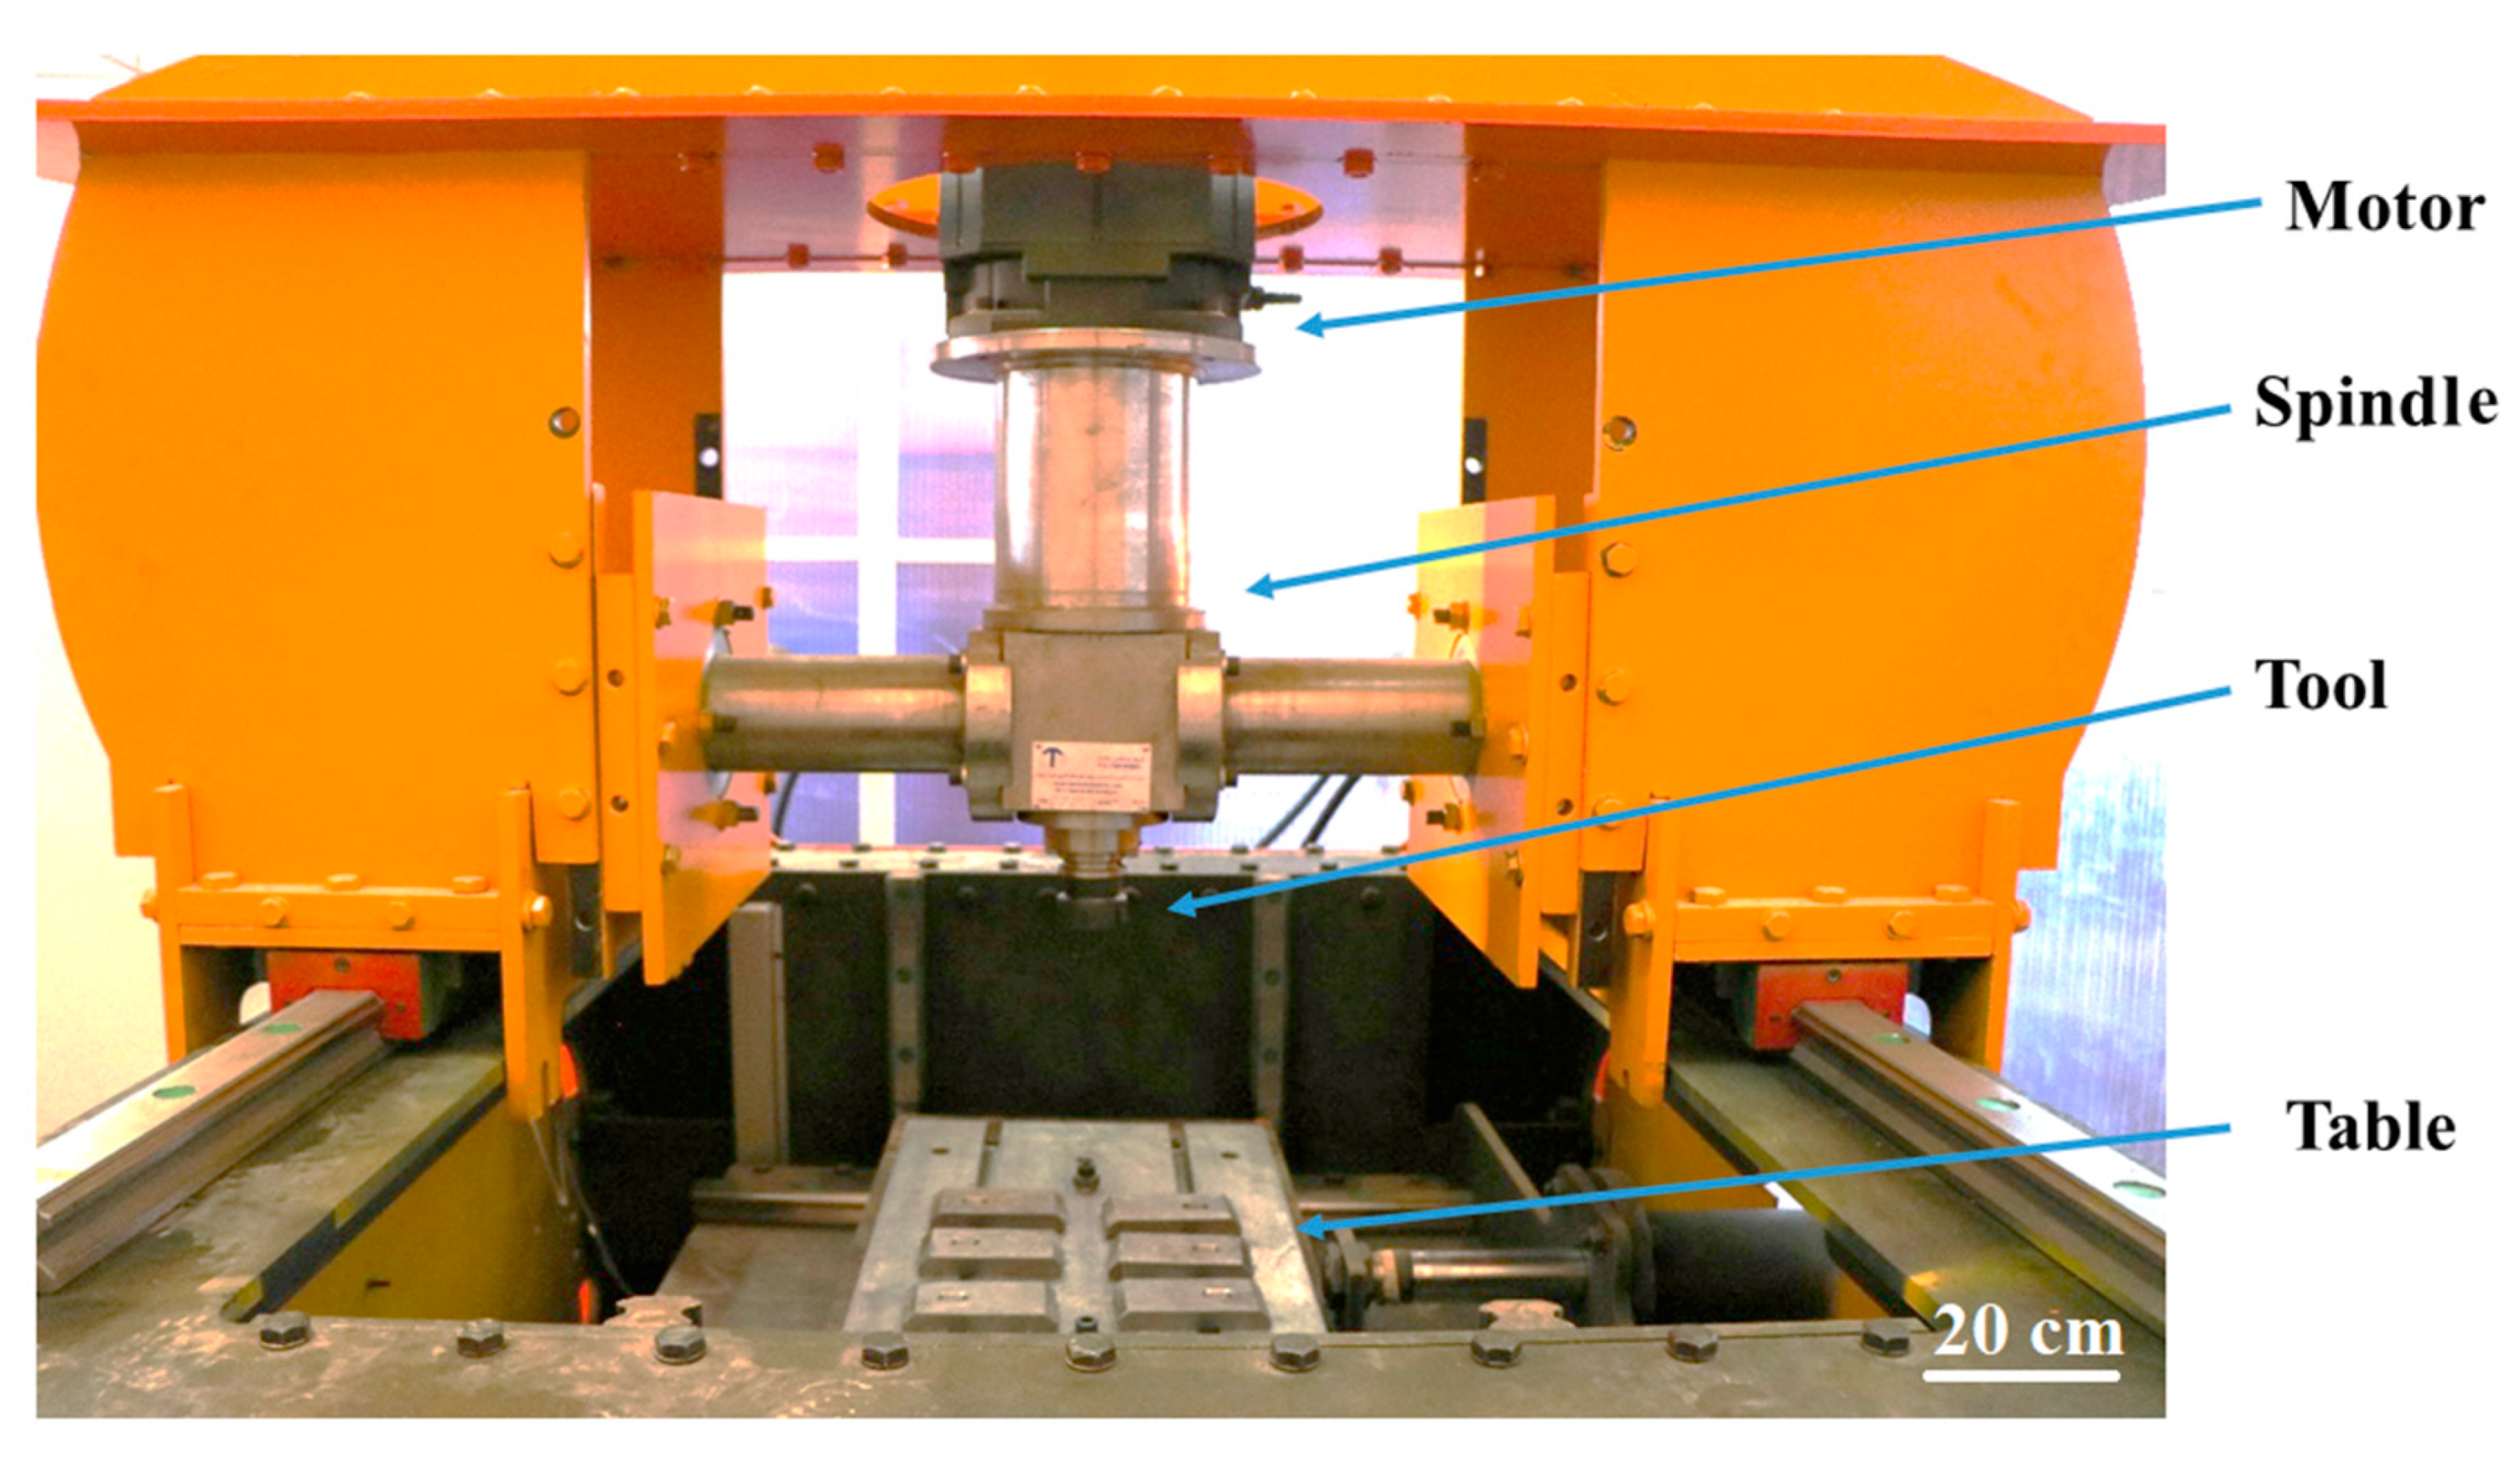
The aluminum sheets used in this study were AA2024-T3 and AA7075-T6 with a thickness of 3 mm. The chemical compositions and the ultimate tensile strength of each material are provided in Table 1. These sheets were cut to dimensions of 130 and 50 mm and clamped to the table of the friction stir welding machine. The direction of the welding was parallel to the rolling direction of both sheets. AA7075 was placed at the advancing side where the direction of rotation of the tool and the direction of travel are identical. The FSW tool was machined from H13 tool steel and was heat-treated to have a hardness value of 53 HRC. Three different pin geometries were used: pyramidal, conical, and circular (Figure 2). The welding parameters included welding speed (10, 30, and 50 mm/min) and rotation speed (800, 1000, and 1200 rpm). A central composite design was used for the design of experiments. Table 2 shows the parameters used for FSW. The FSW machine is shown in Figure 3.
After finishing the welds, tensile specimens according to ASTM E8-M were prepared transverse to the welding direction. At least 2 specimens from each experiment were tested. The specimens were tested using a universal tensile testing machine at the crosshead speed of 1 mm/min. The fracture surfaces of the joints were examined by scanning electron microscopy (SEM). Back-scatter electron (BSE) SEM images were taken from the cross-section of the joints.

2.2. Artificial Neural Network Model

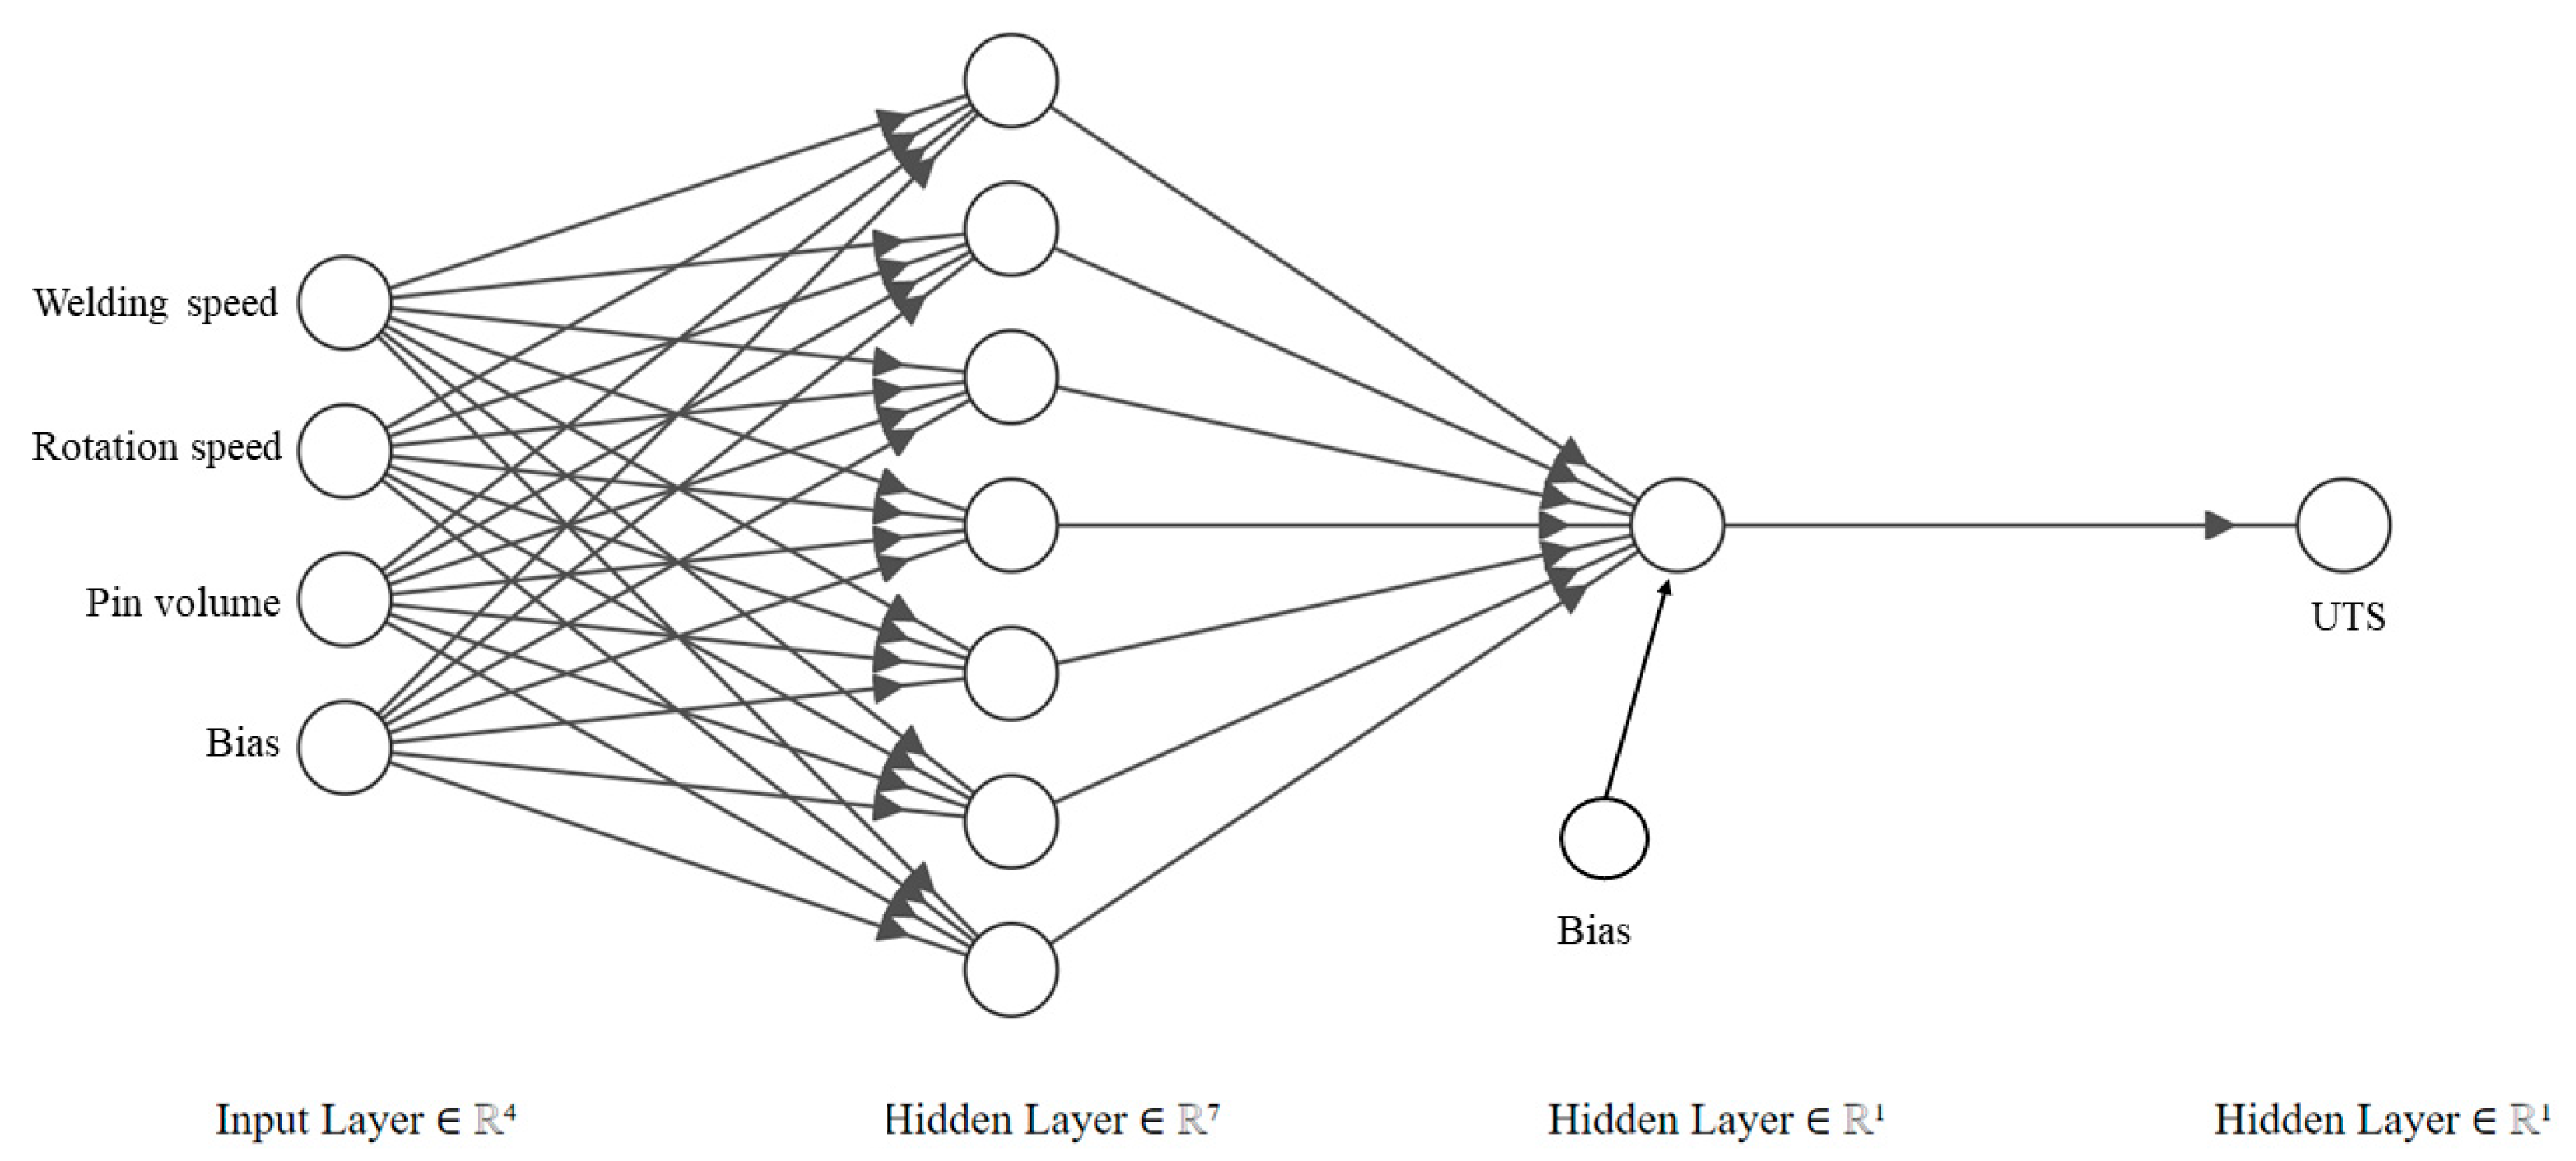
An artificial neural network can model and analyze the input and output data of a system. ANN has three kinds of layers; namely, input, hidden, and output layers. Each layer consists of some neurons. The input data are considered as the input layer and the number of neurons is equal to the number of input variables plus a bias neuron. The output layer consists of the output target which, in this study, is the UTS and only has 1 neuron. The optimum number of hidden layers and the neurons in each one were obtained by trial and error.
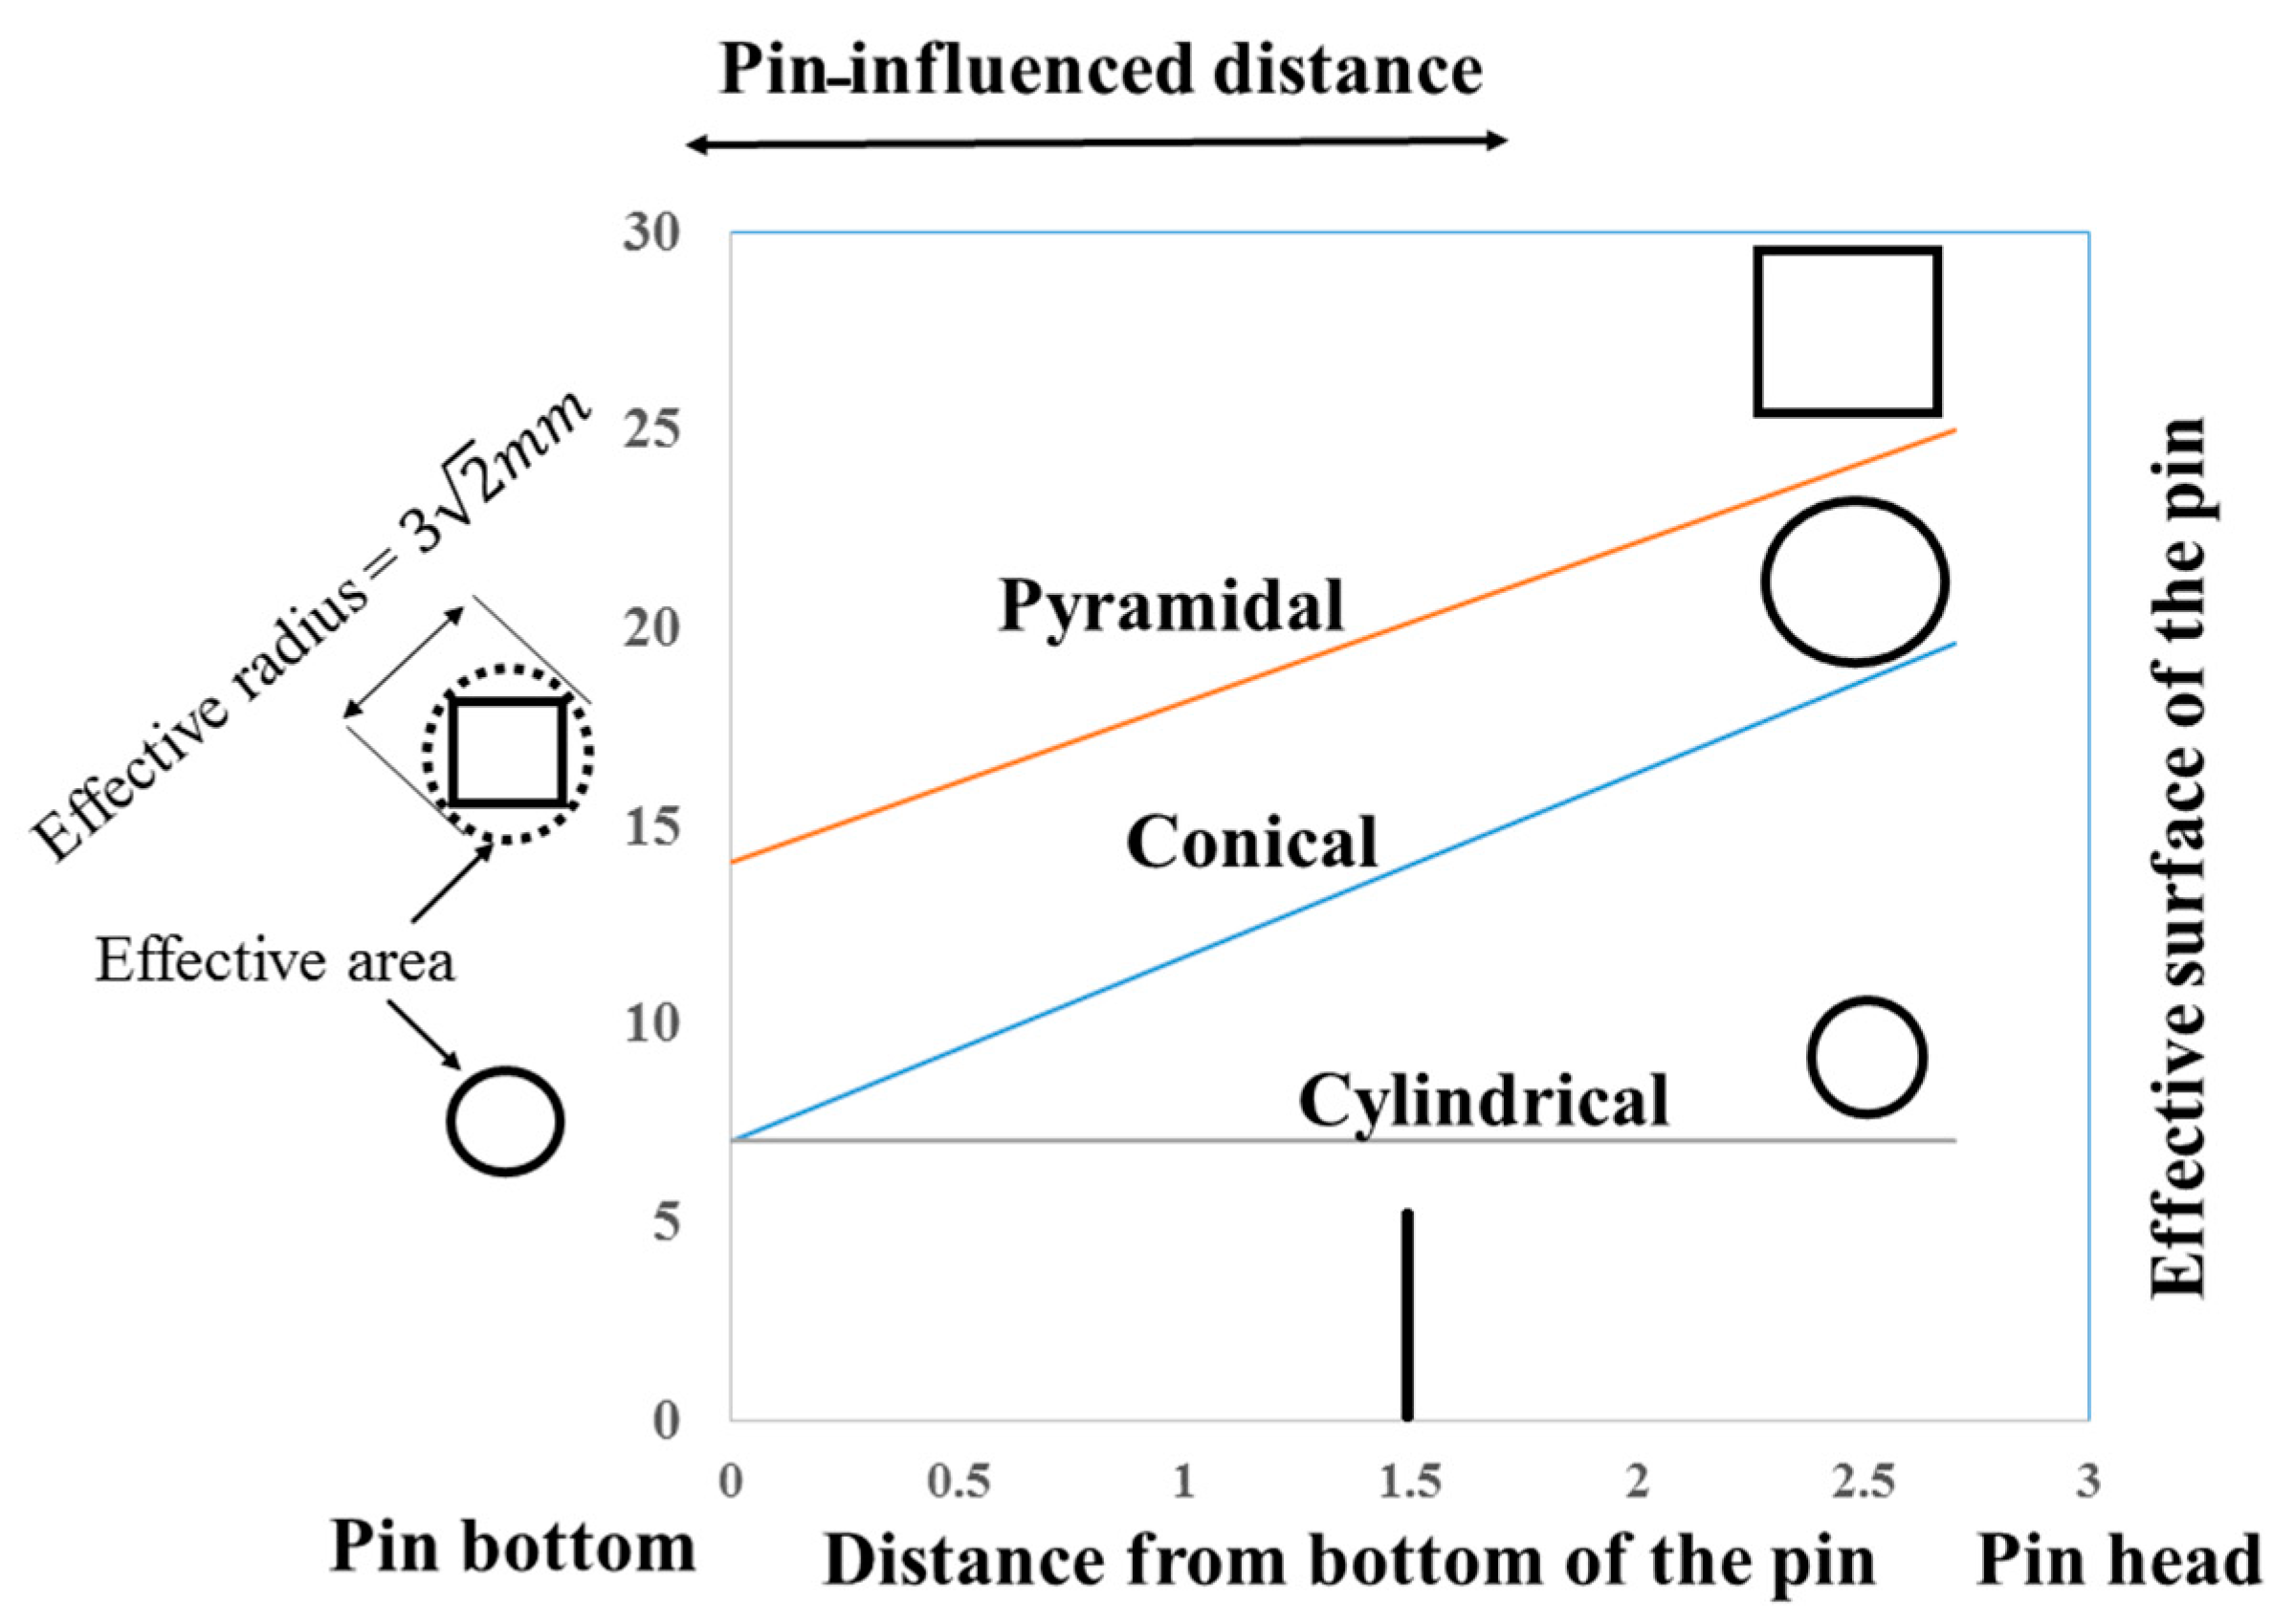
The input parameters of ANN are welding speed, rotation speed, and pin geometry. Figure 4 shows the structure of the ANN used in this study. The major challenge in the present study was the quantification of the tool geometries to be used as input data for ANN modeling. The profile of the pin determines the ratio of dynamic volume to static volume which is a vital parameter in defect formation [25]. Liu et al. [26] report that the volume of the materials swept around the pin determines the temperature during welding, which, in turn, determines the weld zone microstructure. In fact, the influencing factor is not the static volume but the dynamic volume of the pin, which corresponds to the volume of the material around the pin [27]. Therefore, the feature of the pin selected for using in ANN was the effective volume or the dynamic volume of the pin. In order to calculate the dynamic volume of the pin, the cross-section area of the pin versus the distance from the bottom of the pin is drawn and presented in Figure 5.
The dynamic volume of each pin is obtained by calculating the area under each curve. A distance of 1.5 mm from the bottom of the pin is considered the dominant region of the pin. The dynamic volume of each pin is calculated and presented in Table 3.

2.3. Simulated Annealing Algorithm

SA is a powerful tool for minimizing multivariable functions. In SA, an initial temperature is assigned to the model, and the temperature declines steadily until no change is observed in the system. At each temperature, the simulation progressed until a steady state is reached. SA is capable of finding the global minima. The details on the structure of the SA algorithm can be found in Sudhakaran et al. [21].
In the present study, the initial temperature was set to 100 °C and a fast annealing was used for the annealing function. The limit range of the variables was specified for the model. A code is written in MATLAB software to implement the neural network model as a function into the SA algorithm. Since the SA algorithm determines the global minima, the minus of the ANN has been defined as the input function for the SA algorithm.

3. Results and Discussion

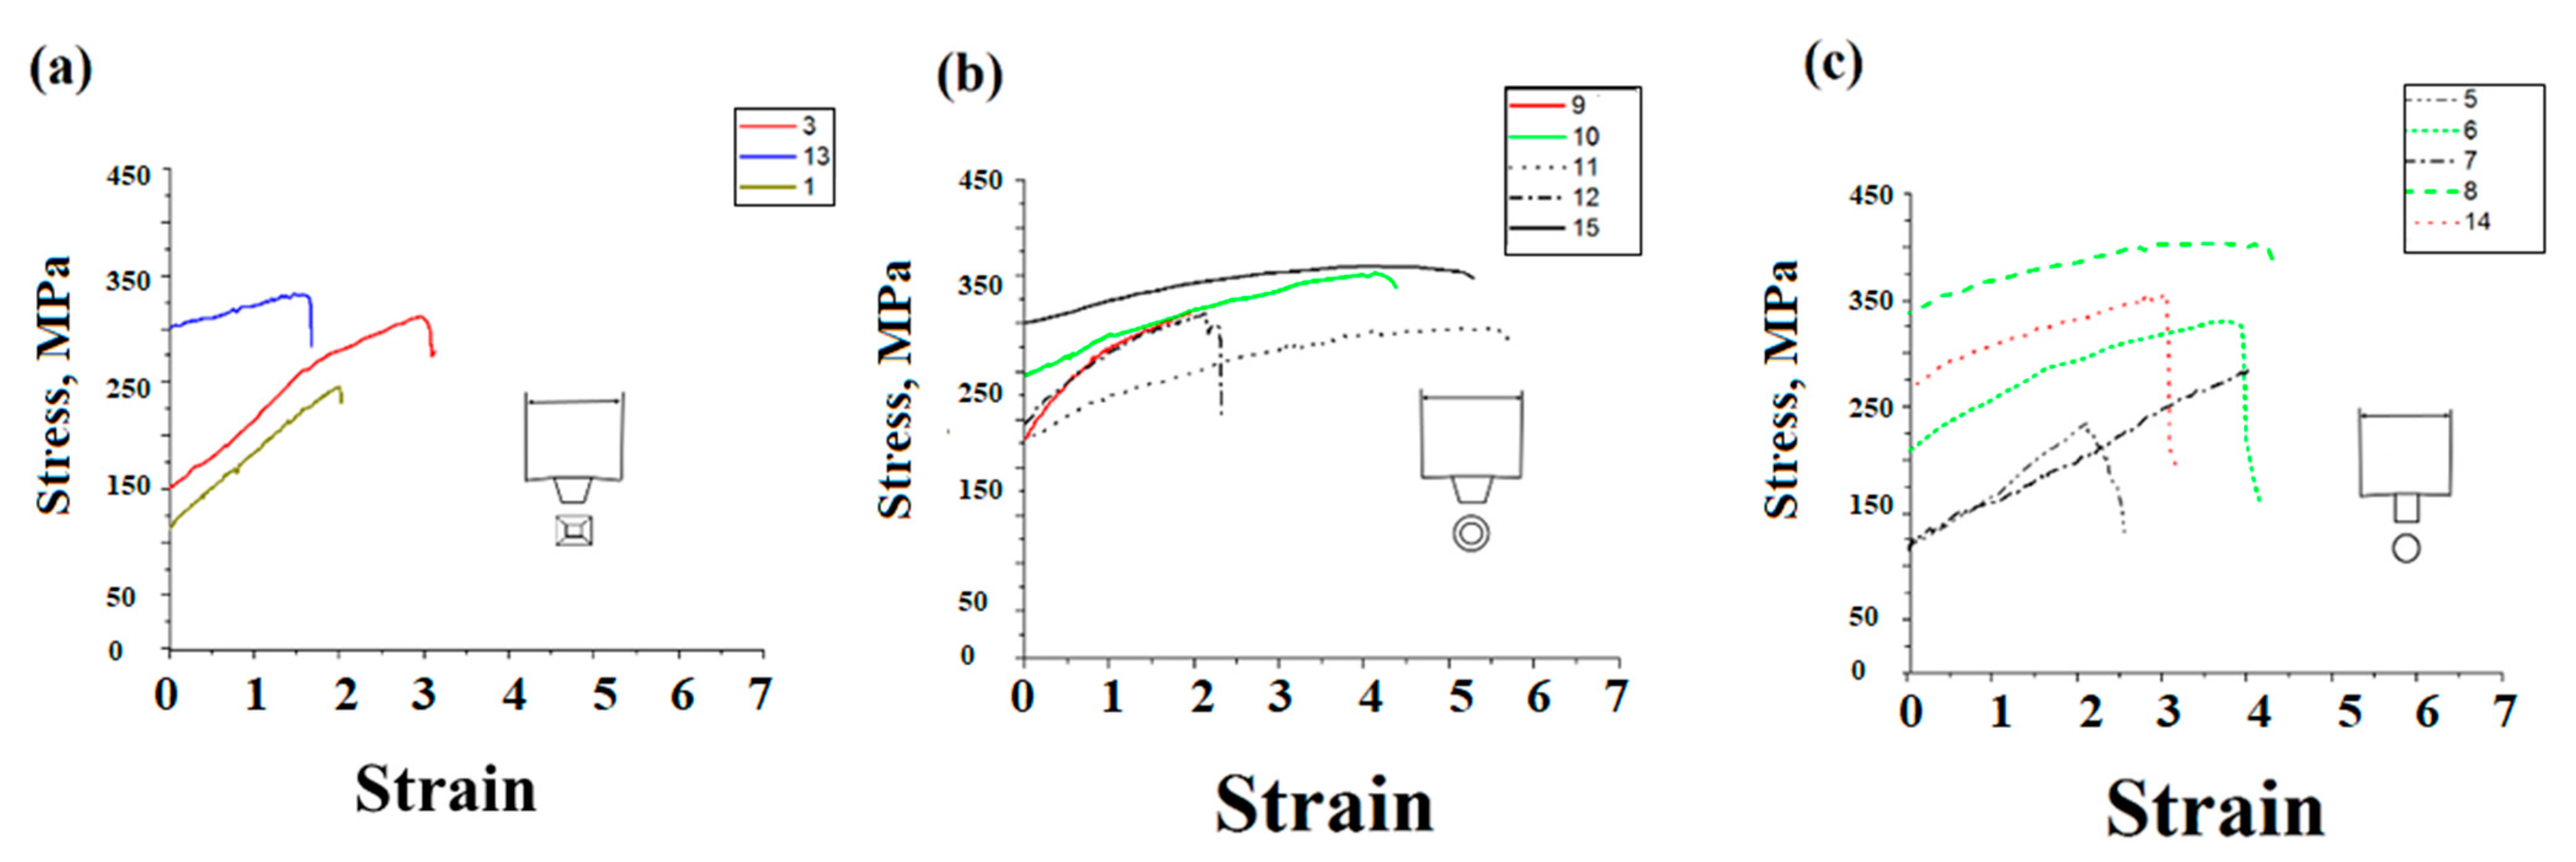
Figure 6 shows the stress-strain curves of the joints. Table 4 represents the yield strength (YS), UTS, and elongation of each experiment. The type of defect in the welds is also identified in the last column. For modeling the data by ANN, experiments 1–10, 11, 12, and 13–15 were chosen as the training, the validation, and the test data, respectively.
The ANN coding was performed by the MATLAB neural network toolbox. The target value was the UTS, as the purpose was to optimize the UTS. To obtain the optimum structure of ANN, some preliminary trials and errors were conducted using various transfer functions (log-sigmoid, hyperbolic tangent sigmoid, linear), various numbers of hidden layers, and various numbers of neurons. The performance of each design was estimated by calculating the root mean square error (RMSE) of the test series. The RMSE is obtained by the following equation:
R M S E = 1 N 1 N t i o i 2
where N is the number of data, t i is the target value of experiment i , and o i is the predicted output value of experiment i . A minimum RMSE value of 0.1 was considered an acceptable value for evaluating the model. This minimum RMSE was obtained when using a log-sigmoid transfer function for the hidden layer and a linear function for the output layer. The optimum number of neurons in the hidden layer was 7 neurons. The training function was Levenberg–Marquardt. Figure 7 shows the output values of the model versus the target values for training, validation, and test data. In almost all the runs, the highest error in the prediction of the UTS corresponded to the pyramidal pin.
The optimum parameters and the resultant UTS obtained by the SA algorithm are provided in Table 5. The error (e%) is calculated according to:
e % = P r e d i c t e d   U T S E x p e r i m e n t a l   U T S E x p e r i m e n t a l   U T S × 100
The optimum effective volume corresponds to the cylindrical pin which possesses the lowest effective volume. The predicted UTS using the optimum values was 420 MPa, which is close to the one obtained by the experiment (395 MPa) with a relative error of 6.4%.
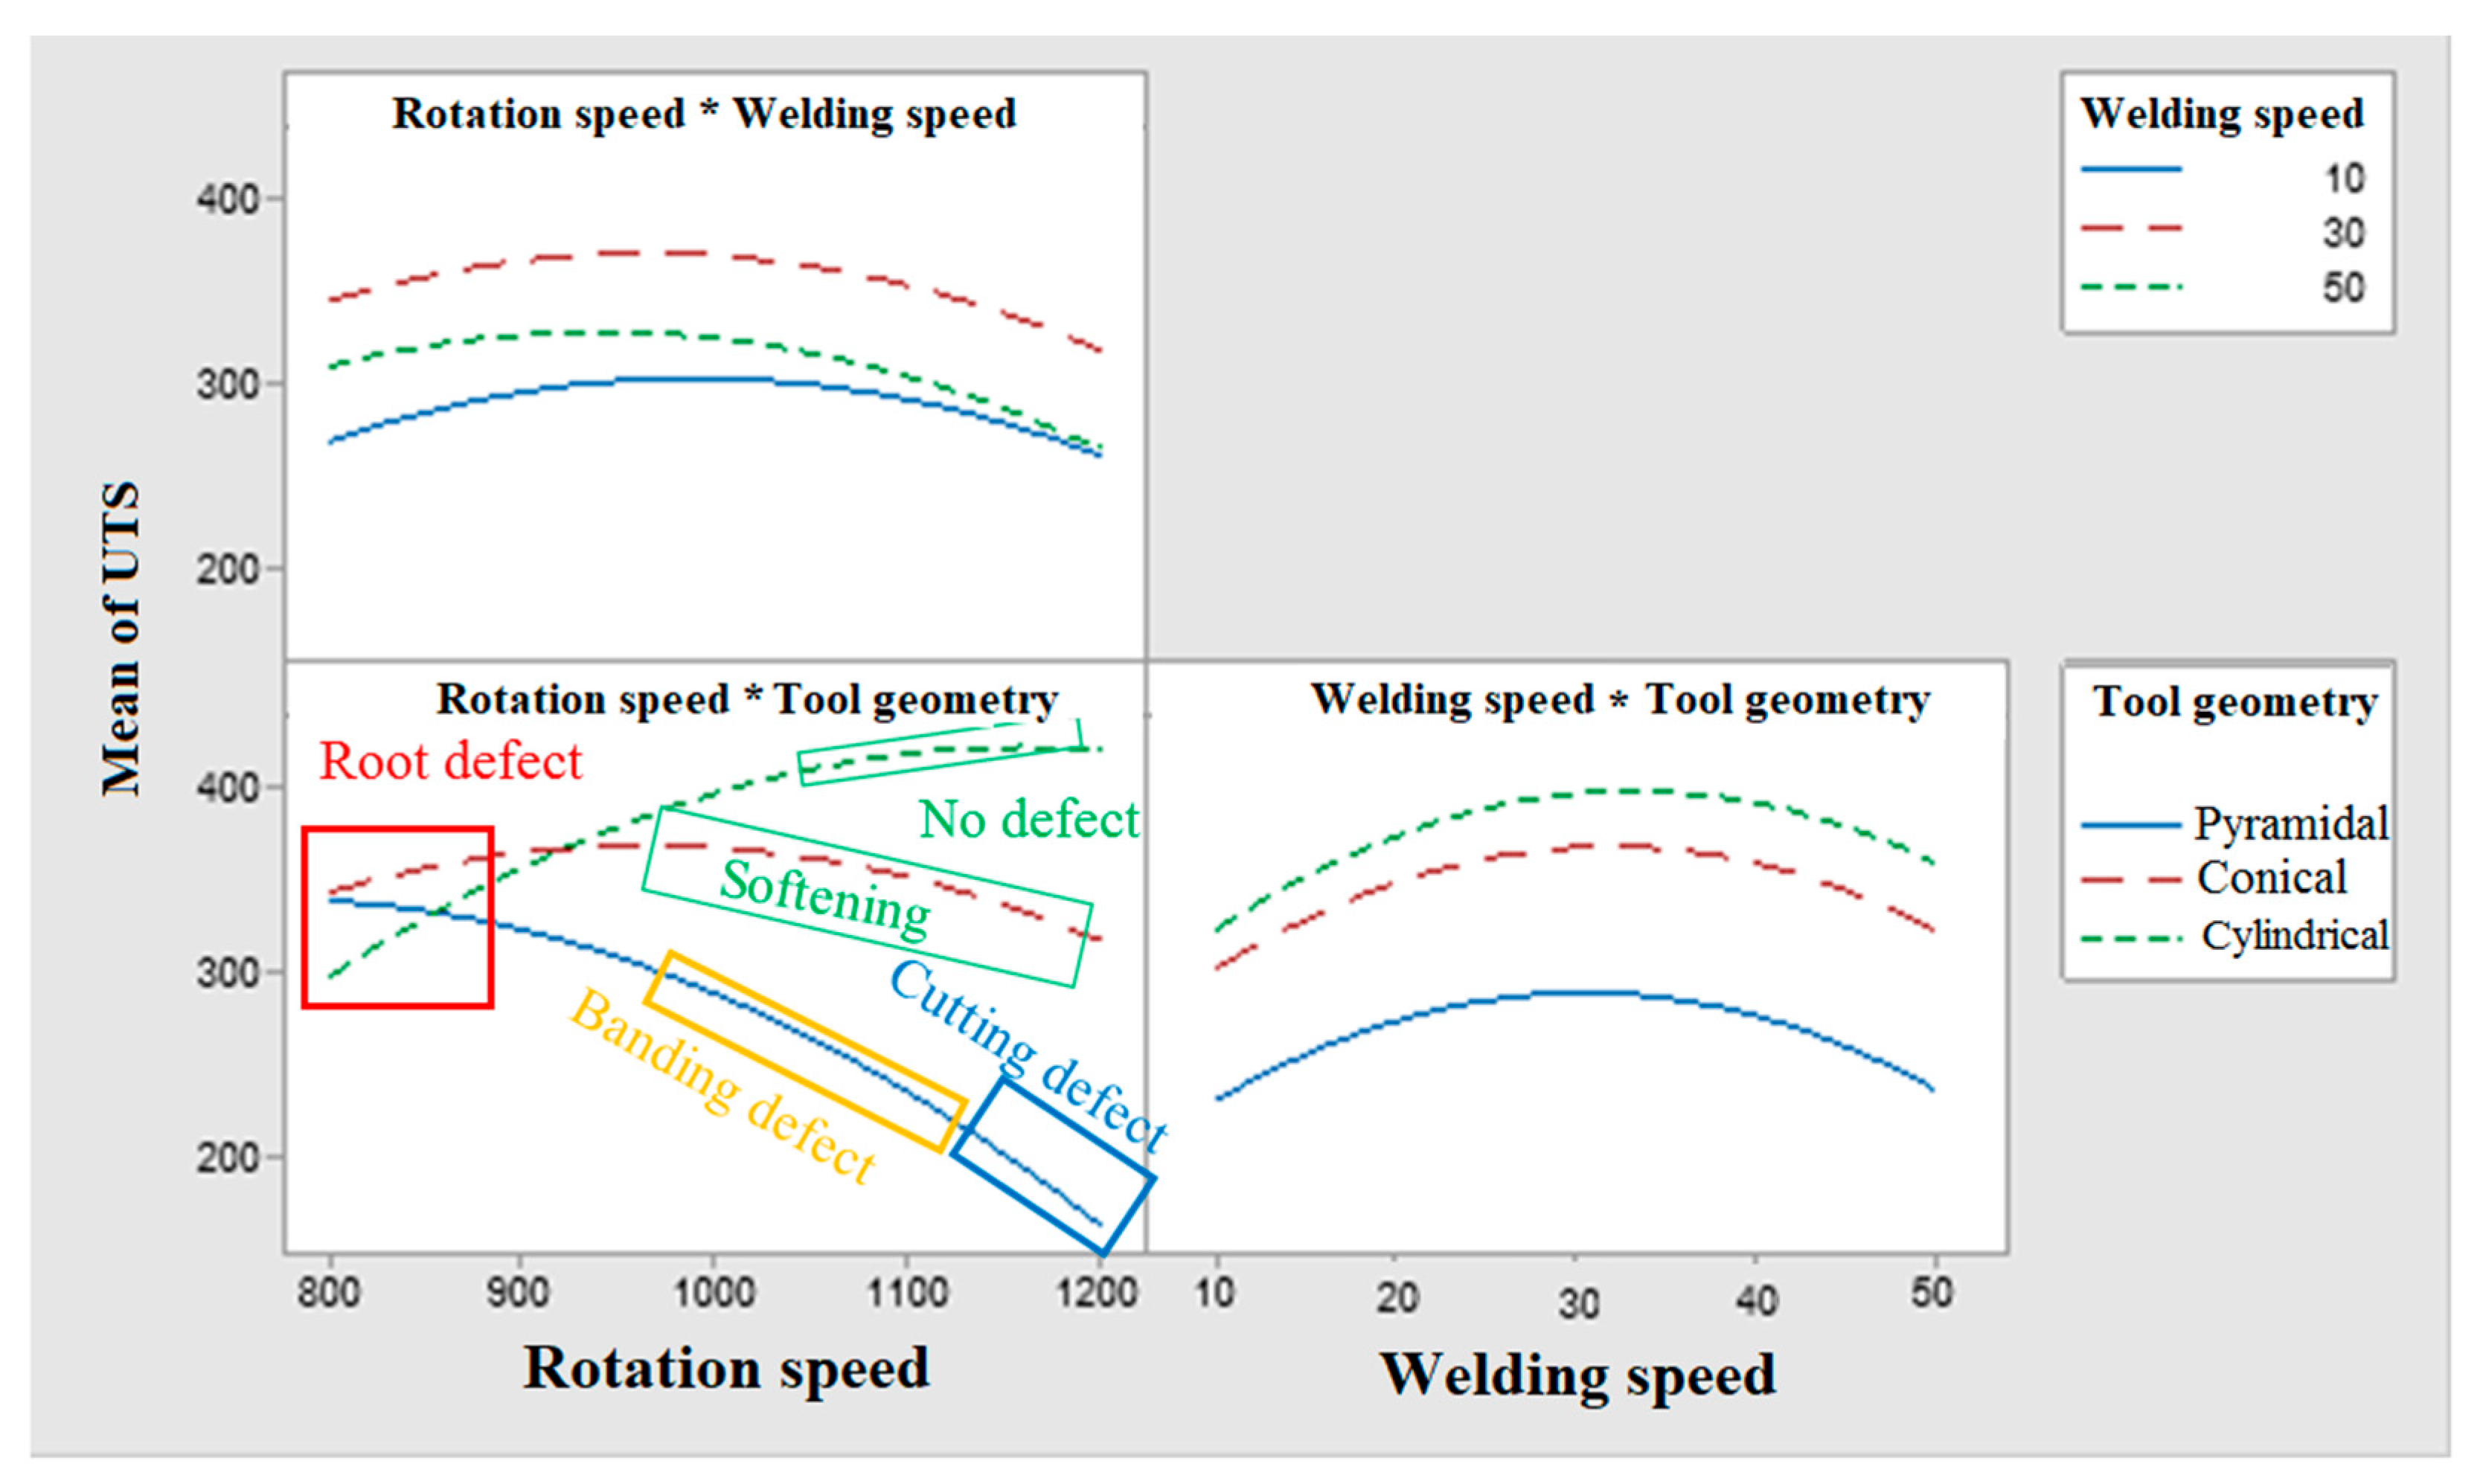
The interaction plot for the UTS calculated by Minitab® software is shown in Figure 8. The interaction between the rotation speed and the tool geometry is the highest among all the others. As can be observed, by increasing the effective volume of the pin, the UTS is decreased. In the case of the pyramidal pin, as it has sharp edges, the materials around the tool tend to be cut rather than plastically deform [28]. This effect is enhanced at a higher rotation speed of the tool [29]. In this study, experiments 2 and 4 had the lowest tensile strength due to the lack of plasticization during FSW and the existence of the hole in the stir zone. At lower rotation speed, this defect disappears as the materials around the tool tend to plastically deform and flow to fill the defects. The error in predicting the tensile strength of the joints by ANN stems from the fact that the pyramidal tool behaves as a cutting tool rather than plasticizing the material at a high rotation speed.
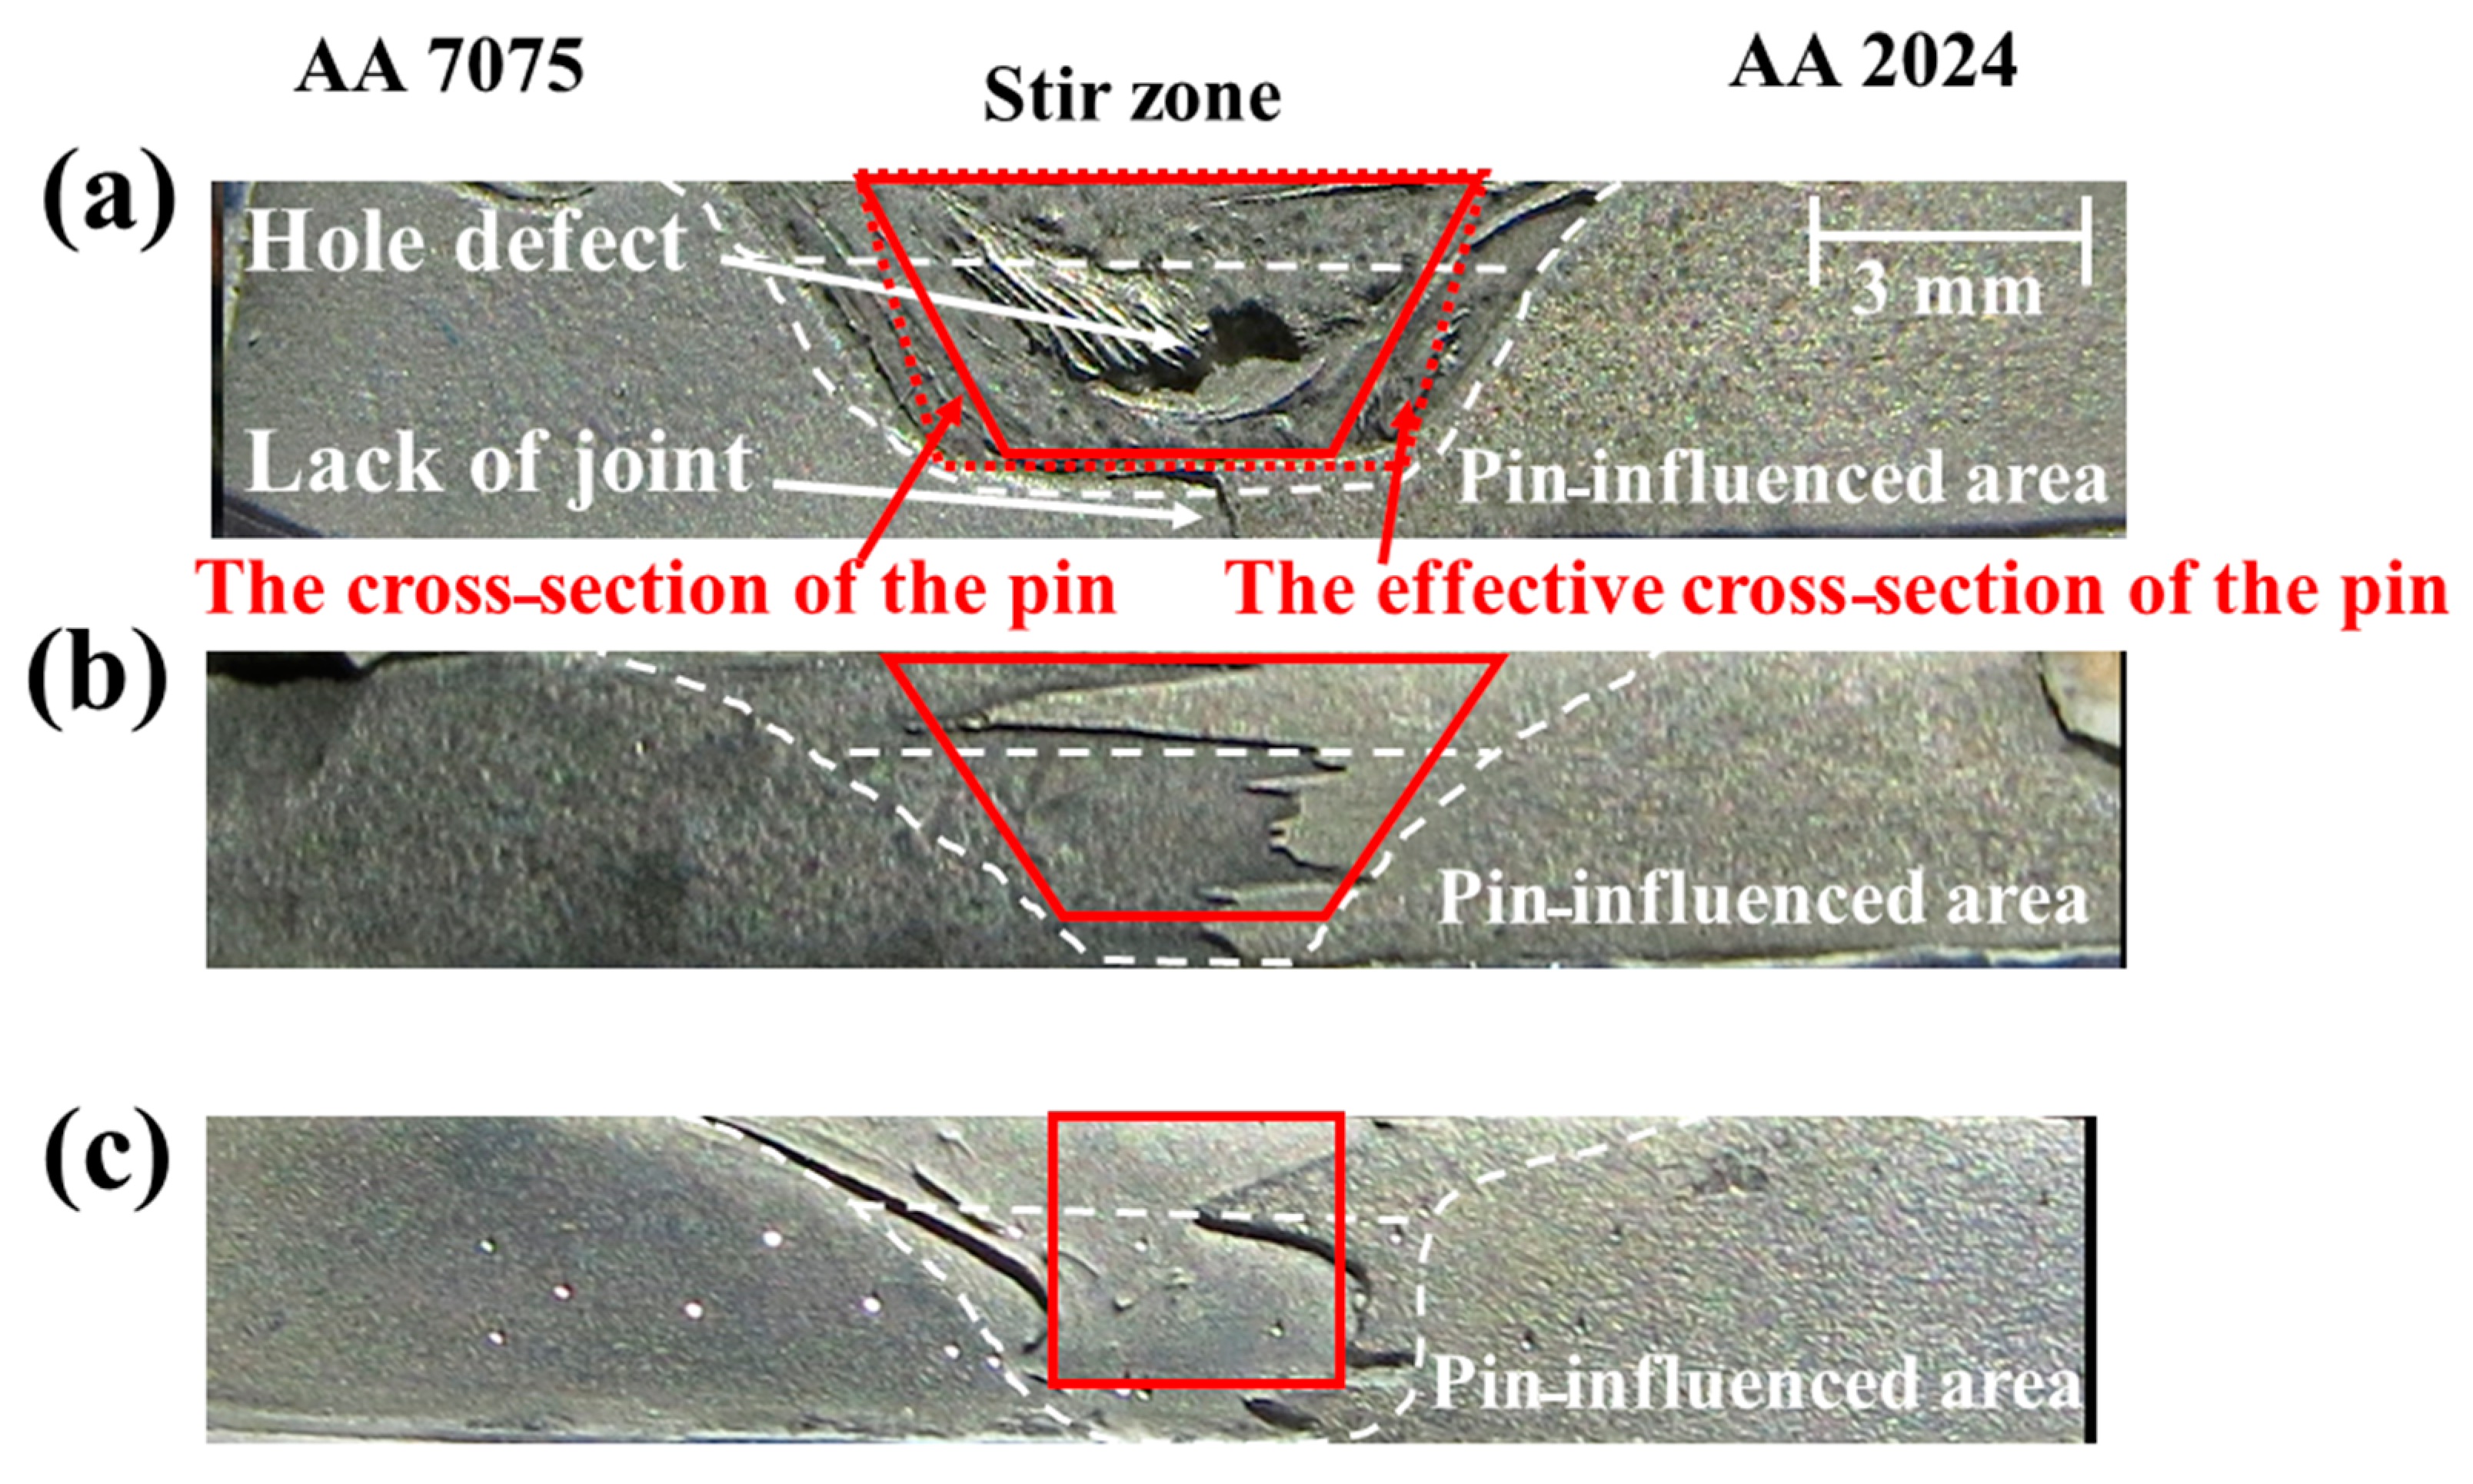
Figure 9 presents the macrographs of some of the welds which represent the general scheme of the weld macrographs obtained by three different pin geometries. The stir zone of the weld made by a pyramidal pin (Figure 9a) consists of a hole defect and the lack of a joint at the bottom of the sheet. The stir zone of the welds, consisting of pin-influenced and shoulder-influenced regions, is marked by white dashed lines. As can be observed, the pin-influenced region of the weld made by the pyramidal pin is larger than the other ones. By matching the pin profile and the pin-influenced region, it can be seen that the volume affected by the pyramidal pin in Figure 9a is much larger than the dimensions of the pin. Therefore, an effective cross-sectional area should be considered which, in this case, is a circle with a radius of r = d 2 , in which d is the edge length of the bottom cross-section of the pyramidal pin and r is the radius of the effective cross-section of the bottom of the pin. By moving from the bottom of the pin towards the shoulder, the influenced area is gradually dominated by the shoulder, and the pin-influenced region constricts to the volume of the pin. This is shown schematically in Figure 9a by a red dashed line imposed on the figure.
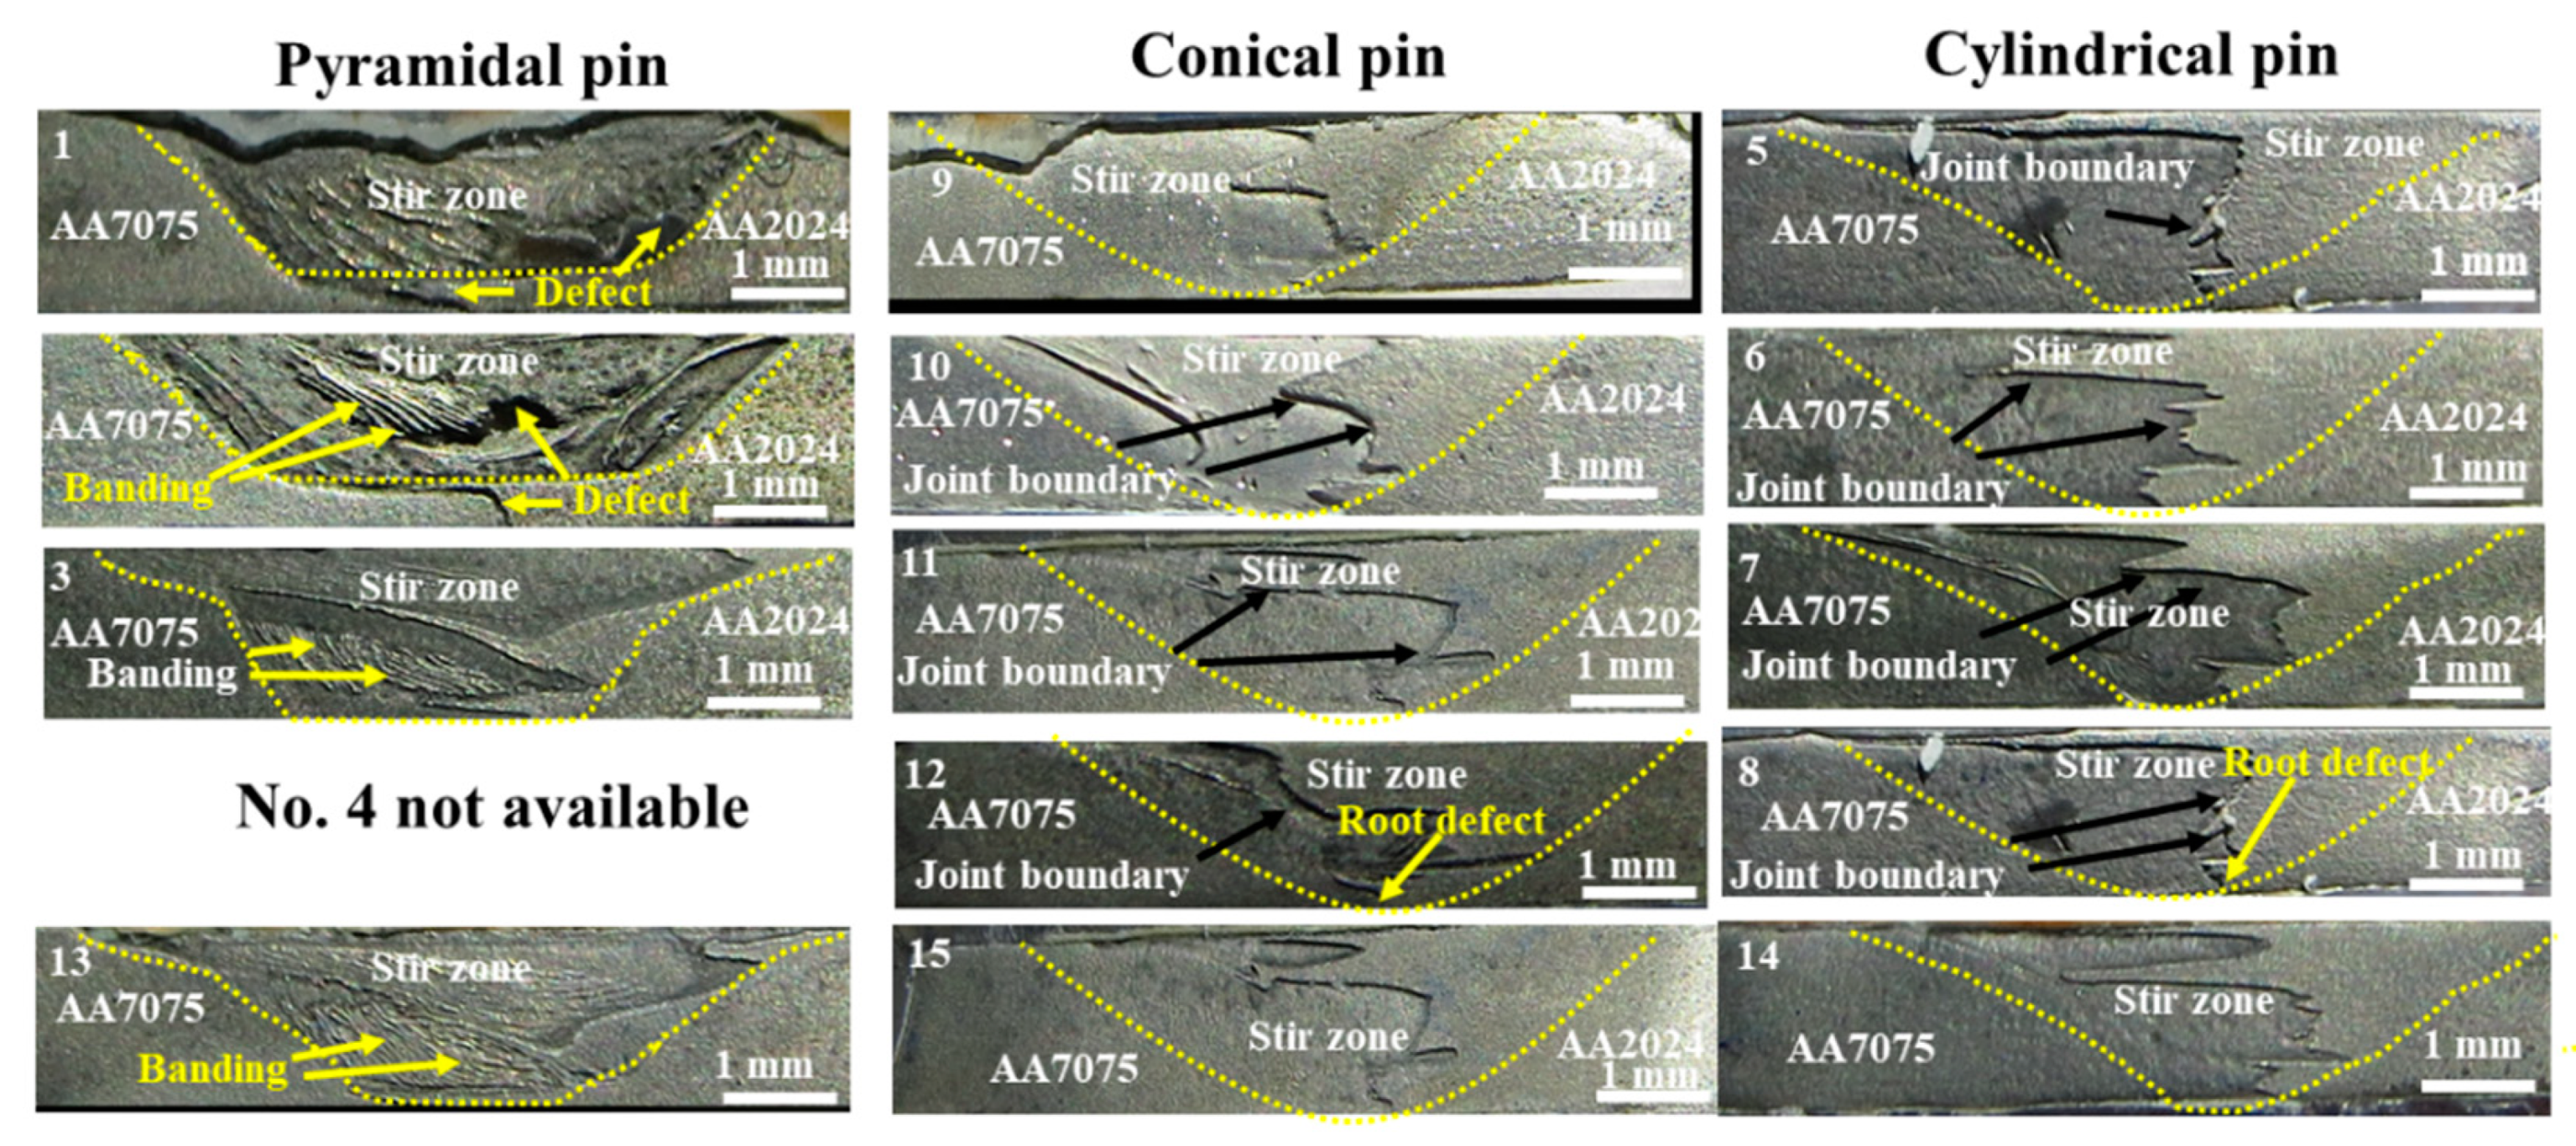
The macrograph of the welds made by three pins is presented in Figure 10. A glance at these images shows a clear difference between the welds made by the pyramidal pin from those made by circular and conical pins. By pyramidal pin, the two materials were intermixed in the stir zone and a lamellar or banding structure was formed. The initial interfaces between the two alloys vanished when using the pyramidal pin. In contrast, the initial interfaces between the two alloys were preserved and only slightly and irregularly displaced from their original position when the conical or cylindrical tools were used.
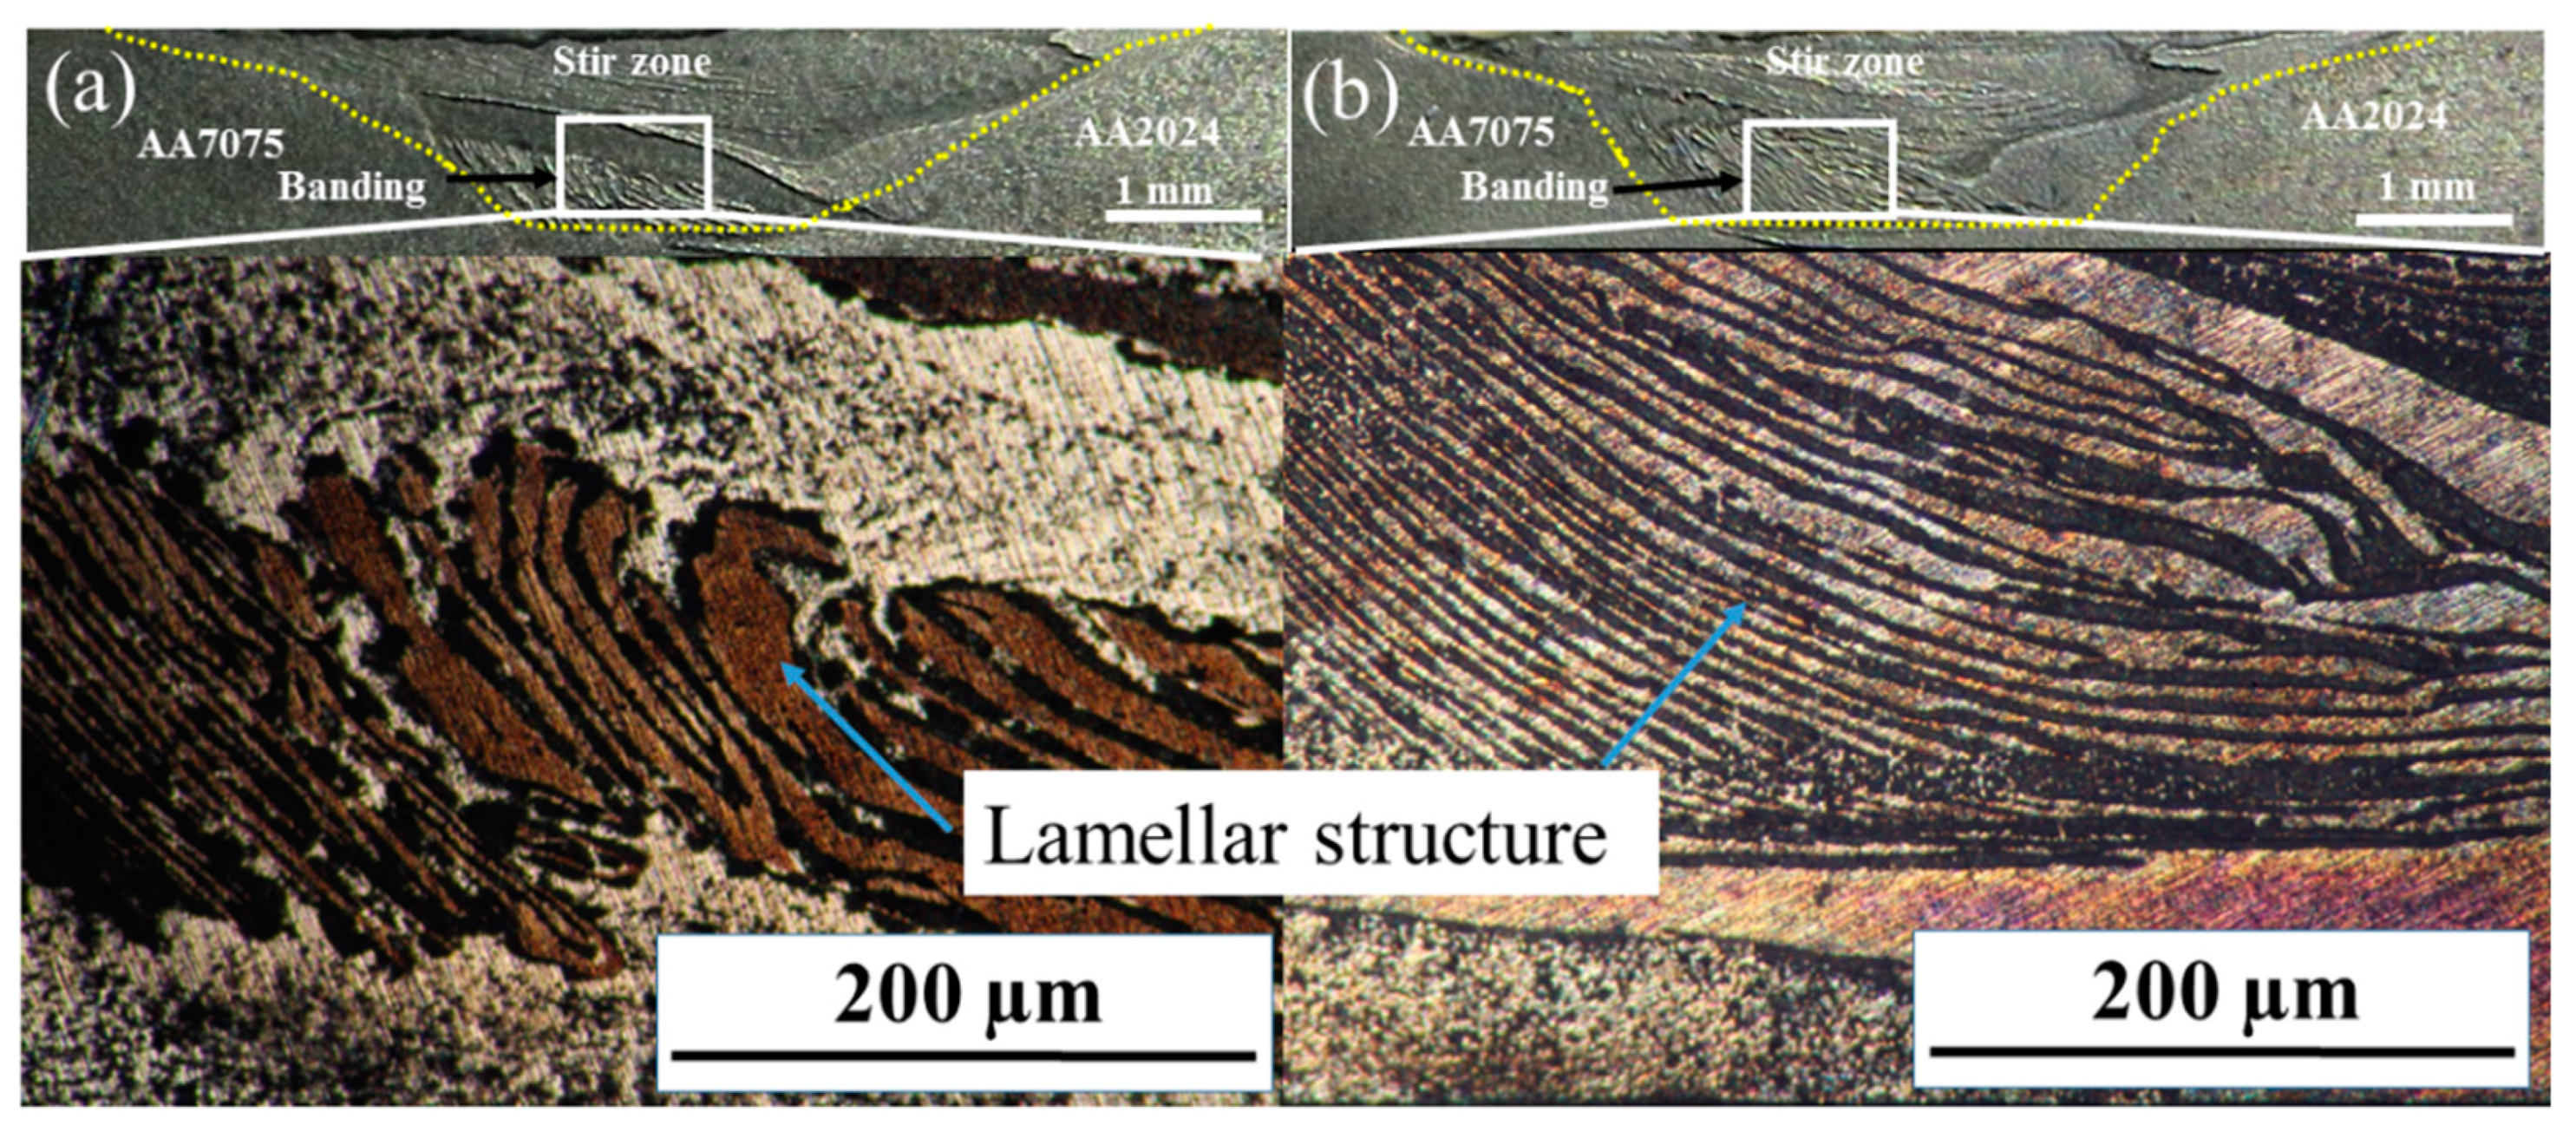
Figure 11 shows the optical image from the stir zones of experiments 3 and 13 which are made by the pyramidal pin at a low rotation speed of the tool. A lamellar or banding structure is obvious in the weld zone. This lamellar structure was not observed in the stir zones of the other welds made by conical or cylindrical pins. This lamellar structure, also referred to as banding, is periodically formed of AA2024 and AA7075 layers as previously reported by Khodir et al. [30] and Zhang et al. [31]. By comparing Figure 11a,b it can be found that the lamellar is finer at higher rotation speeds.
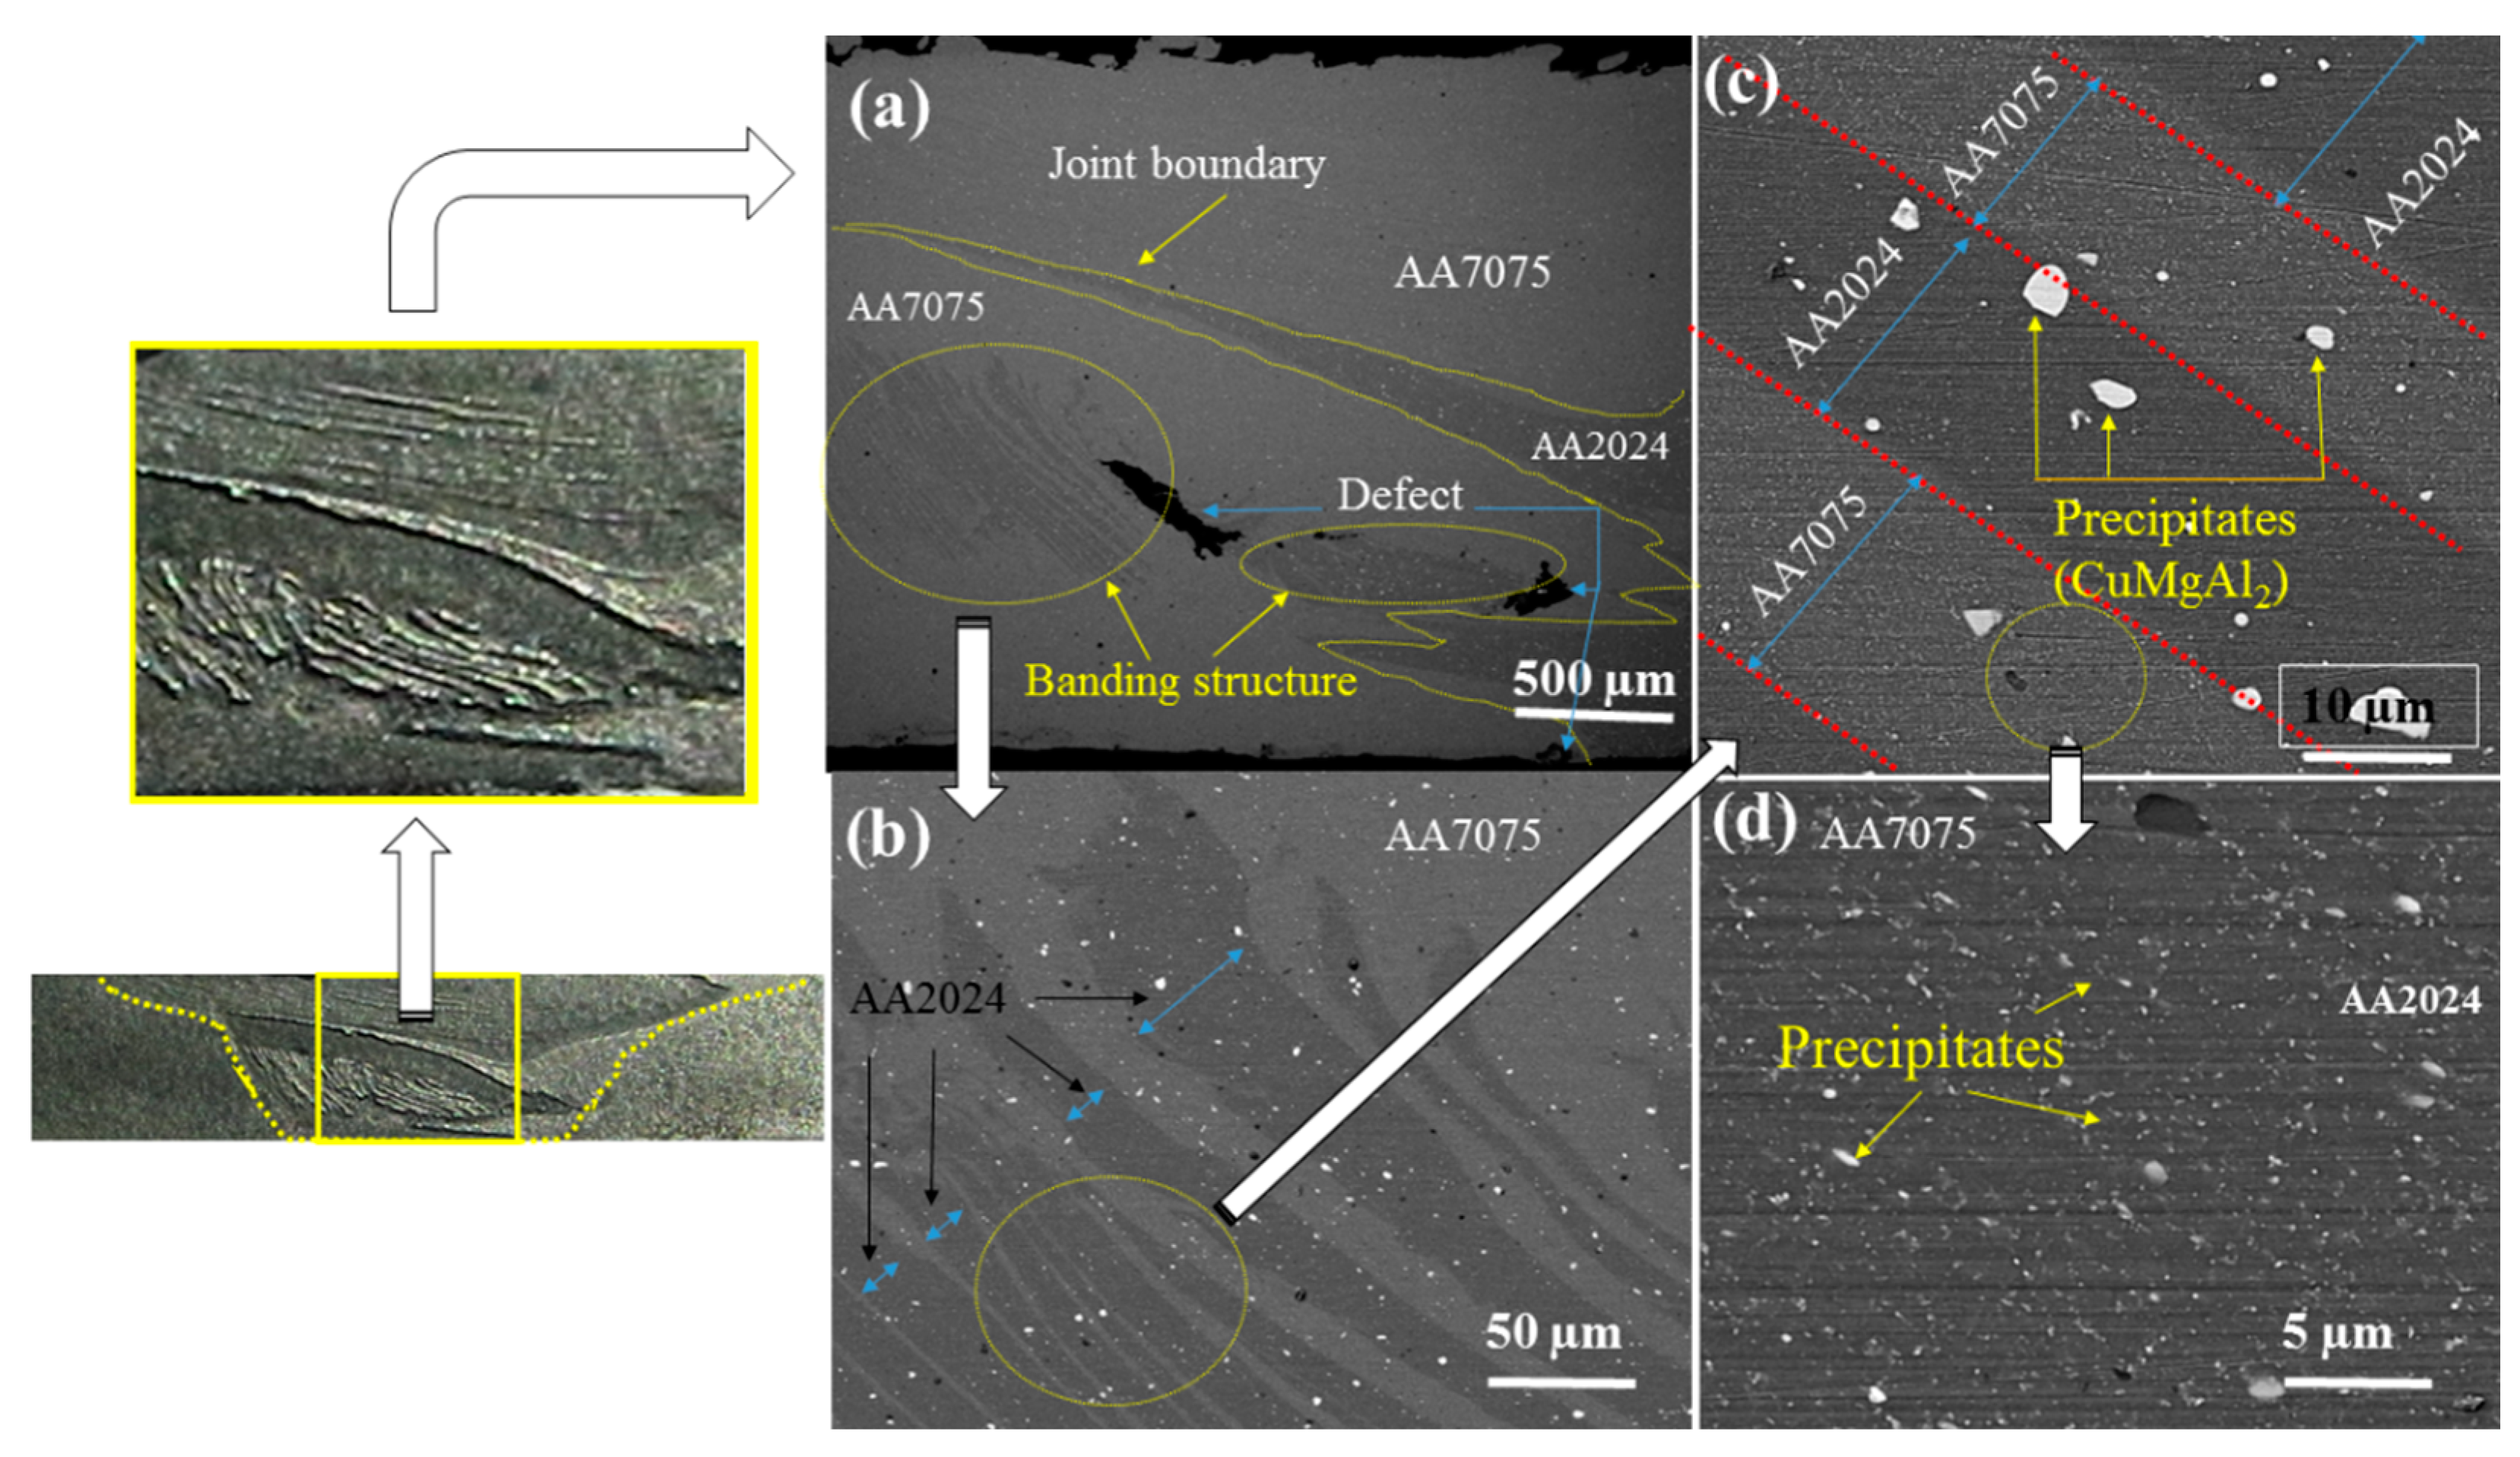
Figure 12a shows the BSE SEM images of the stir zone of sample 3 which represents the samples joined by the pyramidal tool. Some defects are seen in the stir zone which are located in the vicinity of the banding structure (Figure 12a). The presence of voids in the banding region indicates that no consolidation between the two materials occurred in this region, which may be attributed to the different plasticity of the two materials. Figure 12b,c show the higher magnification images of the banding structure in the stir zone. The contrast resulting from the chemical composition suggests that the layers are alternately made of two aluminum alloys. Figure 12d shows the BSE SEM image of AA7075 in the stir zone. An inhomogeneity can be observed in the distribution and size of the precipitates in the stir zone. However, the precipitates in AA7075 are finer and distributed more uniformly than in the AA2024 layer. This can be attributed to the dissolution of pre-existing precipitates and re-precipitation due to the higher temperature and strain during welding on the advancing side. The size of precipitates in layers of AA2024 is coarse and detected to be CuAlMg2.
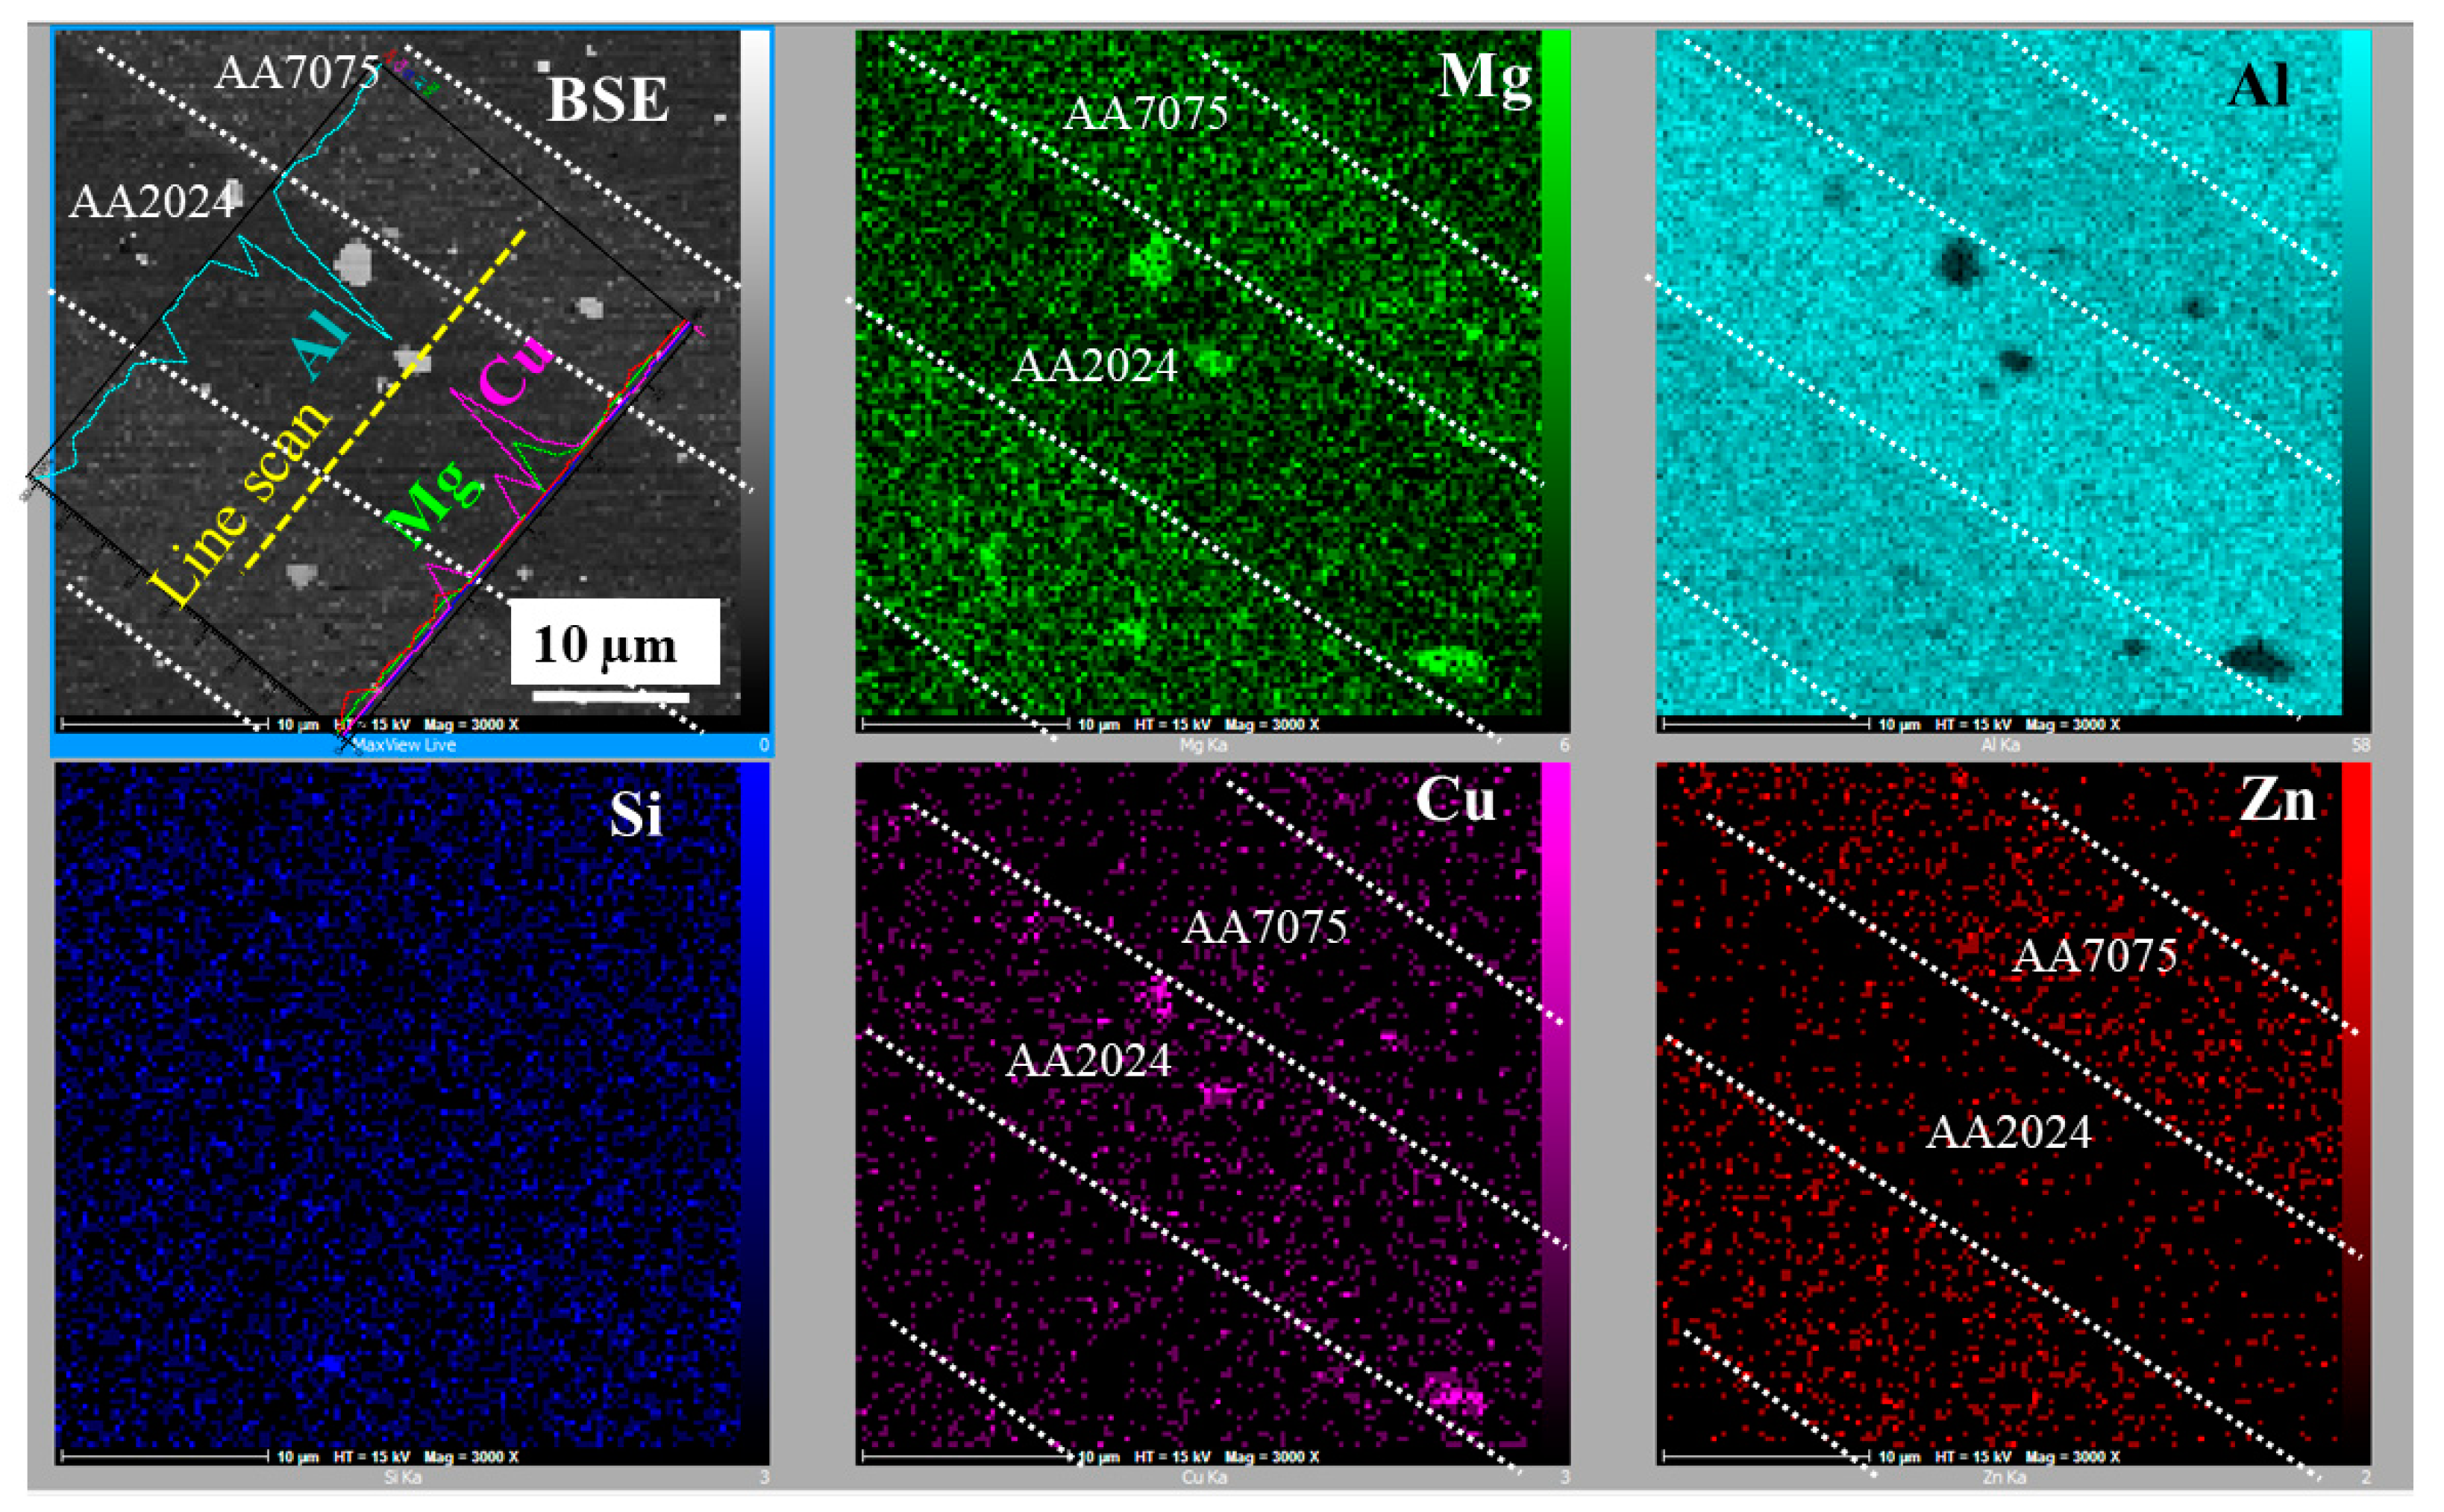
The color element map of the stir zone of specimen 3 is presented in Figure 13. A higher concentration of Cu and a lower concentration of Mg and Zn are observed in the layers corresponding to AA 2024. These images further verify that the alternate layers are composed of AA2024 and AA7075.
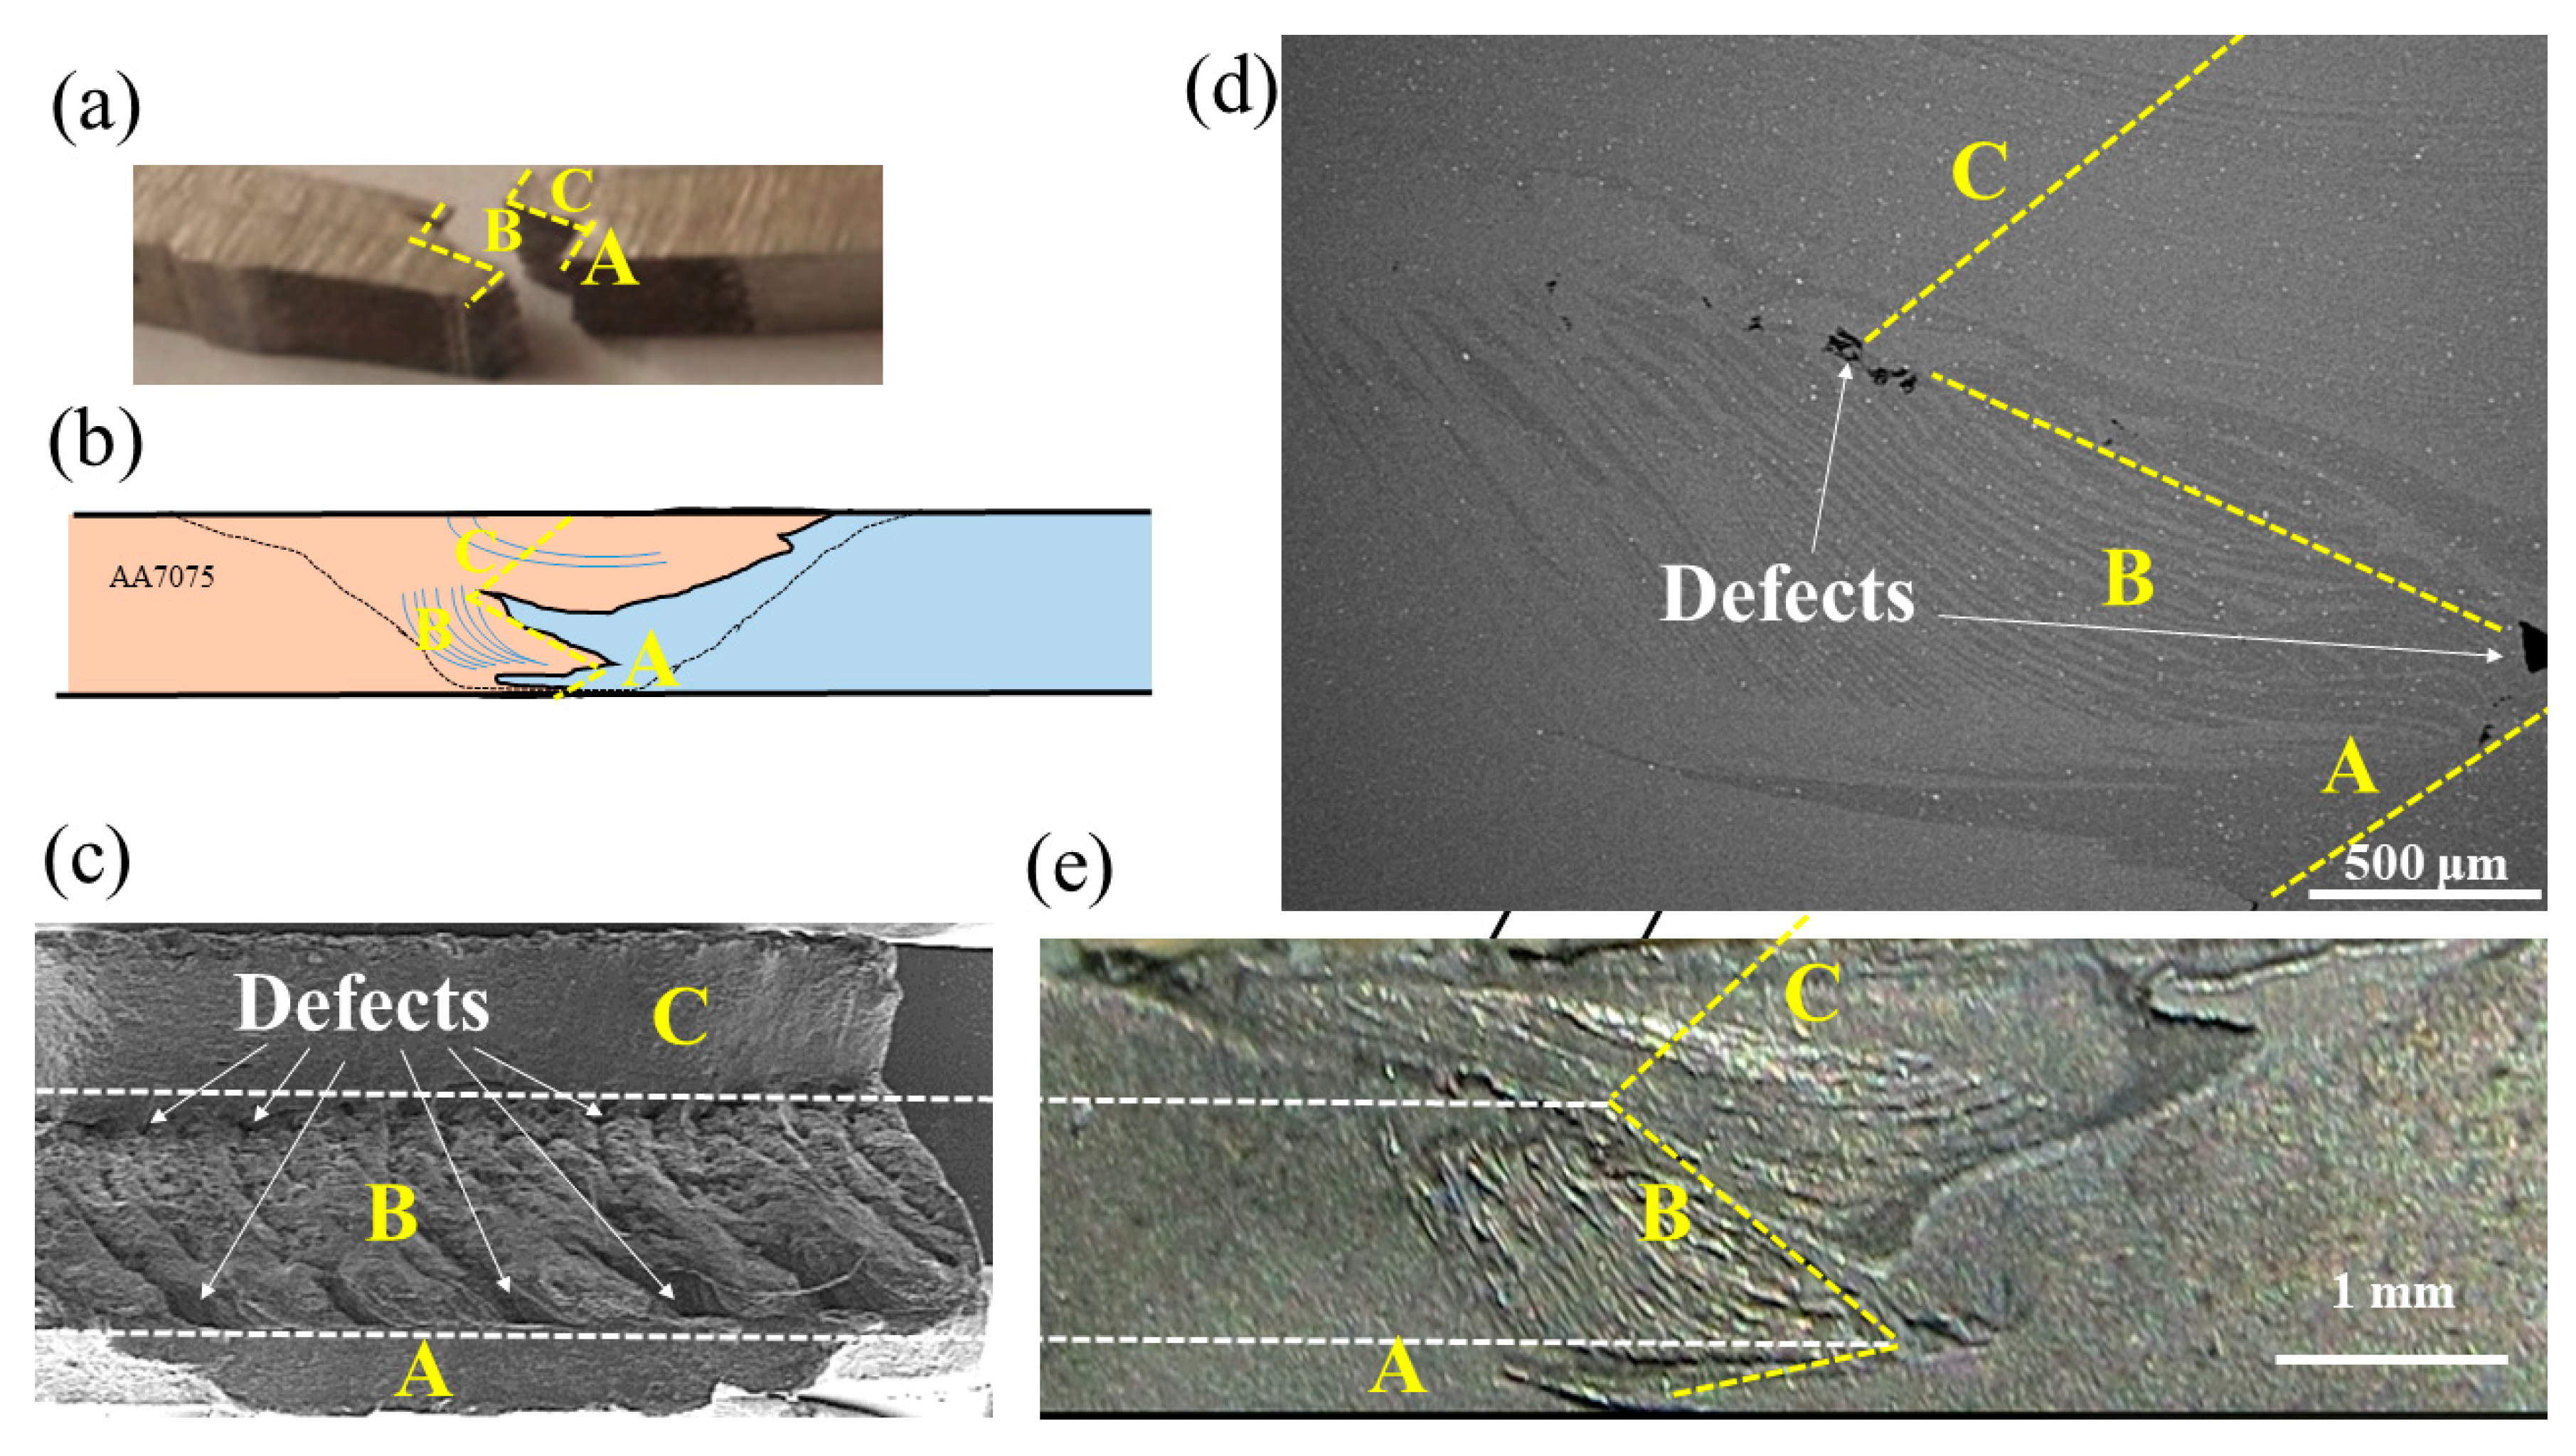
The defects highly impact the strength and fracture behavior of the joints. To be able to correlate the fracture pattern with the macrostructure of the joint, Figure 14a is provided to show the fractured tensile specimen of experiment 13 (the same trend was observed for experiments 1 and 3). Three distinct fracture paths (A, B, and C) can be observed in the fractured specimen. The fracture path is imposed on the schematic of the joint microstructure and is shown in Figure 14b. Figure 14c shows the SEM image of the fracture surface at low magnification. Figure 14d,e show the SEM image and the optical image of the weld macrostructure, respectively. These images are matched together with Figure 14a,b. Region A has failed from AA2024 in the stir zone seemingly initiated from the weld root. Region B has failed through the banding structure which consists of defects (the voids are shown in Figure 14d). The banding is also apparent on the fracture surface shown in Figure 14c. Region C has failed from AA7075 in the stir zone. The low strength and ductility of the samples made by the pyramidal pin at rotation speeds of 1000 and 800 rpm, respectively, are attributed to these defects which are associated with the banding structure in the stir zone. The stir zone in these specimens is dominated by AA7075 wherein the banding structure exists. The reason for the formation of this banding structure is a massive flow of AA7075 from the advancing side to the retreating side and the consequent pushing of AA2024 from the retreating side to the advancing side in the rear of the pin, appearing as a periodic banding structure. It seems that the alternate layers of AA7075 and AA2024 could not be consolidated in the banding region, leading to the formation of the voids.
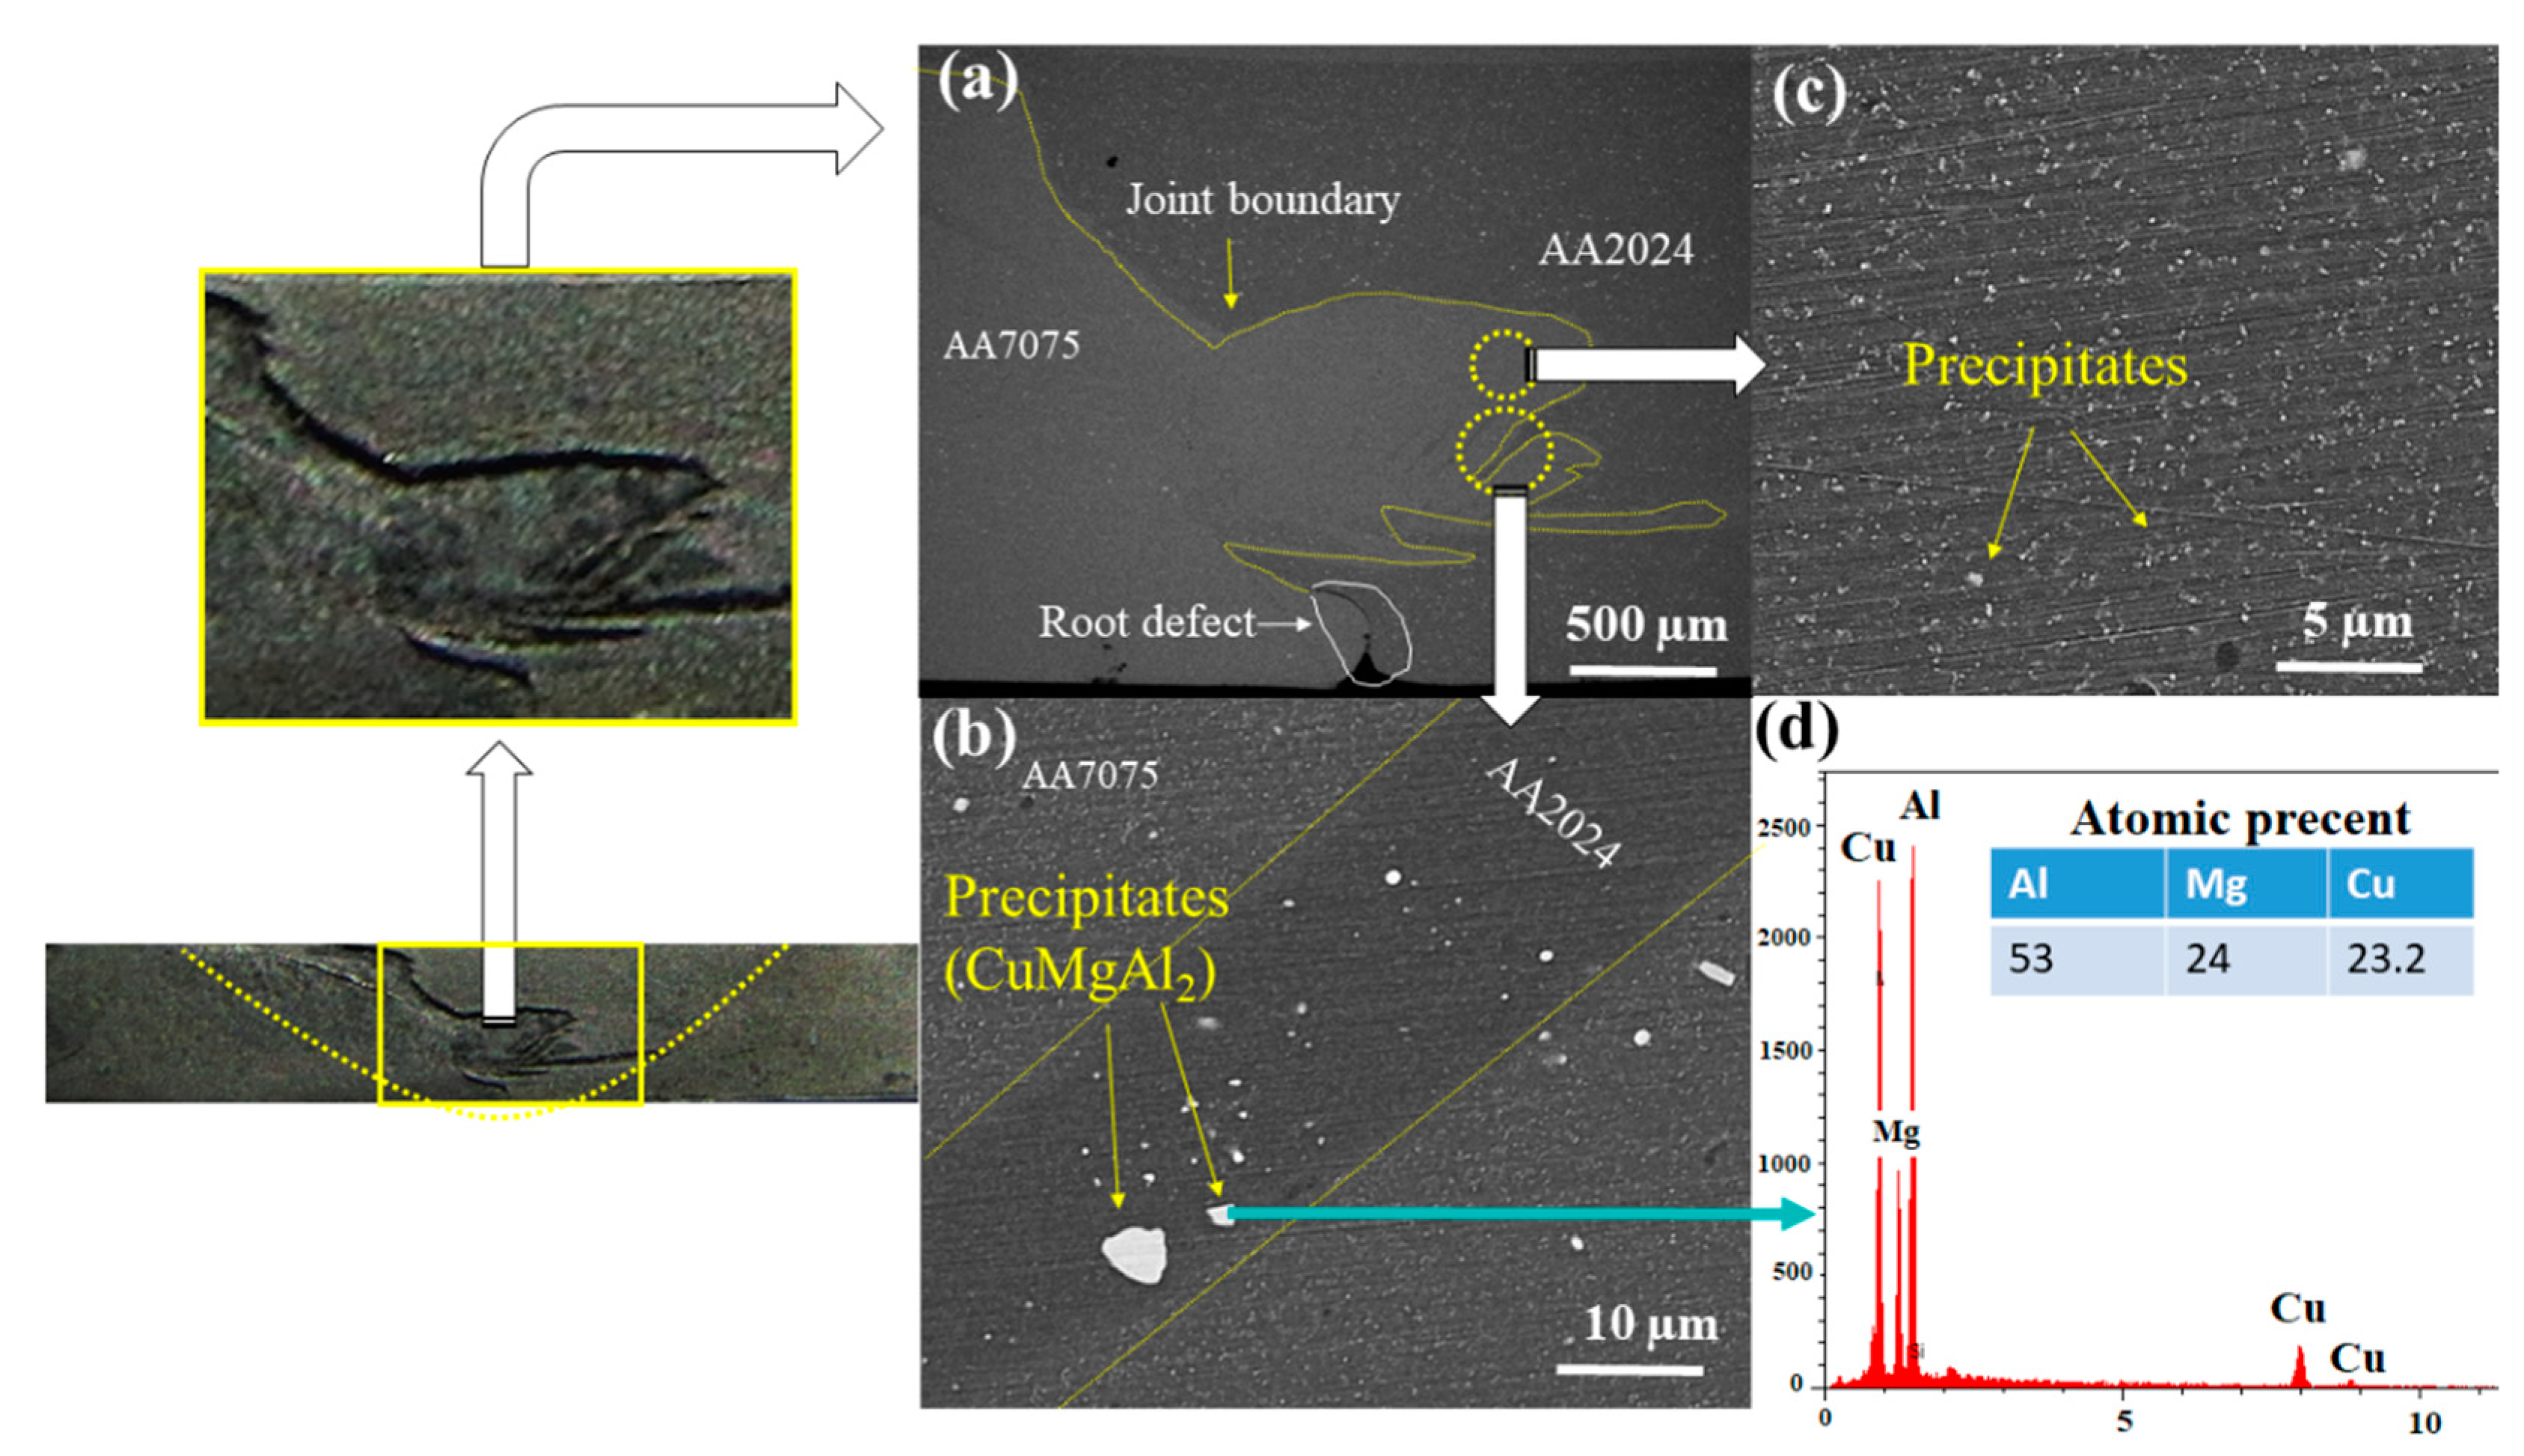
Figure 15 shows the BSE SEM images of the stir zone of experiment 7 representing the welds made by the cylindrical pin. A lack of consolidation of two materials can be observed in the root of the joint (Figure 15a). Bertran et al. [32] have observed this kind of defect in the FSW of AA7020 to AA2139 at high welding speed and attributed this effect to the instability of the process at high welding speed. This phenomenon can also be observed at low rotation speed which leads to a lack of cohesion in the entire joint line; hence, the UTS and elongation of the joints made at 800 rpm are the lowest ones, regardless of the tool geometry. This defect, called the root defect, is observed in joints made at a low rotation speed. The coarsening of the precipitates is clear in AA2024 in the stir zone (Figure 15b) while, in AA7075, the precipitates are finely distributed. The same was observed in the specimens welded by the conical tool. The EDS analysis of the coarse precipitates is presented in Figure 15d which is detected to be CuMgAl2. Unlike the specimens welded by the pyramidal tool, no banding structure was observed in these samples.
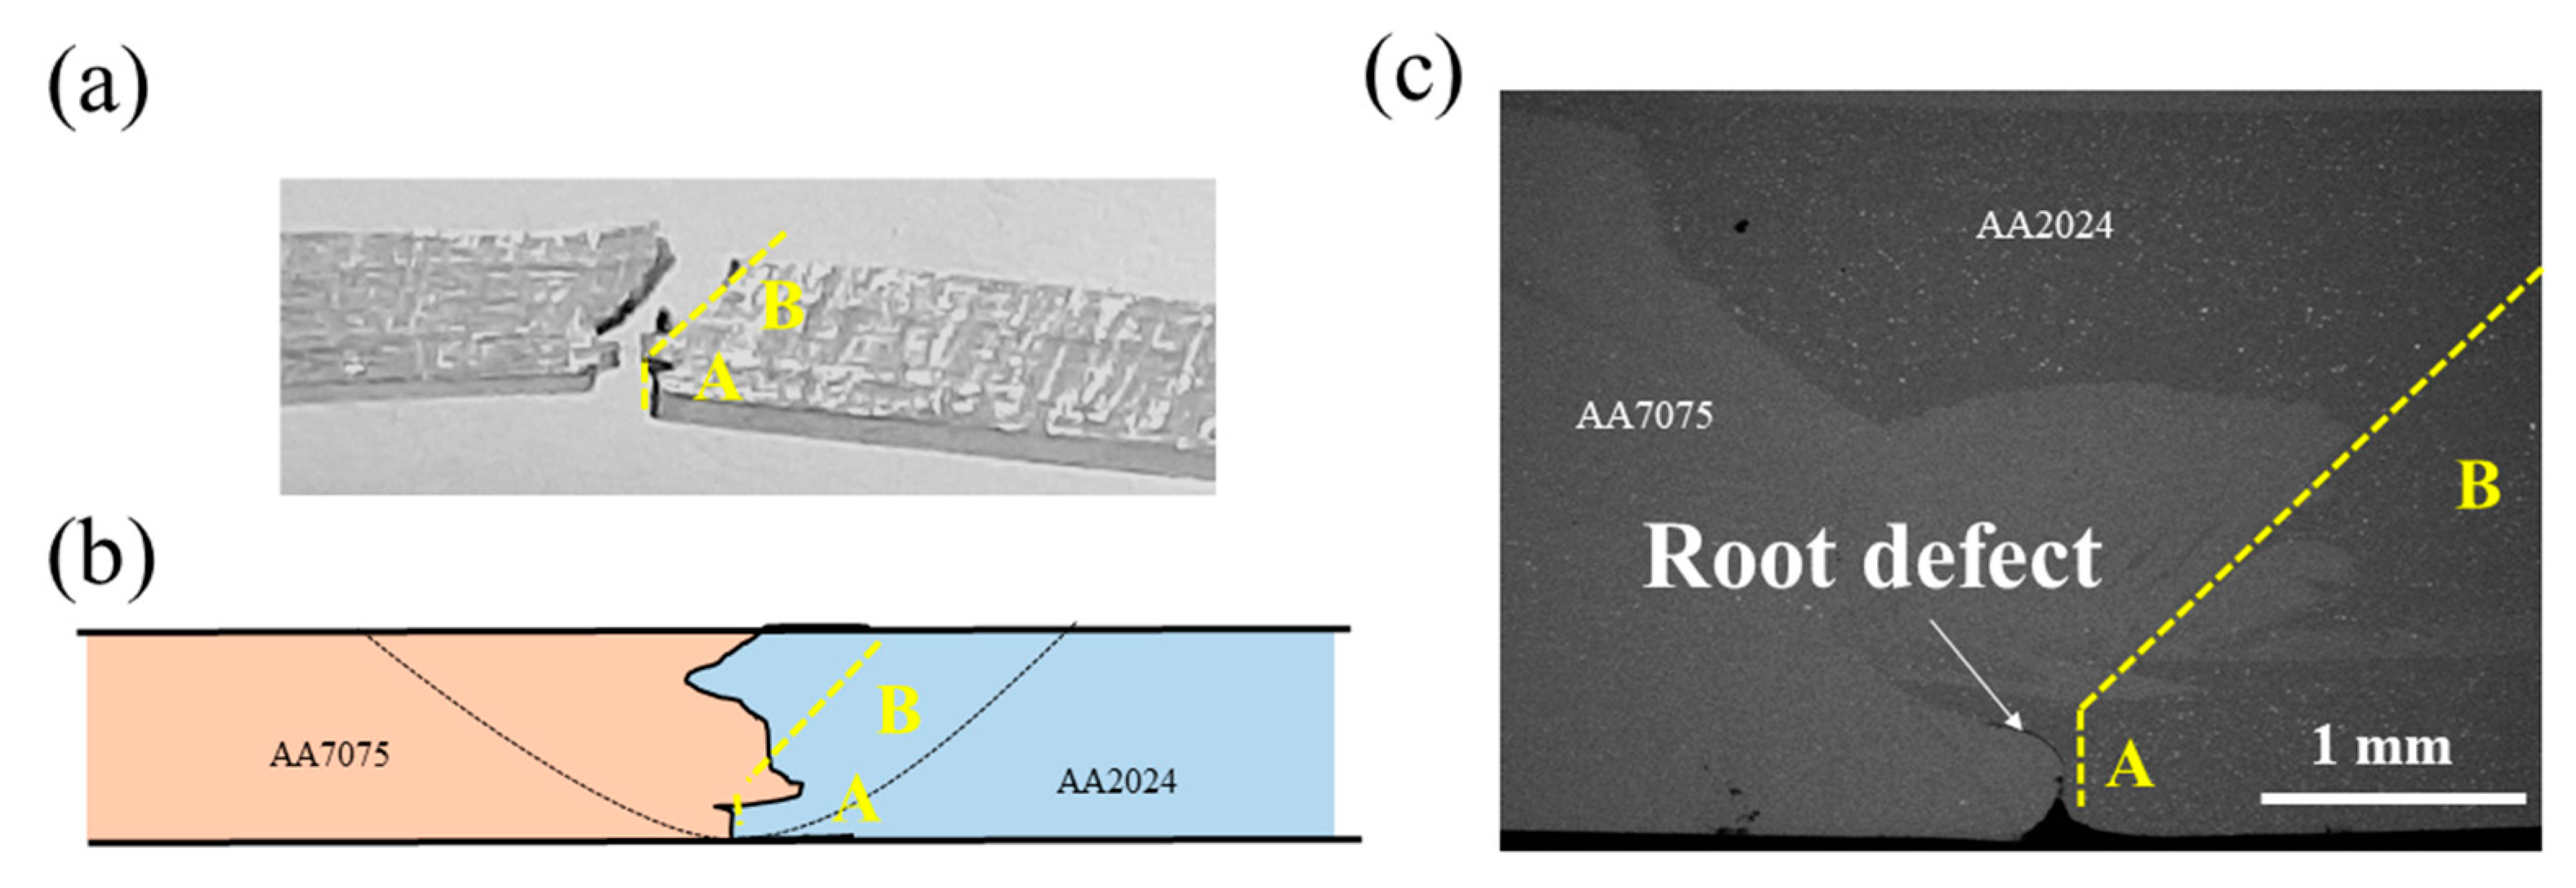
Figure 16a,b show the failed tensile specimen and the schematic of the fracture path of experiment 7 superimposed on the schematic of the microstructure. The fracture initiates from the root defect (region A) and continues as a pure shear plastic fracture in the stir zone of AA2024 (region B in Figure 16c). The propagation of the fracture in region B is due to the lower strength of AA2024 due to the coarser precipitates discussed above. Low strength and elongation obtained at low rotation speed are attributed to this root defect. This trend of fracture was also observed in experiments 5, 9, and 14 in which root defect was present.
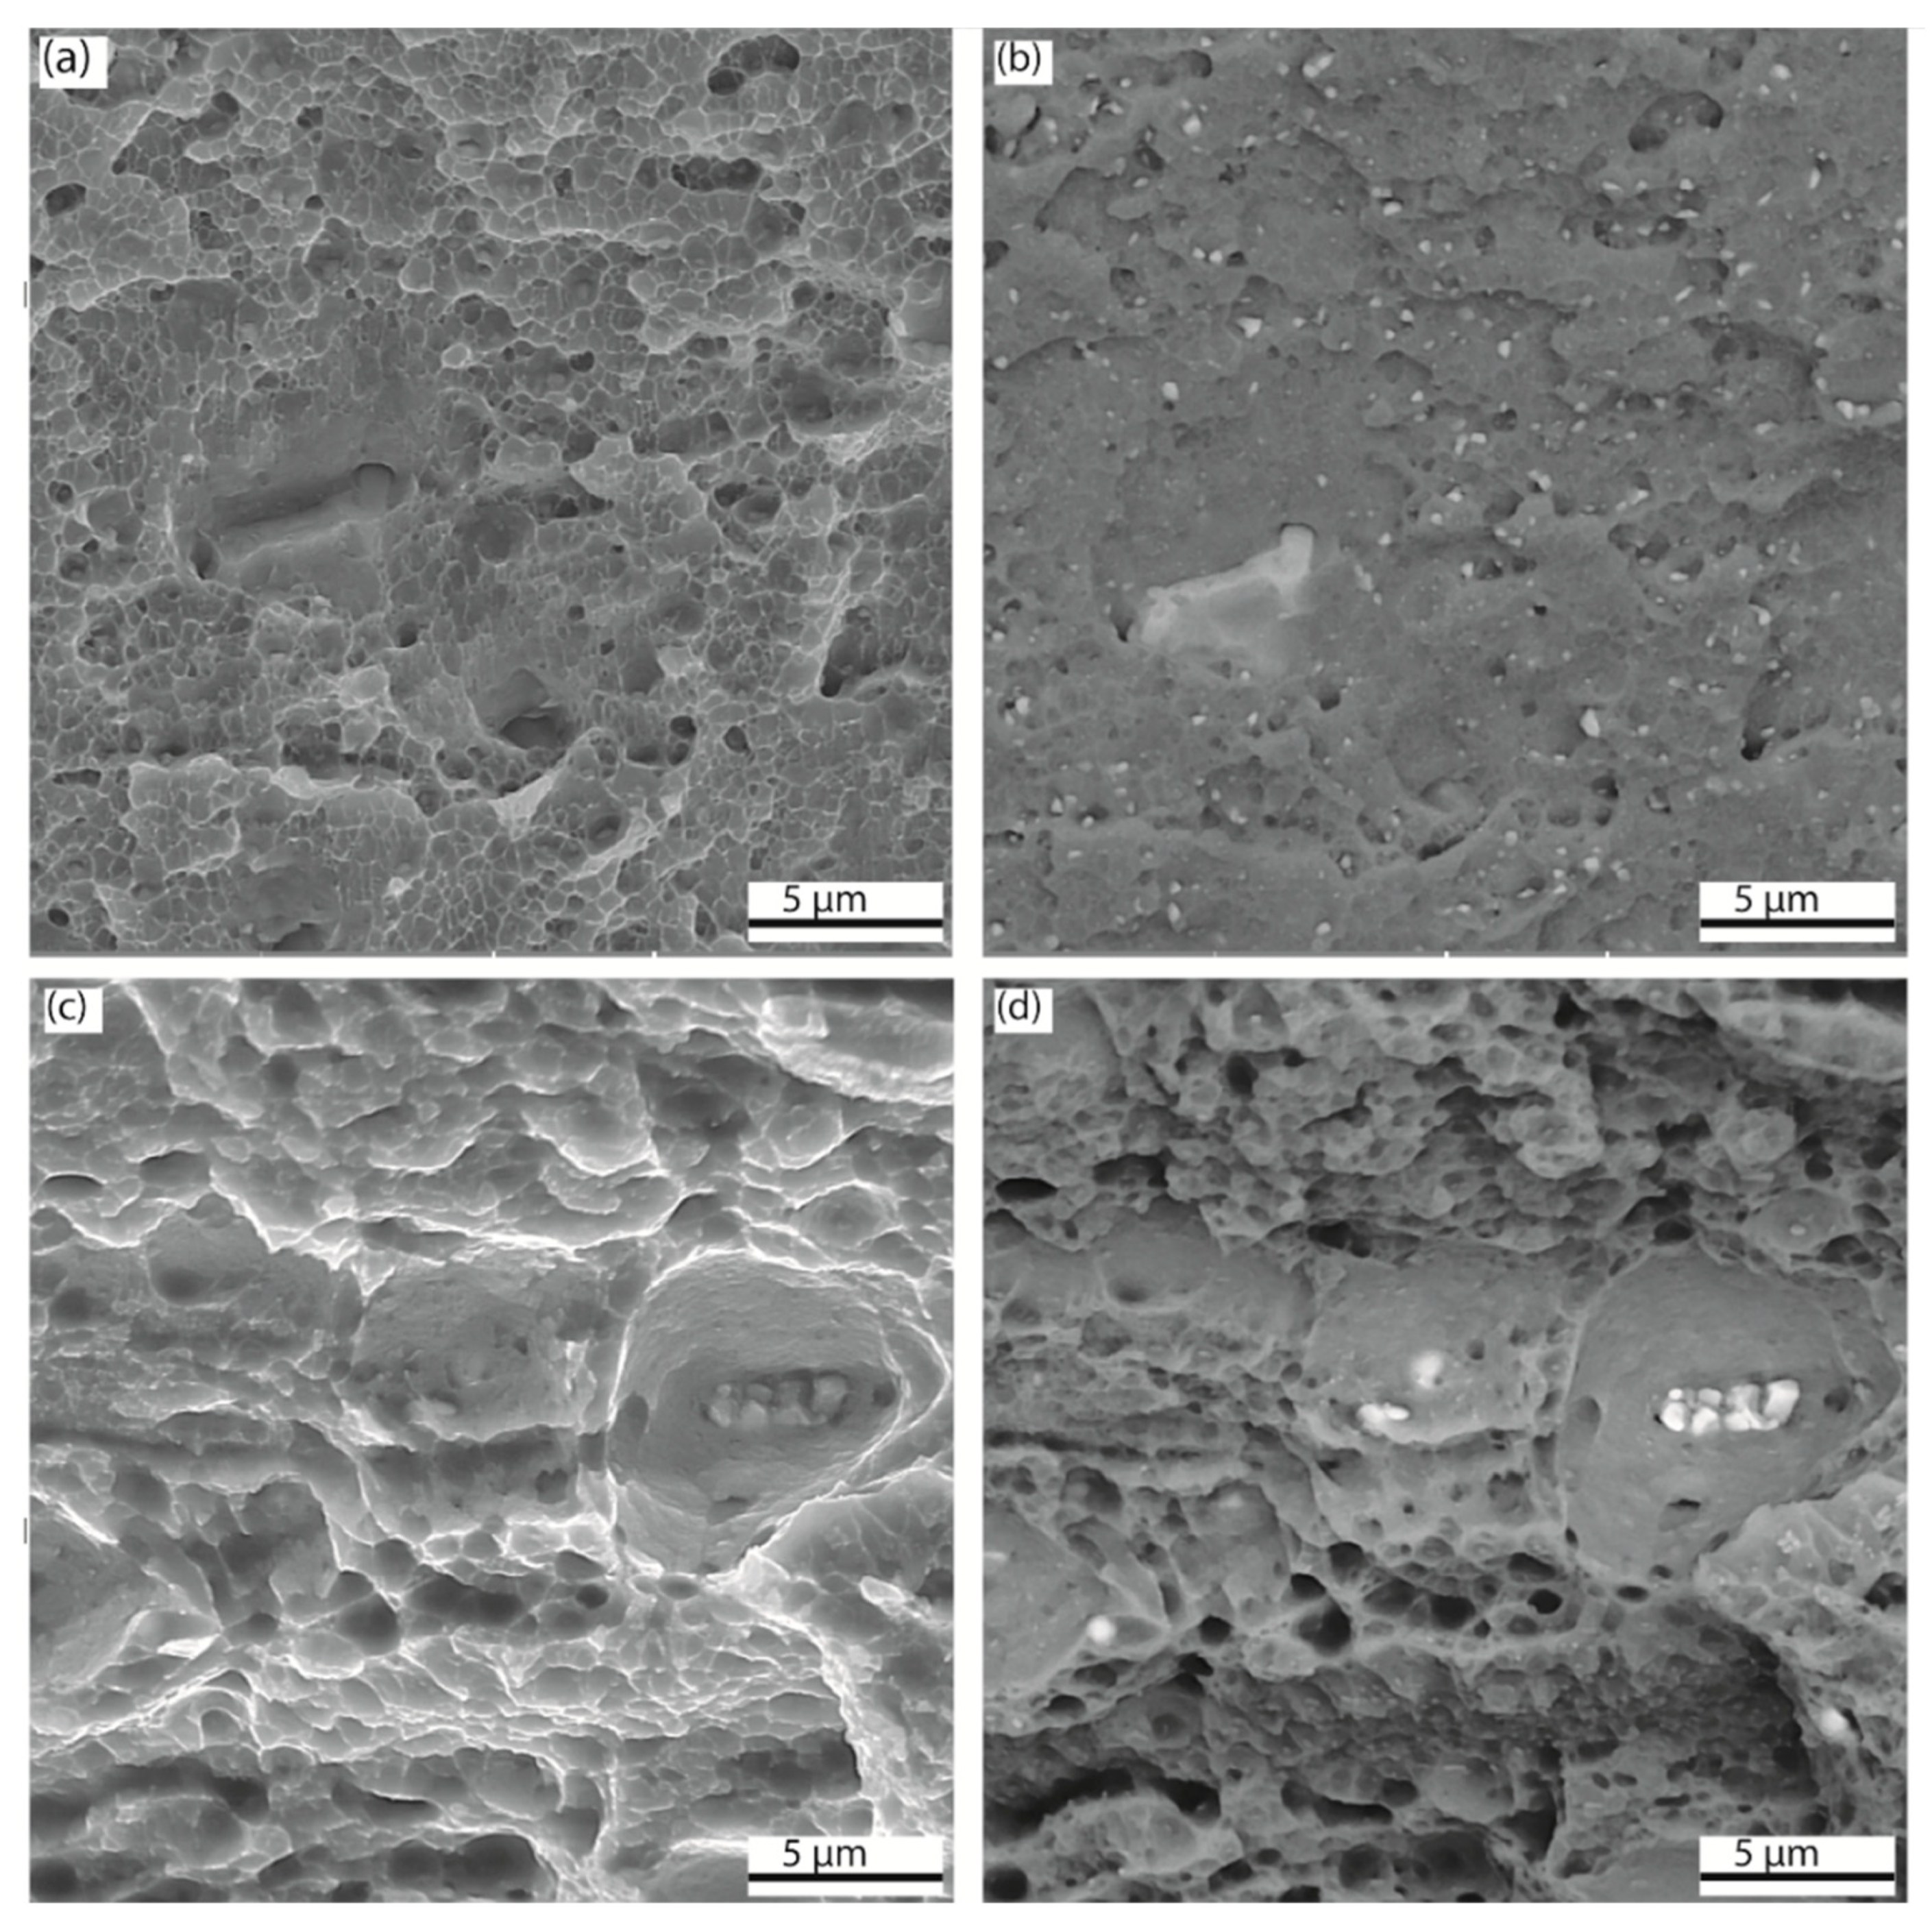
Figure 17a,b show the tensile specimen and the schematic of the fractured experiment welded by the optimized parameters shown in Table 5. The fracture was in pure shear mode probably in the heat-affected zone (HAZ) of AA2024. The large dimples of the fracture surfaces can be seen in Figure 17c,d. EDS analysis of the precipitate present in one of these large dimples is shown in Figure 17e. The presence of the large dimples and precipitates inside these dimples is indicative of the coarsening of the precipitates in AA2024 which was placed on the retreating side. Figure 17f shows the SEM macrograph of the weld in which no root defect is observed. The coarsening of the precipitates is also clear in this figure. This coarsening caused a large softening in this region and, hence, the plastic strain was concentrated there. The same trend was observed in experiments 6, 8, 10, 11, 12, and 15 in which no defect was observed in the stir zone. The reason that this coarsening did not occur in AA7075 placed on the advancing side can be attributed to two factors. First, the initial state of AA7075 was T6 which is artificial heat treatment, while the initial state of AA2024 was T3 which is solution treated. Second, the maximum temperature during FSW in AA2024 was lower than the one in AA7075, as AA2024 was placed on the retreating side. The solution heat treatment temperatures of AA7075 and AA2024 are 480 °C [33] and 500 °C [34], respectively. Therefore, AA7075 is more likely to be solutionized during welding, while the maximum temperature in AA2024 during FSW was more likely to be below the solution temperature. This causes the previously fine precipitates in AA7075 to be dissolved and reprecipitate which leads to a fine distribution of precipitates, while the precipitates nucleate and grow in AA2024. To verify this, the fracture surface of a specimen failed through the AA7075 (experiment 3) is provided in Figure 18a,b. The corresponding BSE SEM image is shown in Figure 18b to observe the distribution of the precipitates. The same was done for a specimen that failed through AA2024 (experiment 8) and the corresponding images are provided in Figure 18c,d. As can be observed, the dimples and the precipitates are finer in the sample that failed from AA7075 than in the one from AA2024.
The heat effects of the FSW cause the coarsening of the precipitates and softening in the stir zone. This softening is pronounced in the specimens welded by conical tool due to higher temperature, as reported by Beygi et al. [10]. Hence, the specimens welded by conical tools, despite having no defect, have lower strength (specimens 10, 11, and 15). The higher temperature in the conical tool compared to the cylindrical tool is due to the larger volume of plasticized material and the higher frictional heat resulting from the larger volume and surface area of the conical pin compared to the cylindrical one.
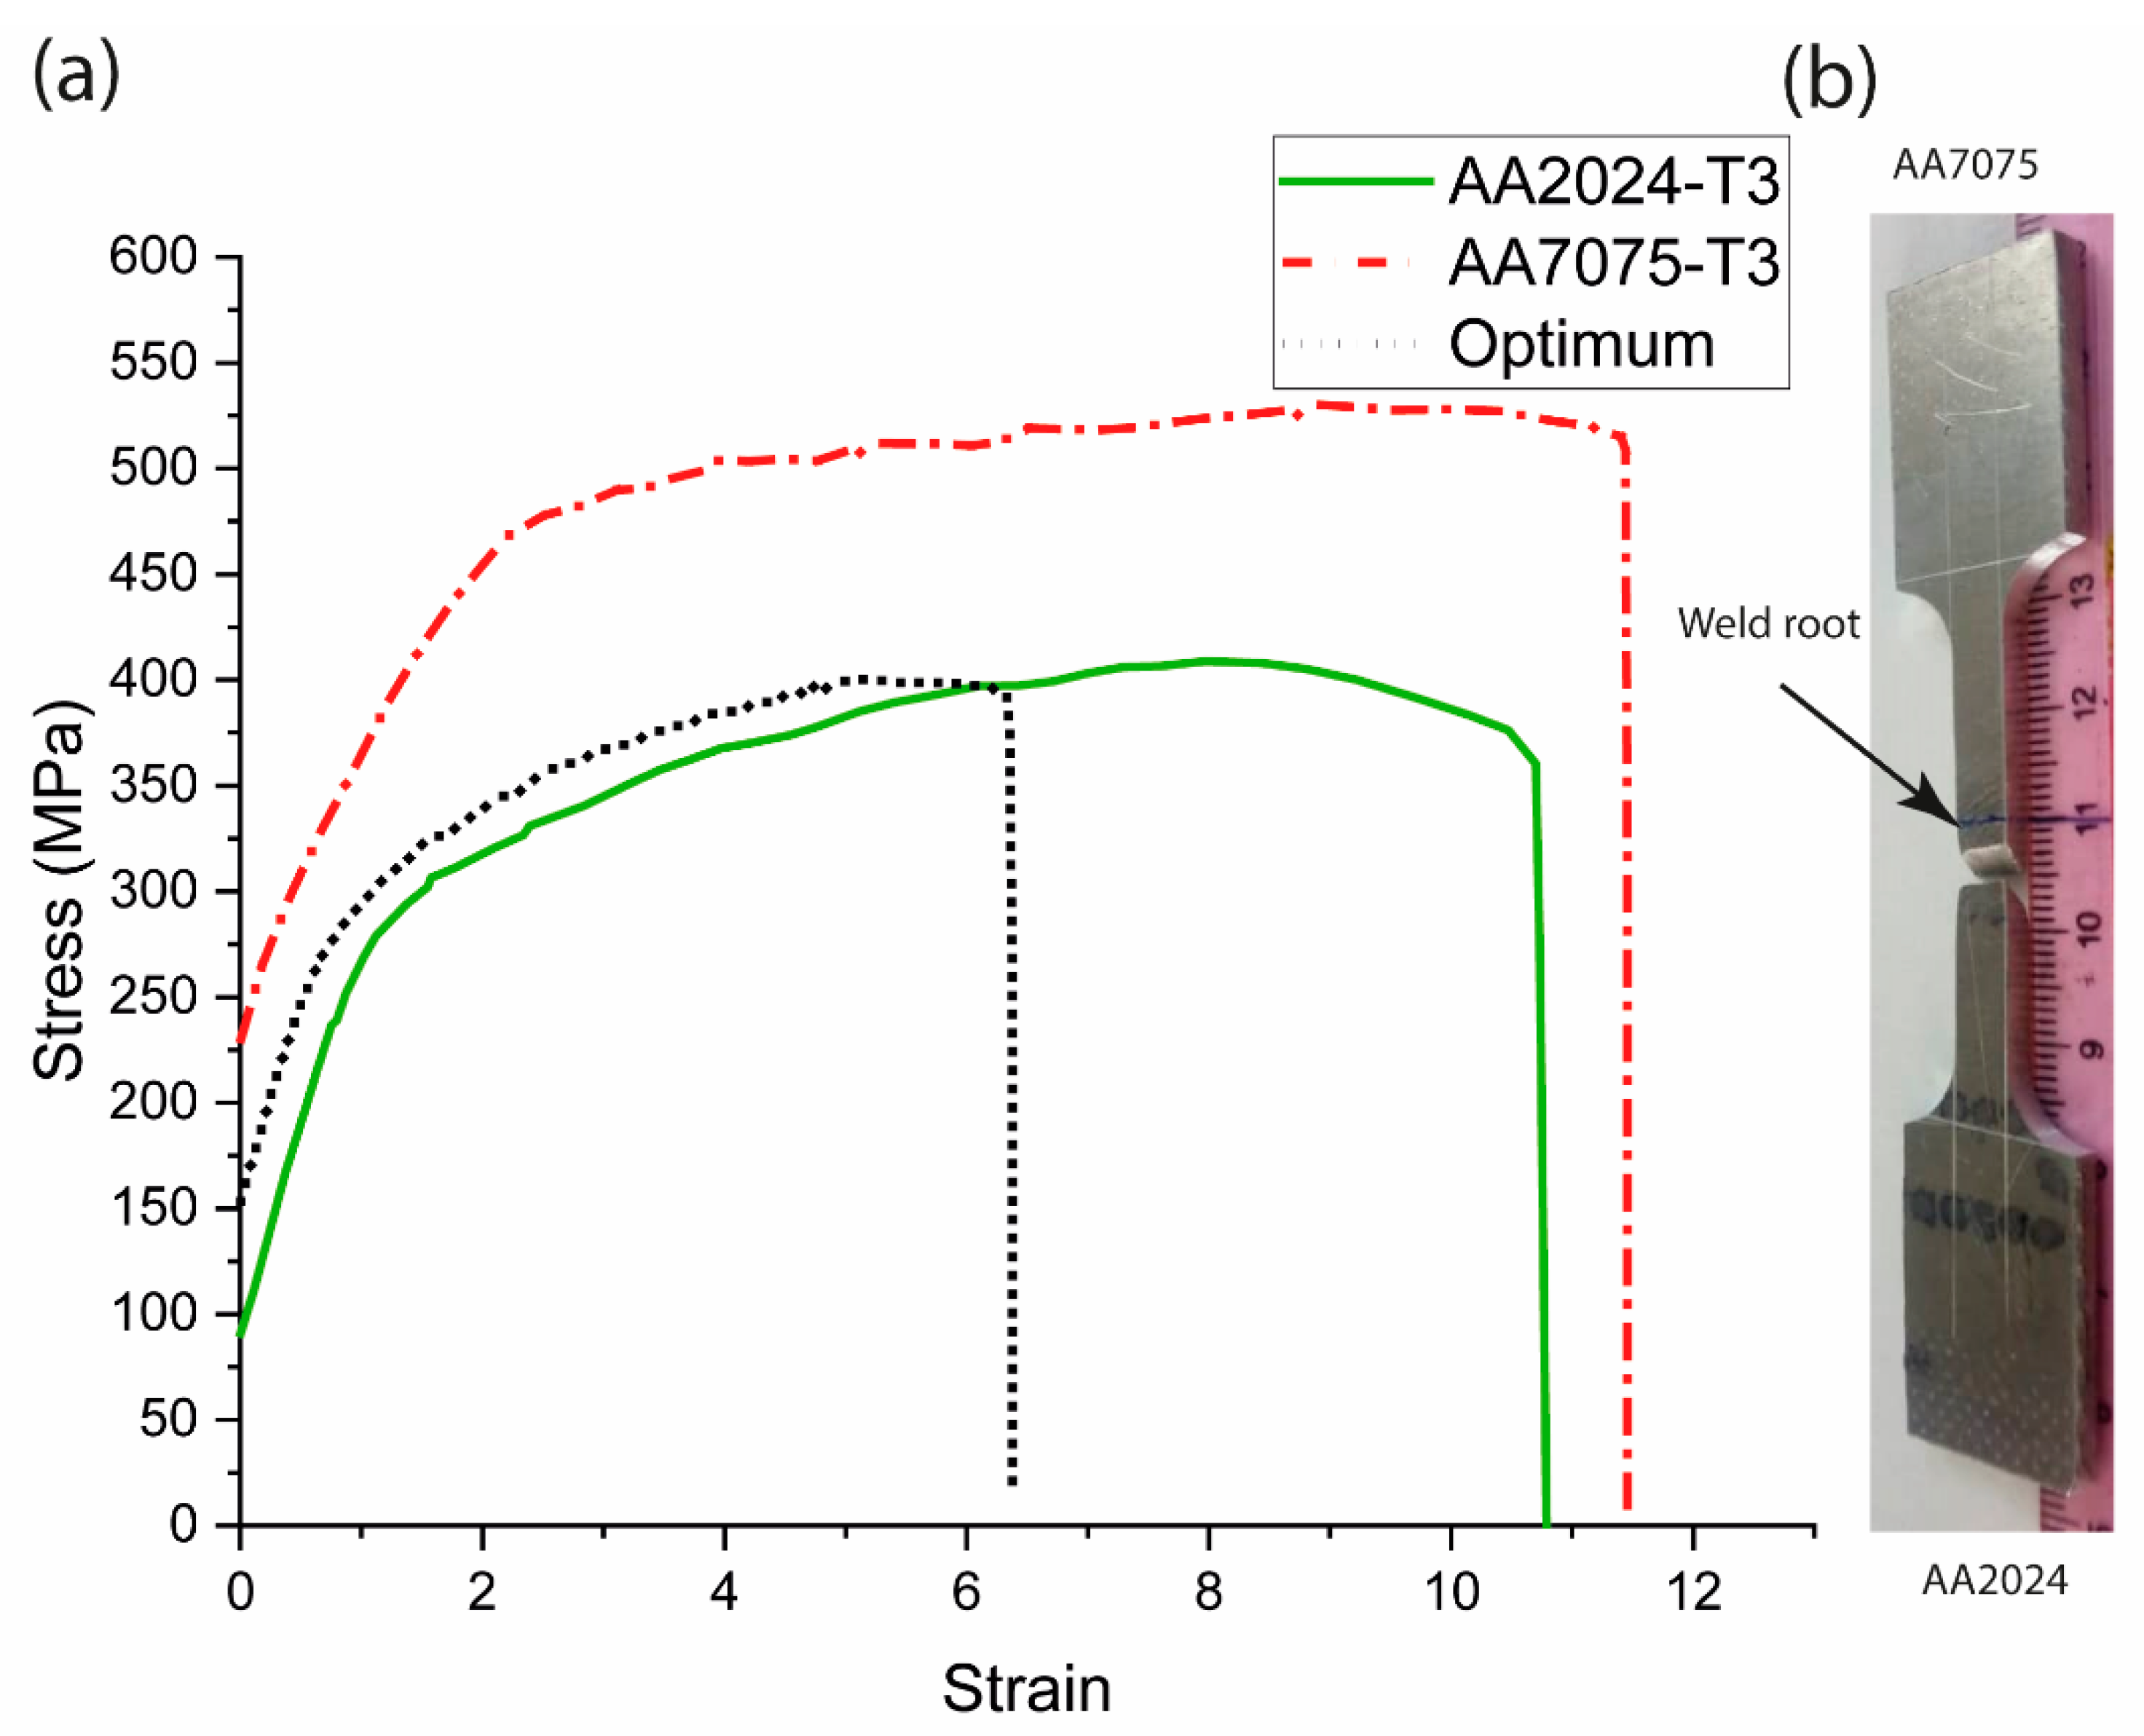
The main cause of the joint failure was the root defect—namely, the kissing bond—which is attributed to the insufficient material flow at low rotation speeds. When this defect disappeared at a high rotation speed, the UTS increased, and the failure occurred due to the softening of AA2024 in the stir zone. This softening is lowest in the specimens joined by the cylindrical tool. In this specimen, the fracture initiated away from the root of the weld as can be observed in Figure 19. The UTS and elongation of this joint are lower than the base material. The lower elongation is due to the strain concentration in the softened zone.
Figure 20 represents the 3D plots showing the effect of the welding speed and rotation speed on the UTS of the welds made by 3 tools. This figure (plotted in Matlab) along with the interaction plot shown in Figure 8 gives a good understanding of the mechanism of defect formation at various welding parameters. First, the UTS is not sensitive to the welding speed (at least in the range of 10–50 mm/min). Second, the root defect appeared at a low rotation speed, regardless of the tool geometry. Third, the root defect disappeared at high rotation speed when FSW was performed by conical and cylindrical tools. When FSW was performed by the pyramidal tool, the edges of the tool caused the chipping of material leading to a lack of plasticity and material flow. Fourth, the softening by the cylindrical tool at high rotation speed is less than the conical tool; hence, the optimum parameter was obtained when the cylindrical tool was used at a high rotation speed.

4. Conclusions

The UTSs of the welded AA2024-AA7075 aluminum alloys were modeled and optimized using RSM. The following results were obtained:
ANN was successfully used to understand the effect of welding parameters and tool geometry on the ultimate tensile strengths of the welds. The optimum condition was obtained by the SA method which corresponded to the experimental result successfully.
All the joints possessed a root defect at a low rotation speed of the joint due to a lack of material flow under the pin.
The joints made by the pyramidal pin possessed the lowest joint strengths due to the various welding defects at different tool rotation speeds: at 1200 rpm the lack of plastic flow, at 1000 rpm the banding structure, and at 800 rpm the root defect.
The joints made by the conical pin were free of defects at higher rotation speeds but still had a low tensile strength. This was attributed to the softening caused by the precipitates coarsening in the stir zone due to a high temperature during welding.
The UTS of the welded specimens had little sensitivity to the welding speed.
The optimum joint strength was obtained using the cylindrical tool at high rotation speed where the root defect disappeared due to sufficient material flow. This tool, having a low volume, did not cause a high temperature during welding and, therefore, softening was minimized.

Author Contributions

Conceptualization, R.B.; methodology, S.M.; software, S.M.; validation, M.Z.M.; formal analysis, A.A.-S.; investigation, S.M.; resources, S.M.; data curation, M.Z.M.; writing—original draft preparation, R.B.; writing—review and editing, L.F.M.d.S.; visualization, A.A.-S.; supervision, L.F.M.d.S. and R.B.; funding acquisition, R.B. All authors have read and agreed to the published version of the manuscript.

Funding

This research received no external funding.

Data Availability Statement

Data is available in the paper.

Acknowledgments

The authors thank Arak University for FSW facilities. The authors also acknowledge the funding under the reference “UIDP/50022/2020—LAETA—Laboratório Associado de Energia, Transportes e Aeronáutica”.

Conflicts of Interest

The authors declare no conflict of interest.

References

  1. Beygi, R.; Mehrizi, M.Z.; Akhavan-Safar, A.; Safaei, S.; Loureiro, A.; da Silva, L.F.M. Design of friction stir welding for butt joining of aluminum to steel of dissimilar thickness: Heat treatment and fracture behavior. Int. J. Adv. Manuf. Technol. 2021, 112, 1951–1964. [Google Scholar] [CrossRef]
  2. Çam, G.; İpekoğlu, G. Recent developments in joining of aluminum alloys. Int. J. Adv. Manuf. Technol. 2017, 91, 1851–1866. [Google Scholar] [CrossRef]
  3. Nonnenmann, T.; Beygi, R.; Carbas, R.J.; da Silva, L.F.; Öchsner, A. Synergetic effect of adhesive bonding and welding on fracture load in hybrid joints. J. Adv. Join. Process. 2022, 6, 100122. [Google Scholar] [CrossRef]
  4. Beygi, R.; Kazeminezhad, M.; Mehrizi, M.Z.; Eisaabadi, B.G.; Loureiro, A. Friction stir butt welding of Al-Cu bilayer laminated composites: Analysis of force, torque, and temperature. Int. J. Adv. Manuf. Technol. 2017, 88, 393–400. [Google Scholar] [CrossRef]
  5. Küçükömeroğlu, T.; Aktarer, S.M.; Ipekoğlu, G.; Çam, G. Microstructure and mechanical properties of friction-stir welded St52 steel joints. Int. J. Miner. Met. Mater. 2018, 25, 1457–1464. [Google Scholar] [CrossRef]
  6. Beygi, R.; Carbas, R.; Barbosa, A.; Marques, E.; da Silva, L. A comprehensive analysis of a pseudo-brittle fracture at the interface of intermetallic of η and steel in aluminum/steel joints made by FSW: Microstructure and fracture behavior. Mater. Sci. Eng. A 2021, 824, 141812. [Google Scholar] [CrossRef]
  7. Sun, Y.; Zeng, W.D.; Zhao, Y.Q.; Zhang, X.M.; Shu, Y.; Zhou, Y.G. Modeling constitutive relationship of Ti40 alloy using artificial neural network. Mater. Des. 2011, 32, 1537–1541. [Google Scholar] [CrossRef]
  8. Akhavan-Safar, A.; Beygi, R.; Delzendehrooy, F.; da Silva, L. Fracture energy assessment of adhesives–Part I: Is GIC an adhesive property? A neural network analysis. Proc. Inst. Mech. Eng. Part L J. Mater. Des. Appl. 2021, 235, 1461–1476. [Google Scholar] [CrossRef]
  9. Delzendehrooy, F.; Beygi, R.; Akhavan-Safar, A.; da Silva, L. Fracture energy assessment of adhesives Part II: Is GIIc an adhesive material property?(A neural network analysis). J. Adv. Join. Process. 2021, 3, 100049. [Google Scholar] [CrossRef]
  10. Beygi, R.; Mehrizi, M.Z.; Verdera, D.; Loureiro, A. Influence of tool geometry on material flow and mechanical properties of friction stir welded Al-Cu bimetals. J. Mater. Process. Technol. 2018, 255, 739–748. [Google Scholar] [CrossRef]
  11. Kumar, K.S.A.; Murigendrappa, S.M.; Kumar, H. A Bottom-Up Optimization Approach for Friction Stir Welding Parameters of Dissimilar AA2024-T351 and AA7075-T651 Alloys. J. Mater. Eng. Perform. 2017, 26, 3347–3367. [Google Scholar] [CrossRef]
  12. Amirafshar, A.; Pouraliakbar, H. Effect of tool pin design on the microstructural evolutions and tribological characteristics of friction stir processed structural steel. Measurement 2015, 68, 111–116. [Google Scholar] [CrossRef]
  13. Babu, K.K.; Panneerselvam, K.; Sathiya, P.; Haq, A.N.; Sundarrajan, S.; Mastanaiah, P.; Murthy, C.V.S. Parameter optimization of friction stir welding of cryorolled AA2219 alloy using artificial neural network modeling with genetic algorithm. Int. J. Adv. Manuf. Technol. 2018, 94, 3117–3129. [Google Scholar] [CrossRef]
  14. D’Orazio, A.; Forcellese, A.; Simoncini, M. Prediction of the vertical force during FSW of AZ31 magnesium alloy sheets using an artificial neural network-based model. Neural Comput. Appl. 2019, 31, 7211–7226. [Google Scholar] [CrossRef]
  15. Tansel, I.N.; Demetgul, M.; Okuyucu, H.; Yapici, A. Optimizations of friction stir welding of aluminum alloy by using genetically optimized neural network. Int. J. Adv. Manuf. Technol. 2010, 48, 95–101. [Google Scholar] [CrossRef] [Green Version]
  16. Dehabadi, V.M.; Ghorbanpour, S.; Azimi, G. Application of artificial neural network to predict Vickers microhardness of AA6061 friction stir welded sheets. J. Central South Univ. 2016, 23, 2146–2155. [Google Scholar] [CrossRef]
  17. Palanivel, R.; Laubscher, R.F.; Dinaharan, I.; Murugan, N. Tensile strength prediction of dissimilar friction stir-welded AA6351–AA5083 using artificial neural network technique. J. Braz. Soc. Mech. Sci. Eng. 2016, 38, 1647–1657. [Google Scholar] [CrossRef]
  18. Shojaeefard, M.H.; Khalkhali, A.; Akbari, M.; Asadi, P. Investigation of friction stir welding tool parameters using FEM and neural network. Proc. Inst. Mech. Eng. Part L J. Mater. Des. Appl. 2015, 229, 209–217. [Google Scholar] [CrossRef]
  19. Manvatkar, V.D.; Arora, A.; De, A.; Debroy, T. Neural network models of peak temperature, torque, traverse force, bending stress and maximum shear stress during friction stir welding. Sci. Technol. Weld. Join. 2012, 17, 460–466. [Google Scholar] [CrossRef]
  20. Kamalvand, E.; Jabbari, A.; Sheykholeslami, M.R.; Mazdak, S.; Beygi, R.; Mohammadi, S. Effect of friction stir welding parameters on the deep drawing of tailor-welded blanks (TWBs). CIRP J. Manuf. Sci. Technol. 2021, 33, 91–99. [Google Scholar] [CrossRef]
  21. Sudhakaran, R.; Murugan, V.V.; Sivasakthivel, P.S.; Balaji, M. Prediction and optimization of depth of penetration for stainless steel gas tungsten arc welded plates using artificial neural networks and simulated annealing algorithm. Neural Comput. Appl. 2013, 22, 637–649. [Google Scholar] [CrossRef]
  22. Padmanaban, R.; Balusamy, V.; Saikrishna, V.; Niranthar, K.G. Simulated Annealing Based Parameter Optimization for Friction Stir Welding of Dissimilar Aluminum Alloys. Procedia Eng. 2014, 97, 864–870. [Google Scholar] [CrossRef] [Green Version]
  23. Joseph, J.; Muthukumaran, S. Optimization of pulsed current GTAW process parameters for sintered hot forged AISI 4135 P/M steel welds by simulated annealing and genetic algorithm. J. Mech. Sci. Technol. 2016, 30, 145–155. [Google Scholar] [CrossRef]
  24. Torabi, A.; Kolahan, F. Optimizing pulsed Nd:YAG laser beam welding process parameters to attain maximum ultimate tensile strength for thin AISI316L sheet using response surface methodology and simulated annealing algorithm. Opt. Laser Technol. 2018, 103, 300–310. [Google Scholar] [CrossRef]
  25. Vijayavel, P.; Balasubramanian, V. Effect of pin profile volume ratio on microstructure and tensile properties of friction stir processed aluminum based metal matrix composites. J. Alloys Compd. 2017, 729, 828–842. [Google Scholar] [CrossRef]
  26. Liu, F.C.; Hovanski, Y.; Miles, M.P.; Sorensen, C.D.; Nelson, T.W. A review of friction stir welding of steels: Tool, material flow, microstructure, and properties. J. Mater. Sci. Technol. 2018, 34, 39–57. [Google Scholar] [CrossRef]
  27. Manuel, N.; Silva, C.; da Costa, J.M.D.; Loureiro, A. Friction stir welding of T-joints in dissimilar materials: Influence of tool geometry and materials properties. Mater. Res. Express 2019, 6, 106528. [Google Scholar] [CrossRef]
  28. Li, B.; Zhang, S.; Fang, Y. Effect of edge hone radius on plowing-induced plastic deformation in hard milling: Analytical modeling and experimental validation. Int. J. Adv. Manuf. Technol. 2019, 105, 3017–3029. [Google Scholar] [CrossRef]
  29. Lu, X.; Jia, Z.; Wang, H.; Feng, Y.; Liang, S.Y. The effect of cutting parameters on micro-hardness and the prediction of Vickers hardness based on a response surface methodology for micro-milling Inconel 718. Measurement 2019, 140, 56–62. [Google Scholar] [CrossRef]
  30. Khodir, S.A.; Shibayanagi, T. Friction stir welding of dissimilar AA2024 and AA7075 aluminum alloys. Mater. Sci. Eng. B 2008, 148, 82–87. [Google Scholar] [CrossRef]
  31. Zhang, C.; Huang, G.; Cao, Y.; Zhu, Y.; Liu, Q. On the microstructure and mechanical properties of similar and dissimilar AA7075 and AA2024 friction stir welding joints: Effect of rotational speed. J. Manuf. Process. 2019, 37, 470–487. [Google Scholar] [CrossRef]
  32. Bertrand, R.; Robe, H.; Texier, D.; Zedan, Y.; Feulvarch, E.; Bocher, P. Analysis of AA2XXX/AA7XXX friction stir welds. J. Mater. Process. Technol. 2019, 271, 312–324. [Google Scholar] [CrossRef] [Green Version]
  33. Ibrahim, M.; Samuel, A.; Alkahtani, S.; Samuel, F. A novel solution heat treatment of 7075-type alloy. In Light Metals 2013; Springer: Berlin/Heidelberg, Germany, 2016; pp. 383–390. [Google Scholar] [CrossRef]
  34. Liang, M.; Chen, L.; Zhao, G.; Guo, Y. Effects of solution treatment on the microstructure and mechanical properties of naturally aged EN AW 2024 Al alloy sheet. J. Alloys Compd. 2020, 824, 153943. [Google Scholar] [CrossRef]
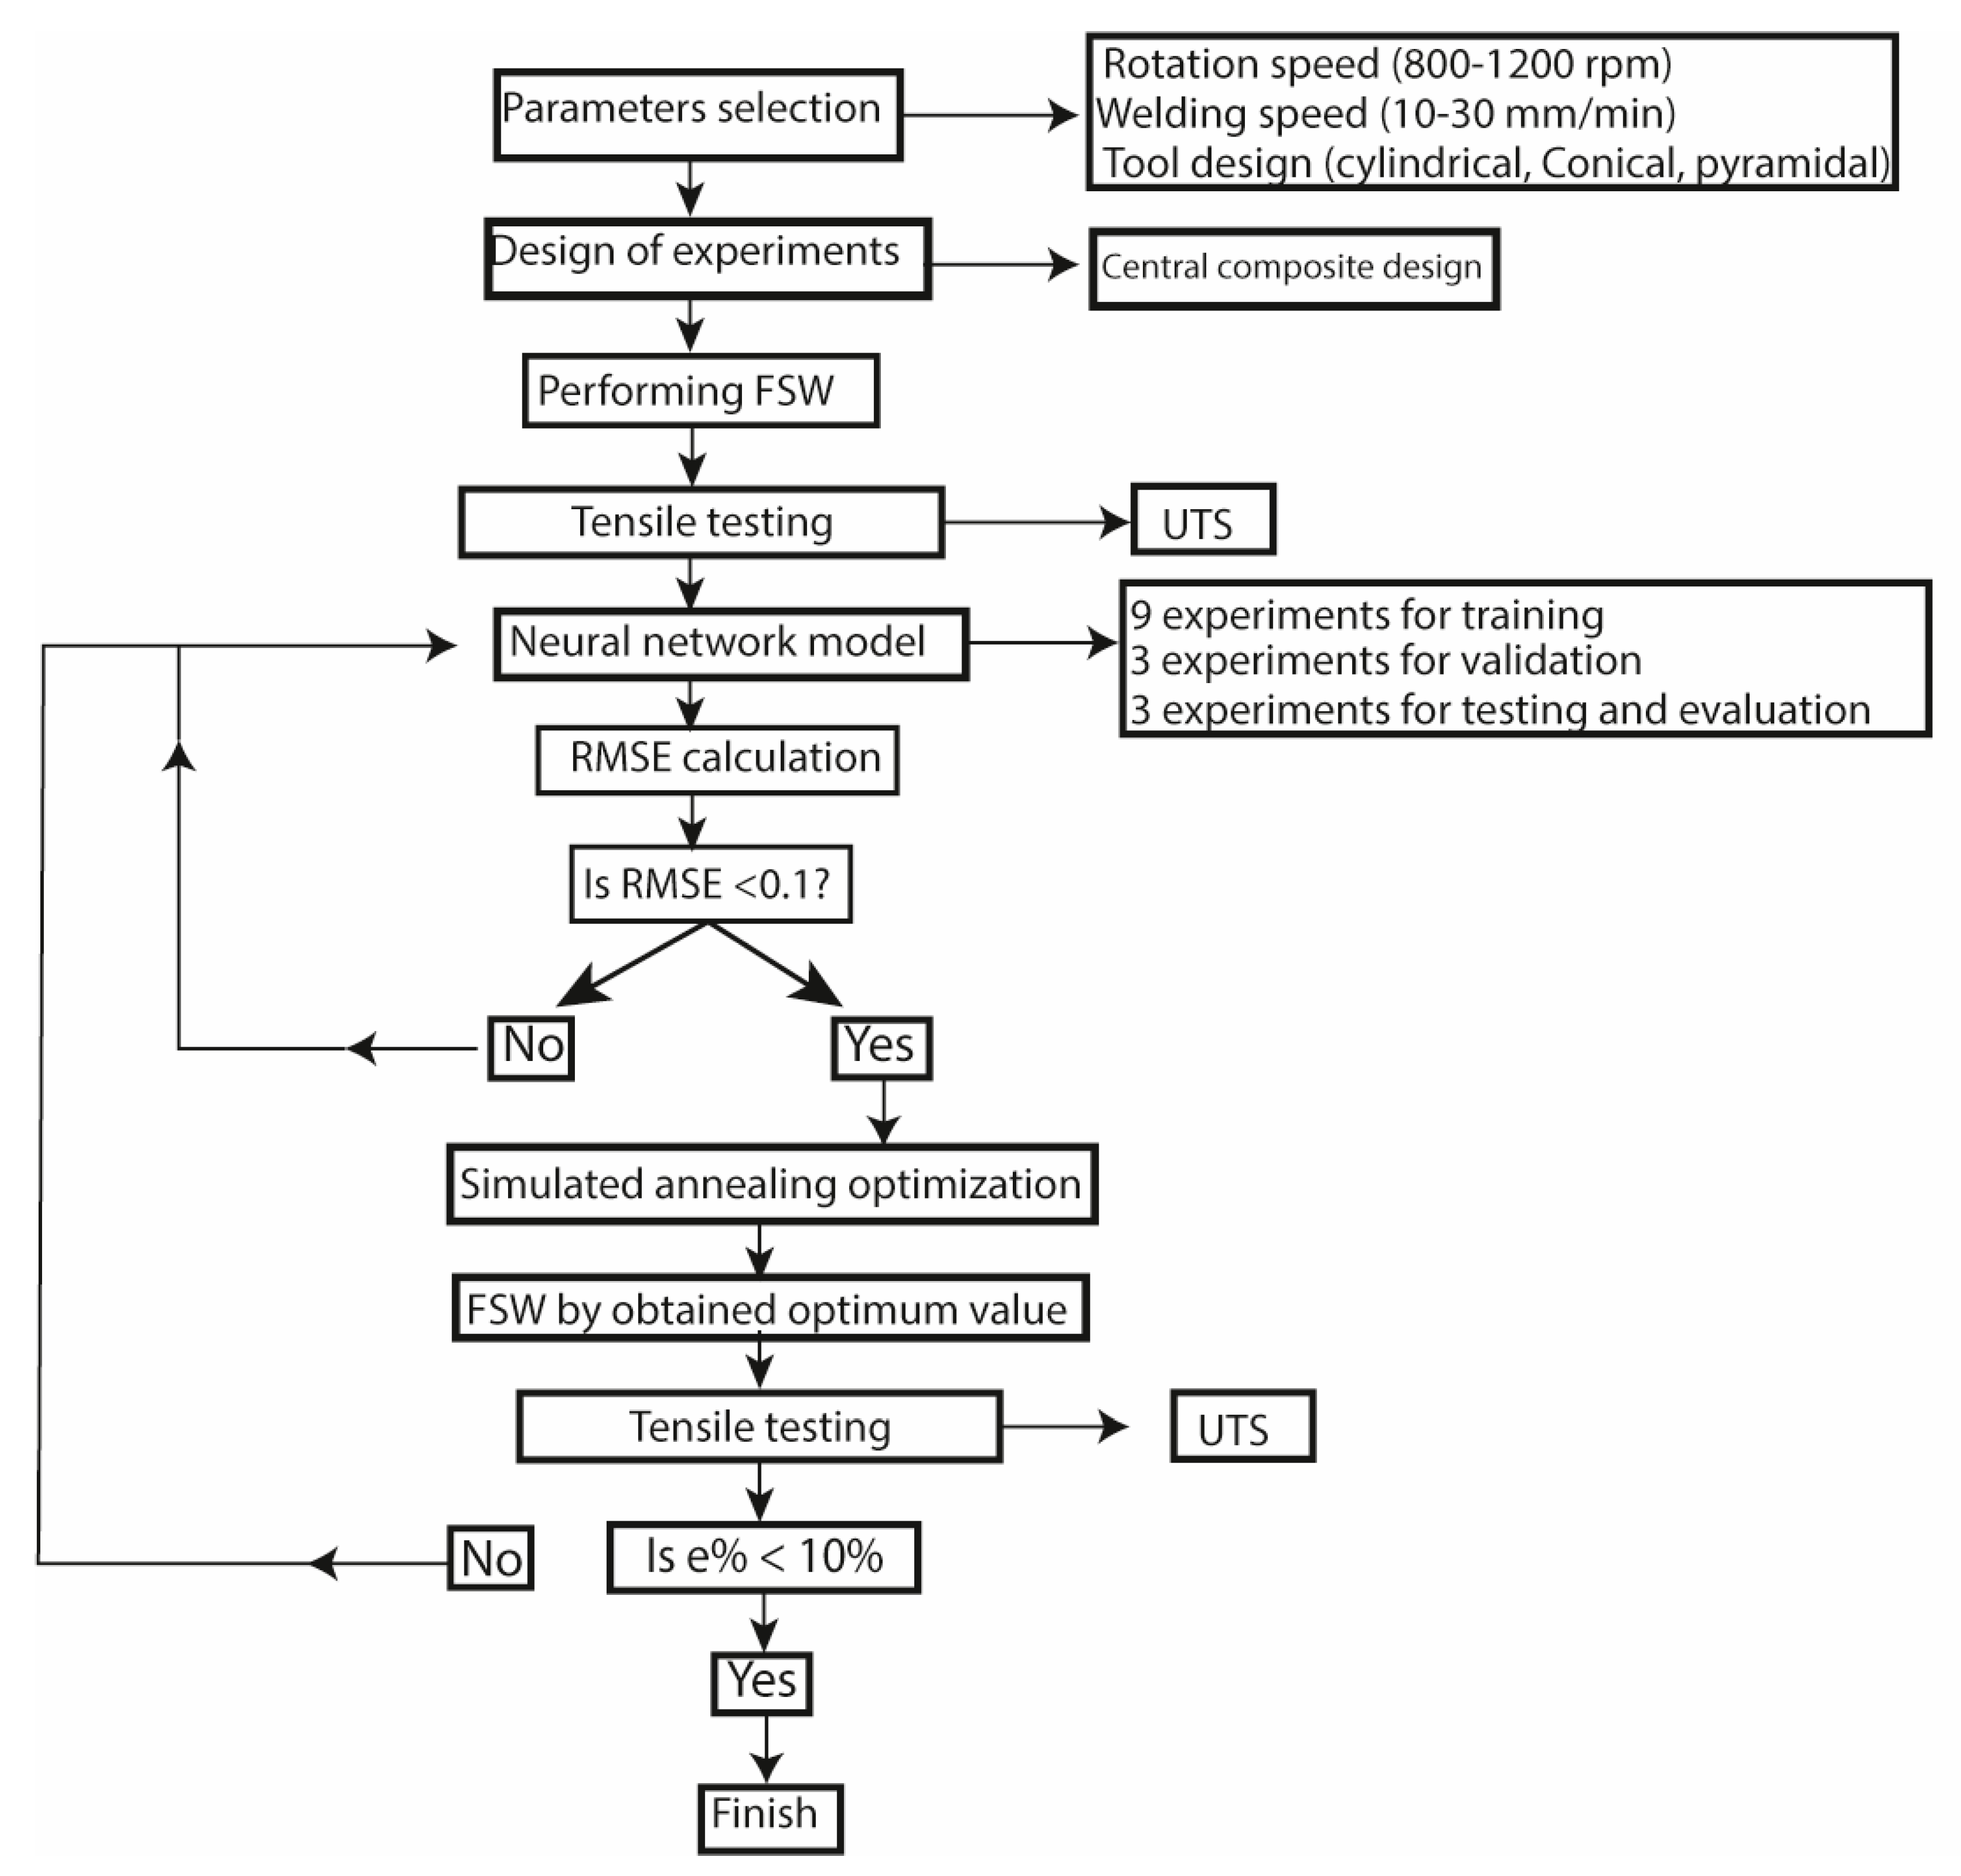
Figure 1. The flowchart of the procedure of the present study.
Lubricants 11 00059 g001
Figure 2. The pin geometries used for FSW of AA2024 to AA7075. (a) Pyramidal, (b) Conical, and (c) Cylindrical.
Lubricants 11 00059 g002
Figure 3. The FSW machine.
Lubricants 11 00059 g003
Figure 4. The ANN structure.
Lubricants 11 00059 g004
Figure 5. The effective surface area of each pin versus the distance from the bottom of the pin (Dimensions are in mm and mm2).
Lubricants 11 00059 g005
Figure 6. Stress-strain curves of the joints made by (a) pyramidal, (b) conical, and (c) cylindrical pins.
Lubricants 11 00059 g006
Figure 7. The output values of the model versus the target values for (a) training, (b) validation, (c) test, and (d) all data.
Lubricants 11 00059 g007
Figure 8. The interaction plot for UTS.
Lubricants 11 00059 g008
Figure 9. Macrographs of the welds made by (a) pyramidal (experiment 2), (b) conical (experiment 10), and (c) circular (experiment 6) pins. The dashed white lines indicate the border of the stir zone. The red line shows the geometry of the pin.
Lubricants 11 00059 g009
Figure 10. The macrographs of the welds are made according to Table 4. Weld number 4 was unsuccessful because the edges of the pyramid pin cut rather than deform the materials.
Lubricants 11 00059 g010
Figure 11. Microstructure of the stir zones of samples (a) 3 and (b) 13, showing the banding structure which exists in the specimens joined by the pyramidal tool.
Lubricants 11 00059 g011
Figure 12. BSE SEM images of the (a) stir zone, (b,c) banding structure, and (d) AA7075 in the stir zone of experiment 3 (made by the pyramidal tool).
Lubricants 11 00059 g012
Figure 13. Color elemental map of the stir zone of experiment 3.
Lubricants 11 00059 g013
Figure 14. (a) The fractures tensile specimen of specimen 13. (b) The fracture path imposed on the schematic of the joint microstructure. (c) SEM image of the fracture surface. (d) The defects in the banding structure. (e) The macro image of the weld zone.
Lubricants 11 00059 g014
Figure 15. (a) BSE SEM image of the stir zone of specimen 7. (b) Higher magnification image of the joint boundary showing the coarse precipitates in AA2024. (c) Higher magnification image of AA7075. (d) EDS analysis of the precipitates in AA2024.
Lubricants 11 00059 g015
Figure 16. (a) The tensile specimen and (b) the schematic of the fracture path. (c) The fracture path imposed on the microstructure of experiment 7 represents the welds made by the cylindrical tool.
Lubricants 11 00059 g016
Figure 17. (a) The tensile specimen of the optimized joint. (b) The schematic of the fractured joint. (c,d) SE and BSE SEM images of the fracture surface. (e) EDS analysis of the precipitate. (f) The macrograph of the weld.
Lubricants 11 00059 g017
Figure 18. (a,b) SE and BSE image of the fracture surface of specimen 3 failed through AA7075 in the stir zone. (c,d) SE and BSE images of the fracture surface of specimen 8 failed through AA2024 in the stir zone.
Lubricants 11 00059 g018
Figure 19. (a) The stress-strain curves of the base materials and the welded specimen obtained at optimum conditions. (b) The failed tensile specimen of the optimum specimen.
Lubricants 11 00059 g019
Figure 20. 3D plots of UTS versus welding speed and rotation speed when using (a) the pyramidal, (b) the conical, and (c) the cylindrical tools.
Lubricants 11 00059 g020
Table 1. The chemical composition and UTS of the sheets used for FSW.
Aluminum SeriesChemical Composition (wt%)UTS(MPa)
Cu MgZnSiAl
AA20244.441.550.070.09493.1405.7
AA70751.62.75.770.08889.4527.49
Table 2. The parameters used for FSW.
Weld ParametersLower LimitUpper Limit
Welding speed (mm/min)1050
Rotation speed (RPM)8001200
Tool geometryCylindricalConicalPyramidal
Table 3. The dynamic volume of each pin (the values are rounded by 0.5).
PinPyramidalConicalCircular
Effective volume (mm3)251510
Calculation of the volume 19   +   14   ×   1.5 2 13   +   7   ×   1.5 2 7   ×   1.5
Table 4. The results of the experiments.
Experiment NumberData SetWelding Speed (mm/min)Tool Rotation Speed (rpm)ToolUTS (MPa)Yield Strength (MPa)ElongationDefect Type
1Training10800Pyramidal257.35351.96Root, Banding
2Training101200Pyramidal100-0.25LOP *
3Training50800Pyramidal305.27502.84Root, Banding
4Training501200Pyramidal80-0.2LOP
5Training10800Cylindrical237.34462.4Root
6Training101200Cylindrical346.81504.2-
7Training50800Cylindrical2851220.8Root
8Training501200Cylindrical388.212604.96-
9Training30800Conical313.151801.4Root
10Training301200Conical354.811804.32-
11Validation101000Conical320.571757.4-
12Validation501000Conical311.911952.08-
13Testing301000Pyramidal334.72201.56Banding
14Testing301000Cylindrical3582102.54Root
15Testing301000Conical363.141956.32-
* Lack of plasticity.
Table 5. The optimum parameters and the resultant UTS obtained by the SA algorithm.
Welding SpeedTool RotationEffective Volume of the PinPredicted UTSExperimental UTS
50 mm/min1110 rpm10 mm3420 MPa395 MPa
Disclaimer/Publisher’s Note: The statements, opinions and data contained in all publications are solely those of the individual author(s) and contributor(s) and not of MDPI and/or the editor(s). MDPI and/or the editor(s) disclaim responsibility for any injury to people or property resulting from any ideas, methods, instructions or products referred to in the content.