Article

High-Pressure Thermophysical Properties of Eight Paraffinic, Naphthenic, Polyalphaolefin and Ester Base Oils

by
Antía Villamayor
1,2,
María J. G. Guimarey
1,3,
Fátima Mariño
1,
José M. Liñeira del Río
1,4,
Francisco Urquiola
5,
Raquel Urchegui
5,
María J. P. Comuñas
1,* and
Josefa Fernández
1
1
Laboratory of Thermophysical and Tribological Properties, NaFoMat Group, Department of Applied Physics, Faculty of Physics and Institute of Materials (iMATUS), University of Santiago de Compostela, 15782 Santiago de Compostela, Spain
2
Plasma Coating Technologies Unit, Tekniker, Basque Research and Technology Alliance (BRTA), c/Iñaki Goenaga 5, 20600 Eibar, Spain
3
Department of Design and Engineering, Faculty of Science & Technology, Bournemouth University, Talbot Campus, Poole BH12 5BB, UK
4
INEGI, Universidade do Porto, Faculdade de Engenharia, Rua Dr. Roberto Frias s/n, 4200-465 Porto, Portugal
5
Verkol S.A.U. Quaker Houghton, Polígono Zalain, 23 I, 31780 Bera Navarra, Spain
*
Author to whom correspondence should be addressed.
Lubricants 2023, 11(2), 55; https://doi.org/10.3390/lubricants11020055
Submission received: 10 January 2023 / Revised: 24 January 2023 / Accepted: 28 January 2023 / Published: 31 January 2023
(This article belongs to the Special Issue Rheological Characteristics of Lubricants and Soft Tribo-Materials)

Abstract

:
In this work, the thermophysical properties of four mineral (paraffinic and naphthenic) and four synthetic (polyalphaolefin and ester) base oils are measured. Knowledge of these properties is of vital importance for the correct and optimal formulation and design of lubricants, and for the development of equations of state and transport models that adequately represent their properties. Density, isothermal compressibility, thermal expansion coefficient, dynamic viscosity, pressure–viscosity coefficient, and contact angle were determined. To carry out this work, a pρT apparatus, a rotational viscometer, a falling body viscometer, and a contact angle analyzer were used. Highest densities were found for the polyalphaolefin and ester synthetic oils, increasing around 5% from 0.1 to 100 MPa for all the base oils. The density of the synthetic oils is less dependent on temperature changes. For the expansivity and compressibility of all the base oils, decreases with pressure of up to 35% and 45% were observed. From the contact angle measurements, it was observed that base oils with a higher viscosity grade have a worse wetting. The greatest effect of pressure on the dynamic viscosity was obtained for the naphthenic mineral oil and the lowest effect for the polyalphaolefin oil. Paraffinic and naphthenic oils present the highest universal pressure–viscosity coefficients.

1. Introduction

In accordance with the demands of society, modern development trends in the industry have shifted towards the use of biodegradable and low-toxicity synthetic lubricants, compared with petroleum-derived lubricants, in addition to lower emissions of organic volatile compounds [1,2]. Lubricants have a great impact on the energy efficiency, reliability, average life, and noise levels of industrial machinery [3]. In lubricant formulation, the selection of the base oils is of utmost importance [4]. Mineral-based oils are usually divided into paraffinic (PARA) and naphthenic (NAPH) depending on the chemical structure of the predominant component [5]. Synthetic base oils, such as polyalphaolefins (PAOs) and esters (ESTERs), are obtained by chemical synthesis, which makes it possible to achieve lubricants with very specific characteristics. Synthetic oils have another advantage over the former, i.e., they improve machine protection and maintain the stability of their properties for a longer period. Moreover, the low toxicity and excellent biodegradability of the ester base oils make them highly interesting from an environmental point of view [6].
For industrial applications, the knowledge of the lubricating properties and the thermophysical and tribological characterization of base oils of different nature (mineral, synthetic and vegetable oils) is essential. Knowledge of the density at high pressures is essential to determine the dynamic viscosity as a function of pressure and, subsequently, the pressure–viscosity coefficient and film thickness, parameters that are directly related to the proper selection of a lubricant for each application. Contact angle measurements (θ) are used to evaluate the tendency of the lubricants to spread on a solid surface (wetting ability), which is a key factor for many industrial processes involving two different phases and a very important factor affecting their lubrication performance [7]. The affinity of the lubricant to the surrounding surfaces is a system variable and, therefore, depends not only on the lubricant, but also on the contact surfaces. Properties such as foaming depend on the viscosity and surface tension of the lubricant [8]. Thus, it is crucial to have databases of the thermodynamic and transport properties, as well as equations of state and models that adequately represent these properties. Liquid lubricants are generally considered incompressible, even though their compressibility is an important property that varies with changes in temperature and pressure and must be taken into account in various cases, such as heavily loaded lubricated contacts or hydraulic fluid applications [9]. In hydraulic systems operating at high pressure, oils with low compressibility are required to transmit power efficiently, as low compressibility results in a fast response time, high-pressure transmission speed, and low power loss. However, a certain amount of compressibility is desirable because it dampens the pressure peaks caused by switching and thus provides a smoother operation [10]. For this reason, knowing the volumetric behavior of base oils at high pressures allows the evaluation of their degree of compressibility and thus helps in the development of more efficient lubricants for a particular application.
We have found in the literature several works studying the thermophysical and tribological properties of mineral and synthetic oils. Gold et al. [11] studied the viscosity–pressure–temperature behavior of several gear oils and hydraulic oils up to 0.8 GPa. Fernández Rico et al. [12] reported the contact angle of mineral and synthetic oils, showing that mineral oil has a higher value than that of synthetic oil. Grandelli et al. [13] determined the high-pressure volumetric properties of three commonly used poly(α-olefin) base oils, PAO 2, PAO 4, and PAO 8, using a special variable volume view cell, which permits continuous pressure scan and volume measurements. These authors [13] determined the densities at several temperatures and pressures up to 40 MPa. Dickmann et al. [14] carried out a comprehensive evaluation of the volumetric and viscous properties of various mineral and synthetic base oils. These authors used a variable volume display cell to obtain densities and a high-pressure rotational viscometer to obtain viscosities at shear rates between 480 and 1270 s−1. Wang et al. [15] determined the pressure–viscosity coefficients of several mineral and synthetic oils with the aim of improving the rolling fatigue lives. Recently, Teh et al. [16] published a review on the tribological performance of non-water miscible lubricants, such as vegetable oil, blend oil, synthetic oil, and ionic liquids.
In order to analyze the effects of the chemical nature and of the viscosity grade on the thermophysical properties, the present work provides high-accurate experimental data on density, isothermal compressibility, thermal expansion coefficient, and viscosity over a temperature range from 278.15 to 373.15 K at a high pressure (up to 100 MPa for density and 150 MPa for viscosity) as well as contact angle values at atmospheric pressure of eight base lubricants. The thermophysical properties of the synthetic oils (polyalphaolefin and ester) are compared with those obtained for the mineral oils (paraffinic and naphthenic).

2. Experimental Procedure and Methodology

The base oils analyzed in this work were four mineral base oils and four synthetic base oils: two paraffinic oils (PARA#1 and PARA#2), two naphthenic oils (NAPH#1 and NAPH#2), two ester oils (ESTER#1 and ESTER#2), and two polyalphaolefin oils (PAO4 and PAO16). These lubricants were kindly provided by Verkol Lubricantes. PARA#1 and PARA#2 are paraffinic mineral solvent neutral classified as API Group I. NAPH#1 is a mid-viscosity hydrotreated naphthenic base oil and NAPH#2 is a high viscosity hydrotreated naphthenic base. ESTER#1 is an adipic acid diester of long chain length alcohols and ESTER#2 is a mixture of adipic acid diester and pentaerythritol ester. NAPH#1, NAPH#2, ESTER#1 and ESTER#2 are categorized as API Group V. PAO4 is a low viscosity isoparaffinic polyalphaolefin and PAO16 is a mixture of high and low viscosity isoparaffinic polyalphaolefins. Both PAOs are classed as API Group IV. The eight base oils can be classified in two groups depending on their viscosity grade. Thus, the oils with kinematic viscosity around 20 mm2 s−1, at 313.15 K and 0.1 MPa (low-viscosity grade, ISO VG22) were PARA#1, NAPH#1, ESTER#1, and PAO4, and those with kinematic viscosity, at 313.15 K and 0.1 MPa, around 100 mm2 s−1 (high-viscosity grade, ISO VG100) were PARA#2, NAPH#2, ESTER#2, and PAO16.
Densities (ρ) and viscosities (ν and η) at atmospheric pressure were measured with the expanded uncertainties of 5 · 10−4 g cm−3 and 1%, respectively, by using an Anton Paar Stabinger SVM3000 rotational viscometer (Anton Paar, Graz, Austria). A vibrating tube densimeter (HPM Anton Paar (Anton Paar, Graz, Austria)) was used to measure densities at high pressures with expanded uncertainties lower than 5 · 10−3 g cm−3. Dynamic viscosities (η) as a function of pressure were obtained with an uncertainty of 3.5% with a falling body viscometer. Contact angles (θ) were measured using the sessile drop method through a Phoenix MT(A) contact angle analyzer with an expanded uncertainty of 1º. Other details regarding the experimental setups of density [17], viscosity [18], and contact angle [19] have been further reported in previous articles.
For industry applications, it is useful to have a correlation that permits the interpolation of the density of these oils at temperatures and pressures different than those studied in this paper. For this reason, the density of each oil, as a function of both the temperature and the pressure, were correlated trough the Tammann–Tait empirical equation of state:
ρ ( T , p ) = A 0 + A 1 T + A 2 T 2 + A 3 T 3 1 C l n ( B 0 + B 1 T + B 2 T 2 + p B 0 + B 1 T + B 2 T 2 + 0.1   MPa )
Using basic thermodynamic relations, it is possible to obtain the thermal expansion coefficient ( α p ) and isothermal compressibility ( κ T ) from density data at different temperatures and pressures. Generally, these properties are used to provide more specific information on the dependence of fluid density on temperature and pressure. The thermal expansion coefficient describes the effect of the temperature on the density at a constant pressure, and is defined as follows:
α p = 1 V ( V T ) P = 1 ρ   ( ρ T ) p
where α p is the volumetric thermal expansion coefficient, ρ the density, V the volume, T the temperature, and p the pressure. If Equation (1) is used to represent the surface ρ (T, p) for each base oil, the isobaric thermal expansivity can be obtained as follows:
α p ( p , T ) = A 1 + 2 A 2 T ρ 0 ( T , 0.1 MPa ) C ( 0.1 MPa p ) ( B ( T ) + p ) ( B ( T ) + 0.1 MPa ) B 1 + 2 B 2 T [ 1 C   l n ( B ( T ) + p B ( T ) + 0.1 MPa ) ]  
Changes in volume that occur with changes in pressure are often characterized using the isothermal compressibility ( κ T ), which is defined as:
κ T = 1 V ( V P ) T = 1 ρ   ( ρ P   ) T
If Equation (1) is used to represent the surface ρ (T, p) for each base oil, the isothermal compressibility can be obtained as follows:
T ( p , T ) = C ( B 0 + B 1 T + B 2 T 2 + p ) [ 1 C   l n ( B 0 + B 1 T + B 2 T 2 + p B 0 + B 1 T + B 2 T 2 + 0.1   MPa ) ]
The estimated uncertainty for the thermal expansion coefficient and the isothermal compressibility are around 0.3 · 10−4 K−1 and 0.06 · 10−4 MPa−1, respectively. For each base oils, the experimental dynamic viscosity data as a function of pressure, η(p), were fitted at each temperature to the following equation:
η ( p ) = η 0 e x p [ A l n ( B + p B + 0.1   MPa ) ]
where η0 is the dynamic viscosity value obtained with the Anton Paar Stabinger viscometer at 0.1 MPa at each temperature) and A, B, and C are adjustable parameters. From Equation (6), it is possible to calculate the pressure–viscosity coefficient (α), which is another relevant property in lubrication [20,21,22,23]. In the present work, the procedure proposed by Bair et al. [23] was used to determine the pressure–viscosity coefficient using these equations:
α = α f i l m = 1 e x p ( 3 ) p i v ( 3 / α )
where p i v the isoviscous pressure given by:
p i v = 0 p η ( p = 0 ) d p η ( p )
and α is the reciprocal asymptotic isoviscous pressure coefficient:
α = 1 p i v ( ) = [ 0 ` η ( p = 0 ) d p η ( p ) ] 1
The pressure–viscosity coefficient for the eight base oils was also estimated from the following equation proposed by Gold et al. [11], which relates this coefficient with the kinematic viscosity, v, at 0.1 MPa:
α G o l d = s ν t
Gold et al. [11] used a database of 28 lubricants, including mineral, synthetic, and vegetable oils, to determine s and t values for six lubricant types. These parameters are valid from 278.15 to 353.15 K. There are several studies [23,24] concerning the relation between the pressure–viscosity coefficient (α) and the central film thickness (h0). According to the American Gear Manufacturers Association (AGMA), under full-film elastohydrodynamic lubrication at speed U, the central film thickness is given by:
h 0 = f   η 0 0.69 α 0.56 U 0.69
where the parameter f is a function of the surface geometry, the applied load, and the elastic parameters of the rolling elements, and η0 is the dynamic viscosity at atmospheric pressure. In Equation (11), for α, we chose the universal pressure–viscosity coefficient (αfilm) obtained from Equation (7), as in a previous work [25]. From Equation (11), it can be concluded that, at a fixed temperature, comparing fluids with the same viscosity, the base oils that provide a better protection (thicker film) at extreme pressures are those with a higher pressure–viscosity coefficient. Nevertheless, to ensure a better efficiency, other factors should be considered, such as the reduction in wear, friction, sub-surface stress and pressure peaks [26,27,28]. Moreover, that the film thickness changes as little as possible with the temperature is desirable.

3. Results and Discussion

Table 1 reports the densities at 0.1 MPa from 278.15 to 373.15 K for the eight oils measured with the SVM3000 apparatus (Anton Paar, Graz, Austria). As can be seen in 
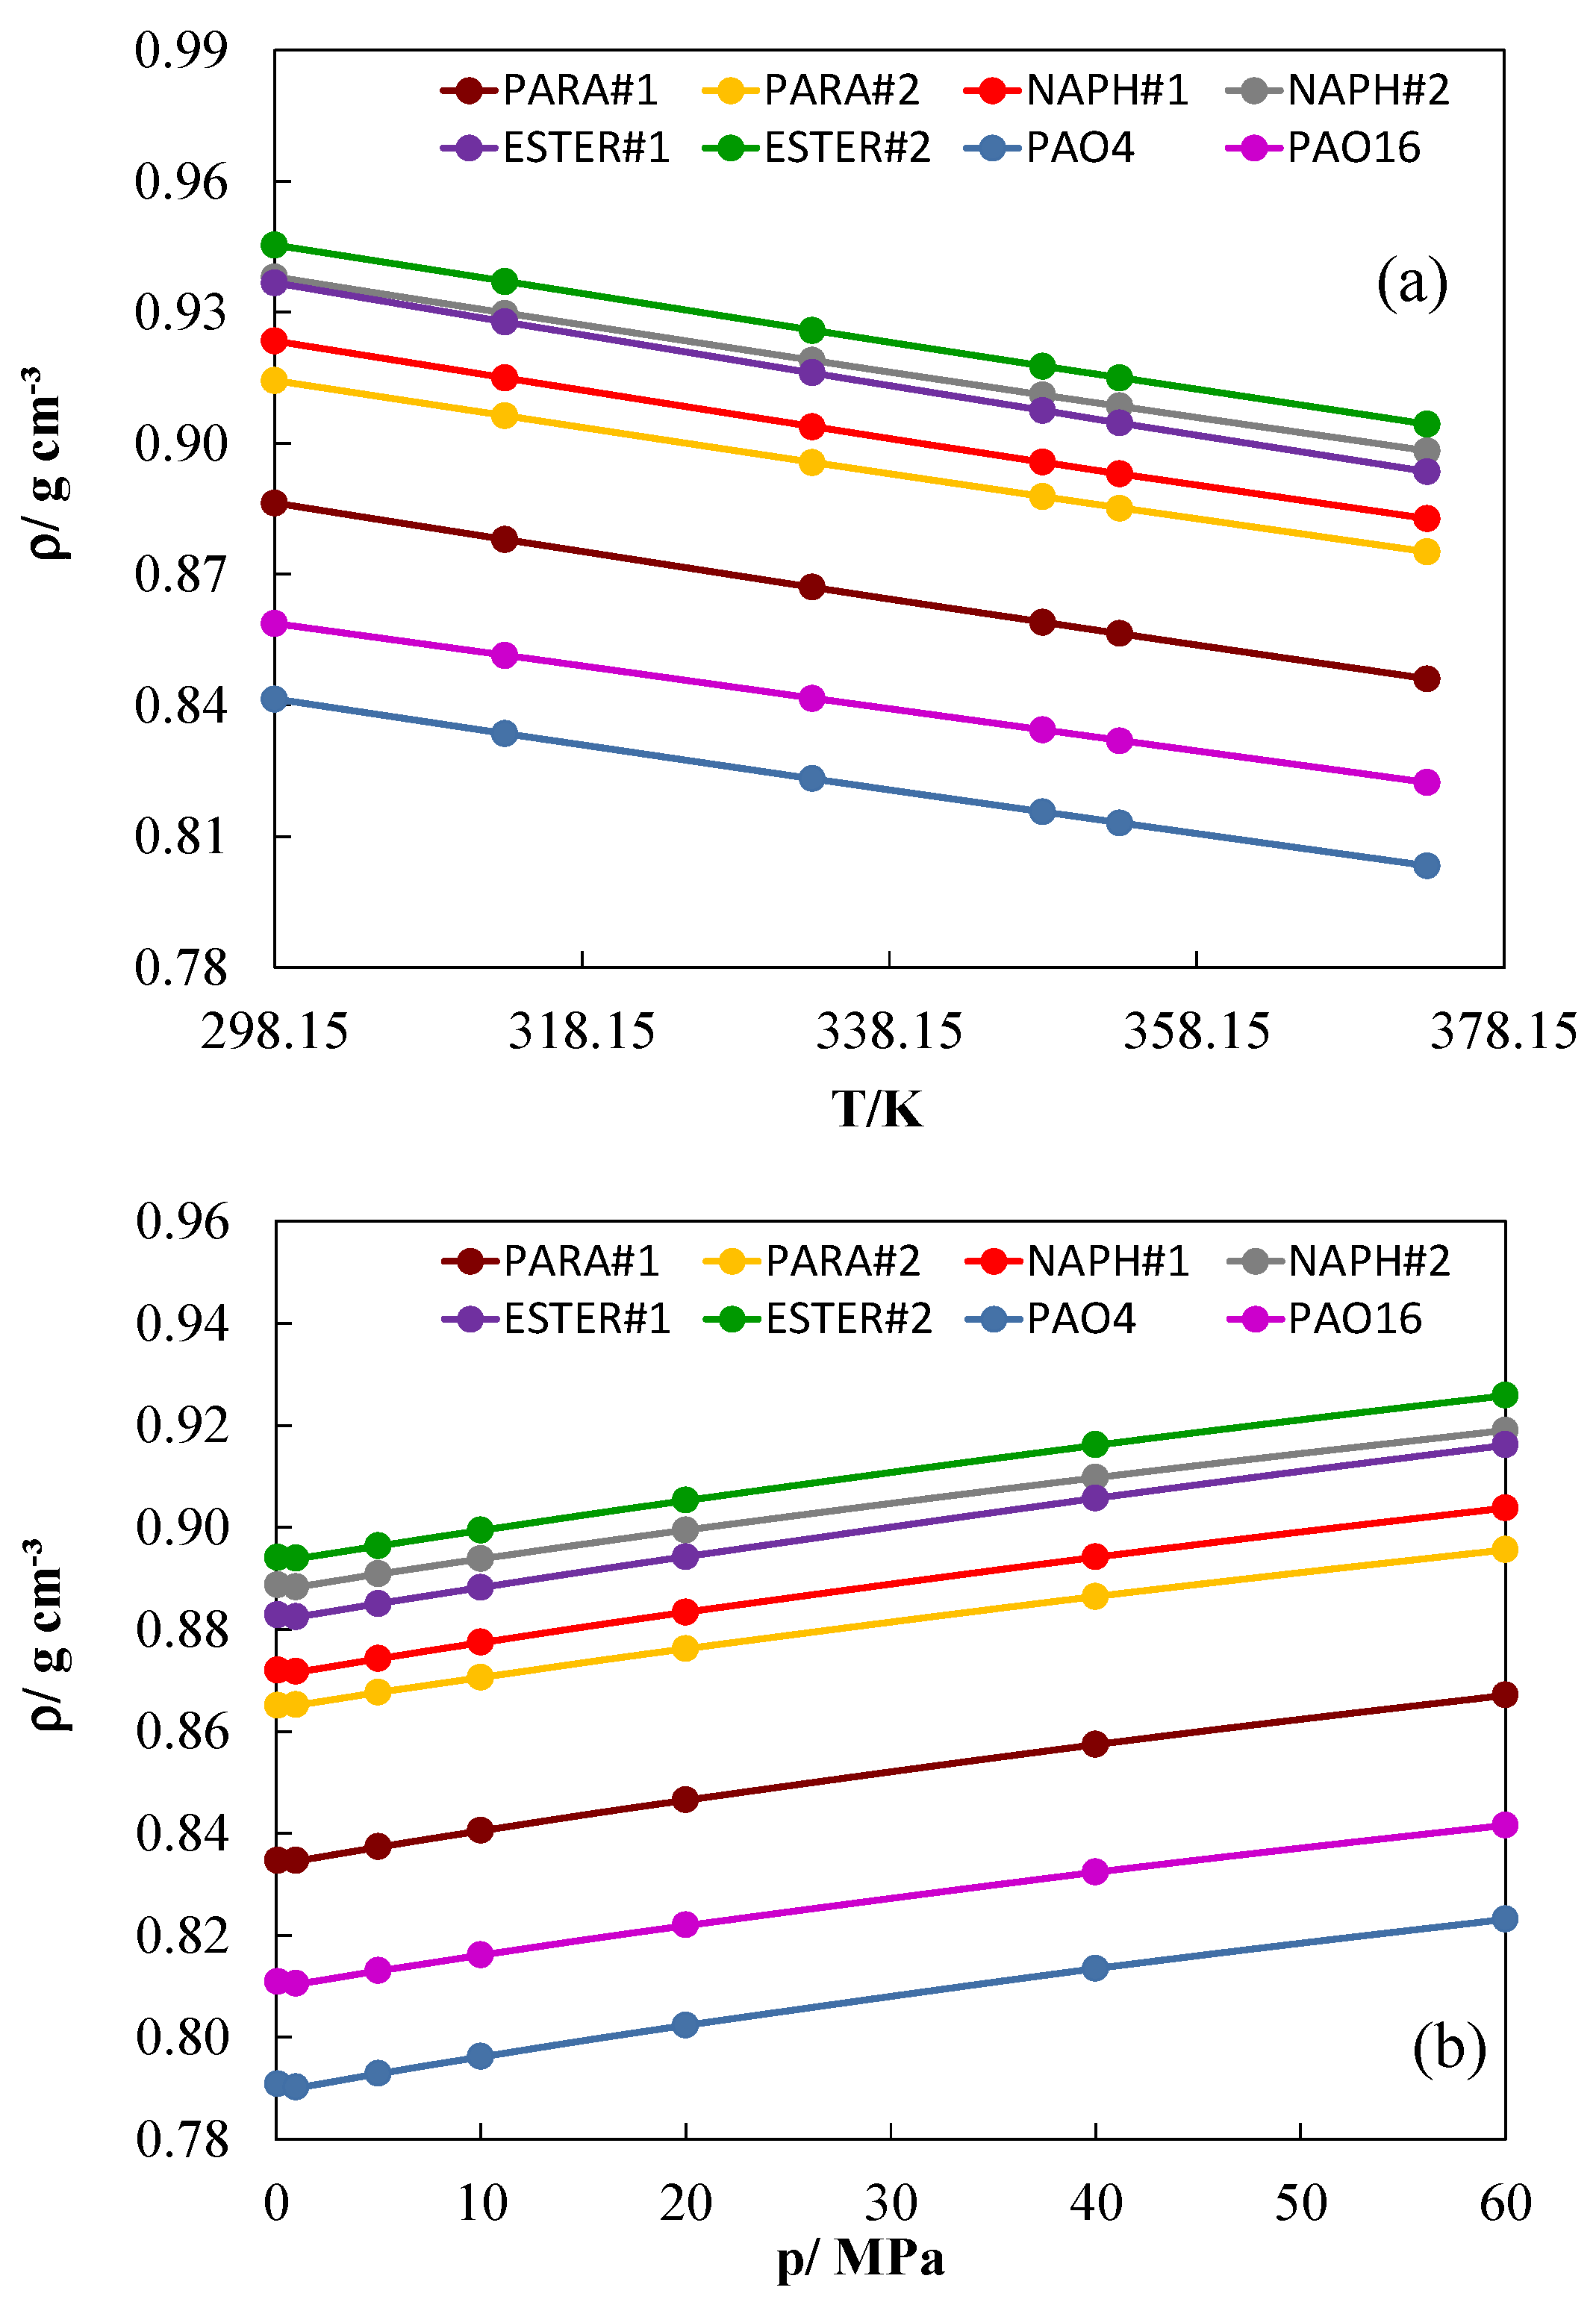
Figure 1, the densities of all eight base oils decrease linearly with increasing temperature at atmospheric pressure. The following sequence is observed for the density at atmospheric pressure for both groups, the low-viscosity-grade base oils (NAPH#1, PARA#1, PAO4, and ESTER#1) and the high-viscosity-grade base oils (NAPH#2, PARA#2, PAO16, and ESTER#2): ESTER> NAPH> PARA> PAO. Thus, at atmospheric pressure, the polyalphaolefin oils (PAO4 and PAO16) have the lowest density values, followed by the mineral base oil PARA#1. On the contrary, esters are the densest fluids in each group. At 0.1 MPa, the decrease in density from 278.15 to 373.15 K is around 7% for all the base oils.
The experimental results of the densities at high pressures for the mineral and synthetic base oils are reported in Table 2 at a temperature range from 298.15 to 373.15 K and at pressures up to 100 MPa. The density values measured with the pρT apparatus at 0.1 MPa for the eight base oils were compared with those obtained with SVM3000 Stabinger apparatus over the temperature interval from 298.15 to 373.15 K. Relative deviations between 0.03% and 0.12% for the temperature of 298.15 K and from 0.01% to 0.08% for the highest temperature, 373.15 K, were found. These good results (very-low relative deviations between both apparatuses) are also a way to check and confirm the reliability of the pρT apparatus. The density of the eight base oils varies from 0.7646 to 0.9600 g cm−3 during the entirety of the pressure and the temperature interval. In Figure 2a, the density of all the base oils was plotted at a fixed pressure (60 MPa) against the temperature. This figure can be compared with Figure 1, where the data obtained with the SVM3000 apparatus at a low pressure (0.1 MPa) are also plotted as a function of the temperature. The same trend with temperature was observed for all the base oils over both isobars (0.1 and 60 MPa). It was found that, at a fixed temperature, the ESTER#2 oil has the highest densities in the entire pressure range; so, for example, at 333.15 K, the density of this oil changes from 0.8934 g cm−3 at 0.1 MPa to 0.9422 g cm−3 at 100 MPa. On the contrary, PAO4 has the lowest densities, ranging from 0.7896 g cm−3 at 0.1 MPa to 0.8400 g cm−3 at 100 MPa at the same temperature. For all the temperatures and pressures, the densities of the polyalphaolefins are around 11% (PAO4) and 9% (PAO16) lower than those of ESTER#2. The other synthetic oil (ESTER#1) has densities slightly lower (around 1%) than those of ESTER#2. Concerning mineral oils, naphthenic oils have higher densities than paraffinic oils. In Figure 2b, the dependence of the density with pressure is plotted at 333.15 K for the eight oils. Densities at 100 MPa are around 5% higher than those at 0.1 MPa for all the base oils for all the isotherms. This increase in density due to pressure must be considered in the design of the machinery that works under high loads.
The coefficients Ai (i = 0, 1, 2) of Equation (1) were determined for each base oil in a preliminary fit of the density at 0.1 MPa as a function of the temperature. The coefficients Bj (j = 0, 1, 2) and C were fitted to the density measurements, at pressures different than 0.1 MPa, using the Levenberg–Marquardt algorithm. The parameter values are presented in Table 3. Comparing the experimental density data and those obtained from Equation (1), we can observe that yield standard deviations (σ) are lower than 6.5 · 10−4 g cm−3, which is a measure of the dispersion of the data. The σ values for all the oils are lower than the estimated experimental uncertainty (5 · 10−3 g cm−3). As an example, 
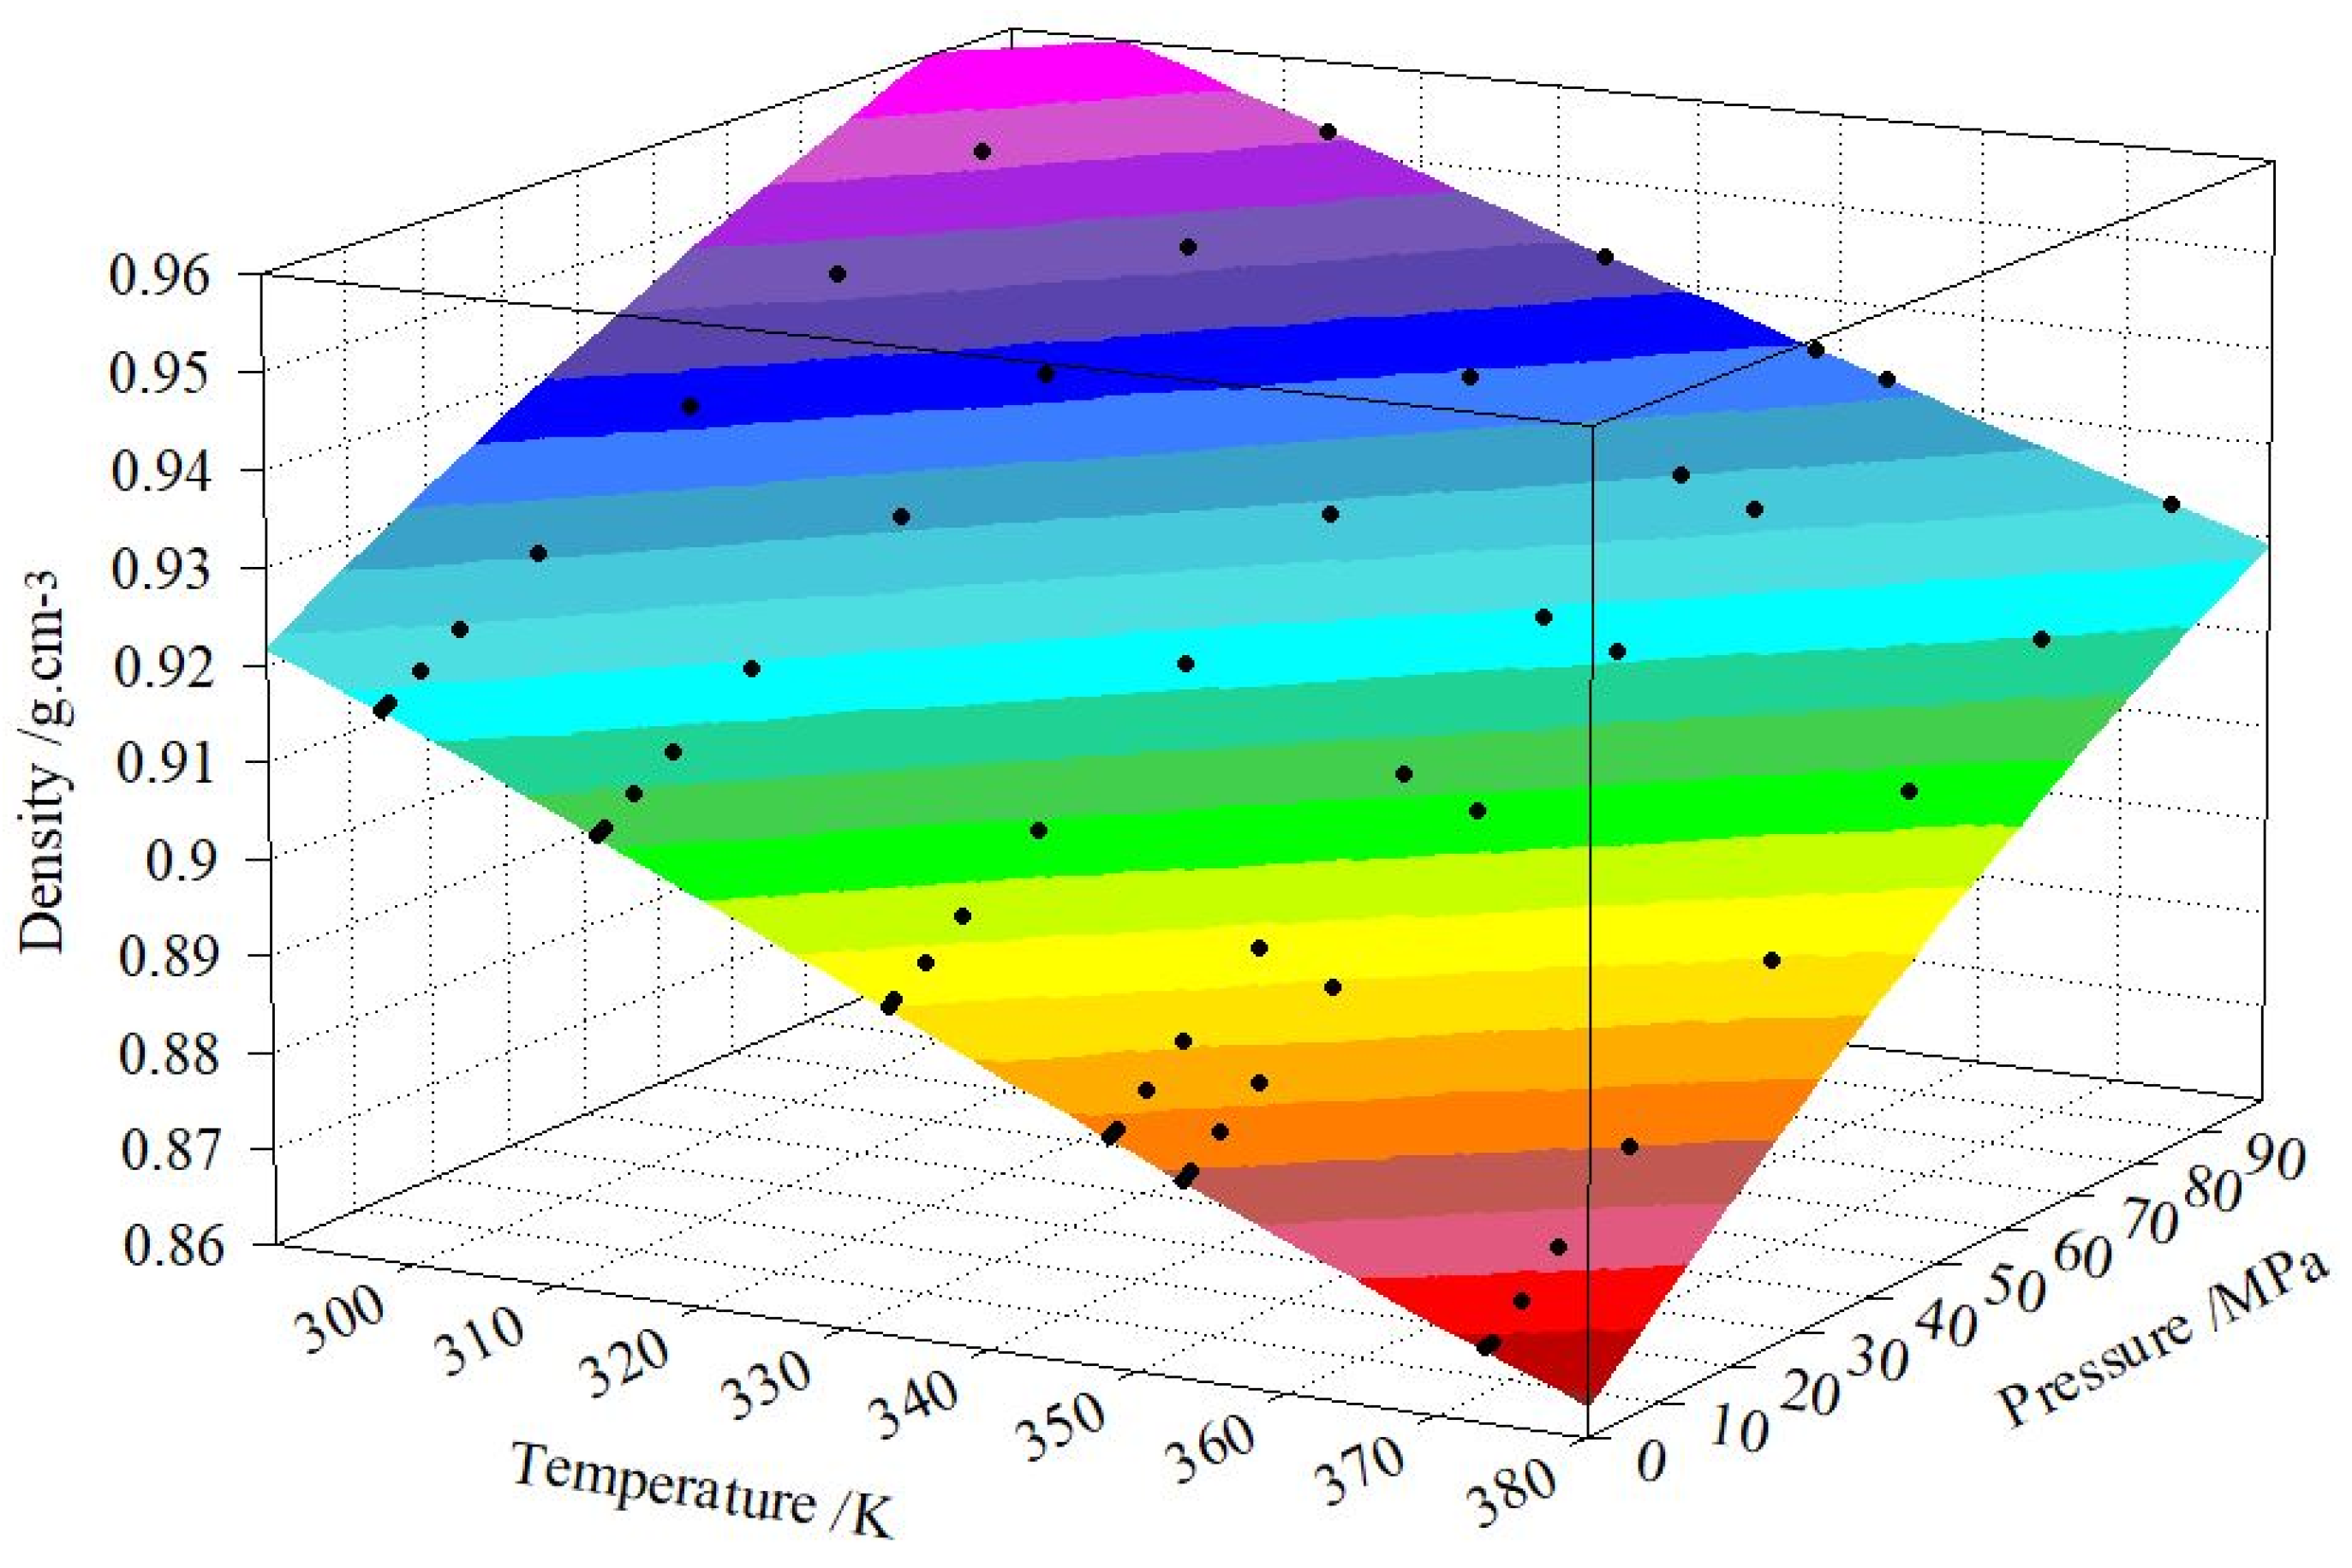
Figure 3 shows, for NAPH#2, the ρ (T,p) surface obtained with Equation (1) together with the experimental data measured with the HPM densimeter.
The isobaric thermal expansivities and the isothermal compressibilities obtained for the eight base oils through Equations (3) and (5) and the values of coefficients Ai, Bi, and C from Table 3 are summarized in Table 4 and 
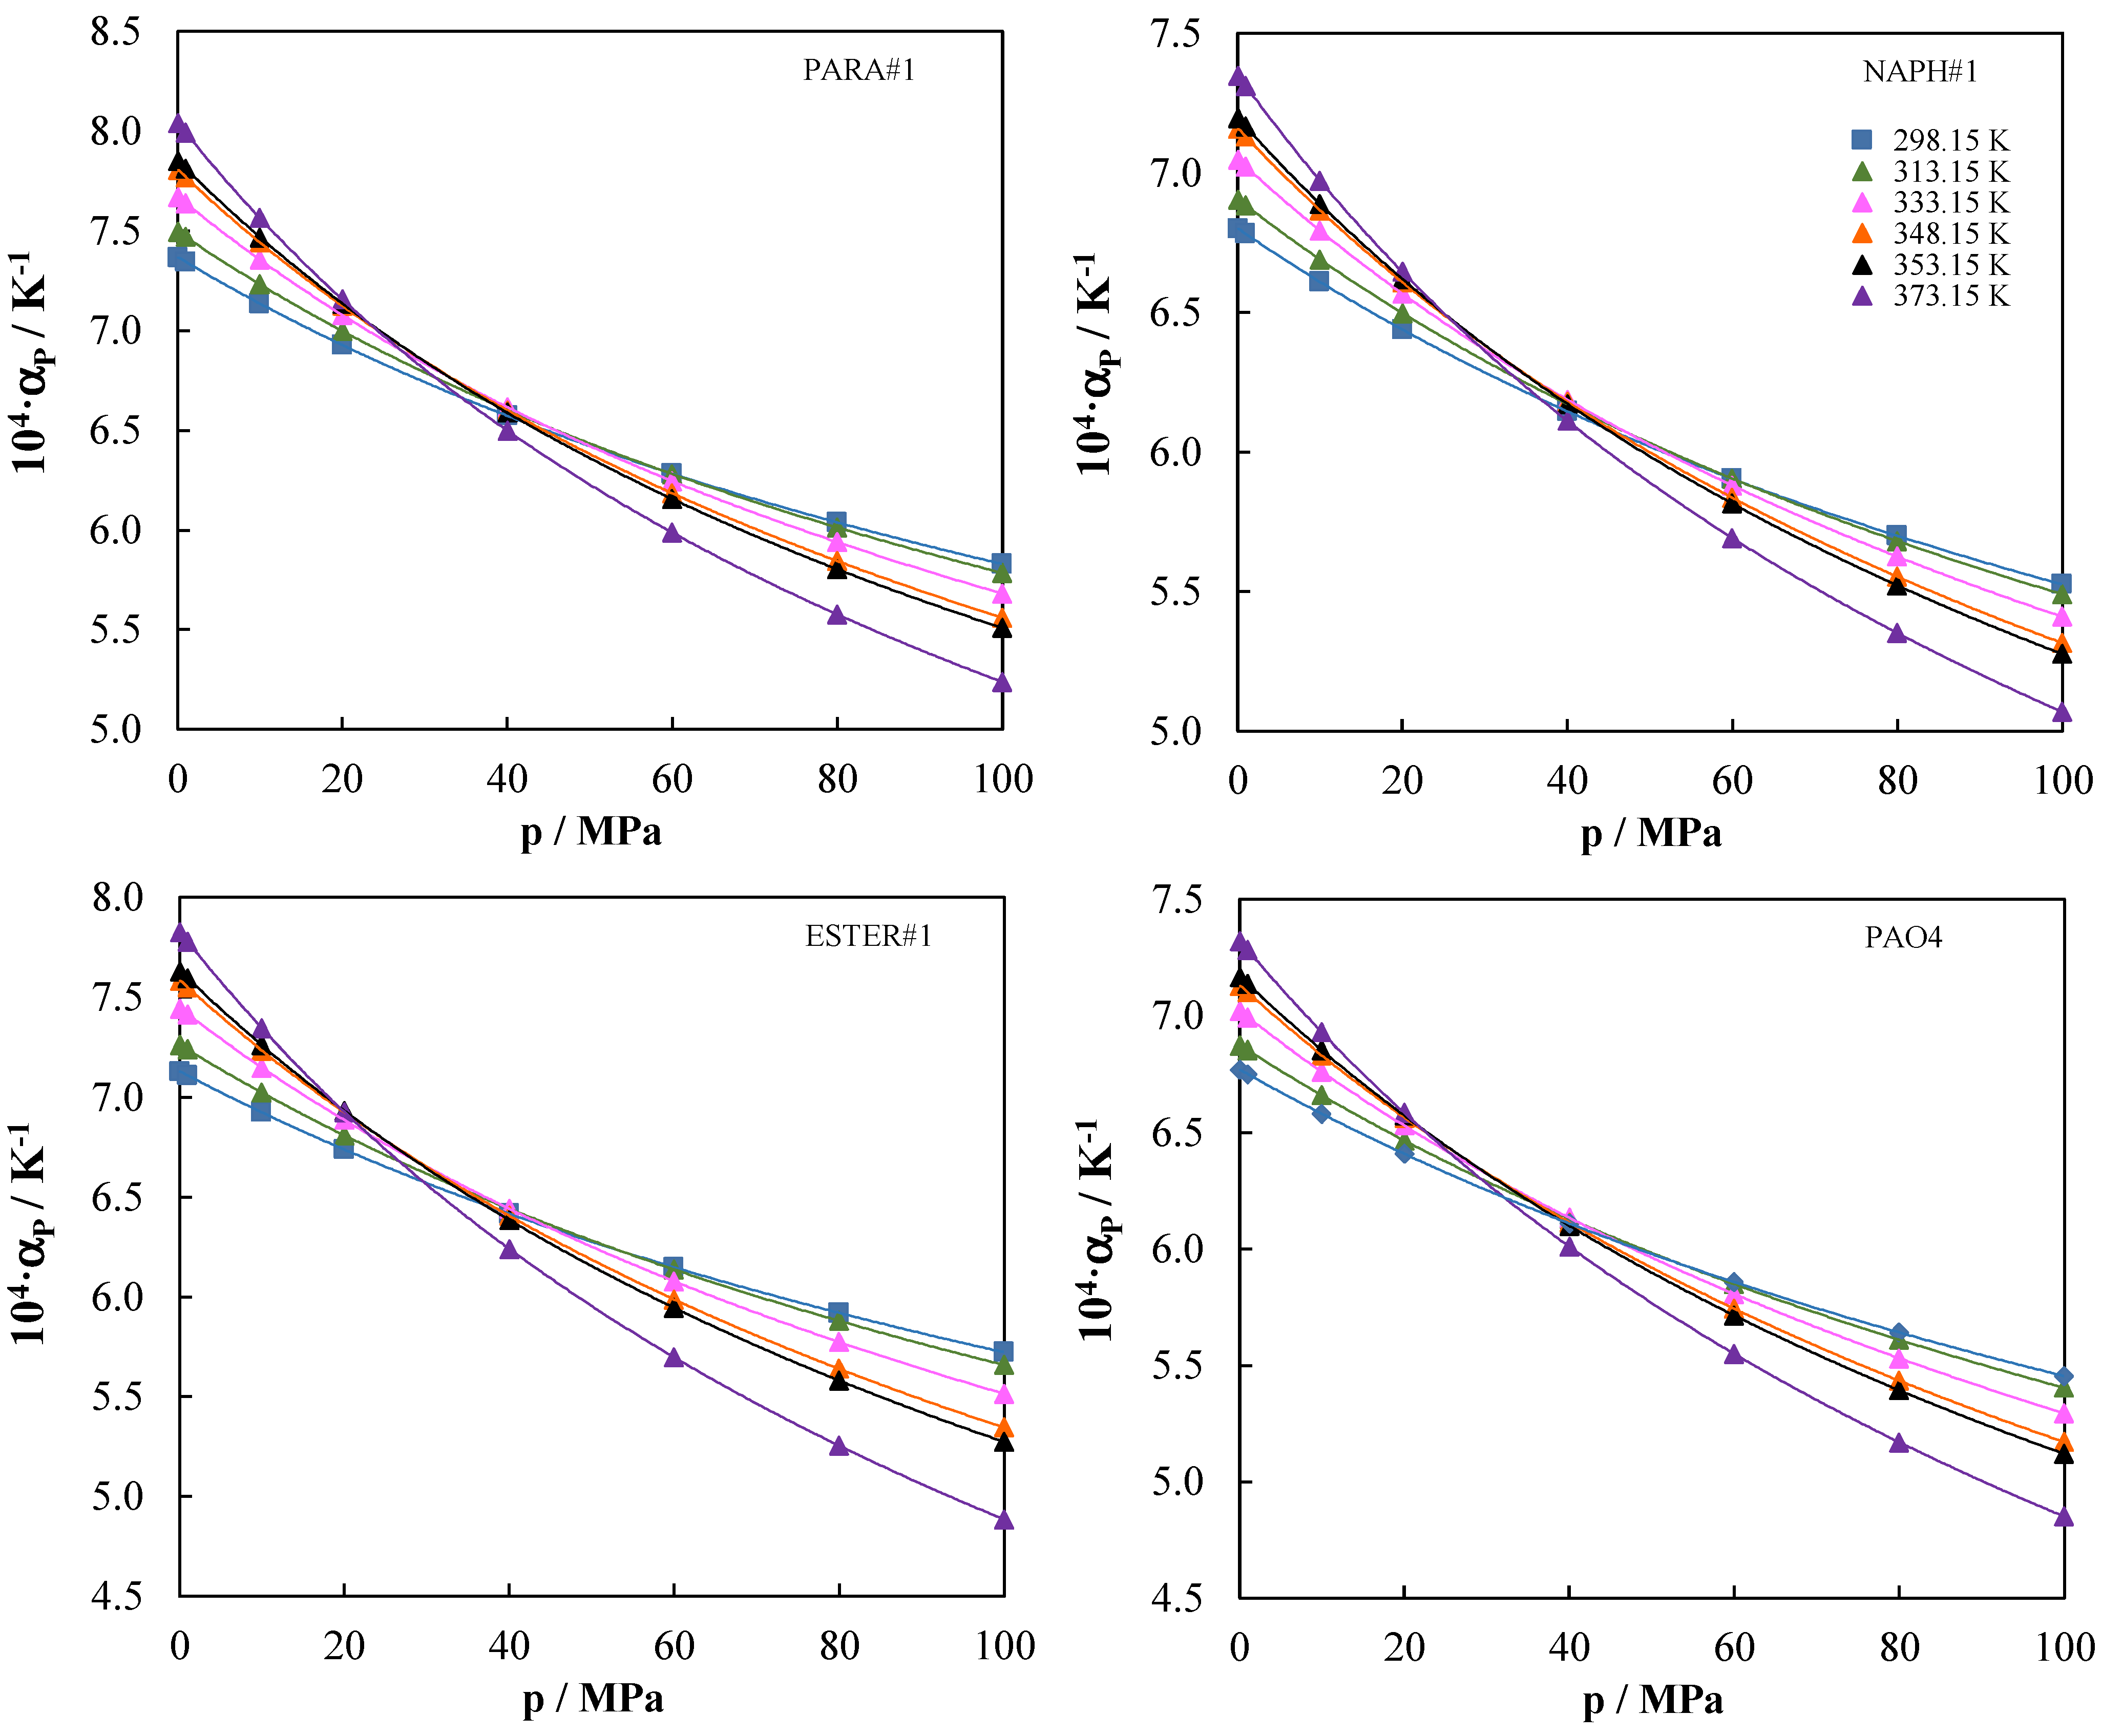
Table 5, respectively. The decrease in the isobaric thermal expansivity from 0.1 MPa to 100 MPa for all the base oils is around 20% at 298.15 K and around 35% at 373.15 K. Thermal expansivities are depicted in Figure 4 and Figure 5 as a function of the pressure at different temperatures for the mineral and synthetic base oils studied in this work. As remarked above, this property decreases when the pressure increases, whereas several crossing points are found between isotherms for all the base oils (around 40 MPa), except for PAO16. Although some authors [29,30,31] concluded that, for a given liquid, all the isotherms of αp against pressure, cross at one definite pressure, Figure 4 and Figure 5 show that this does not occur. This agrees with later articles [32,33], which found a clear dependence of the crossing pressure against temperature for some molecular liquids. For PAO16, the crossing points seem to be a little beyond the studied pressure range.
The isothermal compressibility, κ T , increases with the temperature at a constant pressure for all studied oils, whereas it decreases when the pressure rises at a constant temperature. The decrease in the isothermal compressibility from 0.1 MPa to 100 MPa for all the base oils is around 35% at 298.15 K and around 45% at 373.15 K. The more compressible base oil is ESTER#2, followed by PARA#1, for all the temperatures and pressures (Figure 6). The pressure and temperature dependence of the density and, subsequently, of the isothermal compressibility and thermal expansivity of the base oils must be considered to formulate new potential lubricants.
The static contact angle evolution between the surface and a small drop of lubricant was analyzed by taking images at every second for 120 s (when the steady state was reached). Figure 7 shows the frames captured at 0, 60, and 120 s. The integrated software automatically calculates the angle that the lubricant drop forms with the steel surface on the right and left side and provides the average of both values. The analysis of the contact angle evolution of eight base oils on AISI 420 stainless steel surfaces showed that the base oils with a kinematic viscosity of around 100 mm2 s−1, at 313.15 K and 0.1 MPa (PARA#2, NAPH#2, ESTER#2, and PAO16), have a higher contact angle than the base oils with a kinematic viscosity of around 20 mm2 s−1, at 313.15 K and 0.1 MPa (PARA#1, NAPH#1, ESTER#1, and PAO4), which suggests the poorer wetting of the high-viscosity base oils. Furthermore, the wetting data for the high-viscosity base oils show the following sequence, PARA#2 > ESTER#2 > PAO16 > NAPH#2, which means that the highest contact angle is obtained for the paraffinic oil (PARA#2) and the lowest for the naphthenic oil (NAPH#2).
However, the data for the low-viscosity base oils revealed a different sequence: ESTER#1 > PARA#1 > NAPH#1 > PAO4; in this case, the contact angle was the highest for the esters base oil (ESTER#1) and the lowest for PAO4. In addition, at 323.15 K, PARA#2 (high-viscosity paraffinic oil) reached the steady-state earlier (approx. 20 s) than the other oils. Figure 8 summarizes the results of the average steady-state contact angles for the AISI 420 stainless steel surface wetted with each of the eight base oils at 298.15 and 323.15 K. The contact angles were between 1.4° and 18.1° at 298.15 K and 0.4° and 14.3° at 323.15 K, for all the base oils. As expected, a reduction in the average steady-state contact angle was observed with the increase in temperature, which was around 69% for PARA#1 (low-viscosity paraffinic oil) and 32% for PAO16. At both temperatures, the lowest contact angles corresponded to PAO4 and the highest to PARA#2 (high-viscosity paraffinic base oil).
Coelho de Sousa Marques et al. [7] measured the contact angle for different base oils on AISI 420 stainless steel surface from 293.15 to 323.15 K. They reported the contact angle for four different polyalphaolefins (PAO6, PAO20, PAO32, and PAO40) and for four ester-based lubricants (TMPTO, TOTM, TTM, and BIOE). These authors [7] measured the contact angle at 5 s after the droplet fall, finding 6.8° and 12.6° for PAO6 and PAO20 at 323.15 K, respectively. In the present work, PAO4 and PAO16 provided contact angles at the same droplet fall time (5 s) and at 323.15 K of 5.4° and 15.0°, respectively. Thus, we observed a good agreement considering the uncertainty of the two measurements.
The kinematic and dynamic viscosities for the eight oils measured with SVM3000 apparatus are reported in Table 1. The dynamic viscosities at 0.1 MPa of all the base oils with low-viscosity grades (PARA#1, NAPH#1, ESTER#1, and PAO4) range along the entire temperature interval, from around 3 mPa s to 187 mPa s. Five of the base oils studied in this work (PARA#1, NAPH#1, ESTER#1, PAO4, and NAPH#2) had kinematic viscosities at 373.15 K and 0.1 MPa, between 3 mm2 s−1 and 10 mm2 s−1, which means that they could be used in the formulation of automatic transmission fluids (ATF) for electric vehicles, with configurations where the ATF and the electric motor are in contact due to the latter being inside the transmission housing [
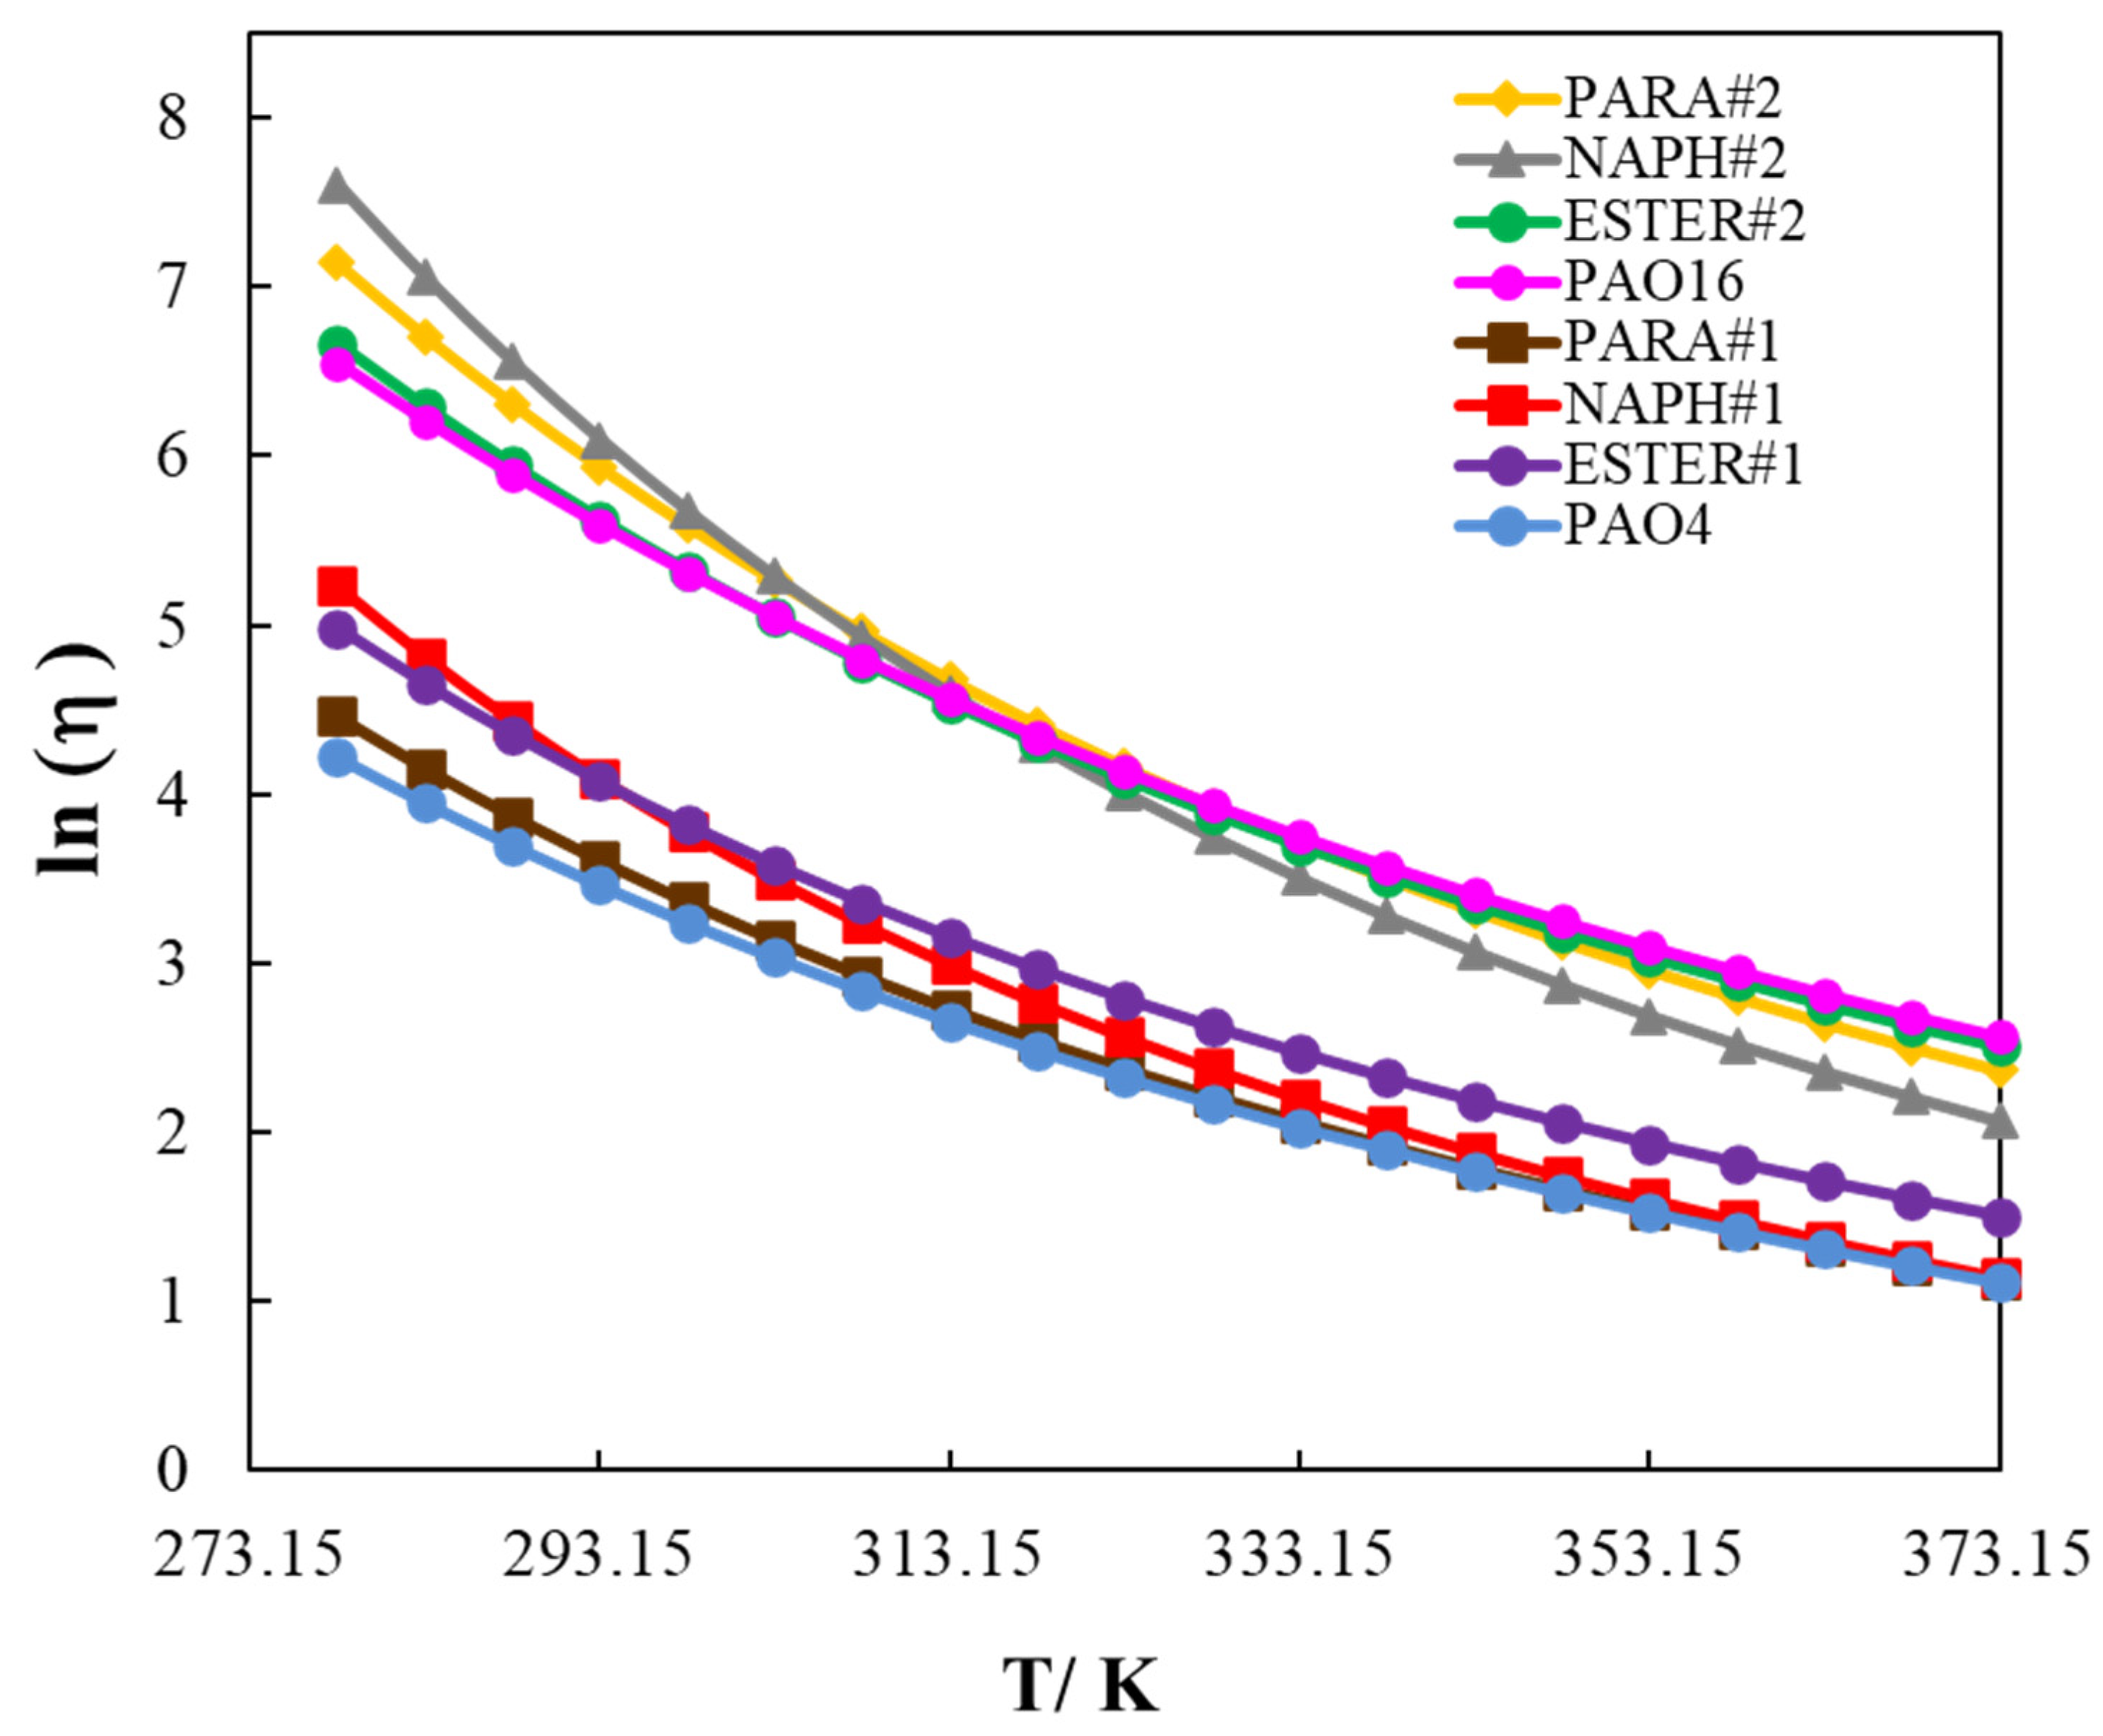
34]. From Figure 9, where the logarithm of the dynamic viscosity is plotted against temperature, we can observe that PARA#1, NAPH#1, and PAO4 had very similar viscosities over the temperature range (343.15–373.15 K). Moreover, the ester oil ESTER#1 presented the higher viscosities within the temperature interval (298.15–373.15 K). On the contrary, at temperatures lower than 298.15 K, the naphthenic oil (NAPH#1) was more viscous that the other three oils; thus, the following trend is obtained: NAPH#1 > ESTER#1 > PARA#1 > PAO4. For the base oils with a high-viscosity grade (PARA#2, NAPH#2, ESTER#2, and PAO16), the dynamic viscosity at 0.1 MPa ranged from 8 mPa s to 2006 mPa s over the entire temperature interval. We observed that, for temperatures lower than 308.15 K, the naphthenic oil (NAPH#2) was more viscous that the other three oils (PARA#2, ESTER#2, and PAO16). Over the entire temperature interval (308.15–318.15 K), the dynamic viscosity of the base oils with a high-viscosity grade were quite similar. However, the trend found for temperatures higher than 318.15 K was PAO16 > ESTER#2 > PARA#2 > NAPH#2.
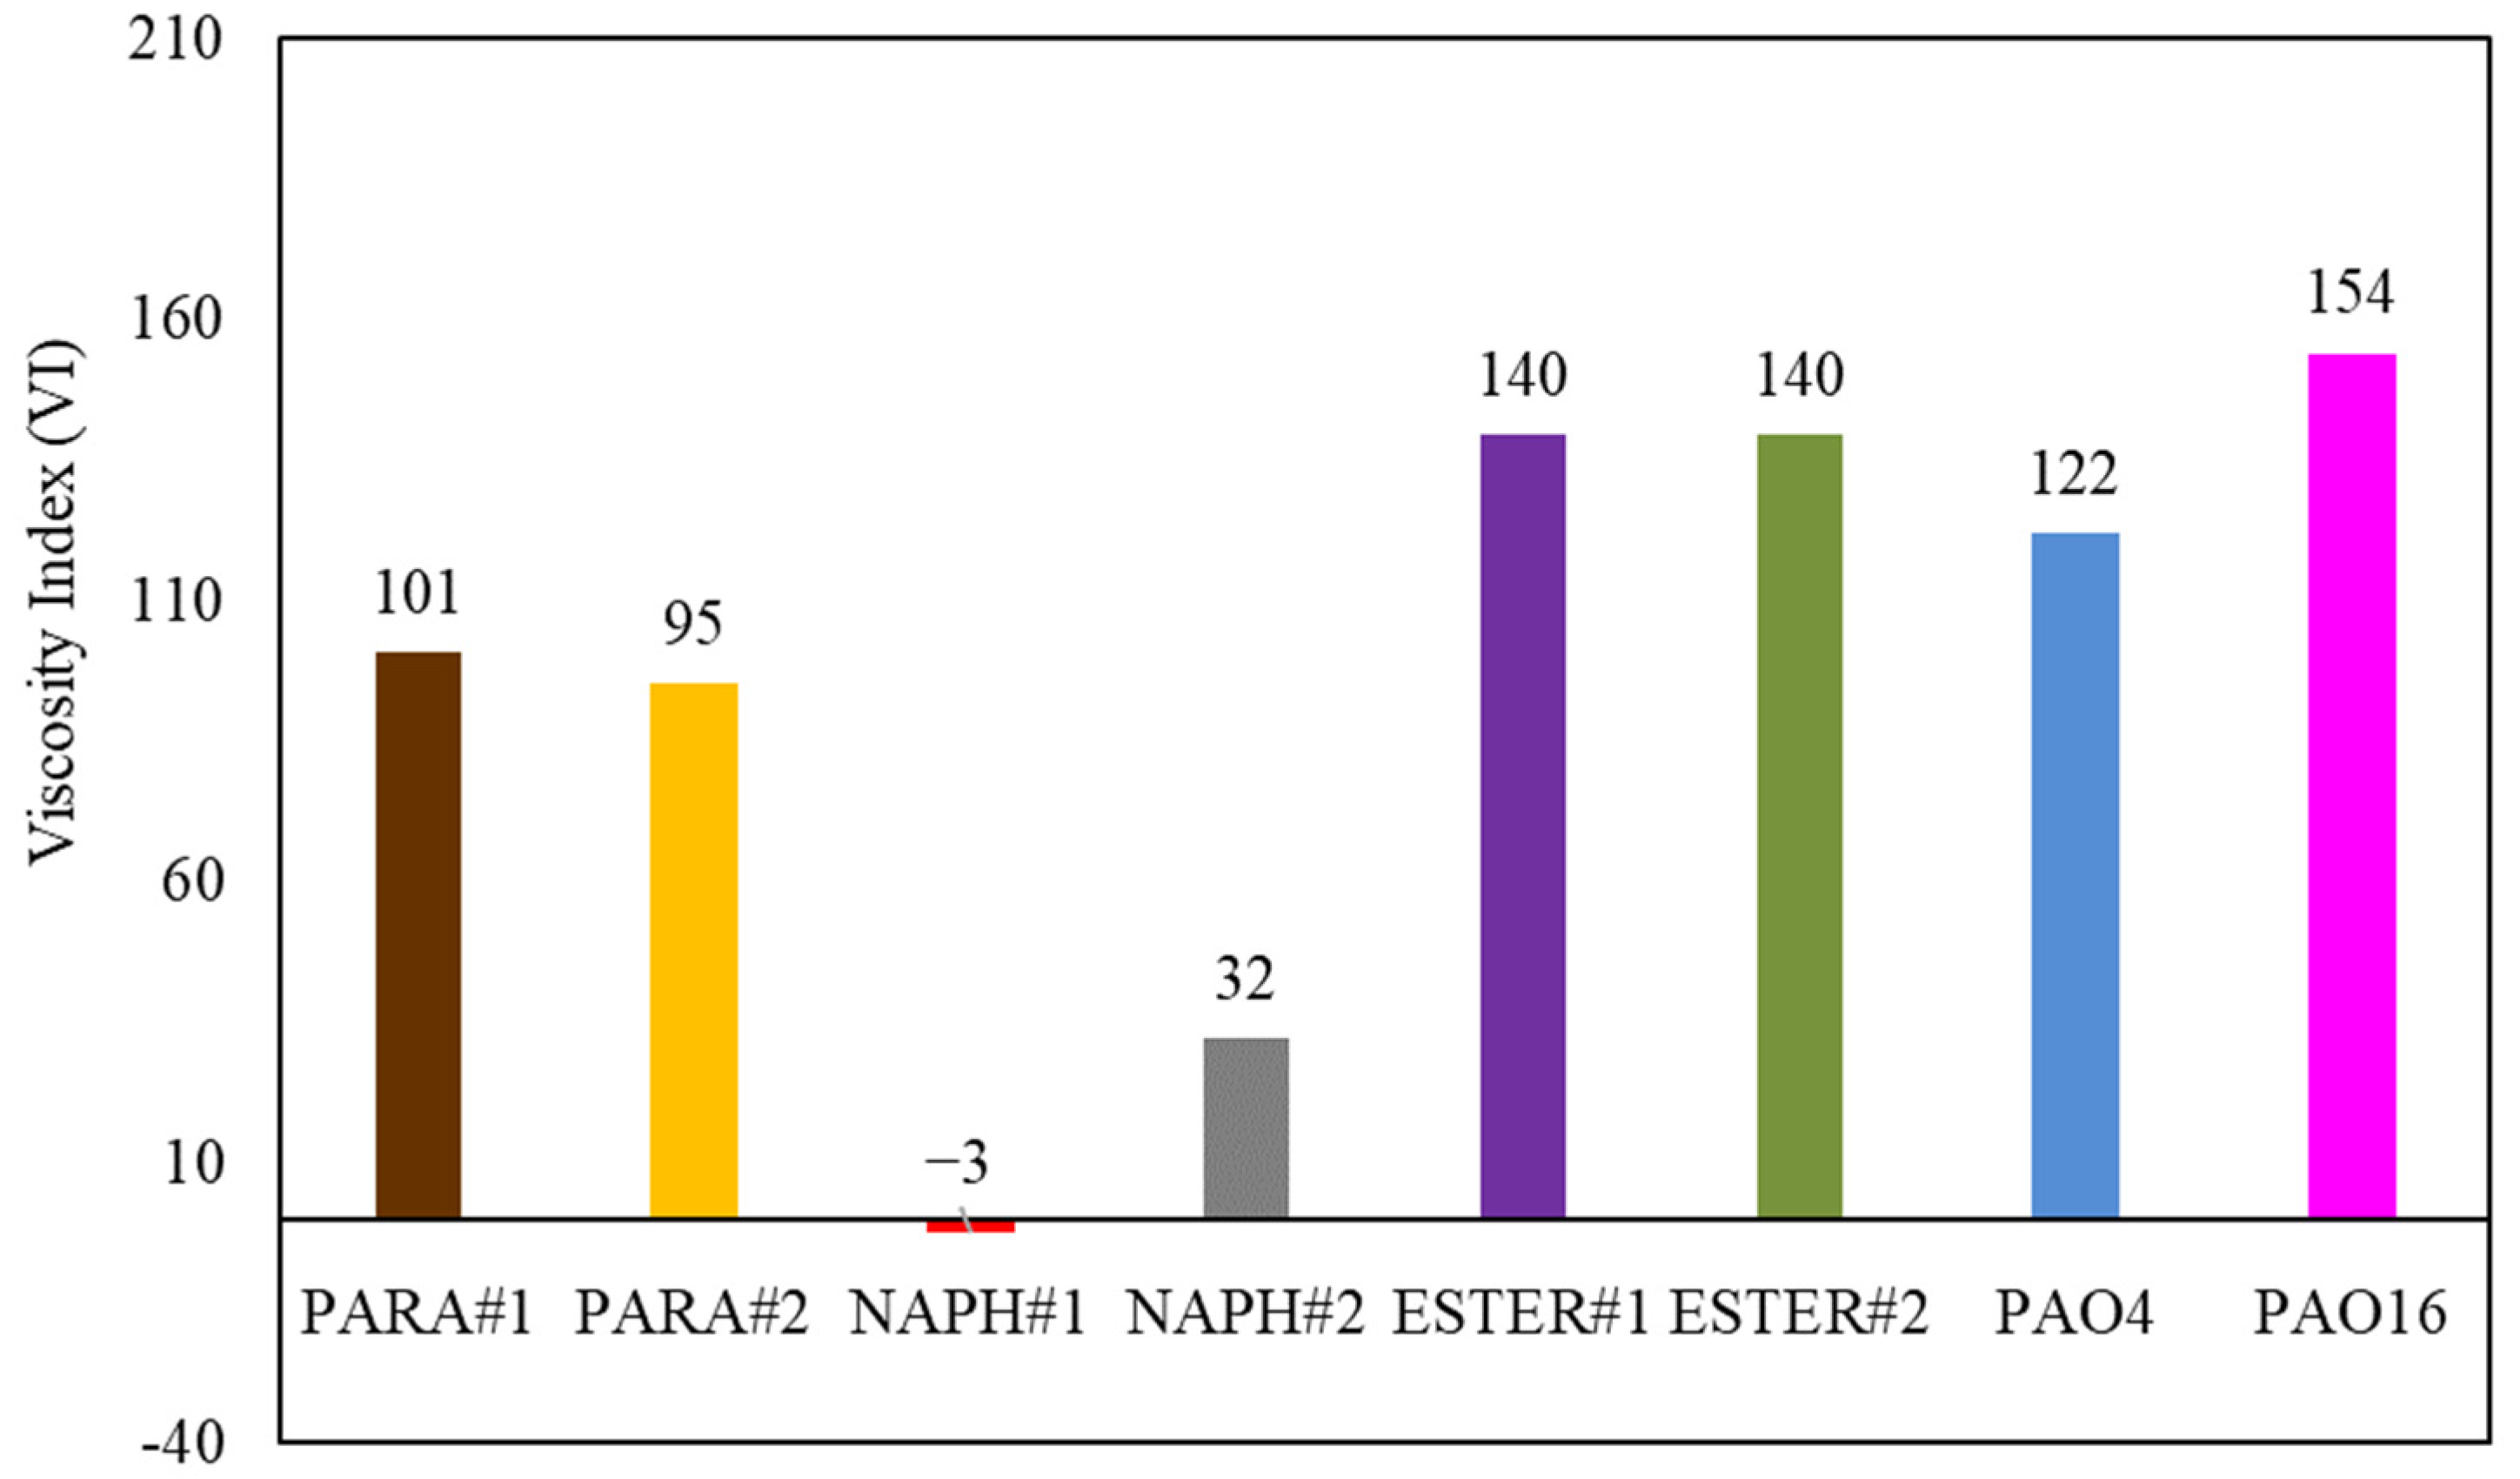
The viscosity index obtained for the eight base oils is reported in Figure 10. The ester and polyalphaolefin oils (synthetic oils) have the highest viscosity index (VI from 122 to 154), that is, they present the lower dependence of the viscosity with the temperature. Both esters have a similar viscosity index (VI = 140), even if both oils have very different viscosity grades. Thus, the viscosity of these synthetic oils is less dependent on temperature changes than that of mineral oils. The very-low values obtained for the VI of the naphthenic base oils were checked measuring the viscosity index three times, obtaining the same results. The VI of the naphthenic base oils indicates that, for these oils, it is necessary to use VI improvers, also known as viscosity modifiers. However, the use of additives as viscosity improvers has some drawbacks, for example, using polymers with a higher molecular weight as additives would improve the thickening properties, but they show less resistance to mechanical shearing. This highlights the great difficulty involved in formulating new lubricants, since the use of one additive can improve one property, but, at the same time, worsen another. In other words, it is necessary to strike a strict balance between the different properties that are to be achieved for the final lubricant.
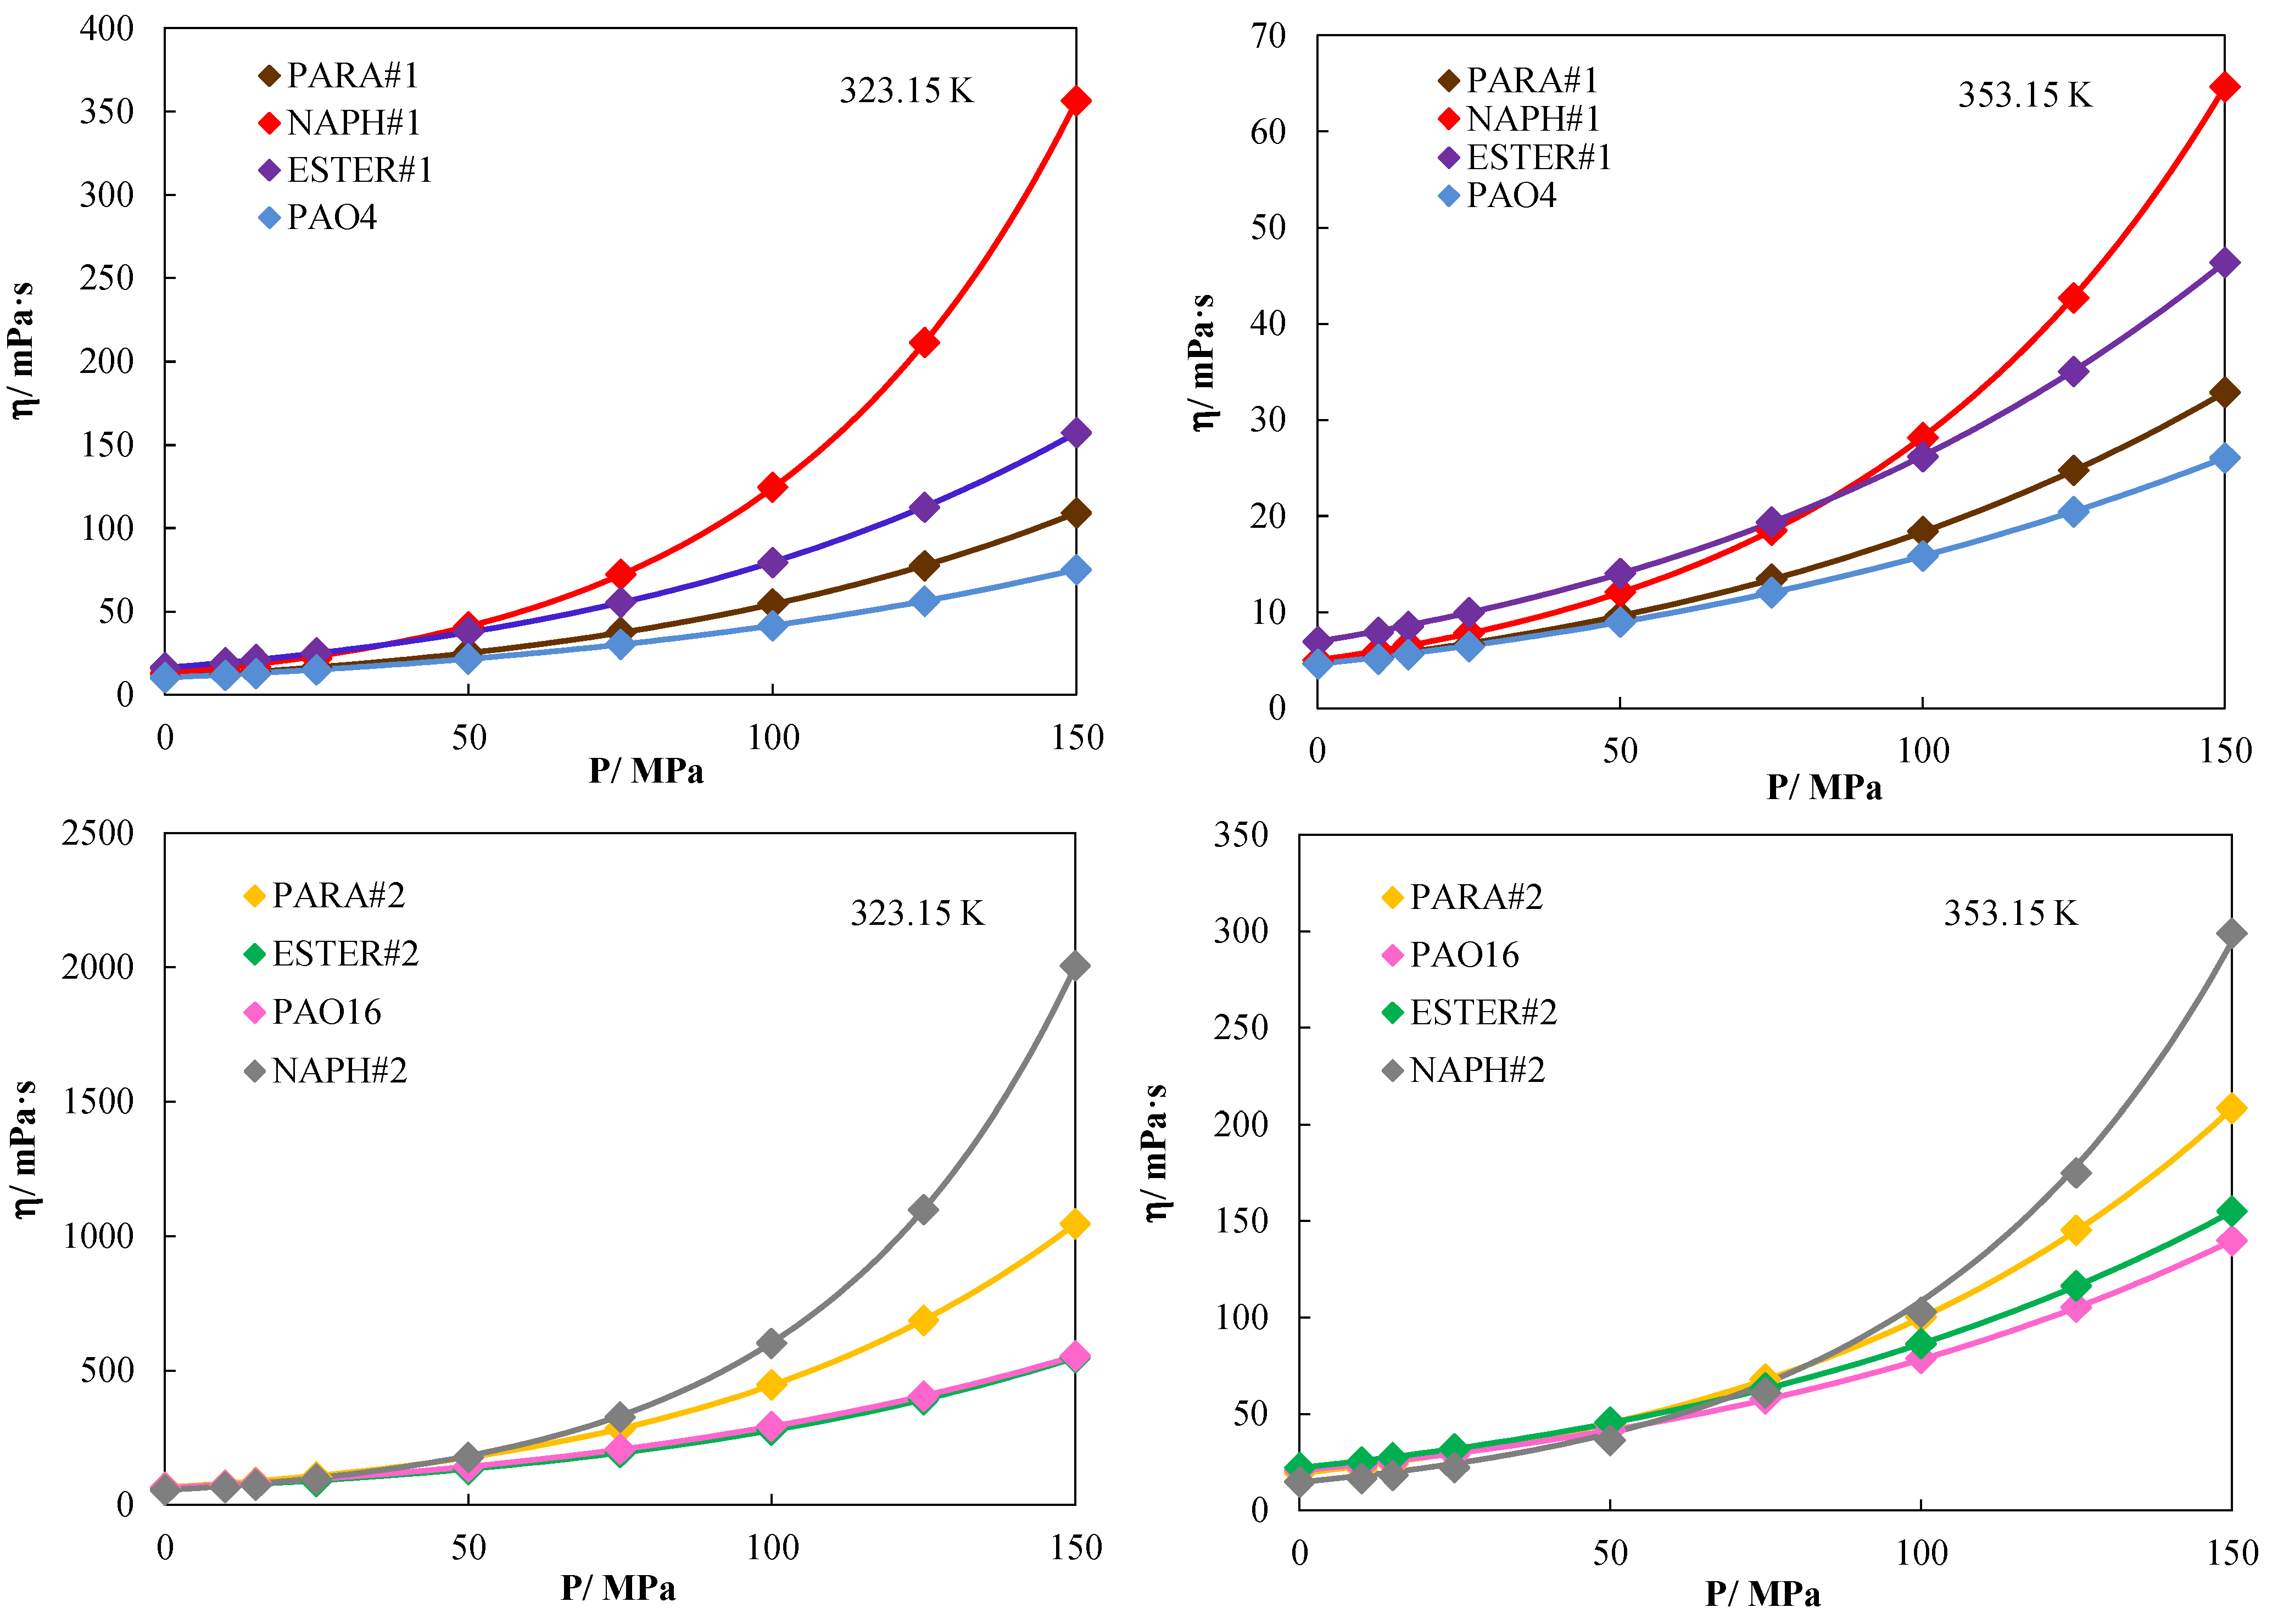
The dynamic viscosities at high pressures for the eight base oils are reported in Table 6. As Figure 11 shows, at 323.15 K and for pressures lower than 50 MPa, the dependence of the viscosity with pressure was quite similar for the eight oils. For pressures higher than 50 MPa, the bigger increase in the viscosity with pressure occurred for the mineral naphthenic oils: NAPH#2 (viscosity at 150 MPa around 40 times higher than that at 0.1 MPa), followed by NAPH#1 (viscosity at 150 MPa around 30 times higher than that at 0.1 MPa). The studied synthetic polyalphaolefin oils (PAO4 and PAO16) had the lowest dependence of the viscosity with pressure (viscosity at 150 MPa/viscosity at 0.1 MPa ≤ 10). At 353.15 K, for the oils with the highest viscosity grade (PARA#2, NAPH#2, ESTER#2, and PAO16), the pressure dependence of the viscosity was quite similar, up to 75 MPa. For pressures higher than 75 MPa, once again mineral oils, especially NAPH#2, had the biggest increase in the viscosity with pressure. For the oils with a lower ISO VG grade at 353.15 K, ESTER#1 had the highest viscosity values at a pressure up to 75 MPa and, for pressures higher or equal than 100 MPa, NAPH#1 is the most viscous fluid.
The experimental dynamic viscosity data as a function of pressure, η (p), were fitted using Equation (6), where η0 is the dynamic viscosity value obtained with the Anton Paar Stabinger viscometer at 0.1 MPa at each temperature (reported in Table 1), and A, B, and C are adjustable parameters. The values of these parameters and the standard deviation of the fit are reported in Table 7. Equation (6) with the values of the parameters of Table 7 reproduces the experimental dynamic viscosity values with a standard deviation lower than 5 mPa s.
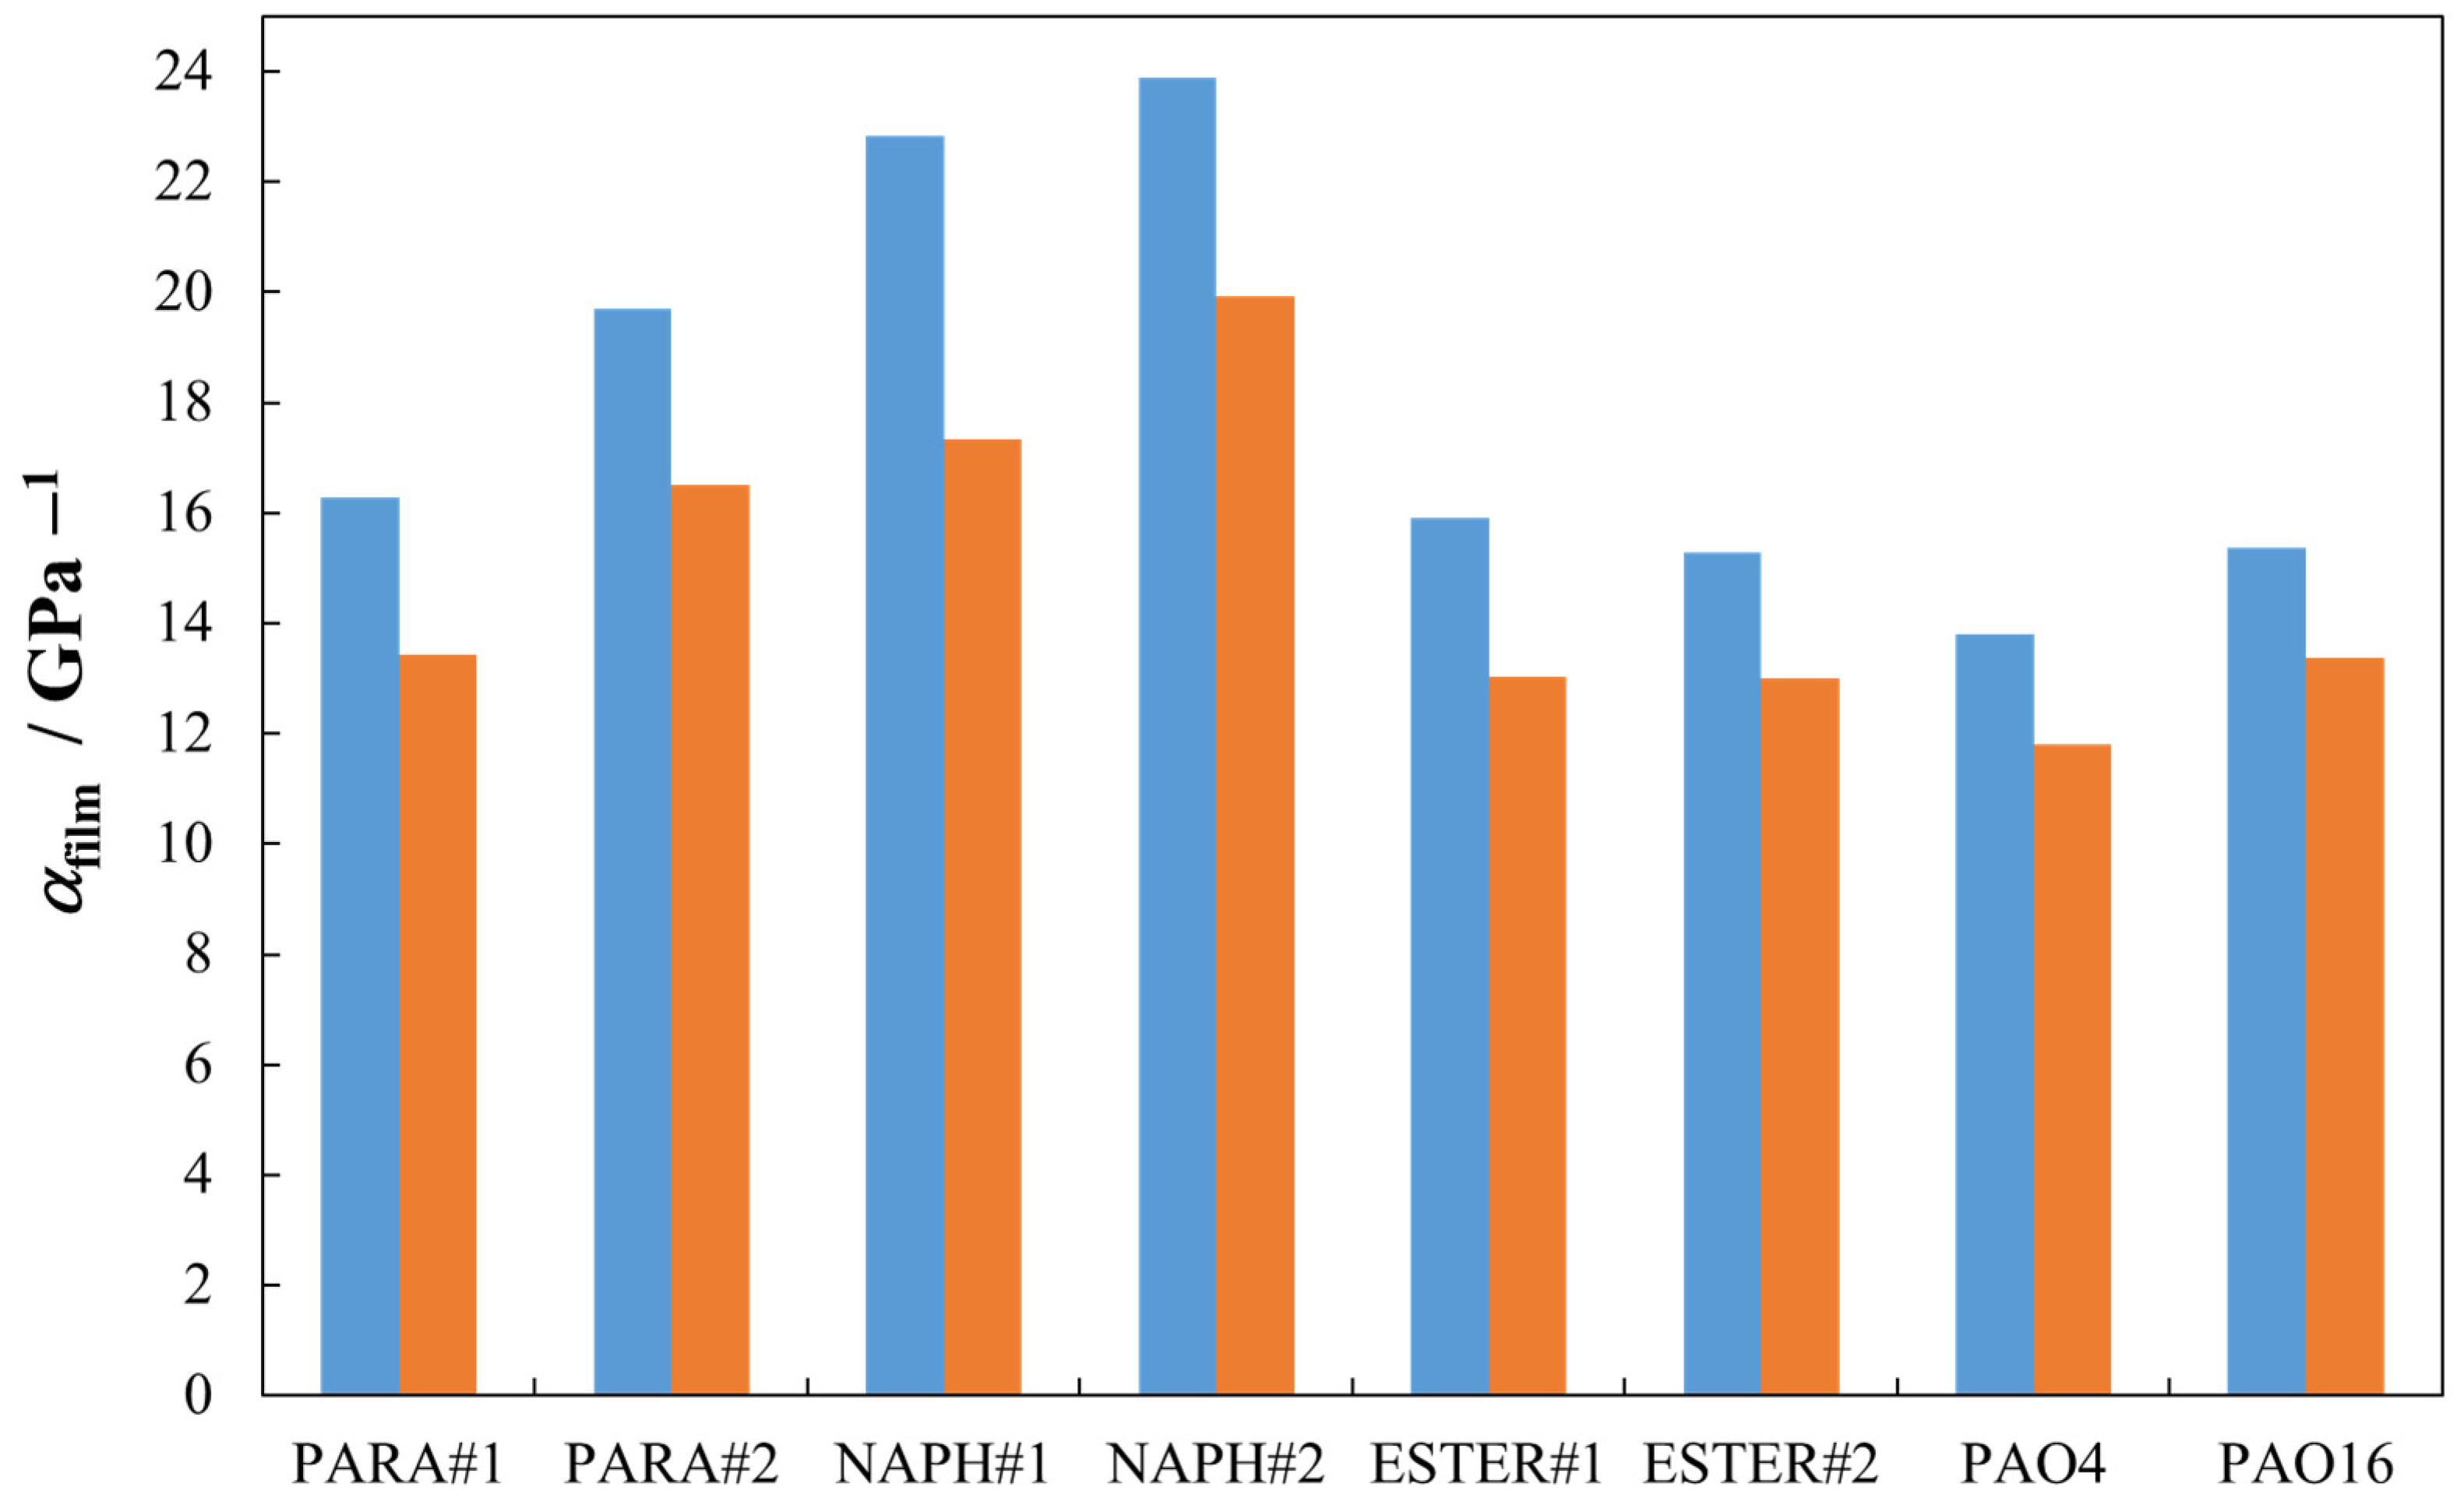
Using Equations (6)–(9), the values of αfilm and α∗ at different temperatures for the eight base oils studied in this work were determined. These values are reported in Table 8. As can be observed in Figure 12, the highest αfilm values were obtained for the naphthenic base oils (NAPH#1 and NAPH#2), followed by the paraffinic oils (PARA#1 and PARA#2). The universal pressure–viscosity coefficient (αfilm) for ESTER#1, ESTER#2, and PAO16 are very similar, around 15 GPa−1 at 323.15 K and around 13 GPa−1 at 353.15 K. The lowest αfilm values were obtained for PAO4. As expected, both coefficients (αfilm and α∗) decreased with temperature. The values reported in Table 8 agree with the previously published data for other mineral and synthetic oils [25,35].
The pressure–viscosity coefficient of the eight base oils were also determined from the equation proposed by Gold et al. [11]. The kinematic viscosity needed in Equation (10) was obtained from Table 1. The pressure–viscosity coefficients obtained from both the procedure proposed by Bair et al. (αfilm) and Equation (10) (αGold) decrease when the temperature rises. It was observed that αfilm values were higher than the αGold values for all the base oils studied in this work, except for NAPH#2, for which the α value obtained from the Gold method is around 8% higher than the αfilm value. For the mineral base oils (PARA#1, PARA#2, NAPH#1, and NAPH#2), average deviations around 10% at 323.15 K and 5% at 353.15 K between αfilm and αGold values were found. These deviations are higher for the synthetic base oils (ESTER#1, ESTER#2, PAO4, and PAO16), and thus average deviations around 25% at 323.15 K and 22% at 353.15 K were obtained, respectively. We must emphasize that, in the database used by Gold et al. to determine the s and m parameters, the lubricants used were in the range from ISO VG32 to ISO VG 460, which means they used oils with a kinematic viscosity higher than 30 mm2 s−1 at 313.15 K. As can be observed in Table 1, the kinematic viscosities of PARA#1, NAPH#1, ESTER#1, and PAO4 at 313.15 K were lower than this value.
The results obtained for η 0 0.69 α 0.56 for the eight base oils studied in the present work are shown in Figure 13 at 323.15 K and 353.15 K. At 323.15 K, for the base oils with the highest viscosity (PARA#2, NAPH#2, ESTER#2, and PAO16), we observed that PARA#2 and NAPH#2 had higher values than ESTER#2 and PAO16. This means that, at 323.15 K, the mineral base oils generate a thicker film than the synthetic ones. At 353.15 K, regarding the four high-viscosity oils, PARA#2 and PAO16 had slightly higher η 0 0.69 α 0.56 values than NAPH#2 and ESTER#2. For the low-viscosity base oils (PARA#1, NAPH#1, ESTER#1, and PAO4), it can be observed in Figure 13 that NAPH#1 and ESTER#1 presented similar and higher η 0 0.69 α 0.56 values than PARA#1 and PAO4 for both temperatures 323.15 and 353.15 K. Finally, we must emphasize that the naphthenic base oils presented the highest variation of η 0 0.69 α 0.56 with temperature, mainly due to their low-viscosity index.

4. Conclusions

Several thermophysical properties of eight mineral and synthetic base oils were experimentally determined. The following features were observed:
  • The densities of the synthetic oils were the highest (ESTERs) and the lowest (PAOs) of all the base oils. The following sequence was observed: ESTER > NAPH > PARA > PAO for both the ISO VG22 and ISO VG100 base oils. Densities at 100 MPa were around 5% higher than those at 0.1 MPa for all the base oils for all the isotherms.
  • Decreases with pressure around 20% at 298.15 K and around 35% at 373.15 K were observed for the isobaric thermal expansivity and 35% and 45%, respectively, for the isothermal compressibility, over the range of 0.1–100 MPa. The more compressible base oil was ESTER#2, so a priori, the risk surface fatigue would be lower with this base oil, although this must be verified by performing tribological tests.
  • The lowest contact angle corresponded to PAO4 and the highest to PARA#2. Base oils with an ISO VG100 grade had a higher contact angle than base oils with ISO VG22, which suggests the poorer wetting of the high-viscosity base oils.
  • Mineral naphthenic oils presented the highest increase in the viscosity with pressure and the synthetic polyalphaolefin oils the lowest. The highest αfilm values were obtained for naphthenic base oils (NAPH#1 and NAPH#2), followed by the paraffinic oils (PARA#1 and PARA#2), with the lowest αfilm values being obtained for PAO4. Average deviations between 5% and 25% were obtained between the αfilm and αGold values for the eight base oils.
  • The naphthenic base oils (NAPH#1 and NAPH#2) presented the highest variation of η 0 0.69 α 0.56 with the temperature, which means that they could diminish the efficiency of the machinery in comparison with other base oils.

Author Contributions

Conceptualization, F.U. and J.F.; methodology, A.V., M.J.G.G., J.M.L.d.R. and F.M.; software, F.M.; validation, M.J.P.C. and A.V.; formal analysis, J.F. and F.U.; investigation, A.V., M.J.G.G., J.M.L.d.R. and M.J.P.C.; resources, F.U. and R.U.; data curation, A.V.; writing—original draft preparation, M.J.P.C.; writing—review and editing, M.J.P.C.; visualization, J.F. and M.J.P.C.; supervision, F.U.; project administration, J.F.; funding acquisition, J.F. and F.U. All authors have read and agreed to the published version of the manuscript.

Funding

This research was funded by MCIN/AEI/10.13039/501100011033 and by the European Regional Development Fund (ERDF, a way of making Europe) through the ENE2017-86425-C2-2-R and the PID2020-112846RB-C22 projects as well as by Xunta de Galicia (ED431C 2020/10). José M. Liñeira del Río acknowledges the grant of the Margarita Salas program, funded by MCIN/AEI/10.13039/501100011033 and “European Union NextGenerationEU/PRTR” María J. G. Guimarey acknowledges a postdoctoral fellowship (ED481B-2019-015) from the Xunta de Galicia (Spain).

Data Availability Statement

Not applicable.

Conflicts of Interest

The authors declare no conflict of interest.

References

  1. Chowdary, K.; Kotia, A.; Lakshmanan, V.; Elsheikh, A.H.; Ali, M.K.A. A Review of the Tribological and Thermophysical Mechanisms of Bio-Lubricants Based Nanomaterials in Automotive Applications. J. Mol. Liq. 2021, 339, 116717. [Google Scholar] [CrossRef]
  2. Quinchia, L.; Delgado, M.; Reddyhoff, T.; Gallegos, C.; Spikes, H.A. Tribological Studies of Potential Vegetable Oil-Based Lubricants Containing Environmentally Friendly Viscosity Modifiers. Tribol. Int. 2014, 69, 110–117. [Google Scholar] [CrossRef]
  3. Boyde, S. Green Lubricants. Environmental Benefits and Impacts of Lubrication. Green Chem. 2002, 4, 293–307. [Google Scholar] [CrossRef]
  4. Larsen, R.G.; Bondi, A. Functional Selection of Synthetic Lubricants. Ind. Eng. Chem. 1950, 42, 2421–2427. [Google Scholar] [CrossRef]
  5. Leslie, R. Rudnick Synthetics, Mineral Oils, and Bio-Based Lubricants Chemistry and Technology; CRC Press: Boa Raton, FL, USA, 2020; ISBN 978-1-138-06821-6. [Google Scholar]
  6. Nagendramma, P.; Kaul, S. Development of Ecofriendly/Biodegradable Lubricants: An Overview. Renew. Sustain. Energy Rev. 2012, 16, 764–774. [Google Scholar] [CrossRef]
  7. Coelho de Sousa Marques, M.A.; Guimarey, M.J.G.; Domínguez-Arca, V.; Amigo, A.; Fernández, J. Heat Capacity, Density, Surface Tension, and Contact Angle for Polyalphaolefins and Ester Lubricants. Thermochim. Acta 2021, 703, 178994. [Google Scholar] [CrossRef]
  8. Totten, G.; Westbrook, S.; Shah, R. Fuels and Lubricants Handbook: Technology, Properties, Performance, and Testing; ASTM International: West Conshohocken, PA, USA, 2003. [Google Scholar]
  9. Besanjideh, M.; Nassab, S.A.G. Effect of Lubricant Compressibility on Hydrodynamic Behavior of Finite Length Journal Bearings Running under Heavy Load Conditions. J. Mech. 2016, 32, 101–111. [Google Scholar] [CrossRef]
  10. Bronshteyn, L.A.; Kreiner, J.H. Energy Efficiency of Industrial Oils. Tribol. Trans. 1999, 42, 771–776. [Google Scholar] [CrossRef]
  11. Gold, P.W.; Schmidt, A.; Dicke, H.; Loos, J.; Assmann, C. Viscosity–Pressure–Temperature Behaviour of Mineral and Synthetic Oils. J. Synth. Lubr. 2001, 18, 51–79. [Google Scholar] [CrossRef]
  12. Fernández Rico, E.; Minondo, I.; García Cuervo, D. Rolling Contact Fatigue Life of AISI 52100 Steel Balls with Mineral and Synthetic Polyester Lubricants with PTFE Nanoparticle Powder as an Additive. Wear 2009, 266, 671–677. [Google Scholar] [CrossRef]
  13. Grandelli, H.E.; Dickmann, J.S.; Devlin, M.T.; Hassler, J.C.; Kiran, E. Volumetric Properties and Internal Pressure of Poly(α-Olefin) Base Oils. Ind. Eng. Chem. Res. 2013, 52, 17725–17734. [Google Scholar] [CrossRef]
  14. Dickmann, J.S.; Devlin, M.T.; Hassler, J.C.; Kiran, E. High Pressure Volumetric Properties and Viscosity of Base Oils Used in Automotive Lubricants and Their Modeling. Ind. Eng. Chem. Res. 2018, 57, 17266–17275. [Google Scholar] [CrossRef]
  15. Wang, Y.; Fernandez, J.E.; Cuervo, D.G. Rolling-Contact Fatigue Lives of Steel AISI 52100 Balls with Eight Mineral and Synthetic Lubricants. Wear 1996, 196, 110–119. [Google Scholar] [CrossRef]
  16. Teh, J.L.; Walvekar, R.; Nagarajan, T.; Said, Z.; Khalid, M.; Mubarak, N.M. A Review on the Properties and Tribological Performance of Recent Non-Aqueous Miscible Lubricants. J. Mol. Liq. 2022, 366, 120274. [Google Scholar] [CrossRef]
  17. Segovia, J.J.; Fandiño, O.; López, E.R.; Lugo, L.; Carmen Martín, M.; Fernández, J. Automated Densimetric System: Measurements and Uncertainties for Compressed Fluids. J. Chem. Thermodyn. 2009, 41, 632–638. [Google Scholar] [CrossRef]
  18. Dakkach, M.; Gaciño, F.Μ.; Guimarey, M.J.G.; Mylona, S.K.; Paredes, X.; Comuñas, M.J.P.; Fernández, J.; Assael, M.J. Viscosity-Pressure Dependence for Nanostructured Ionic Liquids. Experimental Values for Butyltrimethylammonium and 1-Butyl-3-Methylpyridinium Bis(Trifluoromethylsulfonyl)Imide. J. Chem. Thermodyn. 2018, 121, 27–38. [Google Scholar] [CrossRef]
  19. Guimarey, M.J.G.; Abdelkader, A.M.; Comuñas, M.J.P.; Alvarez-Lorenzo, C.; Thomas, B.; Fernández, J.; Hadfield, M. Comparison between Thermophysical and Tribological Properties of Two Engine Lubricant Additives: Electrochemically Exfoliated Graphene and Molybdenum Disulfide Nanoplatelets. Nanotechnology 2021, 32, 025701. [Google Scholar] [CrossRef]
  20. Zhang, L.; He, Y.; Zhu, L.; Yang, C.; Niu, Q.; An, C. In Situ Alkylated Graphene as Oil Dispersible Additive for Friction and Wear Reduction. Ind. Eng. Chem. Res. 2017, 56, 9029–9034. [Google Scholar] [CrossRef]
  21. van Leeuwen, H. The Determination of the Pressure—Viscosity Coefficient of a Lubricant through an Accurate Film Thickness Formula and Accurate Film Thickness Measurements. Proc. Inst. Mech. Eng. Part J J. Eng. Tribol. 2009, 223, 1143–1163. [Google Scholar] [CrossRef] [Green Version]
  22. Spikes, H.A.; Hammond, C.J. The Elastohydrodynamic Film Thicknesses of Binary Ester-Ether Mixtures. A S L E Trans. 1981, 24, 542–548. [Google Scholar] [CrossRef]
  23. Bair, S.; Liu, Y.; Wang, Q.J. The Pressure-Viscosity Coefficient for Newtonian EHL Film Thickness With General Piezoviscous Response. J. Tribol. 2006, 128, 624–631. [Google Scholar] [CrossRef]
  24. Kumar, P.; Bair, S.; Krupka, I.; Hartl, M. Newtonian Quantitative Elastohydrodynamic Film Thickness with Linear Piezoviscosity. Tribol. Int. 2010, 43, 2159–2165. [Google Scholar] [CrossRef]
  25. Paredes, X.; Fandiño, O.; Pensado, A.S.; Comuñas, M.J.P.; Fernández, J. Pressure–Viscosity Coefficients for Polyalkylene Glycol Oils and Other Ester or Ionic Lubricants. Tribol. Lett. 2012, 45, 89–100. [Google Scholar] [CrossRef]
  26. Höglund, E. Influence of Lubricant Properties on Elastohydrodynamic Lubrication. Wear 1999, 232, 176–184. [Google Scholar] [CrossRef]
  27. Larsson, R.; Kassfeldt, E.; Byheden, Å.; Norrby, T. Base Fluid Parameters for Elastohydrodynamic Lubrication and Friction Calculations and Their Influence on Lubrication Capability. J. Synth. Lubr. 2001, 18, 183–198. [Google Scholar] [CrossRef]
  28. Cardoso, N.F.R.; Martins, R.C.; Seabra, J.H.O.; Igartua, A.; Rodríguez, J.C.; Luther, R. Micropitting Performance of Nitrided Steel Gears Lubricated with Mineral and Ester Oils. Tribol. Int. 2009, 42, 77–87. [Google Scholar] [CrossRef]
  29. Randzio, S.L.; Grolier, J.P.E.; Quint, J.R.; Eatough, D.J.; Lewis, E.A.; Hansen, L.D. N-Hexane As a Model for Compressed Simple Liquids. Int. J. Thermophys. 1994, 15, 415–441. [Google Scholar] [CrossRef]
  30. Randzio, S.L. From Calorimetry to Equations of State. Chem. Soc. Rev. 1995, 24, 359–366. [Google Scholar] [CrossRef]
  31. Deiters, U.K.; Randzio, S.L. The Equation of State for Molecules with Shifted Lennard-Jones Pair Potentials. Fluid Phase Equilib. 1995, 103, 199–212. [Google Scholar] [CrossRef]
  32. Taravillo, M.; Baonza, V.G.; Cáceres, M.; Núñez, J. Thermodynamic Regularities in Compressed Liquids: I. The Thermal Expansion Coefficient. J. Phys. Condens. Matter 2003, 15, 2979. [Google Scholar] [CrossRef]
  33. Troncoso, J.; Navia, P.; Romaní, L.; Bessieres, D.; Lafitte, T. On the Isobaric Thermal Expansivity of Liquids. J. Chem. Phys. 2011, 134, 94502. [Google Scholar] [CrossRef] [PubMed]
  34. Tuero, A.G.; Sanjurjo, C.; Rivera, N.; Viesca, J.L.; González, R.; Battez, A.H. Electrical Conductivity and Tribological Behavior of an Automatic Transmission Fluid Additised with a Phosphonium-Based Ionic Liquid. J. Mol. Liq. 2022, 367, 120581. [Google Scholar] [CrossRef]
  35. Guimarey, M.J.G.; Gonçalves, D.E.P.; Liñeira del Río, J.M.; Comuñas, M.J.P.; Fernández, J.; Seabra, J.H.O. Lubricant Properties of Trimethylolpropane Trioleate Biodegradable Oil: High Pressure Density and Viscosity, Film Thickness, Stribeck Curves and Influence of Nanoadditives. J. Mol. Liq. 2021, 335, 116410. [Google Scholar] [CrossRef]
Figure 1. Densities, ρ, obtained with the SVM300 apparatus at 0.1 MPa for the eight oils versus the temperature function. The solid lines are for guidance.
Lubricants 11 00055 g001
Figure 2. Density at high pressure obtained with the Anton Paar apparatus, (a) as a function of temperature at 60 MPa and (b) as a function of pressure at 333.15 K, for the eight base oils. The solid lines are for guidance.
Lubricants 11 00055 g002
Figure 3. pρT surface as a function of the temperature and pressure for NAPH#2 base oil. The dots represent the density measurements obtained with the Anton Paar apparatus, and the surface the correlation using Equation (1) with a standard deviation of 5 · 10−4 g cm−3.
Lubricants 11 00055 g003
Figure 4. Isobaric thermal expansivities, αp, with an uncertainty of 0.3 · 10−4 K−1 against pressure at different temperatures for the base oils with a low-viscosity grade. The solid lines are for guidance.
Lubricants 11 00055 g004
Figure 5. Isobaric thermal expansivities, αp, with an uncertainty of 0.3 · 10−4 K−1 against pressure at different temperatures for the base oils with a high-viscosity grade. The solid lines are for guidance.
Lubricants 11 00055 g005
Figure 6. Isothermal compressibility (kT) values with an uncertainty of 0.06 · 10−4 MPa−1 for eight base oils at 333.15 K and (Lubricants 11 00055 i001) 0.1 MPa and (Lubricants 11 00055 i002) 100 MPa.
Lubricants 11 00055 g006
Figure 7. Images of the sessile drop evolution for all mineral and synthetic oils at 298.15 K.
Lubricants 11 00055 g007
Figure 8. Average steady-state contact angle (θ) of the eight base oils at 298.15 K (filled bars) and 323.15 K (clear bars).
Lubricants 11 00055 g008
Figure 9. Dynamic viscosity (ln η) versus temperature at 0.1 MPa for the eight studied oils.
Lubricants 11 00055 g009
Figure 10. Viscosity index (VI) for the eight studied base oils: four mineral (PARAs and NAPHs) and four synthetic (PAOs and ESTERs) oils.
Lubricants 11 00055 g010
Figure 11. Viscosity as a function of pressure for the eight studied base oils: four mineral (PARAs and NAPHs) and four synthetic (PAOs and ESTERs) oils.
Lubricants 11 00055 g011
Figure 12. Universal pressure–viscosity coefficient (αfilm) for the eight studied base oils: four mineral (PARAs and NAPHs) and four synthetic (PAOs and ESTERs) oils. (Lubricants 11 00055 i003) 323.15 K and (Lubricants 11 00055 i004) 353.15 K.
Lubricants 11 00055 g012
Figure 13. η 0 0.69 α 0.56 for the eight studied base oils: four mineral (PARAs and NAPHs) and four synthetic (PAOs and ESTERs) oils. (Lubricants 11 00055 i003) 323.15 K and (Lubricants 11 00055 i004) 353.15 K.
Lubricants 11 00055 g013
Table 1. Density, ρ, kinematic viscosity, ν, and dynamic viscosity, η, for the eight base oils at different temperatures, T/K, and at 0.1 MPa measured with SVM3000 Stabinger.
T/Kρ/g cm−3ν/mm2 s−1η/mPa sT/Kρ/g cm−3ν/mm2 s−1η/mPa s
PARA#1PARA#2
278.150.869599.4186.44278.150.89841403.31260.6
283.150.866473.3263.53283.150.8953913.2817.6
288.150.863355.4447.86288.150.8923614.3548.1
293.150.860142.8036.82293.150.8892424.9377.8
298.150.857033.6628.85298.150.8862301.2266.9
303.150.853826.9423.00303.150.8832218.5192.9
308.150.850621.9018.63308.150.8802161.8142.4
313.150.847518.0715.31313.150.8772122.3107.2
318.150.844315.1012.75318.150.874294.0682.23
323.150.841112.7710.74323.150.871273.6064.12
328.150.837910.929.152328.150.868258.5050.79
333.150.83479.4287.870333.150.865147.1740.81
338.150.83158.2176.832338.150.862038.5533.23
343.150.82837.2175.978343.150.859031.9127.41
348.150.82516.3885.271348.150.855926.7322.87
353.150.82185.6934.679353.150.852822.6019.27
358.150.81865.1074.181358.150.849719.3116.40
363.150.81544.6073.757363.150.846716.6414.09
368.150.81224.1793.394368.150.843614.4612.20
373.150.80893.8073.080373.150.840512.6610.64
NAPH#1NAPH#2
278.150.9072206.2187.1278.150.92272174.42006.3
283.150.9040136.3123.2283.150.91961261.51160.1
288.150.900993.8784.57288.150.9165768.3704.1
293.150.897766.8560.02293.150.9133487.3445.1
298.150.894549.0543.88298.150.9103320.5291.7
303.150.891436.9832.96303.150.9072218.0197.7
308.150.888228.5625.37308.150.9041152.8138.1
313.150.884922.5419.94313.150.9011110.199.20
318.150.881718.1215.98318.150.898081.3773.07
323.150.878514.8313.02323.150.894961.5455.07
328.150.875212.3110.78328.150.891847.5342.39
333.150.872010.379.046333.150.888737.4333.26
338.150.86878.8407.679338.150.885529.9726.54
343.150.86557.6146.590343.150.882424.3921.52
348.150.86226.6265.713348.150.879320.1317.70
353.150.85895.8154.995353.150.876116.8314.75
358.150.85575.1424.400358.150.873014.2412.43
363.150.85244.5863.909363.150.869812.1710.59
368.150.84914.1143.493368.150.866710.519.109
373.150.84583.7123.140373.150.86359.1567.907
ESTER#1ESTER#2
278.150.9202158.8146.1278.150.9299844.6785.4
283.150.9168114.6105.0283.150.9266584.1541.3
288.150.913485.0377.67288.150.9233415.2383.3
293.150.910064.6458.82293.150.9200301.9277.7
298.150.906650.2245.53298.150.9168224.2205.6
303.150.903239.7435.89303.150.9135170.0155.3
308.150.899832.0228.81308.150.9103131.2119.4
313.150.896426.2023.49313.150.9071103.093.39
318.150.893021.7519.43318.150.903982.0874.18
323.150.889618.2916.28323.150.900666.3759.77
328.150.886215.5613.79328.150.897454.3748.79
333.150.882813.3811.81333.150.894145.1040.32
338.150.879311.6110.21338.150.890937.8233.69
343.150.875910.178.905343.150.887632.0428.44
348.150.87258.9697.825348.150.884327.4124.24
353.150.86907.9696.926353.150.881123.6520.84
358.150.86567.1296.171358.150.877820.5918.07
363.150.86216.4155.530363.150.874518.0315.77
368.150.85875.8044.984368.150.871215.9113.86
373.150.85525.2774.513373.150.868014.1312.26
PAO4PAO16
278.150.825282.5468.11278.150.8439826.8697.8
283.150.822163.2051.96283.150.8409590.1496.2
288.150.819049.3140.38288.150.8379430.7360.9
293.150.815939.1031.90293.150.8349320.6267.7
298.150.812831.4725.58298.150.8319243.0202.2
303.150.809725.6820.79303.150.8289187.3155.3
308.150.806521.2317.12308.150.8259146.6121.1
313.150.803417.7614.27313.150.8230116.495.83
318.150.800315.0212.02318.150.820093.7176.84
323.150.797112.8310.23323.150.817076.3662.39
328.150.793911.068.782328.150.814062.9551.24
333.150.79089.6167.604333.150.810952.4142.50
338.150.78768.5046.698338.150.807944.1135.63
343.150.78447.4665.857343.150.804937.4630.15
348.150.78126.6275.177348.150.801832.0925.73
353.150.77805.9194.605353.150.798827.7222.14
358.150.77495.3194.121358.150.795724.1319.20
363.150.77174.8023.706363.150.792721.1516.76
368.150.76854.3593.350368.150.789718.6414.72
373.150.76533.9763.043373.150.786616.5313.00
Table 2. Experimental density data, ρ/g cm−3, measured with the Anton Paar HPM densimeter of the eight base oils as a function of temperature (T) and pressure (P).
P/MPa T/K
PARA#1NAPH#1ESTER#1PAO4PARA#2NAPH#2ESTER#2PAO16
298.15
0.10.85730.89450.90650.81210.88700.91070.91680.8308
10.85780.89500.90700.81270.88750.91110.91730.8313
50.86010.89730.90930.81500.88960.91320.91950.8335
100.86280.90000.91210.81780.89220.91580.92210.8362
200.86810.90520.91750.82320.89710.92070.92720.8412
400.87770.91480.92760.83280.90610.92980.93670.8504
600.88630.92340.93680.84150.91430.93800.94530.8587
800.89420.93130.94490.84940.92180.94550.95310.8665
1000.90160.93860.95210.85710.92870.95250.96000.8744
313.15
0.10.84730.88450.89580.80240.87740.90080.90690.8219
10.84790.88500.89640.80300.87790.90130.90740.8225
50.85030.88740.89880.80550.88010.90360.90970.8248
100.85320.89030.90170.80850.88290.90630.91250.8277
200.85880.89580.90740.81420.88810.91150.91790.8330
400.86890.90590.91810.82450.89760.92110.92790.8427
600.87800.91490.92780.83360.90620.92980.93700.8514
800.88630.92320.93650.84180.91410.93770.94520.8595
1000.89390.93080.94430.84970.92130.94500.95250.8674
333.15
0.10.83400.87110.88190.78960.86460.88780.89340.8099
10.83470.87170.88240.79020.86510.88840.89390.8105
50.83730.87430.88500.79290.86760.89080.89640.8131
100.84050.87740.88810.79620.87050.89380.89940.8161
200.84650.88340.89420.80240.87620.89940.90520.8220
400.85740.89420.90560.81350.88640.90970.91610.8324
600.86710.90380.91610.82320.89560.91900.92590.8416
800.87580.91250.92550.83190.90390.92740.93460.8500
1000.88380.92060.93400.84000.91150.93510.94220.8581
348.15
0.10.82420.86110.87160.78000.85510.87820.88340.8009
10.82480.86180.87220.78070.85570.87880.88400.8015
50.82760.86450.87490.78350.85830.88140.88660.8042
100.83100.86790.87810.78700.86140.88460.88980.8075
200.83750.87420.88450.79360.86740.89060.89600.8136
400.84890.88560.89650.80530.87820.90140.90740.8247
600.85910.89570.90750.81560.88770.91100.91770.8343
800.86820.90480.91750.82460.89640.91980.92680.8430
1000.87640.91310.92650.83300.90430.92790.93470.8512
353.15
0.10.82090.85780.86820.77680.85190.87500.88010.7978
10.82150.85850.86880.77750.85250.87560.88070.7984
50.82440.86130.87150.78040.85520.87830.88340.8012
100.82790.86470.87480.78400.85840.88150.88660.8045
200.83450.87120.88130.79070.86450.88760.89290.8108
400.84620.88280.89340.80260.87540.89870.90460.8221
600.85640.89300.90460.81300.88520.90850.91500.8319
800.86570.90220.91480.82230.89400.91730.92420.8407
1000.87400.91070.92410.83070.90200.92550.93230.8489
373.15
0.10.80830.84520.85530.76460.84000.86300.86770.7861
10.80840.84530.85540.76480.84000.86310.86780.7862
50.81160.84850.85820.76790.84290.86600.87060.7892
100.81540.85230.86170.77180.84640.86950.87420.7928
200.82250.85940.86860.77900.85300.87620.88090.7996
400.83510.87190.88150.79200.86470.88790.89330.8118
600.84610.88270.89340.80310.87500.89830.90440.8223
800.85580.89240.90440.81300.88430.90760.91410.8316
1000.86460.90130.91440.82180.89270.91620.92250.8401
Table 3. Parameters and deviations for density correlation by using Equation (1).
PARA#1NAPH#1ESTER#1PAO4PARA#2NAPH#2ESTER#2PAO16
A0/g cm−31.03401.05721.07041.08461.10161.10720.98871.0015
104 · A1/g cm−3 K−1−5.5605−5.4302−5.4231−5.5306−6.2946−6.2849−5.5574−5.4016
106 · A2/g cm−3 K−2−0.1262−0.1000−0.1602−0.1059−0.0831−0.0339−0.1155−0.0959
102 · C9.37328.98139.67939.616812.31619.667110.516710.6141
B0/MPa284.529268.536262.860306.981507.125440.691402.898564.606
B1/MPa K−1−0.4194−0.3095−0.1360−0.3398−1.1711−1.1458−0.9538−1.7773
103 · B2/MPa K−2−0.1963−0.3160−0.7213−0.42020.53540.75000. 43250.1572
104 · σ/g cm−34.64.95.15.15.25.06.45.9
AAD/%0.040.040.040.040.050.040.060.06
Bias/%−0.02−0.01−0.03−0.02−0.02−0.02−0.04−0.04
MD/%0.140.130.130.120.100.110.160.13
AAD = average absolute deviation; Bias = average deviation; MD = maximum deviation.
Table 4. Isobaric thermal expansivity, α P /10−4 K−1, of eight base oils, as a function of temperature (T) and pressure (P).
P/MPa T/K
PARA#1NAPH#1ESTER#1PAO4PARA#2NAPH#2ESTER#2PAO16
298.15
0.17.46.87.16.87.57.17.77.2
57.36.77.06.77.47.07.57.0
206.96.46.76.47.06.67.26.7
606.35.96.25.96.36.06.45.8
1005.85.55.75.55.75.55.85.2
313.15
0.17.56.97.36.97.67.27.87.3
57.46.87.16.87.57.07.77.1
207.06.56.86.57.16.77.26.7
606.35.96.15.96.36.06.45.9
1005.85.55.75.45.75.45.75.2
333.15
0.17.77.17.47.07.87.38.07.5
57.56.97.36.97.67.17.87.3
207.16.66.96.57.26.77.36.8
606.35.96.15.86.35.96.35.9
1005.75.45.55.35.65.45.65.2
348.15
0.17.87.27.67.17.97.48.17.6
57.67.07.47.07.77.27.97.4
207.16.66.96.67.26.87.46.9
606.25.86.05.76.25.96.25.9
1005.65.35.45.25.55.35.55.2
353.15
0.17.97.27.67.27.97.48.27.6
57.77.07.47.07.77.28.07.4
207.16.66.96.67.26.87.46.9
606.25.86.05.76.25.96.25.9
1005.55.35.35.15.45.35.45.2
373.15
0.18.07.47.87.38.17.58.47.8
57.87.27.67.17.97.38.17.6
207.26.76.96.67.36.87.47.0
606.05.75.75.66.15.86.15.9
1005.25.14.94.95.25.25.25.2
Table 5. Isothermal compressibility, kT/10−4 MPa−1, of the eight base oils studied in this work.
P/MPa T/K
PARA#1NAPH#1ESTER#1PAO4PARA#2NAPH#2ESTER#2PAO16
298.15
0.16.596.066.125.715.995.836.706.08
56.405.885.955.565.875.686.515.93
205.865.405.505.165.525.266.025.52
604.804.454.584.344.794.415.024.67
1004.083.793.943.754.243.814.324.06
313.15
0.16.996.386.476.036.386.227.176.54
56.776.196.285.876.246.046.966.37
206.175.665.785.425.865.586.405.90
605.014.624.784.525.044.635.284.94
1004.233.924.083.894.433.984.514.27
333.15
0.17.616.897.046.536.986.797.897.22
57.356.666.826.346.816.597.647.01
206.656.056.235.836.366.046.976.44
605.324.885.084.805.414.955.675.32
1004.454.114.304.104.724.214.794.55
348.15
0.18.167.337.556.987.497.288.537.78
57.867.077.306.767.307.058.237.54
207.066.396.636.186.786.427.466.89
605.585.105.355.045.715.205.995.62
1004.644.274.504.274.954.395.024.77
353.15
0.18.377.497.757.147.687.458.767.98
58.057.227.486.927.487.218.457.72
207.226.516.786.316.936.557.647.04
605.685.185.445.125.825.296.105.73
1004.704.324.564.335.034.465.114.84
373.15
0.19.308.238.667.908.518.229.808.82
58.917.918.337.628.267.929.428.51
207.907.077.476.897.607.148.427.69
606.105.535.885.516.295.676.606.15
1004.994.564.874.605.384.725.455.15
Table 6. Dynamic viscosity, η/mPa s, at different temperatures, T/K, and pressures, P/MPa, measured with the high-pressure falling body viscometer.
T/K323.15353.15323.15353.15323.15353.15323.15353.15
P/MPaPARA#1PARA#2NAPH#1NAPH#2
1012.285.14872.3521.3814.316.00563.7716.56
1513.575.61482.0223.7116.576.56672.7318.21
2516.426.620103.928.8521.837.83594.1922.07
5025.349.618176.545.1940.7512.09176.836.32
7537.5913.47284.768.0972.2118.50327.060.77
10054.4118.40446.2100.2124.528.2600.3102.7
12577.5124.74687.1145.2211.542.71098.3174.8
150109.332.91047.1208.3356.564.72006.1298.7
P/MPaESTER#1ESTER#2PAO4PAO16
1019.097.89466.8022.5811.675.13271.0525.08
1520.968.53473.3424.5612.695.54878.3227.20
2525.099.91487.7028.8314.916.43294.1431.79
5037.9514.04132.541.5421.588.971142.545.6
7555.5419.36193.757.8330.2512.07206.663.4
10079.5826.21277.378.7041.5215.84291.686.4
125112.535.03391.6105.456.1820.44404.4116.3
150157.546.41547.9139.875.2426.05554.2155.0
Table 7. Parameters and deviations for the viscosity correlation by using Equation (6).
T/K323.15353.15323.15353.15323.15353.15323.15353.15
PARA#1PARA#2NAPH#1NAPH#2
A7.586526.1153611.00910.43124.68530.88180.892.3
B419.07398.94519.04584.551044.621733.573305.64699.7
σ/mPa s0.30.23.60.91.20.074.74.0
ESTER#1ESTER#2PAO4PAO16
A7.2196.0509.5527.0415.9154.0055.8936.226
B405.830405.78574.04482.55373.62276.70334.11408.60
σ/mPa s0.30.071.90.80.150.11.60.3
Table 8. Universal pressure–viscosity coefficient αfilm and reciprocal asymptotic isoviscous pressure coefficient α∗ for the base oils.
Base OilsT/Kαfilm/GPa−1α∗/GPa−1
PARA#1323.1516.315.2
353.1513.412.8
PARA#2323.1519.719.2
353.1516.516.1
NAPH#1323.1522.822.6
353.1517.317.2
NAPH#2323.1524.124.1
353.1519.419.4
ESTER#1323.1515.915.3
353.1513.312.4
ESTER#2323.1515.314.9
353.1513.012.5
PAO4323.1513.813.2
353.1511.811.0
PAO16323.1515.414.6
353.1513.412.8
Disclaimer/Publisher’s Note: The statements, opinions and data contained in all publications are solely those of the individual author(s) and contributor(s) and not of MDPI and/or the editor(s). MDPI and/or the editor(s) disclaim responsibility for any injury to people or property resulting from any ideas, methods, instructions or products referred to in the content.

