Article

Research on Splash Lubrication Characteristics of a Spiral Bevel Gearbox Based on the MPS Method

1
State Key Laboratory of Heavy-Duty and Express High-Power Electric Locomotive, CRRC Zhuzhou Locomotive Co., Ltd., Zhuzhou 412001, China
2
State Key Laboratory of Rail Transit Vehicle System, Southwest Jiaotong University, Chengdu 610031, China
3
Simulation Department, Suzhou shonCloud Engineering Software Co., Ltd., Suzhou 215100, China
*
Author to whom correspondence should be addressed.
Lubricants 2023, 11(12), 520; https://doi.org/10.3390/lubricants11120520
Submission received: 16 November 2023 / Revised: 4 December 2023 / Accepted: 5 December 2023 / Published: 8 December 2023

Abstract

:
In order to accurately and efficiently analyze the distribution law and motion status of lubricating oil in the spiral bevel gearbox of the electric multiple unit (EMU), a high-fidelity 3D CFD model of the spiral bevel gearbox of the EMU was established for the first time. The moving particle semi-implicit method was used to visualize the lubricating-oil flow field distribution characteristics of the gearbox. The distribution characteristics of lubricating oil in the gearbox with varying gear rotation speeds, initial lubricating-oil volume levels and oil temperatures were analyzed. It was found that the initial lubricating-oil volume is the factor with the largest influence, while the influences of gear rotation speed and oil temperature are relatively small. By analyzing the churning loss under various simulation conditions, it was found that the churning loss is positively correlated with the gear rotation speed and initial oil volume, and is more affected by the initial oil volume. The churning loss is negatively correlated with the oil temperature, and both are nonlinear relationships. The proportion of churning loss related to the driven gear is higher compared to that of the driving gear. These results can provide a theoretical basis for the subsequent optimization of the gearbox.

1. Introduction

The traction motor, gearbox and wheelset are the key components of the power wheelset of the electric multiple unit’s (EMU) bogie. As the core unit of power conversion and transmission, the reliability of the gearbox directly determines the safety of the EMU. The gearbox of EMU has a high power-to-weight ratio, complex structure and compact installation space, so splash lubrication is usually used. The power loss of the gearbox during operation is inevitable, and a significant portion of this loss is ultimately transformed into heat and dissipated into the environment. According to its relationship with the load, the power loss can be divided into load-dependent power loss and load-independent power loss; and the churning loss accounts for approximately 30% of the load-independent power loss, which seriously hampers the transmission efficiency [1]. Accurate prediction of churning loss is an extremely challenging aspect of the gearbox design process, because it is heavily affected by the lubricating-oil distribution in the gearbox, which is relatively unknown. The churning power loss in gearboxes can be obtained by experiments and empirical formulas [2,3,4,5]. While these methods can provide some reference in the initial estimation stage of the gearbox design process, their continued use in the specific structural design and parameter selection can result in design inaccuracies. Therefore, it is still an urgent and challenging task to investigate the churning loss and lubrication characteristics of EMU gearboxes under splash lubrication.
Throughout the past several decades, with the enhancement of computing power, the computational fluid dynamics (CFD) method has gradually become a robust and effective tool for analyzing the lubrication characteristics of gearboxes. Some scholars have employed CFD methods to investigate churning power loss and lubricating-oil distribution in gearboxes. Based on the finite volume method (FVM), Liu et al. [6,7] established a three-dimensional CFD simulation model of a single-stage gearbox considering oil–air two-phase flow, and studied the effects of rotation speed, oil fill level and kinematic viscosity on oil distribution and churning power loss. The oil distribution and churning resistance torque obtained by the CFD method are consistent with the oil distribution records obtained by the high-speed camera and the values obtained by the torque instrument. According to their research conclusions, the speed is the most significant influencing factor for churning resistance torque. Chen and Matsumoto [8] constructed a rotatable single-stage transmission gearbox test bench to investigate the effects of the relative position of the gear on the oil surface profile and churning loss. Additionally, various shapes of fillers are inserted into the gearbox to simulate the influence of the actual shape of the box on the churning loss. The results show that the filler with a specific structure can significantly reduce the churning loss, consistent with the conclusion reached by Hildebrand et al. [9]. And Hu et al. [10] developed a CFD simulation model of a gearbox considering dynamic motion and applied sinusoidal motion to the gearbox by using the method of a non-inertial coordinate system. By comparison with the experimental results of Chen and Matsumoto [8], the correctness and applicability of the established model were verified. Further analysis was conducted on the impacts of the amplitude and frequency of the dynamic motion of the gearbox on the churning power loss. Regarding the FZG test bench, Mastrone and Concli [11] substituted for the lubricating oil with grease and used the Herschel–Bulkley model to describe the non-Newtonian fluid characteristics of the grease. Liu et al. [12] established a CFD model, including gears and bearings, and extended the FVM from a single-stage gearbox to a planetary gearbox with a complex structure. However, to minimize workload, the dynamic motion of the bearing was ignored, and the bearings were set as static. References [6,7,8,9,10,11,12] have shown the great potential of FVM in predicting the distribution of lubricating oil and the churning loss in the gearbox. Nevertheless, when applying this method, a special dynamic mesh strategy is needed to generate the mesh of the gear meshing area. Liu et al. [12], Cho et al. [13], Burberi et al. [14] and Mastrone et al. [15] employed overlapping grids, the immersed boundary method, a local grid reconstruction and a global grid reconstruction method to mesh the gear meshing area, so that the gear meshing could be simulated more realistically. Furthermore, Mastrone and Concli [16] proposed a new mesh processing strategy, that is, a global mesh reconstruction of mesh clustering. By combination with the global mesh reconstruction method, a two-stage industrial gearbox CFD model is established. Theoretically, the FVM method can be extended from the single-stage transmission to the multi-stage transmission gearbox [16,17]. However, since FVM is a grid-based Euler technique, each element needs to follow the conservative Euler equation in the process of application, and the entire computational domain needs to be meshed. In order to ensure the integrity of the whole calculation domain, it is usually necessary to artificially reduce gear or expand the center distance. It is precisely because of the application of these measures that the tooth surface shape or assembly relationship of the gear is altered, influencing the power loss, transmission efficiency and lubrication characteristics obtained through simulation.
Numerical methods based on particles can effectively compensate for the aforementioned drawbacks. Particle-based numerical methods typically employ a Lagrangian coordinate system. Compared with the grid-based Euler method, particle-based numerical methods do not need to mesh the whole computational domain, and only the fluid domain needs to be filled with fluid particles with specific physical properties. It is precisely due to this method that gear scaling and various mesh division techniques have become outdated. Smoothed particle hydrodynamics (SPH) and the moving particle semi-implicit (MPS) method are two commonly used meshless particle methods. Ji et al. [18] used a continuum surface force to model the interfacial surface force between multiphase fluids and used color function to describe different phases. A multiphase fluid numerical model based on SPH was established, and the aeration behavior in the gearbox was analyzed for the first time. Compared with the particle-image velocimetry results, SPH can capture well the local details of the flow field. Legrady et al. [19] demonstrated a SPH-based simulation model of gearbox flow field suitable for bevel gear transmission, and conducted extensive tests on different rotation speeds, rotation directions and liquid level filling heights. When compared with the experimental results, the numerical flow field obtained by the numerical model considering the surface tension is more consistent with the experimental results. In addition, they studied the churning loss with different gear-reduction ratios. If the gear pair is reduced to 98% of the original size during the simulation process, the average difference in churning loss can reach 30%. Liu et al. [20] used the CFD model based on SPH to simulate the oil distribution and churning loss of the FZG test gearbox. The SPH method is very robust and accurate in predicting oil distribution, but the error level between the churning loss obtained by SPH and that of the test results can reach 82%. To achieve more accurate quantitative results, optimization and improvement of the SPH are still needed [21,22]. Liu et al. [23] conducted a series of extensive numerical simulations using the MPS method with reference to the gearbox model established in reference [20].
Based on these findings, combined with the experimental results provided in references [6,20], it can be pointed out that both the MPS and SPH methods can be used to predict the oil distribution, but the churning loss obtained by the MPS method is more accurate than that determined by SPH. Deng et al. [24] and Xie et al. [25] established high-fidelity numerical simulation models for gearboxes used in different types of rail vehicles and carried out simulation calculations with different speeds and lubricating-oil volume levels and viscosities, providing a precedent for the engineering application of the MPS method. The simulation model they established retained the complex gearbox structure, and the modeling process was very simple. However, this is difficult to achieve in the FVM. Guo et al. [26] further analyzed the influences of gear parameters on the churning loss. According to the experimental results in this paper, the power losses of the numerical simulations of gear pairs are in good agreement with those of the experiment. Deng et al. applied the MPS method to study the lubrication performance of the roller enveloping worm reducers [27]. Wei et al. conducted a study on the churning loss and lubricating-oil distribution of a hydraulic pump used in engineering vehicles, based on the MPS method. In addition, they also studied the flow pattern of lubricating oil around the rotating disk under low temperature conditions, dividing the flow pattern of lubricating oil around the disk into coated, immersed and reverse oil films [28,29]. The above literature indicates that the MPS method has a significant advantage in determining the churning loss of the gear transmission system.
The gearbox of an EMU usually adopts a single-stage gear transmission, which can be divided into parallel shaft transmissions and cross shaft transmissions according to the arrangement of the transmission shafts. Compared with the parallel shaft transmission, the bevel gear transmission system driven by the universal shaft is beneficial for reducing the unsprung mass of the bogie and improving the dynamic performance of the EMU. However, because of the shift angle of the bevel gear transmission, the oil splashing in the gearbox becomes more complicated, compared to the parallel transmission. Hu et al. [30] took the helicopter intermediate gearbox as their research object, established an oil–air two-phase flow model that included an oil guide device, casing and spiral bevel gear pair, and discussed in detail the various operating factors occurring during the helicopter’s work, such as gear rotation speed, oil properties and aircraft inclination angle, as well as their impacts on the churning loss of the gearbox. Jiang et al. [31] used the same CFD model as Hu et al. to analyze the influence of the oil guide device on the lubrication effect of the gearbox. They found that the structural aperture of the oil guide device and the radius of the oil duct have important influences on the oil supply of the bearing, but have minor effects on the churning loss and the lubrication of the gear meshing zone. Lu et al. [32] established a CFD model of oil–air two-phase flow for the intermediate gearbox used in helicopters. According to the oil flow characteristics, the lubricating oil stirred by the gear is divided into free flow, jet flow and splash flow. In addition, they also introduced a multi-reference frame to describe the rotations of gears and bearings in the established CFD model. And they built a heat-flow coupling model and discussed the convective heat transfer coefficient and temperature characteristics of the gearbox [33,34]. Bevel gear transmission is not only widely used in helicopter transmission systems, but also very common in truck-axle transmission systems. Peng et al. [35] overcame the difficulties of generating meshes in the meshing zone of bevel gear transmission systems by applying the tooth-surface translation method. And an experimental platform matching the simulation model was designed to verify the accuracy of the numerical method. They also applied the proposed modeling method to the drivetrain system and used the multi-objective optimization and response surface method to optimize the system [36,37]. Although the authors of the above literature have carried out relevant research on the lubrication characteristics of the splash-lubricated bevel gear transmission system, the numerical model used for research is quite different from the actual model. Compared with the gears in the engineering model, the gears in References [30,31,32,33,34,35,36,37] are all reduced, and therefore cannot reflect the real tooth surface shapes and meshing relationships. In addition, in order to reduce the pre-processing of the model and the number of grids used for numerical calculation, a box with a relatively simple shape is necessary. The application of these measures, however, would greatly weaken the guiding role of numerical simulation in engineering practice.
The shape of the casing of the EMU is very important to the analysis of the lubrication characteristics of the gearbox. In order to put forward reasonable measures for subsequent optimization and improve the working performance of the gearbox, when the lubrication mechanism of the gearbox is numerically simulated, retaining the actual structural characteristics of the casing can improve the guiding role of numerical simulation. In this paper, the gearbox of a spiral bevel gear transmission for a body suspension motor EMU is taken as the research object, and a corresponding high-fidelity CFD model is established for the first time. The MPS method is used to analyze the influences of different input shaft speeds, initial lubricating-oil volumes and lubricating-oil temperatures on the distribution of lubricating-oil particles and the churning loss, and the lubrication mechanism of the gearbox is revealed. The organization of this paper is as follows: In Section 2, we introduce MPS and the calculation method of churning loss used in this paper. In Section 3, the spiral bevel gearbox studied in this paper and the processes of establishing the numerical model are presented. In Section 4, the applicability and accuracy of the MPS method are verified. In Section 5, the influences of different working parameters of the gearbox on lubrication characteristics are discussed. Finally, in Section 6, the main conclusions of this paper are given.

2. Numerical Methods

The MPS method utilizes a series of fluid particles to discretize the continuous fluid domain and employs the Lagrangian method to track the fluid particles, an approach which is mainly used to solve the problem of incompressible flow. Different from the traditional method, the MPS method does not need to mesh the continuous fluid domain, but instead determines the motion characteristics of the fluid particles by the motion properties of the fluid at the previous moment and the interaction between the local surrounding particles. In addition, there is no fixed topological structure between fluid particles, so it is very suitable for dealing with free-surface flow problems with large deformation characteristics.

2.1. Governing Equations

In the MPS method, the flow law of the fluid can be described by the continuity equation and the Navier–Stokes equation, and its vector form is [38]:
D ρ D t = 0 ,
D u D t = 1 ρ p + ν 2 u + g ,
where 𝜌 is the fluid density, t is the time, u is the velocity vector, p is the pressure, ν is the dynamic viscosity of the fluid and g represents the acceleration of gravity.

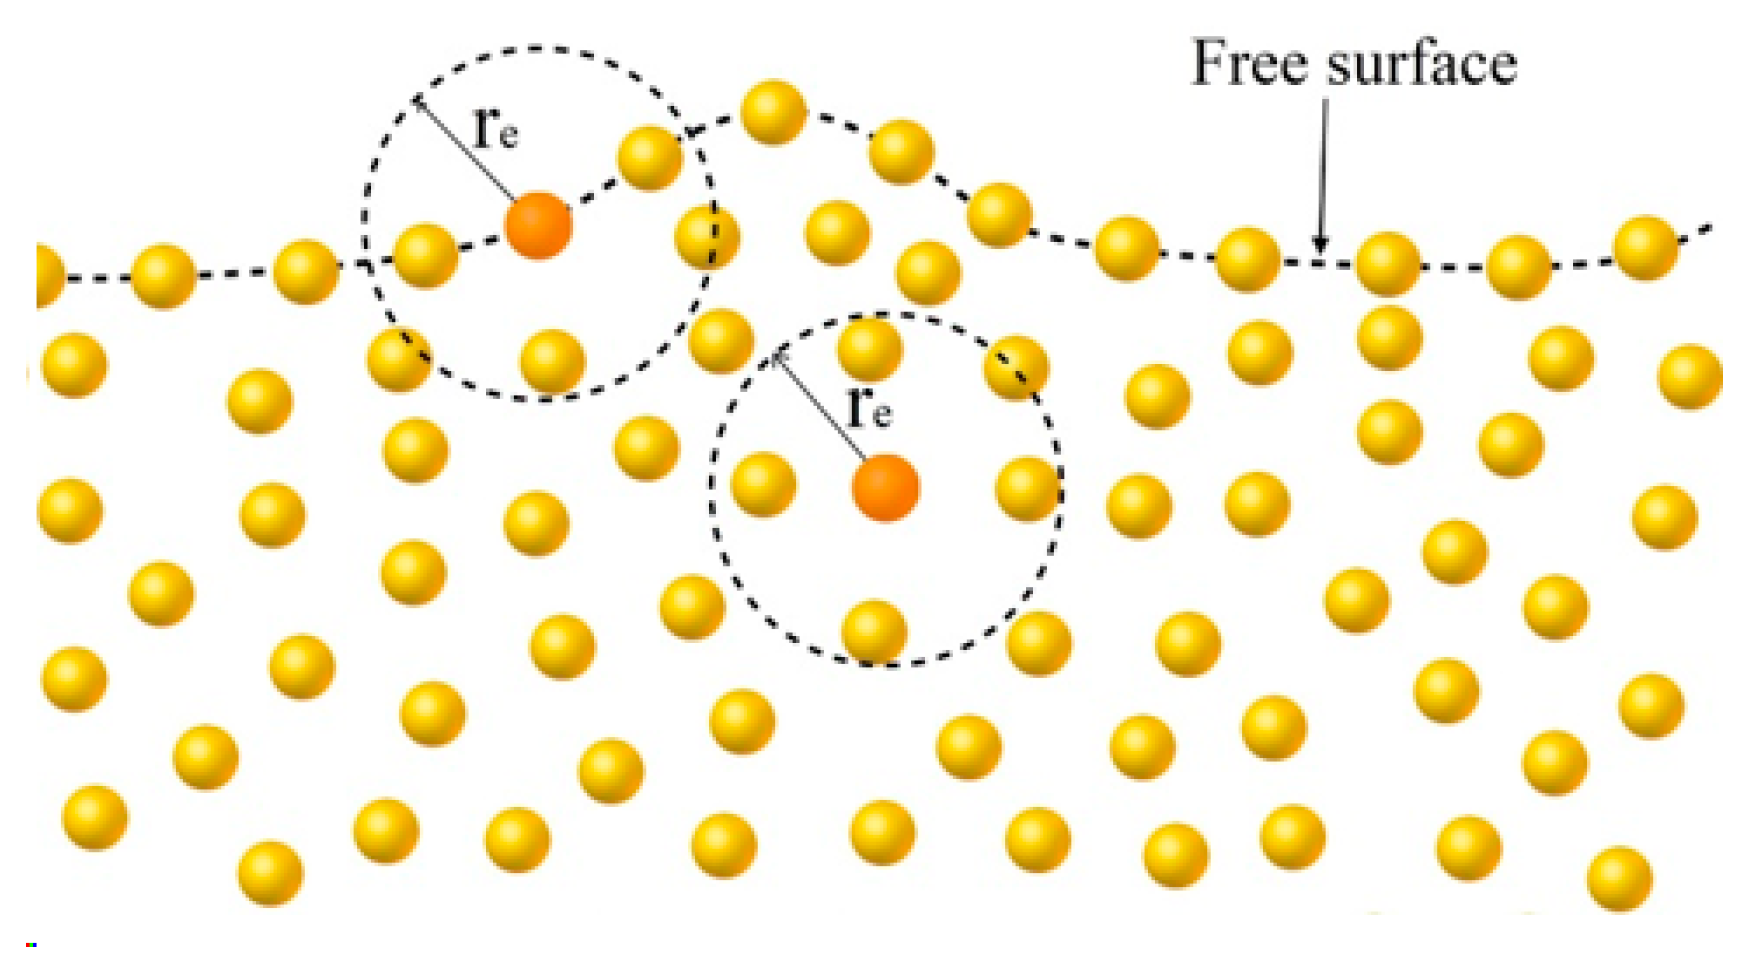
2.2. Kernel Function and Particle Number Density

The position coordinates of the fluid particles are constantly changing in the MPS method. The fluid motion control equation can be solved by means of the interaction between the particles, and the motion law of the fluid particles can be obtained. The interaction between the particles is mainly evaluated by the kernel function, and the kernel function interaction model diagram is shown in Figure 1 [39]. When r < re, there is an interaction between particles. When rre, there is no interaction between particles. The expression of the kernel function is
w ( r ) = r r e 1 ,    ( r < r e )    0 ,           ( r r e ) ,
where r is the distance between two particles, and re is the radius of action of the particles.
In the MPS method, the particle number density represents the distribution of particles within a certain range, which reflects the local density characteristics of the fluid. The particle number density is mainly calculated through a kernel function. Specifically, the particle number density ni of particle i can be expressed as follows:
n i = j i w ( r ) ,

2.3. Particle Interaction Models

The velocity and pressure of the fluid medium are mainly calculated by the gradient model and the Laplace model. Specifically, the gradient model uses the particle number density gradient between adjacent particles to calculate the fluid velocity. When the distances between adjacent particles are shorter, the particle number density is higher, resulting in a larger fluid velocity. The Laplace model employs the Laplace equation to describe the pressure distribution of the fluid and calculates the pressure by solving the Laplace equation. The expressions of Gradient model and Laplace model are as follows [35]:
ϕ i = d n 0 j i φ j φ i r j r i 2 r j r i w r j r i ,
2 ϕ i = 2 d λ n 0 j i ϕ j ϕ i w r j r i ,
λ = j i w r j r i r j r i 2 j i w r j r i ,
where ϕ is the scalar of particle physical parameters; ri and rj are particle coordinate vectors; n0 is the particle number density constant; d is the spatial dimension and λ is the coefficient of the Laplace model.

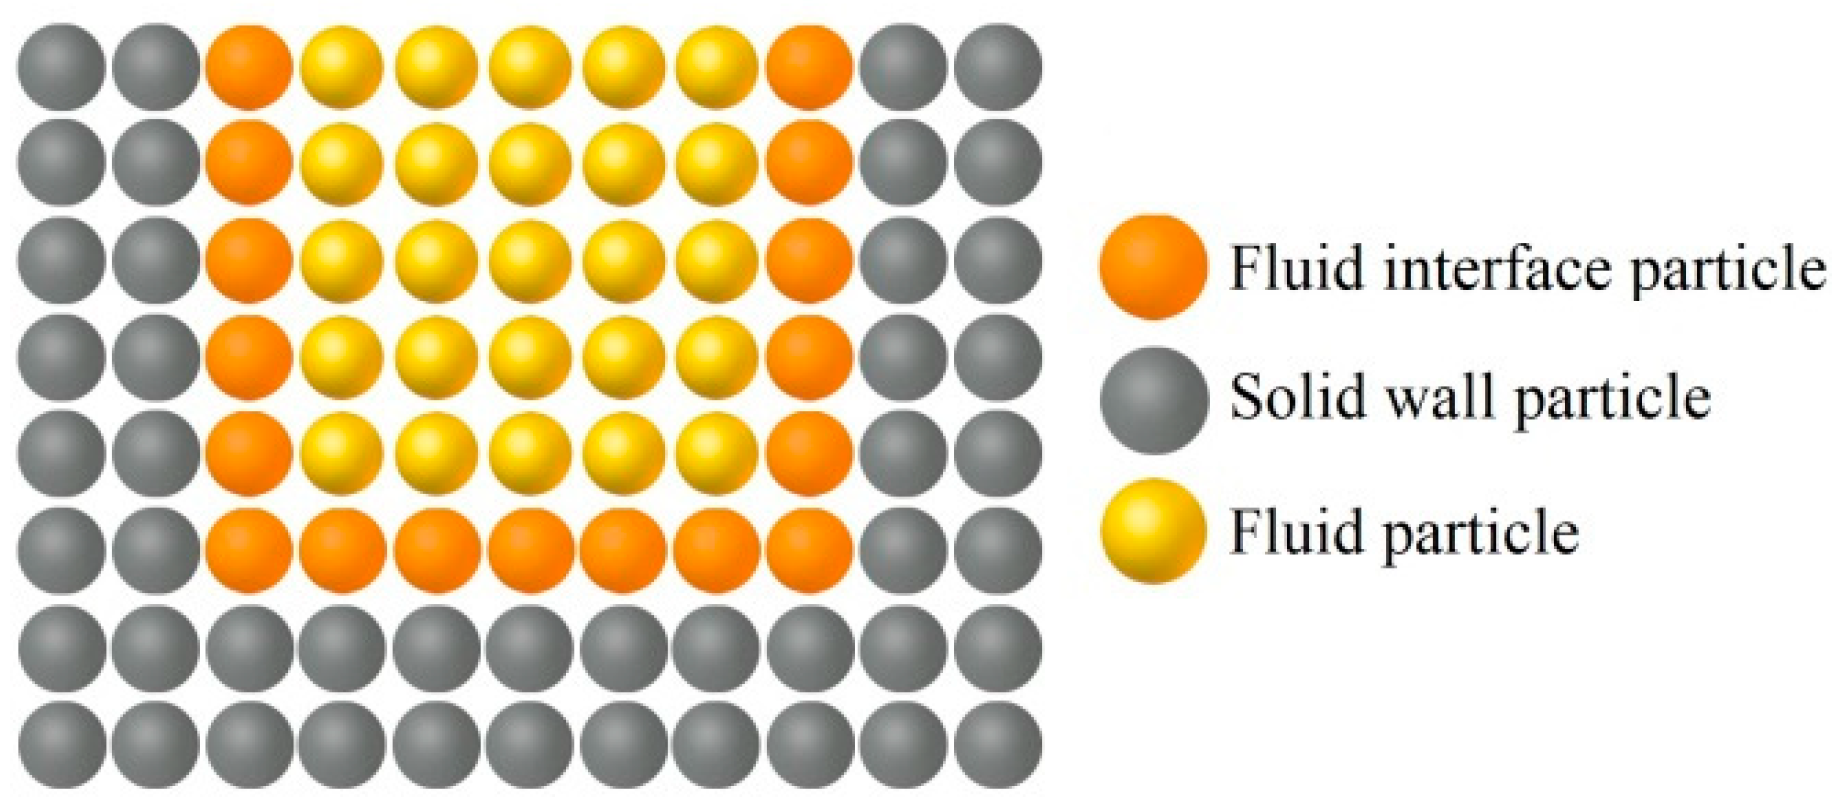
2.4. Boundary Conditions

In the numerical simulation of the flow field characteristics of the gearbox using the MPS method, the non-slip wall boundary and the free surface boundary are the two most commonly used boundary conditions. In general, the air inside the gearbox is ignored, and only the lubricating-oil area is filled with particles. Figure 2 shows the discriminant diagram of the free surface. When a particle is located at the liquid’s surface, its particle density is significantly lower than the initial particle density n0, and this can be used to identify the particles on the free surface. The expression for determining whether particle i is a free-surface particle is as follows:
n i * < β n 0 ,
where β is the free-surface recognition parameter, and β in this study is 0.97 [25].
The non-slip wall boundary is primarily employed to simulate the interaction between a viscous fluid and a solid surface. In the non-slip wall boundary, the wall is assumed to be non-penetrable and without slip. In the MPS method, it is generally achieved by placing virtual particles at the wall and applying appropriate reaction forces and constraints to the fluid particles near the wall. This ensures that the velocity of the particles at the boundary is zero, preventing the fluid particles from entering the solid surface or sliding along the solid surface [40]. The arrangement of wall boundary particles is illustrated in Figure 3.

2.5. Oil Churning Loss

The churning resistance torque generated by the gear pair during operation can be divided into three parts, according to the sources of resistance: the resistance generated by the pressure gradient on the tooth surface, the viscous resistance torque generated due to churning the oil, and the turbulent shear resistance torque. These can be individually calculated using Equations (9)–(11) [26]:
P i = d n 0 j i P j P ^ i r j r i 2 r j r i w r j r i ,
ν 2 u i = ν 2 d λ n 0 j i u j u i w r j r i ,
τ = ρ l 2 u y u y ,
where τ is the turbulent shear stress and l is the mixing length [41].
In the calculation, the product of the oil resistance torque of each gear and its rotation speed is used as the total power loss Ploss of the gearbox. The calculation expression is
P l o s s = T l o s s × N 9550 ,
where Tloss is the churning resistance torque generated by the gear and N is the gear rotation speed.

3. Modeling and Simulation

3.1. Model of a High-Speed Train Gearbox and Simplification

For the spiral bevel gear transmission gearbox used in EMUs, a three-dimensional high-fidelity model is established in SolidWorks 2018, as shown in Figure 4. The gearbox adopts a single-stage transmission, and the speed and torque output by the traction motor are transmitted to the driving gear through a cardan shaft, thereby driving the driven gear to rotate and churning the bottom oil to achieve lubrication. The stagger shift of the bevel gear pair is 90°, and the specific parameters are shown in Table 1.
The gearbox structure of the EMU is complex, with numerous attachments on the casing. According to the transmission mode and working principle of the gearbox, the gearbox has been reasonably simplified to improve the calculation efficiency. The specific simplification measures are as follows:
(1)
Properly simplify minor and non-critical features such as chamfers and fillets on the gearbox casing, while retaining geometric characteristics inside the casing that influence the lubrication characteristics of the gearbox;
(2)
Remove the bolts on the surface of the casing and fill the bolt holes that have little effect on the flow field characteristics, making the inside surfaces of the casing flat and smooth.
The MPS method utilizes a series of particles to fill the oil domain in the gearbox, so it is essential to ensure the integrity and closure of the inner wall of the gearbox when simplifying the model. Compared with other mesh-based methods, this method does not need to mesh the fluid domain, so it is suitable for a complex-shaped gearbox. Moreover, this method does not need to scale the gear to ensure the continuity of the fluid domain, so the complex shape of the gear can be retained to ensure the authenticity of the model as much as possible.

3.2. Physical Parameters and Simulation Condition Settings

The gearbox of the EMU is lubricated and cooled by EMGADRW 75W-90 lubricating oil. The physical parameters of the oil are shown in Table 2. Considering the influence of oil temperature on viscosity and density, according to the viscosity–temperature relationship expression of AGMA 925 A03, the lubricating-oil properties at different temperatures are obtained, as shown in Table 3 [42]. The expressions between oil density, viscosity and temperature are:
ρ = 876 0.6 × T ,
lg l g ν + 0.7 = A B l g T + 273.15 ,
B = lg l g ν 40 + 0.7   lg l g ν 100 + 0.7 l g 373.14 l g 313.15 ,
A = lg l g ν 40 + 0.7 + B × l g 313.15 ,
where ρ is the density, kg/m3; T is temperature, °C; ν is the kinematic viscosity of lubricating oil, mm2/s; A and B are constants; and ν40 and ν100 are the kinematic viscosity of lubricating oil at 40 °C and 100 °C, respectively.
Selecting an appropriate time-step is beneficial for improving the convergence and stability of the calculation. A small time-step makes the calculation tend to be stable, but it significantly reduces computational efficiency. If the selected time-step is too large, the calculation’s results are not easily convergent. The shonDy is a CFD numerical simulation software program based on the MPS method. In shonDy, the time step Δt is selected according to the Courant–Friedrichs–Lewy (CFL) condition, as shown in Equation (17):
Δ t = m i n Δ t i n , c m a x l 0 u m a x , 1 2 d i l 0 2 v + v m a x ,
where l0 is the diameter of the particles, umax is the maximum velocity of the particles, di is the diffusion coefficient, v is the kinematic viscosity of the fluid, vmax is its maximum value, and cmax is the Courant coefficient, which is set to 0.2 in this simulation [43]. ∆tin is the initial time step, c m a x l 0 u m a x is the step calculated based on CFL condition, and 1 2 d i l 0 2 v +   v m a x comes from the stability condition of viscosity calculation.
The diameter of lubricating-oil particles has an important impact on the simulation’s results and computational efficiency. Smaller lubricating-oil particle diameters lead to more accurate computational results but also increase computational costs. When the diameter is below a critical value, further reduction does not notably enhance simulation accuracy but substantially increases calculation time. Therefore, considering the actual calculation time and accuracy, the radius of lubricating-oil particles is set to 1 mm [24,25].
In order to further explore the influence of the gear pair rotation speed, the initial lubricating-oil volume and lubricating-oil temperature on the lubrication characteristics, 10 simulation models were set for numerical simulation, as shown in Table 4. Models 1–4 are used to analyze the influence of gear rotation speed, models 5–7 are used to analyze the influence of initial lubricating-oil volume, and models 8–10 are used to analyze the influence of lubricating-oil temperature. In the process of numerical simulation, the simulation time is set to 3 s. In order to reduce the instantaneous impact during start-up, 0–1 s is the uniform acceleration stage, and 2–3 s is the stable operation stage.
Numerical models were established and simulated using the CFD software program shonDy, and based on the MPS method. The pressure equation is solved by implicit algorithm, and the momentum equation is solved by explicit algorithm. The surface tension coefficient of the lubricating oil is set to 0.02, the wall contact angle is set to 20°, and the gravity of the lubricating-oil particles is 9.8 m/s2. The flow state of the oil in the gearbox is complex during the working process, and the LES turbulence model is employed.

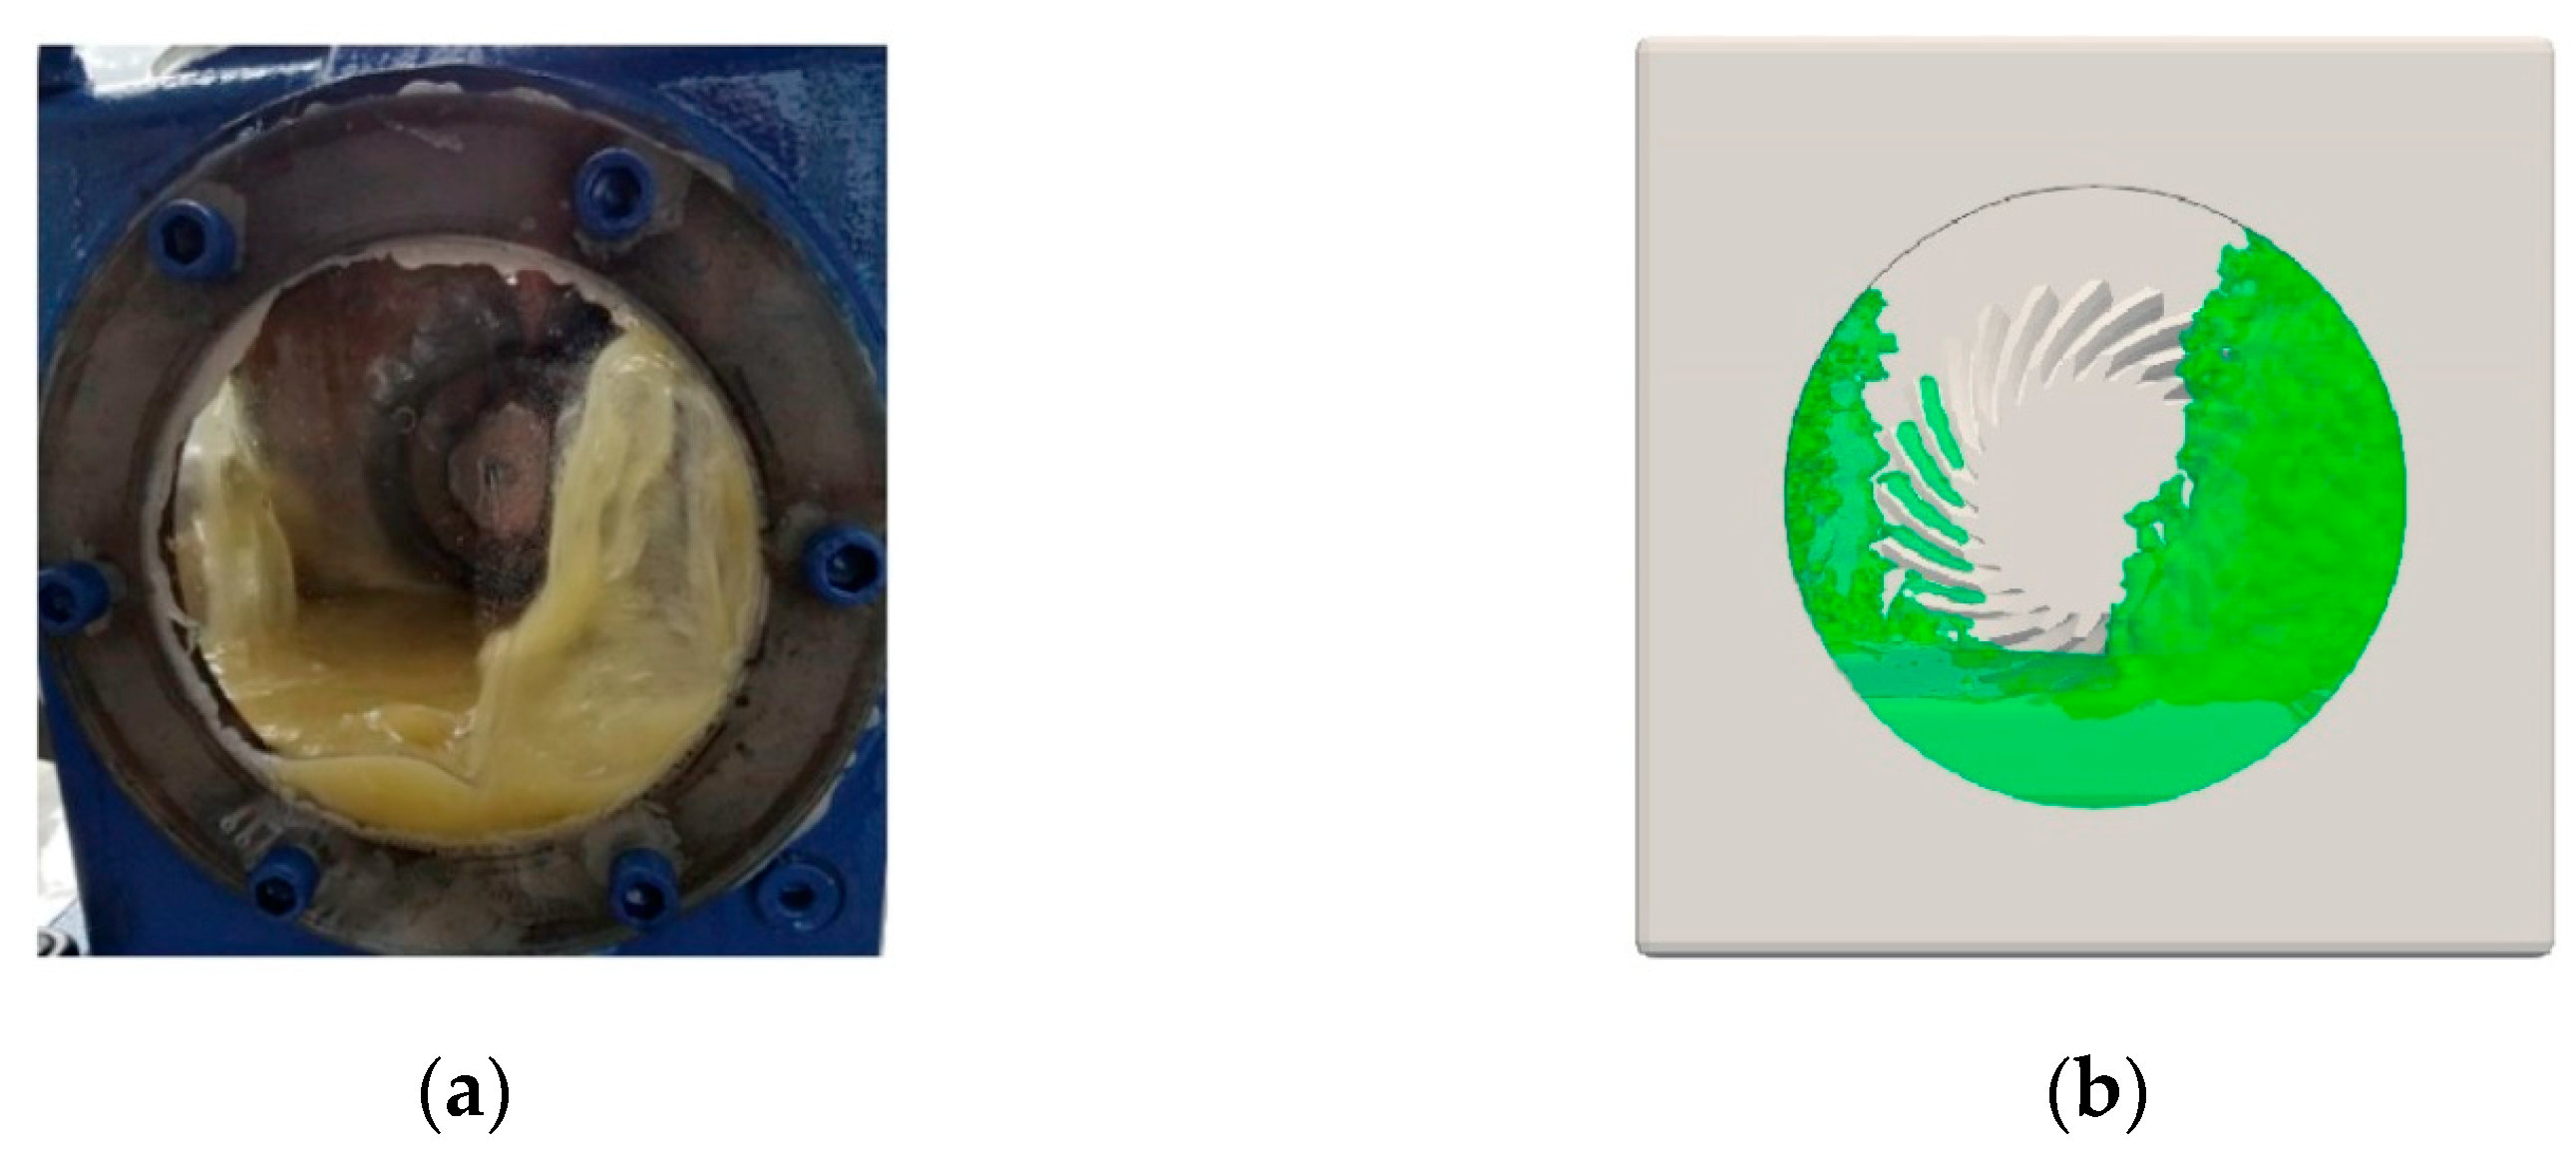
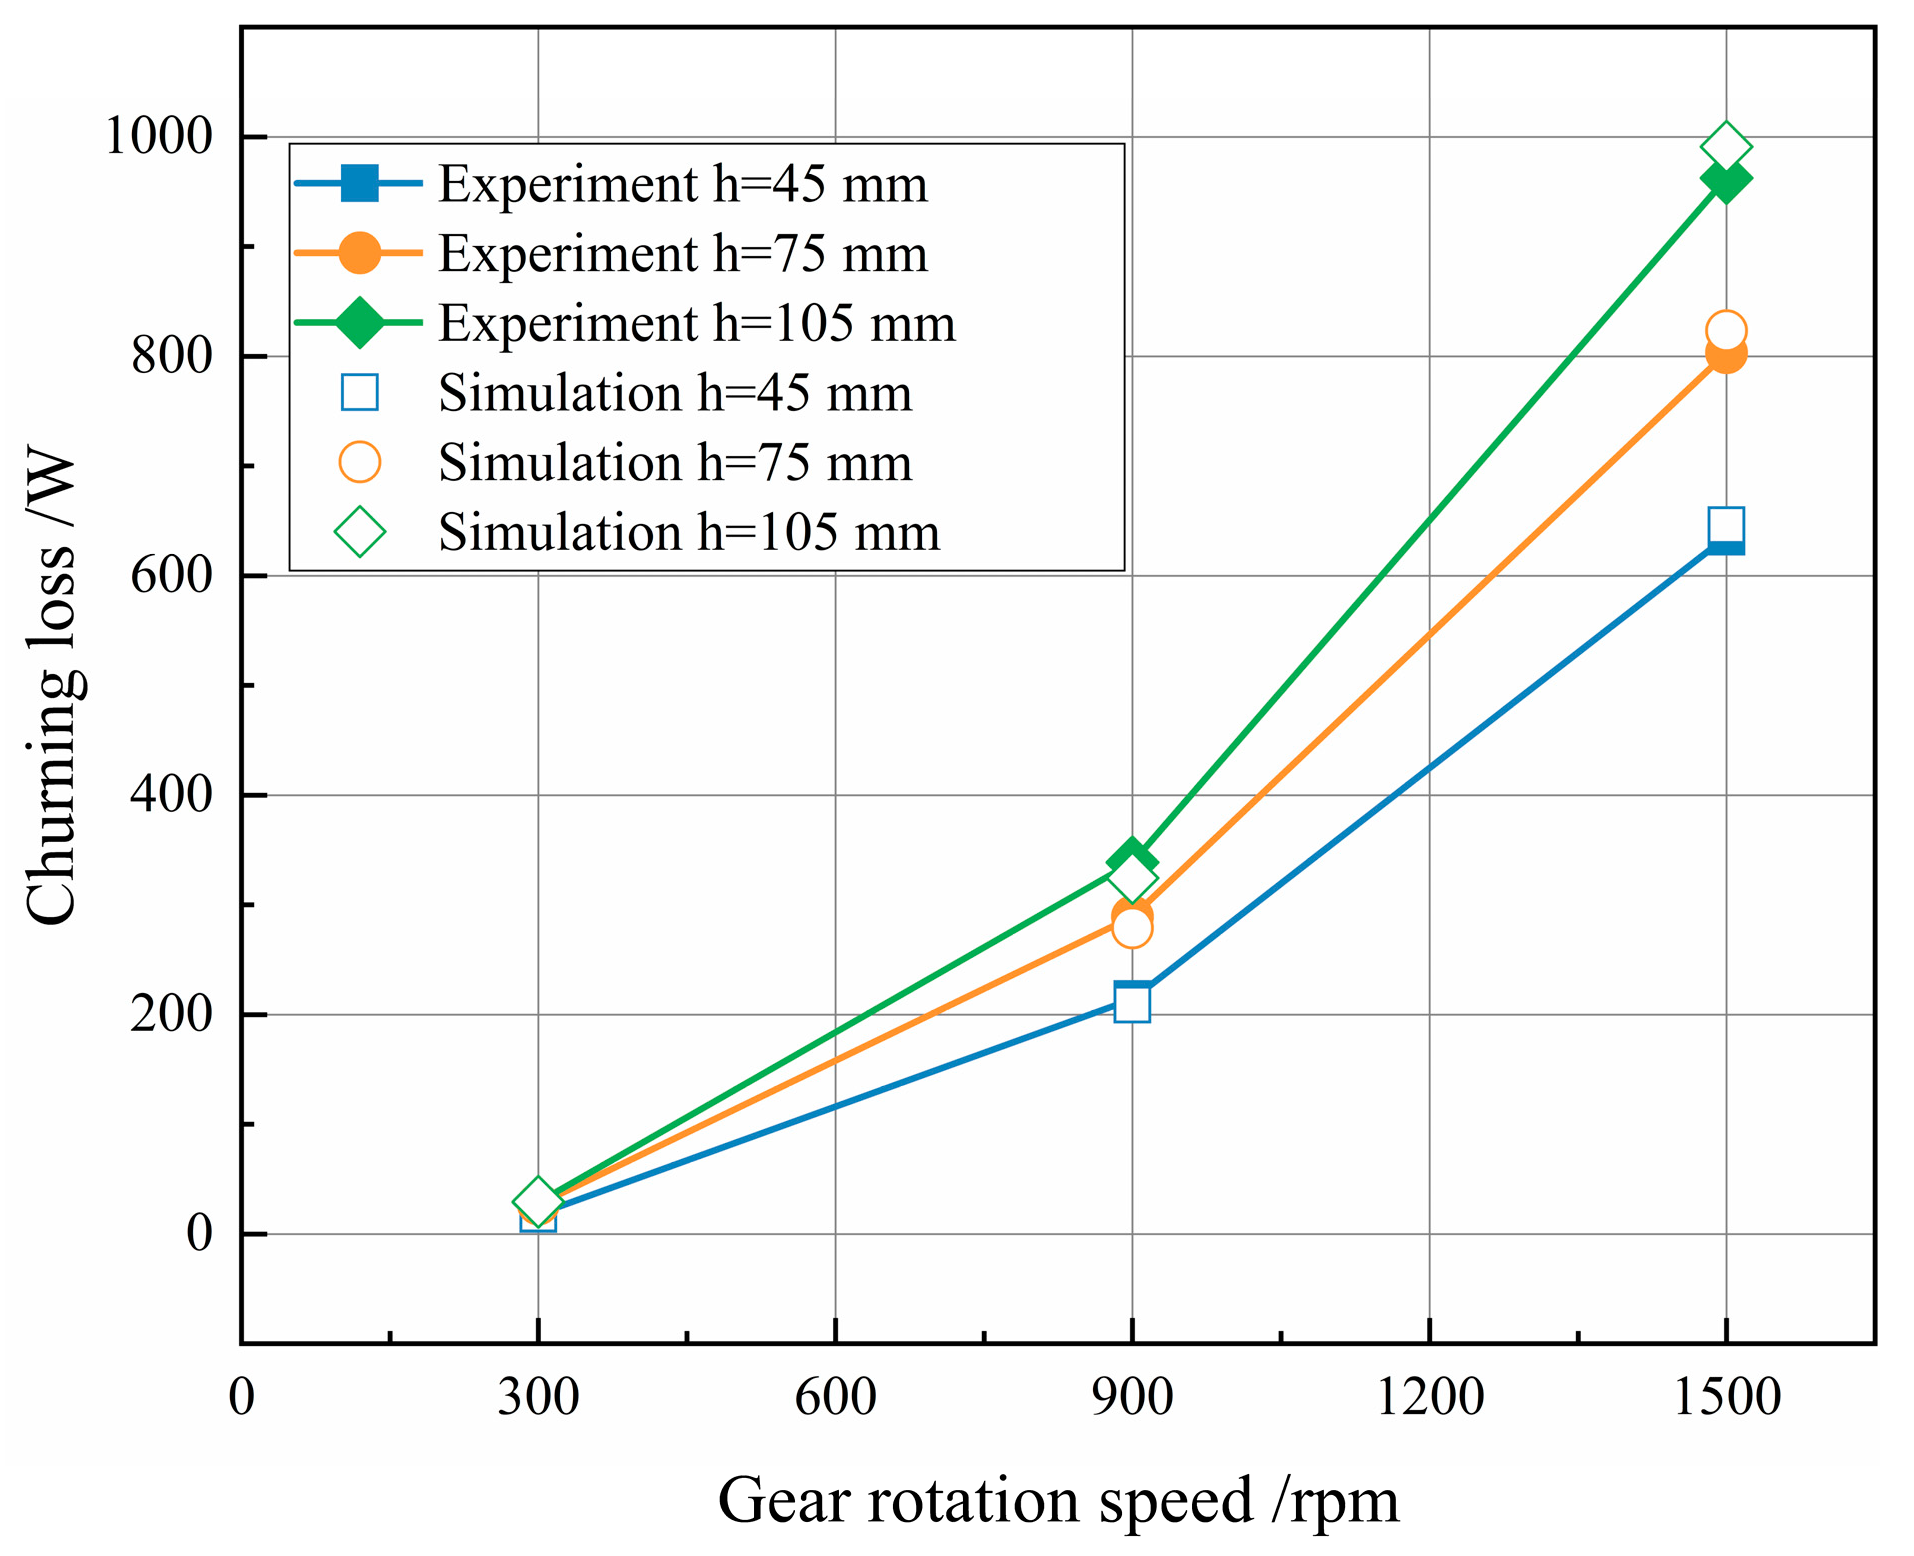
4. Experimental Verification

To verify the applicability and accuracy of the MPS method in analyzing the lubrication characteristics of the bevel gearbox, a simulation model of a helical bevel gearbox was established, with gear parameters as shown in Table 5. The physical parameters of the lubricating oil were set at 40 °C, the density was 850 kg/m3, and the dynamic viscosity was 8.627 × 10⁻² kg/(m·s).
The gear rotation speed was set to 1000 rpm, and the gear immersion depth was defined as 25 mm. The numerical simulation obtains the lubricating-oil distribution under these conditions, which is then compared with the experimental data provided in reference [31], as shown in Figure 5. The numerical simulation results obtained by the MPS method are basically consistent with the oil distribution obtained by the experiment. The lubricating oil accumulates at the lower right of the front transparent glass plate, and the splash behavior of the lubricating oil stirred by the other gear is also in good agreement with the experimental results. Setting the same initial oil immersion depth and gear speed as in reference [30], the churning loss under different working conditions is numerically simulated, as shown in Figure 6.
The numerical results and experimental results also show that at the same oil immersion depth, with the increase of gear rotation speed, the churning loss increases gradually, and the higher the speed is, the more obvious is the increasing trend. Under the same rotation speed, with the increase of oil immersion depth, the churning loss also increases. Moreover, the error between the churning loss obtained by the numerical simulation of the MPS method and that obtained in the experiment is within 5%, which meets the engineering application requirements. In the simulation process, the temperature of the lubricating oil is assumed to be constant, and there is no consideration of the viscosity–temperature characteristics of the lubricating oil, which may cause some errors between the experimental value and the simulation’s value. By comparing the oil distribution and churning loss in the gearbox obtained by the MPS method and the experiment, it can be seen that the MPS method can be beneficially applied to analyze the lubrication characteristics of the bevel gear gearbox.

5. Results and Discussion

The gear rotation speed, initial oil volume and oil temperature are important parameters in the design of the gearbox lubrication system which have important influences on the oil flow and distribution characteristics. Through the post-processing of the numerical results, the number density of the lubricating-oil particles and the particle velocity distributions for different simulation models are obtained, and then the effects of different gear rotation speeds, initial oil volumes and oil temperatures on the lubrication characteristics and churning loss of the gearbox are analyzed. During the operation of the gearbox, the lubricating oil splashes onto the surface of the parts with the rotation of the gear, under the combined actions of gear stirring and the viscous force of the lubricating oil, and thereby achieves lubrication and cooling. The velocities of the lubricating-oil particles can be calculated according to the speed of the gear and the distance to the rotation center. Nevertheless, the velocities of the majority of the lubricating-oil particles in the gearbox are low, with only a small portion of particles near the moving gears exhibiting higher velocities. In order to describe the velocity distribution characteristics of lubricating-oil particles in the gearbox more clearly and accurately, and to describe the differences of particle velocity in the gearbox intuitively and clearly, the display range of the particle velocity nephogram can be set to 0–1 m/s.

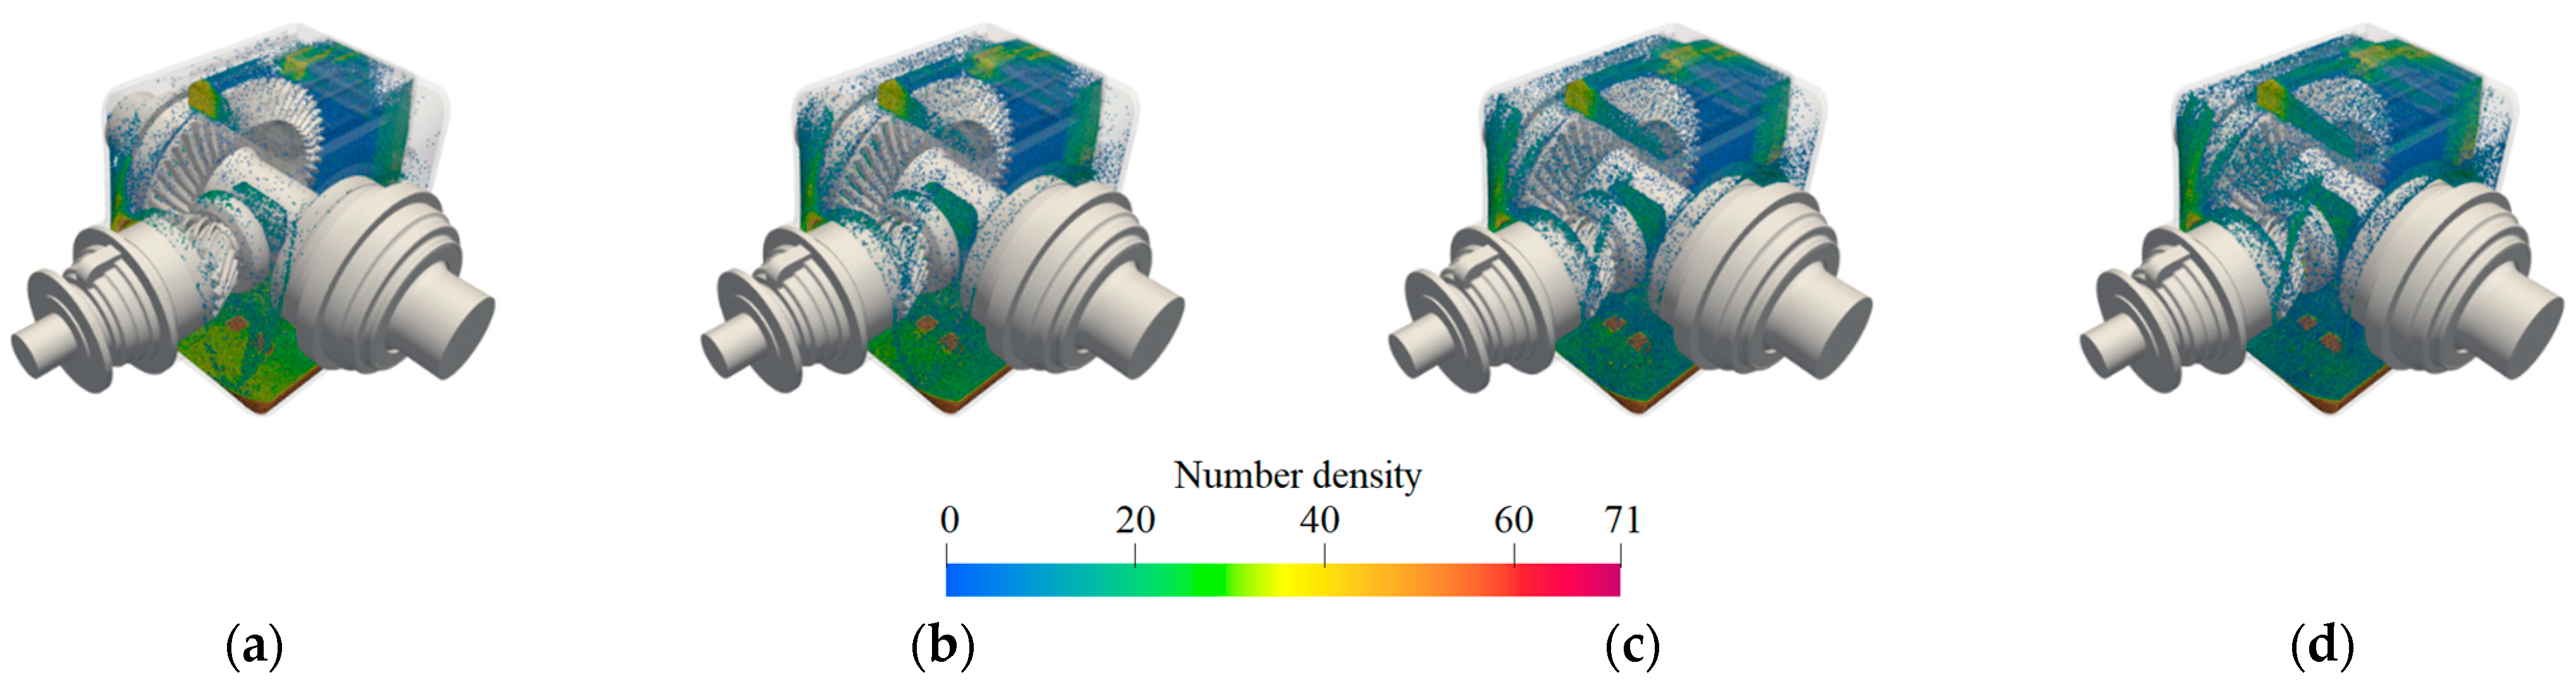
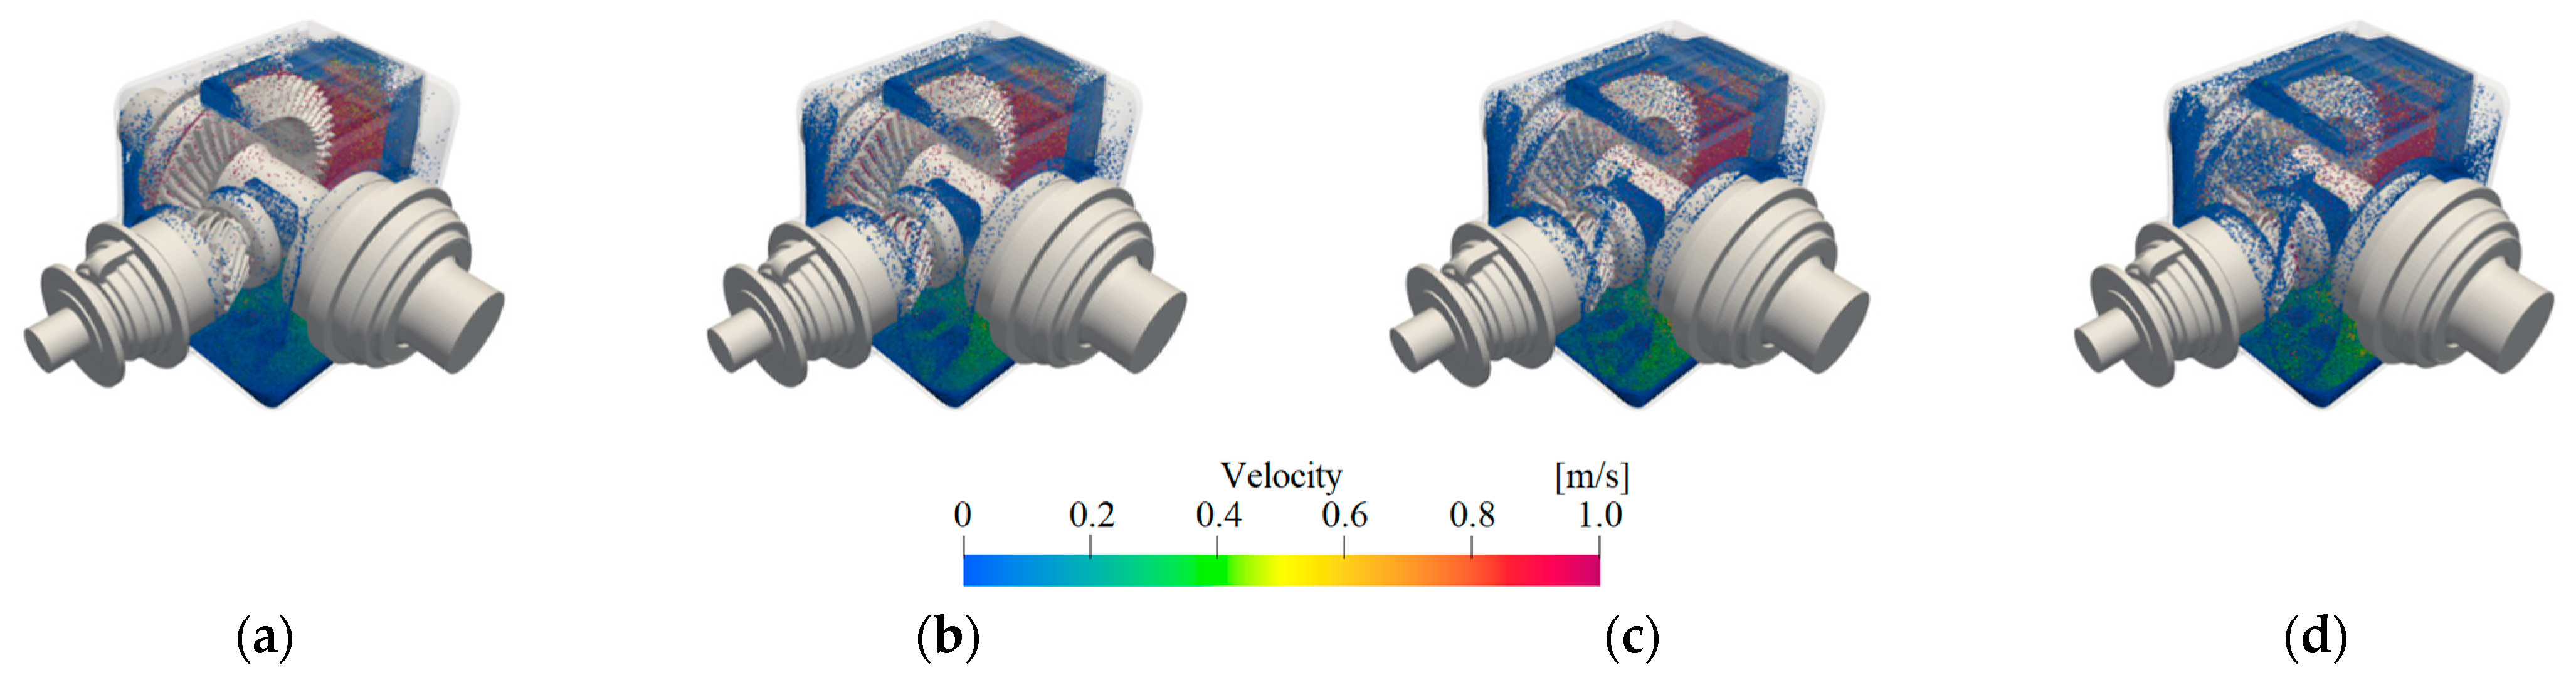
5.1. The Influence of Rotation Speed on the Lubrication Characteristics

The gear rotation speed is a critical factor affecting the lubrication effect and working performance of the gearbox. Under the actual operating conditions, the lubricating oil in the gearbox is in a low-viscosity state. Figure 7 and Figure 8 show the particle number density and particle velocity nephogram at different rotation speeds under low viscosity and medium initial oil-volume. At different speeds, the distribution of lubricating-oil particles in the gearbox is roughly the same, and the stirred-up particles are mainly distributed around the driven gear. At 500 rpm, lubricating oil is adhered to the tooth surface, and the splashed lubricating-oil particles are mainly concentrated at the bottom and rear of the casing. With the increase of rotation speed, the number of stirred-up lubricating-oil particles increases, and the centrifugal force of the particles increases. Some particles directly reach the front of the casing and the meshing area. When the rotation speed reaches 2000 rpm, the splash effect of the particles is significantly enhanced. Some lubricating-oil particles directly splash to the front of the casing or enter the meshing area directly. At the same time, the splash effect of the driving gear on the lubricating-oil particles is significantly improved, which will also make the lubricating-oil particles splash against the inner wall of the casing and cause the particles to be more evenly distributed inside the box.

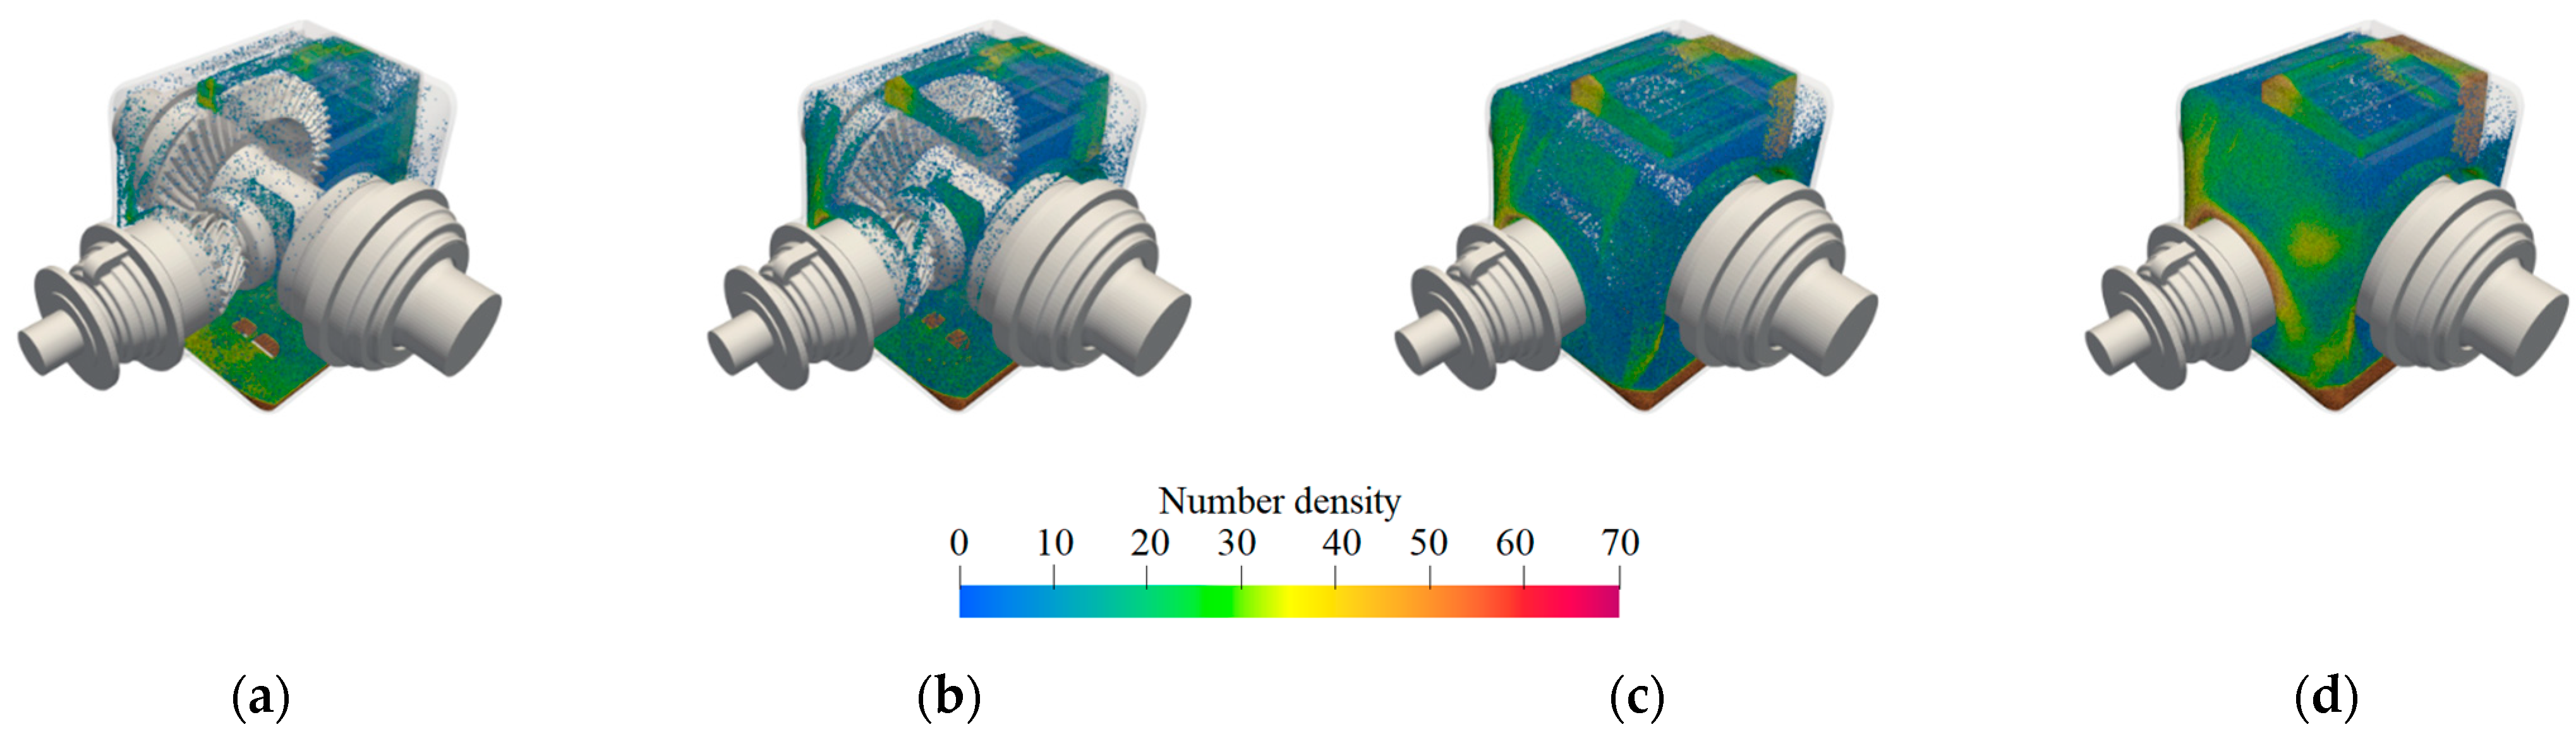
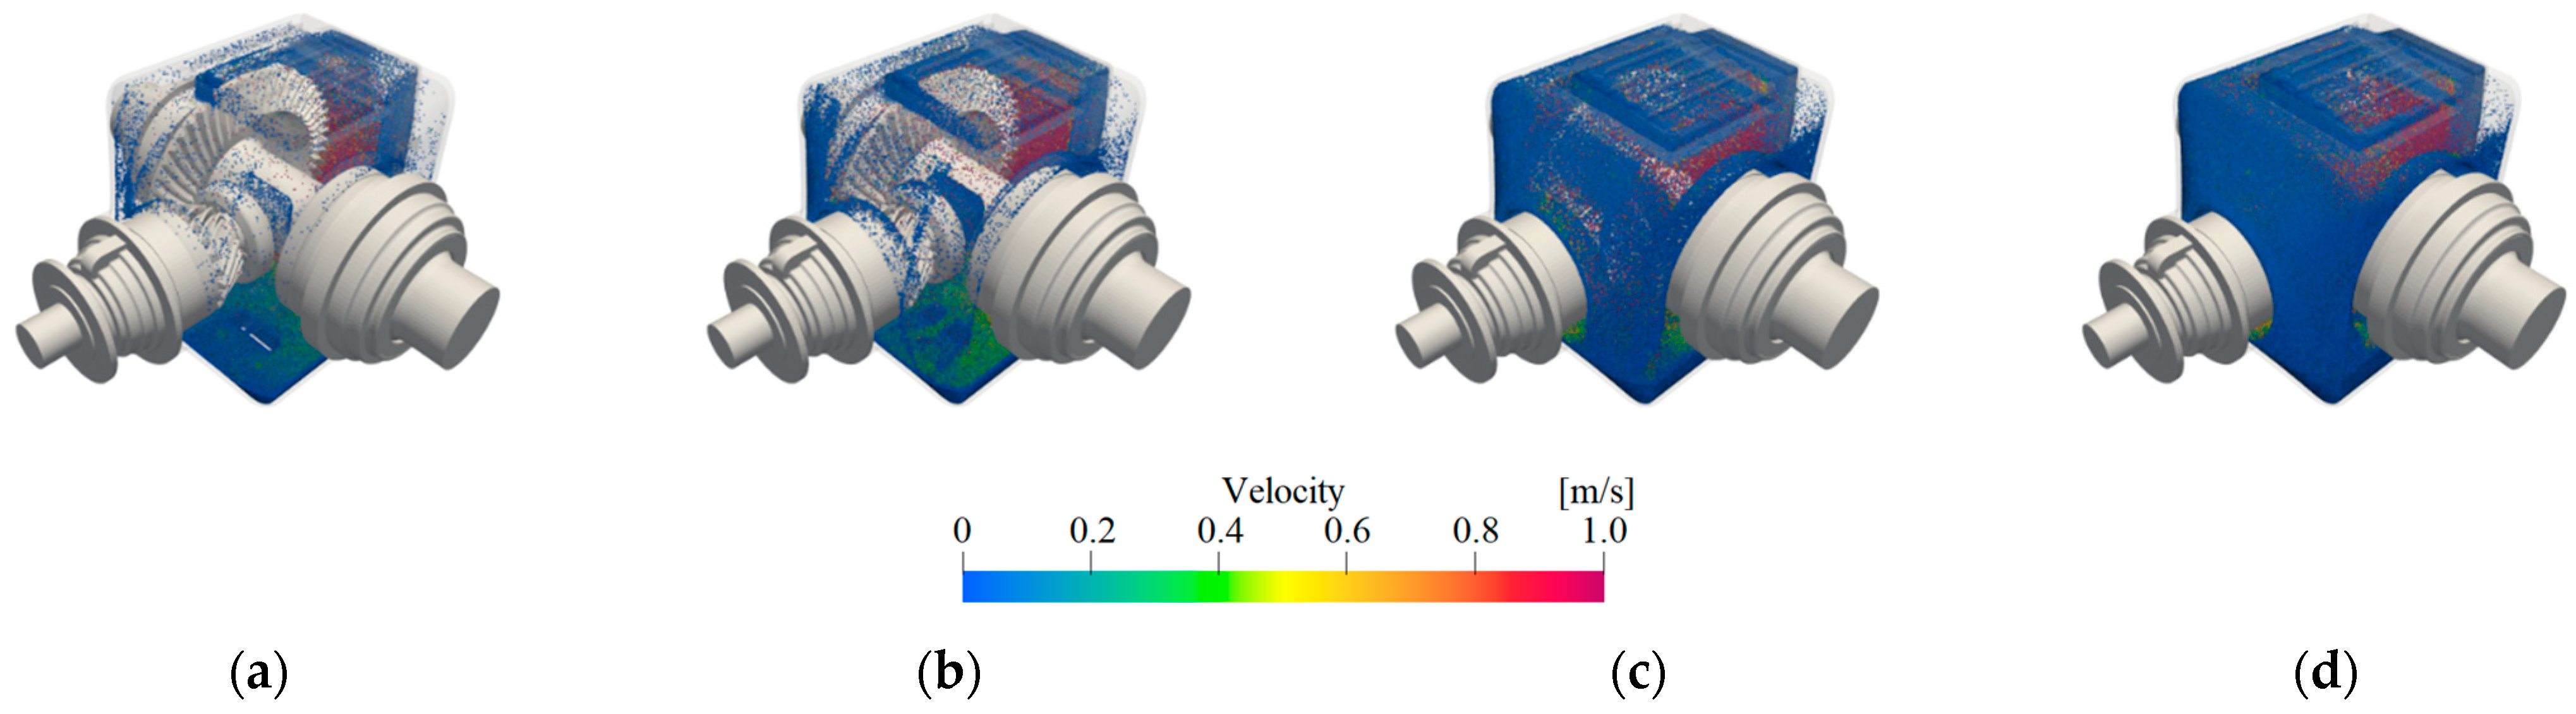
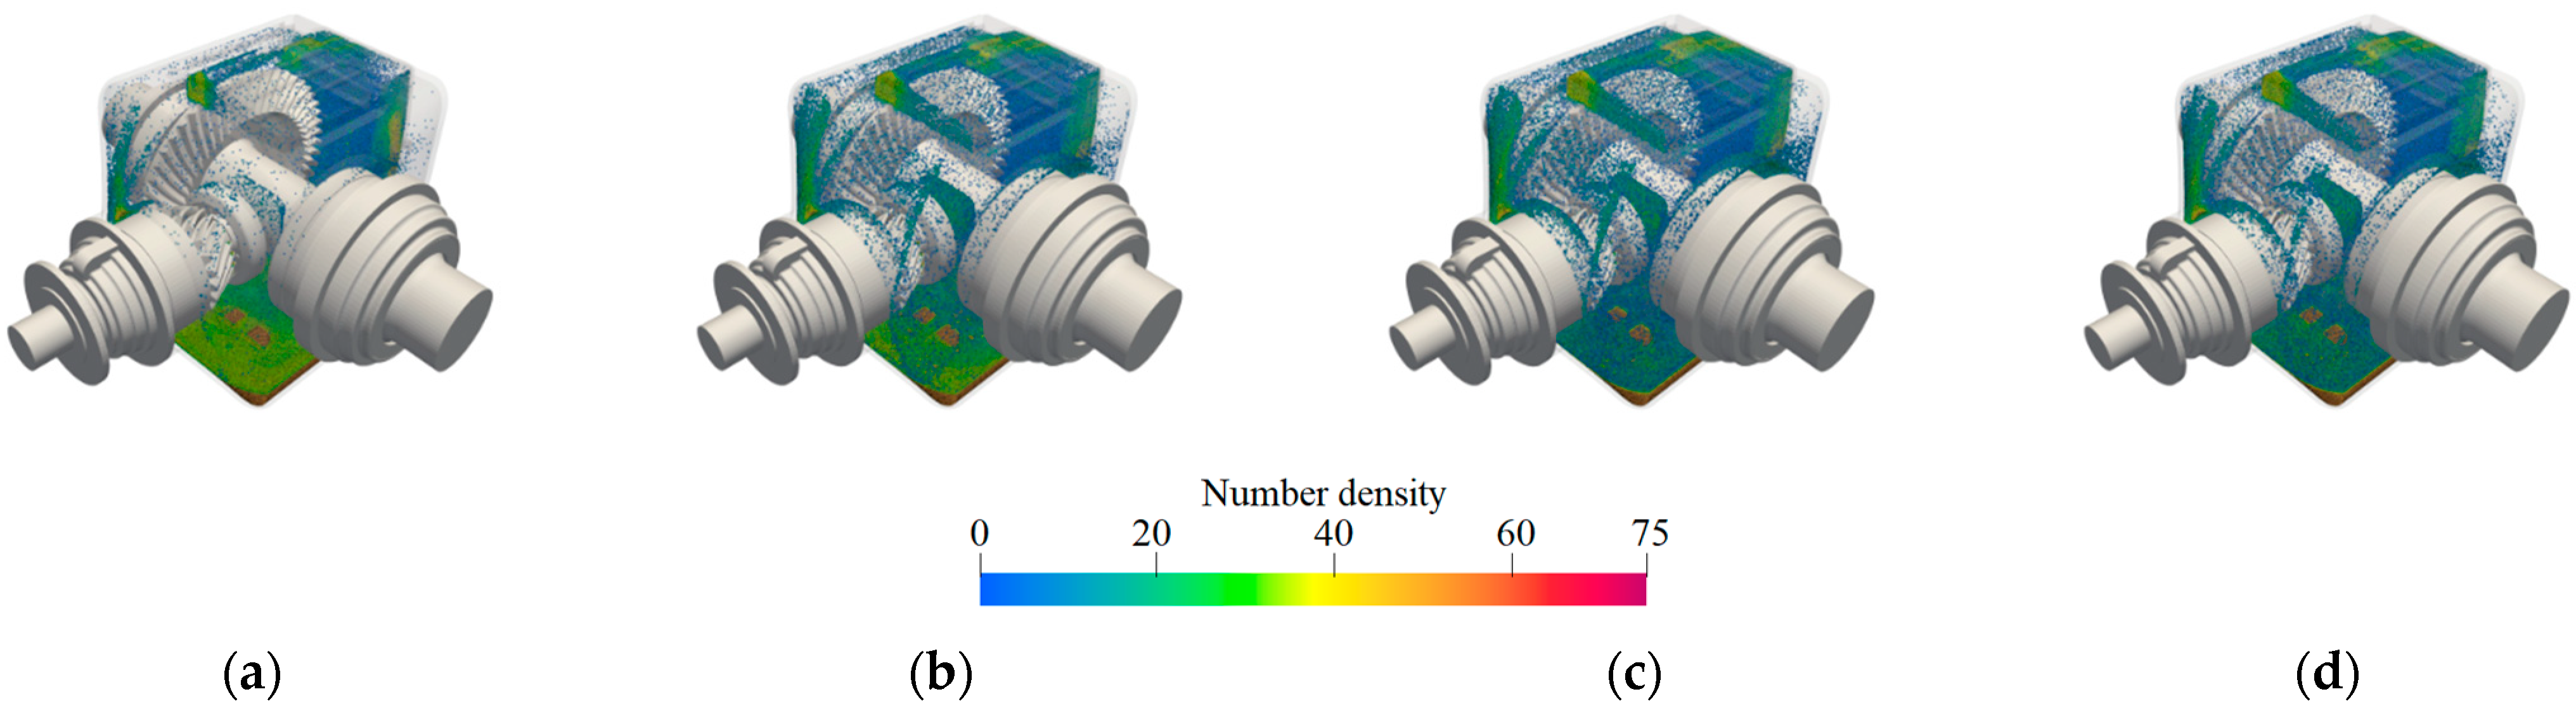
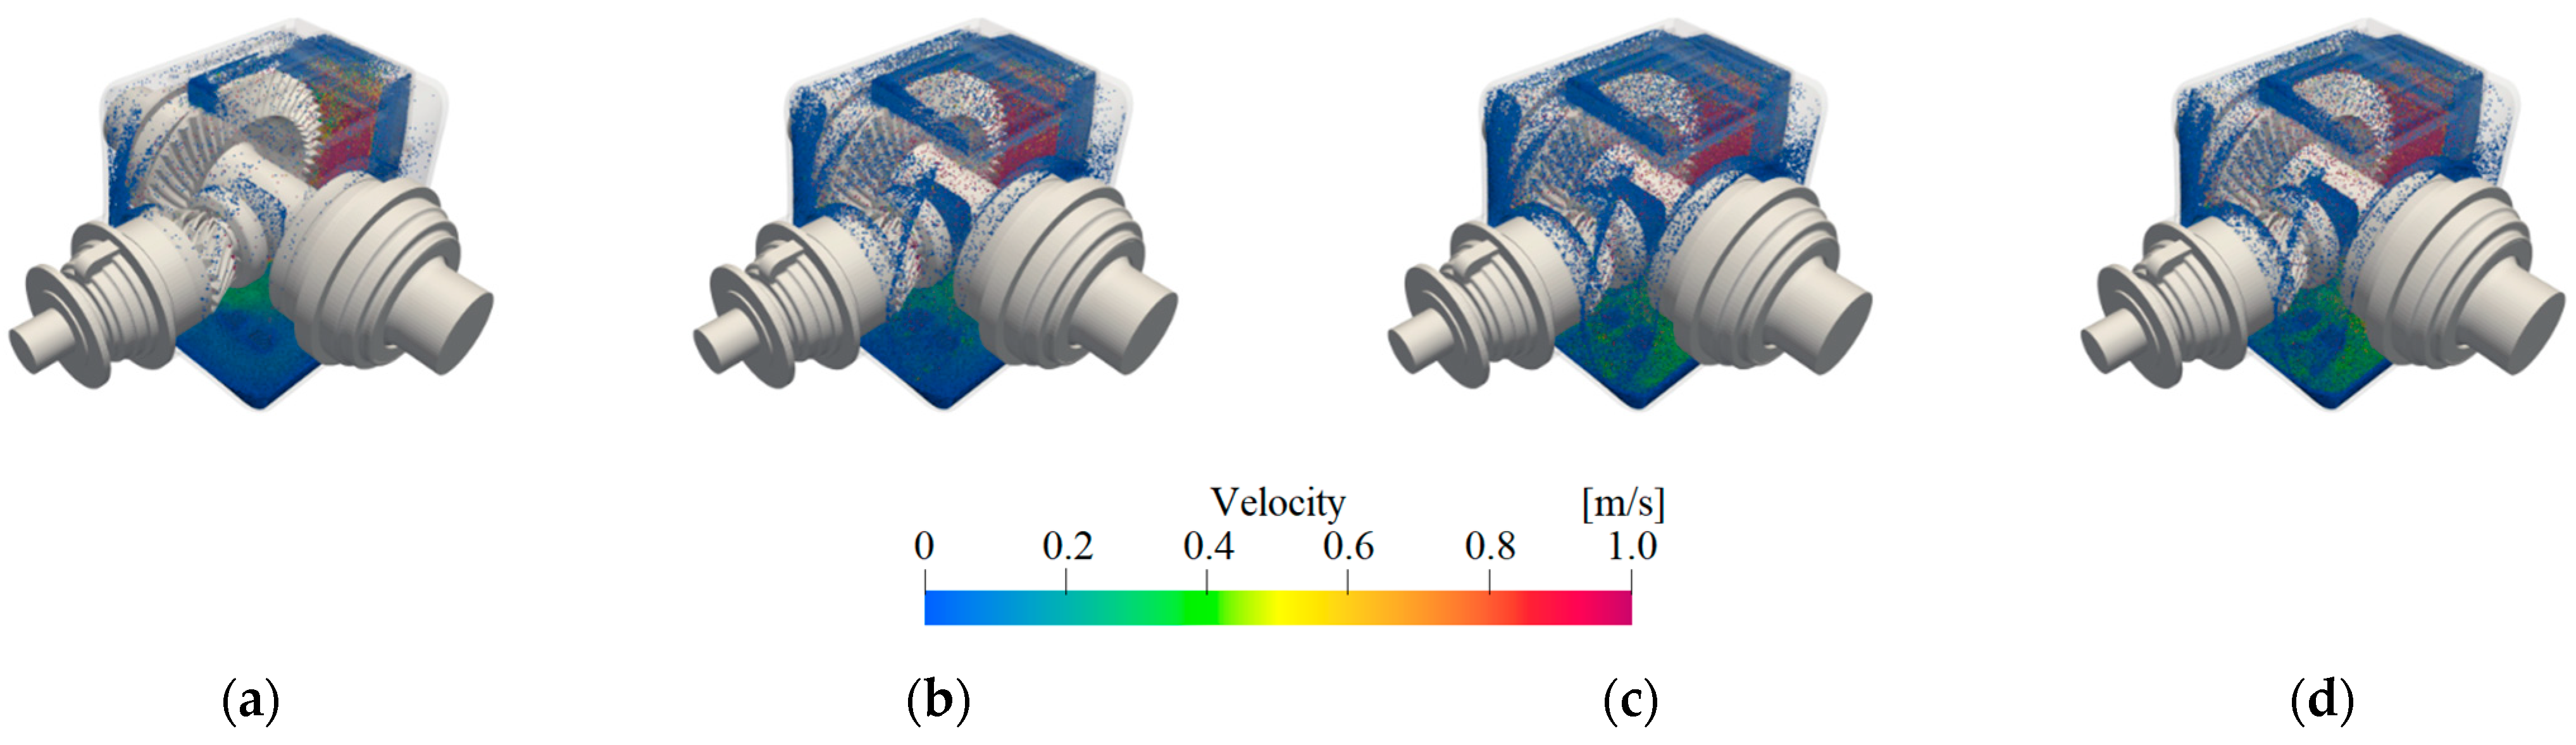
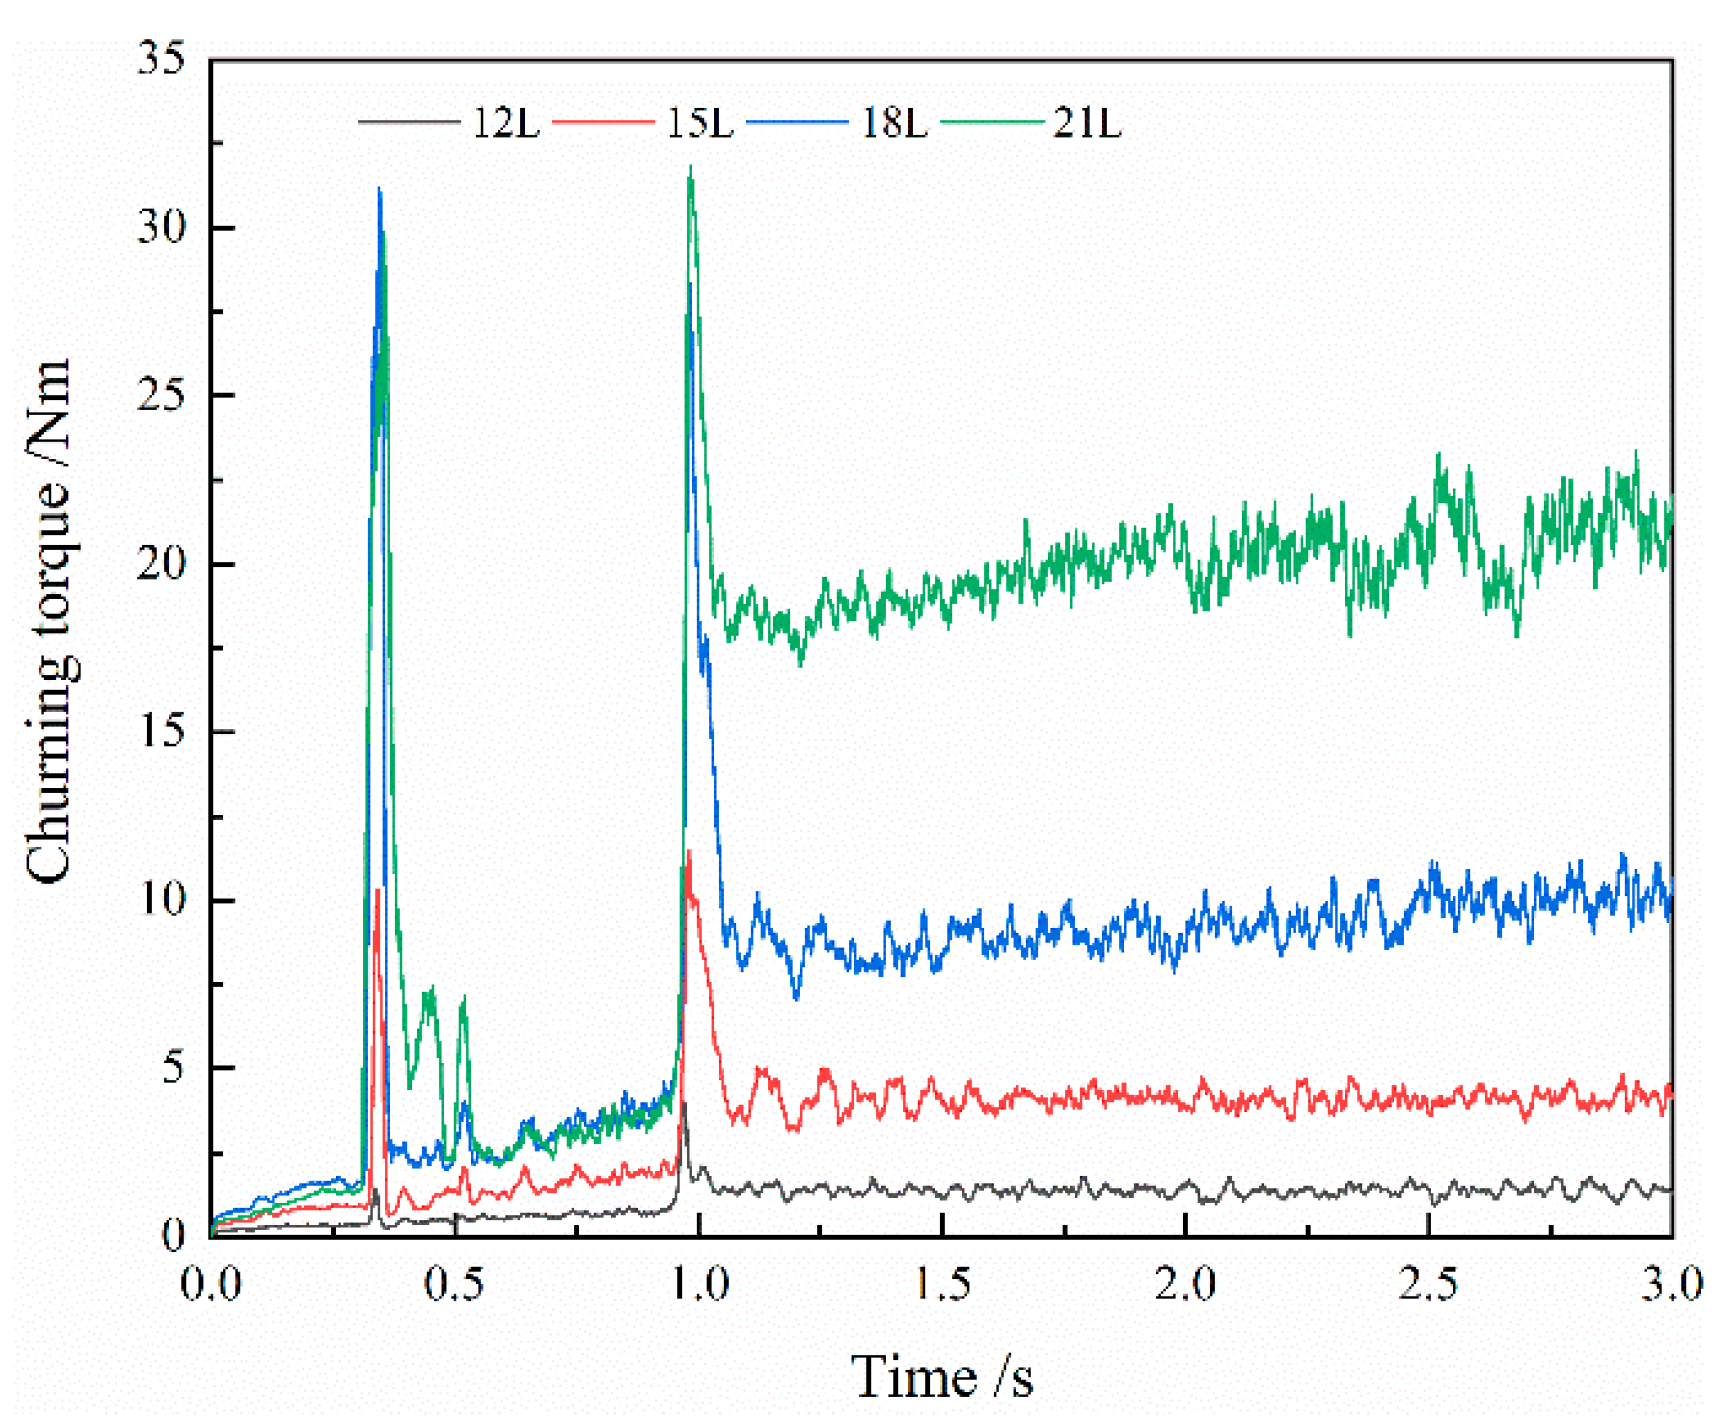
5.2. The Effect of Initial Oil Volume on the Lubrication Characteristics

As an important parameter during the operation of the gearbox, the initial lubricating-oil volume has an important effect on the oil distribution in the gearbox. At a driving-gear speed of 1000 rpm, the lubricating-oil distribution in the gearbox varies with different initial lubricating-oil volumes, as shown in Figure 9 and Figure 10. It can be observed from Figure 9 and Figure 10 that, with the increase of the initial oil volume, the number of stirred-up oil particles significantly increases, leading to a noticeable rise in the internal lubricating-oil concentration in the gearbox. Moreover, the higher the initial lubricating-oil volume is, the more pronounced this growth trend becomes. Increasing the initial oil volume will increase the immersion depth of the driven gear. With respect to the arrangement of bevel gears, when the initial oil volume is low, adding a certain volume of lubricating oil only slightly increases the stirred-up lubricating-oil quantity. When the initial oil volume is high, increasing the lubricating-oil quantity by the same volume significantly raises the stirred-up lubricating-oil quantity. Simultaneously, the splashing effect of the lubricating oil is significantly enhanced, resulting in a noticeable increase in the internal lubricating-oil concentration in the gearbox.

5.3. The Influence of Oil Temperature on the Lubrication Characteristics

The high-speed rotating gear causes power losses such as churning, wind resistance and meshing, resulting in an increase in the lubricating-oil temperature, a decrease in viscosity, and enhanced fluidity. Figure 11 and Figure 12 present the number density and velocity nephograms of lubricating-oil particles in the gearbox at a speed of 1500 rpm for different lubricating-oil temperatures. When the lubricating-oil temperature is low, the amount of lubricating oil stirred up is less and the number of lubricating-oil particles around the gear is high, which helps to realize the lubrication. However, under these conditions, the amount of lubricating oil splashed is small, and most of the lubricating-oil particles accumulate at the bottom of the casing, resulting in a relatively low internal lubricating-oil concentration. Subsequently, though, with the increase in lubricating-oil temperature, fluidity improves, making lubricating-oil particles more likely to be thrown out by the gears. As a result, the number of splashed lubricating-oil particles in the gearbox significantly increases, leading to an increase in internal lubricating-oil concentration. When the oil temperature is low, this growth trend is obvious. When the oil temperature exceeds 40 °C, the influence of oil temperature on the lubrication characteristics is obviously weakened. This is because, according to the viscosity–temperature characteristics of lubricating oil, when the temperature of lubricating oil is low, the viscosity of lubricating oil is more sensitive to temperature variation. As the oil temperature increases from −25 °C to 0 °C, the viscosity level of oil changes more than twelvefold, while an increase in lubricating-oil temperature from 40 °C to 80 °C results in only a 22% variation in viscosity.

5.4. Analysis of Churning Loss

The power loss in the gearbox transmission system of the EMU can be divided into load-dependent power loss and load-independent power loss. The load-independent power loss mainly includes windage loss and churning loss. Among these factors, the churning loss accounts for 30% of the gear transmission power loss, which seriously restricts the efficiency and NVH (noise, vibration and harshness) performance of the transmission system. Hence, a thorough analysis of the mechanism and influencing factors of churning loss is crucial for enhancing the efficiency of transmission and improving energy utilization. After post-processing of various simulation models, the time-domain variation curves of the churning torque of all 10 models were extracted, as illustrated in Figure 13, Figure 14 and Figure 15. It can be observed that the churning torque is a fluctuating curve over time. In the initial stage, the gear-churning oil process is in an unstable phase, with a significant fluctuation in the curve. As time progresses, the gear-churned oil gradually reaches a relatively stable state, and the churning torque tends to be stable and fluctuate within a certain range. Taking the average value of the data from 2.5–3 s for each model yields the churning torque for each simulation model, as shown in Table 6.
It can be seen from Figure 13 that the initial value of the churning torque is small, and that it shows an upward trend with oscillation over time. After violent fluctuations, it gradually tends to become dynamically stable. This is mainly because during the numerical simulation, the gear adopts a slope acceleration mode, and in the initial simulation, the speed is low, and the value of the churning torque is relatively small. Additionally, the intensified flow state of the oil leads to a drastic change in the flow field, causing a rapid increase in the churning torque. After a period of fluctuation, the flow field in the gearbox gradually tends to become stable, and the churning resistance torque follows suit. Furthermore, as the speed of the driving gear increases, the churning torque also increases. At 2000 rpm, the churning torque is significantly improved, and there is established a nonlinear relationship between the churning torque and the rotation speed. As the rotation speed increases, the moments of intense fluctuation in the churning torque also occur earlier. This is mainly because at higher speeds, the time for splashed oil to enter the meshing area is shortened, causing the moments of intense fluctuation to advance. However, at 2000 rpm, there are two instances of intense fluctuation, indicating that at higher speeds, the internal fluid dynamics within the gearbox become more turbulent.
From Figure 14, it can be observed that the churning torque increases with the increase of the initial lubricating-oil volume, and that with more oil, the more obvious becomes the increasing trend. Figure 15 shows that when the lubricating-oil temperature is −25 °C, the churning torque is relatively high. As the oil temperature rises, the oil resistance torque gradually decreases. When the oil temperature exceeds 40 °C, the difference in the churning torque is not substantial, and is less influenced by the inherent viscosity–temperature characteristics of the lubricating oil. At higher lubricating-oil temperatures, the viscosity becomes less sensitive to temperature.
The churning loss levels of different simulation models can be obtained according to Equation (12), as shown in Figure 16. The power loss increases with the increase of the rotation speed of the driving gear and the increase in the initial lubricating-oil volume, and decreases with the increase in oil temperature; all of these are nonlinear relationships. It is worth noting that at higher speeds, the churning loss increases greatly, and a larger proportion of the loss comes from the driven gear. The higher the level of initial lubricating oil is, the greater is the churning loss. Additionally, the higher the lubricating-oil volume is, the more noticeable this growth trend becomes, with a higher proportion of these losses originating from the driven gear. The higher the lubricating-oil temperature is, the smaller are the churning losses in the gearbox. Moreover, the higher the oil temperature is, the less impact there is on churning losses. This is mainly because lubricating oil with higher temperatures has lower viscosity, resulting in less resistance to churning gears. Moreover, at higher temperatures, the variation in oil viscosity is less affected by temperature.

6. Conclusions

Taking the spiral bevel gear box of EMU as the research object, a high-fidelity 3D CFD simulation model was established through reasonable simplification, and the lubrication characteristics of the gearbox were visualized by the MPS method. By numerically solving the established 10 CFD models, the effects of different gear rotation speeds, initial lubricating-oil volume and temperature on the lubricating-oil distribution and the churning loss have been analyzed. The main conclusions are as follows:
(1)
The MPS method has been successfully used to visualize the internal flow field of the spiral bevel gear transmission gearbox, which provides a new method for the CFD research on complex models.
(2)
The number density and velocity nephogram of lubricating-oil particles of different simulation models have been extracted, and the lubrication characteristics of the gearbox qualitatively evaluated by the lubricating-oil particle distribution nephogram. The results indicate that as the gear rotation speed increases, the initial volume of lubricating oil rises, and the oil temperature decreases; additionally, more lubricating-oil particles are stirred up by the driven gear, leading to a more uniform distribution and higher lubricating-oil concentration in the gearbox. Moreover, the number of lubricating-oil particles stirred up by the driven gear in the gearbox is most affected by the initial lubricating-oil volume.
(3)
After post-processing the numerical results, the churning torque calculations and churning losses of different simulation models were obtained. The results show that the churning loss is positively correlated with the gear rotation speeds and the initial lubricating-oil volume, but negatively correlated with the oil temperature. Compared with the driving gear, the driven gear has a higher proportion of churning loss.

Author Contributions

L.S.: Conceptualization, methodology, software, investigation, data curation, writing—original draft preparation, visualization, and funding acquisition. Y.Z.: Software, data curation, formal analysis, investigation, visualization, and funding acquisition. S.S.: Conceptualization, methodology, software, investigation, resources, writing—original draft preparation, supervision, writing—review and editing, and project administration. H.Z.: Software, validation, writing—original draft preparation, writing—review and editing, and visualization. Z.W.: Methodology, software, formal analysis, and visualization. All authors have read and agreed to the published version of the manuscript.

Funding

This research was funded by the National Natural Science Foundation of China (52372403, U2268211), the National Natural Science Foundation of Sichuan Province (2022NSFSC0034, 2022NSFSC1901), the Independent Research and Development Projects of State Key Laboratory of Heavy Duty AC Drive Electric Locomotive Systems Integration (R111720H01385) and the Independent Research and Development Projects of State Key Laboratory of Traction Power (2022TPL-T02).

Data Availability Statement

Data are contained within the article.

Conflicts of Interest

Author Longjiang Shen and Yingmou Zhu were employed by the company CRRC Zhuzhou Locomotive Co., Ltd. Author Zhengyang Wang was employed by the company Suzhou shonCloud Engineering Software Co., Ltd.The remaining authors declare that the research was conducted in the absence of any commercial or financial relationships that could be construed as a potential conflict of interest.

References

  1. Michaelis, K.; Höhn, B.-R.; Hinterstoißer, M. Influence factors on gearbox power loss. Ind. Lubr. Tribol. 2011, 63, 46–55. [Google Scholar] [CrossRef]
  2. Changenet, C.; Velex, P. A model for the prediction of churning losses in geared transmissions—Preliminary results. J. Mech. Design 2007, 129, 128–133. [Google Scholar] [CrossRef]
  3. Laruelle, S.; Fossier, C.; Changenet, C.; Ville, F.; Koechlin, S. Experimental investigations and analysis on churning losses of splash lubricated spiral bevel gears. Mech. Ind. 2017, 18, 412. [Google Scholar] [CrossRef]
  4. Quiban, R.; Changenet, C.; Marchesse, Y.; Ville, F.; Belmonte, J. Churning losses of spiral bevel gears at high rotational speed. Proc. Mech. Part J J. Eng. Tribol. 2019, 234, 172–182. [Google Scholar] [CrossRef]
  5. Polly, J.; Talbot, D.; Kahraman, A.; Singh, A.; Xu, H. An experimental investigation of churning power losses of a gearbox. J. Tribol. Trans. ASME 2018, 140, 031102. [Google Scholar] [CrossRef]
  6. Liu, H.; Jurkschat, T.; Lohner, T.; Stahl, K. Determination of oil distribution and churning power loss of gearboxes by finite volume CFD method. Tribol. Int. 2017, 109, 346–354. [Google Scholar] [CrossRef]
  7. Liu, H.; Jurkschat, T.; Lohner, T.; Stahl, K. Detailed investigations on the oil flow in dip-lubricated gearboxes by the finite volume CFD method. Lubricants 2018, 6, 47. [Google Scholar] [CrossRef]
  8. Chen, S.-W.; Matsumoto, S. Influence of relative position of gears and casing wall shape of gear box on churning loss under splash lubrication condition—Some new ideas. Tribol. Trans. 2016, 59, 993–1004. [Google Scholar] [CrossRef]
  9. Hildebrand, L.; Dangl, F.; Sedlmair, M.; Lohner, T.; Stahl, K. CFD analysis on the oil flow of a gear stage with guide plate. Forsch. Ingenieurwesen 2022, 86, 395–408. [Google Scholar] [CrossRef]
  10. Hu, X.; Wang, A.; Li, P.; Wang, J. Influence of dynamic attitudes on oil supply for bearings and churning power losses in a splash lubricated spiral bevel gearbox. Tribol. Int. 2021, 159, 106951. [Google Scholar] [CrossRef]
  11. Mastrone, M.N.; Concli, F. CFD simulation of grease lubrication: Analysis of the power losses and lubricant flows inside a back-to-back test rig gearbox. J. Non-Newton Fluid 2021, 297, 104652. [Google Scholar] [CrossRef]
  12. Liu, H.; Standl, P.; Sedlmair, M.; Lohner, T.; Stahl, K. Efficient CFD simulation model for a planetary gearbox. Forsch. Ingenieurwesen 2018, 82, 319–330. [Google Scholar] [CrossRef]
  13. Cho, J.; Hur, N.; Choi, J.; Yoon, J. Numerical simulation of oil and air two-phase flow in a planetary gear system using the overset mesh technique. In Proceedings of the 16th International Symposium on Transport Phenomena and Dynamics of Rotating Machinery, Honolulu, HI, USA, 10–15 April 2016. [Google Scholar]
  14. Burberi, E.; Fondelli, T.; Andreini, A.; Facchini, B.; Cipolla, L. CFD simulations of a meshing gear pair. In Proceedings of the ASME Turbo Expo 2016: Turbomachinery Technical Conference and Exposition, Seoul, Republic of Korea, 13–17 June 2016. [Google Scholar]
  15. Mastrone, M.N.; Hartono, E.A.; Chernoray, V.; Concli, F. Oil distribution and churning losses of gearboxes: Experimental and numerical analysis. Tribol. Int. 2020, 151, 106496. [Google Scholar] [CrossRef]
  16. Mastrone, M.N.; Concli, F. CFD simulations of gearboxes: Implementation of a mesh clustering algorithm for efficient simulations of complex system’s architectures. Int. J. Mech. Mater. Eng. 2021, 16, 12. [Google Scholar] [CrossRef]
  17. Mastrone, M.N.; Concli, F. A multi domain modeling approach for the CFD simulation of multi-stage gearboxes. Energies 2022, 15, 837. [Google Scholar] [CrossRef]
  18. Ji, Z.; Stanic, M.; Hartono, E.A.; Chernoray, V. Numerical simulations of oil flow inside a gearbox by Smoothed Particle Hydrodynamics (SPH) method. Tribol. Int. 2018, 127, 47–58. [Google Scholar] [CrossRef]
  19. Legrady, B.; Taesch, M.; Tschirschnitz, G.; Mieth, C.F. Prediction of churning losses in an industrial gear box with spiral bevel gears using the smoothed particle hydrodynamic method. Forsch. Ingenieurwesen 2022, 86, 379–388. [Google Scholar] [CrossRef]
  20. Liu, H.; Arfaoui, G.; Stanic, M.; Montigny, L.; Jurkschat, T.; Lohner, T.; Stahl, K. Numerical modelling of oil distribution and churning gear power losses of gearboxes by smoothed particle hydrodynamics. Proc. Mech. Part J J. Eng. Tribol. 2018, 233, 74–86. [Google Scholar] [CrossRef]
  21. Concli, F.; Gorla, C. Windage, churning and pocketing power losses of gears: Different modeling approaches for different goals. Forsch. Ingenieurwesen 2016, 80, 85–99. [Google Scholar] [CrossRef]
  22. Groenenboom, P.H.L.; Mettichi, M.Z.; Gargouri, Y. Simulating oil flow for gearbox lubrication using smoothed particle hydrodynamics. In Proceedings of the International Conference on High Performance Plastic Gears 2015, Garching, Germany, 5–7 October 2015. [Google Scholar]
  23. Liu, H.; Xie, C.; Li, D.; Wang, J. Flow field distribution of splash lubrication of gearbox and churning gear torque loss. J. Zhejiang Univ. 2021, 55, 875–886. [Google Scholar]
  24. Deng, X.; Wang, S.; Wang, S.; Wang, J.; Liu, Y.; Dou, Y.; He, G.; Qian, L. Lubrication mechanism in gearbox of high-speed railway trains. J. Adv. Mech. Des. Syst. 2020, 14, JAMDSM0054. [Google Scholar] [CrossRef]
  25. Xie, C.; Liu, H.; Jia, R.; Li, Q. Research on splash lubrication characteristics of two-stage gearbox based on MPS method. China Mech. Eng. 2021, 32, 1827–1835. [Google Scholar]
  26. Guo, D.; Chen, F.; Liu, J.; Wang, Y.; Wang, X. Numerical modeling of churning power loss of gear system based on moving particle method. Tribol. Trans. 2020, 63, 182–193. [Google Scholar] [CrossRef]
  27. Deng, X.; Wang, S.; Hammi, Y.; Qian, L.; Liu, Y. A combined experimental and computational study of lubrication mechanism of high precision reducer adopting a worm gear drive with complicated surface contact. Tribol. Int. 2020, 146, 106261. [Google Scholar] [CrossRef]
  28. Wei, C.; Wu, W.; Gui, P.; Zou, T.; Yuan, S.; Zhou, J. Analysis of churning losses distribution of hydraulic pump in engineering vehicles using MPS mechod. Proc. Mech. Part D J. Automb. Eng. 2023, 237, 1947–1958. [Google Scholar] [CrossRef]
  29. Wei, C.; Wu, W.; Hou, X.; Nelias, D.; Yuan, S. Research on flow pattern of low temperature lubrication flow field of rotating disk on MPS method. Tribol. Int. 2023, 180, 108221. [Google Scholar] [CrossRef]
  30. Hu, X.; Jiang, Y.; Luo, C.; Feng, L.; Dai, Y. Churning power losses of a gearbox with spiral bevel geared transmission. Tribol. Int. 2019, 129, 398–406. [Google Scholar] [CrossRef]
  31. Jiang, Y.; Hu, X.; Hong, S.; Li, P.; Wu, M. Influences of an oil guide device on splash lubrication performance in a spiral bevel gearbox. Tribol. Int. 2019, 136, 155–164. [Google Scholar] [CrossRef]
  32. Lu, F.; Wang, M.; Bao, H.; Huang, W.; Zhu, R. Churning power loss of the intermediate gearbox in a helicopter under splash lubrication. Proc. Mech. Part J J. Eng. Tribol. 2022, 236, 49–58. [Google Scholar] [CrossRef]
  33. Lu, F.; Wang, M.; Liu, W.; Bao, H.; Zhu, R. CFD-based calculation method of convective heat transfer coefficient of spiral bevel gear in intermediate gearbox under splash lubrication. Ind. Lubr. Tribol. 2021, 73, 470–476. [Google Scholar] [CrossRef]
  34. Lu, F.; Wang, M.; Pan, W.; Bao, H.; Ge, W. CFD-based investigation of lubrication and temperature characteristics of an intermediate gearbox with splash lubrication. Appl. Sci. 2021, 11, 352. [Google Scholar] [CrossRef]
  35. Peng, Q.; Gui, L.; Fan, Z. Numerical and experimental investigation of splashing oil flow in a hypoid gearbox. Eng. Appl. Comp. Fluid. 2018, 12, 324–333. [Google Scholar] [CrossRef]
  36. Peng, Q.; Zhou, C.; Gui, L.; Fan, Z. Investigation of the lubrication system in a vehicle axle: Numerical model and experimental validation. Proc. Mech. Part D J. Automob. Eng. 2019, 233, 1232–1244. [Google Scholar] [CrossRef]
  37. Peng, Q.; Zhou, C.; Gui, L.; Fan, Z. Investigation of the lubrication system in a vehicle axle: Optimization and experimental validation. Proc. Mech. Part D J. Automob. Eng. 2019, 233, 2096–2107. [Google Scholar] [CrossRef]
  38. Zhang, T. Theories and Applications of Moving Particle Semi-implicit Method; Harbin Institute of Technology Press: Harbin, China, 2019; pp. 4–13. [Google Scholar]
  39. Zhang, K.; Sun, Z.; Xi, G. Influence of the kernel function characteristics on the stability of pressure solution of moving particle semi-implicit method. J. Xi'an Jiaotong Univ. 2019, 53, 1–6. [Google Scholar]
  40. Xu, G. Research on Algorithm of Moving Particle Semi-Implicit Method. Master’s Thesis, Harbin Engineering University, Harbin, China, 2007. [Google Scholar]
  41. Hutter, K.; Wang, Y. Fluid and Thermodynamics. Advances in Geophysical and Environmental Mechanics and Mathematics; Springer International Publishing: Cham, Switzerland, 2016; pp. 263–316. [Google Scholar]
  42. AGMA 925-A03; Effect of Lubrication on Gear Surface Distress. American Gear Manufacturers Association: Alexandria, VA, USA, 2003; pp. 9–10.
  43. De Moura, C.A.; Kubrusly, C.S. The Courant-Friedrichs-Lewy (CFL) Condition: 80 Years after its Discovery; Birkhauser: Basel, Switzerland, 2012; pp. 37–38. [Google Scholar]
Figure 1. Kernel function model.
Lubricants 11 00520 g001
Figure 2. Free-surface discrimination diagram.
Lubricants 11 00520 g002
Figure 3. The schematic diagram of a boundary particle arrangement.
Lubricants 11 00520 g003
Figure 4. Gearbox component decomposition diagram. 1—output shaft gear side oil ring A; 2—output shaft gear side oil rejection ring B; 3—output shaft gear side bushing; 4—driven gear; 5—bearings NU BC1-D290; 6—output shaft gear side bearing inner ring; 7—box upper cover; 8—box back cover; 9—casing; 10—bearing BT2-7038-1, inner retaining ring; 11—bearing BT2-7038-1 outer retaining ring; 12—oil injection plug; 13—output shaft wheel side bushing; 14—output shaft wheel side end cover; 15—output shaft wheel side oil slinger; 16—bearing BT2-7038-2; 17—output shaft wheel side bearing retaining ring; 18—bearing BT2-7038-1; 19—bearing NJ314 bushing; 20—bearing NJ314; 21—driving gear shaft; 22—bearing QJ316 outer retaining ring; 23—bearing QJ316; 24—bearing NU316 inner retaining ring; 25—input shaft end cover; 26—bearing NU316 bushing; 27—bearing NU316; 28—input shaft bearing retaining ring; 29—oil drain plug; and 30—output shaft.
Lubricants 11 00520 g004
Figure 5. Comparison of oil distribution in spiral bevel gearbox. (a) Oil distribution of experiment in [31]; (b) Oil distribution of simulation based on the MPS method.
Lubricants 11 00520 g005
Figure 6. Comparison of churning loss of spiral bevel gearbox.
Lubricants 11 00520 g006
Figure 7. Particle number density distribution at different rotation speeds: (a) 500 rpm; (b) 1000 rpm; (c) 1500 rpm; and (d) 2000 rpm.
Lubricants 11 00520 g007
Figure 8. Particle velocity distribution at different rotation speeds: (a) 500 rpm; (b) 1000 rpm; (c) 1500 rpm; and (d) 2000 rpm.
Lubricants 11 00520 g008
Figure 9. Particle number density distribution with different initial oil volumes: (a) 12 L; (b) 15 L; (c) 18 L; and (d) 21 L.
Lubricants 11 00520 g009
Figure 10. Particle velocity distribution with different initial oil volumes: (a) 12 L; (b) 15 L; (c) 18 L; and (d) 21 L.
Lubricants 11 00520 g010
Figure 11. Particle number distribution with different initial oil temperatures: (a) −25 °C; (b) 0 °C; (c) 40 °C; and (d) 80 °C.
Lubricants 11 00520 g011
Figure 12. Particle velocity distribution with different initial oil temperatures: (a) −25 °C; (b) 0 °C; (c) 40 °C; and (d) 80 °C.
Lubricants 11 00520 g012
Figure 13. The variation curve of churning torque at different rotation speeds.
Lubricants 11 00520 g013
Figure 14. The variation curve of churning torque with different initial oil volumes.
Lubricants 11 00520 g014
Figure 15. The variation curve of churning torque with different oil temperatures.
Lubricants 11 00520 g015
Figure 16. Comparison of churning loss under different simulation models.
Lubricants 11 00520 g016
Table 1. Parameters of the bevel gear.
ParameterDriving GearDriven Gear
Tooth surface typeGleason style
Tooth number2255
Module/mm9.2
Tooth width/mm82
Pressure angle/°20
Helix angle/°30
Table 2. Physical parameters of 75W-90 lubricating oil.
ParameterValueTest Method
Density at 15 °C/(kg/m3)867DIN 51757
Kinematic viscosity at 40 °C/(mm2/s)116ASTM D445
Kinematic viscosity at 100 °C/(mm2/s)16.6ASTM D445
Table 3. Physical properties of lubricating oil at different temperatures.
Temperature (°C)Density (kg/m3)Kinematic Viscosity (mm2/s)
−2589117,676.99
08761430.15
40852116.00
8082825.89
Table 4. Simulation conditions.
Simulation ModelDriving Gear Rotation Speed (rpm)Initial Oil Volume (L)Oil Temperature (°C)
gk015001580
gk021000
gk031500
gk042000
gk0520001280
gk0618
gk0721
gk08200015−25
gk090
gk1040
Table 5. Gear pair parameters of the test gearbox.
ParameterValue
Tooth number24/24
Module (mm)6.5
Tooth width (mm)40
Pressure angle (°)20
Axis shift angle (°)90
Helix angle (°)35
Table 6. Churning torque and power loss under different calculation conditions.
Churning Torque of Driving Gear (Nm)Churning Torque of Driven Gear (Nm)Churning Loss (W)
gk010.050.8119.37
gk020.151.1363.47
gk030.391.99186.59
gk040.353.76390.12
gk050.071.30124.31
gk061.108.96981.45
gk073.8316.272164.60
gk080.567.29728.23
gk090.544.36479.61
gk100.413.77403.40
Disclaimer/Publisher’s Note: The statements, opinions and data contained in all publications are solely those of the individual author(s) and contributor(s) and not of MDPI and/or the editor(s). MDPI and/or the editor(s) disclaim responsibility for any injury to people or property resulting from any ideas, methods, instructions or products referred to in the content.

