Article

Two Contributions to Rolling Contact Fatigue Testing Considering Different Diameters of Rail and Wheel Discs

1
Department of Applied Mechanics, Faculty of Mechanical Engineering, VŠB—Technical University of Ostrava, 17, Listopadu 2172/15, 708 00 Ostrava, Czech Republic
2
Department of Technical Studies, College of Polytechnics Jihlava, Tolstého 16, 586 01 Jihlava, Czech Republic
3
Bonatrans Group, Revoluční 1234, 735 94 Bohumín, Czech Republic
*
Author to whom correspondence should be addressed.
Lubricants 2023, 11(12), 504; https://doi.org/10.3390/lubricants11120504
Submission received: 8 October 2023 / Revised: 23 November 2023 / Accepted: 27 November 2023 / Published: 30 November 2023
(This article belongs to the Special Issue Wheel and Rail Tribology)

Abstract

:
Scaled rolling contact fatigue tests, used to practically simulate the wear of the wheel and rail material under laboratory conditions, are typically classified into two categories. Tests in the first category use twin-disc stands, while the second group of test rigs use two discs of different diameters considering the rail disc as the larger one. The latter setup is closer to the real situation, but problems can occur with high contact pressures and tractions. The focus of this paper is on two main contributions. Firstly, a case study based on finite element analysis is presented, allowing the optimization of the specimen geometry for high contact pressures. Accumulated plastic deformation caused by cycling is responsible for abrupt lateral deformation, which requires the use of an appropriate cyclic plasticity model in the finite element analysis. In the second part of the study, two laser profilers are used to measure the dimensions of the specimen in real time during the rolling contact fatigue test. The proposed technique allows the changes in the specimen dimensions to be characterized during the test itself, and therefore does not require the test to be interrupted. By using real-time values of the specimen’s dimensional contours, it is possible to calculate an instantaneous value of the slip ratio or the contact path width.

1. Introduction

Rolling stock and traction technologies are in a constant state of improvement and development. As maximum transport speeds increase, so do the demands on rail traction and traction wheelsets. The safety and quality of trains and tracks needs to be improved, as well as the related quality of the material and the prediction of its service life. The axle load of individual wheelsets is apparently an equally important operating parameter [1]. Some research suggests that the position of the wheelsets in the locomotive may also have a certain effect on wear [2,3].
It is very complicated and difficult to determine the wear of rails and wheelsets in real operation. Therefore, attention has been focused on estimating the wear characteristics in small, similarly shaped specimens of the wheelsets and simulating the load through the application of artificial pressure to test equipment. The experimental test rigs used are the SUROS system [4,5] or the TUORS test rig (Technical University of Ostrava—Rolling Sliding wear-testing machine) [6], which benefit from a similar construction. These machines are used for various purposes, such as studying rolling contact fatigue phenomena, the effect of residual stresses on wear and surface ratcheting after loading [6], the growth of fatigue cracks [7,8], or comparing the quality of materials that are used today or will be used in the future. The test environments in which tests are performed may vary, for example, under different humidity conditions or by including the addition of sand, leaves, or oil in the contact to better understand the behavior of the materials under real conditions, as railway operations are not carried out under laboratory conditions [9,10,11]. RCF wear testing approaches and recent challenges in the field are discussed by Shresta et al. [12].
The technology is being modernized and so are the research methods, such as the use of microscopy to examine wear particles and the wear zone [13] or the use of chromatic confocal measurements [14]. For the real-time detection of cracks under rolling/sliding contact conditions, magnetic methods [15] and eddy current tomography [16] were successfully applied, which allows early detection of cracks due to rolling contact fatigue (RCF). The Magnetic Barkhausen Noise (MBN) technique, which is a well-known method for quantification of residual stresses, is also applicable [17]. Tensile tests have shown that MBN is also beneficial in determining the degree of plastic deformation [18]. Accelerometric vibration measurements, enhanced by a machine-learning approach, were also found to be useful for monitoring damage progression [19].
Most RCF crack-initiation prediction methodologies for rail–wheel contact are based on numerical modeling, especially using finite elements (FE) [20]. RCF defects are caused by three main damage mechanisms: low-cycle fatigue, ratcheting, and wear. Ratcheting is the accumulation of plastic deformation [21], which plays a very important role in significant tractions. An advanced cyclic plasticity model should be used in the FE analysis to achieve an accurate description of stress-strain behavior. Experiments simulating rolling contact conditions are required to properly calibrate the cyclic plasticity model [20]. Non-proportional loading ratcheting cases should be generated in multiaxial fatigue tests, e.g., carried out using axial-torsional loading, as stated by McDowell [22]. Low-cycle fatigue (LCF) and ratcheting are usually considered competitive mechanisms, while predictions give characteristics of the initiated crack [20]. For the LCF mechanism, a suitable fatigue criterion that considers plastic deformation is generally applied [23], unlike the prediction of bearing RCF crack initiation [24], where stress-based approaches are usually acceptable. The most popular critical plane criterion considering the LCF mechanism in RCF crack-initiation prediction is that of Jiang and Sehitoglu [25]. In the case of ratcheting, there is a critical value of the shear strain that is applied as a threshold value [20,26]. An example of incremental approach application can be found in [27], where the Jiang fatigue damage criterion [28] was utilized. Energy dissipation methods are also applied to predict crack initiation, benefiting from a fast calculation [29]. However, the disadvantage is that the analysis does not provide the characteristics of predicted cracks.
A study of the cyclic plastic properties of wheel material, in connection with laboratory simulation tests, contribute to the proper choice of a steel-grade wheel configuration with high service resistance against wear and the wear of the wheel tread [30]. When a rolling contact fatigue test machine with different diameters of rail and wheel specimens is used in RCF tests, the cyclic plastic behavior of the investigated materials plays a significant role, especially under high contact pressures. Various effects of actual wheel/rail contact can also be studied analytically and numerically [31,32,33,34,35].
In the first part of this paper, the authors focused on the methodology for designing the geometry of contact specimens with different diameters using FE simulations under high contact pressures. Optimizing the chamfering angle in the rail disc is crucial to ensure that both the rail and the wheel have the same contact path width during RCF test implementation. Potential issues that may arise if this is not performed are an unexpected decrease of the traction coefficient and a difference in the wear of the rail and wheel discs even if the same material is considered. The methodology based on FE simulations was verified experimentally on the TUORS testing machine [20]. In the second part, the authors utilized some previous experiments to understand the behavior of the change in contact path width as well as the change in specimen diameter. It is worth mentioning here to compare different methods for measuring the width of the contact path from the contour of the specimen using a contrast penetrant to obtain the actual width of the contact path [36]. Subsequently, a test that included laser profilers was also performed to determine the actual applicability of the laser profilers for future real measurements with rotating wheels [37]. In addition, real-time measurement of the specimen’s dimensional contour was used to calculate the slip ratio or to assess the width of the contact path. The surface path on both rolling discs undergoes evolution during the test. Normally, it is impossible to inspect the contact surface path without interrupting the test. For this reason, an online measuring method has been proposed [38] and will be presented in detail. The tests that have been carried out show good results for future applicability in a wide range of RCF tests.

Material and Background

For freight rail transport, high-resistance steel wheels are manufactured. Being serviced on the AAR railway net, the Class C grade wheel steel, as classified by the AAR M107/M208 Standard [39], along with various steel modifications are predominantly used. The main mechanical properties of Class C steel are summarized in Table 1.
The Class C steel has a ferritic–pearlitic microstructure that has a very low to negligible free ferrite microstructure portion for relevant steel carbon contents. This microstructure configuration has a significant influence on the service behavior of the wheel tread in wheel/rail contact. Wheels with such a steel microstructure have improved wear resistance and different RCF performance, including different accumulations of cyclic plastic strains (ratcheting). The change in the portion and morphology type of free ferrite changes the cyclic plastic strain accumulation process in the wheel/rail contact system. The process of exhausting the cyclic plastic strain with fatigue contact crack development as a result of its process is a characteristic phenomenon accompanying wavy wheel/rail contact motion. The tangential and axial components of this motion during wheel rotation depend on railway track conditions (straight track, curves) [30,40].
Rolling contact fatigue involves cyclic plastic deformation and heat generation in the surface layer, with bainite being more prone to degradation of mechanical properties than lamellar pearlite during these processes [41]. In one study [42], the wear of bainite has been shown to be comparable to pearlite when operating railway wheels, although its hardness is up to three times higher. Degradation of the hardness of bainite due to heat during operation (wheel slides on the rail develop a local temperature of over 800 degrees C, and braking with a block brake can cause temperatures in the range of 600 to 800 degrees C in the belt around the circumference of the wheel) leads to its tempering, a decrease in hardness, and thus an increase in wear, which is then higher than that of pearlite.

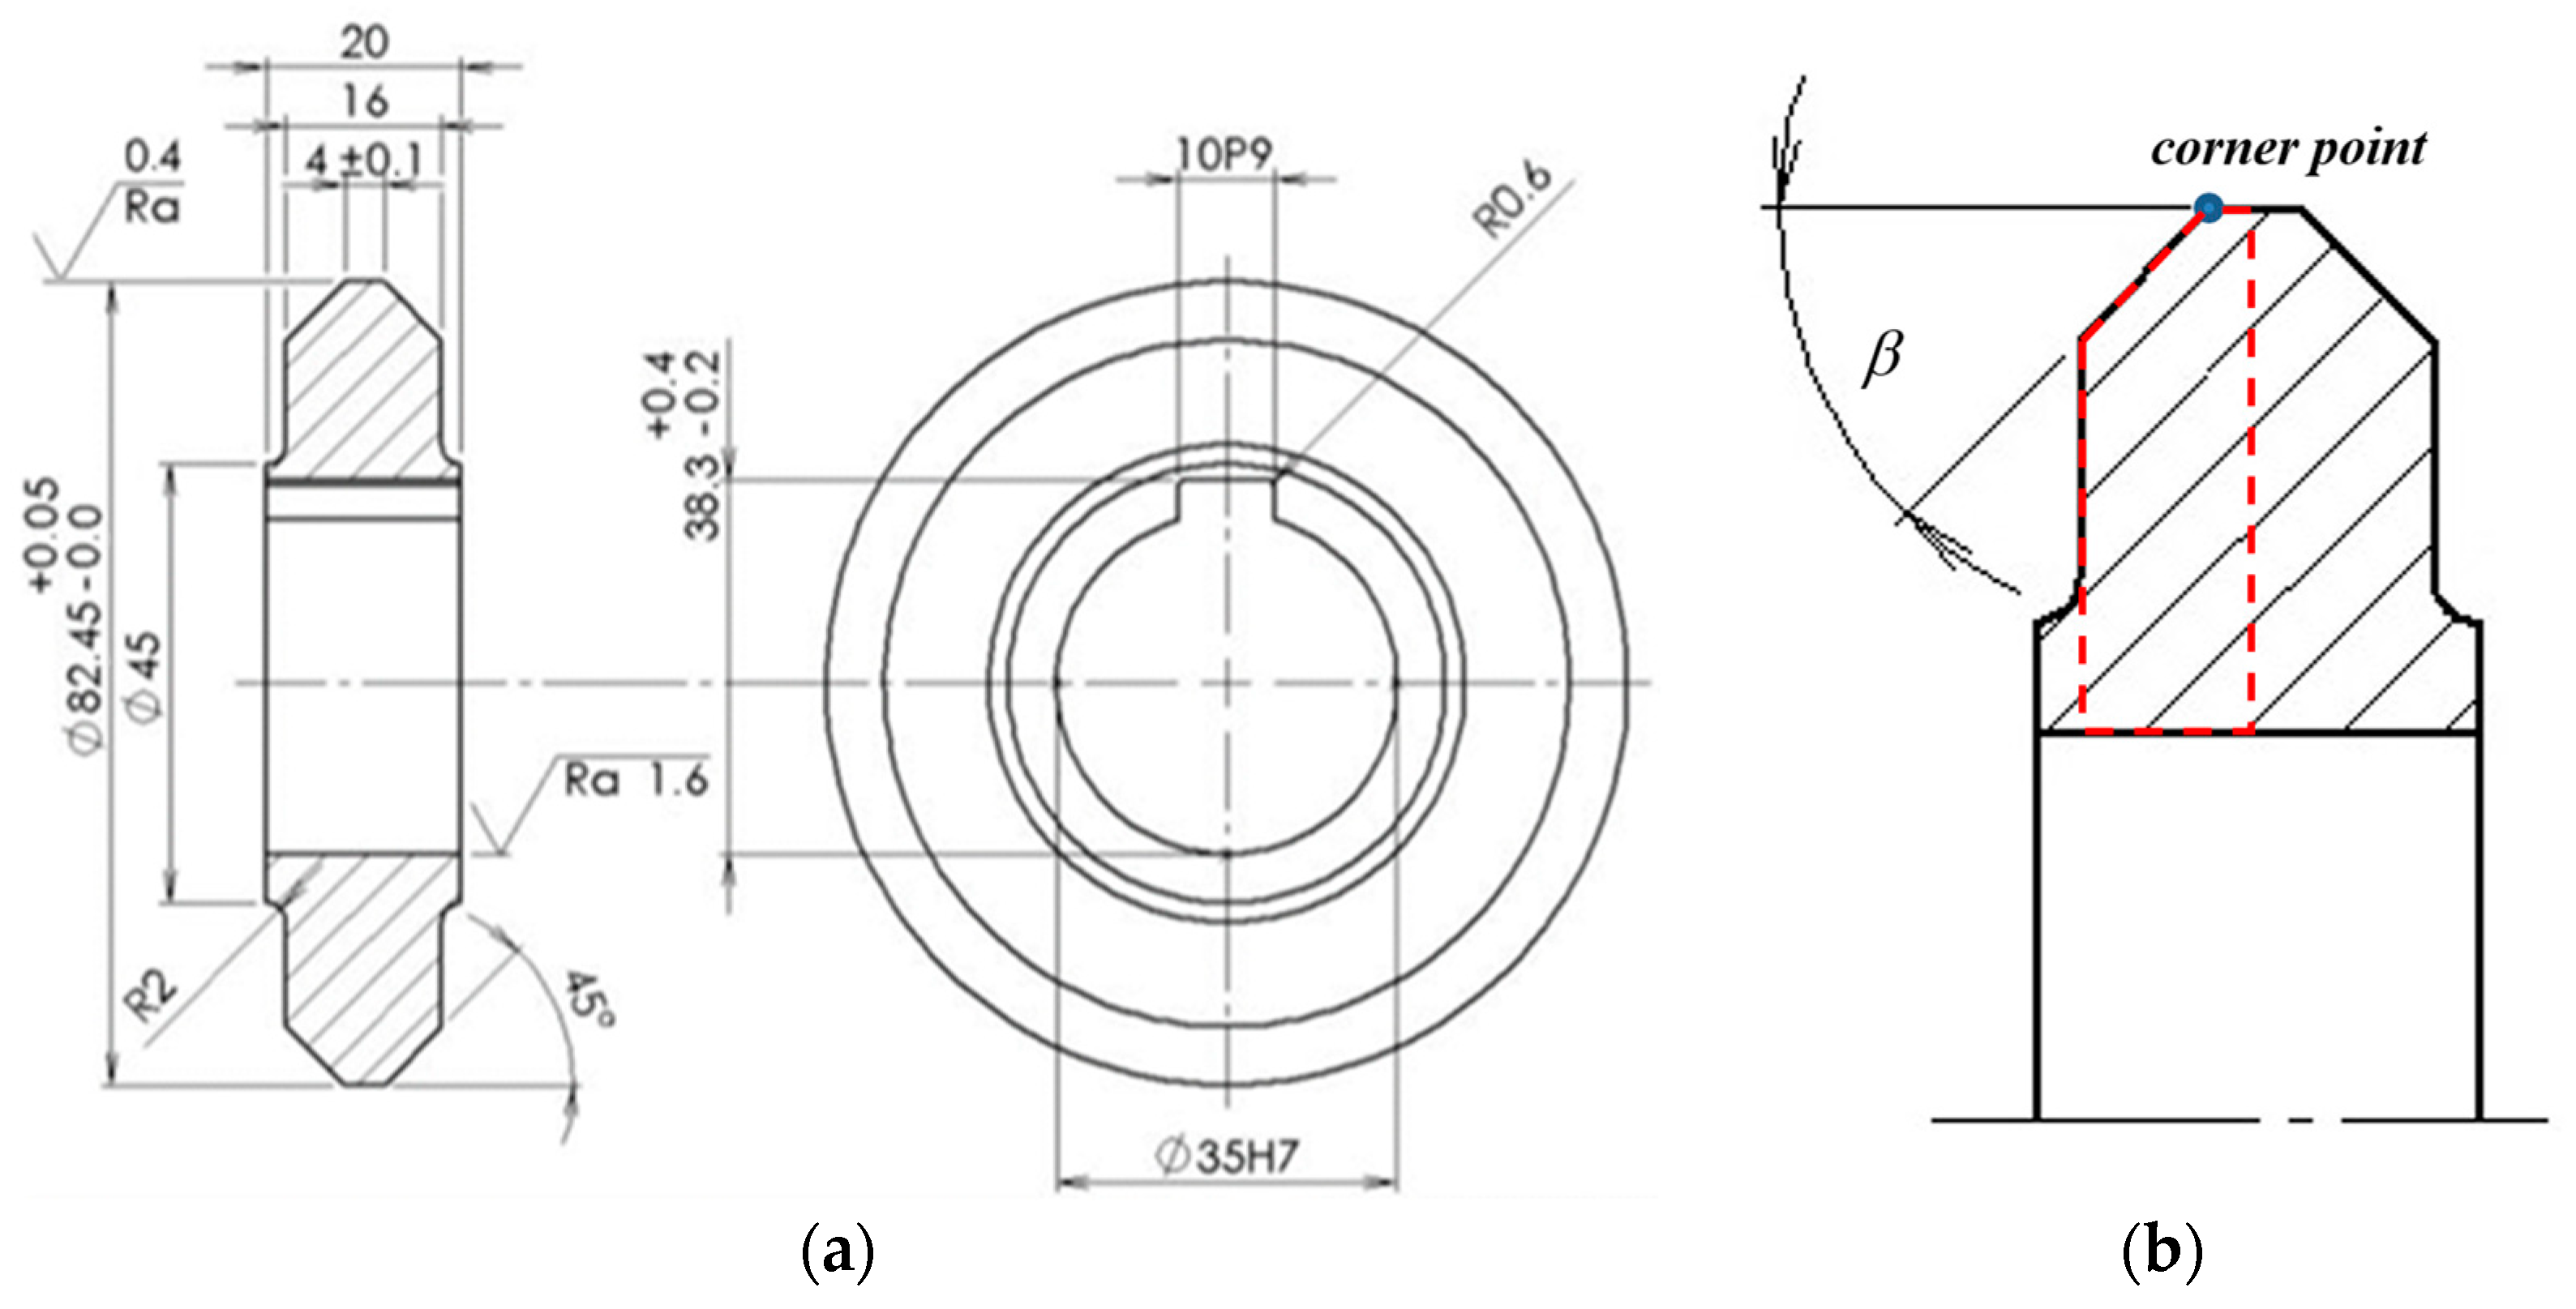
2. Specimen Geometry Optimization for High Contact Pressures

A strategy for finding the suitable geometry of specimens in RCF tests with different diameters of contact discs was experimentally validated. The construction of the TUORS testing machine [20] ensures that the dimensions of the specimens set the slip. For instance, 0.75% slip will result in the wheel disc diameter D W = 82.45 mm while the rail disc diameter will be D R = 215.55 mm. The normal loading force is applied statically using a weight and a lever mechanism [20]. To prevent excessive lateral deformation under high contact pressures, a 45-degree bevel was proposed for the wheel disc (Figure 1a). The purpose of FE simulations in this study was to find the appropriate angle of chamfering (β) for the rail disc (Figure 1b). It is necessary to have the same lateral deformation in the wheel disc as in the rail disc in order to have the correct experimental conditions in the wear test (the width of the rail and wheel discs should evolve equally). For accurate prediction of cyclic plastic deformations of both specimens, an appropriate material model is required.

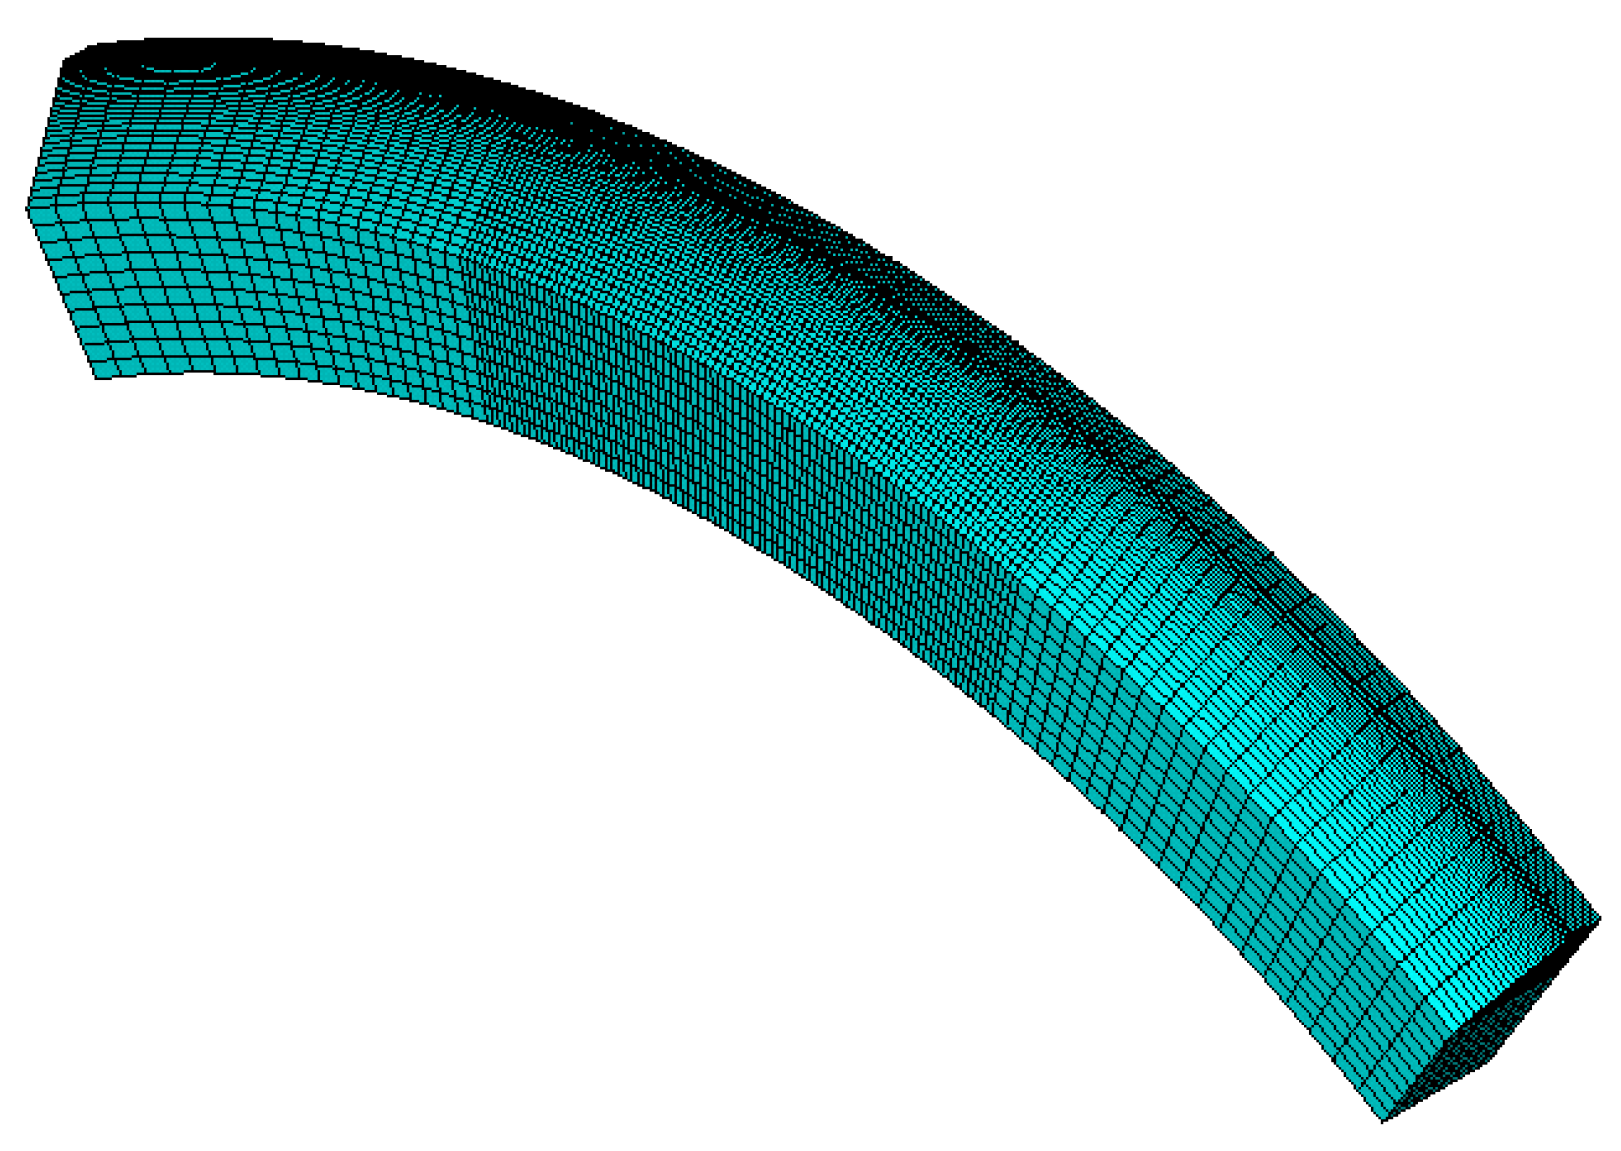
2.1. Numerical Modeling

2.1.1. Constitutive Model

For an accurate prediction of cyclic plastic deformations of both specimens, an appropriate material model is required. Class C steel shows a negligible strain rate sensitivity; therefore, the rate-independent incremental theory of plasticity can be considered. The theory is based on the additive rule (1), which expresses the total strain tensor as
ε = ε e + ε p ,
where ε e is the elastic strain tensor and ε p is the plastic strain tensor. Hooke’s law (2) is used to compute the stress tensor from the elastic strain tensor
σ = D e : ε e = D e : ( ε ε p ) ,
where D e is the 4th order elastic stiffness tensor and “:” denotes the tensor contraction. Elastic properties of the Class C material are assumed to be isotropic with two material parameters: Young modulus E = 205 GPa and Poisson’s ratio µ = 0.3. The von Mises yield condition is applied in the form (3) of
f = 3 2 s a : s a σ Y R = 0 ,
where s denotes the deviatoric part of the stress tensor σ , while a is the deviatoric part of the back stress α, which sets the center position of the yield surface as having initial size σ Y . R is the isotropic variable influencing the transient behavior.
In this study, the normality rule is considered for the plastic strain increment (4) calculation for the case of active loading, i.e.,
d ε p = d p f σ ,
where d p is the accumulated plastic strain increment (5)
d p = 2 3 d ε p : d ε p
It is well known that the kinematic hardening rule plays a crucial role in cyclic plasticity modeling to capture the so-called Bauschinger’s effect. In this work, for the i -th part of the back stress, the evolution equation is considered in the form
d a i = 2 3 C i d ε p γ i a i d p ,
where C i and γ i are material parameters.
Then, the back stress is obtained as a superposition of all back stress parts according to Chaboche (7).
a = i = 1 M a i ,
where M denotes the total number of back stress parts. In this study, the selection M = 5 (five back stress parts) is considered. Finally, the nonlinear isotropic hardening rule is
d R = b R R d p ,
with two material parameters: R and b .
All material parameters of the elastic–plastic model are listed in Table 2. Material parameters σ Y , R ,   C 1 5 , and γ 1 4   were identified for Class C material from a large uniaxial hysteresis loop and monotonic tensile curve. The parameters γ 5 and b influence ratcheting responses. Therefore, γ 5 and b were calibrated using an iterative FEM approach to achieve a good description of ratcheting accumulation on different levels of axial/torsional loadings in the McDowell test [22]. The fatigue tests were performed under symmetric push-pull and repeated torsion harmonic loading with 90 degrees of the phase shift between both loading axes. Four cases were carried out using the LabControl 100 kN/1000 Nm test machine [21] with different maximal shear stresses: 295 MPa; 327 MPa; 357 MPa; and 408 MPa. Corresponding axial stress amplitudes were: 566 MPa; 625 MPa; 679 MPa; and 792 MPa. The McDowell test was proposed to simulate stress-strain states in rolling contact fatigue [22]. More information about stress-strain behaviour of Class C steel under cyclic loading and its prediction via an advanced cyclic plasticity model can be found in a forthcoming book chapter [43]. An example of hysteresis loops in 30 initial cycles for axial and shear components from the fatigue test with the highest load amplitudes is shown in Figure 2.
The Chaboche model satisfactorily predicted the steady state of multiaxial ratcheting in the McDowell tests carried out for the Class C steel, see Figure 3. Ratcheting with rate decay is better described using a previously developed cyclic plasticity model [26], which is based on the AbdelKarim-Ohno kinematic hardening rule and a memory surface introduced in the principal stress space. In this study, we show that after incorporation of the nonlinear isotropic hardening rule into the Chaboche model, the prediction can also be very good, benefiting from the availability in almost all commercial FE software. In all further numerical analyses, the Chaboche model was applied.

2.1.2. Finite Element Simulations

In this study, a similar computational strategy was used as in the paper by Halama et al. [20]. However, the 3D finite element model was created using a parametric macro in ANSYS 18.0. The residual stresses in specimens from the manufacturing process were neglected in the analysis according to the results obtained for different materials elsewhere [6].
The boundary conditions were applied using the so-called surface effect elements of SURF154 type. The normal contact pressure was applied to the rail/wheel disc model according to the Hertz distribution of the line contact (9) [44]
p ( x ) = p 0 1 x a 2 ,
where p 0 is the maximal pressure, x is the distance from the peak, and a is the half-width of the contact area, see Figure 4. According to the RCF experiments performed and the dimensions of the discs, the following values were taken: p 0 = 1800 MPa, a = 1.892 mm. For the definition of shear stress in the model, Coulomb‘s friction law was applied in (10). The actual wheel-rail rolling contact is not slip friction; therefore, the slip is not introduced in the distribution of shear stress, i.e.,
τ ( x ) = f · p ( x ) ,
where f is the coefficient of friction and p x denotes the normal pressure.
As specified above, the most important quantity for the optimization task is the lateral plastic strain at the corner point depicted in Figure 1b. Eight-node brick elements of SOLID185 type were used for meshing and the analysis itself. The 3D model of a wheel/rail disc contains 49,200 elements and 54,571 nodes, see Figure 5. Appropriate displacement boundary conditions, considering a symmetry plane, were applied. Therefore, half of the cross section was considered in the FE model, which is depicted as a red-dashed line in Figure 1b. Seventy rolling cycles were simulated using shifting normal and shear stress distributions on the surface for each considered angle of chamfering. The final finite element mesh was found using a sensitivity study for three different element densities.

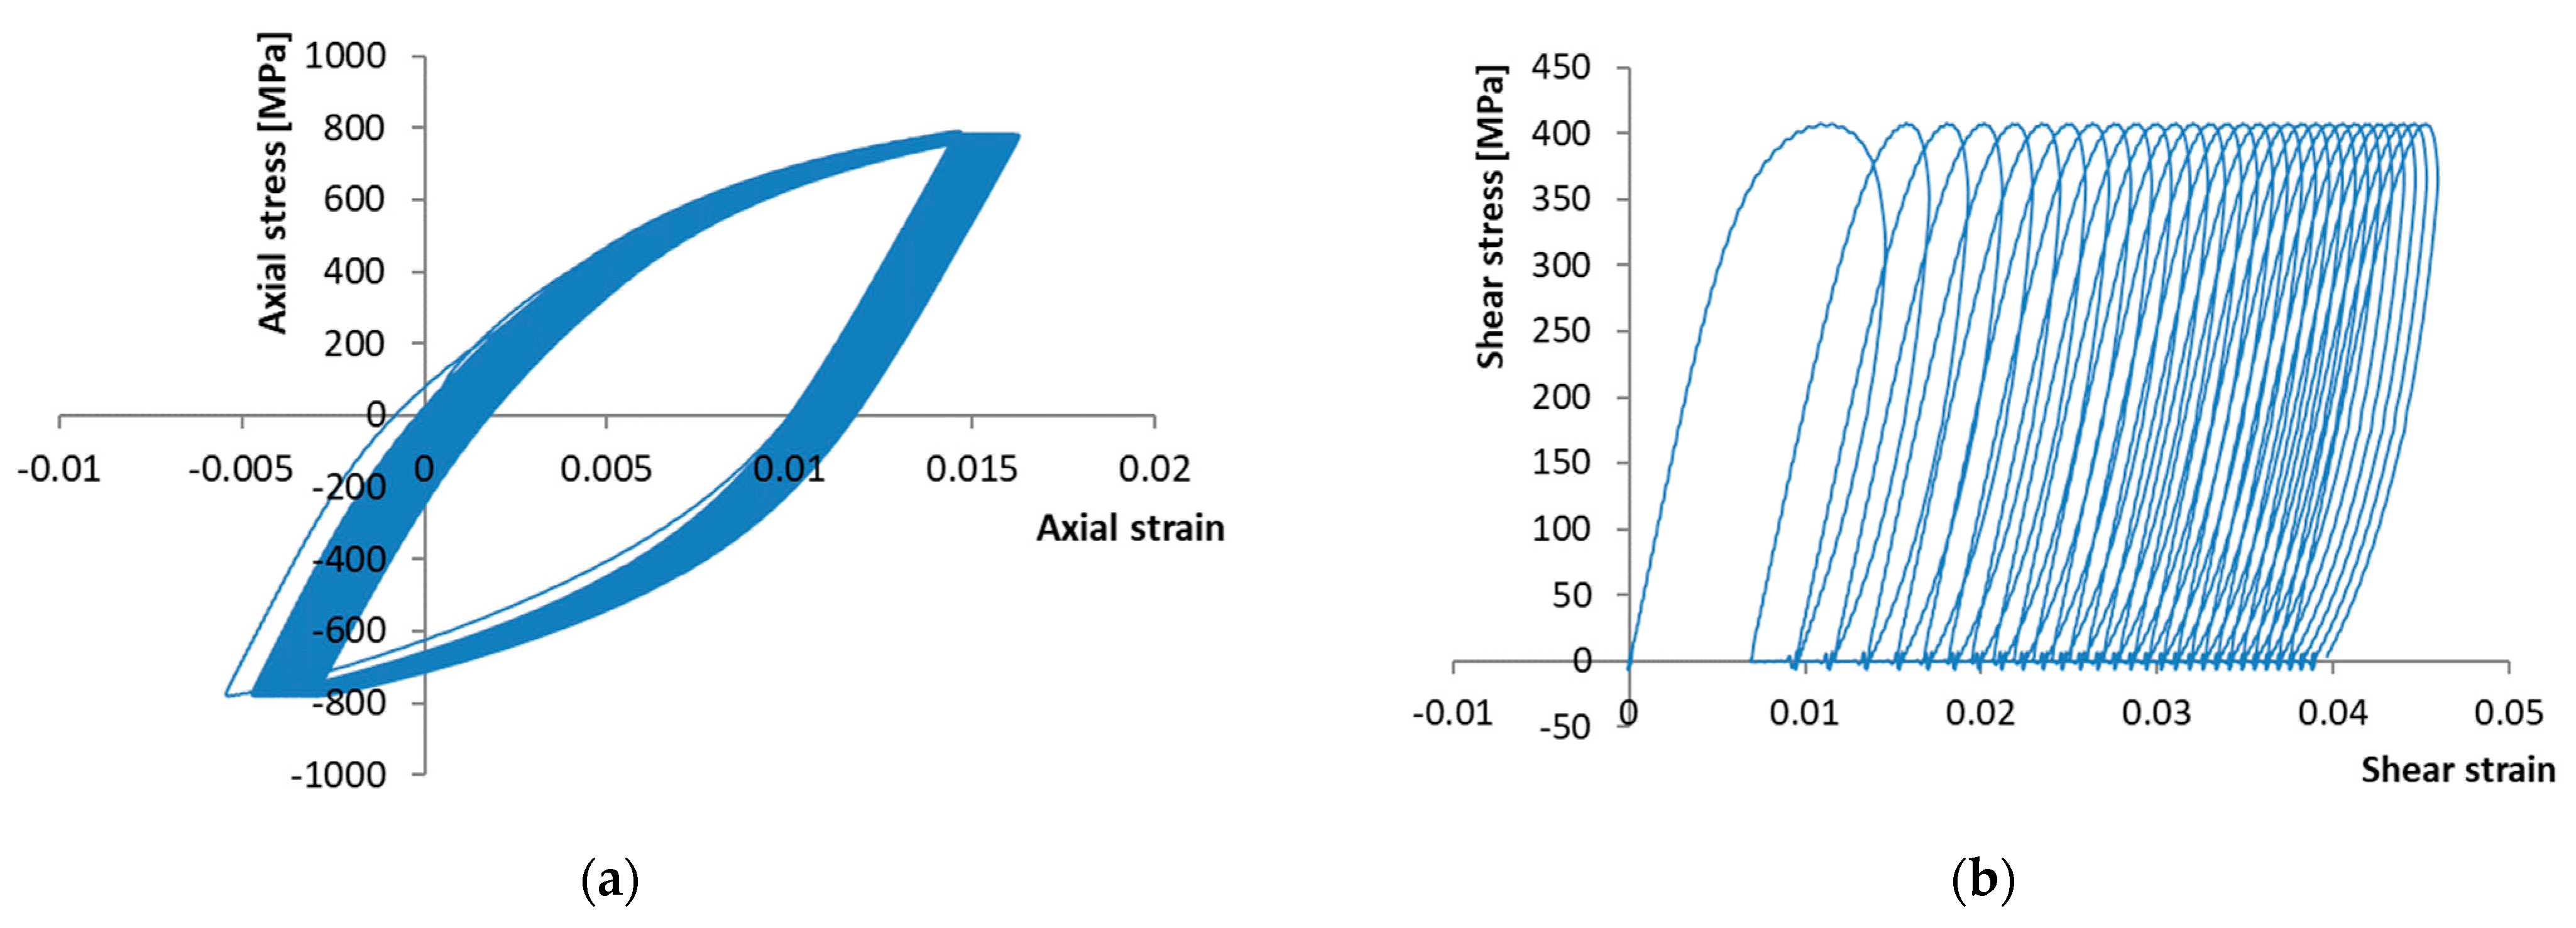
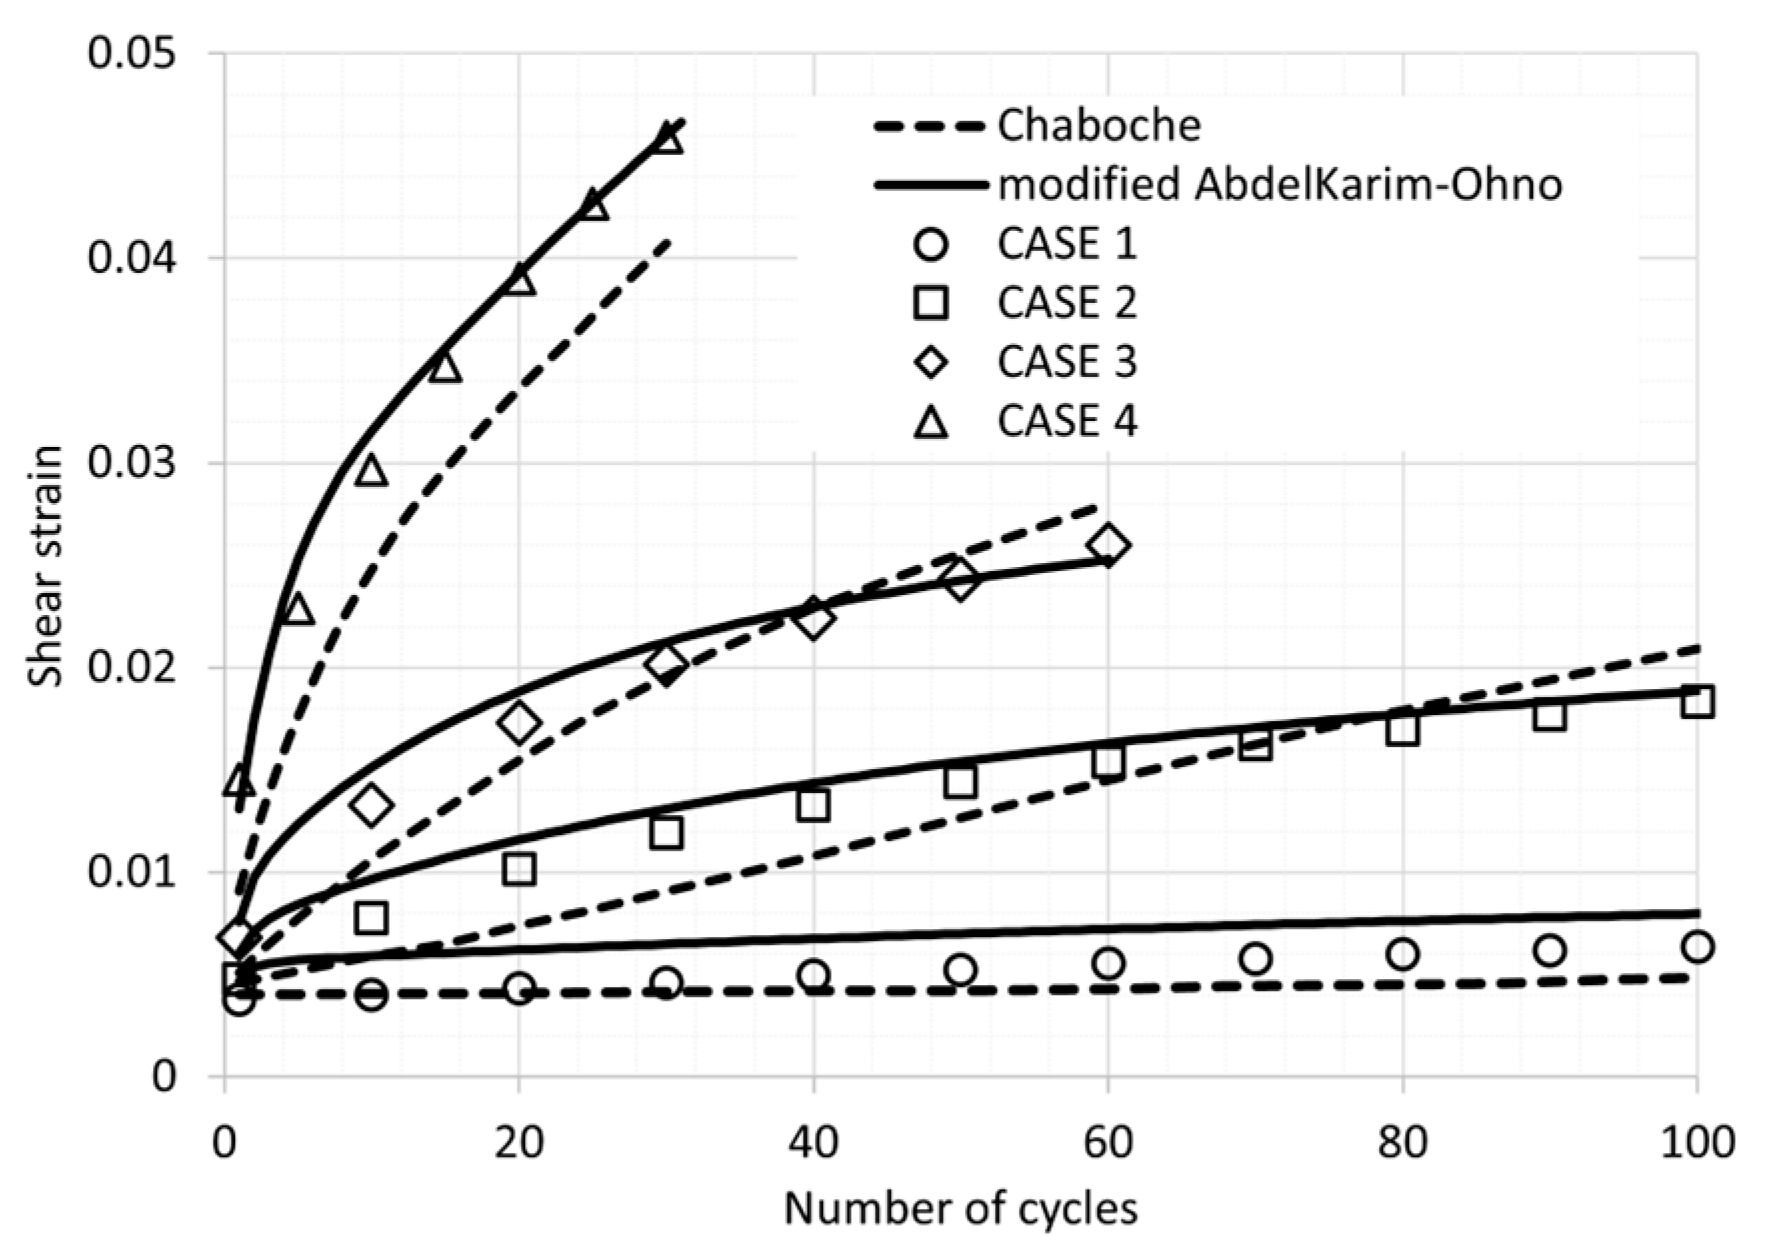
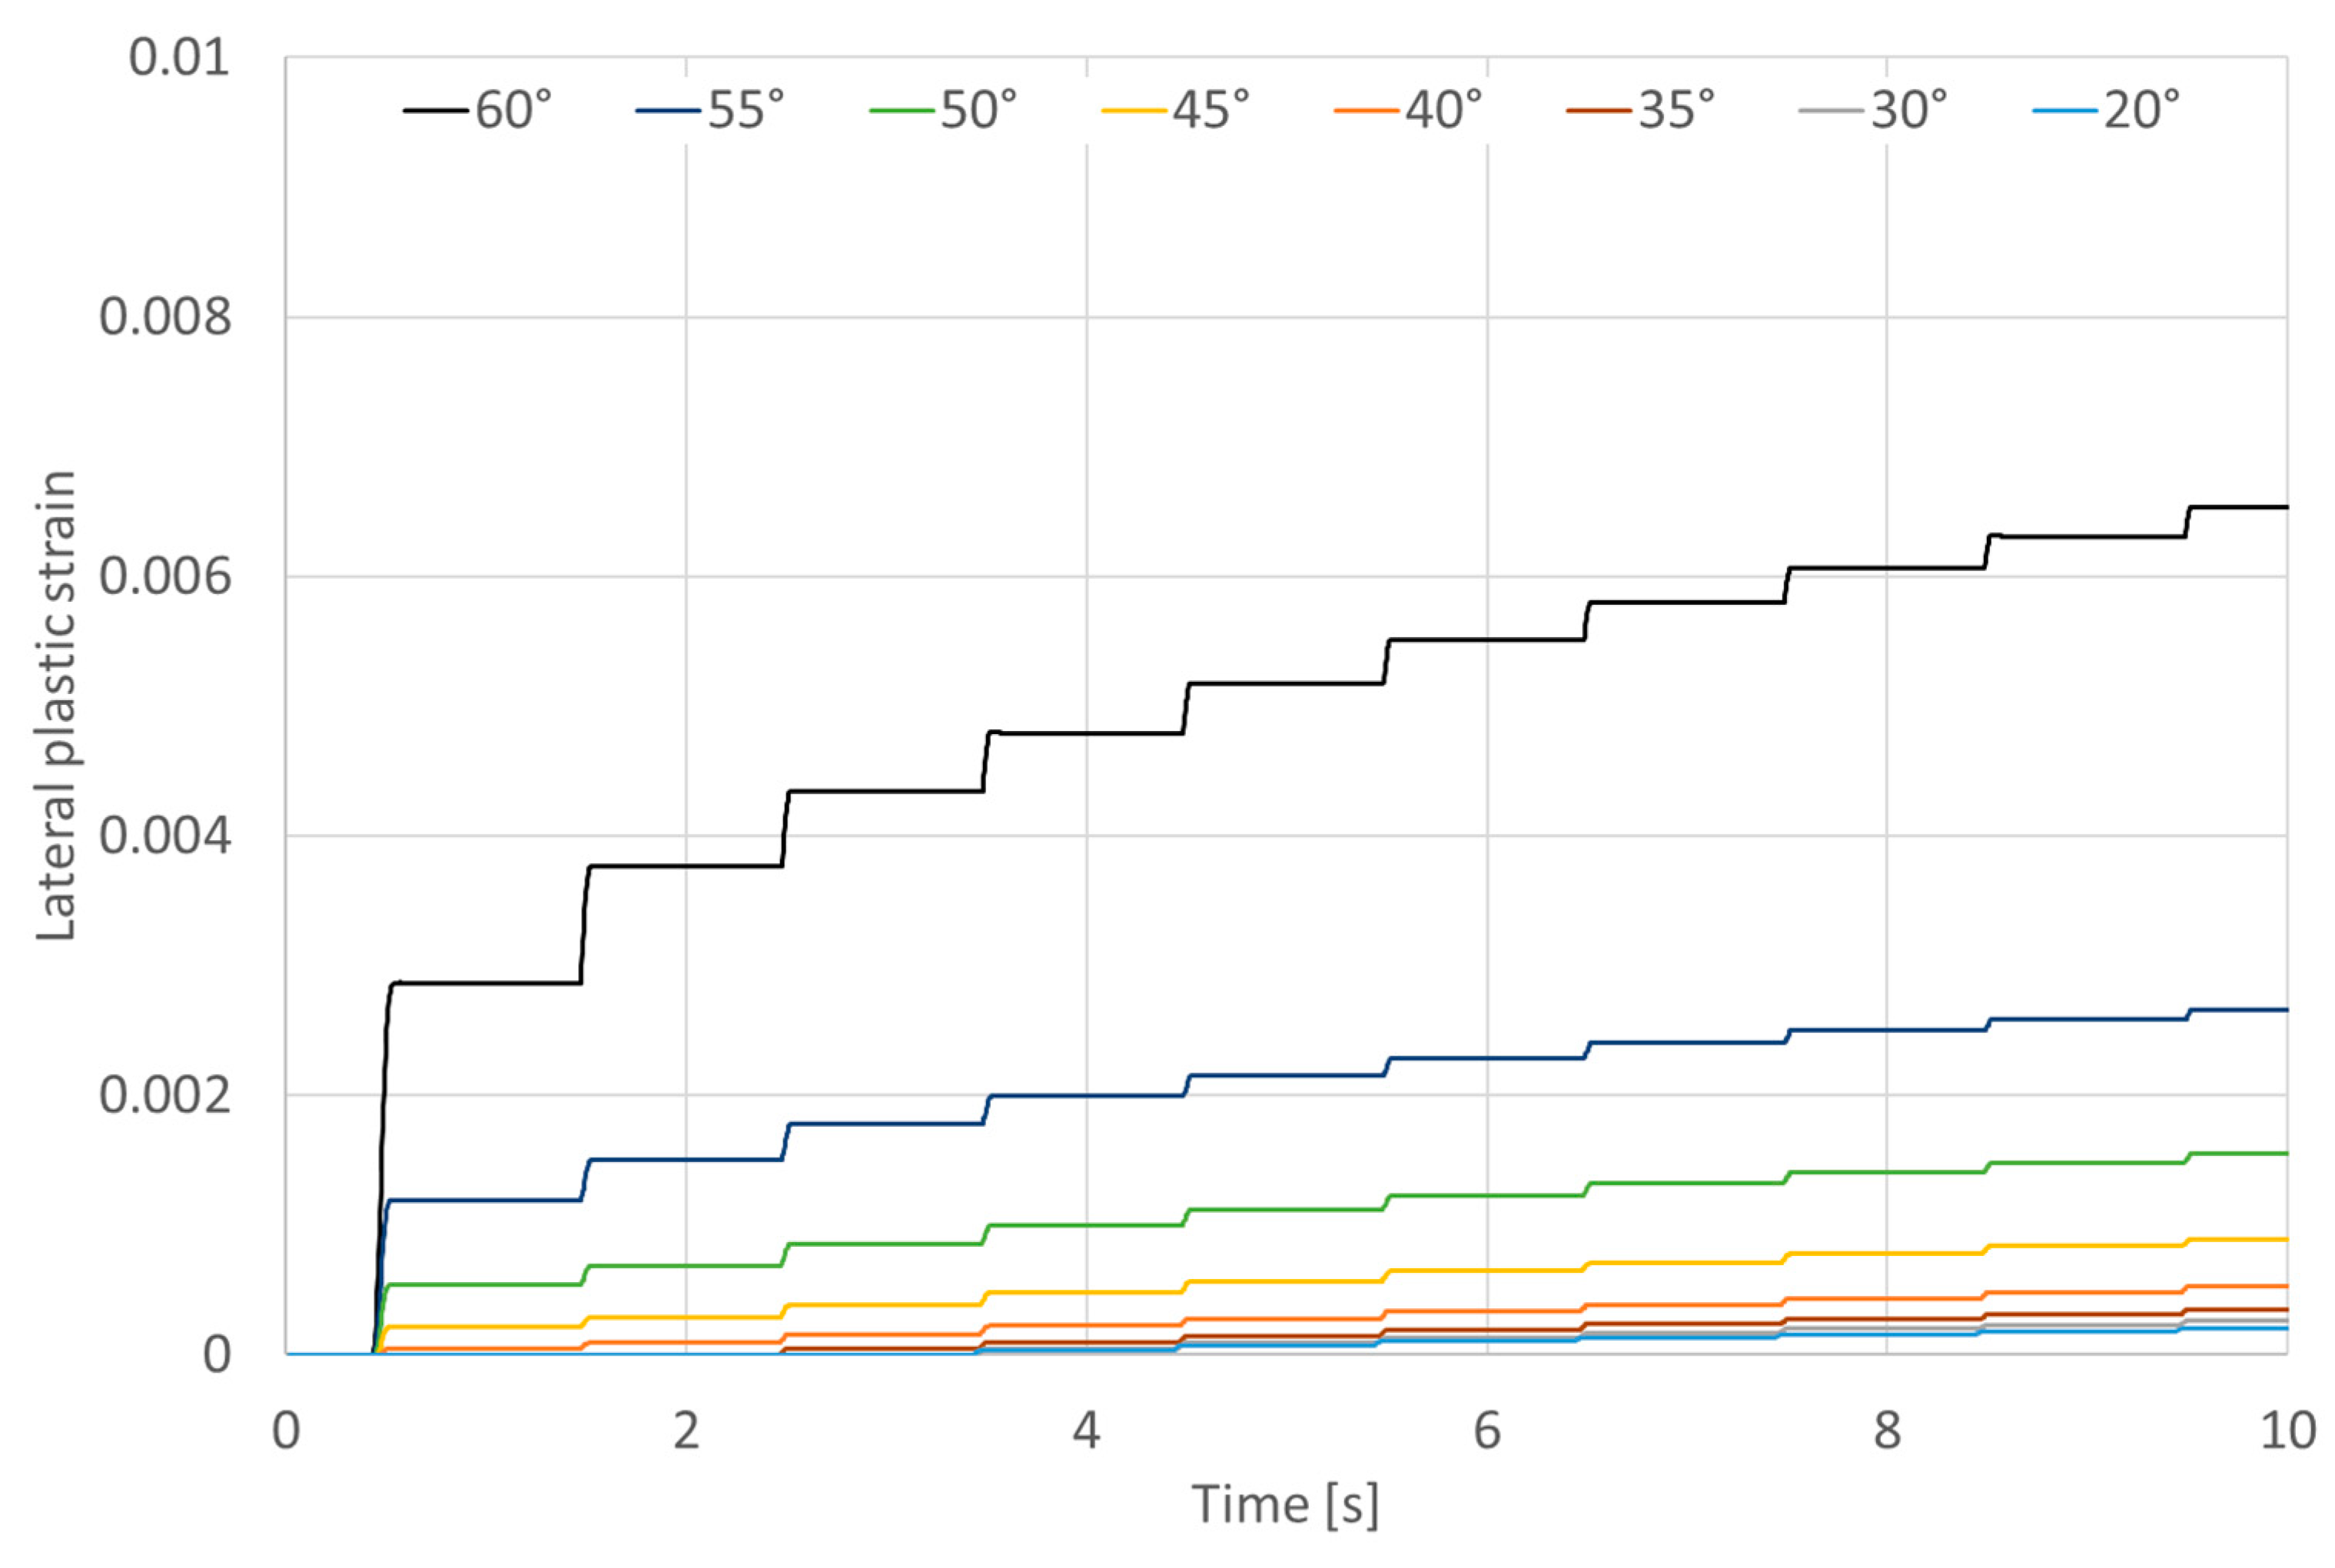
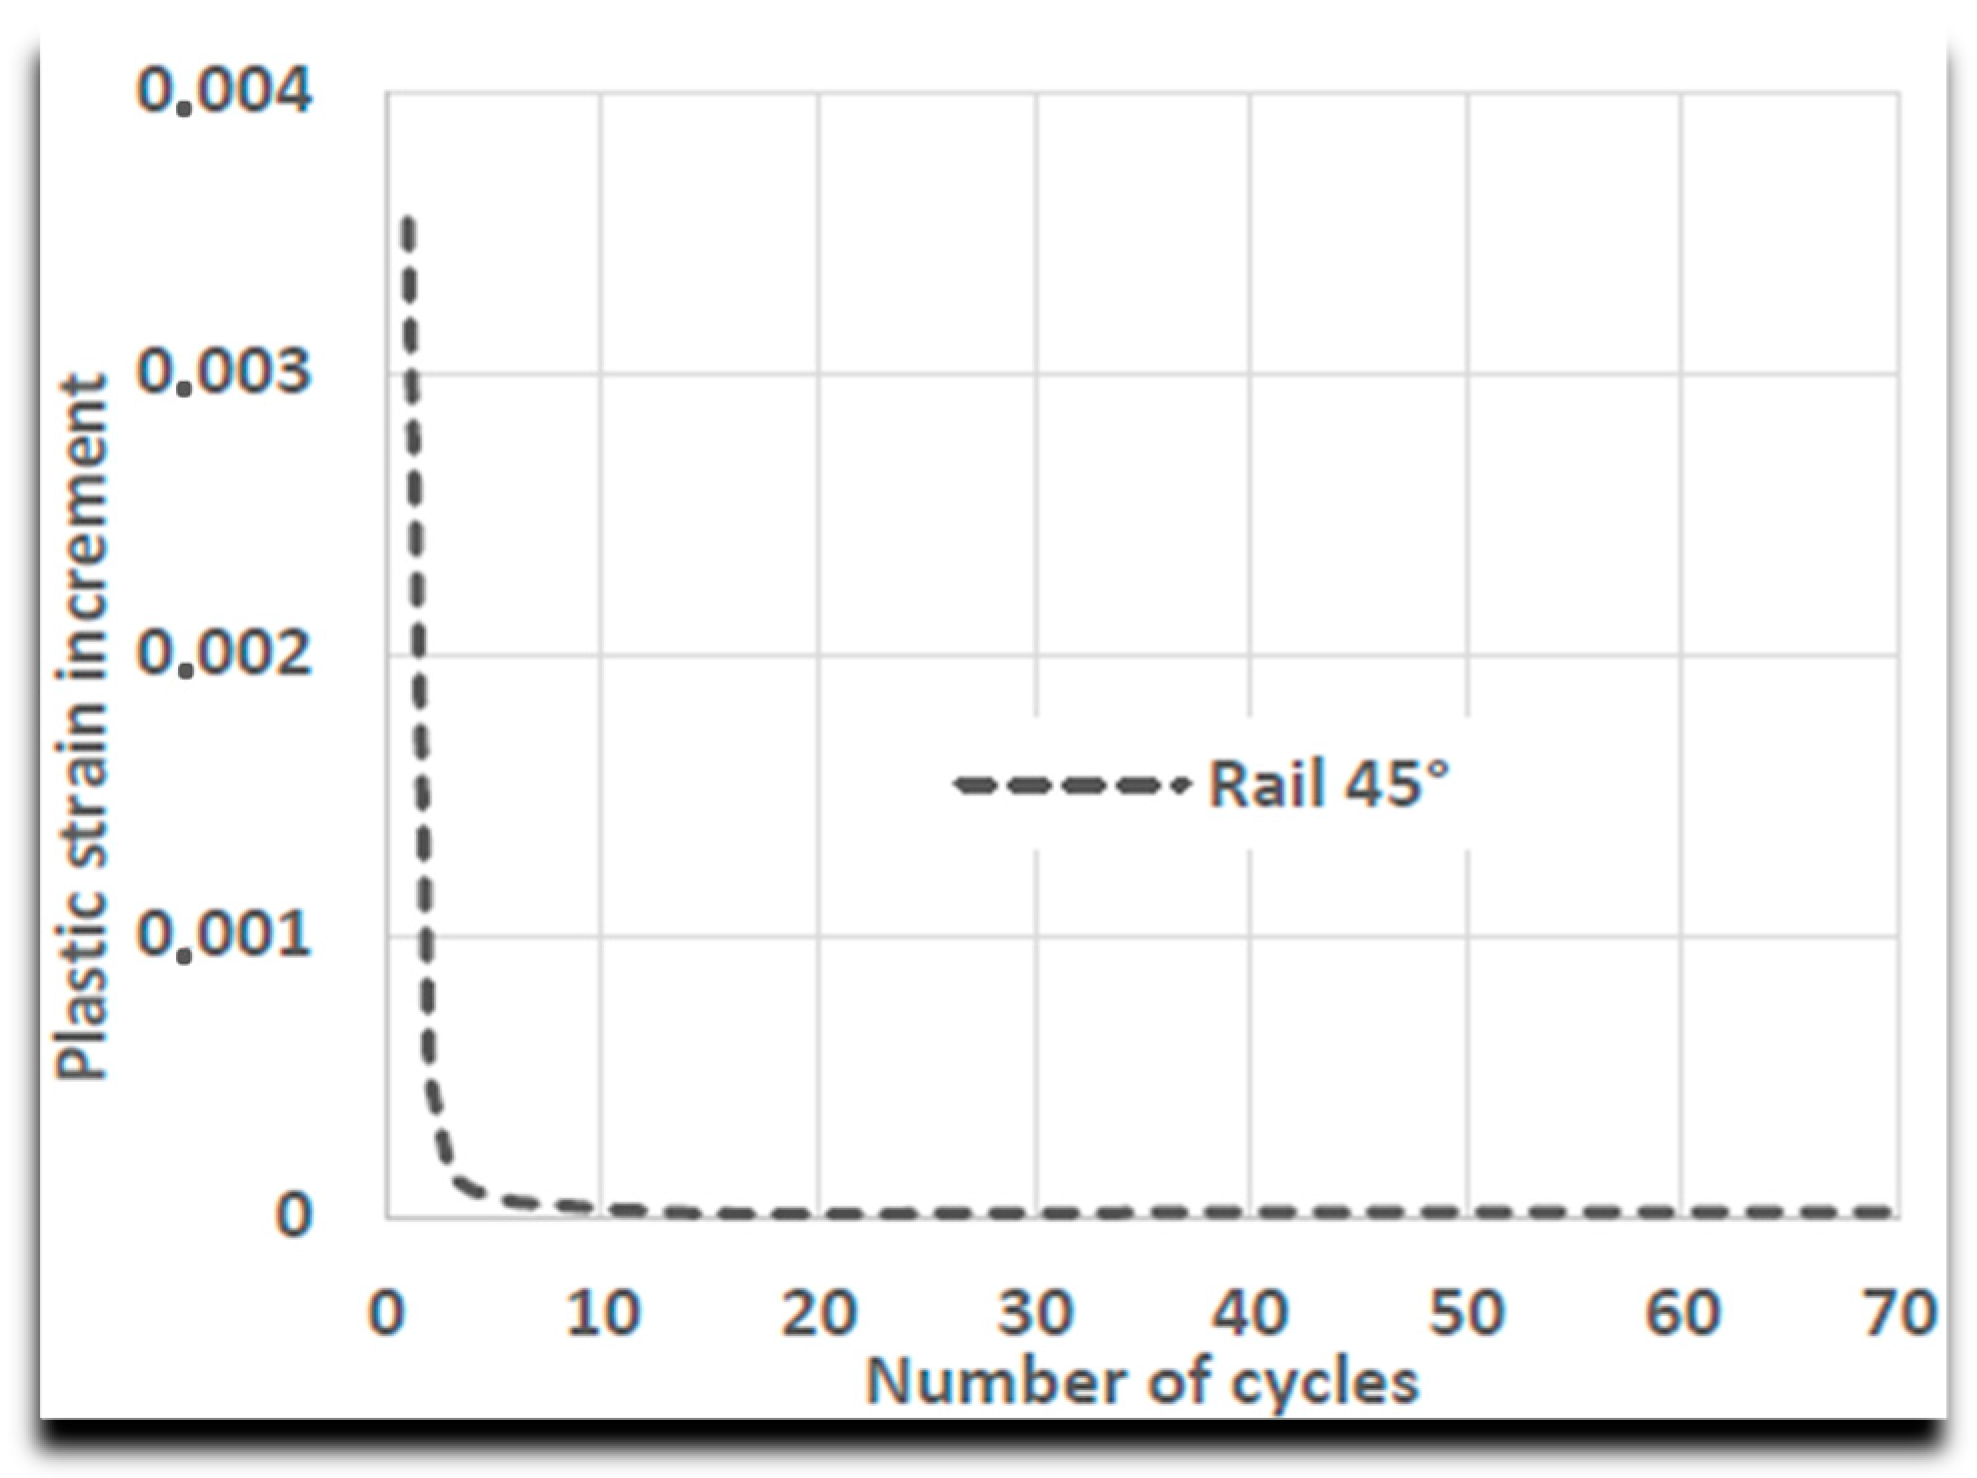
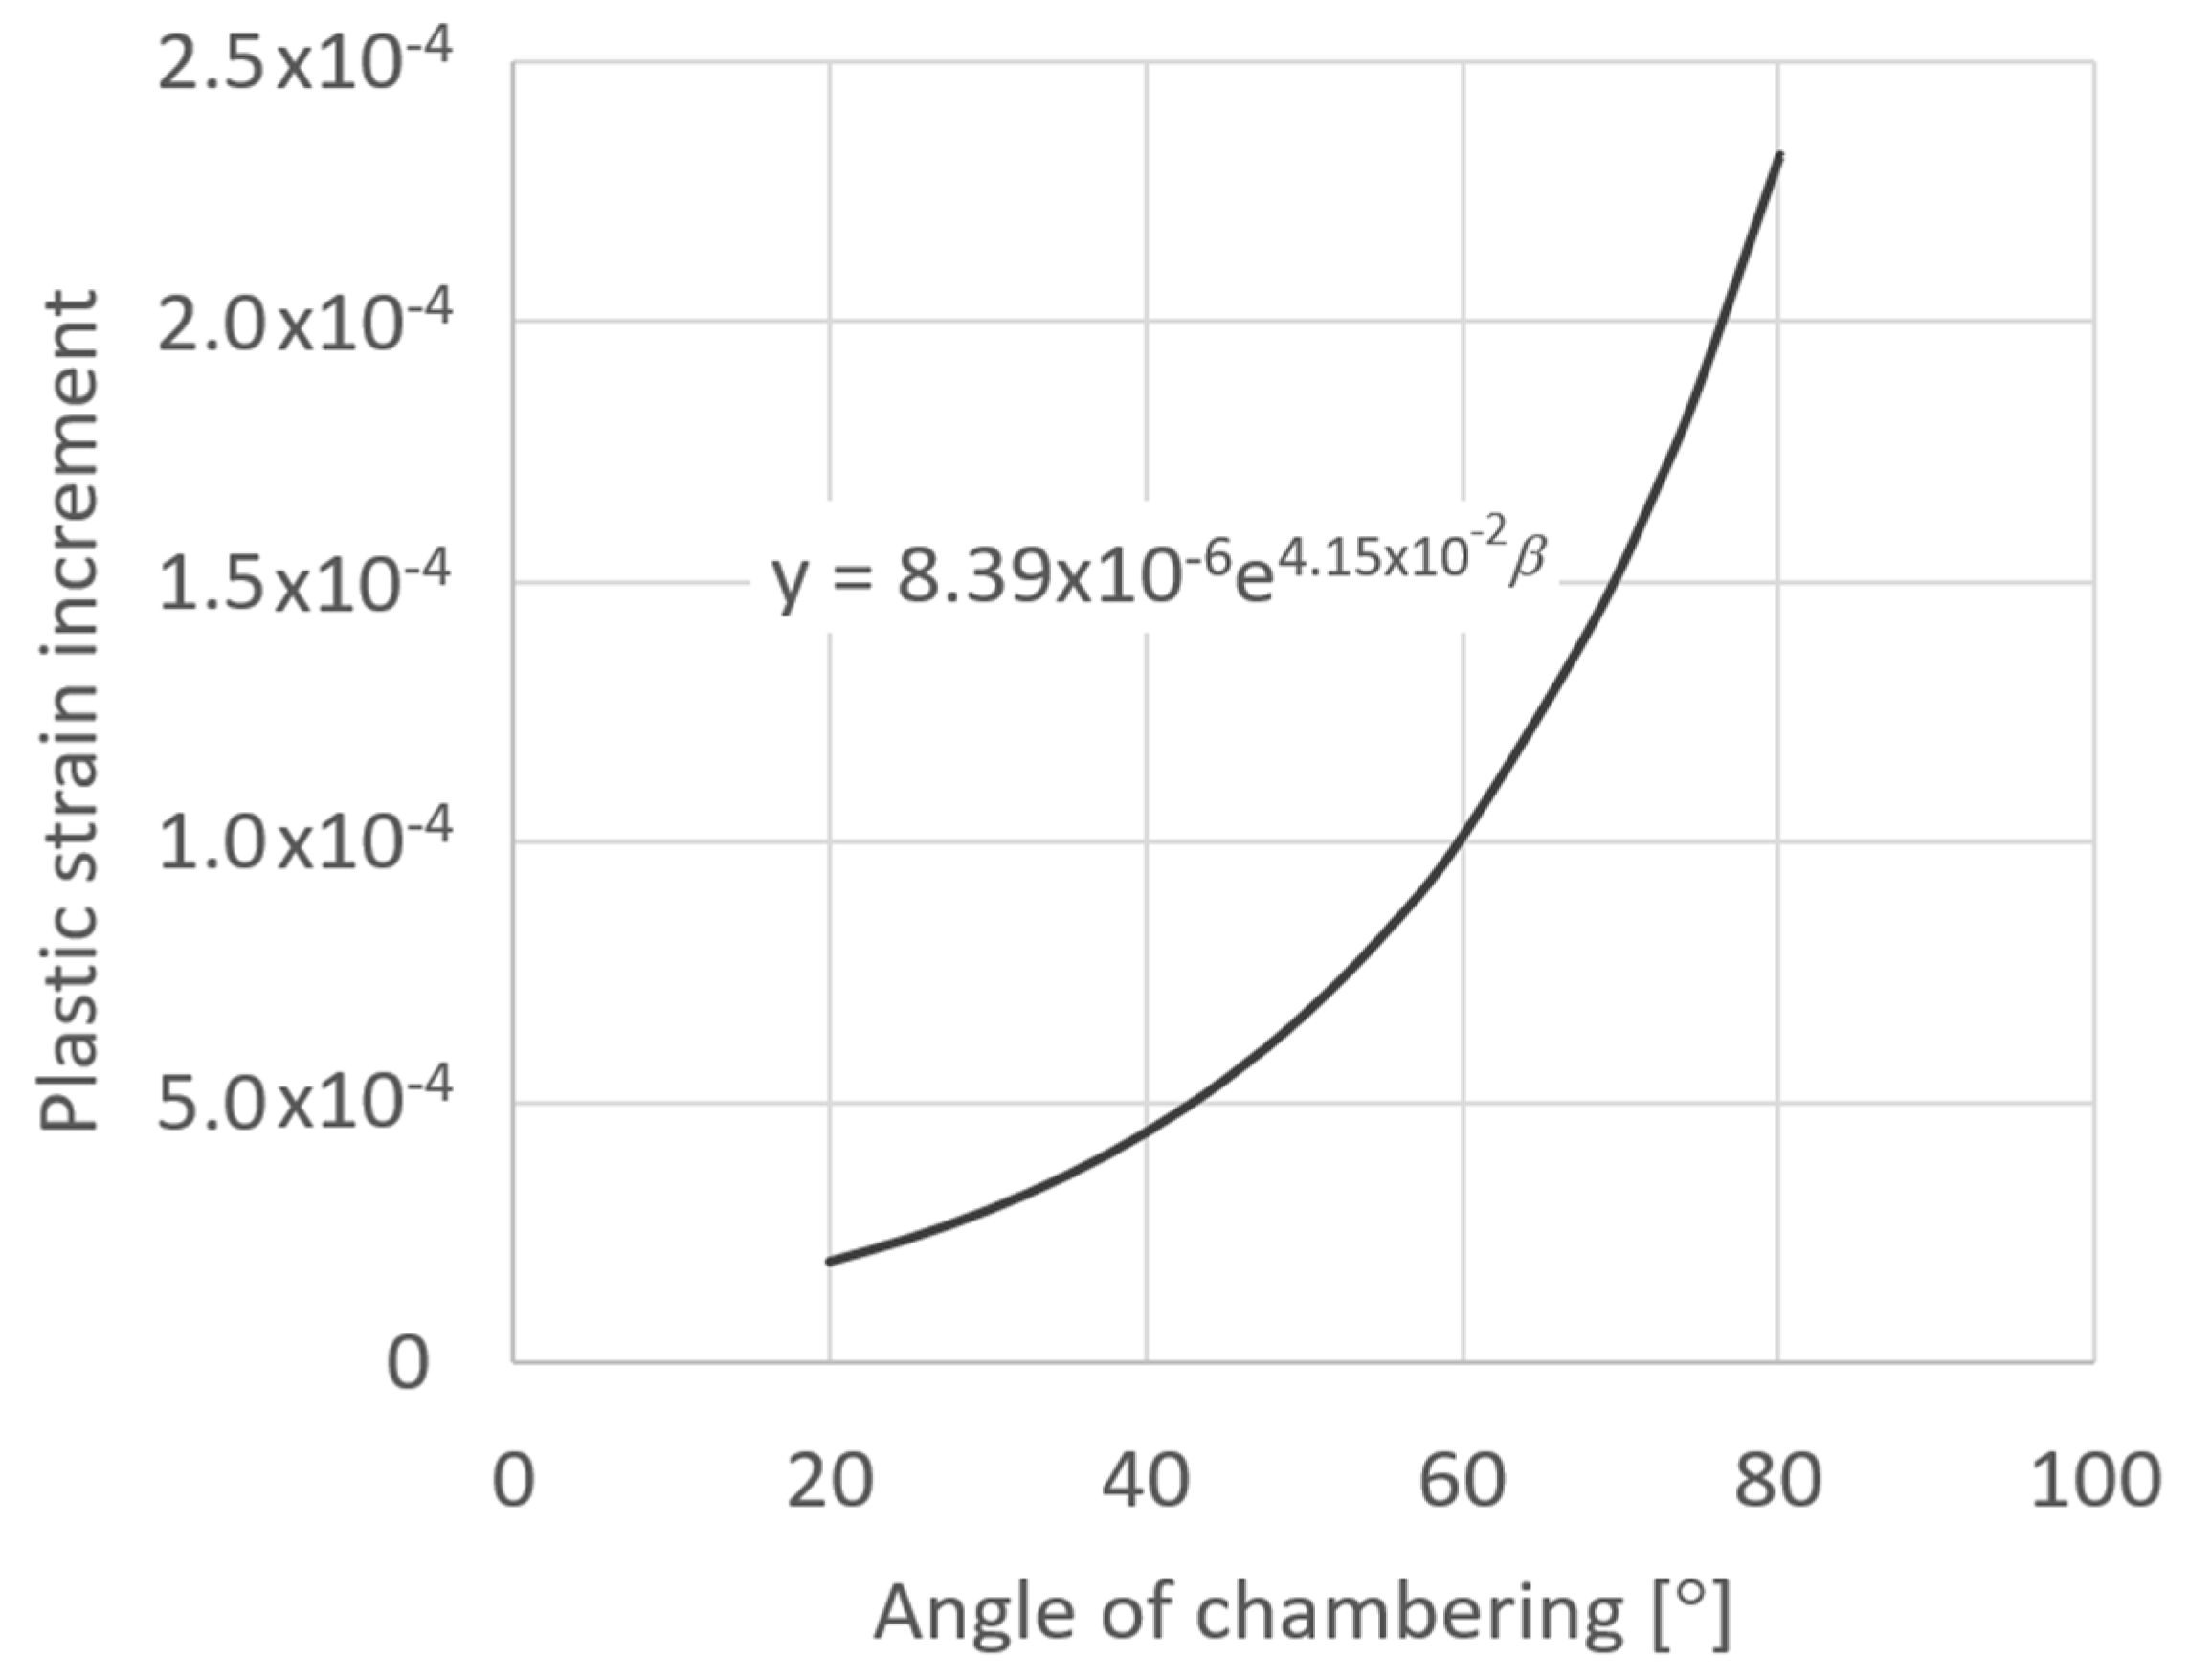
2.1.3. Results of FE Simulations

The ratcheting behavior is strongly influenced by the chamfer angle β, as is obvious from the numerical results presented in Figure 6, where the history of lateral plastic strain within 10 cycles is visible for the chosen values of β. It should be mentioned that one passage of contact load corresponds to 1 s in each FE analysis. The stabilization of the plastic strain increase was very rapid, as presented in the case of β = 45° in Figure 7, where the results of 70 cycles are shown.
For the optimization task, the results corresponding to the 10th cycle were used. The dependency of the plastic strain increment on the angle of chamfering was approximated using an exponential function; see Figure 8. The approximation function (11) can then be applied to obtain the optimal value of the chamfering angle:
δ ε p R = A · e x p ( B · β ) ,
where δ ε p R is the lateral plastic strain increment of the rail disc. For the 45-degree bevel in the wheel disc, the resulting lateral plastic strain increment per cycle at the corner node is 5.43 × 10⁻⁵. Due to the different dimensions of the specimens, a correction according to (12) is applied:
δ ε p R = N W N R δ ε p W = D W D R δ ε p W ,
where δ ε p W is the lateral plastic strain increment of the wheel disc, N W is the number of cycles of the wheel disc, and N R is the number of cycles of the rail disc. Then, the required value of the angle of chamfering obtained from (11) and (12) is as written in (13).
β = 1 B l n D W A · D R δ ε p W = 68.15 ° .

2.2. Experimental Verification

2.2.1. Experimental Setup

For the verification of the proposed approach, two RCF tests were performed on the TUORS testing machine at the Laboratory of Rolling Contact Fatigue at the VSB—Technical University of Ostrava. In both tests, the wheel disc was used with the chambering angle β = 45°. In the first RCF test, the rail disc was used without edge bevel ( β = 90°). The second test was carried out with the chambering angle β = 70°.

2.2.2. Results of Validation Experiments and Discussion

A comparison of the traction coefficient history for both tests, evaluated from the torque, is shown in Figure 9. The significant difference in the decrease in the traction coefficient between both tests confirms well the need for rail disc chamfering. Other experimental results are reported in Table 3. Both RCF tests were stopped when the torque decreased to a value less than the initial torque. To achieve stable experimental conditions using this approach, the observation of the similar specimen width and the total disc weight loss of both specimens in the second test with optimized rail disc geometry is also positive information. The proposed strategy based on FE simulations uses the two-dimensional Hertzian theory to generate appropriate boundary conditions in the three-dimensional analysis. This is a simplification, but from the results it can be seen that it is applicable with an acceptable accuracy.

3. Real-Time Contact Contour Measurement

In the second study of this paper, two laser profilers are used to measure the dimensions of the specimens during the RCF test. The obtained real-time values of specimen dimensional contours not only proved to be useful quantities for wear characteristics, but they can also serve as supporting data for qualitative evaluation of the wear-test control.

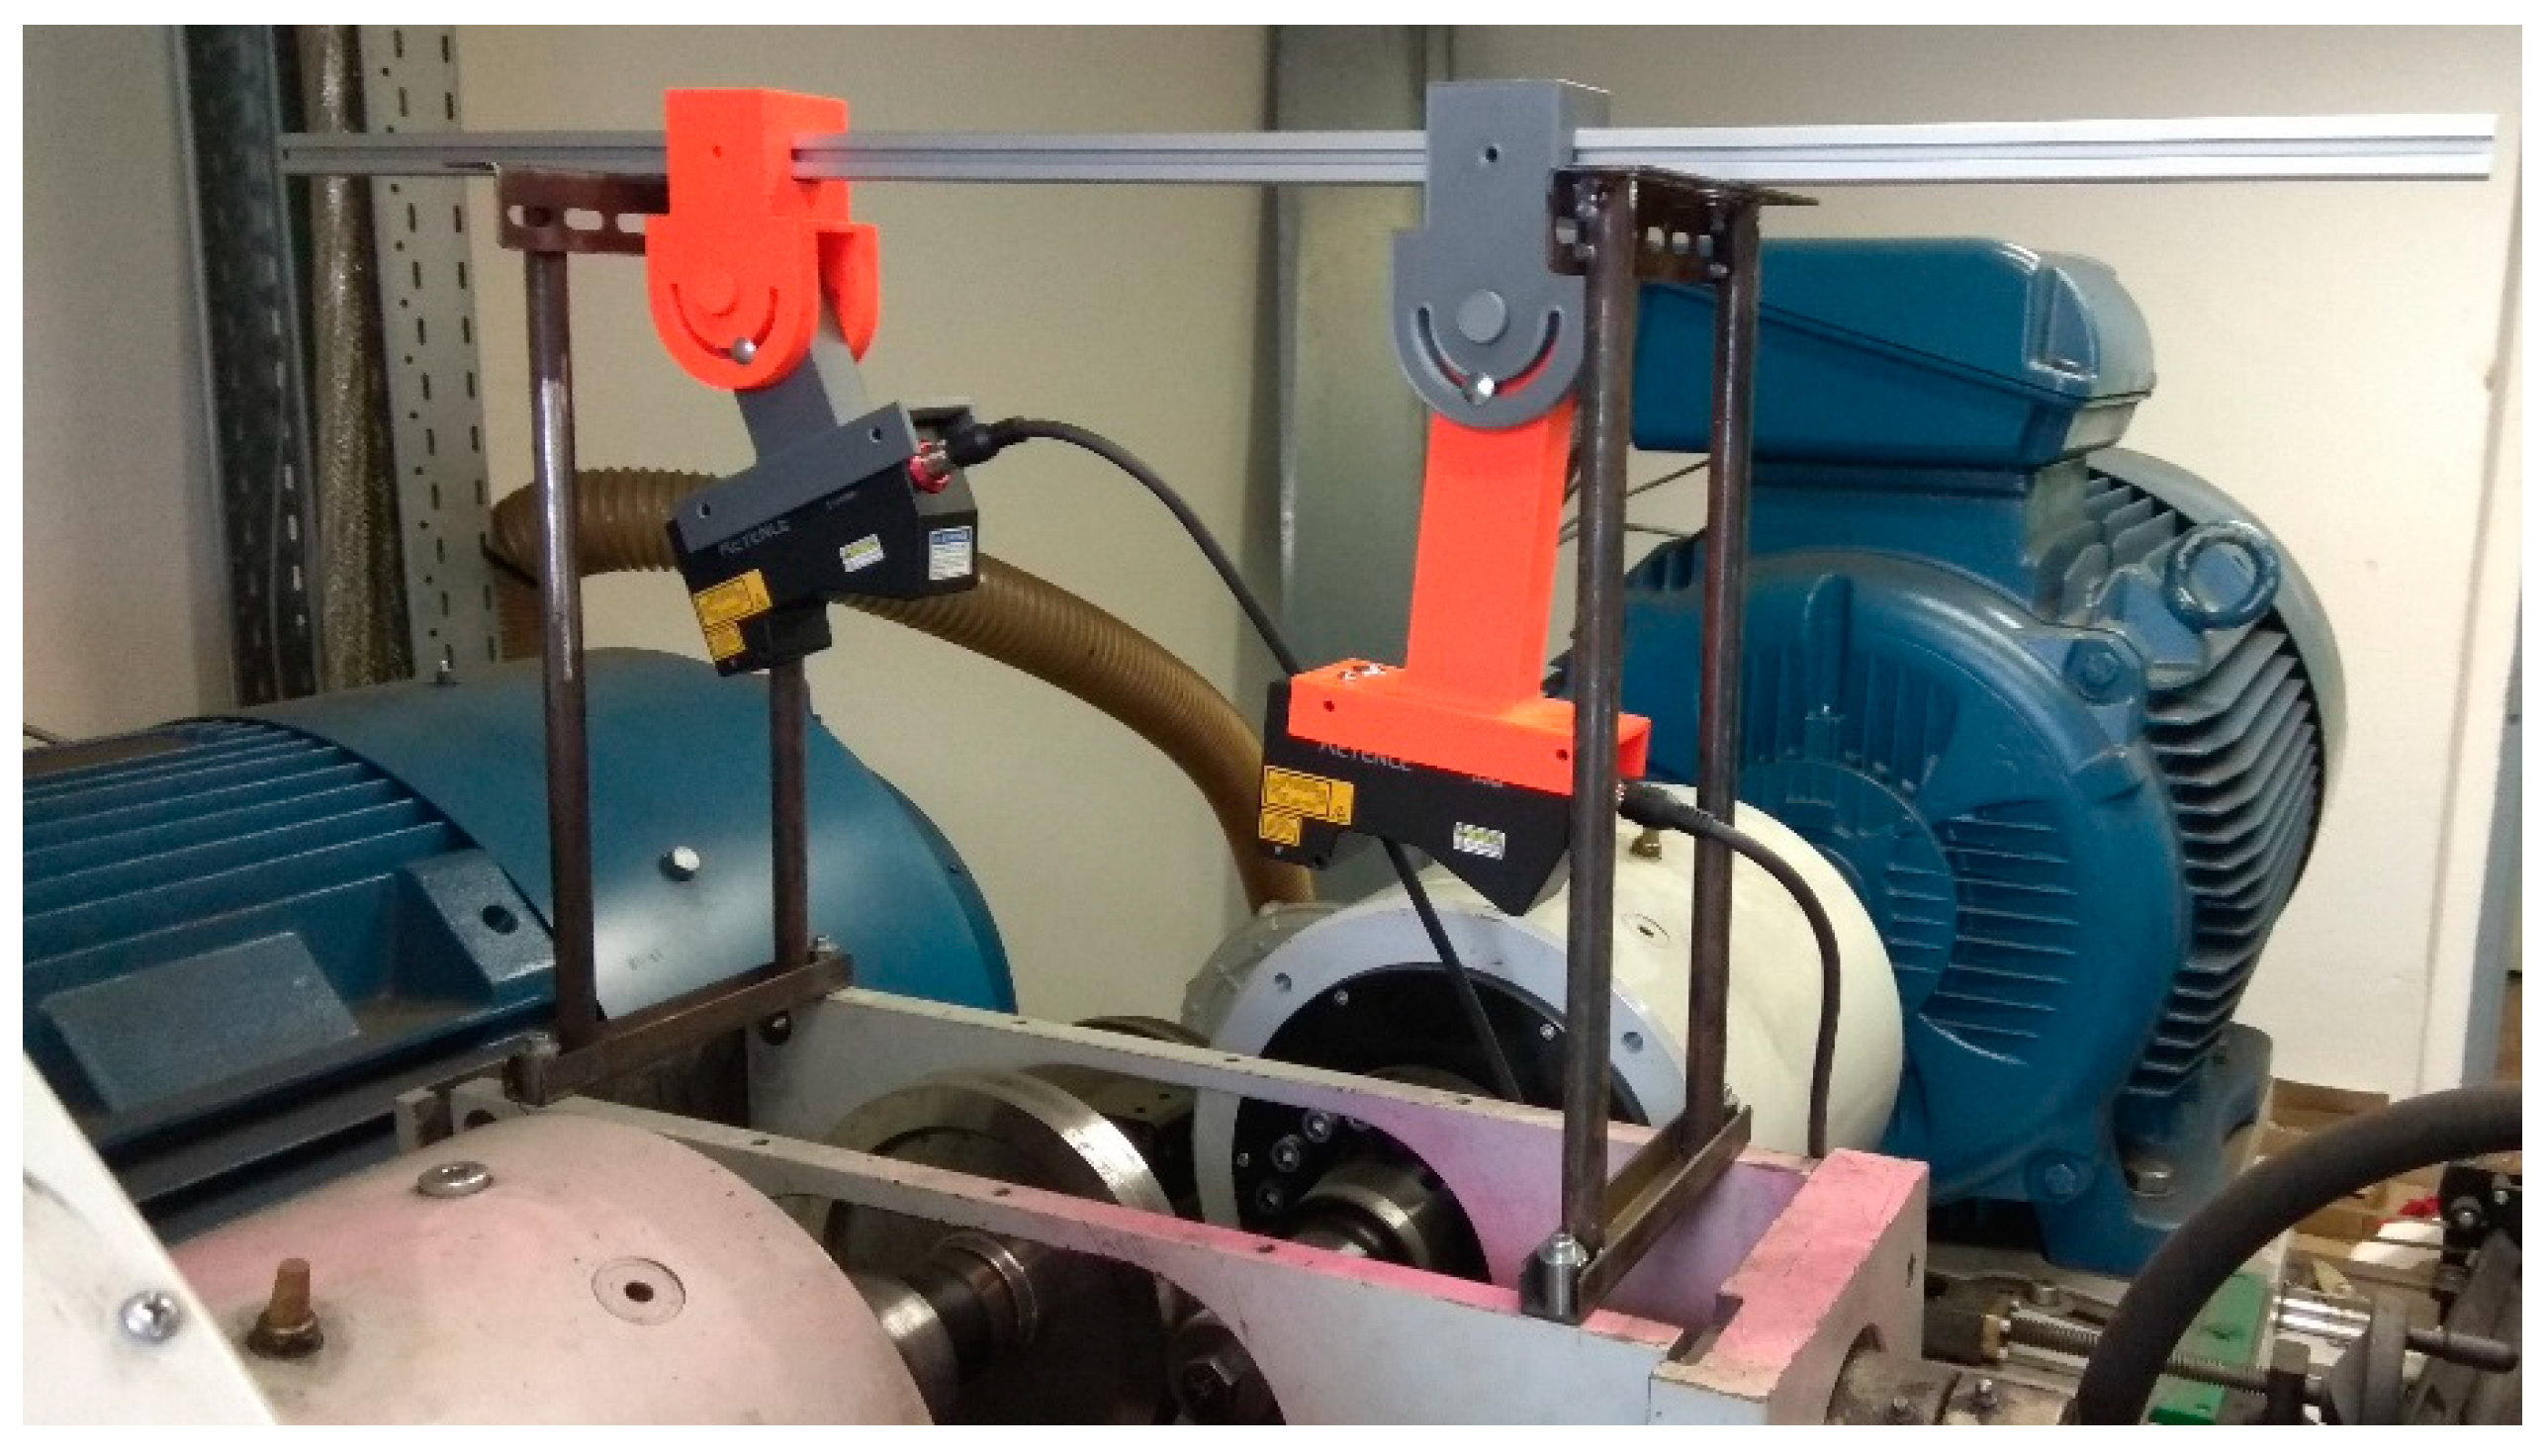
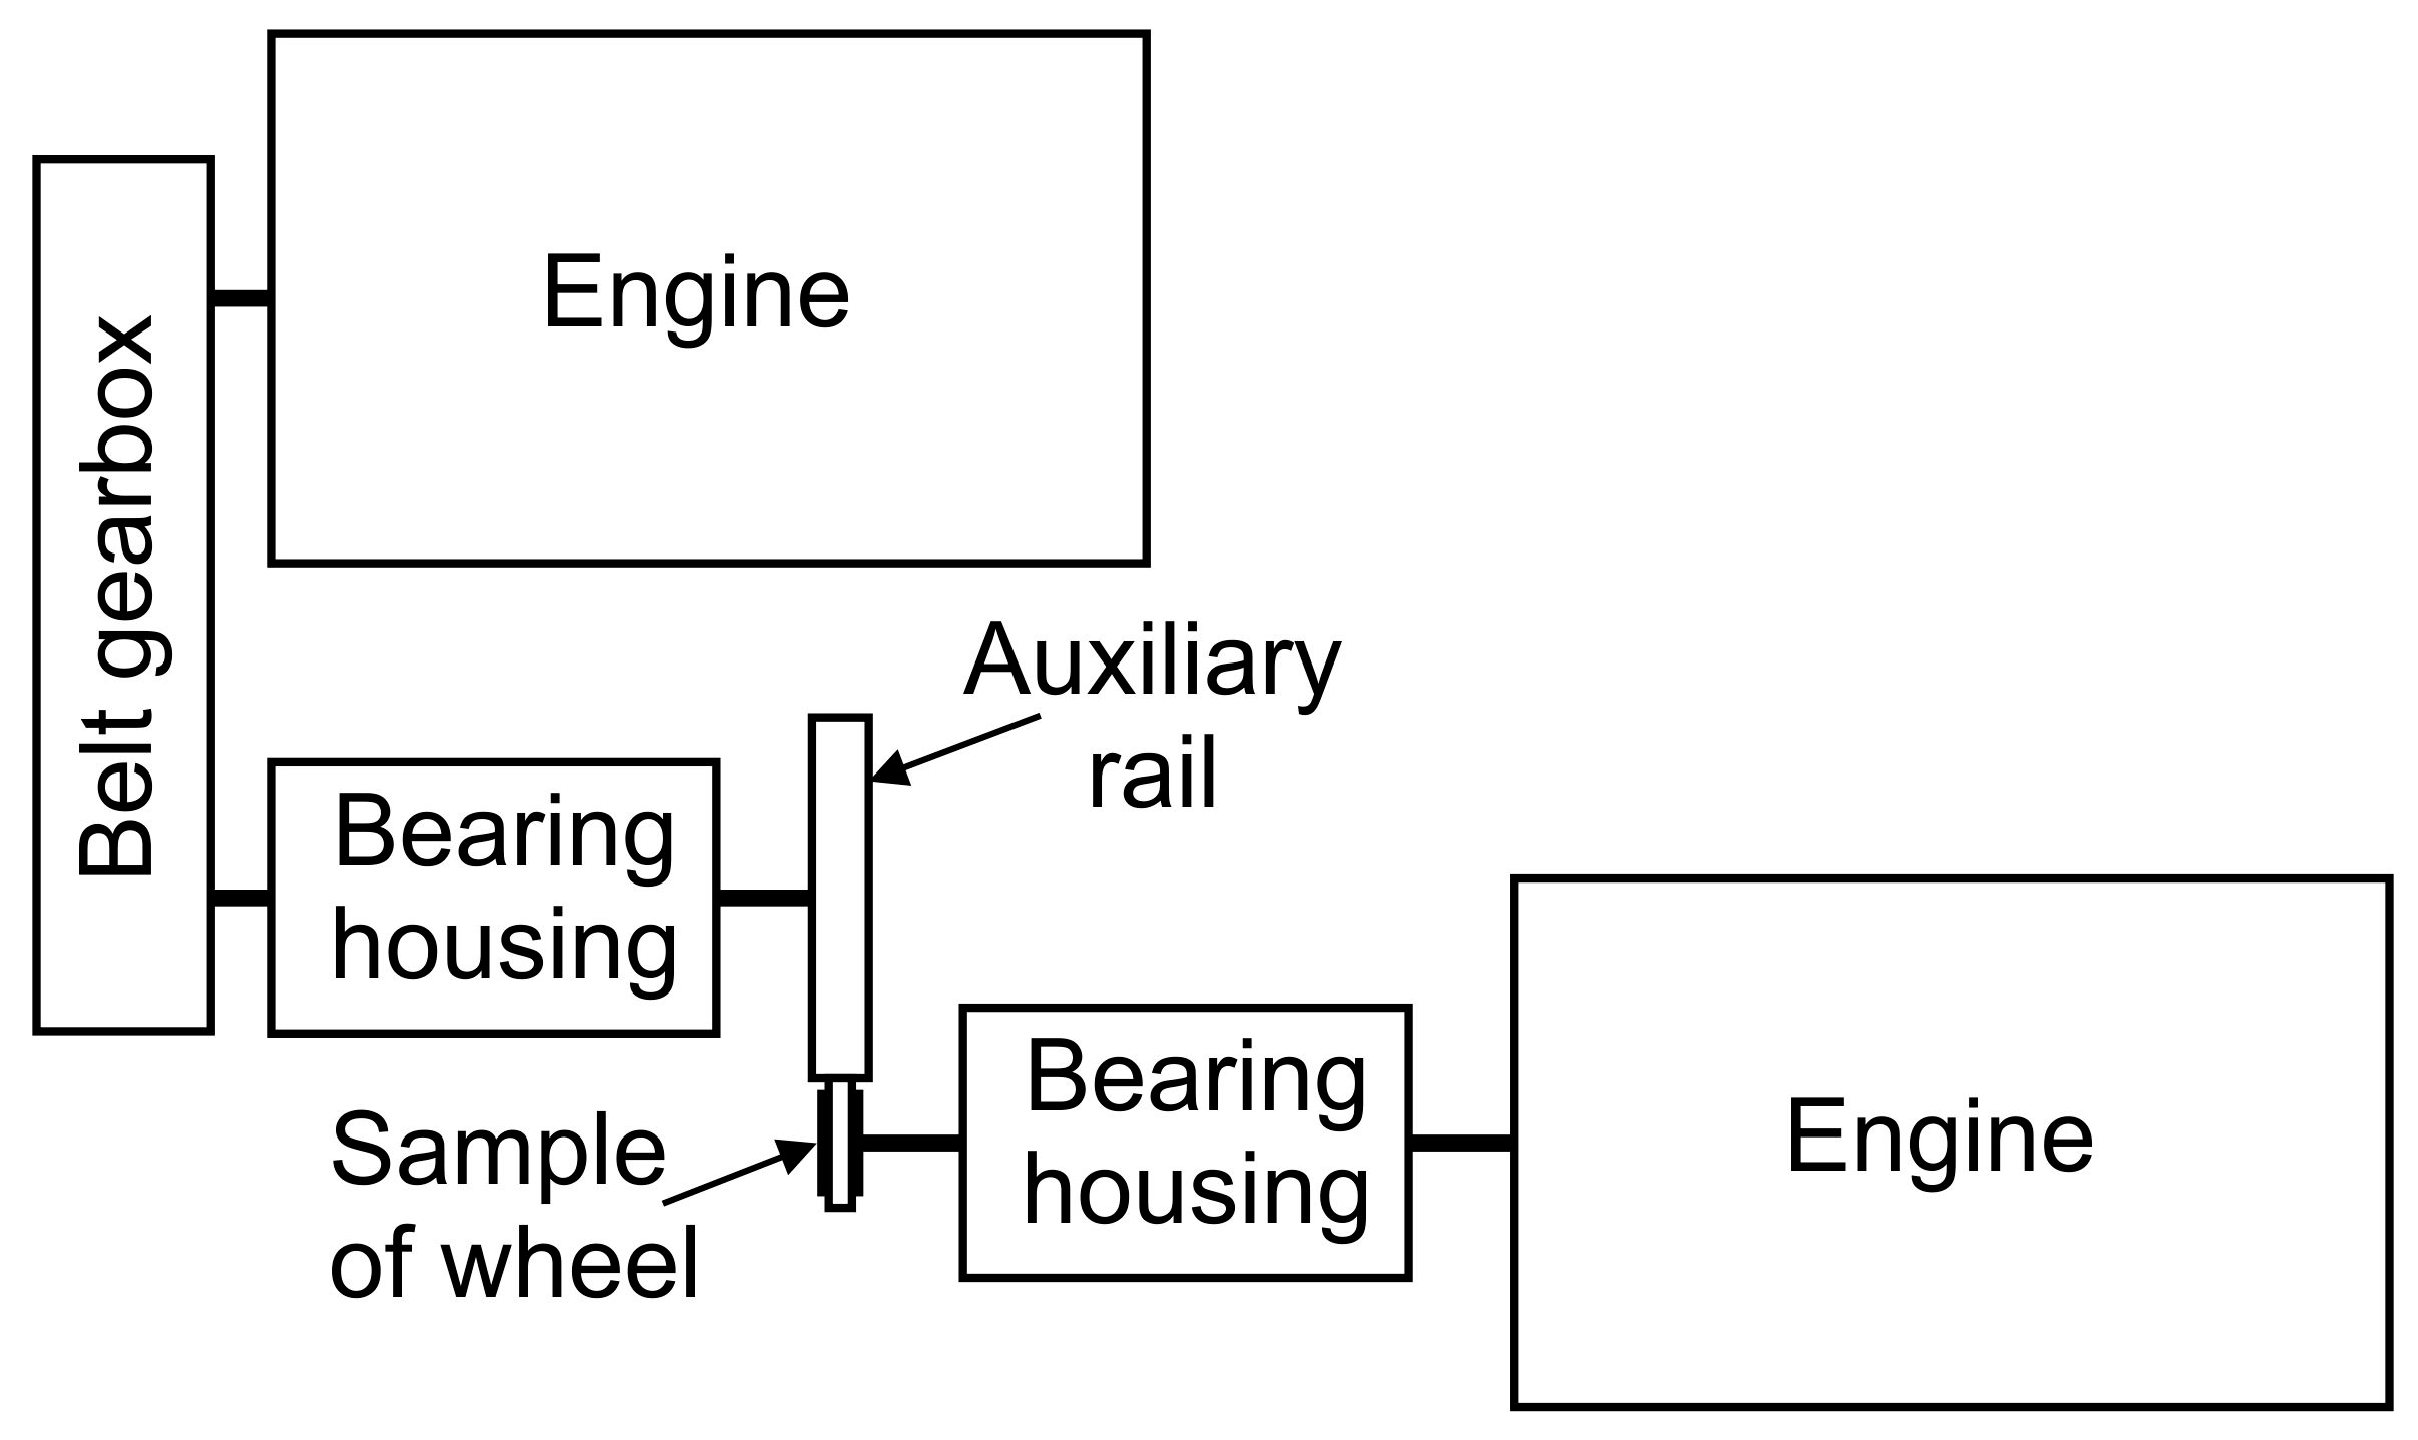
3.1. Experimental Setup

The experimental testing rig was manufactured by the Inova Praha company. The specimens are driven by two asynchronous motors, while the desired contact pressure between both discs is induced using a hydraulic unit. The laser profilers for measuring the specimen contours were made by Keyence (Keyence LV-7200 type). The profilers were mounted on self-developed plastic holders, produced using 3D-printing technology (Figure 10) and controlled by the Keyence LJ-V7001P module. The signal measurement range of each laser profiler is divided into 800 points, collinear to the axis of rotation, and this corresponds to a 60 mm field of view. The sampling frequency of the profile sensors was set to 10 Hz.
The basic block diagram of the measuring system with laser profile sensors is shown in Figure 11. Laser head ‘A’ records the linear contour of the rail disc, while laser head ‘B’ records the linear contour of the wheel disc. Both heads are synchronized for simultaneous scanning.
The material of the specimens, intended for subsequent twin-disc testing, was Class C, as specified in Chapter 2. The rail disc was additionally hardened through induction of the surface. The initial diameter of the wheel disc was 70 mm, with a contact width of 10 mm. The rail disc is considerably larger, with a diameter of 220 mm and a total width equal to 30 mm.
The total test time was 3 h, which corresponds to 36,000 revolutions of the wheel disc and 95,000 profile cycles (records).
The basic concept of the arrangement of the individual disks during the test is shown in Figure 12, where the large wheel simulates the rail and the small wheel the wheel on which the required pressure force acts. Figure 13 then shows the global mutual disposition arrangement of individual functional parts of the measuring stand, such as drive electric motors and gearboxes.
Both electric motors are equipped with integrated incremental rotation angle sensors. Another incremental rotation angle sensor is located on the shaft of the rail body. The primary data on the angle of rotation can be used to obtain data on the angular or peripheral speed with the help of the calculated values. By comparing these data, slip at the rolling point can be determined. In practice, this means that a constant speed is specified for the test body of the wheel, i.e., its electric motor. The diameters of the wheel and rail bodies are scanned using lasers and the required slip is entered. From these data, the revolutions of the rail body are calculated, which are controlled using the revolutions of the electric motor.

3.2. Testing Conditions

The test was carried out under dry rolling/sliding conditions at room temperature, with constant angular velocities of the wheel and rail discs. There was no additional cooling, just natural heat convection in the air. The initial Hertzian contact pressure p i was calculated (14) according to the line contact case theory [44], i.e.,
p i = 0.59   2   · F p w 1 E 1 + 1 E 2   ·   d 1 · d 2 d 1 + d 2 ,
where F p represents the compressive force, w is the contact width, E 1,2 are Young’s moduli of the wheel and the rail discs respectively, and d1,2 correspond to the diameters of discs. The initial Hertzian contact pressure was set to 1200 MPa. Figure 14 shows the contours of the wheel and rail discs measured after 5000 wheel cycles. The slip ratio s induced by the difference in peripheral speeds (15) was set considering the formula
s = v 1 v 2 v 1   +   v 2 2 = d 1 2 · ω 1 d 2 2 · ω 2 d 1 2 · ω 1   +   d 2 2 · ω 2 2 = 2 d 1 · ω 1 d 2 · ω 2 d 1 · ω 1   +   d 2 · ω 2 ,
where v 1,2 are peripheral speeds of the discs and ω 1,2 are the angular velocities of the wheel and the rail discs respectively.

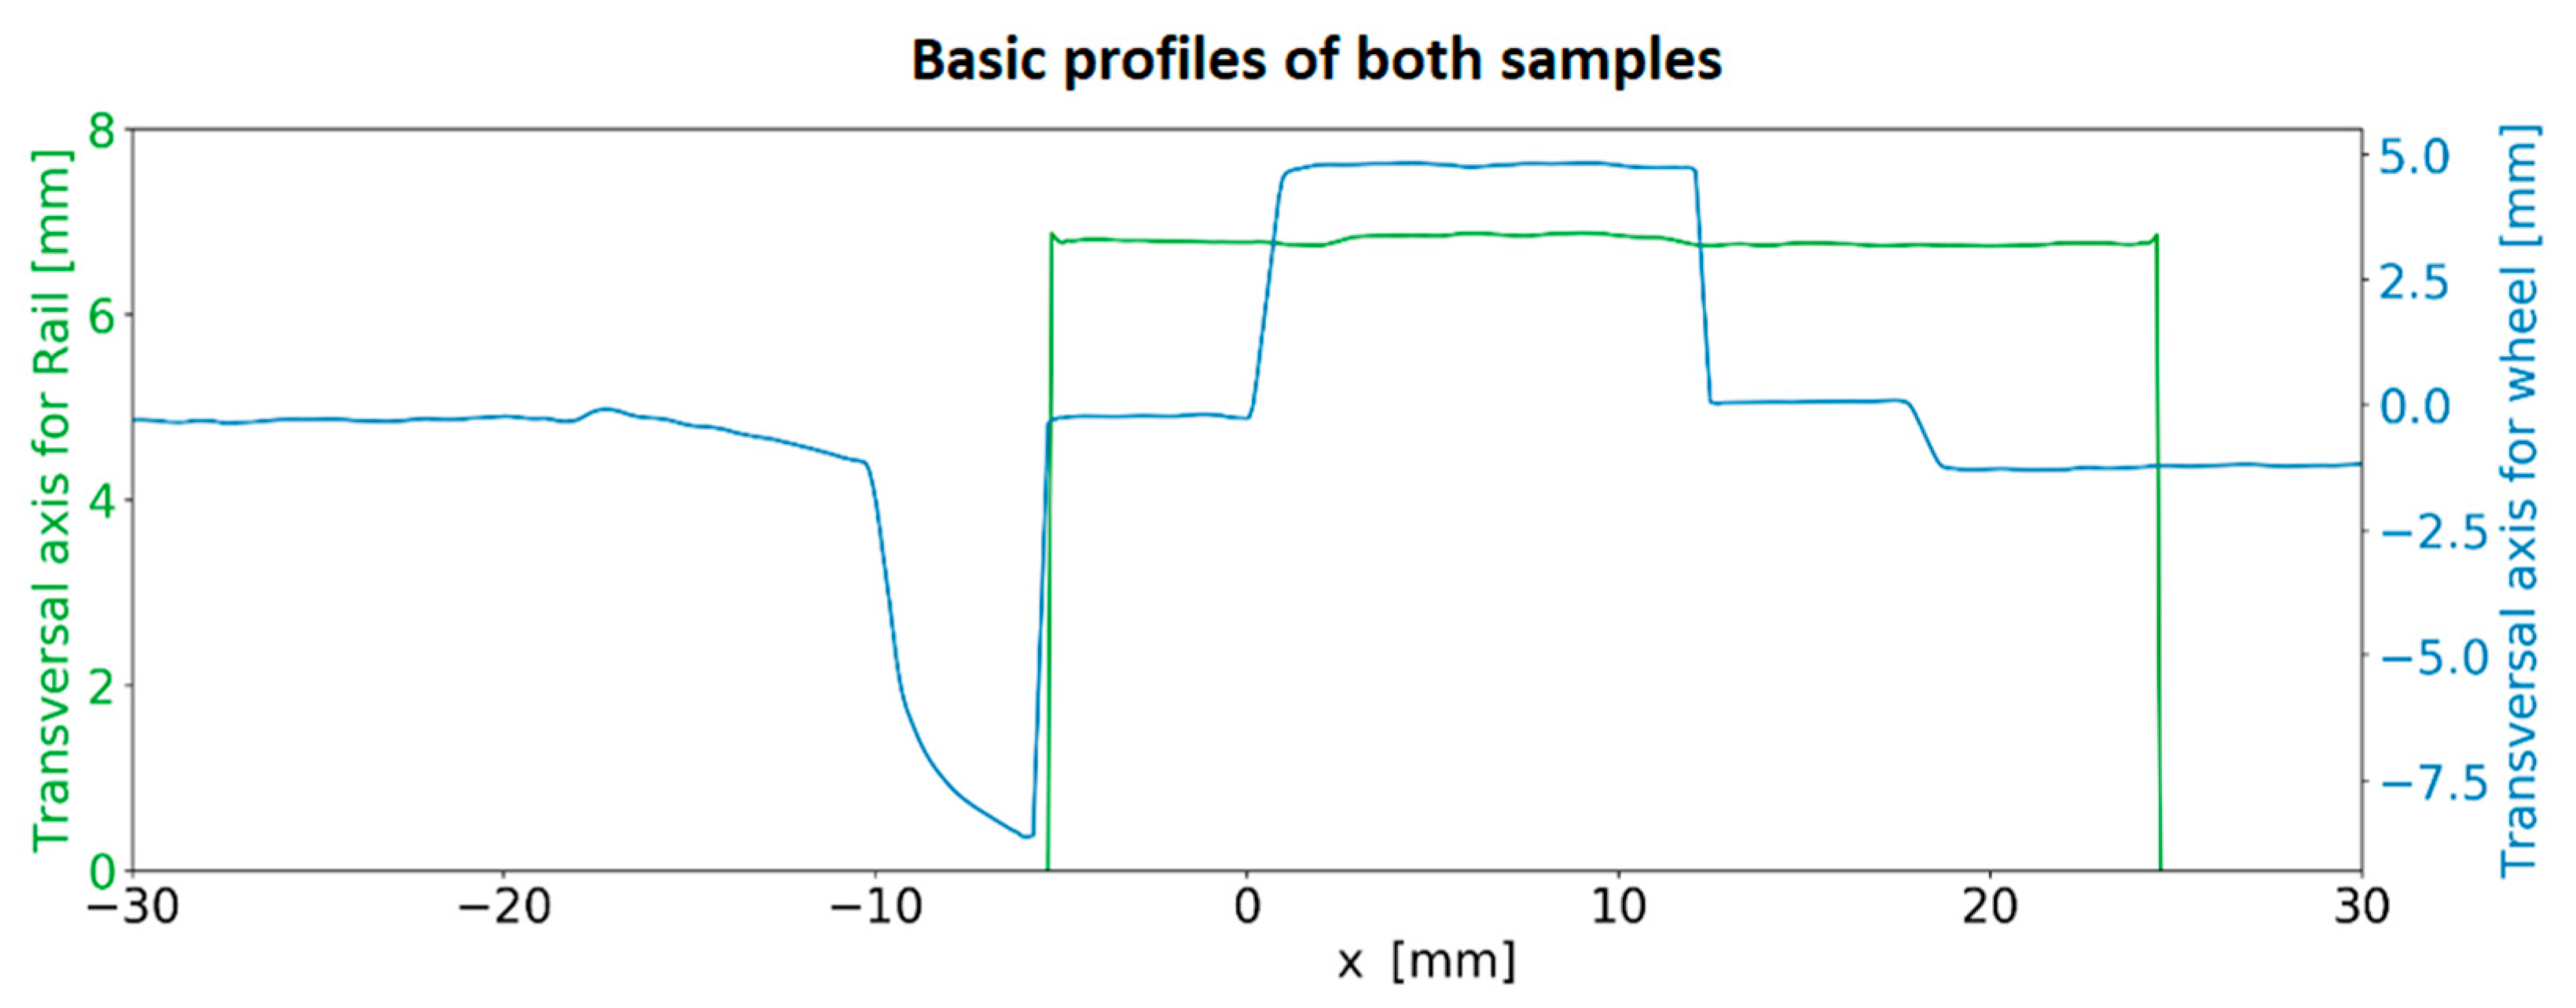
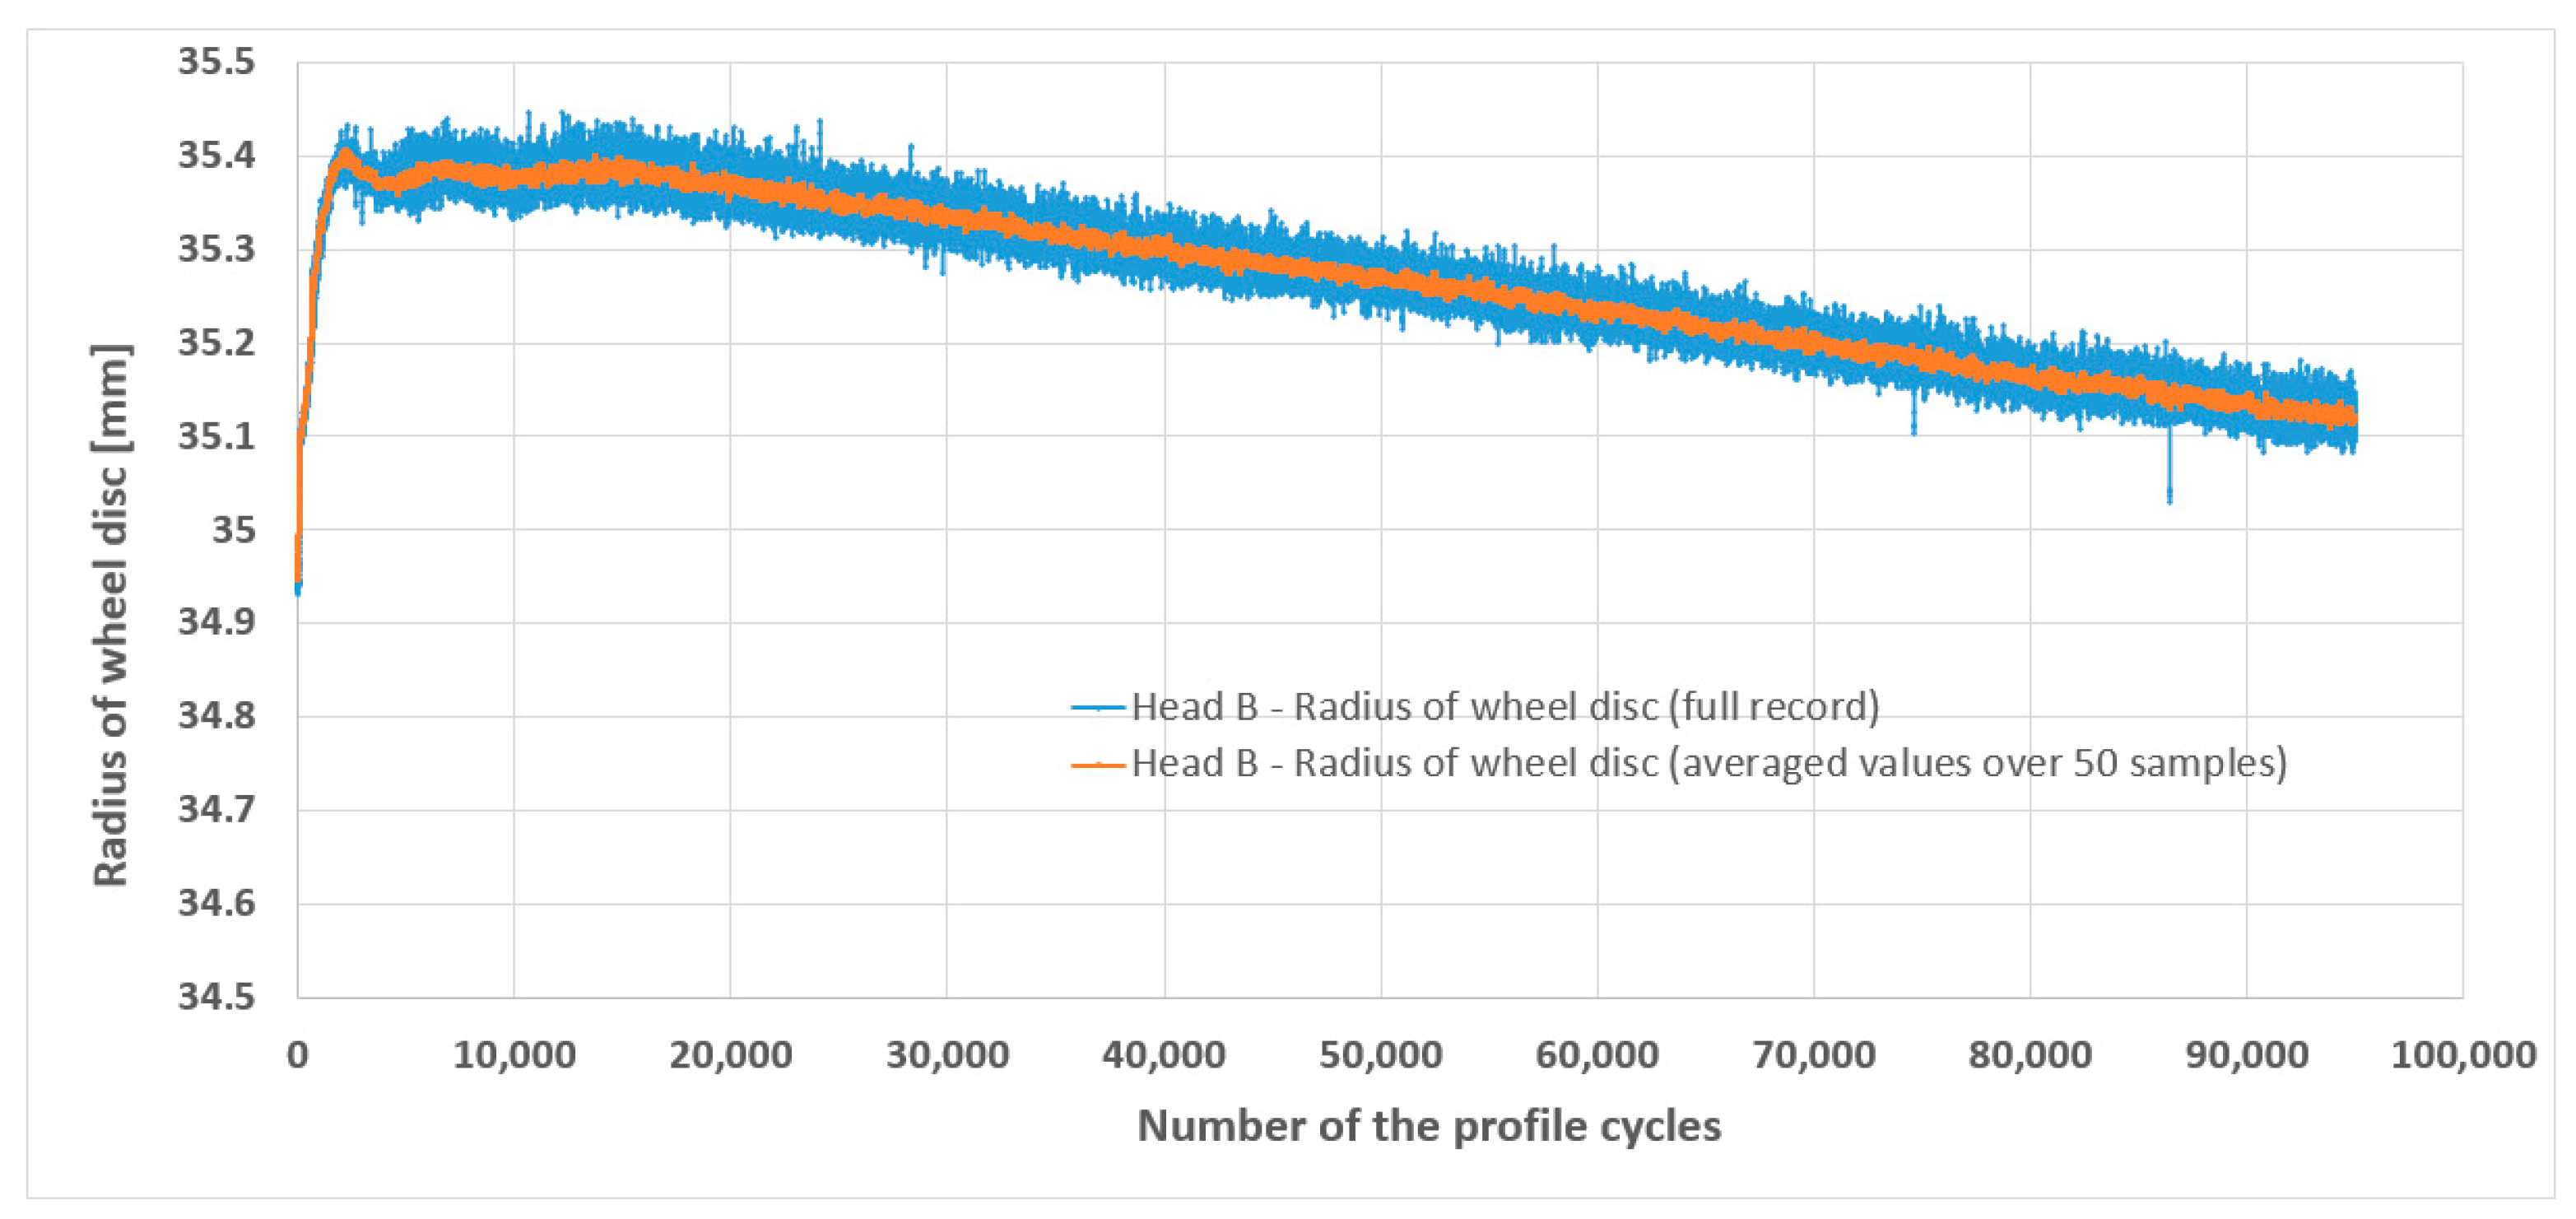
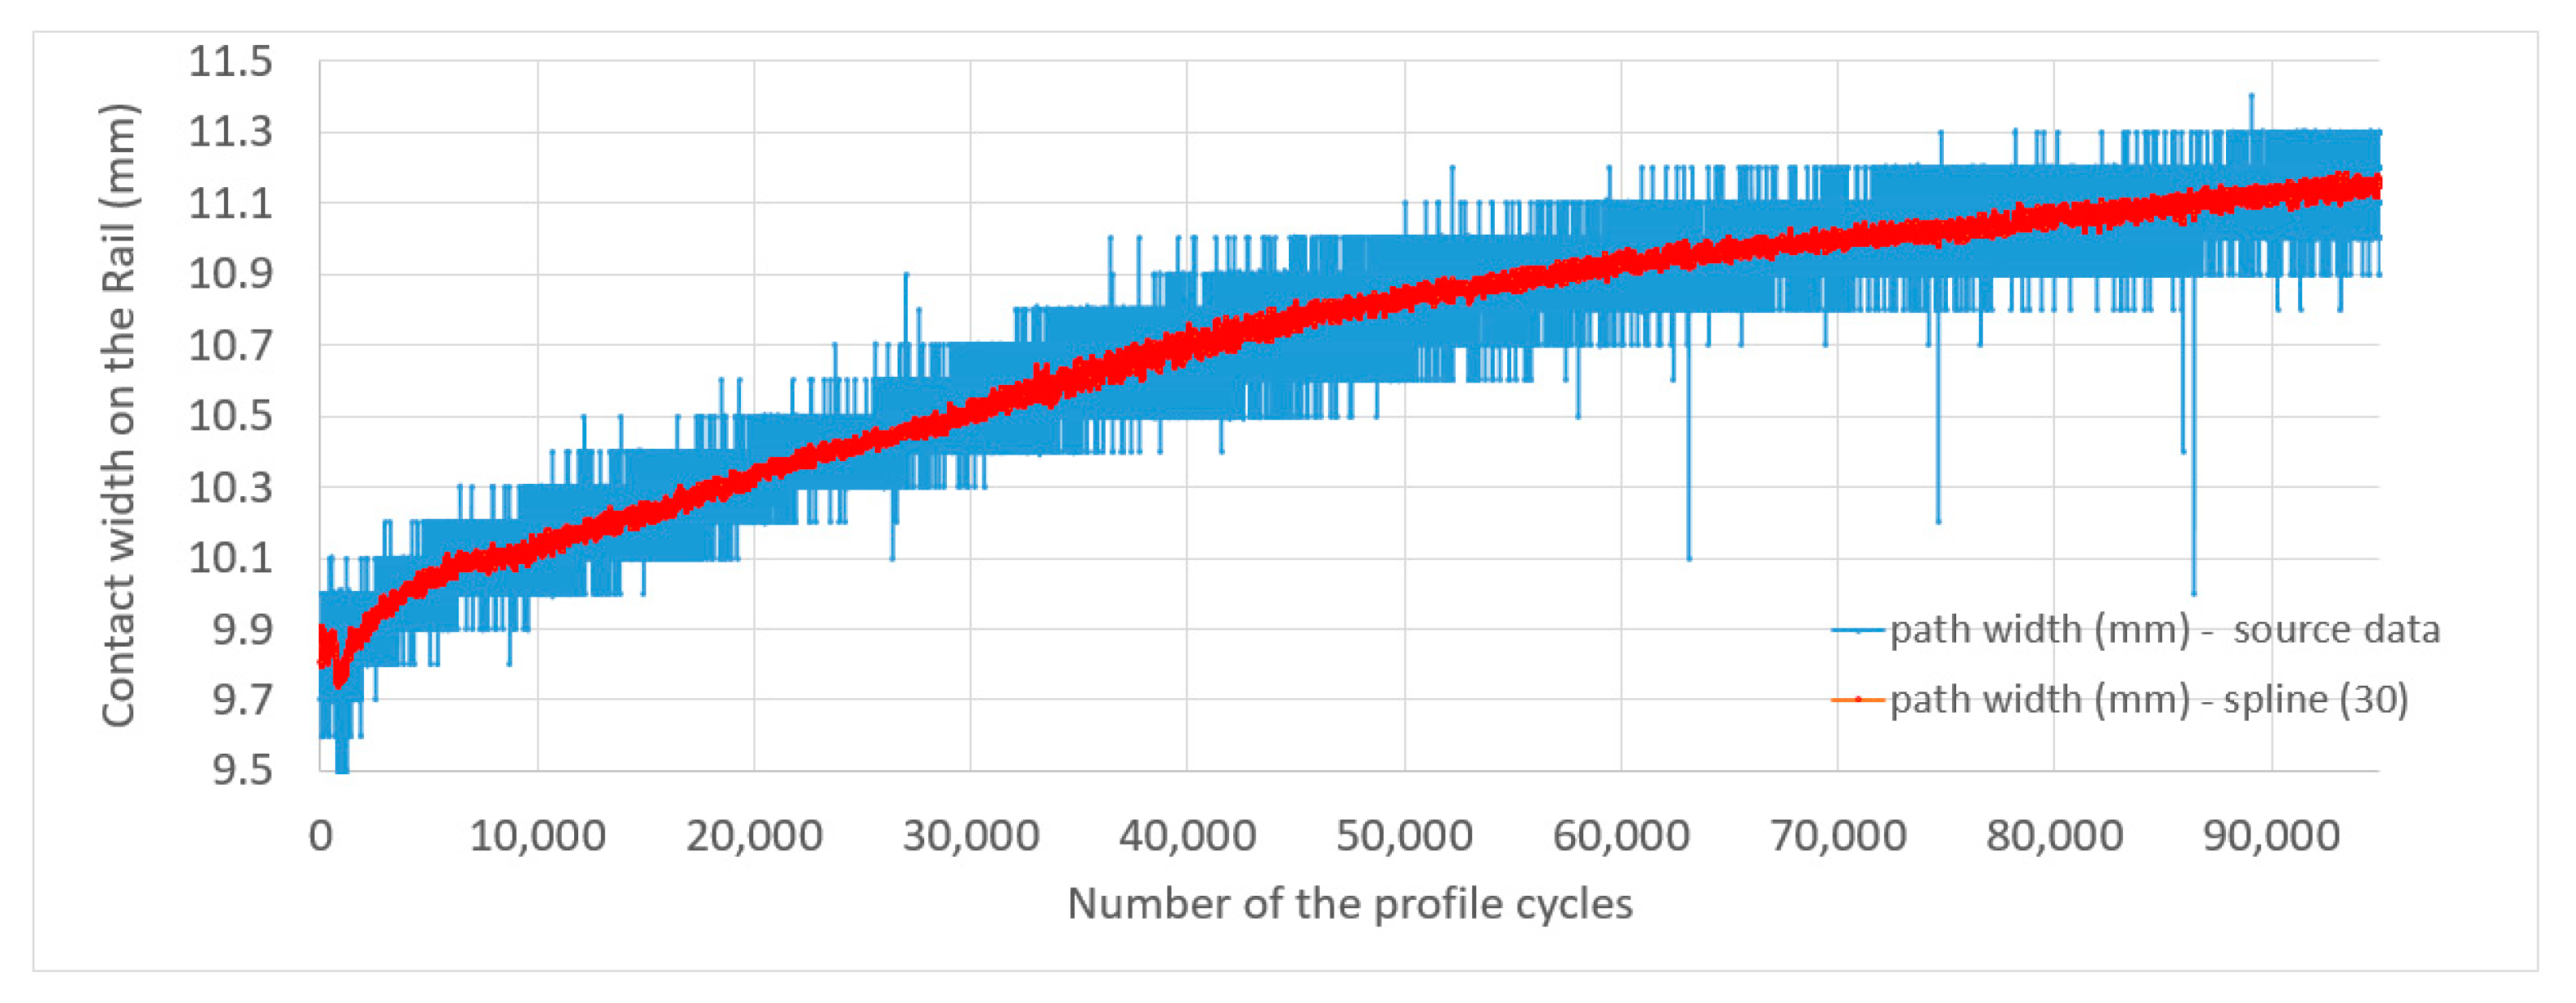
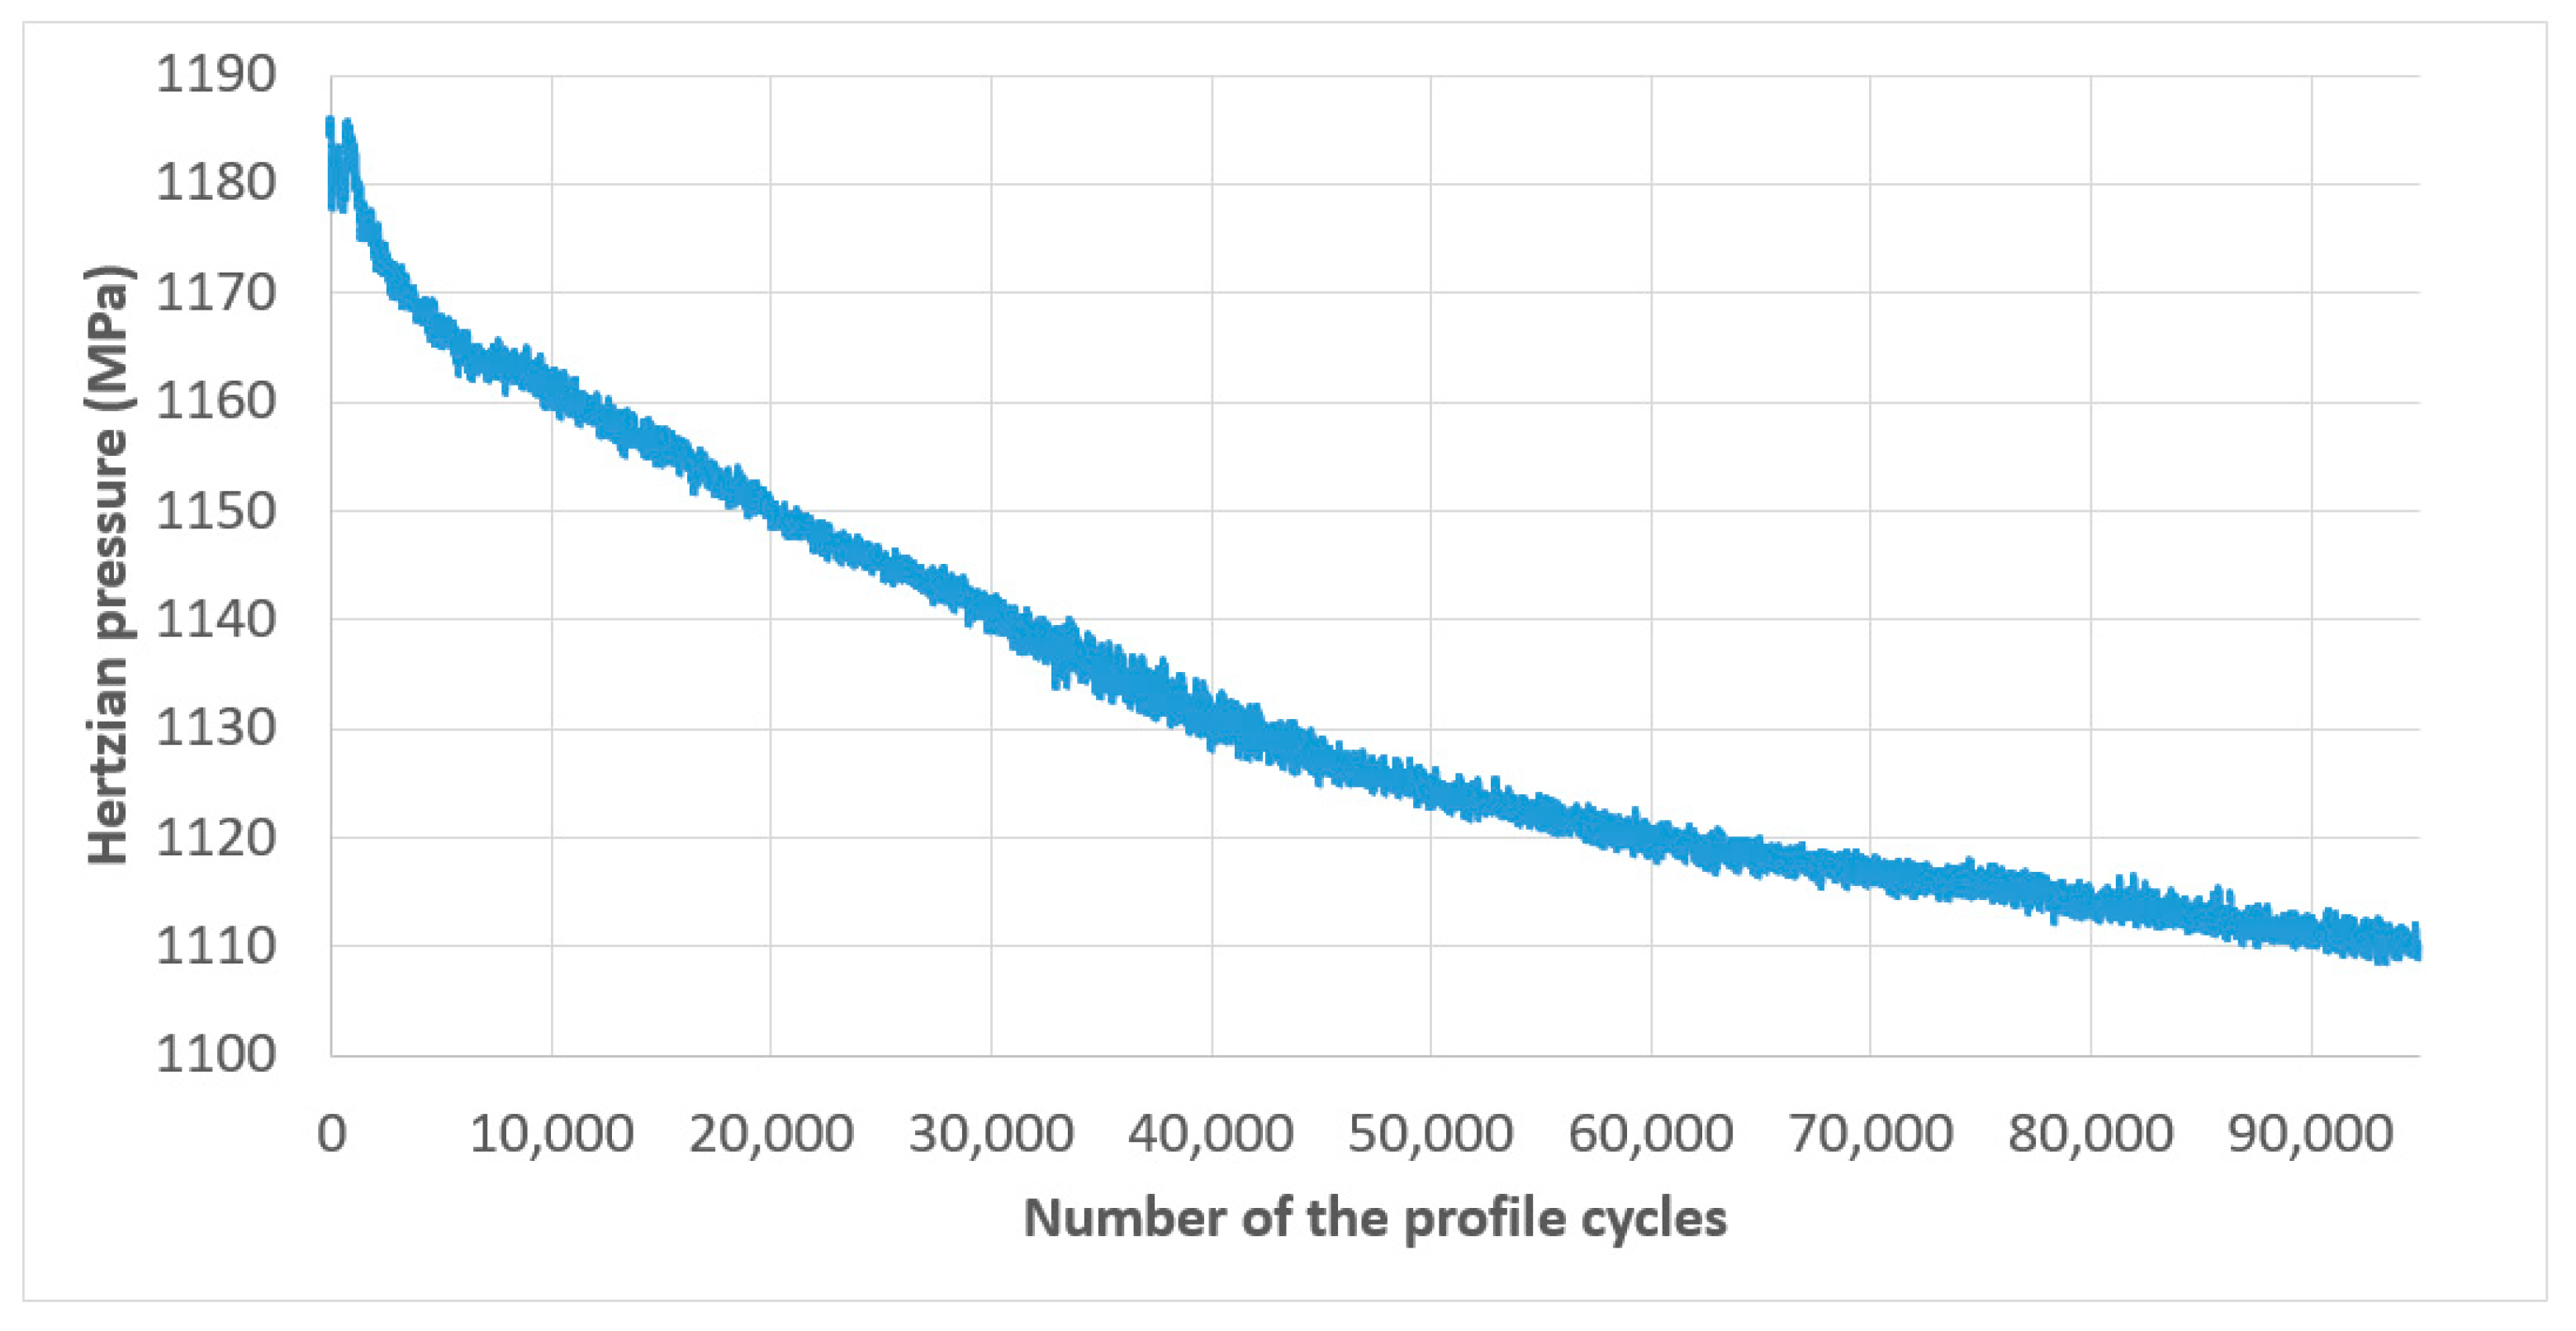
3.3. Test Results and Discussion

Figure 15 and Figure 16 show the evolution of the radius of the wheel disc with the number of profile cycles and the evolution of the radius of the rail disc with the number of profile cycles, respectively. The wheel disc has a better geometry for evaluation, which is visible at lower oscillations. Figure 17 shows the variation of the slip ratio versus the number of profile cycles, calculated from the change in the diameters of the wheel/rail discs and an initial static value of the angular velocity given by Equation (14).
At the end of the test, that is, after 36,000 wheel cycles, the radius of the wheel disc decreased by about 0.25 mm, while the rail-disc radius decreased by about 0.045 mm. These radii changes were subsequently verified using calipers.
In this experiment, after 36,000 wheel cycles the slip ratio decreased from the initial value of 2.5% to approximately 1.7%.
The oscillations in the measurements of profiles forced us to introduce data smoothing using an exponential moving average in Equation (16) and a simple moving average in Equation (17), respectively. The exponential moving average of the i-th sample is calculated as
E M A i ( k ) = x i · k + E M A i 1 · ( 1 k ) ,
where x i is the measured quantity value in the i-th sample and k is the smoothing factor. The simple moving average is considered as
S M A i ( n ) = 1 n i = 0 n 1 x n i ,
where n is the quantity of the unweighted mean of the previous data points (count of used cycles).
The oscillations in Figure 15 and Figure 16 are caused by several factors that superimpose each other. First, both discs are manufactured with a certain precision and therefore contain some geometric circular asymmetry of the surface of the discs. Furthermore, the surface of these discs has a certain roughness and the placement in the bearings is also not perfectly accurate and contains clearances. Furthermore, the mutual slippage of the wheels is not constant over time but pulsates. Also, it should be noted that even the actual control of the contact pressure by the hydraulic generator causes certain pulsations. Overall, these factors cause certain vibrations in individual parts and the entire measuring system, which are reflected in the oscillations of the recorded quantities. For these reasons, it was necessary to use the smoothing of the recorded waveforms with the exponential moving average defined in Equation (16) and the simple moving average in Equation (17).
Figure 18 and Figure 19 show how the shape of the contact surface on both discs developed depending on the number of profile cycles, for the times corresponding to cycle values of 1000, 10,000, 50,000, and 90,000. The given profiles are averaged from five consecutive values.
Figure 20 shows the development of the profiles of both discs during the entire test. At the beginning of the test, as can be seen from Figure 15 and Figure 16, certain anomalies appear in the record when the diameter of the wheel disc increases slightly while the diameter of the rail disc, on the contrary, decreases slightly. This phenomenon at the beginning of the measurement does not capture real changes in wheel diameters, but rather a process in which the entire measuring stand settles mechanically (the fixation of the profilometers is visible in Figure 10). The duration of this transient phenomenon is approximately 5 min.
Figure 21 and Figure 22 show the evolution of the contact path width between the wheel and the rail and the change in contact pressure with the number of profile cycles, respectively. Actual contact pressure was calculated using Formula (14), where the changes in the contact path width and in the diameter of both discs were considered. During approximately the first 3000 cycles, the contact width curve also oscillates due to the discs adapting to each other and also due to significant changes of rail and wheel profiles. Such changes also affect the contact pressure (see Figure 22).

4. Discussion

The paper presents two methodologies that can be used in rolling contact fatigue research. The first approach presented is the methodology of designing the specimen geometry with the aim of ensuring optimal conditions during the RCF test, which involves different specimen diameters and high contact pressure levels. The FE simulation strategy detailed in the article includes the use of the mixed hardening material model proposed by Chaboche with five back-stress parts. The calibration of the model has been carried out on Class C steel test results under different stress amplitudes. The numerical results were successfully confirmed through tests performed on the TUORS test machine. The reduction in the traction coefficient measured during the test with optimized rail disc geometry (the angle of chamfering 70 degrees) is negligible compared to the result of the test performed on the rail disc without chamfering.
Another approach presented is a modern experimental method based on simultaneous real-time measurements of rail and wheel disc profiles using laser profile sensors. The actual evaluation of the wear, i.e., the change in the diameter of both discs, is performed as a post-process method in the Python and NI Labview development environment. From the above results and the measurement method described, the wear of both the rail disc and the wheel disc is clearly visible in terms of diameter change. The exact values of the individual parameters can be easily obtained from the given time-course graphs. The experimental results point to relatively rapid changes in the shape of the contact surface path in the range of 1000 to 10,000 cycles. The control of the loading force or the slip would undoubtedly make it possible to clarify the influence of the regulation of these parameters on the overall development of the test in the initial phase. The proposed approach has proven to be an eligible method for a relatively simple measurement of the diameter of the specimen or the contact path width in the case of the RCF test. Using the information about the measured diameter and contour, together with the already known value of revolutions per minute, it is possible to calculate the slip ratio in real time, as well as the Hertzian contact pressure. The proposed approach can also find its application in case of a system which would control the loading force to maintain a constant contact pressure value.
Despite the relevant complexity of the experimental setup, the undeniable benefits of obtaining a wider range of measured values must be highlighted. This makes it possible to compare individual materials under test conditions much more unified than has been the case so far. In conclusion, this work opens up a new perspective on and opportunities in the field of rolling contact fatigue and wear testing of traction wheels and rails, which can significantly contribute to increasing the reliability and safety of these systems.

5. Conclusions

The conclusions of the approaches presented can be summarized as follows:
  • The FE simulations using the Chaboche cyclic plasticity model proved to be an effective tool for the geometric optimization of the discs, especially in cases where the wheel disc and the rail disc have different diameters and also if higher levels of contact pressure are applied.
  • The wear-evaluation approach based on the use of laser profilers is a slightly more complex setup. However, the results obtained clearly indicate its full applicability in the given field.
  • The experimental setup will also be used in the field of loading-force regulation, which will ensure more stable simulated conditions, such as actual contact pressure or slip due to the monitoring of disc-dimensional parameters.

Author Contributions

Conceptualization, J.Š., M.M. and M.Š.; methodology, M.M. and R.H.; software, M.M. and J.Š.; validation, J.Š., M.M., M.Š. and P.M.; formal analysis, M.Š.; investigation, J.Š.; resources, J.Š. and M.M.; data curation, J.Š., R.H. and M.M.; writing—original draft preparation, J.Š., R.H. and M.M.; writing—review and editing, L.K., P.M., M.M. and M.Š.; visualization, J.Š.; supervision, R.H.; project administration, M.Š.; funding acquisition, R.H. All authors have read and agreed to the published version of the manuscript.

Funding

This research was funded by Ministry of Education, Youth and Sports of Czech Republic, grant number SP2023/027.

Data Availability Statement

Data are contained within the article.

Acknowledgments

The authors are thankful for the support of Bonatrans Group Inc. company.

Conflicts of Interest

Authors Libor Kovář and Petr Matušek were employed by the company Bonatrans Group Inc. The remaining authors declare that the research was conducted in the absence of any commercial or financial relationships that could be construed as a potential conflict of interest.

References

  1. Hannemann, R.; Köster, P.; Sander, M. Fatigue crack growth in wheelset axles under bending and torsional loading. Int. J. Fatigue 2019, 118, 262–270. [Google Scholar] [CrossRef]
  2. Ma, W.; Song, R.; Liu, W.; Luo, S. The influence of journal box position error on wheelset asymmetric flange wear of the 2C0-type locomotive. Wear 2014, 314, 314–320. [Google Scholar] [CrossRef]
  3. Bracciali, A.; Megna, G. Contact mechanics issues of a vehicle equipped with partially independently rotating wheelsets. Wear 2016, 366–367, 233–240. [Google Scholar] [CrossRef]
  4. Wang, W.J.; Lewis, S.R.; Lewis, R.; Beagles, A.; He, C.G.; Liu, Q.Y. The role of slip ratio in rolling contact fatigue of rail materials under wet conditions. Wear 2016, 376–377, 1892–1900. [Google Scholar] [CrossRef]
  5. Fletcher, D.I.; Beynon, J.H. Development of a machine for closely controlled rolling contact fatigue and wear testing. J. Test. Eval. 2000, 28, 267–275. [Google Scholar]
  6. Halama, R.; Šofer, M.; Rojíček, J.; Fojtík, F.; Kolařík, K. A method for predicting ratcheting and wear in rolling contact fatigue, taking technological residual stresses into consideration. Teh. Vjesn. 2017, 24, 7–14. [Google Scholar]
  7. Santa, J.F.; Cuervo, P.; Christoforou, P.; Harmon, M.; Beagles, A.; Toro, A.; Lewis, R. Twin disc assessment of wear regime transitions and rolling contact fatigue in R400HT—E8 pairs. Wear 2019, 432–433, 102916. [Google Scholar] [CrossRef]
  8. Hannemann, R.; Köster, P.; Sander, M. Investigations on crack propagation in wheelset axles under rotating bending and mixed mode loading. Procedia Struct. Integr. 2017, 5, 861–868. [Google Scholar] [CrossRef]
  9. Lewis, S.R.; Lewis, R.; Cotter, J.; Lu, X.; Eadie, D.T. A new method for the assessment of traction enhancers and the generation of organic layers in a twin-disc machine. Wear 2016, 366–367, 258–267. [Google Scholar] [CrossRef]
  10. HyunWook, L. Generation of airborne wear particles from the wheel–rail contact under wet conditions using a twin-disk rig. Wear 2020, 448–449, 203236. [Google Scholar]
  11. Suhr, B.; Skipper, W.A.; Lewis, R.; Six, K. Sanded Wheel–Rail Contacts: Experiments on Sand Crushing Behaviour. Lubricants 2023, 11, 38. [Google Scholar] [CrossRef]
  12. Shrestha, S.; Spiryagin, M.; Bernal, E.; Wu, Q.; Cole, C. Recent advances in wheel-rail RCF and wear testing. Friction 2023, 11, 2181–2203. [Google Scholar] [CrossRef]
  13. Ramalho, A.; Esteves, M.; Marta, P. Friction and wear behavior of rolling-sliding steel contacts. Wear 2013, 302, 1468–1480. [Google Scholar] [CrossRef]
  14. Andersson, P.; Hemming, B. Determination of wear volumes by chromatic confocal measurements during twin-disc tests with cast iron and steel. Wear 2015, 338–339, 95–104. [Google Scholar] [CrossRef]
  15. Nagato, K.; Shintani, K.; Hamaguchi, T.; Nakao, M. Real-time detection of microcracks with floating giant-magnetoresistance sensor in twin-disk sliding tests. CIRP Ann. 2017, 66, 539–542. [Google Scholar] [CrossRef]
  16. Zhu, J.; Withers, P.; Wu, J.; Liu, F.; Yi, Q.; Tian, G. Characterization of Rolling Contact Fatigue Cracks in Rails by Eddy Current Pulsed Thermography. IEEE Trans. Ind. Inform. 2020, 17, 2307–2315. [Google Scholar] [CrossRef]
  17. Lin, Q.; Jiang, S.; Tian, H.; Ding, H.; Wang, W.; Guo, J.; Liu, Q. Study on non-destructive testing of rail rolling contact fatigue crack based on magnetic barkhausen noise. Wear 2023, 528–529, 204965. [Google Scholar] [CrossRef]
  18. Schmidová, E.; Neslušan, M.; Ondruš, J.; Trojan, K.; Pitoňák, M.; Klejch, F.; Ramesha, S.K. Monitoring of Plastic Straining Degree of Components Made of Interstitial Free Steel after Uniaxial Tensile Test by the Use of Barkhausen Noise Technique. Steel Res. Int. 2021, 93, 2100597. [Google Scholar] [CrossRef]
  19. Provezza, L.; Bodini, I.; Petrogalli, C.; Lancini, M.; Solazzi, L.; Faccoli, M. Monitoring the Damage Evolution in Rolling Contact Fatigue Tests Using Machine Learning and Vibrations. Metals 2021, 11, 283. [Google Scholar] [CrossRef]
  20. Halama, R.; Fajkoš, R.; Matušek, P.; Bábková, P.; Fojtík, F.; Václavek, L. Contact defects initiation in railroad wheels—Experience, experiments and modelling. Wear 2011, 271, 174–185. [Google Scholar] [CrossRef]
  21. Kapoor, A. A Re-evaluation of the Life to Rupture of Ductile Metals by Cyclic Plastic Strain. Fatigue Fract. Eng. Mater. Struct. 1994, 17, 201–219. [Google Scholar] [CrossRef]
  22. McDowell, D.L. Stress state dependence of cyclic ratchetting behavior of two rail steels. Int. J. Plast. 1995, 11, 397–421. [Google Scholar] [CrossRef]
  23. Zhang, S.; Liu, Q.; Spiryagin, M.; Wu, Q.; Ding, H.; Wen, Z.; Wang, W. Gaps, challenges and possible solution for prediction of wheel–rail rolling contact fatigue crack initiation. Rail. Eng. Sci. 2023, 31, 207–232. [Google Scholar] [CrossRef]
  24. Hwang, J.-I.; Coors, T.; Pape, F.; Poll, G. Simulation of a Steel-Aluminum Composite Material Subjected to Rolling Contact Fatigue. Lubricants 2019, 7, 109. [Google Scholar] [CrossRef]
  25. Ringsberg, J.W. Life Prediction of Rolling Contact Fatigue Crack Initiation. Int. J. Fatigue 2001, 23, 575–586. [Google Scholar] [CrossRef]
  26. Halama, R.; Fusek, M.; Šofer, M.; Poruba, Z.; Matušek, P.; Fajkoš, R. Ratcheting Behavior of Class C Wheel Steel and Its Prediction by Modified AbdelKarim-Ohno Model. In Proceedings of the International Conference on Contact Mechanics of Wheel/Rail Systems, CM2015, Colorado Springs, CO, USA, 30 August–3 September 2015. [Google Scholar]
  27. Deng, T.S.; Zhao, X.; Wu, B.; Li, W.; Wen, Z.F.; Jin, X.S. Prediction of Crack Initiation of Rail Rolling Contact Fatigue. Appl. Mech. Mater. 2013, 344, 75–82. [Google Scholar] [CrossRef]
  28. Jiang, Y. A fatigue criterion for general multiaxial loading. Fatigue Fract. Eng. Mater. Struct. 2000, 23, 19–32. [Google Scholar] [CrossRef]
  29. Rodríguez-Arana, B.; San Emeterio, A.; Alvarado, U.; Martínez-Esnaola, J.M.; Nieto, J. Prediction of Rolling Contact Fatigue Behavior in Rails Using Crack Initiation and Growth Models along with Multibody Simulations. Appl. Sci. 2021, 11, 1026. [Google Scholar] [CrossRef]
  30. Halama, R.; Šmach, J.; Matušek, P.; Sakaino, T. Ratcheting prediction based development of rolling contact fatigue test for high pressures. In Proceedings of the 11th International Conference on Contact Mechanics and Wear of Rail/wheel Systems, CM 2018, Delft, The Netherlands, 24–27 September 2018; pp. 350–355. [Google Scholar]
  31. Klimenda, F.; Skocilas, J.; Skocilasova, B.; Soukup, J.; Cizek, R. Vertical Oscillation of Railway Vehicle Chassis with Asymmetry Effect Consideration. Sensors 2022, 22, 4033. [Google Scholar] [CrossRef]
  32. Jakubovičová, L.; Sága, M.; Vaško, M. Impact analysis of mutual rotation of roller bearing rings on the process of contact stresses in rolling elements. Manuf. Technol. 2013, 13, 50–54. [Google Scholar] [CrossRef]
  33. Pletz, M.; Meyer, K.A.; Künstner, D.; Scheriau, S.; Daves, W. Cyclic plastic deformation of rails in rolling/sliding contact –quasistatic FE calculations using different plasticity models. Wear 2019, 436–437, 202992. [Google Scholar] [CrossRef]
  34. Meyer, K.A.; Skrypnyk, R.; Pletz, M. Efficient 3d finite element modeling of cyclic elasto-plastic rolling contact. Tribol. Int. 2021, 161, 10705. [Google Scholar] [CrossRef]
  35. Gschwandl, T.J.; Weniger, T.M.; Antretter, T.; Künstner, D.; Scheriau, S.; Daves, W. Experimental and Numerical Visualisation of Subsurface Rail Deformation in a Full-Scale Wheel–Rail Test Rig. Metals 2023, 13, 1089. [Google Scholar] [CrossRef]
  36. Roshan, C.C.; Raghul, C.; Ram, H.V.; Suraj, K.; Solomon, J. Non-destructive testing by liquid penetrant testing and ultrasonic testing—A review. Int. J. Adv. Res. Ideas Innov. Technol. 2019, 5, 694–697. [Google Scholar]
  37. Šmach, J.; Halama, R.; Marek, M. Advanced testing in rolling contact fatigue for wheel material investigation. In Proceedings of the Applied Mechanics 2018, University of West Bohemia, Pilsen, Czech Republic, 9–11 April 2018; pp. 139–141. [Google Scholar]
  38. Šmach, J.; Marek, M.; Šofer, M.; Fusek, M. Measurement of Twin-Disc Wear Resistance Test by Laser Profilometer. In Proceedings of the Experimental Stress Analysis 2020: 58th International Scientific Conference, Ostrava, Czech Republic, 19–22 October 2020; pp. 505–509. [Google Scholar]
  39. AAR M-107/M-208; Standard: AAR Manual of Standards and Recommended Practices Wheels and Axles Wheels, Carbon Steel Specification M-107/M-208. AAR: Pueblo, CO, USA, 2011.
  40. Coelho, L.; Batista, A.C.; Nobre, J.P.; Marques, M.J. Rolling and Rolling-Sliding Contact Fatigue Failure Mechanisms in 32 CrMoV 13 Nitrided Steel—An Experimental Study. Appl. Sci. 2021, 11, 10499. [Google Scholar] [CrossRef]
  41. Liu, J.P.; Li, Y.Q.; Zhou, Q.Y.; Zhang, Y.H.; Hu, Y.; Shi, L.B.; Wang, W.J.; Liu, F.S.; Zhou, S.B.; Tian, C.H. New insight into the dry rolling-sliding wear mechanism of carbide-free bainitic and pearlitic steel. Wear 2019, 432–433, 202943. [Google Scholar] [CrossRef]
  42. Diener, M.; Ghidini, A. Fracture Toughness: A Quality Index for Railway Solid Wheels. Mater. Perform. Charact. ASTM 2014, 3, 286–304. [Google Scholar] [CrossRef]
  43. Halama, R.; Markopoulos, A.; Šmach, J.; Govindaraj, B. Theory, Application and Implementation of Modified Abdel-Karim-Ohno model for Uniaxial and Multiaxial Fatigue Loading. In Fatigue Damage in Metals—Numerical Based Approaches and Applications; Elsevier: Amsterdam, The Netherlands, 2022; (in press). [Google Scholar]
  44. Johnson, K.L. Contact Mechanics; Cambridge University Press: Cambridge, UK, 1985. [Google Scholar]
Figure 1. Schematics of the specimens: (a) Wheel disc with two contact profiles; (b) rail disc with a depicted angle for optimization.
Lubricants 11 00504 g001
Figure 2. Resulting stress-strain hysteresis loops from McDowell test carried out on Class C: (a) axial components; (b) shear components.
Lubricants 11 00504 g002
Figure 3. Prediction of shear strain accumulation from the simulations of McDowell tests (Class C) by Chaboche model [30] and by modified AbdelKarim/Ohno model [26].
Lubricants 11 00504 g003
Figure 4. Contact pressure distribution according to the Hertz line contact theory.
Lubricants 11 00504 g004
Figure 5. Example of finite element mesh for β = 45°.
Lubricants 11 00504 g005
Figure 6. Results of FE analyses for particular values of β angle as lateral plastic strain over time.
Lubricants 11 00504 g006
Figure 7. Results of FE analysis for β = 45° in the form of plastic strain increment evolution.
Lubricants 11 00504 g007
Figure 8. Plastic strain increment for the 10th cycle as a function of the angle of chamfering.
Lubricants 11 00504 g008
Figure 9. Traction coefficient as a function of the number of wheel disc cycles for two geometries of the rail disc.
Lubricants 11 00504 g009
Figure 10. INOVA twin-disc experimental rig with Keyence LV-7200 laser profiler [19].
Lubricants 11 00504 g010
Figure 11. Basic block diagram of the measuring system.
Lubricants 11 00504 g011
Figure 12. Basic concept and arrangement of samples in the test system.
Lubricants 11 00504 g012
Figure 13. Layout arrangement of the test system with individual functional blocks.
Lubricants 11 00504 g013
Figure 14. Measured contour line using Keyence LV-7200 laser profiler after 5000 wheel cycles.
Lubricants 11 00504 g014
Figure 15. Change in the radius of the wheel disc per the number of profile cycles.
Lubricants 11 00504 g015
Figure 16. Change in the radius of the rail disc per the number of profile cycles.
Lubricants 11 00504 g016
Figure 17. Slip development per the number of profile cycles.
Lubricants 11 00504 g017
Figure 18. Profile of the wheel per the selected number of profile cycles.
Lubricants 11 00504 g018
Figure 19. Profile of the rail per the selected number of profile cycles.
Lubricants 11 00504 g019
Figure 20. Development of the contact profiles throughout the test recording time.
Lubricants 11 00504 g020
Figure 21. Change in the contact path width per the number of profile cycles.
Lubricants 11 00504 g021
Figure 22. Change in the contact pressure per the number of profile cycles.
Lubricants 11 00504 g022
Table 1. Tensile properties of Class C steel.
Young Modulus
[GPa]
Yield Strength
[MPa]
Ultimate Strength
[MPa]
Ductility
[%]
205802127013
Table 2. Material parameters of the cyclic plasticity model.
ParameterValue
σ Y [MPa]550
  R [MPa]−100
b 10
C 1 5 [MPa]190,230, 86,250, 22,463, 7478, 13,810
γ 1 5 2222, 690, 215, 103, 2.1
Table 3. Experimental results from the RCF tests.
Geometry Original   β = 90° Optimized   β = 70°
Surface roughness at the end of test Ra (µm):
Wheel0.630.67
Rail0.330.67
Total disc weight loss (g):
Wheel0.843.28
Rail0.353.11
Disc diameter loss (mm):
Wheel0.8551.117
Rail0.741.34
Change of track width (mm):
Wheel3.933.36
Rail2.63.2
Number of cycles (wheel)100,000215,000
Max. coefficient of traction0.3050.299
Disclaimer/Publisher’s Note: The statements, opinions and data contained in all publications are solely those of the individual author(s) and contributor(s) and not of MDPI and/or the editor(s). MDPI and/or the editor(s) disclaim responsibility for any injury to people or property resulting from any ideas, methods, instructions or products referred to in the content.

