Olive Pomace Oil as a Chainsaw Lubricant: First Results of Tests on Performance and Safety Aspects


 ,
,  , ,
, ,  and
and
Abstract
:1. Introduction
- Promoting the use of vegetable oils with additives in concentration as low as possible as lubricants along the food chain to replace mineral oil-based lubricants.
- Contributing to the reduction of mineral oil contamination of food and the environment.
- Finding alternative uses for ROPO, a solvent extracted from dried olive residues (pomace) that is an involuntary by-product of the olive oil production chain.
2. Materials and Methods
2.1. Chain Lubricants at Comparison
2.1.1. ROPO-Based Biolubricant
Analytical Methods for ROPO Evaluation
Oil Additivation with Viscosifier/Humectant and Antioxidant
- Highly viscous, fluid.
- All components are biodegradable (90% by OECD 301B Guideline).
- Approved by the Food and Drug Administration (Sections 177.1030 and 184.1555).
- Quickly and easily dissolves in natural vegetable oils, including rapeseed oil. It is also soluble in TMP oleate and other synthetic esters.
- Enhances biodegradable vegetable properties.
Chainsaw Oil Preparation
- Preparation of a mother solution. To prepare 10 L of the oil-additives blend, 1 L of ROPO was heated at 80 °C in a 2-L beaker, under stirring. Due to its very high viscosity, the BIOTAC additive also had to be preheated at 80 °C in the oven before use. When both constituents reached the set temperature, a certain amount of BIOTAC additive was added to the oil, continuing the stirring and heating until all additive was dissolved, and the mother solution was ready. During the described preparation, 3.0 g kg−1 of tert-butylhydroquinone antioxidant (TBHQ—Aldrich cod. 112941, Merck Life Science srl, Milan, Italy) was added to the oil using the same procedure.
- Dilution of the mother solution in the final 10-L blend. To obtain the desired additive concentration in the final fluid, the obtained mother solution was diluted ten times to obtain the final fluid for tests.
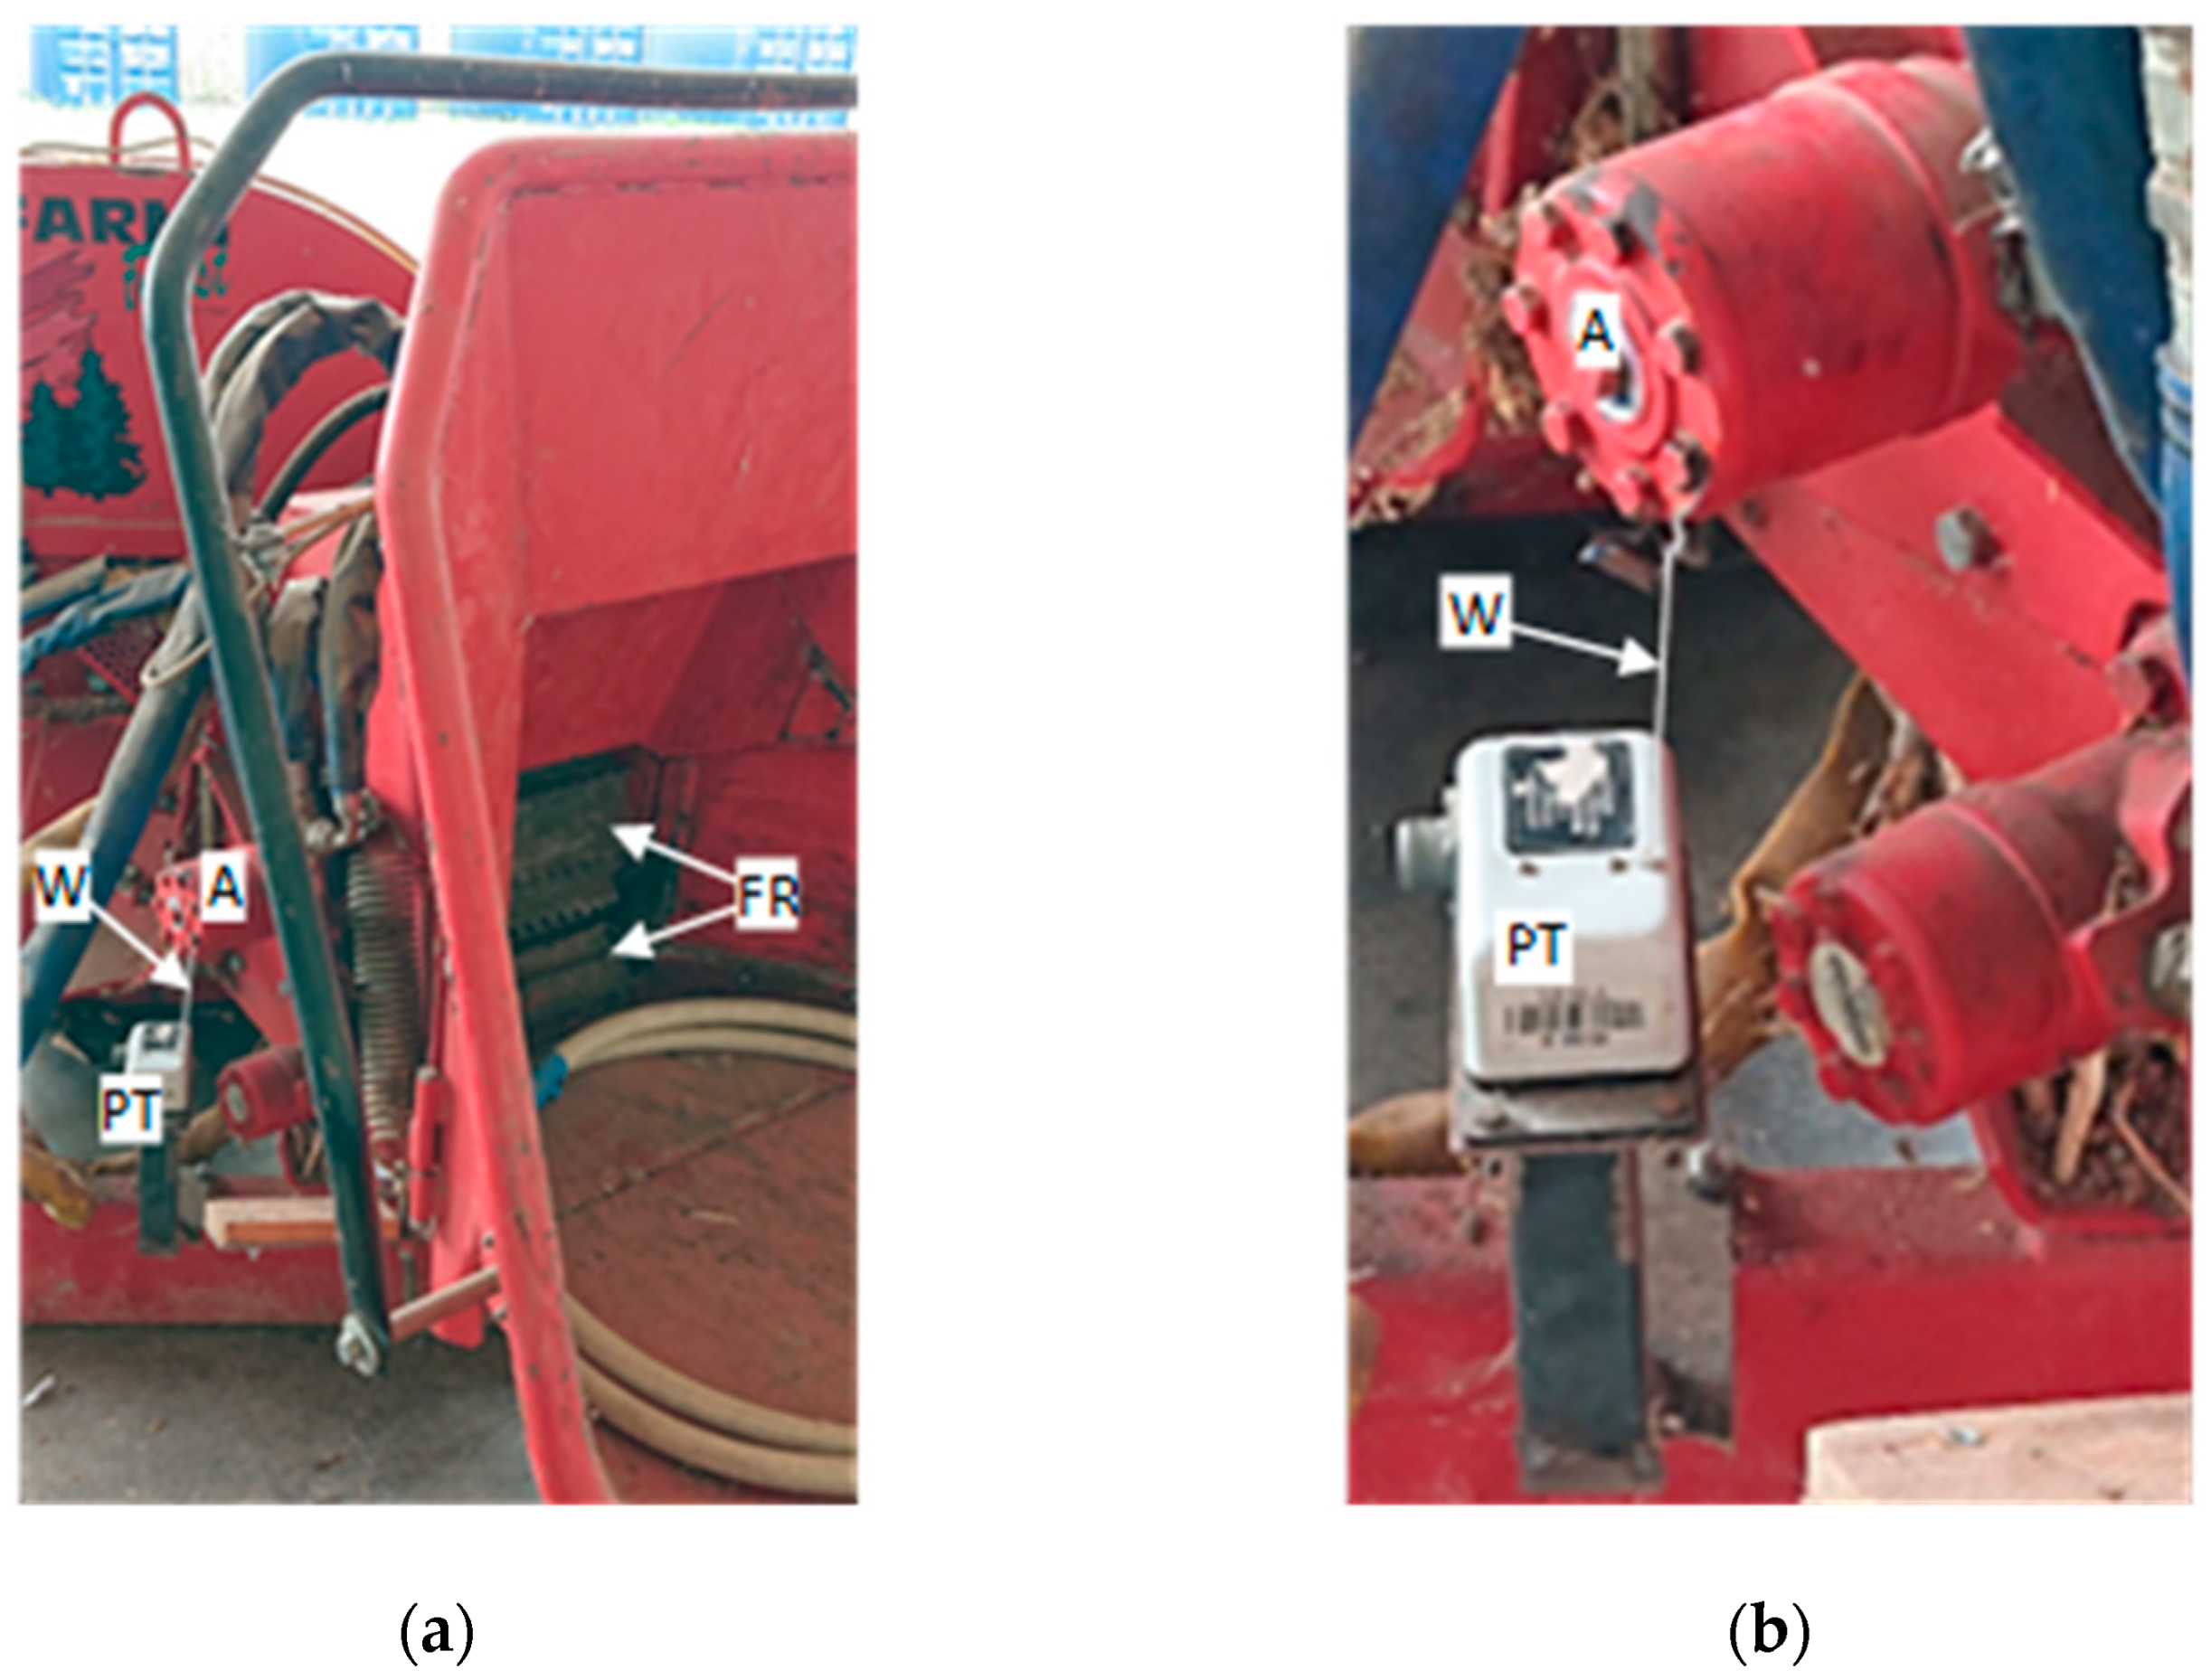
2.1.2. Conventional Lubricant
2.2. Tests
- Evaluations expressed by the operators.
- Observation of the temperature of the chain and of the guide bar during cutting, under the hypothesis that any different lubricating capacity of the tested fluids could lead to different friction values in the interface between the bar and chain and consequent to different heating levels.
- Assessment of the wear of the chain through mass measurements before and after cutting activity.
- Quantitative and qualitative analysis of the air-borne particulate sampled during cutting with the chain lubricants used.
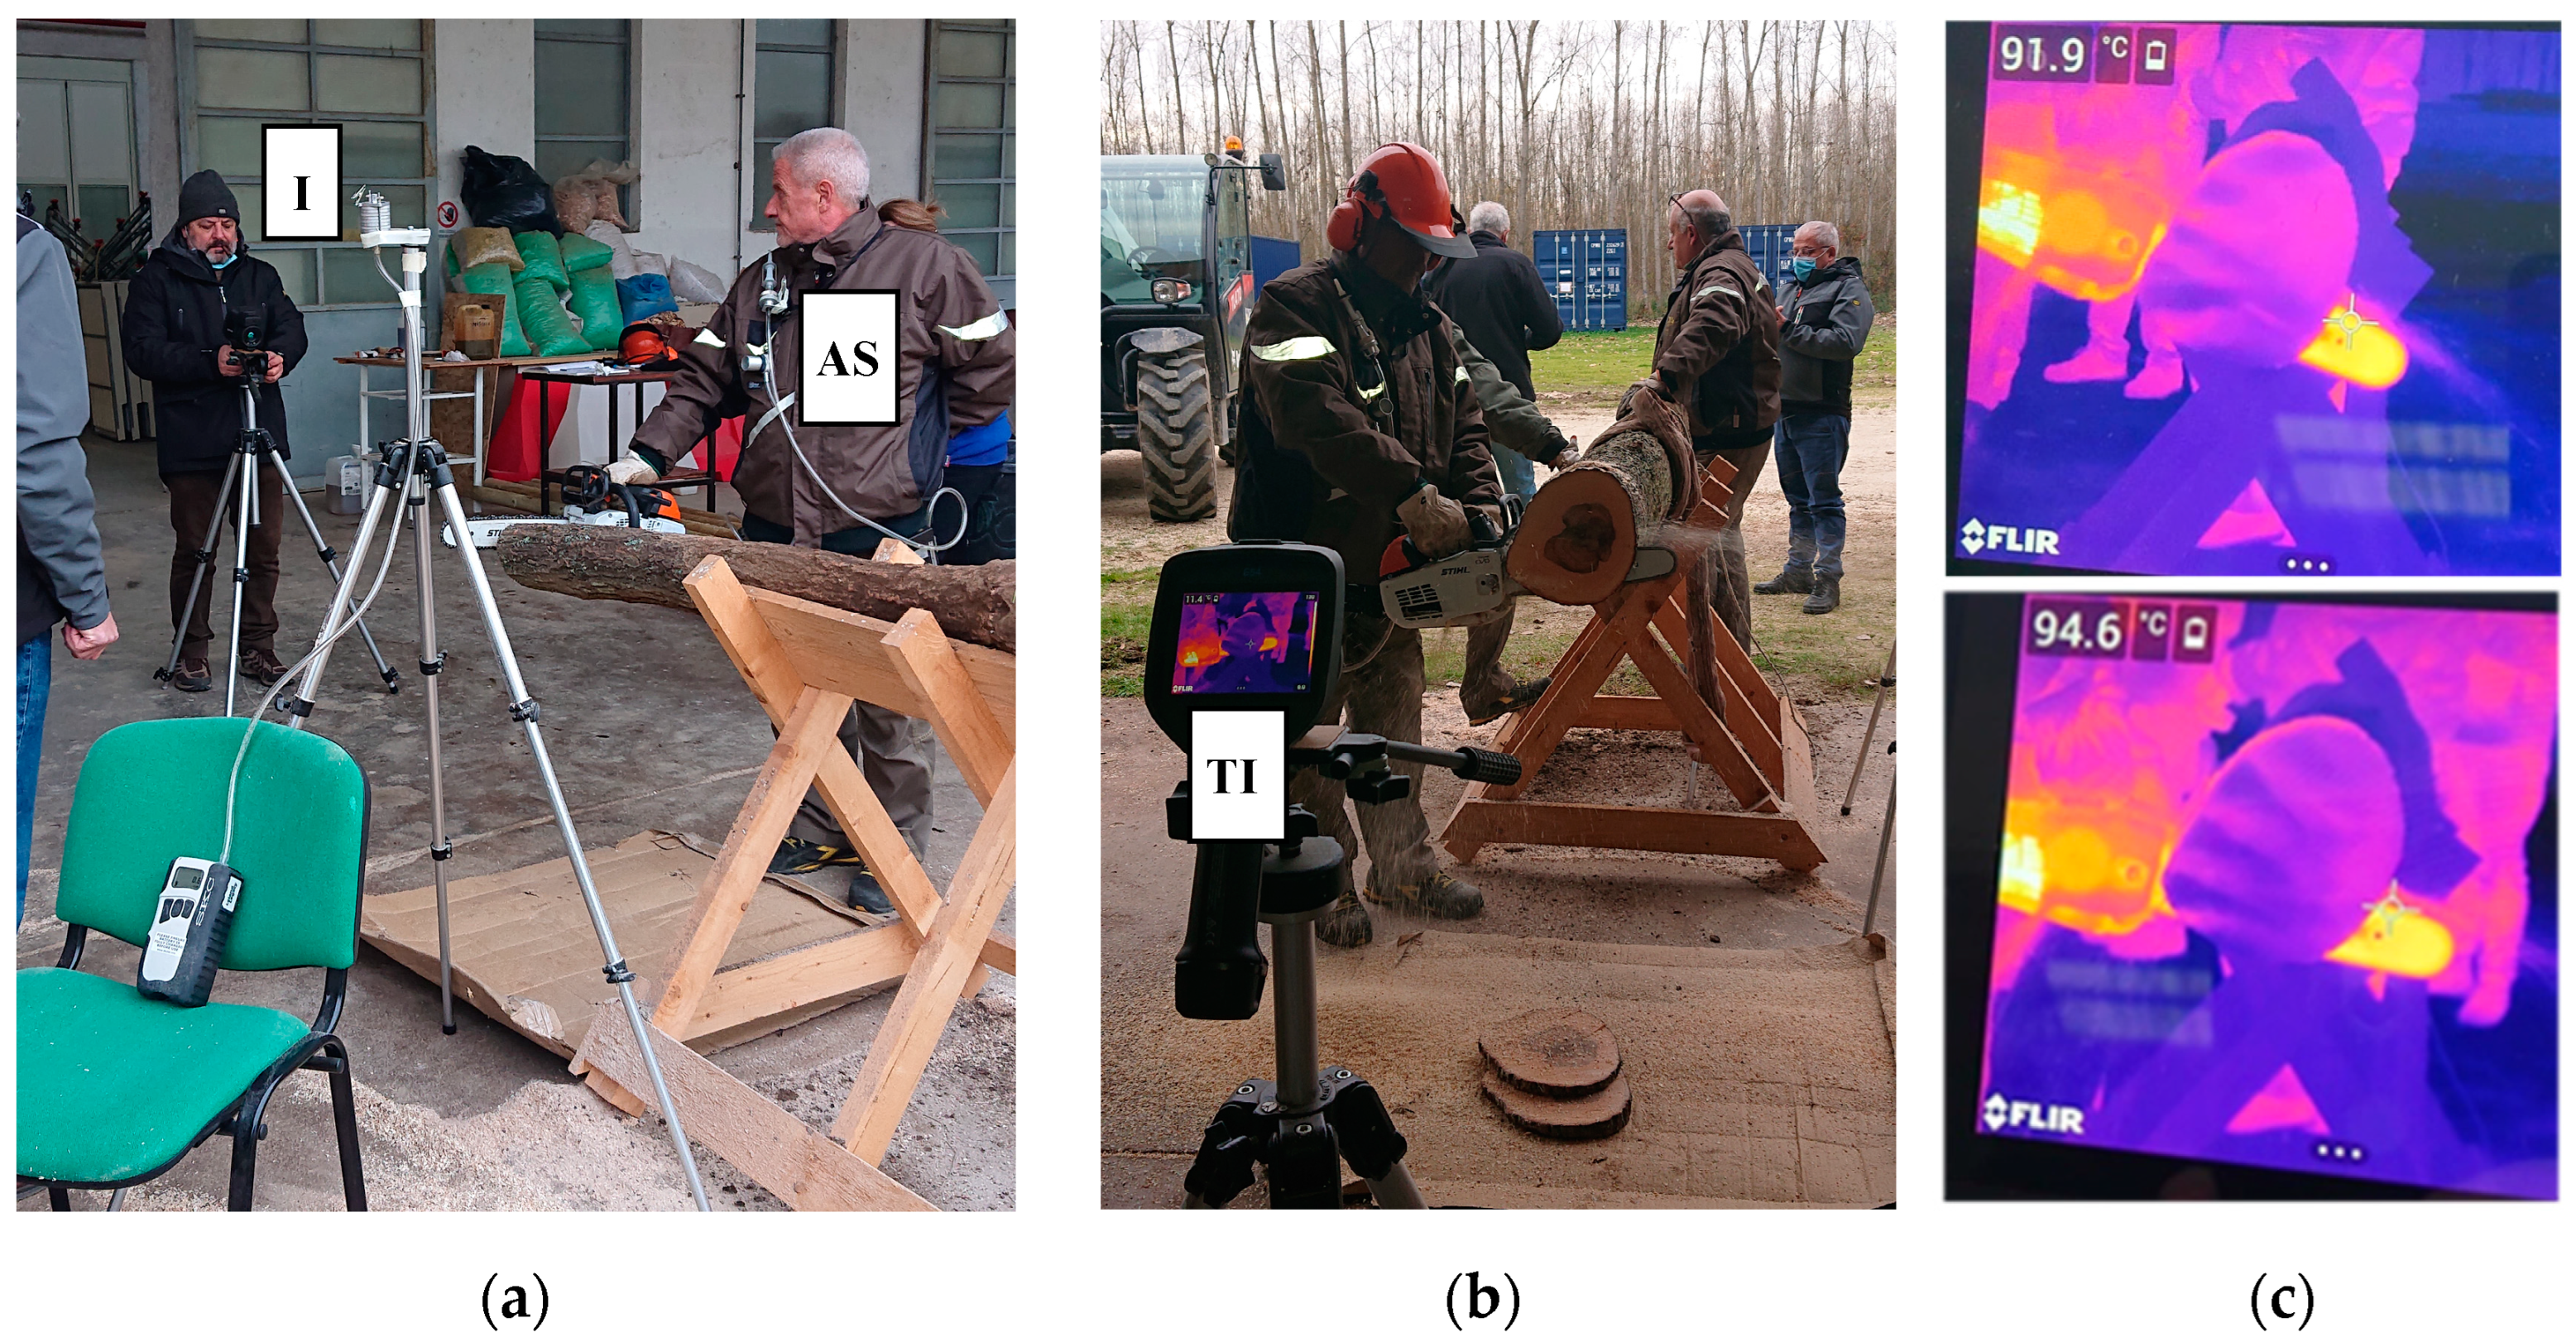
2.2.1. Preliminary Test (T0)
2.2.2. Felling in Turkey Oak Forest (T1)
2.2.3. Trunks Cutting at Fixed Point (T2)
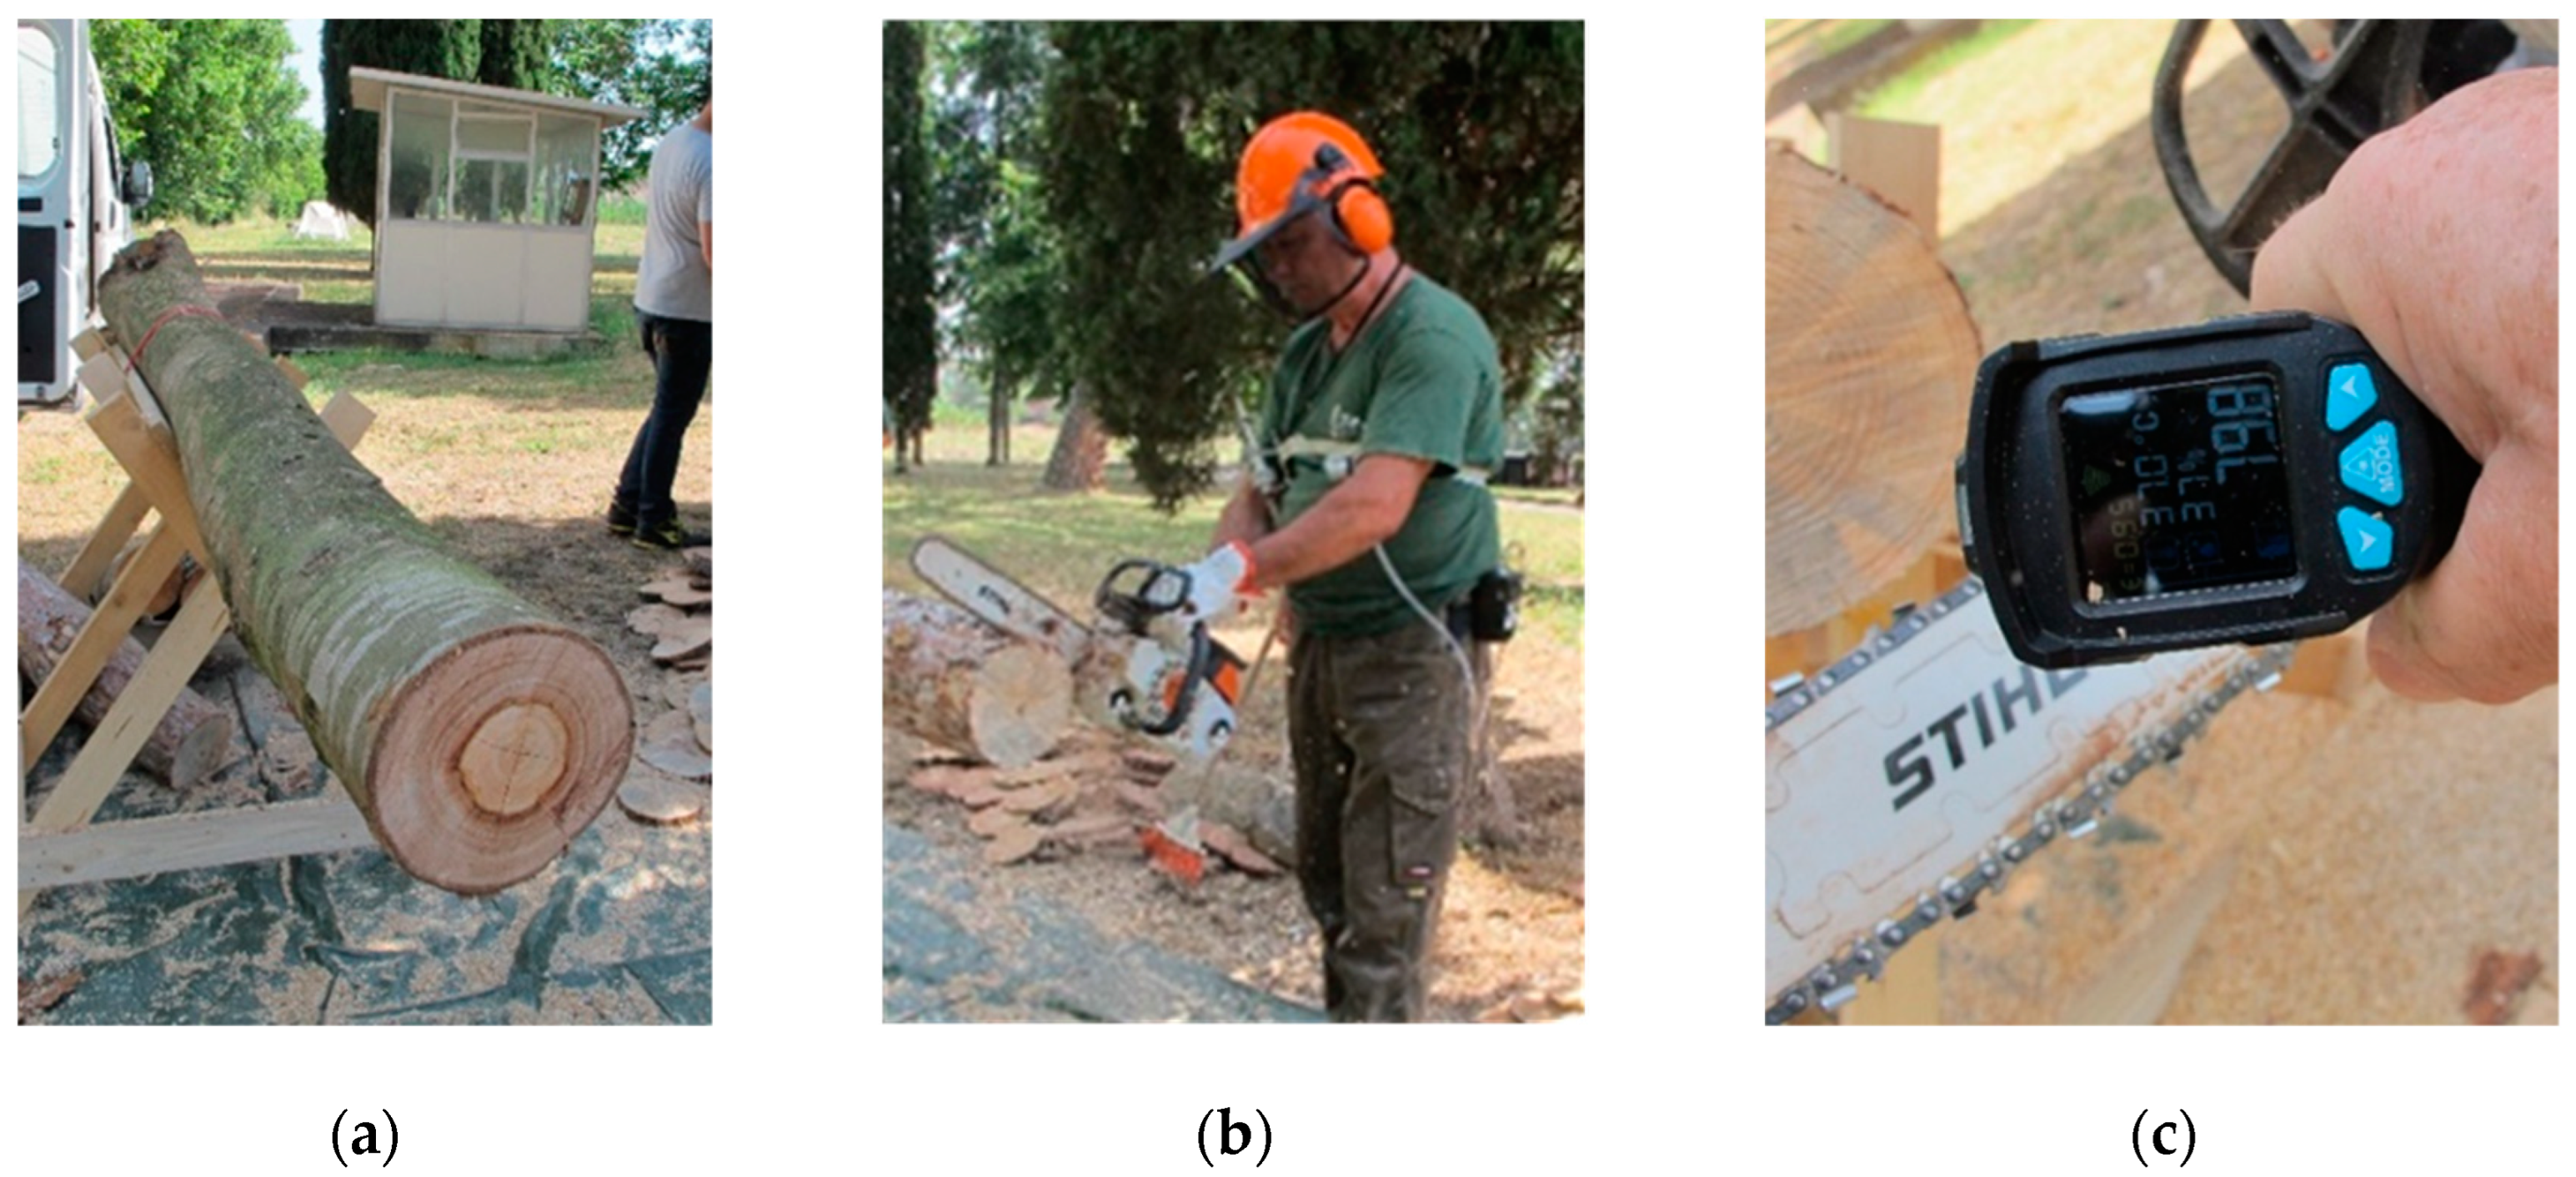
2.2.4. Cutting of Turkey Oak Trunks at Fixed Point (T3)
2.2.5. Felling of a Poplar Grove (T4) at CREA
2.2.6. Chemical Analyses
3. Results and Discussion
3.1. Results of Laboratory Activity
3.2. Tests of ROPO-Based Fluids in Chainsaws
3.2.1. Preliminary Test (T0)
3.2.2. Felling in Turkey Oak Forest (T1)
- Boron (B), aluminum (Al), and copper (Cu): high concentrations of the three elements appear in all three filters. It can be noticed that they are unexpectedly high also in the blank filter, thus suggesting that an accumulation of these elements in the forest could have occurred during the felling activity carried out in the days preceding the test. Consequently, the quantities detected in T1 are probably strongly affected by the previous deposits, making it difficult to discern their origins. For instance, the level of Al detected in Rep. 4 is very high compared to that of Rep. 3, where, however, it is not neglectable. It would be interesting to quantify the rate of Al coming from the previous deposits. Similar considerations can be made for B and Cu.
- Sodium (Na), chromium (Cr), manganese (Mn), iron (Fe), nickel (Ni), and barium (Ba): These elements are present in Rep. 3, sometimes in high concentrations (Na, Cr, Fe, and Ba), while in Rep. 4 and in Blank, they have low concentrations or are undetected.
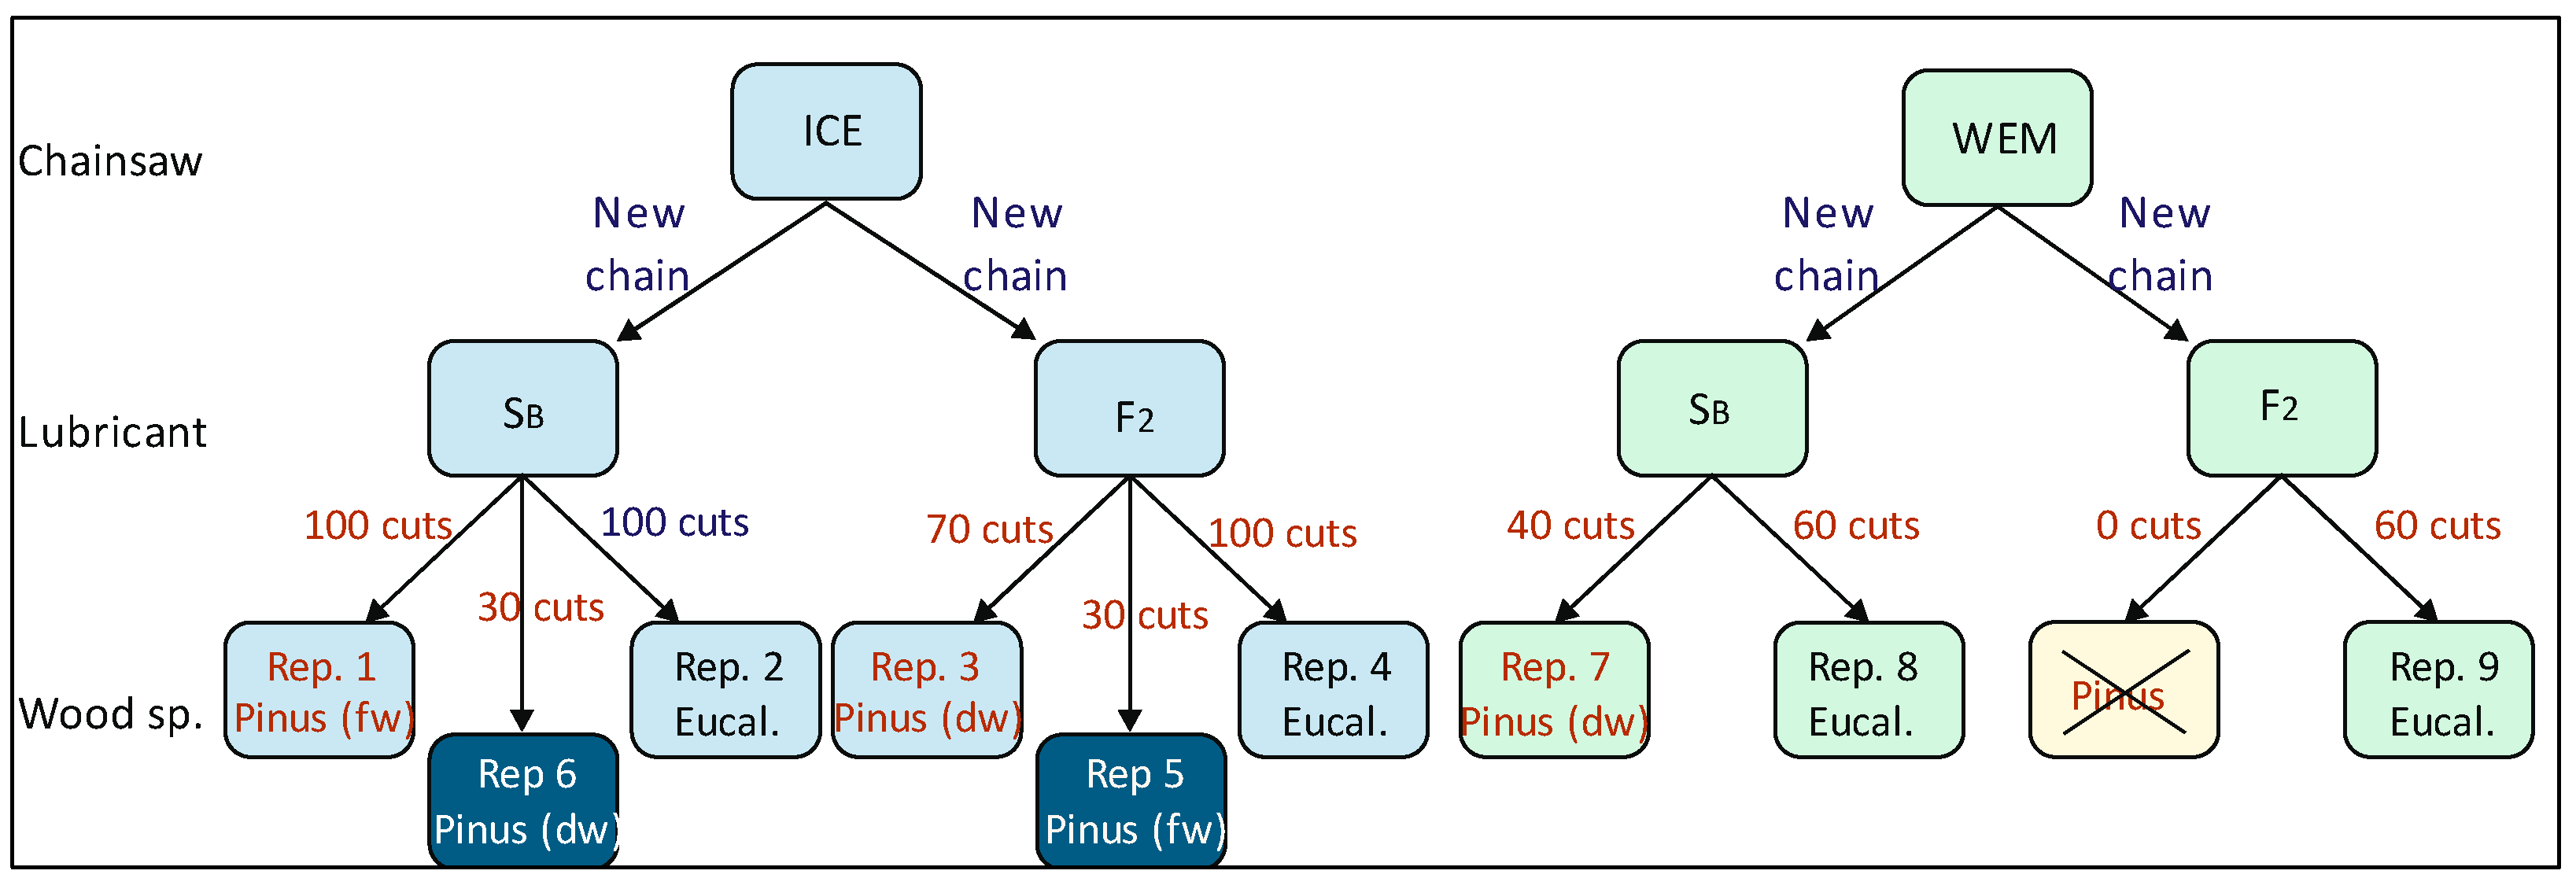
3.2.3. Trunks Cutting at Fixed Point (T2)
Cutting
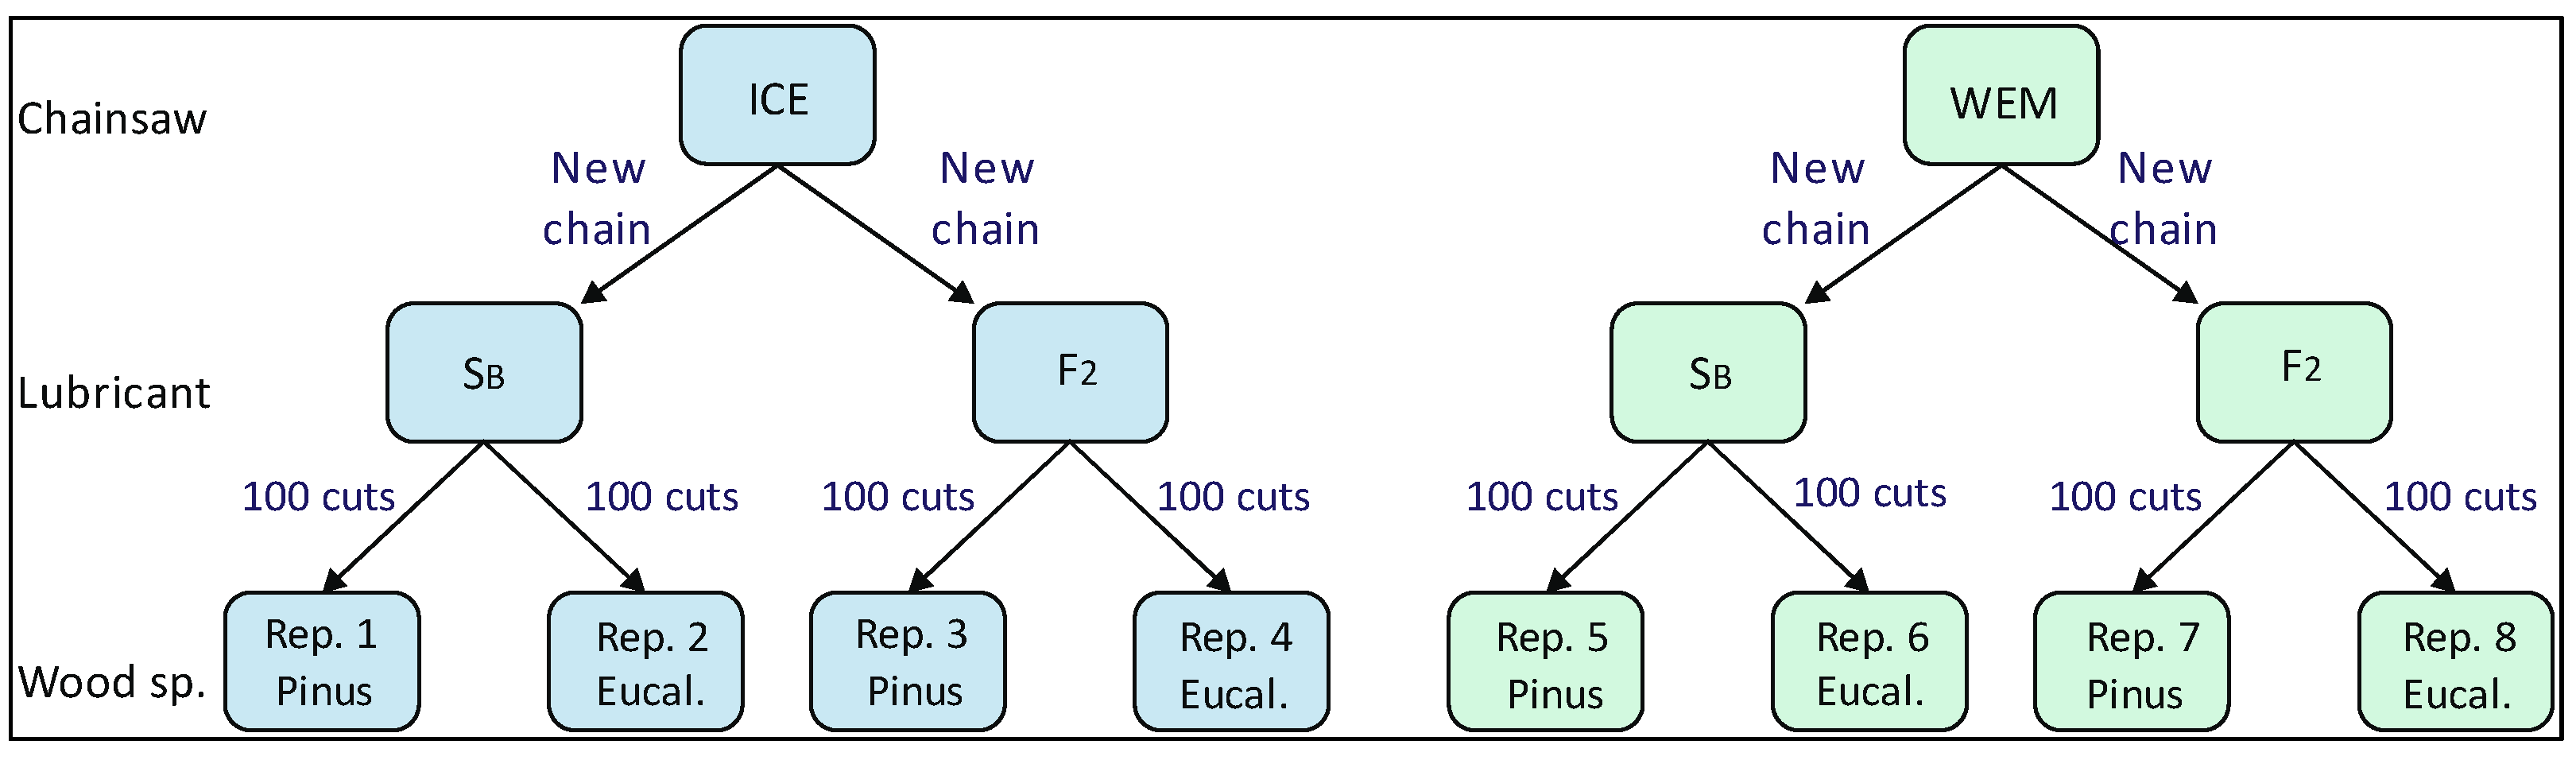
- -
- The planned 100 cuts were executed only in Reps. 1, 2, and 4 with fresh wood, whose high humidity contributed to the cooling of the chain. In all three repetitions, after 50–60 cuts, the temperature stabilized at relatively low values which, however, seem lower with Pinus (fw) (average: 45.7 °C) than with Eucalyptus (53.1 and 54.4 °C in Rep. 2 and Rep. 4, respectively).
- -
- In Rep. 3, with lubricant F2, the cutting of dry wood Pinus trunks caused the raising of the chain temperature up to 113 °C, which indicated that we needed to stop the test after 70 cuts. The data for the first 30 cuts of Rep. 3 seem significantly higher than those of Rep. 6 and indicate the possibility of a minor efficiency of F2 as lubricant under these conditions.
- -
- Considering Rep. 2 and Rep. 4, respectively (100 and 80 cuts on Eucalyptus), the chain temperature values resulted in being higher in Rep. 4 in the presence of the F2 lubricant. This could be partly due to the higher starting temperature in Rep. 4 (56.6 °C) than in Rep. 2 (49.1 °C), caused by the chain overheating that occurred in Rep. 3. Slightly higher temperatures of the chain occurred, again with F2, in Rep. 5, compared to the values of the first 30 cuts of Rep. 1 with SB, in the cut of Pinus fresh wood.
- -
- Reps. 7 to 9 concerned the electric chainsaw. Its electric motor overheated and stopped working after 40 cuts in Rep. 7 (with Pinus dry wood and chain temperatures which raised up to 77 °C) and after 60 cuts in Reps. 8 and 9 (both with Eucalyptus and chain temperatures relatively low), indicating that this type of machine is not suitable for continuous cutting tasks. As regards the behavior of the two lubricants, the comparison between Rep. 8 and Rep. 9, both on Eucalyptus, shows that lower chain temperatures occurred with F2.
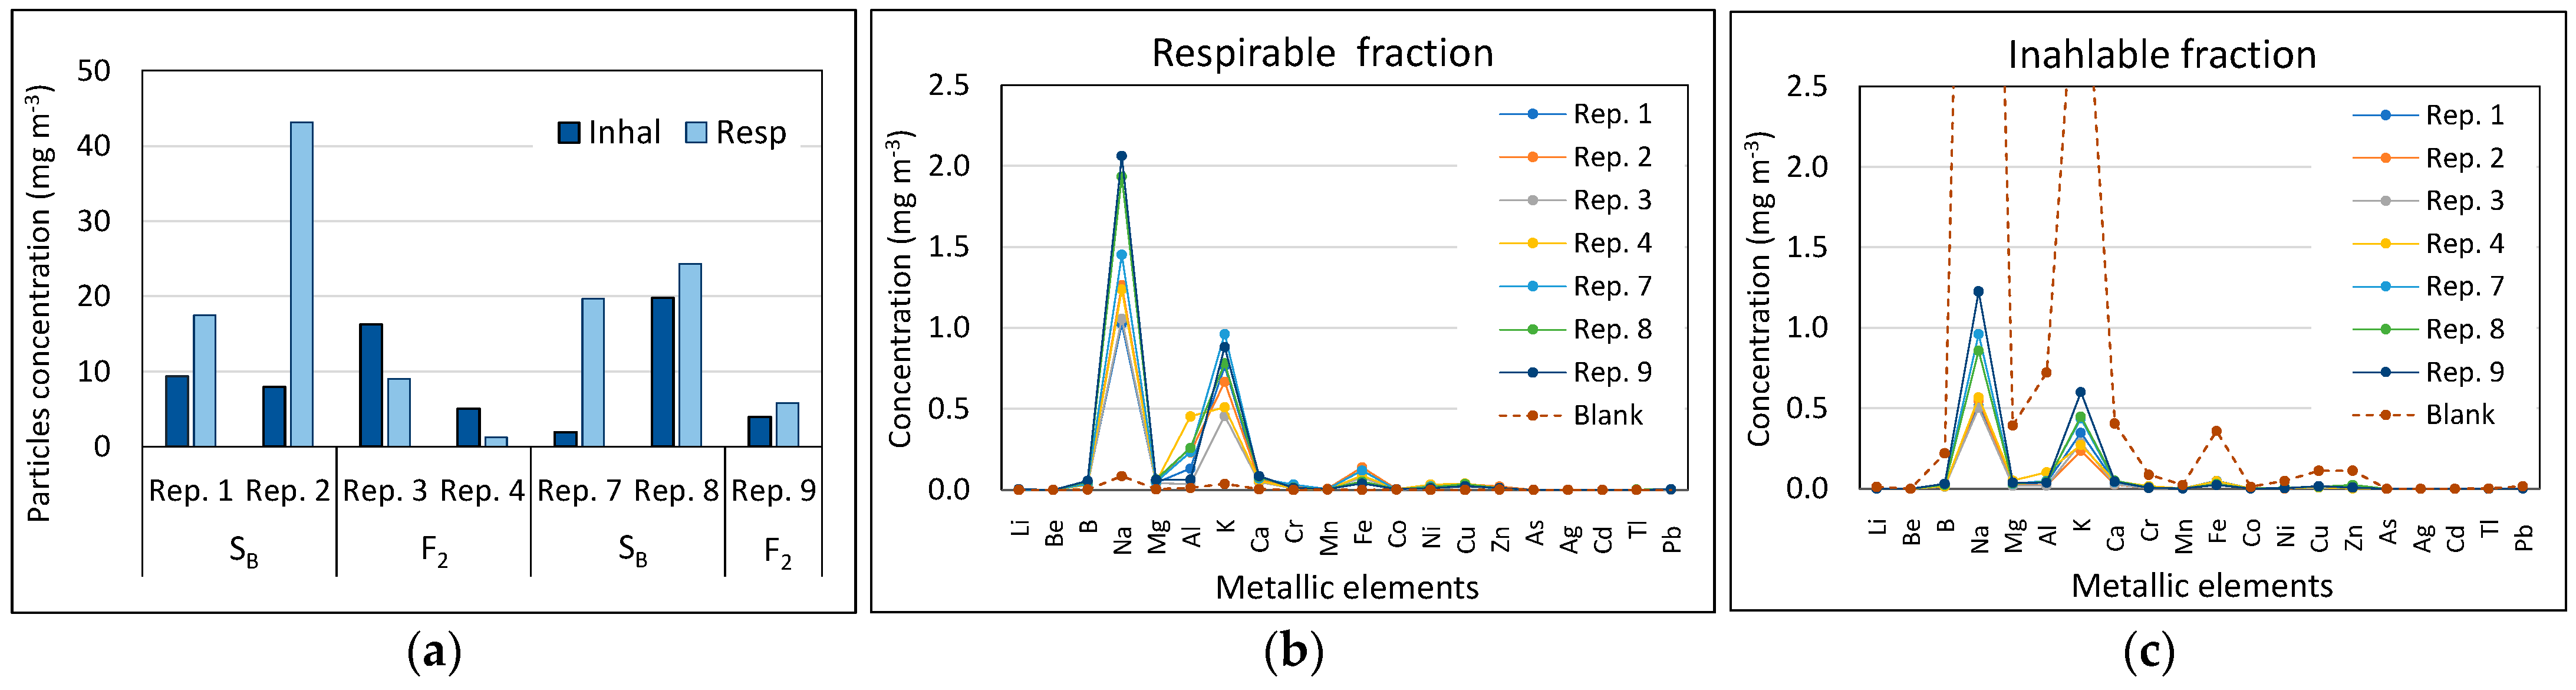
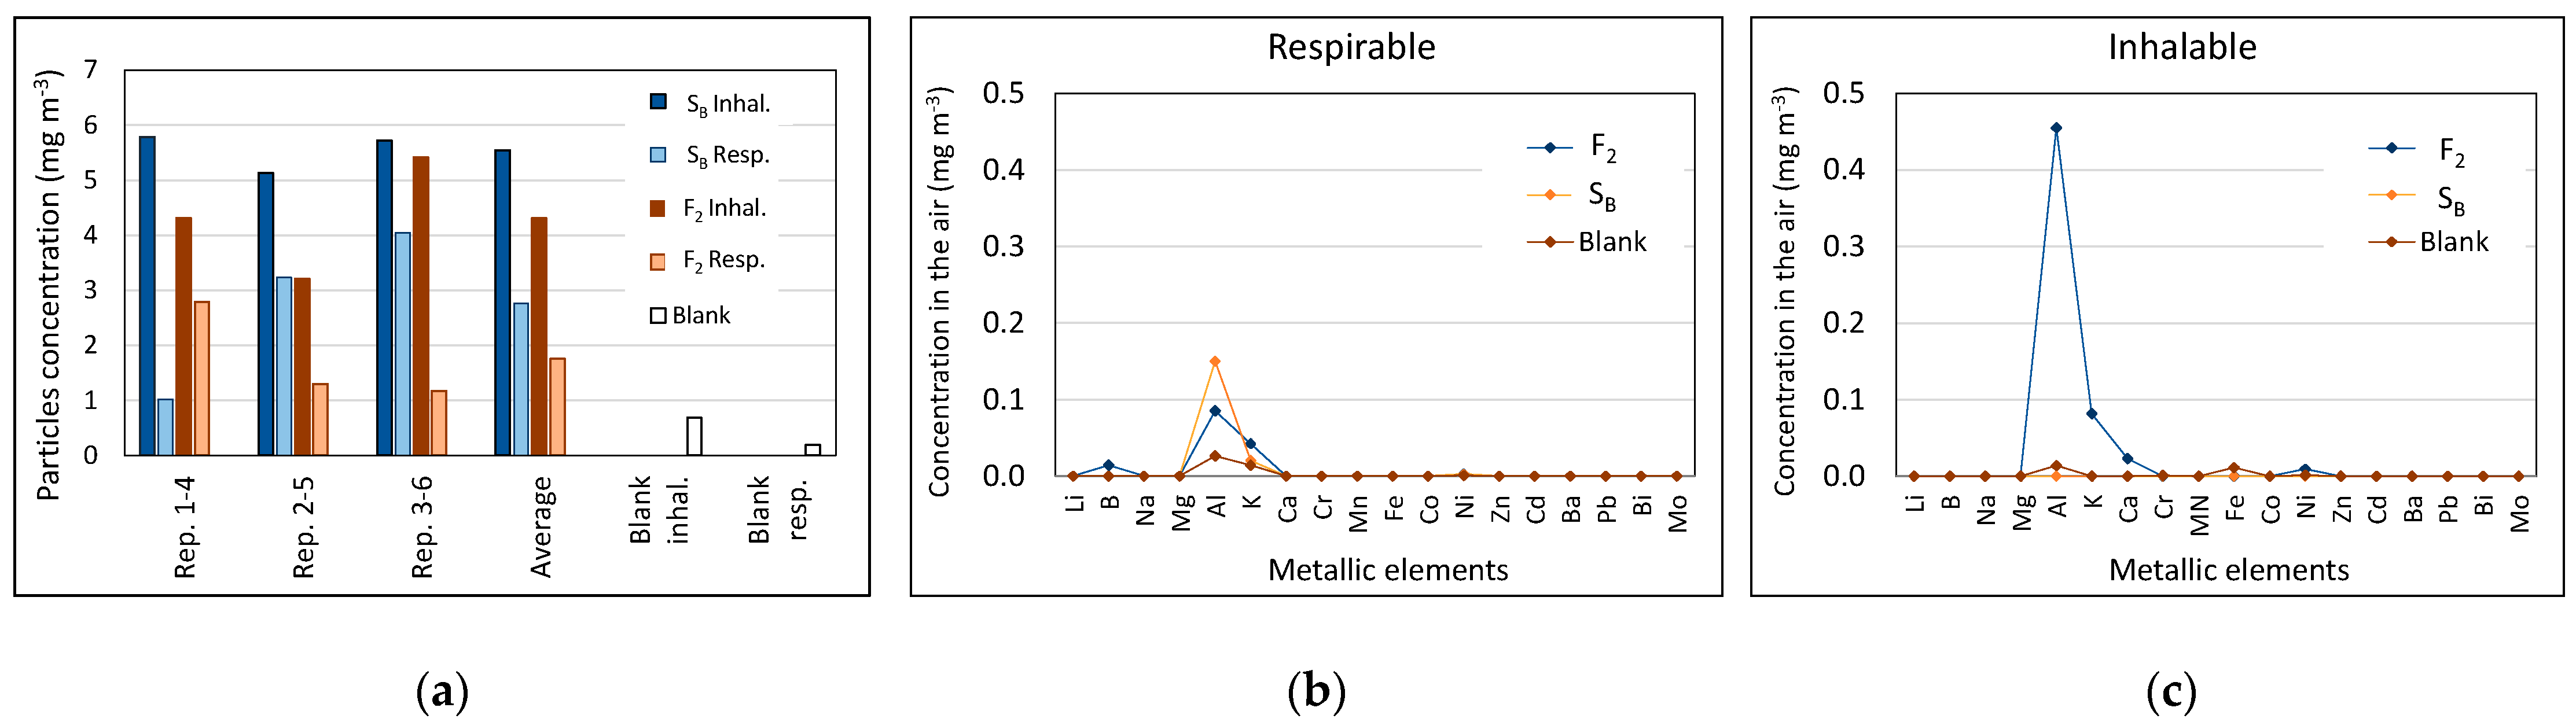
Air Sampling
3.2.4. Cutting of Turkey Oak Trunks at Fixed Point (T3)
Test of Cutting
Air Samplings
3.2.5. Felling of a Poplar Grove at CREA
4. Conclusions
4.1. Lubricants and Chainsaws Performance
- -
- Measurement of the temperature of the fluids within the reservoir during the cutting.
- -
- Measurement of the temperature of the saw chain/guide bar system and of the wood by means of the thermal imaging camera during the cutting with both fluids.
- -
- Saw chain lubricant consumption during cutting with both fluids and evaluation of any differences. e.g., F2, used from T1 to T4, is more viscous than SB, and its consumption should therefore be lower and cause more friction, heating, and wear of the chain.
- -
- Based on the results of the previous point, an ROPO-based formulation with a different viscosity could be tested to reduce the difference in chain wear relating to the commercial lube. Another possibility to investigate is to change the flow rate setting of the pump in the chainsaw’s lubrication system in order to optimize the lube distribution on the chain.
- -
- Evaluation of the long-term stability of the biofluid, both in the storage phase and after sitting for a long time in the unused chainsaw.
4.2. Lubricants and Sawdust Emissions
Author Contributions
Funding
Data Availability Statement
Acknowledgments
Conflicts of Interest
References
- Lopez-Blanco, R.; Gilbert-Lopez, B.; Rojas-Jimenez, R.; Robles-Molina, J.; Ramos-Martos, N.; Garcia-Reyes, J.F.; Molina-Diaz, A. Evaluation of processing factors for selected organic contaminants during virgin olive oil production: Distribution of BTXES during olives processing. Food Chem. 2016, 199, 273–279. [Google Scholar] [CrossRef]
- Moret, S.; Conchione, C.; Srbinovska, A.; Lucci, P. Microwave-based technique for fast and reliable extraction of organic contaminants from food, with a special focus on hydrocarbon contaminants. Foods 2019, 8, 503. [Google Scholar] [CrossRef] [PubMed]
- Barp, L.; Moret, S.; Purcaro, G. Monitoring and occurrence of heavy PAHs in pomace oil supply chain using a double-step solid-phase purification and HPLC-FLD determination. Foods 2022, 11, 2737. [Google Scholar] [CrossRef] [PubMed]
- Dennis, M.J.; Massey, R.C.; Cripps, G.; Venn, I.; Howarth, N.; Lee, G. Factors affecting the polycyclic aromatic hydrocarbon content of cereals, fats and other food products. Food Addit. Contam. 1991, 8, 517–530. [Google Scholar] [CrossRef] [PubMed]
- Šimko, P. Determination of polycyclic aromatic hydrocarbons in smoked meat products and smoke flavouring food additives. J. Chromatogr. B 2002, 770, 3–18. [Google Scholar] [CrossRef]
- Magnusson, R.; Nilsson, C.; Andersson, K.; Andersson, B.; Rannug, U.; Östman, C. Effect of Gasoline and Lubricant on Emissions and Mutagenicity of Particles and Semivolatiles in Chain Saw Exhaust. Environ. Sci. Technol. 2000, 34, 2918–2924. [Google Scholar] [CrossRef]
- Ålander, T.; Antikainen, E.; Raunemaa, T.; Elonen, E.; Rautiola, A.; Torkkell, K. Particle Emissions from a Small Two-Stroke Engine: Effects of Fuel, Lubricating Oil, and Exhaust Aftertreatment on Particle Characteristics. Aerosol Sci. Technol. 2005, 39, 151–161. [Google Scholar] [CrossRef]
- Stanovský, M.; Schürger, J.; Jankovský, M.; Messingerová, V.; Hnilica, R.; Kučera, M. The effect of lubricating oil on temperature of chainsaw cutting system. Croat. J. For. Eng. 2013, 34, 83–90. [Google Scholar]
- Skoupy, A.; Pechlák, B.; Sejkora, P.A. Contribution to the understanding of oil dispersion at the work with a chain saw by means of the radiotracer method. Lesnictví 1990, 36, 937–946. [Google Scholar]
- Nowak, P.; Kucharska, K.; Kamiński, M. Ecological and health effects of lubricant oils emitted into the environment. Int. J. Environ. Res. Public Health 2019, 16, 3002. [Google Scholar] [CrossRef]
- Webb, E.; Bushkin-Bedient, S.; Cheng, A.; Kassotis, C.D.; Balise, V.; Nagel, S.C. Developmental and reproductive effects of chemicals associated with unconventional oil and natural gas operations. Rev. Environ. Health 2014, 29, 307–318. [Google Scholar] [CrossRef] [PubMed]
- EUR-Lex—32022R2104—EN—EUR-Lex; Commission Delegated Regulation (EU) 2022/2104 of 29 July 2022 Supplementing Regulation (EU) No 1308/2013 of the European Parliament and of the Council as Regards Marketing Standards for Olive Oil and Repealing Commission Regulation (EEC) No 2568/91 and Commission Implementing Regulation (EU) No 29/2012. European Union: Brussels, Belgium, 2023.
- Gòmez-Coca, R.B.; Pérez-Camino, M.; Moreda, W. The Mineral Oil Hydrocarbon Paradox in Olive Pomace Oils. Food 2023, 12, 434. [Google Scholar] [CrossRef] [PubMed]
- Brühl, L. Occurrence, determination, and assessment of mineral oils in oilseeds and vegetable oils. Eur. J. Lipid Sci. Technol. 2016, 118, 361–372. [Google Scholar] [CrossRef]
- Ursol Menegoz, L.; Conchione, C.; Peroni, D.; Carretta, A.; Moret, S. A study of the impact of harvesting operations on the mineral oil contamination of olive oils. Food Chem. 2023, 406, 135032. [Google Scholar] [CrossRef] [PubMed]
- Garrett, S. Vegetable Oil for Lubricating Chain Saws. In Fire Management Tech Tips; United States Department of Agriculture Forest Service: St. Paul, MN, USA, 1998. [Google Scholar]
- Cecilia, J.A.; Ballesteros Plata, D.; Alves Saboya, R.M.; Tavares de Luna, F.M.; Cavalcante, C.L., Jr.; Rodríguez-Castellón, E. An overview of the biolubricant production process: Challenges and future perspectives. Processes 2020, 8, 257. [Google Scholar] [CrossRef]
- Pochi, D.; Fanigliulo, R.; Bisaglia, C.; Cutini, M.; Grilli, R.; Fornaciari, L.; Betto, M.; Pari, L.; Gallucci, F.; Capuzzi, L.; et al. Test rig and method for comparative evaluation of conventional and bio-based hydraulic fluids and lubricants for agricultural transmissions. Sustainability 2020, 12, 8564. [Google Scholar] [CrossRef]
- Fanigliulo, R.; Pochi, D.; Bondioli, P.; Grilli, R.; Fornaciari, L.; Folegatti, L.; Malaguti, L.; Matteo, R.; Ugolini, L.; Lazzeri, L. Semi-refined Crambe abyssinica (Hochst. EX R.E.Fr.) oil as a biobased hydraulic fluid for agricultural applications. Biomass Convers. Biorefinery 2023, 13, 1859–1871. [Google Scholar] [CrossRef]
- Ugolini, L.; Matteo, R.; Lazzeri, L.; Malaguti, L.; Folegatti, L.; Bondioli, P.; Pochi, D.; Grilli, R.; Fornaciari, L.; Benigni, S.; et al. Technical performance and chemical-physical property assessment of safflower oil tested in an experimental hydraulic test rig. Lubricants 2023, 11, 39. [Google Scholar] [CrossRef]
- Orawiec, A.; Suryan, L.; Parmigiani, J. An evaluation of the performance of chainsaw lubricants. Croat. J. For. Eng. 2020, 41, 325–332. [Google Scholar] [CrossRef]
- Pochi, D.; Biocca, M.; Fanigliulo, R.; Gallo, P.; Pulcini, P. Sowing of seed dressed with thiacloprid using a pneumatic drill modified for reducing abrasion dust emissions. Bull. Insectol. 2015, 68, 273–279. [Google Scholar]
- States Environmental Protection Agency (EPA). Method 6010D (SW-846): Inductively Coupled-Plasma Atomic Emission Spectrometry, Revision 4; States Environmental Protection Agency (EPA): Washington, DC, USA, 2014. [Google Scholar]
- European Union. Directive (EU) 2019/130 of the European Parliament and of the Council of 16 January 2019 amending Directive 2004/37/EC on the protection of workers from the risks related to exposure to carcinogens or mutagens at work. Off. J. Eur. Union 2019, 30, 112–120. [Google Scholar]
- European Union. Directive (EU) 2017/2398 of the European Parliament and of the Council of 12 December 2017 amending Directive 2004/37/EC on the protection of workers from the risks related to exposure to carcinogens or mutagens at work. Off. J. Eur. Union 2017, 345, 87. [Google Scholar]
- Marchi, E.; Neri, F.; Cambi, M.; Laschi, A.; Foderi, C.; Sciarra, G.; Fabiano, F. Analysis of dust exposure during chainsaw forest operations. iForest 2017, 10, 341–347. [Google Scholar] [CrossRef]
- Otto, A.; Parmigiani, J. Velocity, depth-of-cut, and physical property effects on saw chain cutting. BioResources 2015, 10, 7273–7291. [Google Scholar] [CrossRef]
- Dimou, V.; Malesios, C.; Chatzikosti, V. Assessing chainsaw operators’ exposure to wood dust during timber harvesting. SN Appl. Sci. 2020, 2, 1899. [Google Scholar] [CrossRef]
- Camera di Commercio di Bari—Borsa Merci—Commissione Olio—Listino Olio 2022. Available online: https://www.ba.camcom.it/info/listino-olio-2022 (accessed on 30 October 2023).
- Camera di Commercio di Bari—Borsa Merci—Commissione Olio—Listino Olio 2023. Available online: https://www.ba.camcom.it/info/listino-olio-2023 (accessed on 30 October 2023).


| Tests | T0 | T1 | T2 | T3 | T4 |
|---|---|---|---|---|---|
| Location | Bomarzo, Italy | Mugnano, Italy | Monterotondo (Rome), Italy | ||
| Period | October 2020 | February 2021 | June 2021 | December 2021 | February 2022 |
| Duration (days) | 2 | 2 | 1 | 1 | 1 |
| Activity | Firewood cutting | Forest cutting | Intensive cutting at a fixed point | Intensive cutting at a fixed point | Felling of a poplar grove |
| Operators | 1 worker | 3 lumberjacks | 1 worker | 1 worker | 1 worker |
| Chain lubricants | F0, F1, F2, F3 | F0, F2, SB | F2, SB | F2, SB | F2, SB |
| Trunk dimensions | Variable size | Diam.: 25–40 cm | Diam.: 15–20 cm Length: 2.5 m | Diam: 30–35 cm Length: 2.5 m | Diam: 15–20 cm Length: 12–18 m |
| Tree species | Turkey oak | Turkey oak | Pinus, Eucalyptus | Turkey oak | Poplar |
| Measurements carried out during tests | - | Diameter of cuts | Diameter of cuts | Diameter of cuts | Diameter of cuts |
| - | Cuts number per full of oil | Number of cuts | Number of cuts | Number of cuts per full of oil | |
| Bar and chain temperature | Bar and chain temperature | Bar and chain temperature | Bar and chain temperature | - | |
| Oil temperature inside the reservoir | Internal temp. of freshly cut trunks | Internal temp. of freshly cut trunks | Internal temp. of freshly cut trunks | - | |
| Weather conditions | Weather conditions | Weather conditions | Weather conditions | - | |
| - | Air/dust sampling and analysis | Air/dust sampling and analysis | Chain wear (mass variation) | Chain wear (mass variation) | |
| - | Sampling of sawdust and analysis | Sampling of sawdust and analysis | Thermographic analysis | - | |
| Other observations | Operator ratings | ||||
| Tests | T0 | T1 | T2 | T3, T4 | |||
|---|---|---|---|---|---|---|---|
| Brand | Husqvarna | Oleomac | Husqvarna | Stihl | Stihl | Pellenc 1 | Stihl |
| Model | 353 | 952 | 372 XP | 362 C | MS 201TC | C21HD | MS 201TC |
| Engine Displacement (cm3) | 51.7 | 51.7 | 70.7 | 59 | 35.2 | 45.0 2 | 35.2 |
| Power (kW) | 2.4 | 2.5 | 3.9 | 3.5 | 1.8 | 2.0 | 1.8 |
| Max recom. engine speed (min−1) | 13,000 | 13,000 | 13,500 | 10,000 | 10,500 | 6200 | 10,500 |
| Fuel reservoir volume (L) | 0.50 | 0.50 | 0.77 | 0.60 | 0.30 | - | 0.30 |
| Oil reservoir volume (L) | 0.28 | 0.27 | 0.40 | 0.32 | 0.22 | 0.25 | 0.22 |
| Oil pump type | Adjustable flow | ||||||
| Chain pitch (mm) | 8.0 | 9.5 | 9.5 | 9.5 | 9.5 | 6.35 | 9.5 |
| Guide bar length (mm) | 460 | 460 | 450 | 500 | 350 | 280 | 350 |
| Ac. pressure, dB (A) | 102 | 101 | 103 | 106 | 100 ± 2.5 | 85 | 100 ± 2.5 |
| Ac. power, dB (A) | 113 | 113 | 115 | 117 | 113 ± 2.5 | 100 | 113 ± 2.5 |
| Vibration front/rear (mm·s−2) | 3.1/3.2 | 5.2/5.5 | 3.5/4 | 3.5/3.5 | 3.5/3.1 | 2.5/2.5 | 3.5/3.1 |
| Mass without cutting group (kg) | 5.0 | 5.4 | 6.1 | 5.95 | 3.7 | 2.55 | 3.7 |
| Type of Measurement | Parameters | T0 | T1 | T2 | T3 | T4 | |
|---|---|---|---|---|---|---|---|
| Atmospheric conditions | Temperature, R.H., Wind speed, Atm. pressure | Local bulletin https://www.ilmeteo.it/meteo/Bomarzo (accessed on 22 October 2020) | Portable weather station Kestrel® 4500 (R-P-R Ltd., Lymington, UK) | ||||
| Measurements during cutting activity | Trunk length and diameter | - | Manual measurement | ||||
| Oil temp. (in the tank) | Salmoiraghi Digital thermometer 301H + | - | - | - | - | ||
| Chain/bar temperature | RTD PT100 probe (Resolution: 0.1 °C; Accuracy: ±0.1%) | Infrared thermometer Mestek IR01D (Range of measurement −50 °C/800 °C; Accuracy: ±0.5 °C) | FLIR E54 thermal imaging camera (IR res. 320 × 240 pixels. Thermal sens. < 40 mK at 30 °C Accuracy: ±2 °C | - | |||
| Internal wood temperature | |||||||
| Air sampling | - | - | - | Five-stage impactor SKC Sioutas (Dorset, BSI DT11 8ST, UK) + L12 37 mm diameter, PTFE filters Merck (Darmstadt, Germany) | - | ||
| Isokinetic personal air sampler Zambelli Egoplus-TT (Bareggio MI, Italy) + 37 mm diameter, PTFE filters Merck (Darmstadt, Germany) | |||||||
| Laboratory measurements | Kinematic visc. @ 40 °C | Ubbelohde Viscometers for 40 °C in thermostatic bath (ASTM D445) | |||||
| Kinematic visc. @ 100 °C | Ubbelohde Viscometers for 100 °C in thermostatic bath (ASTM D445) | ||||||
| Viscosity index (V.I.) | Calculated from V40 and V100 (ASTM D2270) | ||||||
| Humidity | Sawdust | Oven Bicasa—MFA (Bernareggio, MB, Italy) | - | ||||
| Gravimetric analyses | Sawdust on the chain | - | Precision balance Sartorius CP 622 (Resolution 0.01 g; Min. weight: 0.1 mg; Max. weight: 622 g) | - | |||
| Filters | - | Analytical balance Sartorius ME5 (Resolution 0.001 mg; Max. weight: 5.1 g) | - | ||||
| Chemical analyses | Filter mineraliz. | - | Microwave Assisted Acid Digestion of Sediments, Sludges, and Oils (U.S. EPA Method 3051A) | ||||
| Metallic elements | ICP-MS, method UNI EN ISO 16967:2015 (CREA Lab.) | ICP-MS, method U.S. EPA 6020B:2014 (INNOVHUB Lab.) | - | ||||
| Fatty Acid | %Area |
|---|---|
| Myristic | 0.02 |
| Pentadecanoic | 0.01 |
| Palmitic | 11.17 |
| Palmitoleic | 0.85 |
| Heptadecanoic | 0.07 |
| Heptadecenoic | 0.11 |
| Stearic | 2.91 |
| Oleic | 72.38 |
| Linoleic | 10.71 |
| Eicosanoic | 0.47 |
| Eicosenoic | 0.34 |
| Linolenic | 0.59 |
| Docosanoic | 0.22 |
| Erucic | <0.01 |
| Tetracosanoic | 0.10 |
| Parameters | Methods | Units | ROPO | F2 |
|---|---|---|---|---|
| Density @ 15 °C | ISO 12185:1986 | kg·m−3 | 914.8 | 914.8 |
| Acidity | ISO 660:2020 | % Oleic Acid | 0.16 | 0.18 |
| Acid value | ISO 660:2020 | mg·KOH·g−1 | 0.31 | 0.36 |
| Peroxide value | ISO 3960:2017 | mEq·O2·kg−1 | 11.70 | 15.72 |
| Kinematic viscosity @ 40 °C | ASTM D445-06 | mm2·s−1 | 40.12 | 47.05 |
| Kinematic viscosity @ 100 °C | ASTM D445-06 | mm2·s−1 | 8.52 | 10.02 |
| Viscosity index | ASTM D2270-10 | - | 197 | 207 |
| Copper corrosion (50 °C, 3 h) | ASTM D 130 | Class | 1 | 1 |
| Rancimat Induction Time | ISO 6886:2016 | Hours | 4.95 | 25.18 |
| Slip point | ISO 6321:2021 | °C | −3 | n.a. |
| Limpidity point | ISO 6321:2021 | °C | 0 | n.a. |
| Pour point | ISO 3016:2019 | °C | −9 | −9 |
| Sulfur | ISO 20846:2019 | mg·kg−1 | 7.6 | 8.3 |
| Phosphorous | ISO 10540-3:2002 | mg·kg−1 | 0.3 | 4.5 |
| Potassium | EPA 6010D:2014 | mg·kg−1 | <1 | 15 |
| Tin | EPA 6010D:2014 | mg·kg−1 | 2 | 4 |
| Monoglycerides | EN 14105:2020 | % m·m−1 | 0.25 | 0.25 |
| Diglycerides | EN 14105:2020 | % m·m−1 | 6.68 | 6.68 |
| Ashes | ISO 6884:2008 | % m·m−1 | 0.003 | 0.003 |
| Conradson carbon residue | ISO 10370:2014 | % m·m−1 | 0.26 | 0.26 |
| Formulation | Composition | Kinematic Viscosity @ 40 °C (mm2·s−1) | Kinematic Viscosity @ 100 °C (mm2·s−1) | Viscosity Index |
|---|---|---|---|---|
| F0 | ROPO+TBHQ (3 g kg−1) | 40.92 | 8.68 | 198 |
| F1 | ROPO+TBHQ+BIOTAC (1%) | 44.36 | 9.36 | 201 |
| F2 | ROPO+TBHQ+BIOTAC (2%) | 47.05 | 10.02 | 207 |
| F3 | ROPO+TBHQ+BIOTAC (3%) | 50.28 | 10.57 | 207 |
| Lubricants | Density @ 15 °C (kg·m−3) | Kinematic Viscosity @ 40 °C (mm2·s−1) | Viscosity Index | Flash Point (°C) | Pour Point (°C) | Remarks |
|---|---|---|---|---|---|---|
| F2 | 915 | 47 | 207 | >280 | −9 | Vegetable-based |
| ENI | 884 | 100 | 99 | 252 | −18 | Mineral product |
| ENI Forest | 885 | 105 | 100 | 240 | −14 | Mineral product |
| Papillon | 925 | 42 | - | >280 | −3 | Vegetable-based |
| UNISPAD | 920 | 60 | 180 | 300 | −10 | Vegetable-based |
| VPM | 920 | 45 | n.a. | >230 | 5 | Vegetable-based |
| TAMOIL Blue B. | 880–890 | 95–110 | >98 | >240 | −9 | n.a. |
| MOL-LUB D.F. | 875–895 | 100 | 92 | 260 | −27 | Mineral product |
| STIHL Bioplus | 920–930 | 32–42 | n.a. | >230 | n.a. | Vegetable-based |
| BIOD ENG 100% | 1090 (20 °C) | 40–55 | n.a. | 350 | −40 | Vegetable-based |
| Ambient Conditions | Day 1 | Day 2 |
|---|---|---|
| Temperature (°C) | 17 | 7 |
| R.H. (%) | 68 | 88 |
| Wind speed (km·h−1) | 25 | 0 |
| Atmospheric pressure (mbar) | 1018 | 1018 |
| Repetitions | Parameters | Rep. 1 | Rep. 2 | Rep. 3 | Rep. 4 | Rep. 5 | Average |
|---|---|---|---|---|---|---|---|
| Chain Lubricant | F2 | F2 | F0 | SB | SB | ||
| Chainsaw | Husqvarna 372 XP | Stihl 362 C | |||||
| Values per full of oil | Cutting time (s) | 1860 | 1740 | 1500 | 1161 | 1500 | 1552.20 |
| Cuts number (N) | 414 | 242 | 300 | 238 | 414 | 321.60 | |
| Time per cut (s·cut−1) | 4.5 | 7.2 | 5.0 | 4.9 | 3.6 | 5.04 | |
| Cut frequency (N·min−1) | 13.4 | 8.3 | 12.0 | 12.3 | 16.6 | 12.51 | |
| Values per dm3 | Cutting time (s·dm−3) | 4650 | 4350 | 3750 | 4644 | 6000 | 4679 |
| Cuts number (N·dm−3) | 1035 | 605 | 750 | 952 | 1656 | 1000 | |
| Cut diameter | Average (cm) | 10.10 | 11.50 | 9.97 | 18.53 | 10.80 | 12.18 |
| Max (cm) | 28.00 | 50.00 | 35.00 | 60.00 | 19.00 | 38.40 | |
| Min (cm) | 5.00 | 5.00 | 5.00 | 5.00 | 5.00 | 5.00 | |
| St. dev. (cm) | 4.31 | 8.68 | 6.82 | 8.38 | 5.63 | 6.77 | |
| CV (%) | 42.69 | 75.49 | 68.43 | 45.20 | 52.16 | 56.79 | |
| St. error | 0.21 | 0.56 | 0.39 | 0.54 | 0.33 | 0.41 | |
| Sum of diameters per full of oil (cm) | 4087 | 2784 | 2990 | 4410 | 3240 | 3502 | |
| Sum of diameters per liter of oil (cm·dm−3) | 10,218 | 6960 | 7475 | 17,640 | 12,960 | 11,051 | |
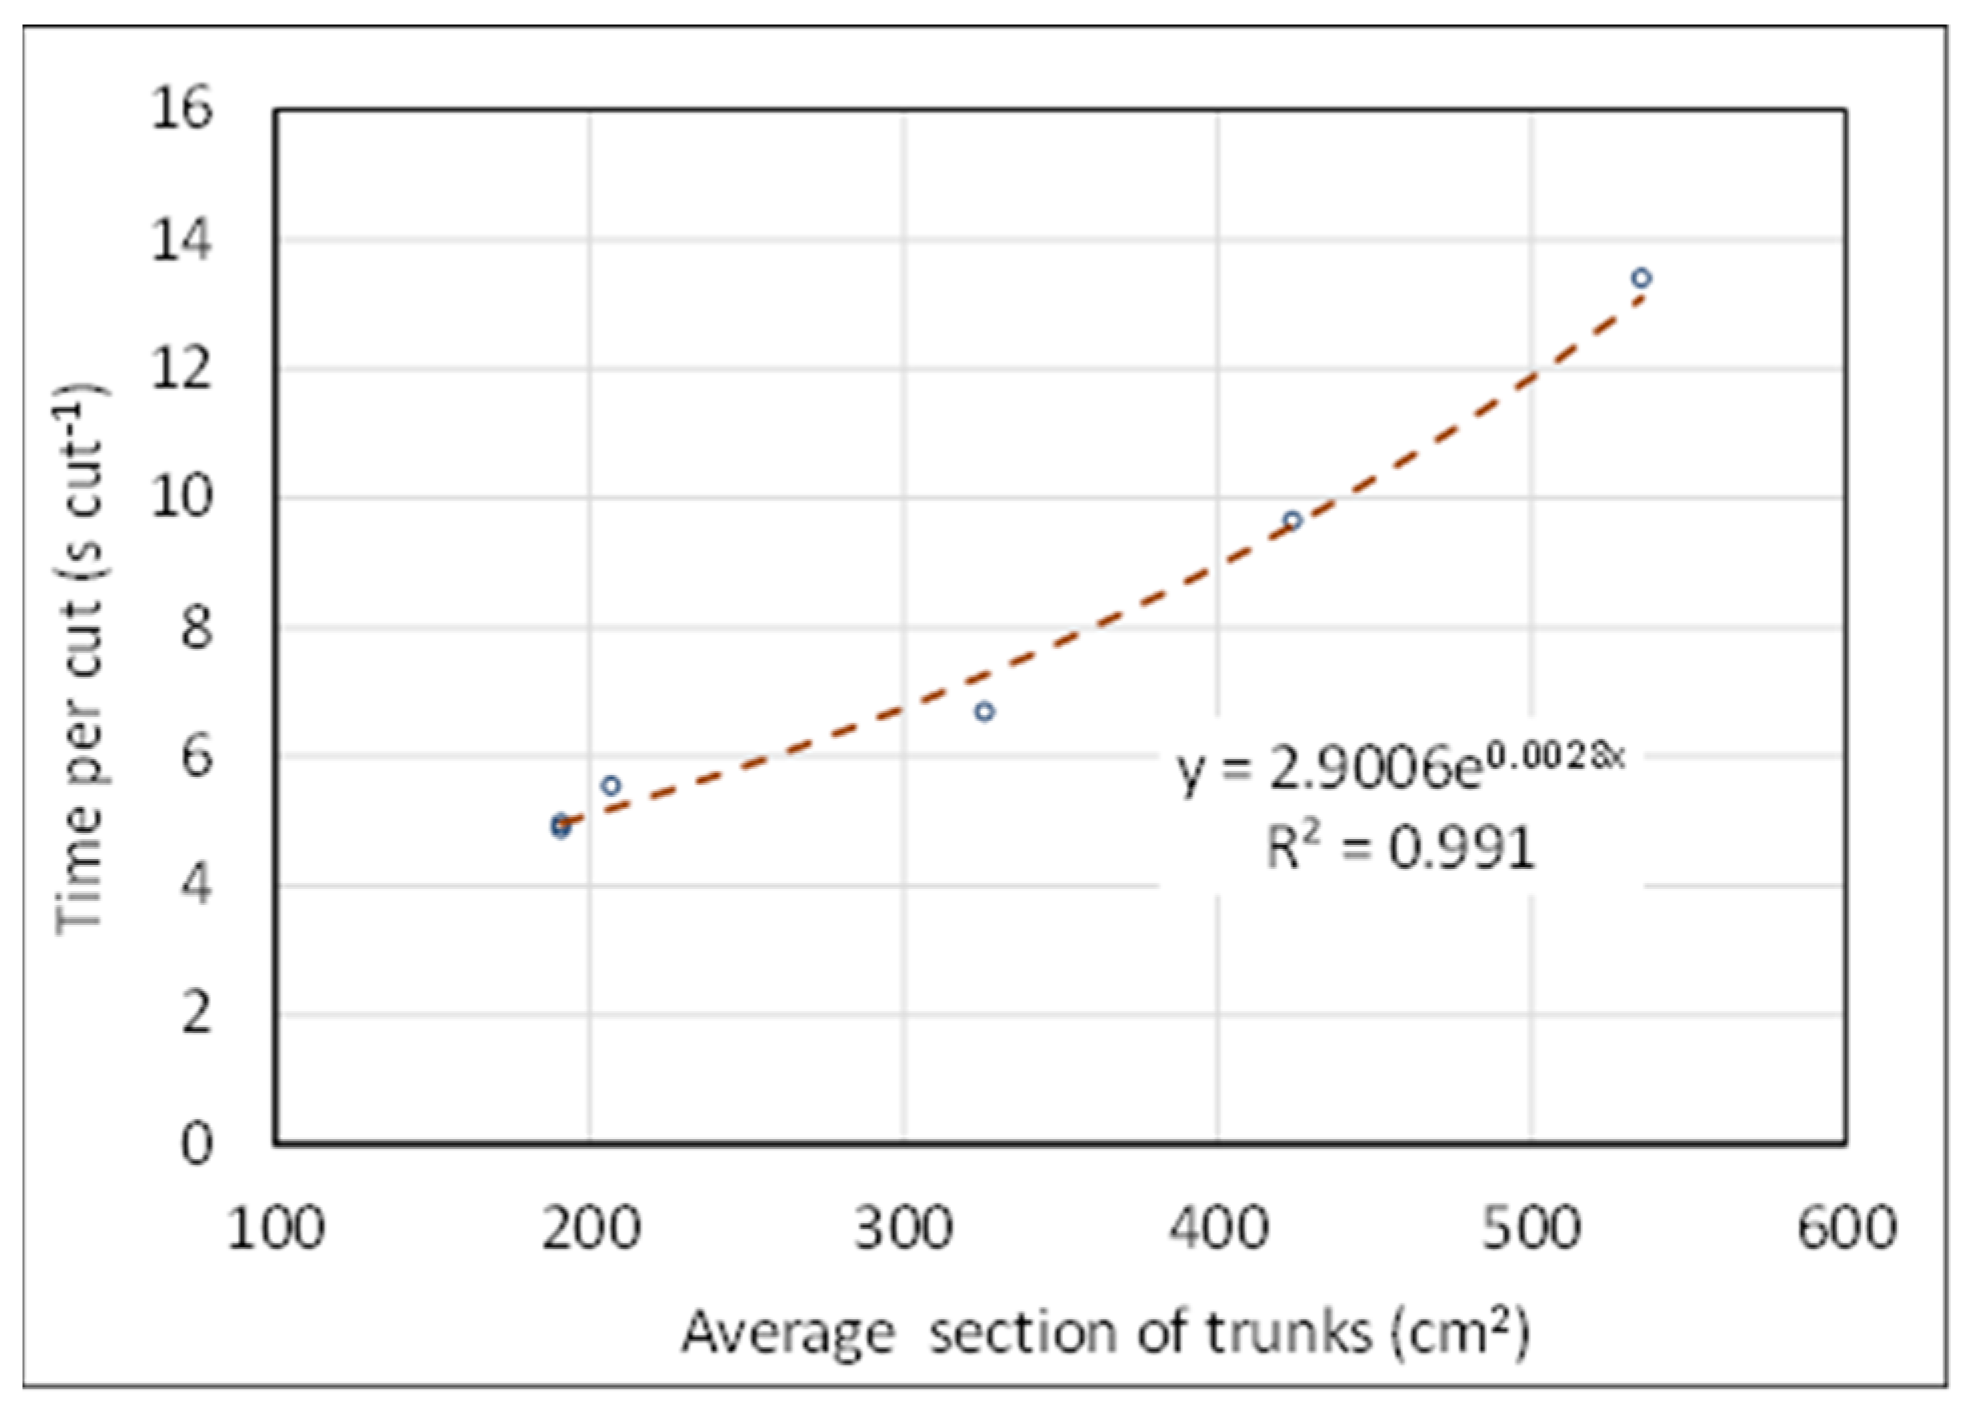
| Cut section | Average (cm2) | 94.71 | 162.93 | 114.43 | 324.52 | 116.45 | 162.61 |
| Max (cm2) | 615.75 | 1963.50 | 962.11 | 2827.43 | 283.53 | 1330.46 | |
| Min (cm2) | 19.63 | 19.63 | 19.63 | 19.63 | 19.63 | 19.63 | |
| St. dev. (cm2) | 89.58 | 327.68 | 190.18 | 316.17 | 104.73 | 205.67 | |
| CV (%) | 94.57 | 201.12 | 166.19 | 97.43 | 89.94 | 129.85 | |
| St. error | 4.40 | 21.06 | 10.98 | 20.49 | 6.05 | 12.60 | |
| Sum of sections per full of oil (cm2) | 38,839 | 39,429 | 34,330 | 77,236 | 34,935 | 44,954 | |
| Sum of sections per liter of oil (cm2·dm−3) | 98,029 | 98,571 | 85,824 | 308,944 | 192,838 | 156,842 | |
| Chain temperature | Average (°C) | 49.39 | 55.94 | 50.15 | 54.58 | 42.96 | 50.61 |
| Max (°C) | 57.70 | 60.00 | 55.60 | 57.70 | 60.90 | 58.38 | |
| Min (°C) | 32.00 | 45.00 | 46.60 | 32.00 | 39.20 | 38.96 | |
| St. dev. (°C) | 10.05 | 2.72 | 4.35 | 6.34 | 7.06 | 6.10 | |
| CV (%) | 20.35 | 4.86 | 8.67 | 11.61 | 16.43 | 12.38 | |
| St. error | 0.49 | 0.17 | 0.25 | 0.41 | 0.41 | 0.35 | |
| Temperature of freshly cut wood (°C) | 5–7 | ||||||
| U\p (Same) | Rep. 1 | Rep. 2 | Rep. 3 | Rep. 4 | Rep. 5 |
|---|---|---|---|---|---|
| Rep. 1 | - | 4.52 × 10⁻¹ | 1.86 × 10⁻⁵ | 4.23 × 10−47 | 1.25 × 10⁻¹ |
| Rep. 2 | 48,425 | - | 1.82 × 10⁻³ | 1.59 × 10⁻²⁹ | 6.54 × 10⁻¹ |
| Rep. 3 | 50,740 | 30,770 | - | 1.13 × 10−38 | 6.25 × 10⁻² |
| Rep. 4 | 17,009 | 12,071 | 12,650 | - | 1.00 × 10⁻⁴ |
| Rep. 5 | 58,000 | 35,500 | 41,100 | 13,040 | - |
| Parameters | Units Measure | Values |
|---|---|---|
| Volume of the chain lube reservoir | dm3 | 0.376 |
| Duration of full oil | h | 0.47 |
| Actual working time | h day−1 | 6 |
| Hourly oil consumption | dm3 h−1 | 0.80 |
| Daily oil consumption | dm3 day−1man−1 | 4.80 |
| Cutting team composition | men | 3 |
| Team daily oil consumption | dm3 day−1 | 14.4 |
| Area covered by the team daily | ha day−1 | 0.5 |
| Oil dispersed per unit area | dm3 ha−1 | 28.8 |
| cm3 m−2 | 2.88 |
| Chainsaws | ICE | WEM | ||||||||
|---|---|---|---|---|---|---|---|---|---|---|
| Chain lubricant | SB | F2 | SB | F2 | ||||||
| Repetition | Rep. 1 | Rep. 6 | Rep. 2 | Rep. 5 | Rep. 3 | Rep. 4 | Rep. 7 | Rep. 8 | Rep. 9 | |
| Wood | Pinus (fw) | Pinus (dw) | Eucal. | Pinus (fw) | Pinus (dw) | Eucal. | Pinus (dw) | Eucal. | Eucal. | |
| Trunk diameter (cm) | 20 | 18.5 | 19 | 20 | 18.5 | 20.5 | 15.3 | 15.3 | 15.8 | |
| Unit measure | °C | °C | °C | °C | °C | °C | °C | °C | °C | |
| Number of cuts | 10 | 39.2 | 63.8 | 49.1 | 44.1 | 67.9 | 56.6 | 64.4 | 44.4 | 42.7 |
| 20 | 49.1 | 80.1 | 51.9 | 43.6 | 98.3 | 57.2 | 73.2 | 43.4 | 45.9 | |
| 30 | 47.1 | 88.8 | 52.6 | 49.1 | 104.2 | 54.4 | 77.6 | 43.3 | 46.9 | |
| 40 | 49.1 | - | 54.7 | - | 113.2 | 56.1 | 72.1 | 41.2 | 46.9 | |
| 50 | 48.8 | - | 53.7 | - | 112.6 | 52.6 | - | 42.2 | 46.8 | |
| 60 | 42.1 | - | 55.6 | - | 112.6 | 53.8 | - | 42.1 | 46.9 | |
| 70 | 45.9 | - | 54.2 | - | 109.7 | 53.6 | - | - | - | |
| 80 | 45.3 | - | 53.7 | - | - | 53.3 | - | - | - | |
| 90 | 45.2 | - | 52.5 | - | - | - | - | - | - | |
| 100 | - | - | 52.6 | - | - | - | - | - | - | |
| Statistical indicators (All data) | Min | 39.2 | 63.8 | 49.1 | 43.6 | 67.9 | 52.6 | 64.4 | 41.2 | 42.7 |
| Max | 49.1 | 88.8 | 55.6 | 49.1 | 113.2 | 57.2 | 77.6 | 44.4 | 46.9 | |
| Mean | 45.8 | 77.6 | 53.1 | 45.6 | 102.6 | 54.7 | 71.8 | 42.8 | 45.7 | |
| St. dev. | 3.4 | 12.7 | 1.8 | 3.0 | 16.3 | 1.7 | 5.5 | 1.2 | 1.6 | |
| St. err. | 1.1 | 7.3 | 0.6 | 1.8 | 6.1 | 0.6 | 2.7 | 0.5 | 0.6 | |
| CV | 7.3 | 16.4 | 3.4 | 6.7 | 15.8 | 3.1 | 7.6 | 2.7 | 3.4 | |
| Statistical indicators (30 cuts) | Min | 39.2 | 63.8 | 49.1 | 43.6 | 67.9 | 54.4 | 64.4 | 43.3 | 42.7 |
| Max | 49.1 | 88.8 | 52.6 | 49.1 | 104.2 | 57.2 | 77.6 | 44.4 | 46.9 | |
| Mean | 45.1 | 77.6 | 51.2 | 45.6 | 90.1 | 56.1 | 71.7 | 43.7 | 45.2 | |
| St. dev. | 5.2 | 12.7 | 1.9 | 3.0 | 19.5 | 1.5 | 6.7 | 0.6 | 2.2 | |
| St. err. | 1.7 | 5.2 | 0.6 | 1.2 | 7.4 | 0.5 | 2.7 | 0.2 | 0.9 | |
| CV | 11.6 | 16.4 | 3.6 | 6.7 | 21.6 | 2.6 | 9.4 | 1.4 | 4.9 | |
| Chainsaws | Particles | ICE | WEM | |||||
|---|---|---|---|---|---|---|---|---|
| Chain Lubricants | SB | F2 | SB | F2 | ||||
| Repetitions | Rep. 1 | Rep. 2 | Rep. 3 | Rep. 4 | Rep. 7 | Rep. 8 | Rep. 9 | |
| Wood | Pinus (fw) | Eucal. | Pinus (dw) | Eucal. | Pinus (fw) | Eucal. | Eucal. | |
| Wood Humidity | 48.6 | 56.2 | 14.5 | 57.1 | 48 | 53.7 | 55.1 | |
| Diameter (cm) | 20.25 | 19 | 18.65 | 20.65 | 15.25 | 15.25 | 15.75 | |
| Number of cuts | 90 | 100 | 70 | 80 | 40 | 60 | 60 | |
| Concentration of powder as it is | Inhalable (mg m−3) | 18.17 | 18.11 | 19.00 | 11.75 | 3.70 | 42.62 | 8.83 |
| Respirable (mg m−3) | 33.99 | 98.50 | 10.51 | 2.92 | 37.95 | 52.45 | 12.90 | |
| Concentration of dust (d.s.) | Inhalable (mg m−3) | 9.34 | 7.93 | 16.25 | 5.04 | 1.93 | 19.73 | 3.97 |
| Respirable (mg m−3) | 17.47 | 43.14 | 8.99 | 1.25 | 19.73 | 24.28 | 5.79 | |
| Differences SB—F2 (dust as it is) | Rep. 1–Rep. 3 | Rep. 2–Rep. 4 | - | Rep. 8, Rep. 9 | ||||
| Inhalable (mg m−3) | −0.83 | 6.36 | - | 33.79 | ||||
| Respirable (mg m−3) | 23.48 | 95.58 | - | 39.55 | ||||
| Differences SB—F2 (dust d.s.) | Inhalable (mg m−3) | −6.91 | 2.89 | - | 15.77 | |||
| Respirable (mg m−3) | 8.48 | 41.89 | - | 18.49 | ||||
| Fluids | Rep. | Environ. Temp. | R.H. | Wood Hum. | Wood | Cuts | Cutting Time | Time | Diameter (Mean) | Section | Total | Max |
|---|---|---|---|---|---|---|---|---|---|---|---|---|
| Intern. | per Cut | Surface | Cut | Chain | ||||||||
| Stat. | Temp. | (Mean) | (Mean) | Surface | Temp. 1 | |||||||
| Ind. | °C | % | % | °C | N | s | s cut−1 | cm | cm2 | m2 | °C | |
| SB | 1 | 8.9 | 63.3 | 33.6 | 6.3 | 100 | 670 | 6.7 | 20.4 | 325.9 | 3.30 | 84.9 |
| 2 | 11.83 | 59.2 | 35.7 | 8.2 | 100 | 965 | 9.7 | 23.2 | 424.1 | 4.20 | 122.3 | |
| 3 | 12.17 | 60.9 | 32.0 | 7.4 | 100 | 489 | 4.9 | 15.6 | 191.1 | 1.90 | 62.2 | |
| Total | - | - | - | - | 300 | 2124 | - | - | - | 9.40 | - | |
| Average | 10.97 | 61.1 | 33.8 | 7.3 | - | 708 | 7.1 | 19.7 | 313.7 | 3.1 | 89.80 | |
| Dev. St. | 1.80 | 2.06 | 1.86 | 0.95 | - | 240 | 2.4 | 3.9 | 117.0 | 1.16 | 30.35 | |
| St. error | 1.04 | 1.19 | 1.07 | 0.55 | - | 139 | 1.4 | 2.2 | 67.5 | 0.67 | 17.52 | |
| CV | 16.39 | 3.37 | 5.51 | 13.1 | - | 34 | 33.9 | 19.6 | 37.3 | 36.99 | 33.80 | |
| F2 | 4 | 10.1 | 66.3 | 33.1 | 7 | 100 | 497 | 5.0 | 15.6 | 191.1 | 1.90 | 78.1 |
| 5 | 10.57 | 66.2 | 35.7 | 7.9 | 100 | 1341 | 13.4 | 26.1 | 535.1 | 5.40 | 104.6 | |
| 6 | 10.4 | 66.2 | 32.3 | 8.20 | 100 | 555 | 5.6 | 16.2 | 207.0 | 2.10 | 112.8 | |
| Total | - | - | - | - | 300 | 2393 | - | - | - | 9.40 | - | |
| Average | 10.36 | 66.2 | 33.7 | 7.7 | - | 798 | 8.0 | 19.3 | 311.1 | 3.13 | 98.50 | |
| Dev. St. | 0.24 | 0.05 | 1.8 | 0.62 | - | 471 | 4.7 | 5.9 | 194.2 | 1.97 | 18.14 | |
| St. error | - | 0.14 | 1.0 | 0.36 | - | 272 | 2.7 | 3.4 | 112.1 | 1.13 | 10.47 | |
| CV | - | 2.30 | 5.3 | 8.11 | - | 59 | 59.1 | 30.5 | 62.4 | 62.73 | 18.41 |
| Test for Equal Means | ||||||
|---|---|---|---|---|---|---|
| Parameters | Variability Factors | Sum of Squares | Df | Mean Square | F | P (Same) |
| Cutting time | Between groups | 12,060.2 | 1 | 12,060.2 | 0.3183 | 0.6294 |
| Within groups | 559,953 | 4 | 139,988 | - | - | |
| Error | 75,770.3 | 2 | 37,885.2 | - | 0.7503 | |
| Between subject: | 484,182 | 2 | 242,091 | - | - | |
| Total | 572,013 | 5 | - | - | - | |
| Average section surface | Between groups | 10.67 | 1 | 11 | 0.0014 | 0.9737 |
| Within groups | 10.28 | 4 | 25,691.2 | - | - | |
| Error | 15,390.3 | 2 | 7695.17 | - | 1 | |
| Between subject: | 87,374.3 | 2 | 43,687.2 | - | - | |
| Total | 102,775 | 5 | - | - | - | |
| Lubricants | State of the Saw Chain | Masses | Specific Chain Wear | ||||
|---|---|---|---|---|---|---|---|
| Chains | Residues | Losses | Per surf. Unit | Per Cut | Diff. | ||
| g | mg | mg | mg m−2 | mg cut−1 | % | ||
| SB (viscosity @ 40 °C: 42 mm−2·s−1) | New | 172.25 | - | - | - | - | - |
| End of test: dirty chain | 173.74 | 1490 | - | - | - | - | |
| End of test: cleaned chain | 172.06 | - | 190 | 20.21 | 0.63 | - | |
| F2 (viscosity @ 40 °C: 47 mm−2·s−1) | New | 172.36 | - | - | - | - | - |
| End of test: dirty chain | 174.29 | 1930 | - | - | - | - | |
| End of test: cleaned chain | 172.00 | - | 360 | 38.30 | 1.20 | 89.47 | |
| Lubricants | State of the Saw Chain | Masses | Cutting Data | Specific Chain Wear | ||||||
|---|---|---|---|---|---|---|---|---|---|---|
| Chains | Residues | Losses | Trees | Section Mean Area 1 | Total Cut Area | per Surf. Unit | per Cut | Diff. | ||
| g | mg | mg | N | cm2 | m2 | mg m−2 | mg cut−1 | % | ||
| SB | New | 171.98 | 153.72 | |||||||
| End of test: dirty chain | 172.59 | 0.86 | 250 | 294 | 4.5 | 0.85 | 55.32 | |||
| End of test: cleaned chain | 171.73 | |||||||||
| F2 | New | 172.04 | ||||||||
| End of test: dirty chain | 172.88 | 1.13 | 290 | 252 | 3.9 | 1.15 | 74.86 | 35.33 | ||
| End of test: cleaned chain | 171.75 | |||||||||
Disclaimer/Publisher’s Note: The statements, opinions and data contained in all publications are solely those of the individual author(s) and contributor(s) and not of MDPI and/or the editor(s). MDPI and/or the editor(s) disclaim responsibility for any injury to people or property resulting from any ideas, methods, instructions or products referred to in the content. |
© 2023 by the authors. Licensee MDPI, Basel, Switzerland. This article is an open access article distributed under the terms and conditions of the Creative Commons Attribution (CC BY) license (https://creativecommons.org/licenses/by/4.0/).
Share and Cite
Fanigliulo, R.; Bondioli, P.; Biocca, M.; Grilli, R.; Gallo, P.; Fornaciari, L.; Folegatti, L.; Benigni, S.; Calderari, I.; Gallucci, F.; et al. Olive Pomace Oil as a Chainsaw Lubricant: First Results of Tests on Performance and Safety Aspects. Lubricants 2023, 11, 494. https://doi.org/10.3390/lubricants11110494
Fanigliulo R, Bondioli P, Biocca M, Grilli R, Gallo P, Fornaciari L, Folegatti L, Benigni S, Calderari I, Gallucci F, et al. Olive Pomace Oil as a Chainsaw Lubricant: First Results of Tests on Performance and Safety Aspects. Lubricants. 2023; 11(11):494. https://doi.org/10.3390/lubricants11110494
Chicago/Turabian StyleFanigliulo, Roberto, Paolo Bondioli, Marcello Biocca, Renato Grilli, Pietro Gallo, Laura Fornaciari, Liliana Folegatti, Stefano Benigni, Igor Calderari, Francesco Gallucci, and et al. 2023. "Olive Pomace Oil as a Chainsaw Lubricant: First Results of Tests on Performance and Safety Aspects" Lubricants 11, no. 11: 494. https://doi.org/10.3390/lubricants11110494
APA StyleFanigliulo, R., Bondioli, P., Biocca, M., Grilli, R., Gallo, P., Fornaciari, L., Folegatti, L., Benigni, S., Calderari, I., Gallucci, F., & Pochi, D. (2023). Olive Pomace Oil as a Chainsaw Lubricant: First Results of Tests on Performance and Safety Aspects. Lubricants, 11(11), 494. https://doi.org/10.3390/lubricants11110494