Abstract
A mechanical seal is a common type of rotating shaft seal in rotating machinery and plays a key role in the fluid seal of rotating machinery, such as centrifugal pumps and compressors. Given the performance degradation caused by the wear to the face of the contact mechanical seal during operation and the lack of effective predictive maintenance monitoring methods and evaluation indexes, a method for measuring the acceleration of the mechanical seal face’s vibration was pro-posed. The influence of face performance degradation and rotational speed change on the tribo-logical regime of the mechanical seal was investigated. The proposed fault detection model based on support vector data description (SVDD) was constructed. A mechanical seal face degradation test rig verifies the usability of the proposed method. The results show that in the mixed lubrication (ML) regime, the vibration sensitivity of the face increases with the increase in rotational speed. With the decrease in the face performance, the vibration-sensitive characteristic parameters of the face in-crease and change from the ML regime to the boundary lubrication (BL) regime. The incipient fault detection model can warn about incipient faults of mechanical seals. Here, the axial detection result predicted that maintenance would be required 10.5 months earlier than the actual failure time, and the radial and axial detection results predicted required maintenance 12 months earlier than the actual failure.
1. Introduction
Mechanical seal is a common form of rotating shaft seal for rotating machinery and is used to seal the pressurized fluid around the rotating shaft in various industrial fields [1]. Mechanical seals are one of the core power components of high-end rotating equipment in the fields of nuclear power, petrochemical, aerospace, marine equipment, etc., and play a decisive role in the safe and stable operation of the main engine [2].
In the daily maintenance of pumps and other equipment, the maintenance workload of mechanical seals accounts for 30% of the total workload, and about 70% of maintenance costs for centrifugal pumps are used on repairing sealing faults [3]. In summary, the reliable and stable operation of mechanical seals is essential for the routine operation of equipment and the safe production of enterprises. However, there are technical bottlenecks in the prediction of the remaining working life of mechanical seals and the prevention of mechanical seal leakage [4]. The most common causes of seal failure include dry running, abrasives in seal fluid, sludge and bonding, thermal and mechanical distortion, coking, sleeve damage, o-ring damage, carbon ring erosion, etc. Incorrect seal design, incorrect installation, and operation mistakes are the most common reasons [5]. Due to the lack of effective mechanical seal condition monitoring in engineering technology, catastrophic accidents caused by mechanical seal leakage occur frequently. The failure of mechanical seals often leads to severe losses and may even lead to catastrophic combustion, explosion, leakage of harmful media, and accidents [6]. To ensure the continuity and safety of industrial production while reducing production costs, it is necessary to perform predictive maintenance on mechanical seals [7]. An effective maintenance strategy can avoid unplanned production stops, reduce costs, and possibly even extend the life of mechanical seals [8].
In recent years, many scholars have conducted research on the monitoring and improvement of the performance of mechanical seals. KOU [9] established a two-dimensional axisymmetric thermal–fluid–solid-coupling mathematical model of contact mechanical seals, used the finite difference method to solve the control equations of fluid pressure and temperature on the seal face, and used the finite element method to determine the thermal deformation state of the seal. Tomioka [10] found by measuring friction torque, leakage amount, and surface roughness that as the surface roughness increases, the leakage decreases, and the frictional loss torque increases. ZHANG [11] built a friction and wear experimental system for rotating seals. It was found that wear would lead to a decrease in the mechanical properties and sealing performance of the seals. DUAN [12] believed that due to friction and wear, the leakage of seals gradually increases over time. TAKAMI [13] used the thermal analysis method to monitor the mechanical seal and explored the influence of thermal conductivity, operating temperature, and the heat convection coefficient on the temperature distribution of the mechanical seal face. LUAN [14] conducted a heat transfer analysis on mechanical seals using fin theory to estimate the contact and surface temperatures between seal rings. MOHSEN [15] proposed the concept of load sharing to study the behavior of mechanical seals under mixed lubrication conditions. The advantage of this method is that various parameters, including fluid properties, sliding velocity, surface roughness, friction coefficient, temperature effect, and other effective factors, can be considered simultaneously. The above scholars’ theoretical research on the tribological behavior of mechanical seals in relation to factors such as face thermal deformation, surface roughness, surface temperature, and so on has laid a theoretical foundation for the development of mechanical seal condition monitoring.
In order to prevent sudden leakage accidents of mechanical seals, some domestic and international scholars have carried out research on mechanical seal condition monitoring technology. According to FAN [5], methods of mechanical seal condition monitoring include operation parameter monitoring, acoustic emission, ultrasonic, dynamic behavior measurement, and the acoustic noise of air propagation. Identifying the early failure of mechanical seals is an important means to avoid premature failure. SUN [16] found that the change in surface morphology is the main reason for the leakage of mechanical seals when the preload is constant. The failure of seals usually causes additional vibration and sound due to the direct contact of two sliding surfaces. Therefore, vibration monitoring is a feasible method for mechanical seal condition monitoring. ANDERSON [17] developed a monitoring device for mechanical seals that uses ultrasonic shear waves to determine the state of the seal interface, thereby monitoring the friction state and wear degree between the faces. The shear wave probe is installed on the back of the non-rotating seal ring. Towsyfyan [18] used the acoustic emission (AE) method to study the tribological behavior of mechanical seals by extracting the AE signals under the three failure modes of the health status and the three failure modes of dry running, spring failure, and seal defects; the time domain, frequency domain, and time–frequency domain analysis methods were used to process the collected data, and by monitoring the prominent frequency bands, it was found that the time domain and frequency domain characteristics of AE signals can be effectively used to determine the lubrication status and incipient fault detection of mechanical seals. HUANG [19] employed the acoustic emission method to investigate the state evolution of the dry gas seal during the start-up process. The root mean square value of the acoustic emission signal showed obvious periodic characteristics, and the state evolution process of the seal was divided into four stages. HUANG et al. [20] conducted an analysis on the root mean square (RMS) value of the acoustic emission (AE) signal from the gas seal pair, and observed that the AE RMS value was higher when the angle of the titled rotor increased compared to when it decreased. REDDYHOFF [21] employed AE technology to measure changes in liquid film thickness between the faces, revealing a correlation between load variations and alterations in liquid film thickness.
There are some limitations in the condition monitoring technology of mechanical seals based on acoustic emission signals. The main limitations are as follows: acoustic emission technology is mainly used in the condition monitoring of non-contact mechanical seals, and the application scenarios of contact mechanical seals for centrifugal pumps are subject to many restrictions [17,18,19]. FAN [22] pointed out that the low signal-to-noise ratio of acoustic emission signals has been identified as the main obstacle to the application of condition monitoring for mechanical seals in pumps.
LEE [23] installed an acoustic emission sensor and accelerometer on the surface of the mechanical seal shell, and studied the applicability of the acceleration signal in the condition monitoring of the mechanical seal. By comparing the acoustic emission signal and the acceleration signal, it was found that the acceleration signal is more effective for wear monitoring than the AE signal. It is believed that wear leads to a change in lubrication state. The contact area of asperity decreases with an increase in seal surface wear, while the signal-to-noise ratio of the acoustic emission signal decreases. CHITTORA [24] installed vibration sensors outside of the pump casing to monitor the health status of the bearing and seal using vibration analysis, and utilized the fault characteristic frequency signal to identify the condition of the mechanical seal. LUO [25] installed sensors on the pump casing to measure the vibration signal of the centrifugal pump with mechanical seal face damage. It was found that the wear of the mechanical seal produces a high-frequency vibration signal. The method of collecting vibration signals outside the pump casing to identify the condition of mechanical seals is easily affected by factors such as bearing damage, shaft bending, and significant axial displacement, rendering it unreliable.
The incipient fault detection of rotating machinery parts based on the vibration signal analysis method has been widely used. Common incipient fault detection methods include the convolutional neural network method [26], deep belief neural network [27], long short-term memory neural network [28], transfer learning [27] and support vector data description method [29,30,31]. These methods have been successfully used for the detecting incipient faults of rotating equipment components, such as bearings and gears, but the research on the incipient fault detection of mechanical seals based on vibration signal analysis has not been reported.
In this paper, a method for measuring the vibrational acceleration of the mechanical seal face is proposed. A vibration acceleration sensor is installed on the stationary ring of the mechanical seal to acquire data on the mechanical seal’s vibration acceleration. The relationship between the tribological regime of the mechanical seal, the performance degradation of the face, and the rotational speed was studied in conjunction with the Stribeck curve. An incipient fault detection model for the mechanical seal was established, and a mechanical seal test rig was built to verify the proposed method.
2. Theoretical Model
2.1. Structure of Mechanical Seal
The structure of common mechanical seals is shown in Figure 1. The mechanical seal consists of several components including the following: (1) rotating ring end cover, (2) shaft sealing, (3) drive pin, (4) rotating ring, (5) stationary ring, (6) gland plate, (7) lock sleeve, (8) spring, (9) push ring, (10) stationary ring sealing, and (11) rotating ring sealing.
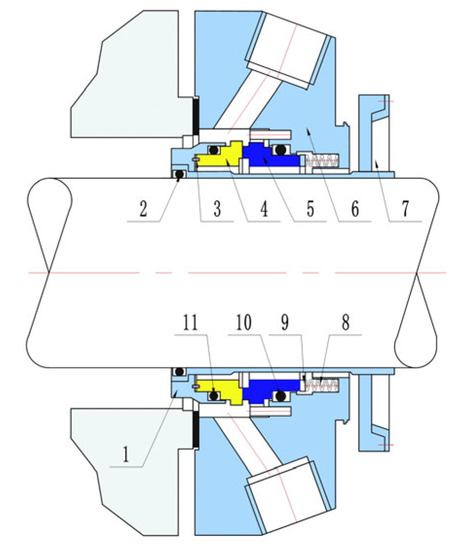
Figure 1.
Mechanical seal structure.
2.2. Face Vibration Acceleration Source Mechanism
Due to the varying thickness of the liquid film between the faces, mechanical seals operate in different tribological regimes, i.e., boundary lubrication (BL), mixed lubrication (ML), and hydrodynamic lubrication (HL) regime depending on the operating conditions that are characterized by the well-known Stribeck curve, as shown in Figure 2.
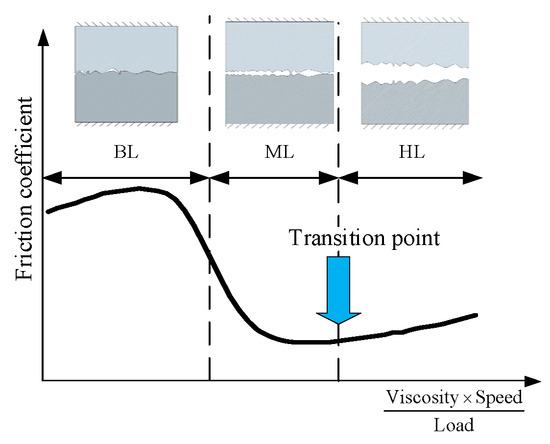
Figure 2.
Stribeck curve.
The mechanical seal is ideally located at the transition point from the ML to the HL regime. However, during the seals’ operating life, a mechanical seal’s faces may wear and deform due to temperature, pressure, and abrasive particles. The BL regime is an unwanted operating regime for mechanical face seals because it generates excessive wear, dry rubbing, and quick damage to the mating rings.
The tribological regime of the mechanical seal is related to the friction between its faces. According to Newton’s second law, the acceleration of an object is proportional to the force acting on it. Therefore, the vibration acceleration of the face is directly influenced by the friction in its contact pair. Consequently, an analysis of the force model for compensation rings in mechanical seals helps clarify the source mechanism behind this acceleration.
As shown in Figure 3a,b, the fluid control volume elements of the sealing face in cartesian coordinates and polar coordinates are established, and the friction equations under different friction regimes are listed according to the control volume elements.
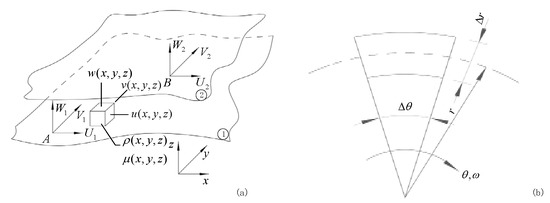
Figure 3.
The face control body in (a) cartesian and (b) polar coordinates.
The force equation of the stationary ring under the fluid viscous shear friction and asperity contact friction is established to explore the variation rule of the force of the stationary ring during the evolution of tribological regime; analyze the main influencing factors of the axial force, tangential force, and radial force of the stationary ring, and clarify the source mechanism of the vibration acceleration of the face of the mechanical seal under the influence of tribological behavior. The characters in Figure 3 are represented as follows: U1, V1, and W1. They are the first face’s x-direction, y-direction, and z-direction velocity vector. U2, V2, and W2 are the second face’s x-direction, y-direction, and z-direction velocity vector. , , and are the velocity vector of fluid film in the x-direction, y-direction, and z-direction. and are the density of the fluid and dynamic viscosity.
The friction equation of the fluid viscous shear friction is as follows:
The viscous shear forces along the x and y directions are shown in Equations (1) and (2):
where is the shear stress in the x direction, is the shear stress in the y direction, h is the thickness of the fluid film, and p is fluid pressure.
The friction equation in the fluid viscous shear friction is shown in Equation (3).
where is friction force, is the average radius, is the outer diameter of the stationary ring, is the radius of the contact node, p is fluid pressure, is the rotational speed, is the angle, h is the thickness of the liquid film.
The tangential contact friction equation of the asperity contact friction is shown in Equation (4).
where is tangential contact friction force, is the product of the local average contact pressure and the empirical value of a contact friction factor, is the average radius, is the outer diameter of the stationary ring, and is the radius of the contact node.
In the running state, the mechanical seal’s dynamic behavior, such as angular swing and axial oscillation of the rotating ring (which is tiny), and its tribological state, including friction and wear on the face, may lead to performance degradation such as wear and deformation of the face. Consequently, this degree of degradation can impact the mechanical seal’s tribological regime and alter the stationary ring’s dynamic behavior.
2.3. Face Incipient Fault Detection
The incipient fault detection model of mechanical seals adopts the single classification algorithm Support Vector Data Description (SVDD) in machine learning. SVDD only requires positive samples to train a sensitive outlier detection model [32]. Therefore, SVDD is used in data-driven rotating machinery and widely applied in incipient fault detection technology. This paper attempts to apply SVDD to the incipient fault detection of mechanical seals for predictive maintenance.
Figure 4 shows the incipient fault detection model of the mechanical seal based on the support vector data description (SVDD) established in this paper.
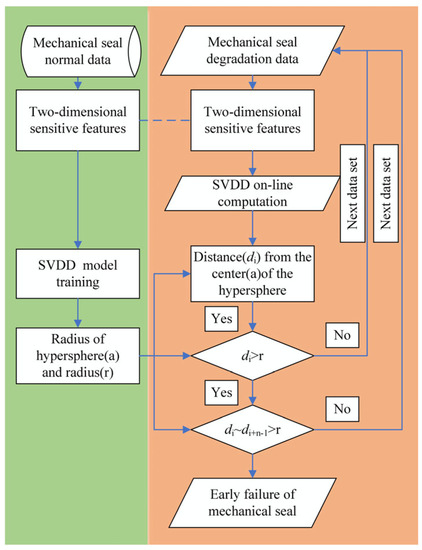
Figure 4.
Incipient fault detection model of mechanical seal face degradation.
The main steps of the incipient fault detection model of mechanical seal tribological regimes proposed in this paper are as follows:
Step 1: Face vibration tribological regimes sensitive feature extraction
The data set of the vibration signal of the mechanical seal face under normal operation history was collected, and the two-dimensional sensitive characteristic parameters of tribological regimes were extracted.
Step 2: Train SVDD
The two-dimensional sensitive characteristic parameters of the tribological regimes calculated in the first step were input into SVDD for training, and the center a and radius r of the hypersphere containing standard samples were obtained.
Step 3: Calculate the generalized distance between the real-time online monitoring data and the center of the hypersphere
The tribological regime two-dimensional sensitive feature of the face vibration data under the real-time operation state was input into the SVDD trained in the second step to obtain the generalized distance di from the center of the hypersphere.
Step 4: Online detection of early fault points
Determine the r size of di and online, such as di > r, which is the suspected incipient fault point. If the number of consecutive alarms exceeds the number of a dynamic array of the composite moving window, di~di+n-1 > r, it is determined to be an incipient fault point.
The SVDD algorithm is a single classification algorithm whose purpose is to map the training data into a high-dimensional space and find a hypersphere with the smallest volume in the high-dimensional space so that the training data can be included in the hypersphere as much as possible. Data belonging to this class resides outside the hypersphere. Its mathematical model is constructed as follows:
Given a training sample , where i is the number of samples, a hypersphere is defined containing almost all samples of the target class. The relaxation factor ξi is introduced to improve the algorithm’s robustness to the training samples. At this time, the SVDD optimization problem is described as follows:
where a is the center of the hypersphere, r is the radius of the hypersphere, and C is the penalty coefficient (C > 0), which is used to weigh the number of abnormal training samples (number of out-of-sphere samples) and the size of the hypersphere. To solve the above optimization problem, the following Lagrangian equation is constructed:
where is the Lagrangian multiplication operator, let the partial derivative of be 0, and obtain the following:
When the sample point is inside the hypersphere, αi = 0. When the sample point is on the boundary of the hypersphere, then 0 < αi < C. When the sample point is outside the hypersphere, then αi = C. The samples on and within the boundaries of the hypersphere are called support vectors.
Substitute Formula (6) into Formula (7) to obtain the following optimization function:
where K(•) is a Gaussian kernel function, and its expression is as follows:
In high-dimensional space, the radius r of the hypersphere can be calculated from the distance from the support vector (xsv) on the interface of the hypersphere to the center of the hypersphere:
For a single test sample z, its distance from the center a can be expressed as:
During the anomaly detection process, the extracted normal training samples are inputted into SVDD for training, resulting in a hypersphere that contains normal samples; in the actual application process, Formula (11) can be used to obtain the generalized distance d between the real-time detection samples and the center of the hypersphere. It is shown that when d ≤ r, the sample is normal, and when d > r the sample is abnormal.
The key step in incipient fault detection is to identify the sensitive characteristics of face vibration tribological regimes. The specific steps are as follows.
Most current research uses time domain, frequency domain, and time-frequency domain features in vibration signals to characterize the degradation state of rolling bearings, gearboxes, etc. [33,34,35], but this approach has not been applied to the research of mechanical seals. To effectively evaluate the incipient fault detection and health status evaluation of mechanical seals, it is necessary to identify eigenvalues that are sensitive to mechanical seal failure and provide effective parameters for further research. In this paper, we calculate the original waveform data of the stationary ring vibration signals from mechanical seals in the time domain, frequency domain, and time-frequency domain using the calculation method [36] shown in Table 1. The representation method for entropy feature is shown in Table 2.

Table 1.
Time domain and frequency domain calculation method.

Table 2.
Entropy feature representation method.
The original eigenvector set composed of 39 features is calculated, and the arc tangent normalization of Formula (1) is used to eliminate the difference in the size of each eigenvalue.
Calculate the monotonicity, correlation, and robustness of each characteristic index [37,38]. The value range of each index is [0, 1]. The corresponding calculation formulas are Formula (2) ~ Formula (4), respectively.
where is the health index time series, is the unit step function, and is the total sample size of the health index.
where is a certain condition monitoring indicator sequence, and is the corresponding monitoring index time series.
where is the trend sequence of the corresponding state monitoring index sequence, This paper uses the five-point cubic smoothing method to obtain the trend sequence.
Bring the calculated three indicators into the calculation formula of sensitivity [39] to measure the sensitivity of the evaluated indicators to the degradation of the mechanical seal. The calculation formula is shown in Formula (16).
Among them, is the sensitivity index, is the attribute weight of a single state monitoring index, and different indexes correspond to different attribute weights due to their different characteristics.
To eliminate the influence of human factors, the sensitivity value of each characteristic parameter is calculated using the entropy-weight-based sensitivity feature screening method [40].
3. Experimental Approach
The test platform of the contacting single mechanical seal is shown in Figure 5a,b,d. It consists of seal testing devices, hydraulic and cooling systems, data acquisition systems, and a variable frequency motor. Turbine oil was used as the lubricating medium for the similarity test, with its main characteristics being high stability and strong load-bearing capacity.
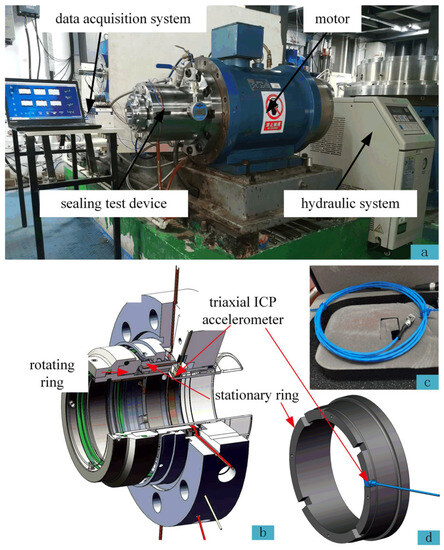
Figure 5.
Test rig and diagram: (a) Test rig. (b) Sensor installation diagram. (c) Triaxial ICP accelerometer. (d) The installation position of the acceleration sensor on the stationary ring.
The seal test device consists of a cartridge mechanical seal and a sealing test chamber. The main components are stationary, and the rotating rings made of silicon carbide.
The installation position of the triaxial acceleration sensor is shown in Figure 5. The triaxial acceleration sensors are installed in the groove on the back of the stationary ring, and they indirectly receive vibration signals generated by the axial, radial, and tangential forces from the friction pair through the stationary ring.
The data acquisition system comprises a vibration-collecting data acquisition card and a computer for data acquiring and storing data. The LabVIEW virtual instrument installed and set up on the computer to measure signals in the time, frequency, and time-frequency domains. Figure 5c displays various sensors utilized in the test, while Table 3 provides detailed parameters of each data acquisition card and sensor.

Table 3.
Data acquisition components and sensors specifications.
The hydraulic and cooling systems include an oil tank, a lubricating oil circulation pump, an oil cooler, and a cooling water circulation pump, and the lubricating oil pressure can be adjusted by the outlet regulating valve of the circulating oil pump.
The test rig was driven by an electric motor with an adjustable rotational speed of up to 6000 rpm.
Measurement Methods
Considering that a 40%~50% degradation of the mechanical seal occurs after approximately six months, the mechanical seal degradation test takes a significant amount of time to complete [41]. The lubrication condition of the laboratory is good, and the operating condition is stable, so it is difficult to complete the performance degradation test of the whole life cycle of the mechanical seal in a short time. Therefore, four rotating rings with different wear degrees with different running times on the same equipment were collected and used to simulate the degradation process of end face performance due to increased wear.
The sealing faces are numbered as (a) (b) (c) and (d) according to the degree of wear, ranging from slight to severe. Figure 6 displays the appearance of the four rotating rings and their surface morphology measured by an automatic imager. The surface roughness of the four rings measured by the roughness meter is shown in Table 4. Among them, ring (a) is a new ring. According to the on-site records of the oil station, the operation time of ring (b) is 1 year, the operation time of ring(c) is 1.5 years, and the operation time of ring (d) is 2 years. Generally, when using ring (d), the mechanical seal has a large leakage.
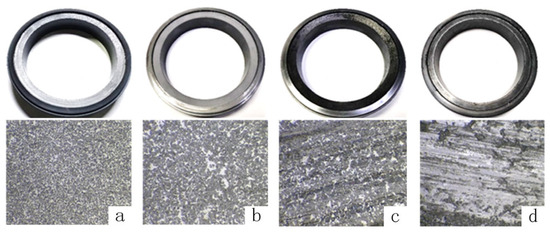
Figure 6.
Surface topography of rotating ring: (a) ring (a). (b) ring (b). (c) ring (c). (d) ring (d).

Table 4.
Surface roughness measurement value of rotating ring.
The values of the sensors installed on the stationary ring were collected during the test. The test is divided into four stages, and each stage uses a rotating ring and is run for a certain period to collect corresponding data. After completion, the machine is stopped. And we wait for the cavity and medium to cool down to room temperature. Then, we disassemble the mechanical seal, and replace different rotating rings with higher wear degrees. The motor speed is set to 3000 rpm for each test step, with a duration of 2.2 h per step, while maintaining a constant pressure of 0.2 MPa in the test chamber lubricating oil.
4. Results
4.1. Vibration-Sensitive Characteristic Parameter Characterization of Face Tribological Regimes
4.1.1. Original Waveform Data of Face Vibration Acceleration
Three sets of face vibration data were collected for each of the four test groups. The sampling time for each sensor was set to 1 s, and a set of data files was saved every 10 s. Since each group testing time was 2.2 h, the length of data for each measuring point is 800, and the total length of degraded data composed from all four experiments is 3200. The vibration data consists of acceleration measurements collected by the sensors in axial, radial, and tangential directions. A detailed description of the test data can be found in Table 5.

Table 5.
Explanation of experimental data.
The original vibration waveform data diagram of the face vibration acceleration is shown in Figure 7. As the face performance degrades, the amplitude of the face vibration acceleration increases.

Figure 7.
Original vibration acceleration waveform of face.
4.1.2. Face Vibration Acceleration Sensitive Characteristic Parameter
The 39-dimensional time domain, frequency domain, and time-frequency domain sensitive feature values of the original waveform data of the face vibration are calculated according to Table 1. The sensitive feature screening method is used to screen the features sensitive to the tribological behavior of mechanical seals, and the sensitive feature values of the mechanical seal face vibration are determined based on the sensitivity of Table 6.

Table 6.
Eigenvalue sensitivity.
The fuzzy entropy, which is the most sensitive to the tribological regime, is utilized for verifying the test data. Entropy represents the sum of all microscopic states of an object in a certain macroscopic state. Fuzzy entropy serves as a measure of fuzzy uncertainty and is employed to quantify the uncertainty associated with information or a system. Consequently, fuzzy entropy can effectively express the uncertainty related to mechanical seal face vibration.
The change curve of fuzzy entropy of brand-new ring (a) at 3000 rpm is shown in Figure 8.

Figure 8.
Fuzzy entropy curve of rotating ring test.
In Figure 8, during the initial stage of the mechanical seal, the seal ring is in the running-in stage. In the tribological regime, the BL and the fuzzy entropy value decrease from its highest point. Then, it transitions to the ML regime, where the fuzzy entropy value reaches its lowest point. Finally, in HL regime, the fuzzy entropy value gradually increases, along with the trend of the Stribeck curve.
This provides compelling evidence that the mentioned method of measuring face vibration acceleration can accurately represent the tribological behavior of mechanical seals and, therefore, can be utilized for precise seal monitoring.
4.2. Mechanical Seal Face Performance Degradation Detection and Incipient Fault Early Warning
The two-dimensional sensitivity characteristics were selected as inputs for the incipient fault detection model and the health status assessment model, based on the sensitivity values provided in Table 6. The chosen features are fuzzy entropy F34 and mean value F1.
This method calculates the selected fuzzy entropy and mean value as two-dimensional features. It takes 800 sets of data files of a rotating ring as normal data, inputs them into SVDD for training, and obtains the center a and radius of the hypersphere containing normal samples r. It then inputs a total of 3200 sets of data with mechanical seal face degradation sensitive features into the trained SVDD to obtain the generalized distance di from the center of the hypersphere. The magnitude of di and r is judged, and if di > r, it is considered a suspected incipient fault point.
The calculation results of the mechanical seal incipient detection model are shown in Figure 9. The model detects 1061 points, 801 points, and 801 points as the incipient fault detection points in the three directions, respectively. Based on the actual operation time of the sealing ring introduced above, we can consider the 3200th sample time in this experiment as the failure time of the seal. Therefore, the SVDD-based incipient fault detection model for mechanical seal face vibration acceleration can detect the early fault time of a mechanical seal in advance. Among them, the axial detection result is earlier than actual operation time by 10.5 months, while the radial and axial detections are earlier by 12 months.

Figure 9.
Incipient fault detection of mechanical seal.
5. Discussion
5.1. The Variation Law of Sensitive Characteristic Parameters of Face Vibration Acceleration with Rotational Speed
The test design of the face vibration acceleration data acquisition, with the mechanical seal rotation rate changing, contains five stages, with the rotation rates of 1000 rpm, 1150 rpm, 1350 rpm, 1650 rpm, and 2100 rpm, respectively. The duration of each stage is two hours. The pressure in the test chamber constant at 0.4 MPa. A pair of new rotating and stationary rings are used for the test. Numerical vibration data in axial (Z), radial (Y), and tangential (X) directions were collected for each stage.
The circumferential friction (in the polar coordinate system) of the friction pair in a mechanical seal increases with an increase in rotating speed, and the vibration acceleration on the face of the stationary ring also increases with an increase in rotating speed. Figure 10 illustrates how the vibration-sensitive characteristic parameters of the mechanical seal’s face change with its rotation speed. As shown in Figure 10a,b, as the speed increases, the fuzzy entropy value rises from 0.1 to about 0.7, and the mean value rises from 0.1 m/s2 to about 0.8 m/s2. Both the fuzzy entropy and mean value exhibit a linear increasing trend with increasing speed, and this changing trend is consistent across axial, radial, and tangential directions.
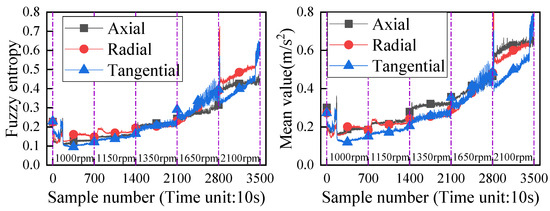
Figure 10.
Change curve of face-sensitive characteristic parameters with rotational speed.
Figure 11 shows the curve of the fundamental frequency amplitude of the face vibration waveform changing with the rotation speed. As the mechanical seal’s rotational speed increases from 1000 rpm to 1150 rpm, 1350 rpm, 1650 rpm, and 2100 rpm, the corresponding waveform’s vibration acceleration amplitudes are calculated as20 Hz, 23 Hz, 27 Hz, 33 Hz, and 42 Hz, respectively. The amplitude face vibration waveform is plotted accordingly. The fundamental frequency of a vibration signal represents the lowest oscillation frequency of a free oscillation system, and its amplitude serves as an important indicator for assessing equipment performance. As shown in Figure 11, the fundamental frequency amplitude of the face vibration waveform increases with increasing rotation speed, particularly, radial vibration waveform exhibits greater sensitivity to changes in tangential and axial vibrations.
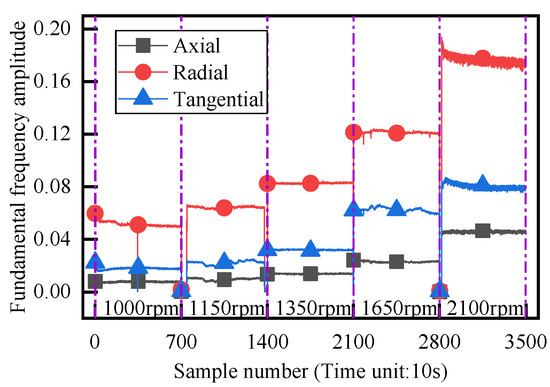
Figure 11.
Variation curve of fundamental frequency amplitude of face vibration waveform changing with speed.
In summary, in the ML regime of mechanical seal, the fuzzy entropy and mean value of the face vibration of the stationary ring increase linearly with an increase in rotating speed. The amplitude of fundamental frequency for face vibration waveform increases with increasing rotating speed, while the change in amplitude for radial vibration waveform is more sensitive.
5.2. The Variation Law of Vibration Acceleration Sensitivity Characteristic Parameters in the Process of Face Performance Degradation
The two-dimensional face’s vibration-sensitive characteristic value increases accordingly as the degradation degree of the mechanical seal face increases, as shown in Figure 10. According to the Stribeck curve, the mechanical seal face is in the ML regime with a low wear degree, low viscous shear force, small load, and small corresponding friction coefficient at the a and b ring regimes. In the c and d ring stages, there is an increase in contact between micro convex bodies on the face, resulting in an increase in tangential force, load, and friction coefficient of the face. Consequently, there is a change in the tribological regime from the ML to the BL regime for the mechanical seal.
The two-dimensional sensitive features represent the tribological state of the mechanical seal face and are shown in Figure 12. As the wear degree of the face increases, there is an upward trend in the changing pattern of fuzzy entropy in the axial, radial, and tangential directions Among them, tangential fuzzy entropy is more sensitive to changes in wear degree. In both b and c ring tests, fuzzy entropy in all three directions exhibits a wide oscillation. In the early stage of the c- ring, fuzzy entropy in all three directions shows a wide oscillation before steadily increasing. In both a and b ring tests, there is little change in wear degree on the face and no obvious average change trend; however, during c and d ring tests, the mean value significantly increases but still exhibits a wide oscillation during the c- ring test.

Figure 12.
Degradation curves of sensitive features.
In summary, as the degree of face wear increases, the tribological regimes on the face gradually transition from the ML regime to the BL regime. Both the fuzzy entropy and the mean value of face vibration acceleration exhibit good sensitivity to the increase in face wear degree, with fuzzy entropy being more sensitive than the mean value.
6. Conclusions
A method for measuring the tribological regime of mechanical seals based on face vibration acceleration was proposed, and models for detecting incipient faults and assessing performance degradation were established. The relationship between the tribological regimes of mechanical seals and changes in face degradation and rotation speed was explored. The effectiveness of the proposed method was verified by constructing a test rig to degrade mechanical seals. The main conclusions are as follows:
- (1)
- At the start-up stage of the mechanical seal, the tribological regime is initially BL and then transitions to ML. As the face wear degree increases, the tribological regime gradually shifts from ML to BL. The fuzzy entropy and the mean value of face vibration acceleration exhibit better sensitivity to increasing face wear degree, with the fuzzy entropy being more sensitive than the mean value.
- (2)
- Under the mechanical seal’s ML regime, both the fuzzy entropy and the mean value of stationary ring face vibration increase linearly with rotating speed. The amplitude of fundamental frequency in the face vibration waveform also increases with rotating speed, while the change in amplitude of t radial vibration waveform is more sensitive.
- (3)
- The incipient fault detection model based on SVDD was established using the fuzzy entropy and mean value indexes of the face vibration acceleration. The test data can be used to detect the incipient fault of the mechanical.
In this study, the research on the vibration acceleration of the face of the mechanical seal has only been explored preliminarily, and there are still some shortcomings. The following two aspects will continue to be studied.
- (1)
- It aims to investigate the law governing the change of sensitive characteristic parameters of vibration acceleration on the mechanical seal face with respect to pressure, temperature, compensation spring force, and friction torque between the faces.
- (2)
- The method of measuring face vibration acceleration is applied in engineering practice to explore the accuracy and robustness of the proposed incipient fault detection model under actual working conditions.
Author Contributions
Conceptualization, Y.S. (Yunfeng Song) and Q.W.; methodology, Y.S. (Yunfeng Song); validation, Y.X.; writing—original draft preparation, Y.S. (Yunfeng Song); writing—review and editing, Q.W.; visualization, H.L.; supervision, Y.S. (Yue Shu). All authors have read and agreed to the published version of the manuscript.
Funding
This research was funded by the PipeChina Institute of Science and Technology Project, grant number CLZB202202 and the Open Fund of the State Key Laboratory of Compressor Technology, grant number SKL-YSJ202101.
Data Availability Statement
Since much of the content in this paper is part of the team’s ongoing research about seals, the relevant data cannot be shared at the time of publication.
Acknowledgments
The authors gratefully acknowledge the financial support of the PipeChina Institute of Science and Technology Project (CLZB202202) and the Open Fund of the State Key Laboratory of Compressor Technology (SKL-YSJ202101).
Conflicts of Interest
The authors have no competing interests to declare that are relevant to the content of this article.
Abbreviations
| Abbreviation | Definition |
| SVDD | Support vector data description |
| AE | Acoustic emission |
| RMS | Root mean square |
| BL | Boundary lubrication |
| ML | Mixed lubrication |
| HL | Hydrodynamic lubrication |
| U1 | The first face’s x-direction velocity vector |
| V1 | The first face’s y-direction velocity vector |
| W1 | The first face’s z-direction velocity vector |
| U2 | The second face’s x-direction velocity vector |
| V2 | The second face’s y-direction velocity vector |
| W2 | The second face’s z-direction velocity vector |
| The velocity vector of fluid film in the x-direction | |
| The velocity vector of fluid film in the y-direction | |
| The velocity vector of fluid film in the z-direction | |
| The density of the fluid | |
| The dynamic viscosity of the fluid | |
| The shear stress in the x direction | |
| The shear stress in the y direction | |
| H | The thickness of the fluid film |
| P | Fluid pressure |
| Friction force | |
| The average radius | |
| The outer diameter of the stationary ring | |
| The radius of the contact node | |
| The rotational speed | |
| The angle | |
| Tangential contact friction force | |
| The product of the local average contact pressure and the empirical value of a contact friction factor |
References
- Jianjun, S.; Chenbo, M.; Qiuping, Y.; Jianhua, L.; Min, Z.; Peiyan, Z. Numerical analysis on a new pump-out hydrodynamic mechanical seal. Tribol. Int. 2017, 106, 62–70. [Google Scholar] [CrossRef]
- Zheng, W.; Sun, J.; Ma, C.; Yu, Q. Percolation interpretation of film pressure forming mechanism of mechanical seal and calculation method of film pressure coefficient. Tribol. Int. 2022, 173, 107664. [Google Scholar] [CrossRef]
- Raadnui, S. Seal wear debris characterization for predictive maintenance. Wear 2015, 330–331, 490–497. [Google Scholar] [CrossRef]
- Yin, Y.; Huang, W.; Liu, X.; Liu, Y.; Wang, Y.; Li, K. The State-of-the-art and Future Development of Mechanical Face Seal Intelligentization. Jixie Gongcheng Xuebao/J. Mech. Eng. 2021, 57, 116–128. [Google Scholar] [CrossRef]
- Fan, Y.E.; Gu, F.; Ball, A. A Review of the Condition Monitoring of Mechanical Seals. In Proceedings of the ASME 7th Biennial Conference on Engineering Systems Design and Analysis, Manchester, UK, 19–22 July 2004; pp. 179–184. [Google Scholar]
- Ni, X.; Ma, C.; Sun, J.; Zhang, Y.; Yu, Q. A leakage model of contact mechanical seals based on the fractal theory of porous medium. Coatings 2020, 11, 20. [Google Scholar] [CrossRef]
- Zhang, Z.; Chen, K.; Zhang, E.Q.; Fu, P. Mechanical seal condition monitoring technology research. Appl. Mech. Mater. 2014, 529, 344–348. [Google Scholar] [CrossRef]
- Nunes, P.; Santos, J.; Rocha, E. Challenges in predictive maintenance—A review. CIRP J. Manuf. Sci. Technol. 2023, 40, 53–67. [Google Scholar] [CrossRef]
- Kou, G.Y.; Li, X.H.; Wang, Y.; Tan, C.S.; Zhou, K.R.; Yang, X.P. Multifield Coupling Model and Performance Analysis of a Hydrostatic Mechanical Seal. Energies 2020, 13, 5159. [Google Scholar] [CrossRef]
- Tomioka, J.; Miyanaga, N. Effect of surface roughness of mechanical seals under blood sealing. Lubr. Sci. 2010, 22, 443–452. [Google Scholar] [CrossRef]
- Zhang, Z.; Gao, D.; Guan, T.; Liang, Y.; Zhao, J.; Wang, L.; Tang, J. Experimental Study on Friction and Wear Characteristics of Hydraulic Reciprocating Rotary Seals. Lubricants 2023, 11, 385. [Google Scholar] [CrossRef]
- Duan, X.; Liu, D.; Wang, S.; Shang, Y. A Hydraulic Reciprocating Rod Seal’s Life Evaluation Method Incorporating Failure Mechanism Analysis and Test Observation Data. Lubricants 2023, 11, 319. [Google Scholar] [CrossRef]
- Takami, M.R.; Gerdroodbary, M.B.; Ganji, D.D. Thermal analysis of mechanical face seal using analytical approach. Therm. Sci. Eng. Prog. 2018, 5, 60–68. [Google Scholar] [CrossRef]
- Luan, Z.; Khonsari, M.M. Heat transfer analysis in mechanical seals using fin theory. Proc. Inst. Mech. Eng. Part J-J. Eng. Tribol. 2007, 221, 717–725. [Google Scholar] [CrossRef]
- Rahimpour, M.; Samadani, A.; Akbarzadeh, S. Application of Load-Sharing Concept to Mechanical Seals. Lubricants 2023, 11, 266. [Google Scholar] [CrossRef]
- Sun, J.; He, X.; Wei, L.; Feng, X. Failure analysis and seal life prediction for contacting mechanical seals. In Proceedings of the ICEM 2008: International Conference on Experimental Mechanics 2008, Nanjing, China, 8–11 November 2009; pp. 848–854. [Google Scholar]
- Anderson, W.B.; Jarzynski, J.; Salant, R.F. A Condition Monitor for Liquid Lubricated Mechanical Seals. Tribol. Trans. 2001, 44, 479–483. [Google Scholar] [CrossRef]
- Towsyfyan, H.; Gu, F.; Ball, A.D.; Liang, B. Modelling acoustic emissions generated by tribological behaviour of mechanical seals for condition monitoring and fault detection. Tribol. Int. 2018, 125, 46–58. [Google Scholar] [CrossRef]
- Fan, W.; Huang, W.; Liu, Y.; Yin, Y.; Liu, X.; Wang, Y. State Evolution of Dry Gas Seal during Repeated Start–Stop Operation Using Acoustic Emission Method. Tribol. Trans. 2020, 63, 173–181. [Google Scholar] [CrossRef]
- Yin, Y.; Huang, W.; Liu, X.; Liu, Y.; Wang, Z.; Fan, W.; Hu, S. Analysis of the Dynamic Friction of a Gas Face Seal Based on Acoustic Emissions. Tribol. Lett. 2018, 66, 85. [Google Scholar] [CrossRef]
- Reddyhoff, T.; Dwyer-Joyce, R.S.; Harper, P. A New Approach for the Measurement of Film Thickness in Liquid Face Seals. Tribol. Trans. 2008, 51, 140–149. [Google Scholar] [CrossRef]
- Fan, Y.B.; Gu, F.S.; Ball, A. Acoustic emission monitoring of mechanical seals using MUSIC algorithm based on higher order statistics. Key Eng. Mater. 2009, 413, 811–816. [Google Scholar] [CrossRef]
- Lee, D.H.; Ha, C.W. Characteristics of Acceleration and Acoustic Emission Signals from Mechanical Seals. In Proceedings of the Transactions of the Korean Nuclear Society Autumn Meeting, Gyeongju, Republic of Korea, 29–30 October 2015. [Google Scholar]
- Chittora, S.M. Monitoring of Mechanical Seals in Process Pumps. Master’s Thesis, KTH Industrial Engineering and Management, Stockholm, Sweden, 2018. [Google Scholar]
- Luo, Y.; Zhang, W.; Fan, Y.; Han, Y.; Li, W.; Acheaw, E. Analysis of Vibration Characteristics of Centrifugal Pump Mechanical Seal under Wear and Damage Degree. Shock Vib. 2021, 2021, 6670741. [Google Scholar] [CrossRef]
- Chen, R.; Huang, X.; Yang, L.; Xu, X.; Zhang, X.; Zhang, Y. Intelligent fault diagnosis method of planetary gearboxes based on convolution neural network and discrete wavelet transform. Comput. Ind. 2019, 106, 48–59. [Google Scholar] [CrossRef]
- Zhao, H.; Yang, X.; Chen, B.; Chen, H.; Deng, W. Bearing fault diagnosis using transfer learning and optimized deep belief network. Meas. Sci. Technol. 2022, 33, 065009. [Google Scholar] [CrossRef]
- Zhong, Z.; Zhao, Y.; Yang, A.; Zhang, H.; Zhang, Z. Prediction of Remaining Service Life of Rolling Bearings Based on Convolutional and Bidirectional Long- and Short-Term Memory Neural Networks. Lubricants 2022, 10, 170. [Google Scholar] [CrossRef]
- Zhao, Y.; Wang, S.; Xiao, F. Pattern recognition-based chillers fault detection method using Support Vector Data Description (SVDD). Appl. Energy 2013, 112, 1041–1048. [Google Scholar] [CrossRef]
- Zhao, Y.-P.; Xie, Y.-L.; Ye, Z.-F. A new dynamic radius SVDD for fault detection of aircraft engine. Eng. Appl. Artif. Intell. 2021, 100, 104177. [Google Scholar] [CrossRef]
- Huang, J.; Yan, X. Related and independent variable fault detection based on KPCA and SVDD. J. Process Control 2016, 39, 88–99. [Google Scholar] [CrossRef]
- Tax, D.M.J.; Duin, R.P.W. Support vector data description. Mach. Learn. 2004, 54, 45–66. [Google Scholar] [CrossRef]
- Attoui, I.; Oudjani, B.; Boutasseta, N.; Fergani, N.; Bouakkaz, M.-S.; Bouraiou, A. Novel predictive features using a wrapper model for rolling bearing fault diagnosis based on vibration signal analysis. Int. J. Adv. Manuf. Technol. 2020, 106, 3409–3435. [Google Scholar] [CrossRef]
- McInerny, S.A.; Dai, Y. Basic vibration signal processing for bearing fault detection. IEEE Trans. Educ. 2003, 46, 149–156. [Google Scholar] [CrossRef]
- Zuber, N.; Bajrić, R.; Šostakov, R. Gearbox faults identification using vibration signal analysis and artificial intelligence methods. Eksploat. Niezawodn. 2014, 16, 61–65. [Google Scholar]
- Wang, Q.; Wang, S.; Wei, B.; Chen, W.; Zhang, Y. Weighted K-NN classification method of bearings fault diagnosis with multi-dimensional sensitive features. IEEE Access 2021, 9, 45428–45440. [Google Scholar] [CrossRef]
- Qiu, G.; Gu, Y.; Chen, J. Selective health indicator for bearings ensemble remaining useful life prediction with genetic algorithm and Weibull proportional hazards model. Measurement 2020, 150, 107097. [Google Scholar] [CrossRef]
- Schwartz, S.; Jiménez, J.J.M.; Vingerhoeds, R.; Salaün, M. An unsupervised approach for health index building and for similarity-based remaining useful life estimation. Comput. Ind. 2022, 141, 103716. [Google Scholar] [CrossRef]
- Harrath, S.; Ali, J.B.; Zouaghi, T.; Zerhouni, N. A new adaptive prognostic strategy based on online future evaluation and extended Kalman filtering. In Proceedings of the 2019 6th International Conference on Control, Decision and Information Technologies (CoDIT), Paris, France, 23–26 April 2019; pp. 2033–2038. [Google Scholar]
- Xu, D.; Shao, J.; Ge, J.; Wang, Y.; Wei, F.; Fan, Y. Research on Weak Signal Feature Extraction Method of Rolling Bearing Based on Refined Composite Multi-Scale Weighted Entropy. Machines 2022, 10, 1155. [Google Scholar] [CrossRef]
- Rentong, C.; Zhang, C.; Shaoping, W.; Yujie, Q. Reliability estimation of mechanical seals based on bivariate dependence analysis and considering model uncertainty. Chin. J. Aeronaut. 2021, 34, 554–572. [Google Scholar]
Disclaimer/Publisher’s Note: The statements, opinions and data contained in all publications are solely those of the individual author(s) and contributor(s) and not of MDPI and/or the editor(s). MDPI and/or the editor(s) disclaim responsibility for any injury to people or property resulting from any ideas, methods, instructions or products referred to in the content. |
© 2023 by the authors. Licensee MDPI, Basel, Switzerland. This article is an open access article distributed under the terms and conditions of the Creative Commons Attribution (CC BY) license (https://creativecommons.org/licenses/by/4.0/).