Experimental Investigation into the Effects of Fuel Dilution on the Change in Chemical Properties of Lubricating Oil Used in Fuel Injection Pump of Pielstick PA4 V185 Marine Diesel Engine


Abstract
:1. Introduction
2. Materials and Methods
2.1. Choice of the Tested Oil Properties
- Dispersivity or capacity to keep the cold parts of an engine clean;
- Detergency or capacity to keep hot parts of an engine clean;
- Thermal strength or capacity to withstand temperature changes;
- Anti-oxidation or capacity to resist the action of oxygen;
- Anti-wear or capacity to contain wear;
- Anti-scuffing or capacity to preserve oil film even in the presence of high pressures;
- Alkalinity reserve or capacity to neutralize acids formed during combustion or other sources, thereby preventing corrosive wear;
- Demulsibility or capacity to separate contaminant;
- Resistance to hydrolysis or capacity to withstand the action of water, which can affect the additive’s pumpability;
- Centrifugibility and filterability or capacity to separate insoluble elements;
- Anti-rust, anti-corrosive property and anti-foaming are some of the other properties that protect the metallic object from wear.
- Viscosity—viscosity is the most important property of the lubricating oil, minimizing frictional losses and measured as a fluid resistance to flow. Viscosity of oil may drop due to fuel dilution when running on diesel and may rise when running on heavy diesel fuel. Likewise, the aging of the oil due to oxidation and thermal degradation increases the viscosity. Too low a viscosity of the lubricant results in the fact that the oil film cannot be maintained between the moving surfaces, which leads to excessive wear. Too high a viscosity of the liquid causes excessive resistance to the flow.
- Metal particle content—metals, non-metals and chemicals alike can be present in a huge variety, and they can belong to one of three major oil element categories—wear metals, contaminants and additives. Table 1 presents the limits for the metallic content normally accepted in the industry for diesel engines, independent of the brand and without considering kilometers or hours of operation [14,15].
- Water content—water presence in oil systems deteriorates the rheological properties of the working fluid used, reducing its lubricating and insulating abilities. Water in oil reduces the possibility of bearing load transfer, accelerates the oil oxidation processes, rinses out improvers and increases the amount of sediment formed and causes corrosion. Limits are laid down by the regulations of many manufacturers; the limit of 0.2% should cause an investigation into the source, while remedial action is needed at 0.5%. The presence of Na and Mg in oil indicates contamination with salt water.
- Flash point—the “lowest liquid temperature at which, under certain standardized conditions, a liquid gives off vapors in a quantity such as to be capable of forming an ignitable vapors/air mixture”. Commercial products must adhere to specific flash points that have been set by regulating authorities, especially for safety reasons.
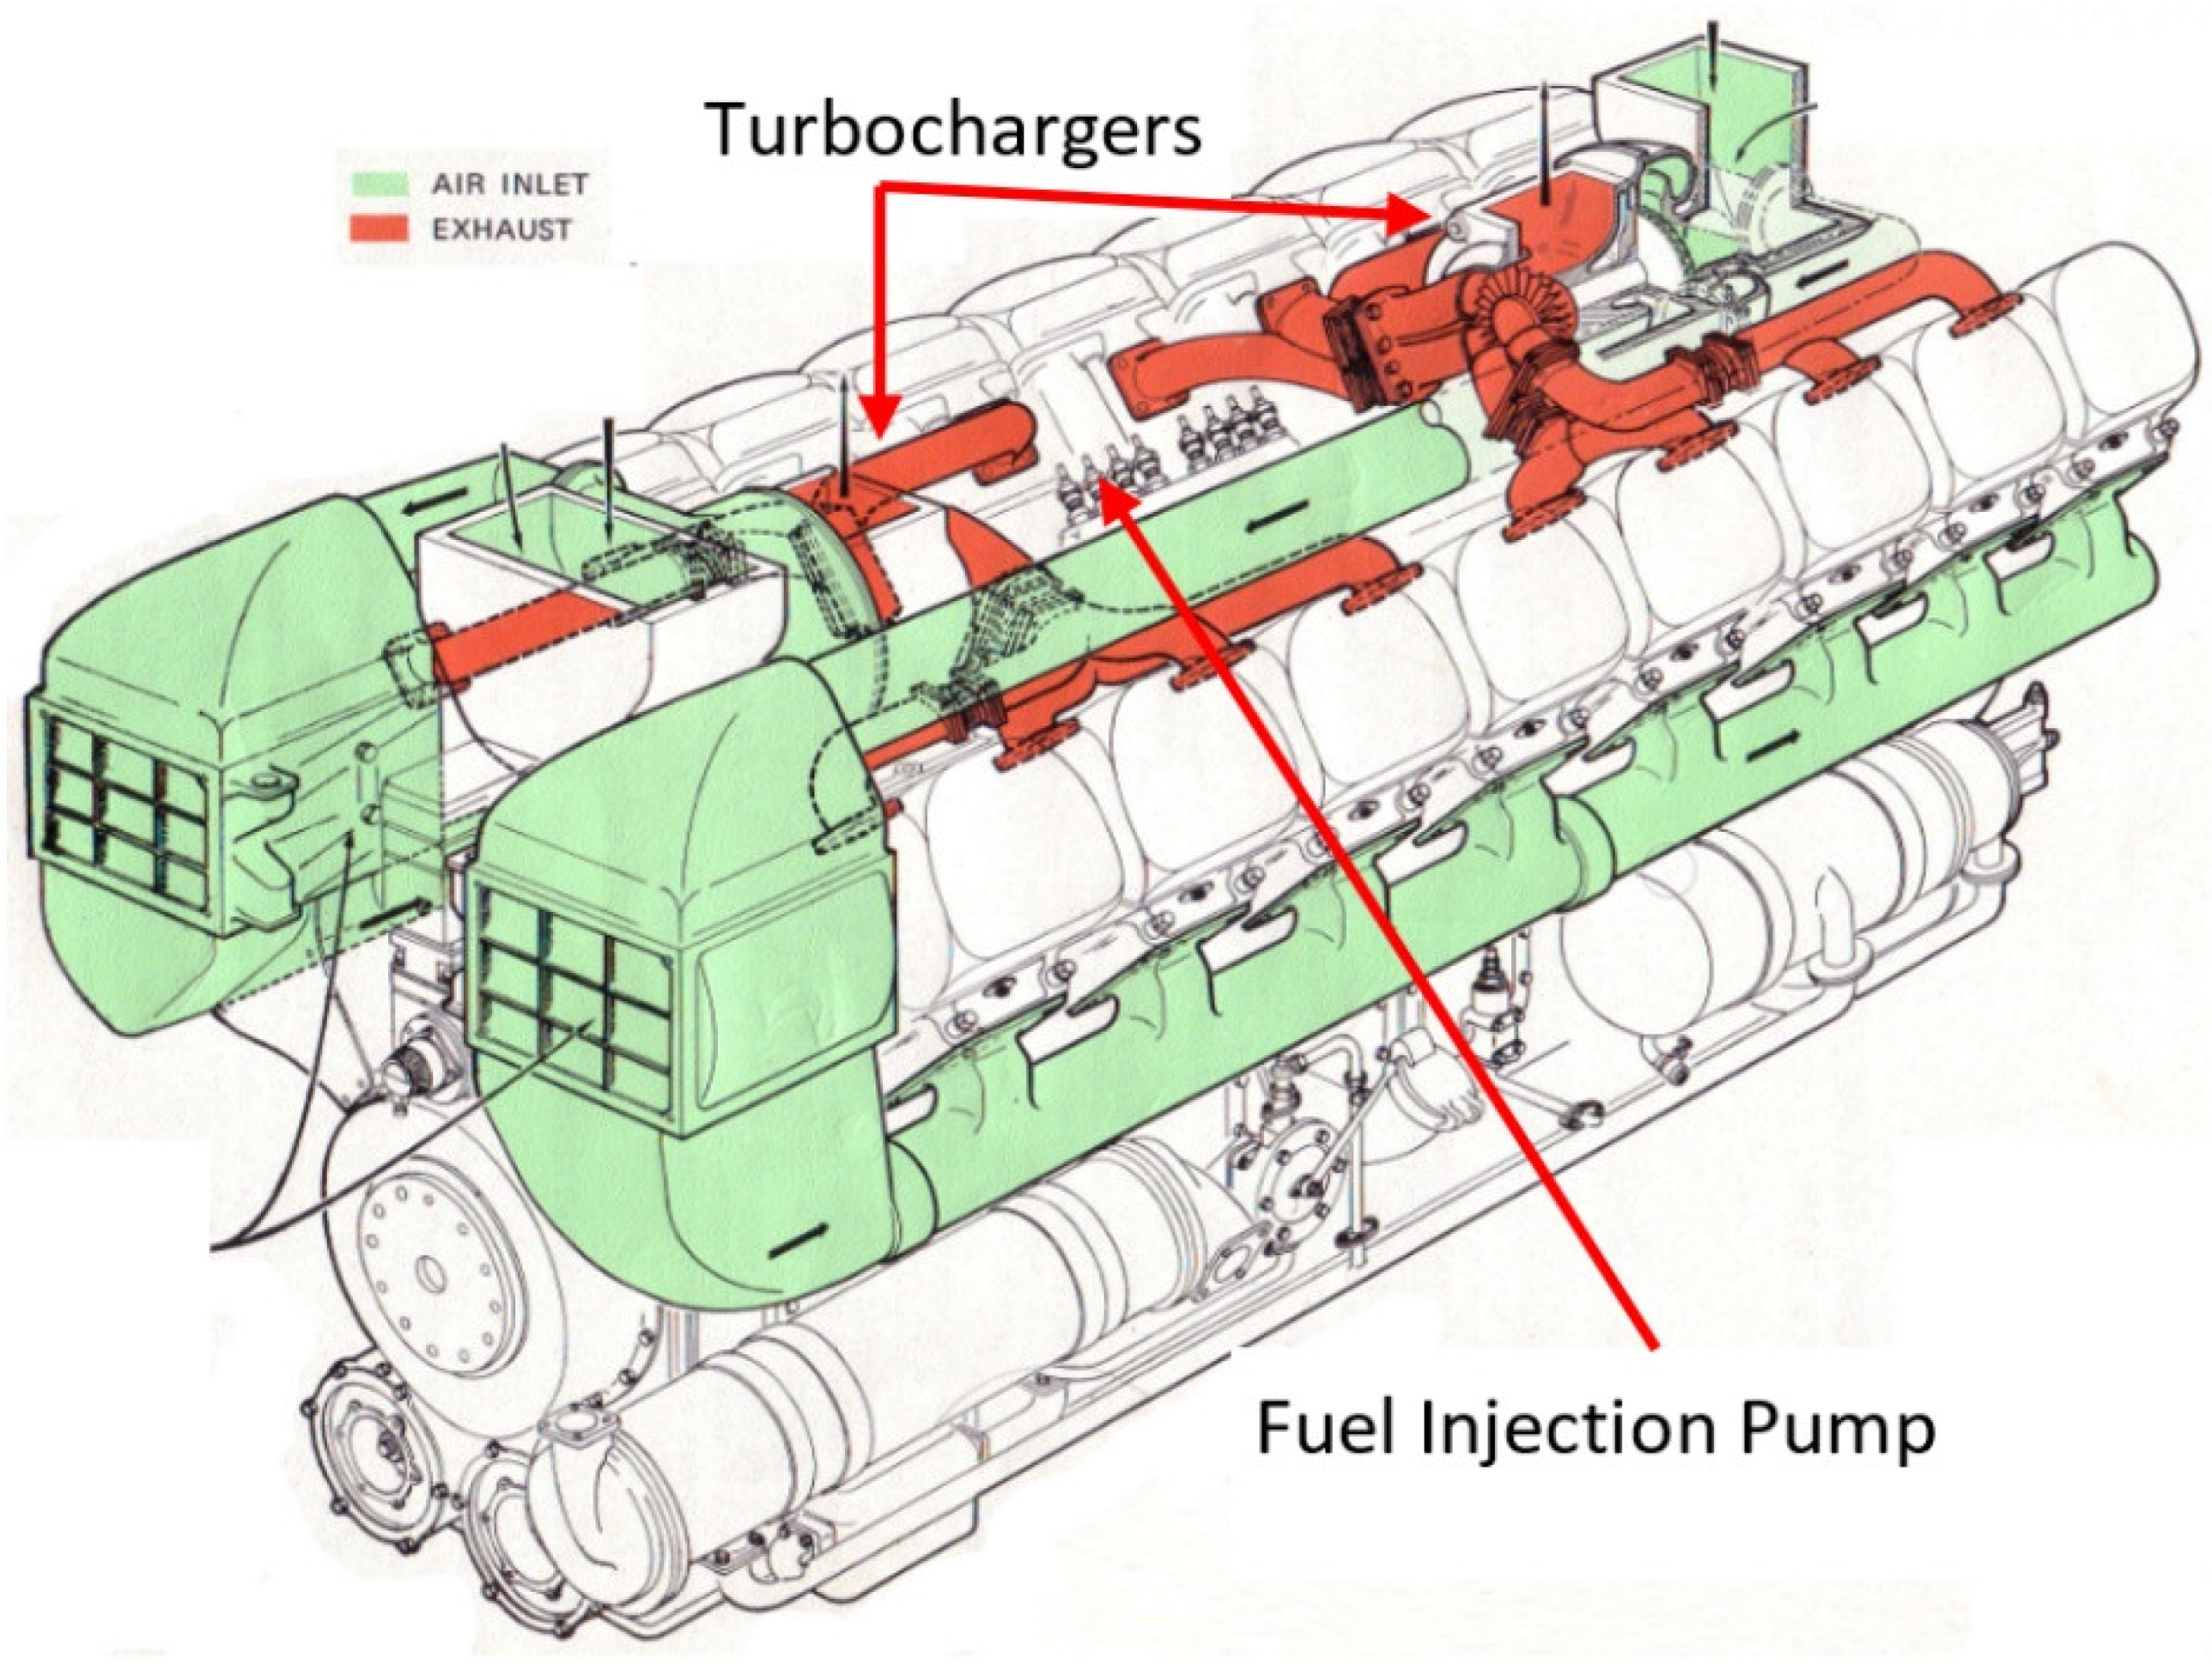
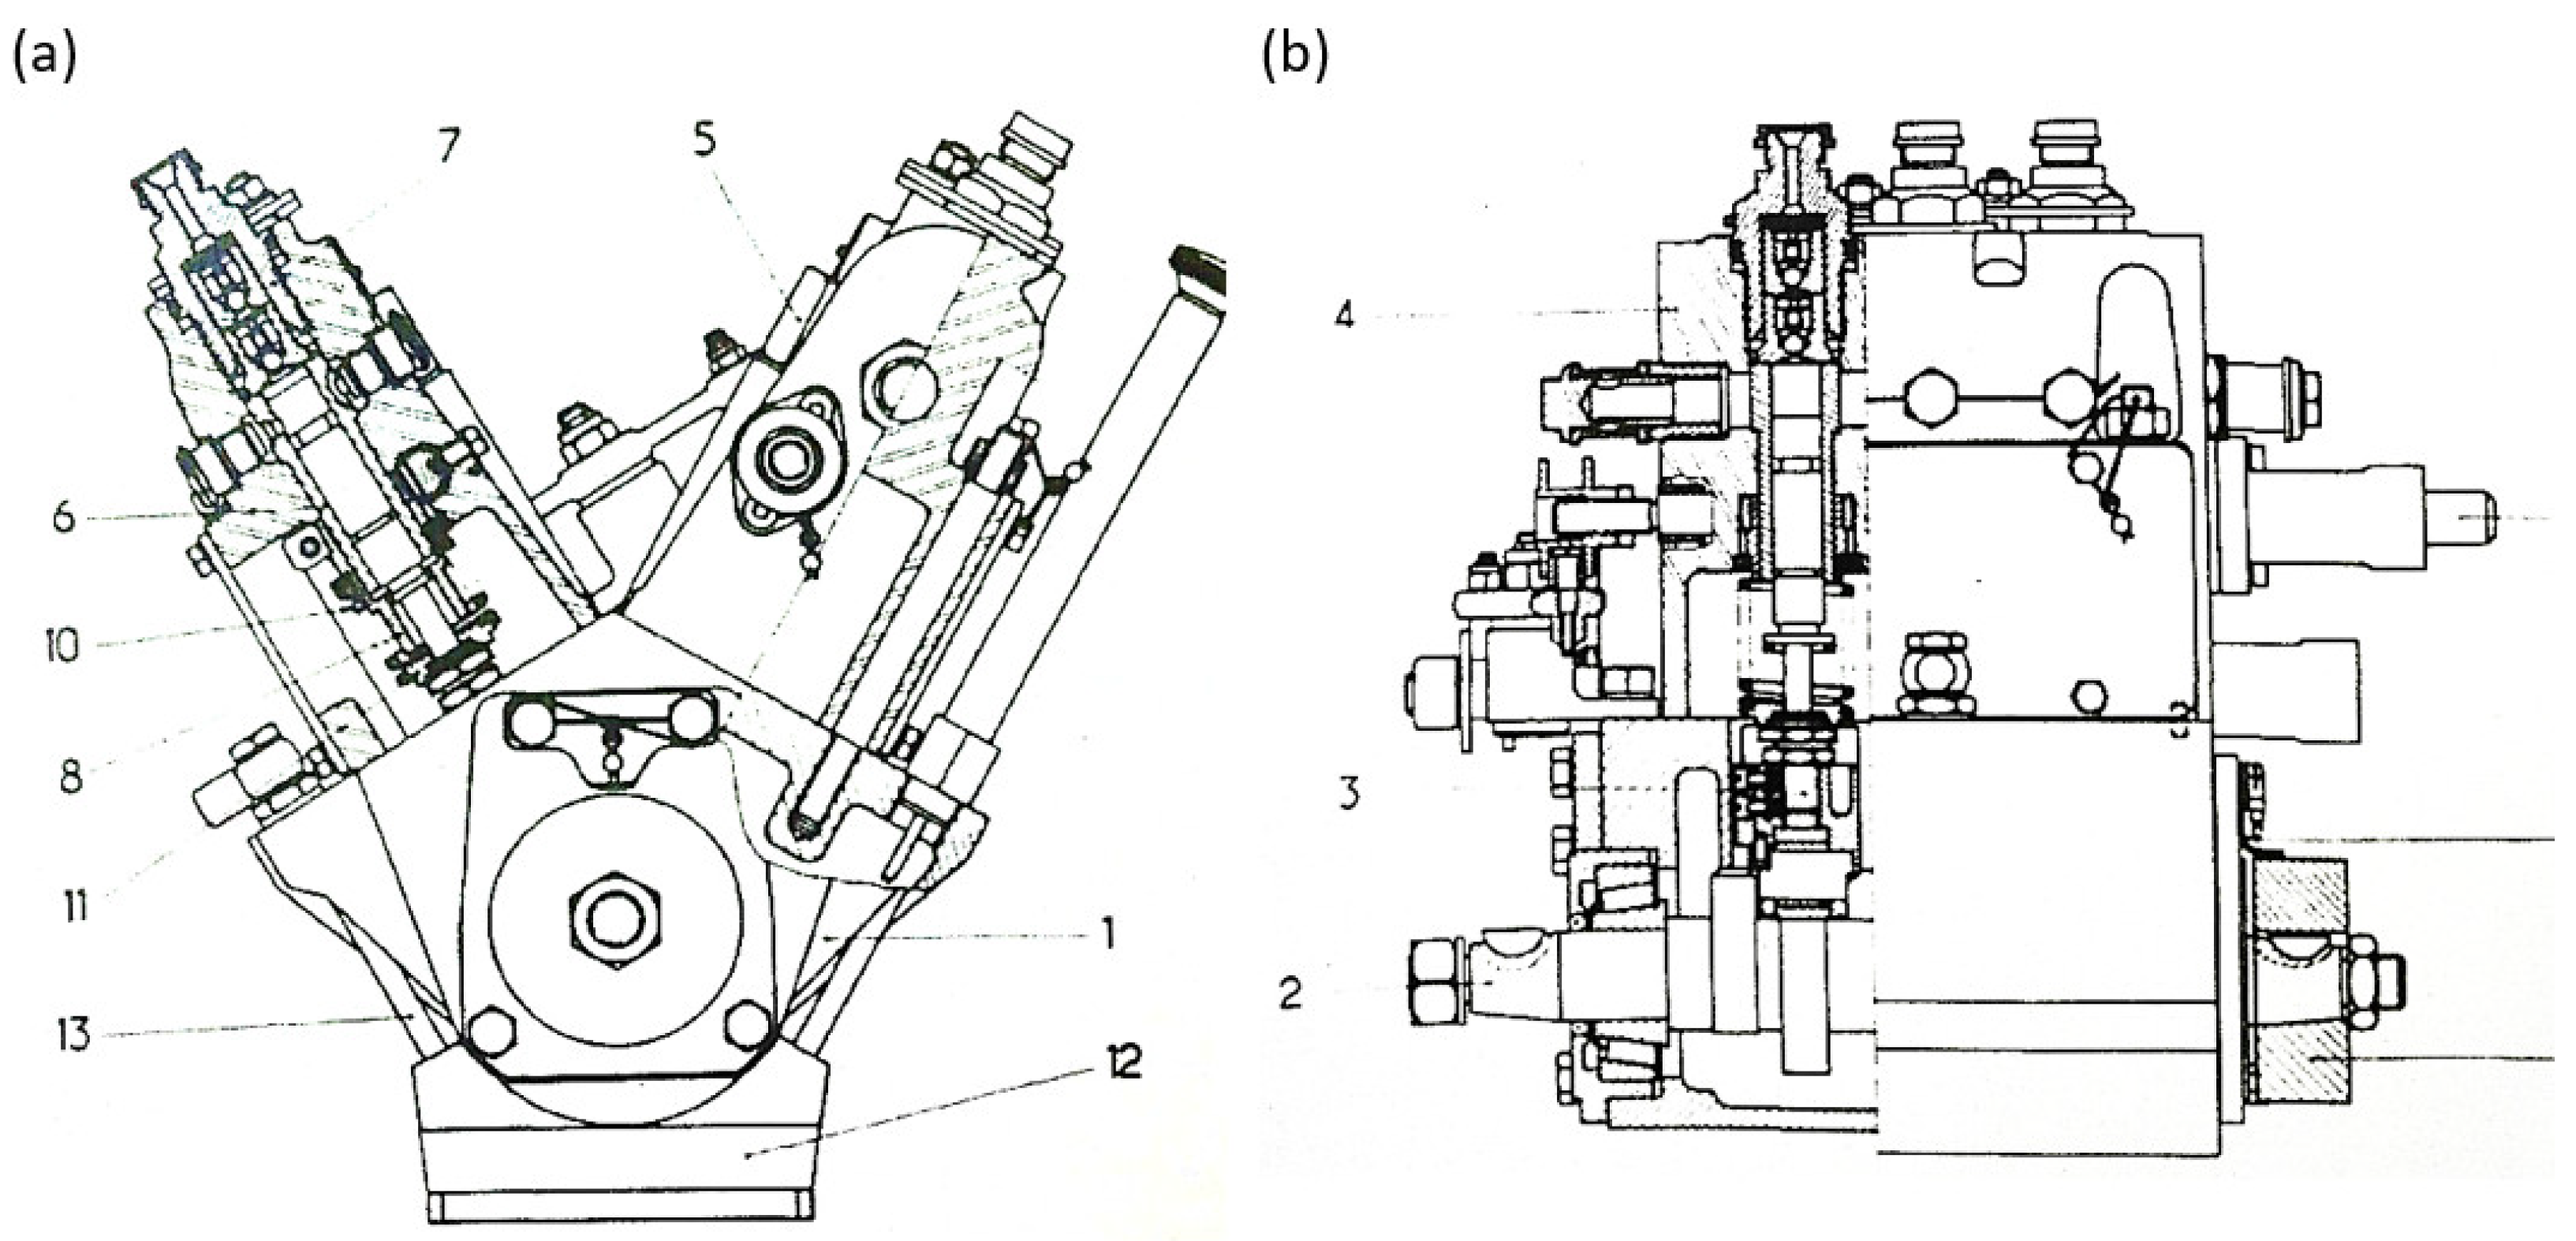
2.2. Research Object
2.3. Oil Samples
2.4. Laboratory Equipment Used for Oil Test
2.4.1. Density—Density/Specific Gravity Meter DA-640
2.4.2. Chemical Composition—Spectroil Q100
2.4.3. Viscosity—MARS Rheometer
2.4.4. Flash Point—ERAFLASH
3. Results and Discussion
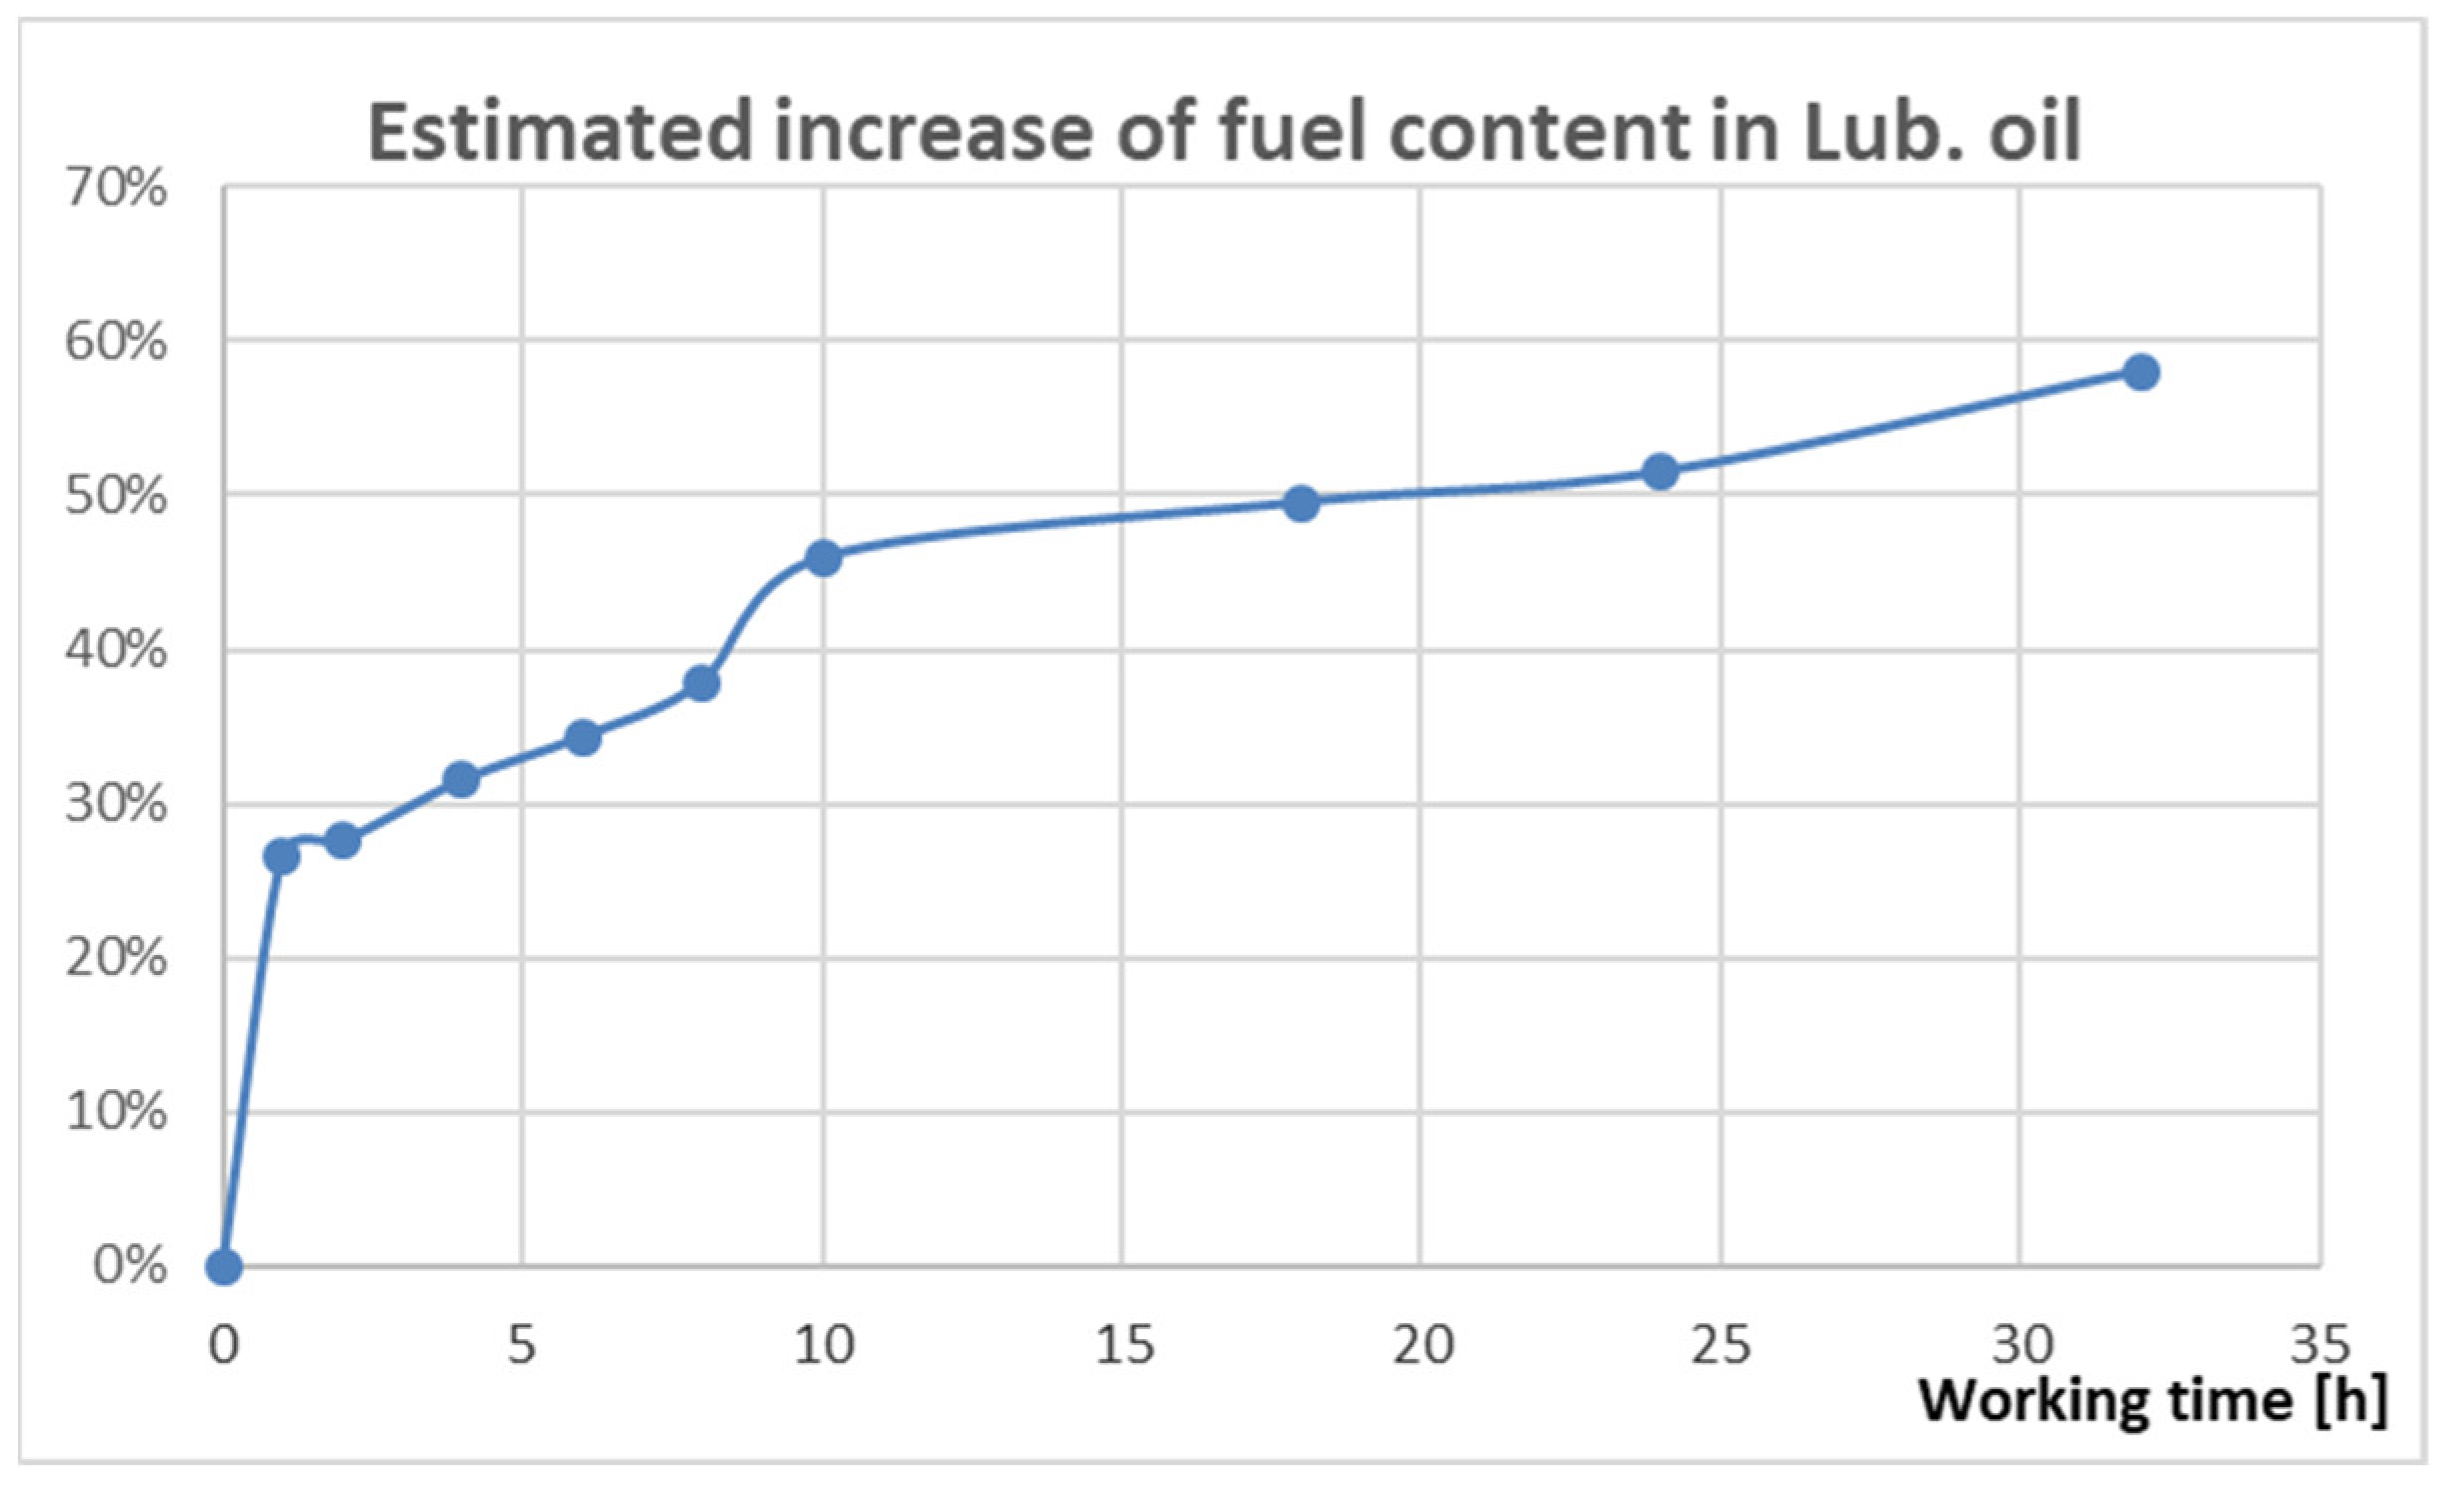
3.1. Density and Fuel Content in Oil
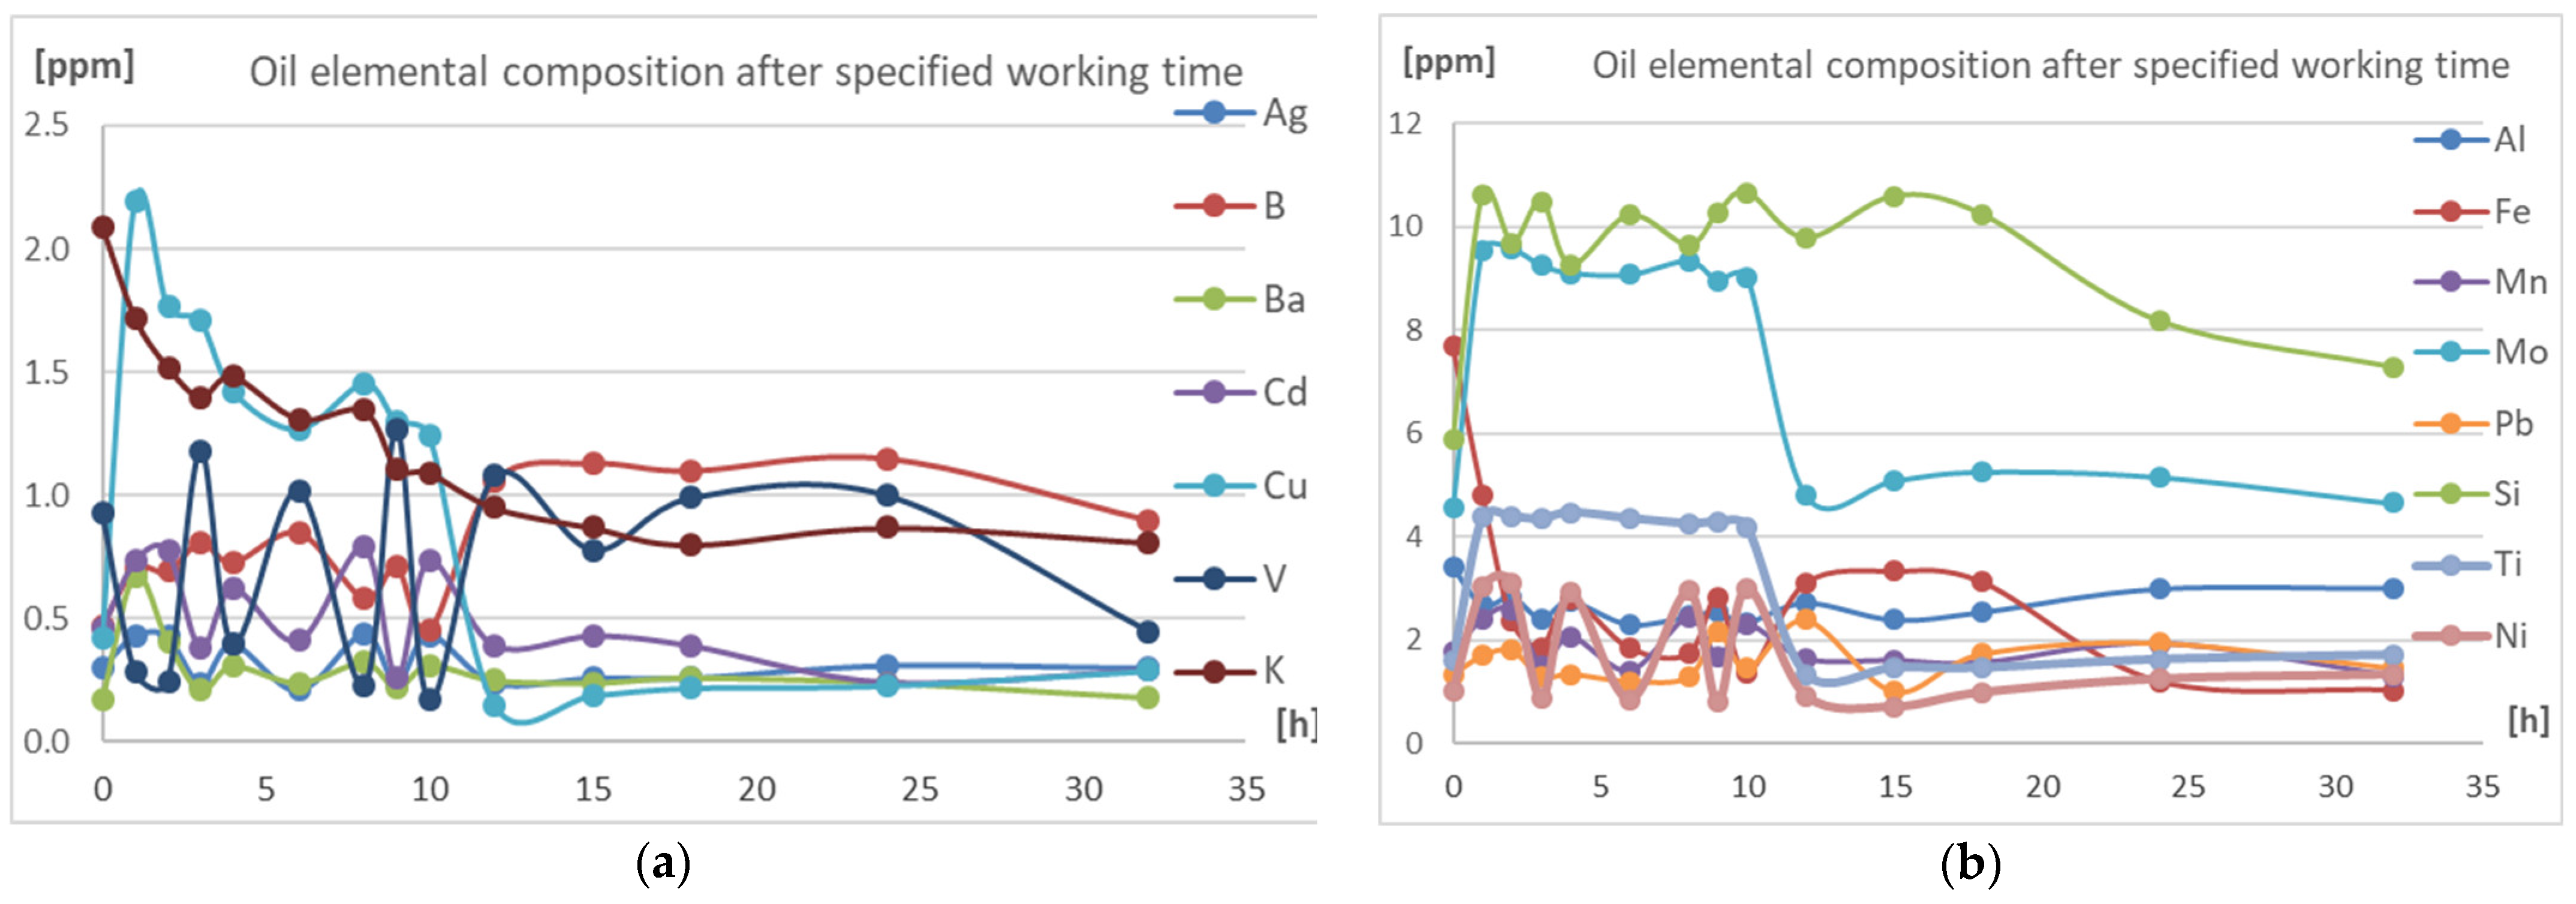
3.2. Spectroscopy
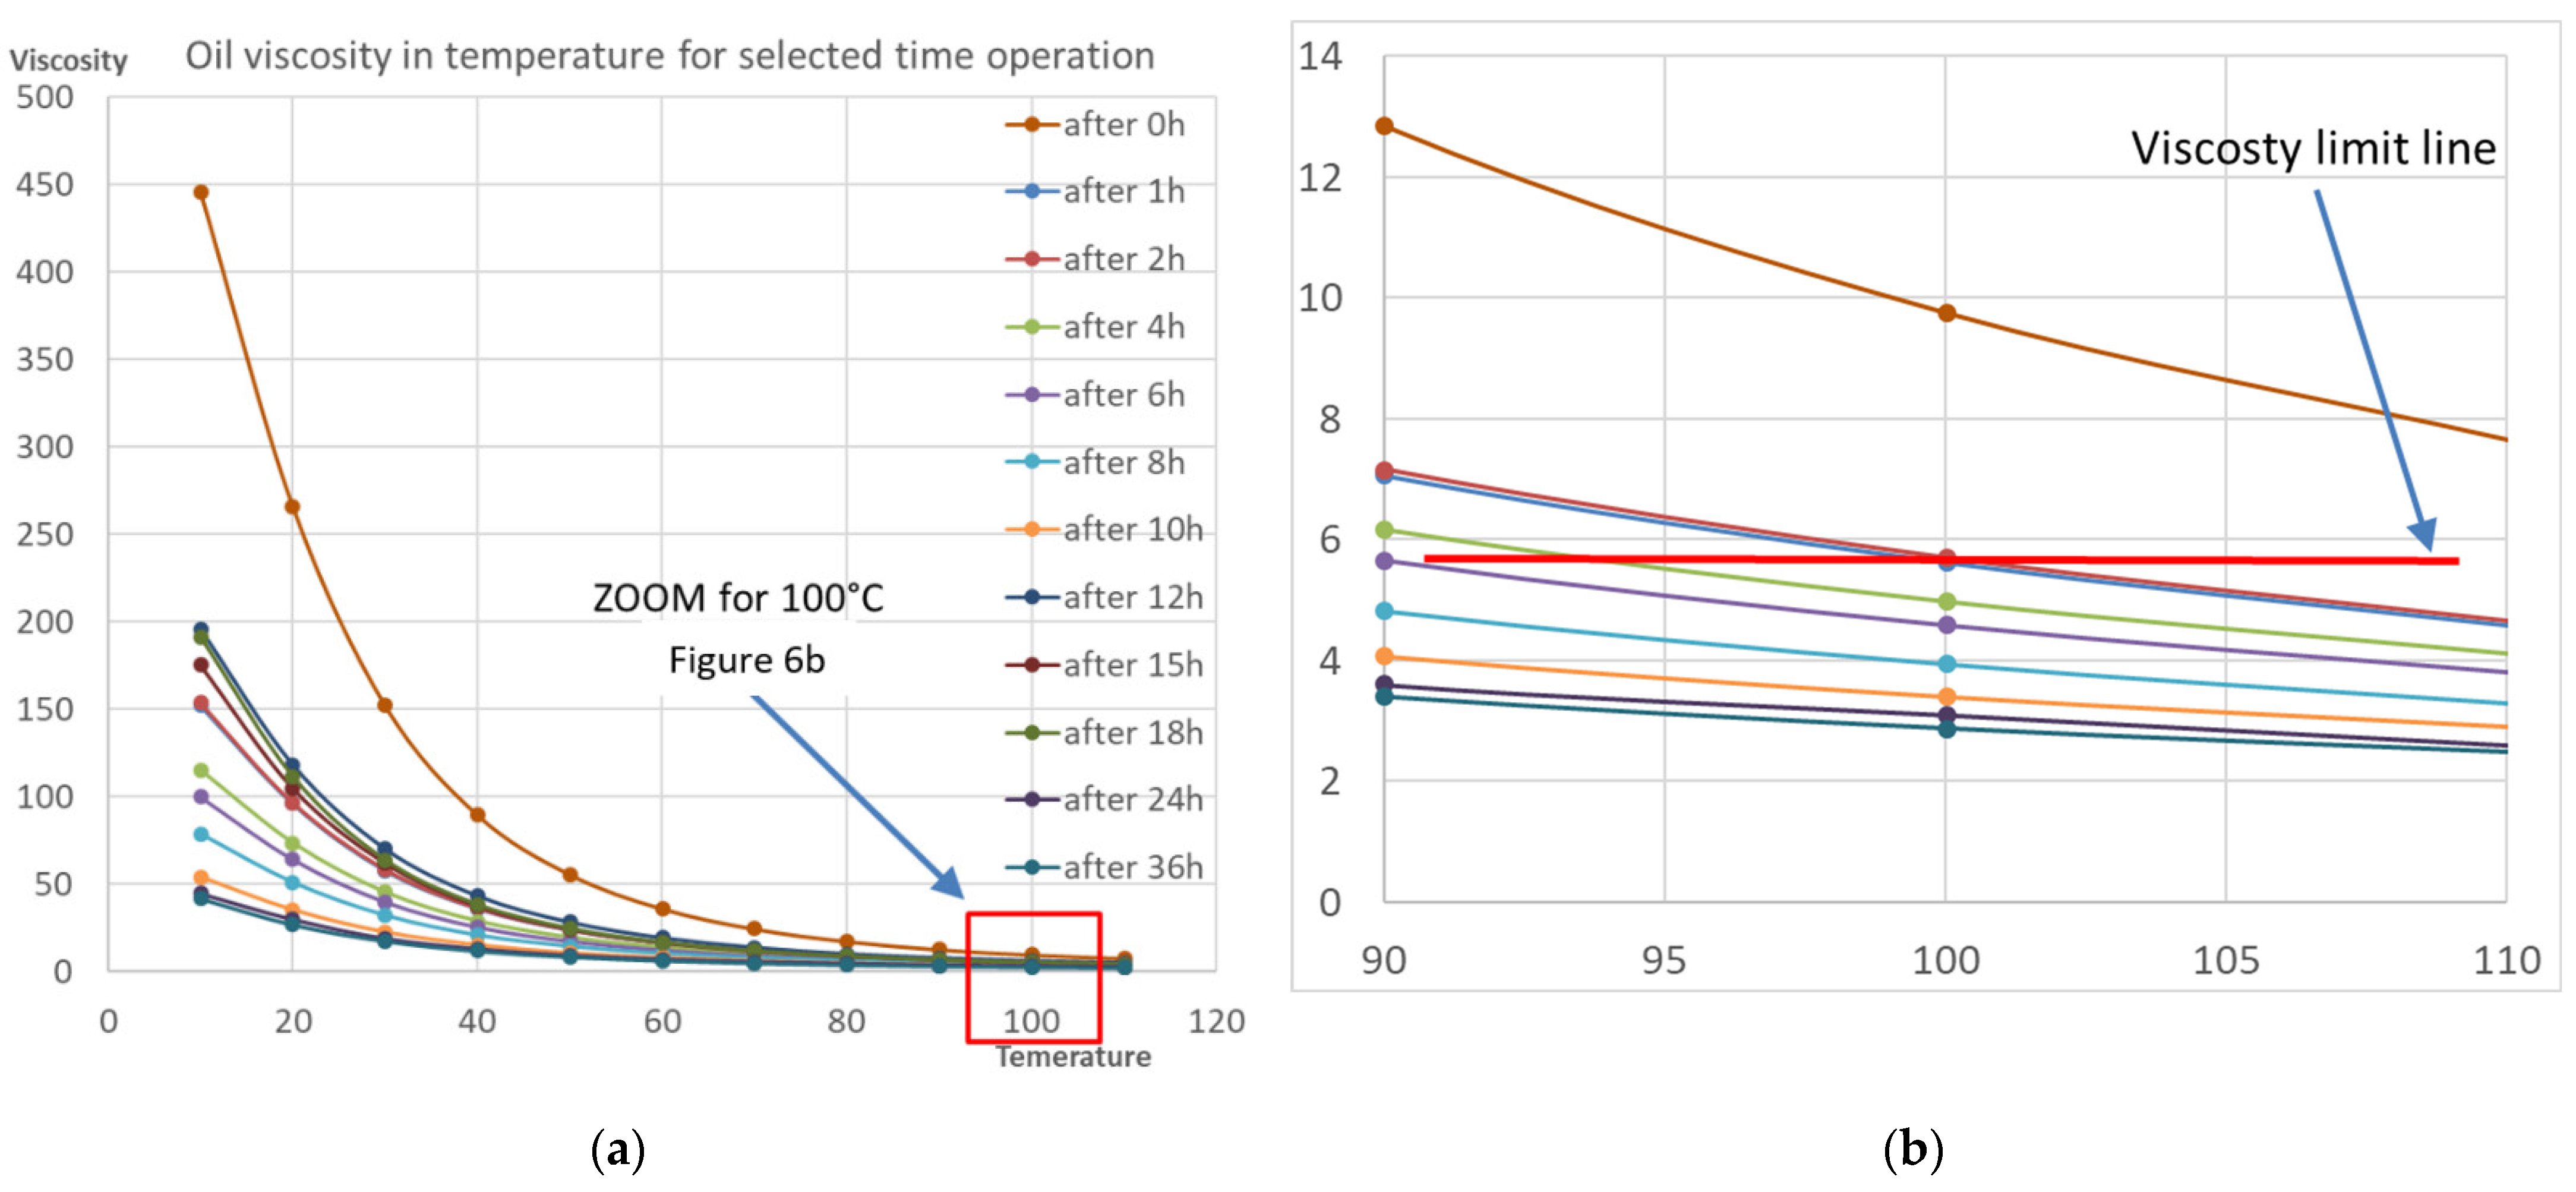
3.3. Viscosity
3.4. Flash Point
4. Summary
- The problem of the technical condition of the fuel injection pump,
- The change in the oil replacement strategy from 100 working hours (according to manufacturer recommendation) to a more frequent period (i.e., every 24 h),
- The change of the used oil into oil with a respectively higher viscosity.
Funding
Institutional Review Board Statement
Informed Consent Statement
Data Availability Statement
Conflicts of Interest
References
- Abril, S.O.; Rojas, J.P.; Flórez, E.N. Numerical Methodology for Determining the Energy Losses in Auxiliary Systems and Friction Processes Applied to Low Displacement Diesel Engines. Lubricants 2020, 8, 103. [Google Scholar] [CrossRef]
- Pérez, A.T.; Hadfield, M. Low-Cost Oil Quality Sensor Based on Changes in Complex Permittivity. Sensors 2011, 11, 10675–10690. [Google Scholar] [CrossRef] [PubMed]
- Hu, T.; Teng, H.; Luo, X.; Chen, B. Impact of Fuel Injection on Dilution of Engine Crankcase Oil for Turbocharged Gasoline Direct-Injection Engines. SAE Int. J. Engines 2015, 8, 1107–1116. [Google Scholar] [CrossRef]
- Splitter, D.; Burrows, B.; Lewis, S. Direct Measurement and Chemical Speciation of Top Ring Zone Liquid during Engine Operation; 2015-01–0741; SAE Technical Paper; SAE: Sydney, Australia, 2015. [Google Scholar] [CrossRef]
- Sejkorová, M.; Pokorny, J.; Jilek, P. The usage of modern instrumental methods in diagnostics of quality of operated engine oils. In Proceedings Deterioration, Dependability, and Diagnostics; University of Defence: Brno, Czech Republic, 2014. [Google Scholar]
- Wolak, A.; Zając, G.; Żółty, M. Changes of properties of engine oils diluted with diesel oil under real operating conditions. Combust. Engines 2018, 173, 34–40. [Google Scholar] [CrossRef]
- Urzędowska, W.; Stępień, Z. Wybrane zagadnienia dotyczące zmian właściwości silnikowego oleju smarowego w eksploatacji. Nafta-Gaz 2012, 12, 1102–1110. [Google Scholar]
- Ajayi, O.O.; Lorenzo-Martin, C.; Fenske, G.; Corlett, J.; Murphy, C.J.; Przesmitzki, S. Bioderived Fuel Blend Dilution of Marine Engine Oil and Impact on Friction and Wear Behavior. J. Tribol. 2015, 138, 021603. [Google Scholar] [CrossRef]
- Zhou, Y.; Li, W.; Stump, B.C.; Connatser, R.M.; Lazarevic, S.; Qu, J. Impact of Fuel Contents on Tribological Performance of PAO Base Oil and ZDDP. Lubricants 2018, 6, 79. [Google Scholar] [CrossRef] [Green Version]
- Khuong, L.S.; Masjuki, H.H.; Zulkifli, N.W.M.; Mohamad, E.N.; Kalam, M.A.; Alabdulkarem, A.; Arslan, A.; Mosarof, M.H.; Syahir, A.Z.; Jamshaid, M. Effect of gasoline–bioethanol blends on the properties and lubrication characteristics of commercial engine oil. RSC Adv. 2017, 7, 15005–15019. [Google Scholar] [CrossRef] [Green Version]
- Song, B.-H.; Choi, Y.-H. Investigation of variations of lubricating oil diluted by post-injected fuel for the regeneration of CDPF and its effects on engine wear. J. Mech. Sci. Technol. 2008, 22, 2526–2533. [Google Scholar] [CrossRef]
- Kral, J.; Konecny, B.; Madac, K.; Fedorko, G.; Molnar, V. Degradation and chemical change of longlife oils following intensive use in automobile engines. Measurement 2014, 50, 34–42. [Google Scholar] [CrossRef]
- Agoston, A.; Ötsch, C.; Jakoby, B. Viscosity sensors for engine oil condition monitoring—Application and interpretation of results. Sens. Actuators A Phys. 2005, 121, 327–332. [Google Scholar] [CrossRef]
- Fernández-Feal, M.; Sánchez-Fernández, L.R.; Pérez-Prado, J.R. Study of Metal Concentration in Lubricating Oil with Predictive Purposes. Curr. J. Appl. Sci. Technol. 2018, 27, 1–12. [Google Scholar] [CrossRef]
- Widman Internacional SRL. Available online: http://www.widman.biz (accessed on 25 March 2018).
- TPEO Engine Oil—Product Description and Application—Marinol RG1240. Available online: https://lotosoil.pl/upload/oil/import/17661_Marinol%20TPEO%20%2012_ed5_EN.pdf (accessed on 11 March 2022).
- Pielstick PA4 V185 Manual; French Societé d’Etudes de Machines Thermiques: Paris, France, 1975.
- Adem, G. Providing Eligibility Criteria on Turbocharger Filter Silencer Design Processes. J. ETA Marit. Sci. 2013, 1, 15–22. [Google Scholar]
- Density/Specific Gravity Meter DA-650/645/640. Available online: https://www.kem.kyoto/en/products/density/da6xx/# (accessed on 30 March 2022).
- SpectrOil Q100 Rotating Disc Electrode Optical Emission Spectrometer. Available online: https://aasystems.latimagespdfdescargasSpectroQ100.pdf (accessed on 14 March 2022).
- Haake-Mars-Rheometer-Brochure-623-2138. Available online: https://www.thermofisher.comdocument-connectdocument-connect.htmlurl=https%3A%2F%2Fassets.thermofisher.com%2FTFS-Assets%2FMSD%2Fbrochures%2Fhaake-mars-rheometer-brochure-623-2138.pdf (accessed on 14 March 2022).
- Flash Point Determination in Food, Flavors and Fragrances. Available online: https://eralytics.com/wp-content/uploads/2018_10_Eraflash-for-Flavors-and-Fragrances.pdf (accessed on 30 April 2022).
- SAE Viscosity Grades for Engine Oils. Available online: https://www.gofurthergofs.com/Portals/0/Assets/Knowledge/Whitepapers/SAE-Viscosity-Grades-for-Engine-Oils.pdf (accessed on 30 April 2022).
- ISO Viscosity Grades. Available online: https://www.machinerylubrication.com/Read/213/iso-viscosity-grades (accessed on 30 April 2022).


| Metal Component | Normal (ppm) | Abnormal (ppm) | Critical (ppm) |
|---|---|---|---|
| Aluminium Al | <20 | 20–30 | >30 |
| Chrome Cr | <10 | 10–25 | >25 |
| Copper Cu | <30 | 30–75 | >75 |
| Nickel Ni | <10 | 10–20 | >20 |
| Iron Fe | <100 | 100–200 | >200 |
| Sodium Na | <50 | 50–200 | >200 |
| Lead Pb | <30 | 30–75 | >75 |
| Tin Sn | <20 | 20–30 | >30 |
| Silicon Si | <20 | 20–50 | >50 |
| Properties | Test Methods | Unit | RG1240 |
|---|---|---|---|
| Kinematic viscosity at 100 °C | ASTM D 445 | mm2/s | 14.3 |
| Pour point | ASTM D 5950 | °C | −21 |
| Ignition temperature | PN-EN ISO 2592 | min | 255 |
| TBN base number | PN-ISO 3771 | mg KOH/g | 12 |
| Viscosity index | ASTM D 2270 | (-) | 98 |
| Corroding action Cu, 100 °C/24 h | PN-EN ISO 2160 | degree | 1 |
| Samples No. | 1 | 2 | 3 | 4 | 5 | 6 | 7 | 8 | 9 | 10 | 11 |
|---|---|---|---|---|---|---|---|---|---|---|---|
| Engine working time after start-up and oil change (h) | 0 | 1 | 2 | 4 | 6 | 8 | 10 | 12 | 18 | 24 | 36 |
| Engine working hours counter after last general repair (h) | - | 67 | s93 | 187 | 203 | 229 | 255 | 281 | 313 | 345 | 371 |
| Oil Working Period | at 15 °C | at 40 °C | at 60 °C | Fuel Oil Quantity | ||
|---|---|---|---|---|---|---|
| (g/cm3) | (g/cm3) | (g/cm3) | (kg) | (l) | (%) | |
| Fresh oil | 0.8886 | 0.8736 | 0.8616 | 0 | 0 | 0 |
| after 1 h | 0.8749 | 0.8658 | 0.8538 | 0.5708 | 0.6525 | 27 |
| after 2 h | 0.8744 | 0.8647 | 0.8523 | 0.5986 | 0.6846 | 28 |
| after 4 h | 0.8723 | 0.8643 | 0.852 | 0.7227 | 0.8285 | 32 |
| after 6 h | 0.8708 | 0.8639 | 0.8517 | 0.8194 | 0.9410 | 34 |
| after 8 h | 0.8689 | 0.8627 | 0.8504 | 0.9532 | 1.0970 | 38 |
| after 10 h | 0.8645 | 0.8611 | 0.8489 | 1.3226 | 1.5299 | 46 |
| after 18 h | 0.8625 | 0.8611 | 0.8489 | 1.5253 | 1.7685 | 50 |
| after 24 h | 0.8614 | 0.8528 | 0.8405 | 1.6485 | 1.9137 | 52 |
| after 32 h | 0.8577 | 0.8427 | 0.8307 | 2.1392 | 2.4941 | 58 |
| Chemical Element | Critical Level | Fresh Oil | Oil Samples Elemental Composition after Specified Working Time (h)—Mean Values of 3 Samples | |||||||
|---|---|---|---|---|---|---|---|---|---|---|
| --- | 0 | 1 | 2 | 3 | 4 | 6 | 8 | 9 | 10 | |
| (ppm) | (ppm) | (ppm) | (ppm) | (ppm) | (ppm) | (ppm) | (ppm) | (ppm) | (ppm) | |
| Al | >30 | 3.40 | 2.68 | 2.83 | 2.42 | 2.75 | 2.30 | 2.46 | 2.54 | 2.35 |
| Ca | 6278 | 6181 | 6131 | 4995 | 5037 | 4904 | 5089 | 4867 | 4649 | |
| Fe | >200 | 7.69 | 4.82 | 2.37 | 1.86 | 2.77 | 1.84 | 1.73 | 2.83 | 1.37 |
| Mg | 24.57 | 16.64 | 17.07 | 17 | 16 | 16 | 15 | 16 | 14 | |
| Na | >200 | 63.71 | 67.00 | 72.00 | 83 | 76 | 69 | 71 | 82 | 81 |
| P | 1230 | 819 | 836 | 759 | 776 | 651 | 598 | 599 | 631 | |
| Si | >50 | 5.89 | 10.62 | 9.69 | 10 | 9 | 10 | 8 | 10 | 7 |
| Zn | 1420 | 448 | 480 | 545 | 471 | 541 | 406 | 507 | 354 | |
| C | 200 | 206 | 207 | 226 | 186 | 237 | 194 | 208 | 184 | |
| Ag, B, Ba, Cd, Cu, Cr, K, Mn, Mo, Ni, Pb, Sn, Ti, V, H | Less than 1 ppm | |||||||||
| Chemical Element | Oil Samples Elemental Composition after Specified Working Time (h)—Mean Values of 3 Samples | Maximum and Minimum Value | Specific Max and Min (Deviation) | ||||||
|---|---|---|---|---|---|---|---|---|---|
| 12 | 15 | 18 | 24 | 36 | max | min | max/Fresh | min/Fresh | |
| (ppm) | (ppm) | (ppm) | (ppm) | (ppm) | (ppm) | (ppm) | (-) | (-) | |
| Al | 2.72 | 2.39 | 2.54 | 2.99 | 3.00 | 3.00 | 2.30 | −12% | −32% |
| Ca | 5135 | 4920 | 4874 | 4401 | 3862 | 6181 | 3862 | −2% | −38% |
| Fe | 3.11 | 3.33 | 3.12 | 1.20 | 1.03 | 4.82 | 1.03 | −37% | −87% |
| Mg | 17 | 17 | 16 | 14 | 12 | 17 | 12 | −31% | −53% |
| Na | 86 | 80 | 82 | 82 | 5 | 86 | 65 | 35% | 2% |
| P | 717 | 707 | 680 | 499 | 435 | 836 | 435 | −32% | −65% |
| Si | 9.78 | 10.59 | 10.23 | 8.17 | 9.27 | 11 | 10 | 80% | 13% |
| Zn | 500 | 502 | 490 | 467 | 424 | 545 | 354 | −62% | −75% |
| C | 201 | 220 | 214 | 228 | 225 | 237 | 184 | 18% | −8% |
| Ag, B, Ba, Cd, Cu, Cr, K, Mn, Mo, Ni, Pb, Sn, Ti, V, H | Less than 1 ppm | ---------- | Less than 5% | ||||||
| Engine Oil Working Time (h) | 0 | 1 | 2 | 4 | 6 | 8 | 10 | 12 | 18 | 24 | 36 |
|---|---|---|---|---|---|---|---|---|---|---|---|
| Oil kinematc viscosity (cSt at 40 °C) | 89.8 | 38.8 | 36.3 | 28.9 | 25.7 | 20.9 | 15.4 | 14.5 | 13.8 | 13.0 | 12.0 |
| Oil kinematc viscosity (cSt at 100 °C) | 9.8 | 5.6 | 5.7 | 5.0 | 4.6 | 3.9 | 3.4 | 3.3 | 3.2 | 3.1 | 2.9 |
| Marine Engine Manufacture | Max | Min | Min Determined for Tested Oil at 100 °C |
|---|---|---|---|
| (cSt) or (%) | (cSt) or (%) | (cSt) | |
| Daihatsu | +30% | −20% | 11.6 |
| Deutz-MWM | 11 or +25% | 9.0 | 9.0 |
| Krupp MaK | 130 at 40 °C | 80 at 40 °C | 5.6 |
| MAN B&W | 26.0 SAE * | 3.8–21.9 SAE * | 5.6 |
| S.E.M.T. Pielstick | 26.0 SAE * | 3.8–21.9 SAE * | 5.6 |
| MTU | +25% | 9.0 (SAE 30) | 9.0 |
| Wartsila | 19 | 11.5 | 11.5 |
| Sulzer | +30% | −20% | 11.6 |
| Yanmar | +30% | −20% | 11.6 |
Publisher’s Note: MDPI stays neutral with regard to jurisdictional claims in published maps and institutional affiliations. |
© 2022 by the author. Licensee MDPI, Basel, Switzerland. This article is an open access article distributed under the terms and conditions of the Creative Commons Attribution (CC BY) license (https://creativecommons.org/licenses/by/4.0/).
Share and Cite
Kaminski, P. Experimental Investigation into the Effects of Fuel Dilution on the Change in Chemical Properties of Lubricating Oil Used in Fuel Injection Pump of Pielstick PA4 V185 Marine Diesel Engine. Lubricants 2022, 10, 162. https://doi.org/10.3390/lubricants10070162
Kaminski P. Experimental Investigation into the Effects of Fuel Dilution on the Change in Chemical Properties of Lubricating Oil Used in Fuel Injection Pump of Pielstick PA4 V185 Marine Diesel Engine. Lubricants. 2022; 10(7):162. https://doi.org/10.3390/lubricants10070162
Chicago/Turabian StyleKaminski, Piotr. 2022. "Experimental Investigation into the Effects of Fuel Dilution on the Change in Chemical Properties of Lubricating Oil Used in Fuel Injection Pump of Pielstick PA4 V185 Marine Diesel Engine" Lubricants 10, no. 7: 162. https://doi.org/10.3390/lubricants10070162
APA StyleKaminski, P. (2022). Experimental Investigation into the Effects of Fuel Dilution on the Change in Chemical Properties of Lubricating Oil Used in Fuel Injection Pump of Pielstick PA4 V185 Marine Diesel Engine. Lubricants, 10(7), 162. https://doi.org/10.3390/lubricants10070162