1. Introduction
The coefficient of friction (COF) is one of the most important parameters to evaluate the performance of a brake system. This latter is mainly composed of a rotating disc, two friction pads and their backplates, two or more pistons and a caliper. A frictional force is generated between the disc rotor and two pads to slow down a vehicle, since one or more pistons are moved against the backplates by the brake fluid running in the caliper pipes. The braking force shows a strong dependence on the COF, which is influenced by the evolution of the contact status between the disc and the pads; local contact pressure, slip rate and temperature play a key role in modifying the contact interface, and they have a relevant influence on the COF evolution during brake events [
1,
2,
3,
4,
5,
6,
7].
Pads-to-disc contact has been experimentally studied by several authors [
8,
9,
10,
11,
12] to explain the difference between primary and secondary plateaus: the first ones are basically metal fibers and/or hard particles which support most of the load, while secondary plateaus are generated from the wear particles, coming from both the disc and the pad, filling the gaps between the primary plateaus, and stacking up against them [
8]. Riva et al. [
9,
10] discussed the influence of the plateaus’ formation process on the contact area and the effects of the secondary plateaus on COF and contact pressure. Ostermeyer [
11] also showed the existence of primary plateaus and explained the wear as a result of a continuous process of growth and destruction of hard patches on the pads-to-disc contact interface. He focused on how microscopic processes on the contact surface have an influence on the macroscopic COF and wear of the brake system. On a nanoscopic scale, Österle et al. [
12] conducted an experiment consisting of scanning a used pad surface, showing the presence of a third layer made of all the ingredients in the friction pad material mixture and iron oxides from the disc.
To replicate different real phenomena occurring during a brake event, several simulations have been developed. A Computational Fluid Dynamics (CFD) approach is used to better understand the cooling of a brake system [
13,
14,
15]. Finite Element Analysis (FEA) is used to estimate the contact pressure and to evaluate deformations and displacements of the entire structure [
16]. This approach has also been used to estimate the wear amount and to describe the contact pressure distribution on the pad surface [
17,
18,
19]. In addition, Riva et al. [
10] used FEA combined with a COF
pv-map to compute the global COF. The local COF is estimated from a
pv-map for each local slip rate and contact pressure determined by the FEA. Knowing the local COF, the braking force of the entire brake system and the global COF are evaluated. Other authors used the FEA approach to investigate the airborne particle emissions [
19,
20,
21].
Since FEA is able to describe phenomena only occurring in a size scale of millimeters, Cellular Automaton (CA) simulations have been developed to better understand the formation and the destruction of plateaus; in fact, this process takes place in a size scale of 50–500 µm [
22], and for this reason several authors discussed CA approaches to analyze the pads-to-disc contact in a mesoscopic scale [
23,
24,
25,
26,
27,
28,
29]. Starting from the experimental results of Kumar and Bijwe [
30], Varriale et al. [
31] conducted a CA simulation taking the single ingredients of a friction pad material mixture into account to estimate the global COF of a brake system under specific braking conditions. In this study, friction
pv-maps for every component of the friction material compound have been implemented in the simulation model. Several authors also used another approach named Moving Cellular Automaton (MCA) to better investigate phenomena such as third layer formation, particle flow and tribo-film; nano-scale simulations based on this theory have been developed to reach this goal [
32,
33,
34,
35].
Focusing on friction maps generation, Wahlström et al. [
5] conducted several tests using a pin-on-disc tribometer to obtain a COF
pv map from a low-metallic/cast-iron disc brake contact pair. In addition, a
pv map of the specific wear rate of the pin friction material and the rotor disc was also obtained; a
pv map of the particle emission has also been investigated. These maps can be used in the very early design phase of the friction material pad because they help to understand how friction material pads work under specific load conditions. Friction maps generated with pin on disc tribometers can be also used as inputs for simulation models, from FEA to CA approaches. Candeo et al. [
36] executed several experimental tests for a copper-free brake friction material using a subscale dynamometer;
pv maps of the friction coefficient, together with maximum disc temperature and deceleration, have been used to compare the performance of three different surface scorching conditions of the same brake pad compound. Wahlström [
37] also generated a COF
pv-map at low contact pressures and low sliding speeds to develop a friction model used as input for simulation tools having as aim the prediction of the stick–slip phenomena for disc brakes which occurs at very low vehicle speeds and torques. A low-metallic pad and gray cast iron have been investigated to generate the COF map. It is noted that COF values increase with a decrease in both contact pressure and sliding speed.
Focusing on the simulations developed to evaluate the COF of a brake system under brake events, several models have been discussed by different authors [
38,
39]. Szczypinski-Sala and Dobaj [
38] conducted research to estimate the COF between brake pads-to-disc surfaces, taking the influence of external conditions into account. They started with an experimental test campaign on a real vehicle, and then the results coming from a neural network-based simulation were compared with the experimental measurements, showing that this approach can be used to estimate mean values of COF under different working conditions. Sawczuk et al. [
39] developed a multiple regression model based on several brake bench tests to estimate the average friction coefficient and the instantaneous friction coefficient of a disc brake for railway applications. The model takes three types of variables into account: input braking parameters such as speed, pressure, and mass to be braked; the wear of the brake disc and on the friction linings; and design parameters such as the holes on the brake disc surface. Simulated results showed a good fit with the experimental observations.
Developing simulation tools to predict the performance of a brake system estimating its COF under different working conditions could be important for braking companies, avoiding in this way onerous and time-consuming experimental tests. A large part of the simulation models starts from full-scale experimental bench tests or from the execution of tests on a real vehicle, as the abovementioned articles report [
38,
39]. There is a lack of simulation approaches in literature whose inputs come from reduced scaled bench tests and that are based on a characterization of the friction pad–disc rotor contact pair.
The aim of this work is to develop a simulation tool capable of predicting the average COF and its evolution during brake events querying contact pressure-slip rate-temperature (pvT) friction maps generated executing experimental tests on a subscale dynamometer. Friction maps are representative of the specific friction pad–rotor disc contact pair and they are independent of the brake system geometry. This allows the simulation tool to be able to predict the performance of different brake system layouts with the same friction pad–rotor disc contact pair previously tested on the subscale dynamometer.
2. Simulation Approach
The purpose of the simulation tool is to estimate the global COF of a brake system under different working conditions and to verify the possibility of using a subscale dynamometer to obtain a tribological characterization of a brake disc–friction pad contact pair. This is achieved by querying 3D friction
pvT-maps with
pvT values from braking cycles to simulate as input parameters. Three-dimensional friction maps play a key role in the simulation process since they characterize the behavior of the friction pad and disc rotor materials in terms of COF. An overview of the simulation structure is reported in
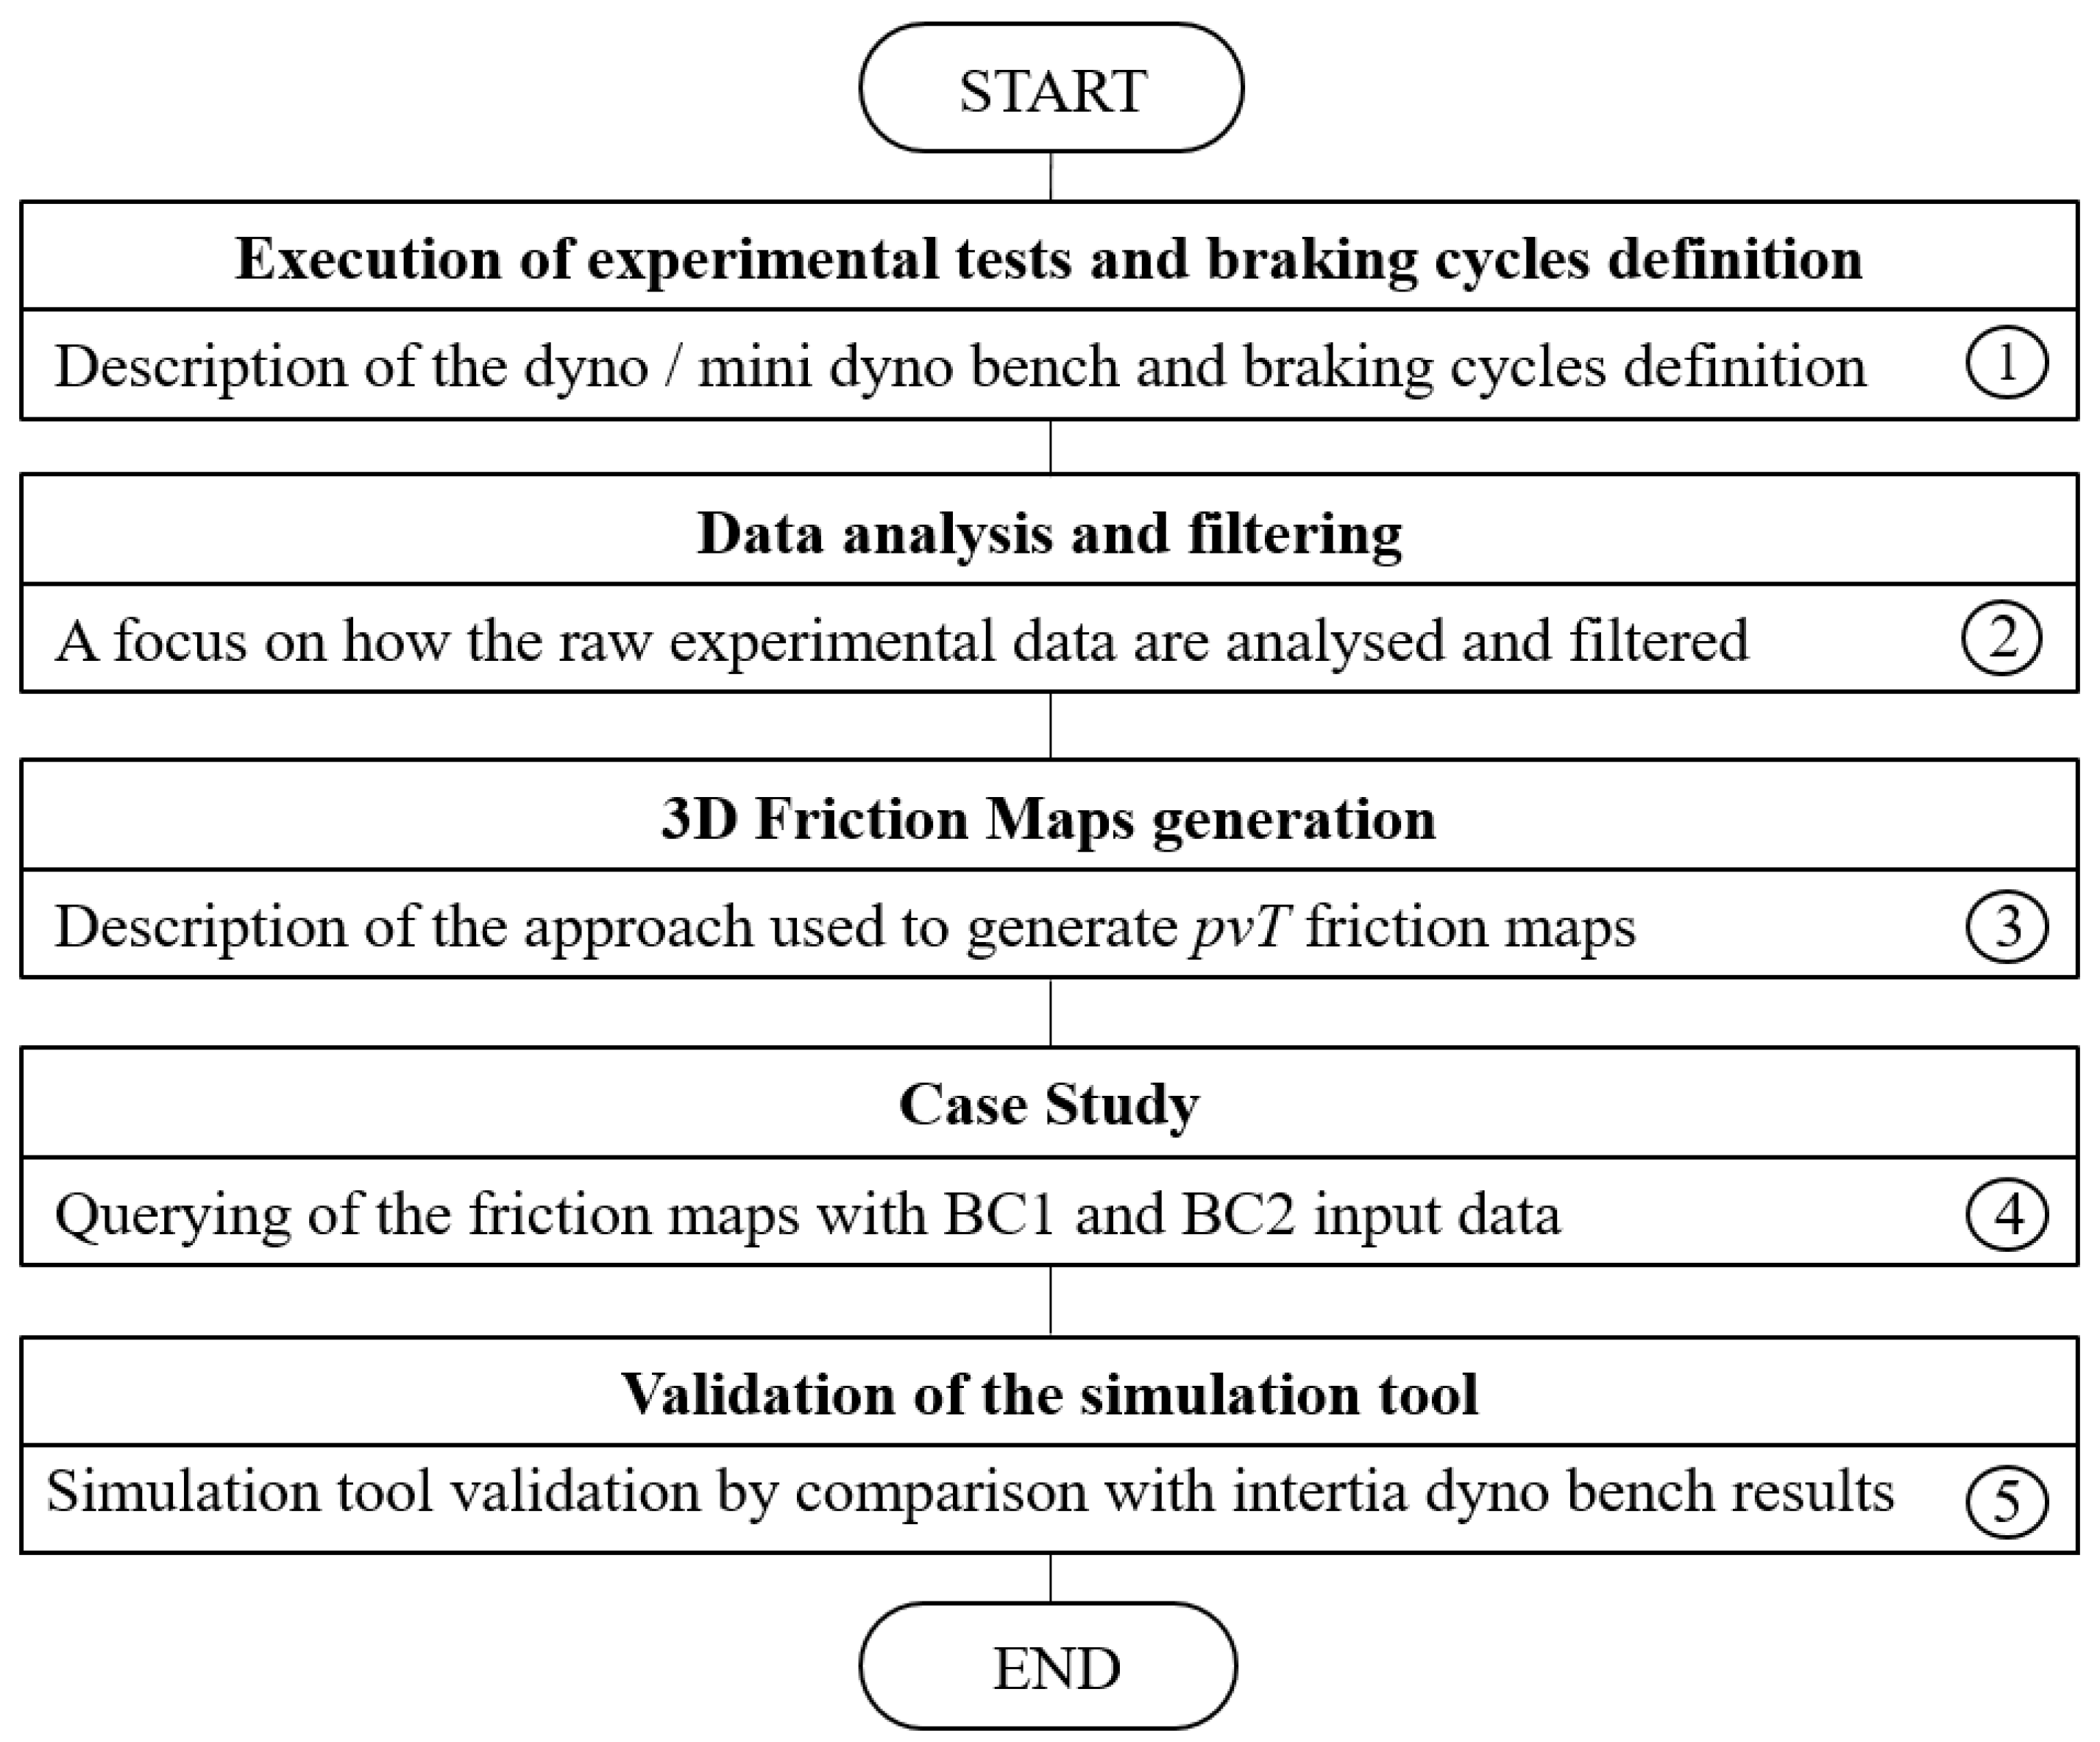
Figure 1: raw data are generated from a subscale dynamometer (LINK model 1200) (box-1), described in detail in [
36], which replicates braking cycles performed on the full-scale inertia dyno bench. Secondary raw data are analyzed and filtered using the commercial software Matlab (ver. R2018b, MathWorks, Natick, MA, USA) (box-2), and then 3D friction maps are generated using a median filtering with piecewise linear approach in order to obtain more discrete data. In this way, they can be easily queried by the input parameters (box-3). Once friction maps are obtained,
pvT values from two different braking cycles are used to query them. A brake system of a D-segment car with a gray cast iron brake disc and a low-metallic friction pad material have been tested on the full-scale dyno bench to generate the reference experimental COF (box-4). Finally, these results are compared with the simulated ones to validate the numerical model (box-5). A detailed description of each box is reported in the following subsections.
2.1. Execution of Experimental Tests and Braking Cycles Definition
Experimental tests were executed both on a full-scale inertia dyno bench, described in detail in [
31], and on a subscale dynamometer. Two different braking cycles (BC1 and BC2) have been performed on the full-scale dyno bench and some of their outputs are used as inputs for the numerical model. These two have been replicated on the reduced scale dyno bench; in addition, a wider braking cycle (BC3) has been performed on the subscale dynamometer. All the cycles executed on the mini dyno have the purpose to generate data for the creation of the 3D friction maps. The number of brake events for each series, together with the two different inertia values used for the execution of BC1-BC2 and BC3, are summarized in
Table 1. On which dyno bench the braking cycles have been performed has also been reported. It is important to remark that the amount of braking reported in the table has not taken run-in phase braking into account. It refers only to the ones suitable for the investigation. Brake events have been performed in a range of 5 km/h to 200 km/h of linear velocity of the vehicle, 10 bar to 180 bar of braking pressure and 50 °C to 750 °C of initial brake disc temperature.
2.1.1. Full-Scale Dyno Bench Tests
Dyno bench tests are executed on the inertia dyno bench described in [
31] with a D-segment passenger car brake system, whose main parameters are reported in
Table 2. A commercial low-metallic friction material and a grey cast iron disc have been adopted for this study.
To guarantee a constant braking torque, brake cylinder pressure, controlled by an actuator, is regulated by a torque feedback signal. Dyno bench ensures a ventilation to cool down the brake system temperature. The disc temperature is measured in real time during testing by a thermocouple of type K; it is installed on the external surface of the brake disc, and it is positioned to make a hole on the rotor surface. The main output of the experimental tests is the evolution of the COF during brake events that will be compared to the simulation trends. Brake disc temperature, brake pressure and velocity signals of the full-scale dyno bench tests are the input parameters of the numerical model.
2.1.2. Reduced Scale Dyno Bench Tests
BC1 and BC2 have been replicated, and a wider BC3 has been performed on the subscale dynamometer, whose detailed description is reported in [
36]. To simulate a real brake system, a disc rotor and two friction samples mounted 180° spaced have been considered. Brake disc and friction pad materials are the same as those used in the full-scale dyno bench. A single piston, acting as one or more pistons in the real brake system, generates the normal force. The latter is controlled, together with the brake torque (torque control mode) or the desired pressure (pressure control mode), in a closed loop feedback to maintain the target values. The disc temperature is monitored with a thermocouple installed at the effective radius on the brake disc surface in the same way as for the full bench dyno tests; each braking starts once the selected temperature is reached. Brake pressure, angular velocity and inertia have been scaled via mechanical laws to guarantee the same contact pressure, slip rate at effective radius and brake energy of the real brake system. Geometrical main parameters of the disc rotor and friction pads are summarized in
Table 3.
The most important output of the subscale dyno bench is the evolution of COF during the brake events starting from the brake torque parameter. From the latter, it is possible to evaluate the tangential frictional force and the COF as a consequence, knowing the normal force. Contact pressure is calculated by dividing the force signal by the friction pads area. Contact pressure, slip rate, disc temperature and COF data from these tests are used to generate the 3D friction maps.
2.2. Data Analysis and Filtering
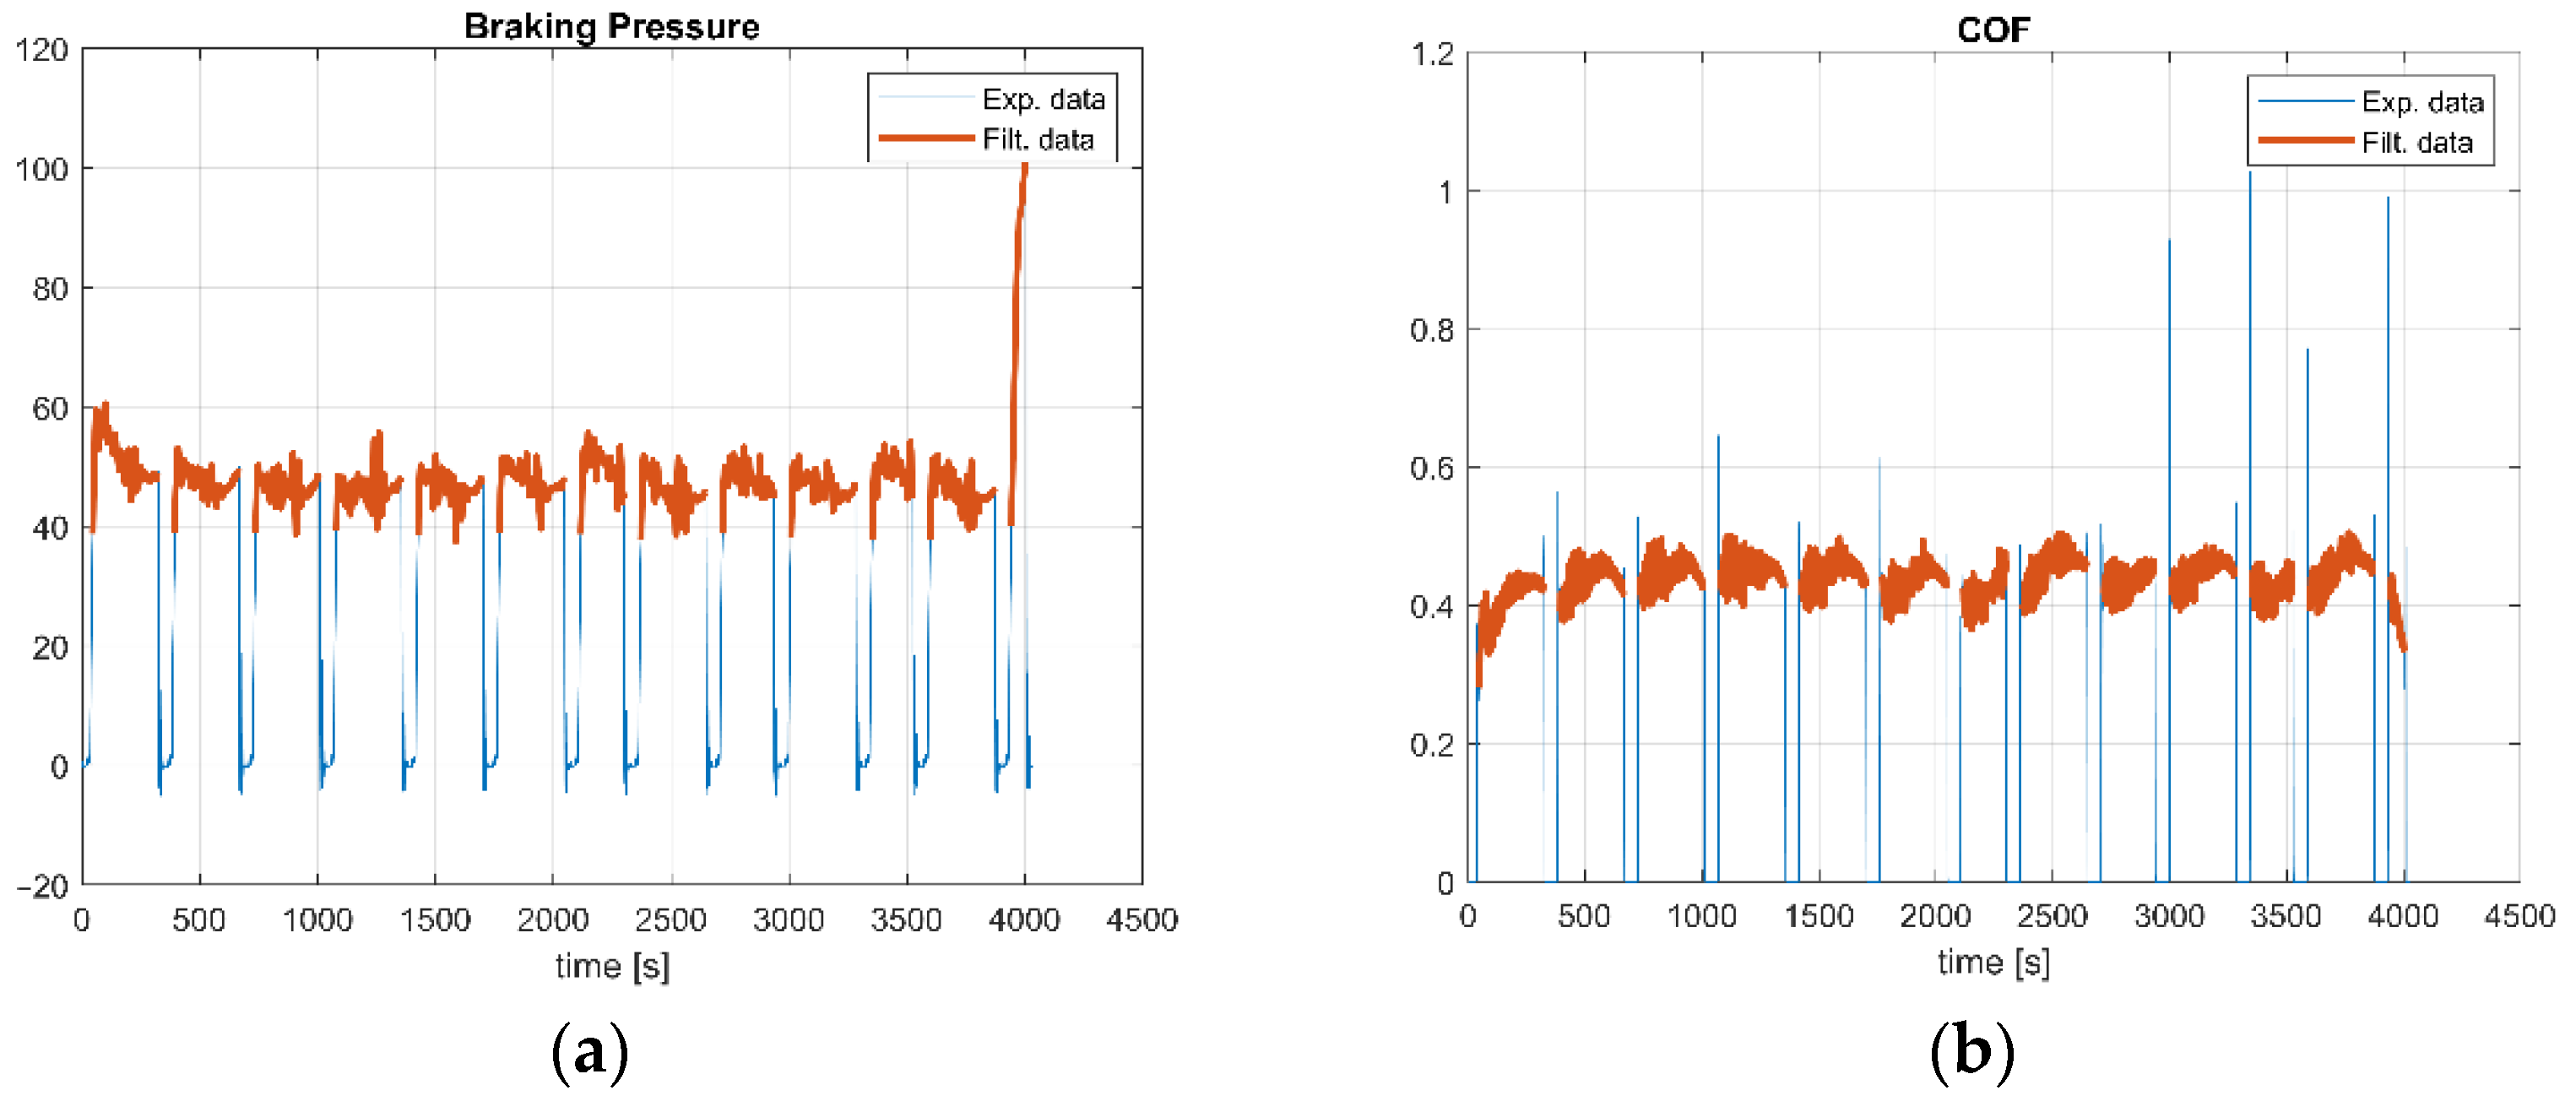
Both raw data from the full-scale dyno bench and the mini dyno are analyzed and filtered using the commercial software, Matlab. The principle behind this step is to obtain data concerning the physics of the phenomena: only values of brake system pressure (and so contact pressure), linear velocity of the vehicle (and so slip rate), disc rotor temperature and COF belonging to real brake events have been considered. It means that only values corresponding to the target braking pressure scheduled in the braking cycle definition have been considered. An example is shown in
Figure 2, where in orange filtered data and in blue the raw data regarding braking pressure and COF are represented.
2.3. 3D Friction Maps Generation
Friction maps are the core input of the methodology, since they return COF values once queried by the simulation tool. Friction maps show COF as a function of contact pressure, slip rate and brake disc temperature. To validate their generation process and the simulation procedure, two friction maps have been generated from full-scale dyno bench experimental data and then queried with the same input parameters from which they are generated. They are named fm1 and fm2. The other 3D friction maps generated from reduced-scale dyno bench data are summarized in
Table 4. Numbers from 1 to 3 and capital letters have been assigned to better identify them.
A median filtering with a piecewise linear approach has been used to obtain more discrete friction maps avoiding the presence of different COF values for the same
pvT conditions. It consists of averaging the contact pressure, slip rate, disc temperature and COF values of N points, creating one point in the new friction map. The process is reported in
Figure 3.
This procedure has been implemented using the commercial software Matlab and it takes a maximum of 5 min of running time. In general, it depends on how much data are generated from experimental tests.
2.4. Case Study
Pressure, velocity and disc temperature signals from full-scale dyno bench tests about BC1 and BC2 have been used as inputs for the numerical simulation to query the three different 3D friction maps obtained from the reduced scale dyno bench FM1, FM2 and FM3. The predicted COF values have been compared with the experimental results.
The first step is a preliminary verification of the 3D generation process and simulation tool. This simulation has been run to be certain the simulation procedure does not introduce any errors in the estimation of the COF; it has been conducted querying fm1 and fm2 with BC1 and BC2 input parameters, respectively. Then, different simulations have been run to verify the possibility of using 3D friction pvT-maps created by filtering results of material tests conducted in a mini-dyno inertia bench to estimate the COF of a disc brake system under different driving conditions; FM1 and FM2 have been queried with BC1 and BC2 parameters, respectively; these last have been also used to query the wider FM3.
In addition, the median COF values have also been evaluated and compared to the ones evaluated from the experimental results.
All simulation runs have a maximum of 5 min of running time. The higher the number of data to be processed, the longer the duration of the simulation.
3. Results
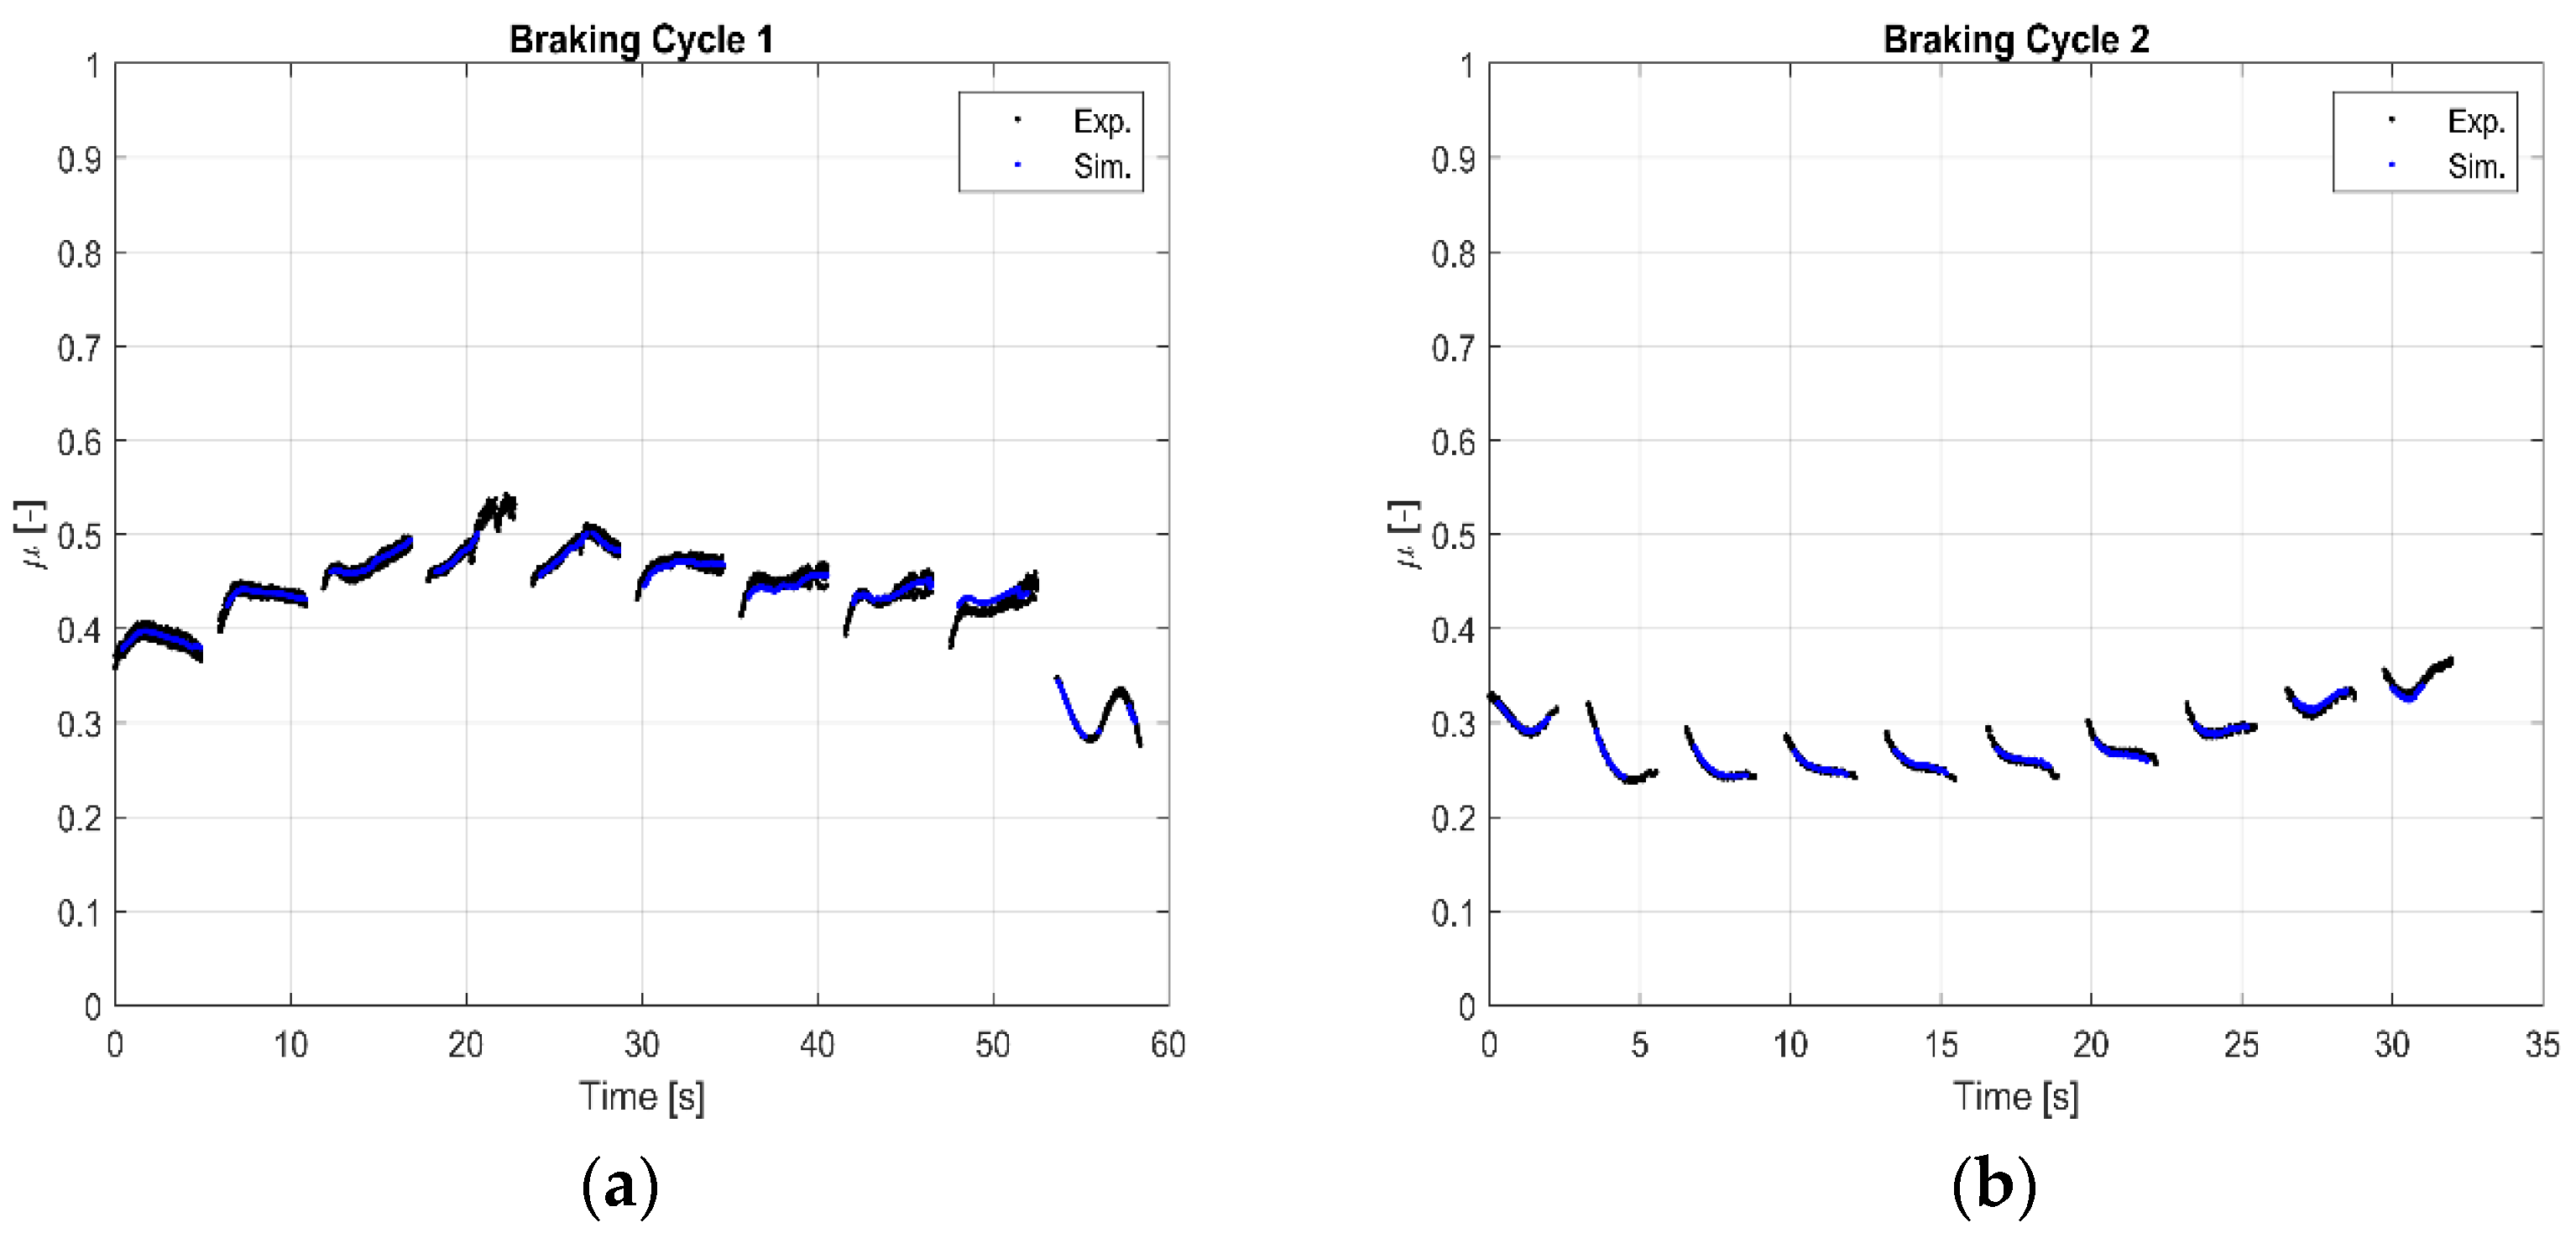
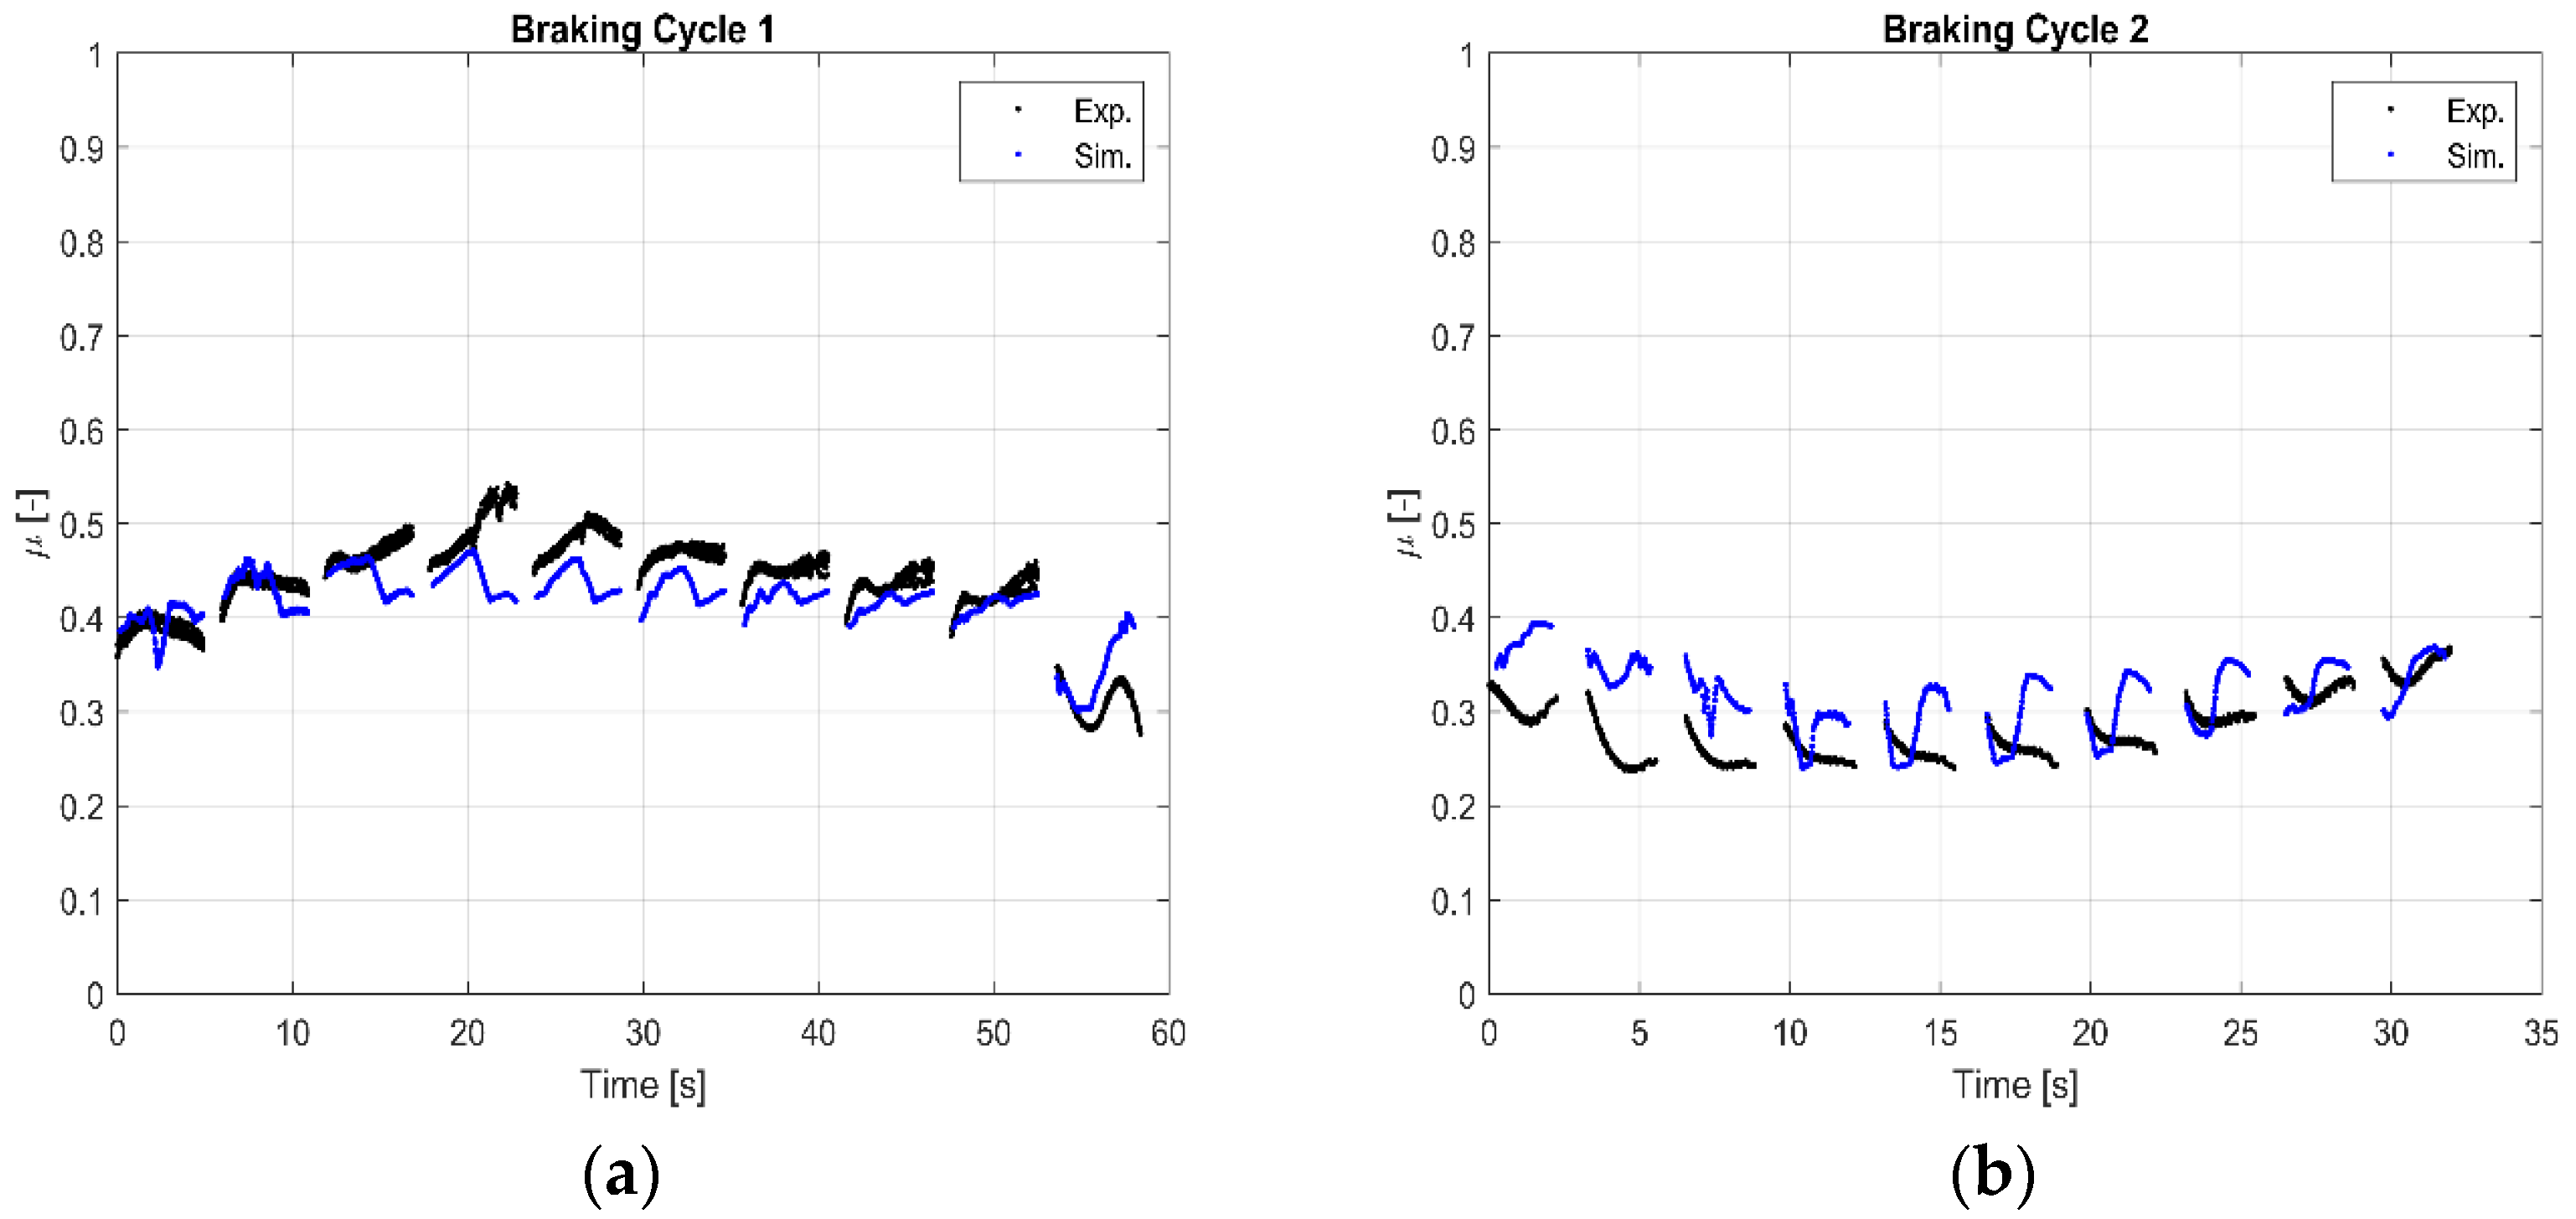
As discussed above, a preliminary comparison between experimental and simulated results to verify the response of the virtual model is reported. Pressure, linear velocity of the vehicle and disc temperature signals from full-scale dyno bench tests about BC1 and BC2 have been considered as inputs for the numerical model; the first two parameters have been previously converted in contact pressure and slip rate at the effective radius. Friction maps generated with BC1 and BC2 tests executed at the full-scale dyno bench have been queried with the abovementioned input parameters. The simulated COF evolutions during BC1 and BC2 and the experimental results are reported in
Figure 4.
It is noted that the simulation model and the 3D friction map generation process do not introduce any errors in the virtual estimation of the COF. In some brake events, there are no simulated COF values because the process of the friction map generation can reduce the number of the points to be queried. It was decided not to use extrapolation methods to avoid results too far from the working conditions of a real brake system.
Once the quality of the simulation tool has been verified, the same abovementioned input parameters have been used to query the friction maps generated from a reduced-scale dyno bench. The comparison between the simulated COF evolution and its median value with the experimental results is reported in the next two paragraphs.
3.1. COF Evolution during the Brake Events
The comparison between the simulated and experimental results about the evolution of COF during brake events querying FM1 and FM2, respectively, with BC1 and BC2 input parameters, is reported in
Figure 5.
Focusing on BC1, the virtual model does not predict values in the first braking because the input parameters for that event are out of the friction maps’ values. Despite this, the evolution of the predicted COF is the same of the experimental one for the other brake events, even if a slight positive offset is noted. Otherwise, focusing on BC2, a positive offset is noted for all the brake events. In addition, there are some missing values in the simulated COF evolution for the second brake event; this lack of predicted values affects the median COF calculation. The simulated COF evolution is the same as the experimental one for all the brake events, except for the second one.
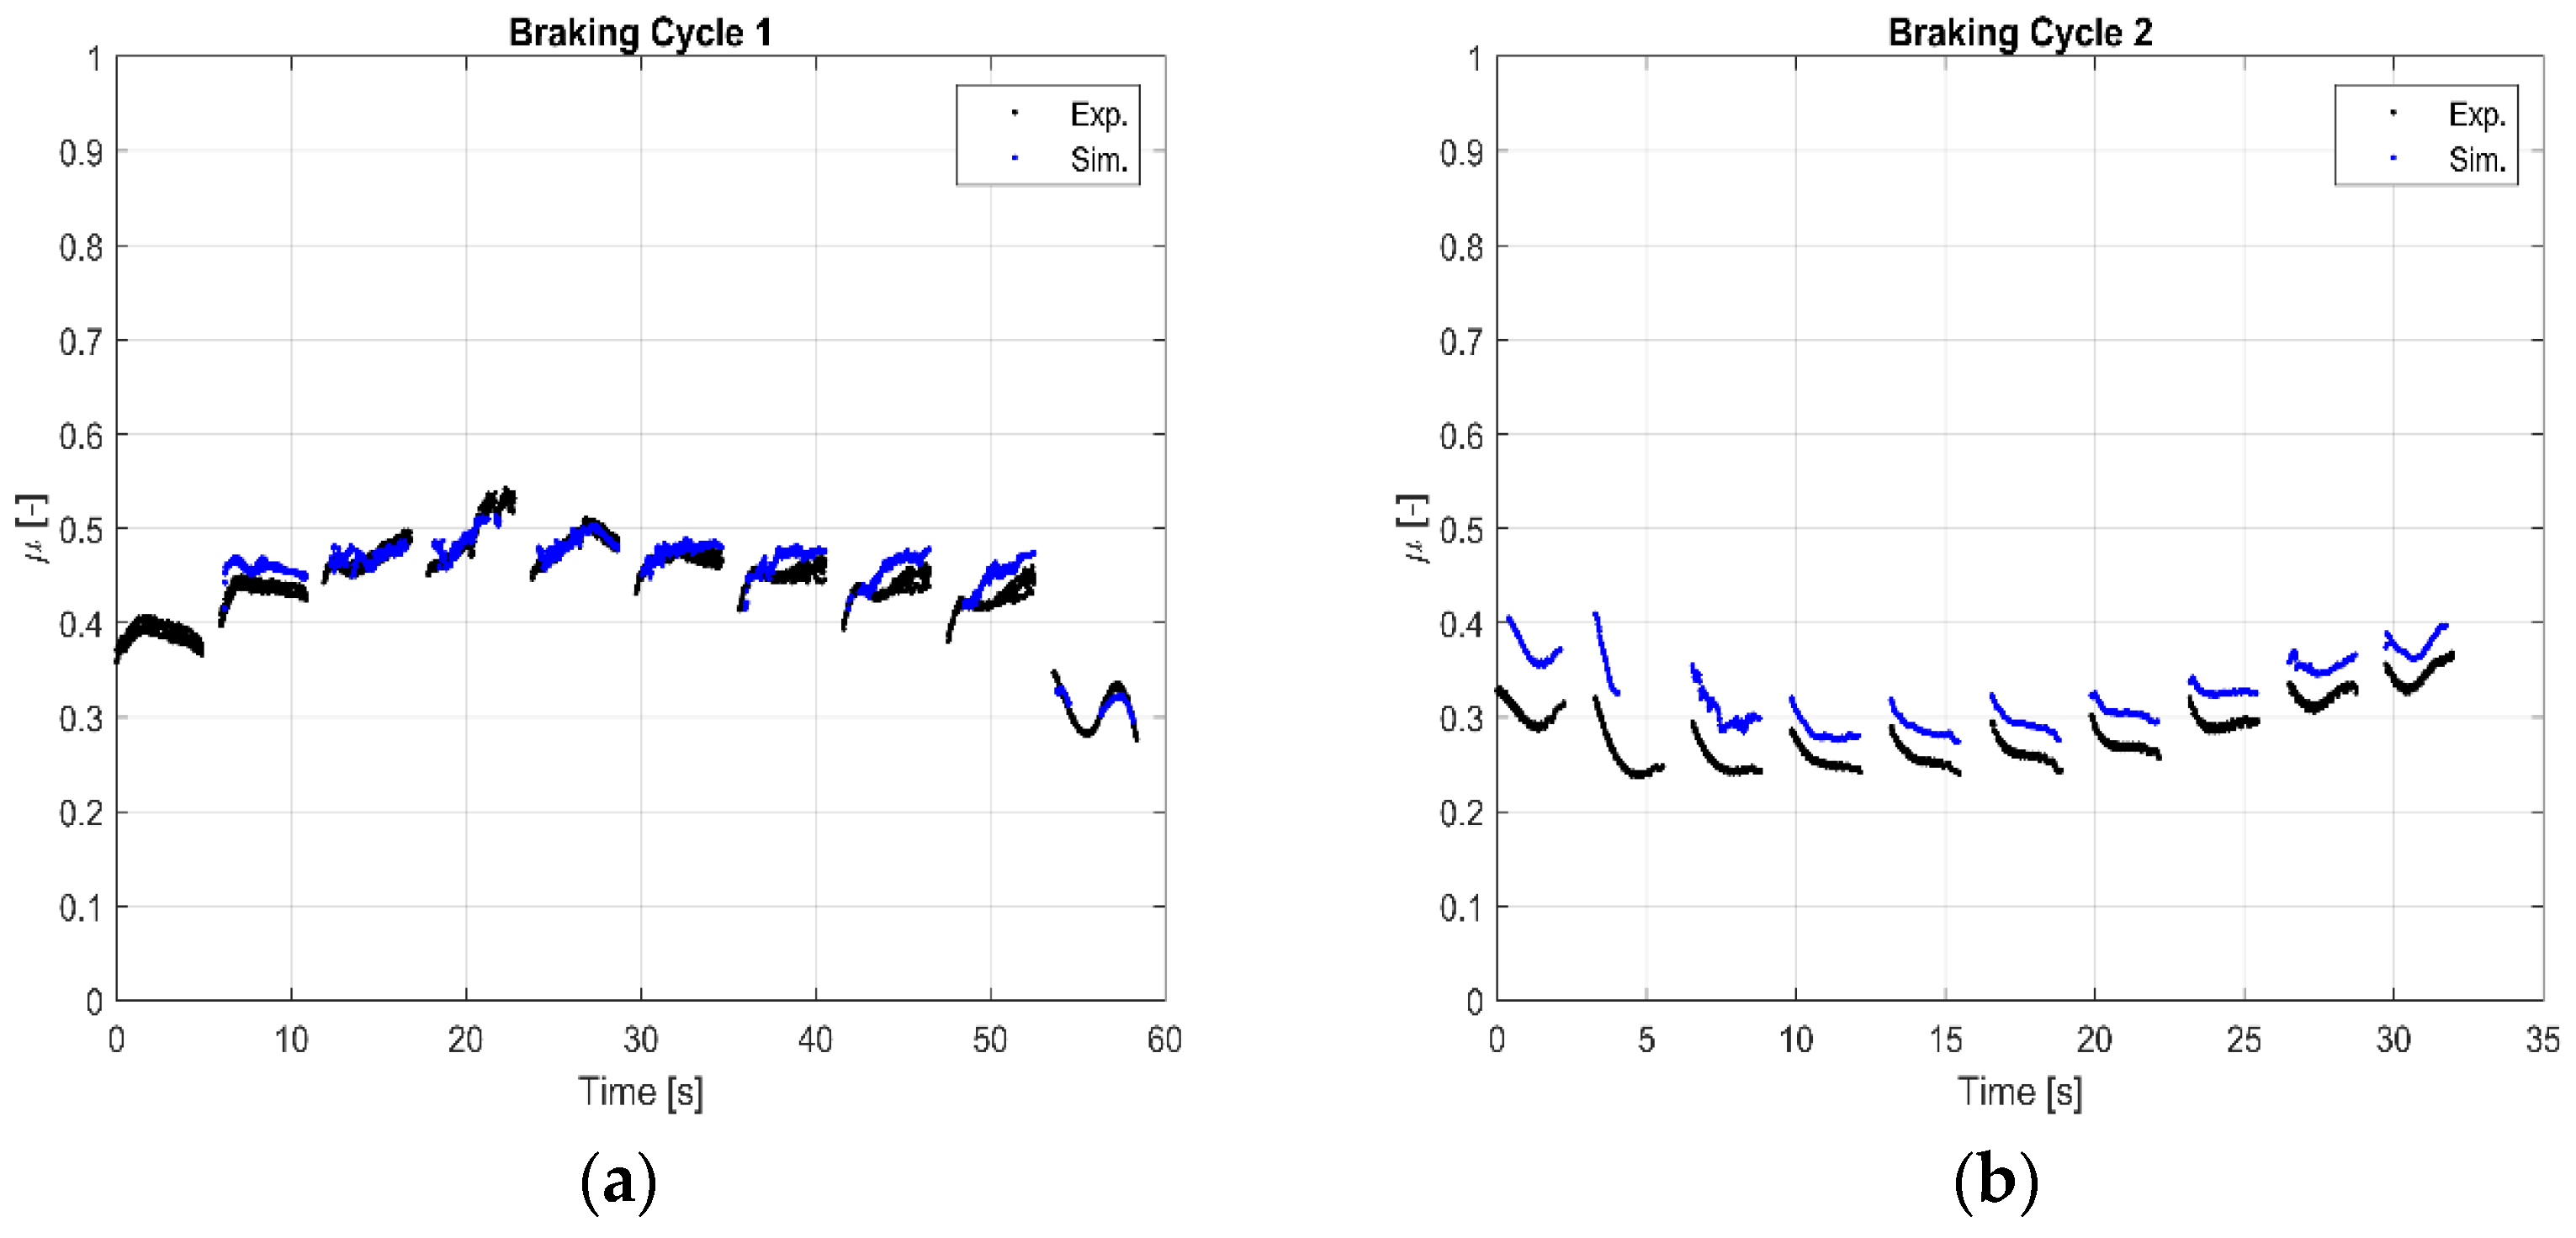
The same braking cycles have been simulated, querying a 3D friction map generated from the wider BC3 performed on the reduced-scale dyno bench. Results are shown in
Figure 6.
The correlation between the predicted COF values of BC1 and the experimental results is good (
Figure 6a), even though for some braking numbers, a negative offset is shown. Focusing on BC2 (
Figure 6b), a positive offset is noted especially for initial braking, while at the end of the cycle the correlation is good.
3.2. COF Median Values
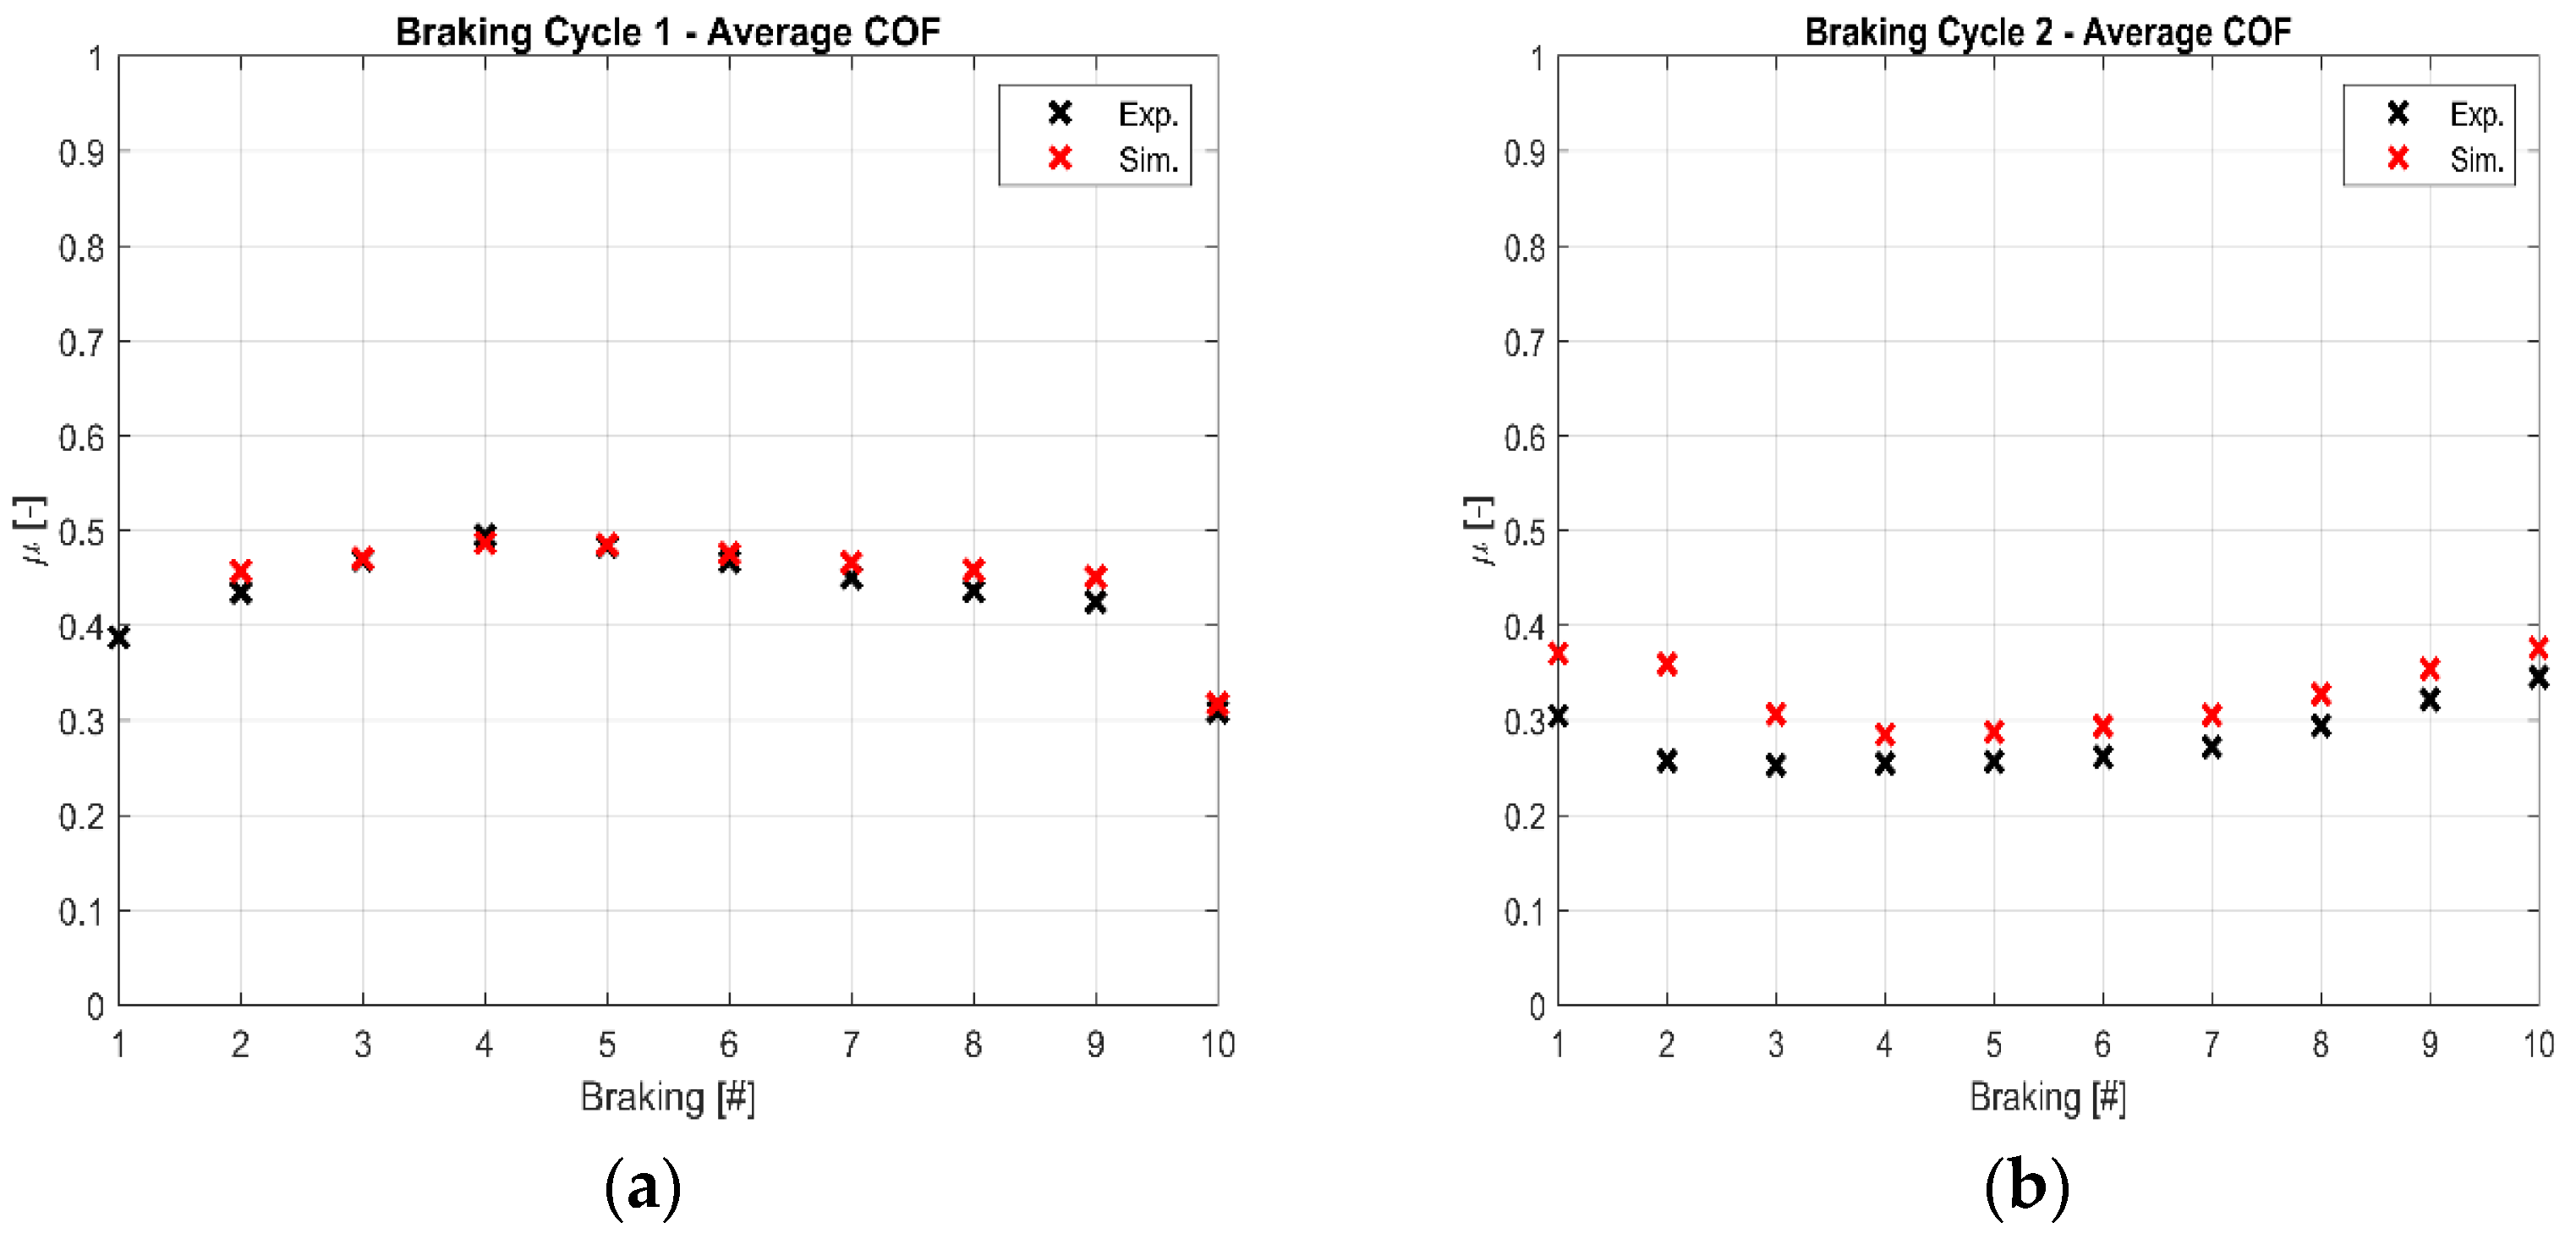
The comparison between the simulated and experimental results about the COF median values querying FM1 and FM2, respectively, with BC1 and BC2 input parameters, is reported in
Figure 7.
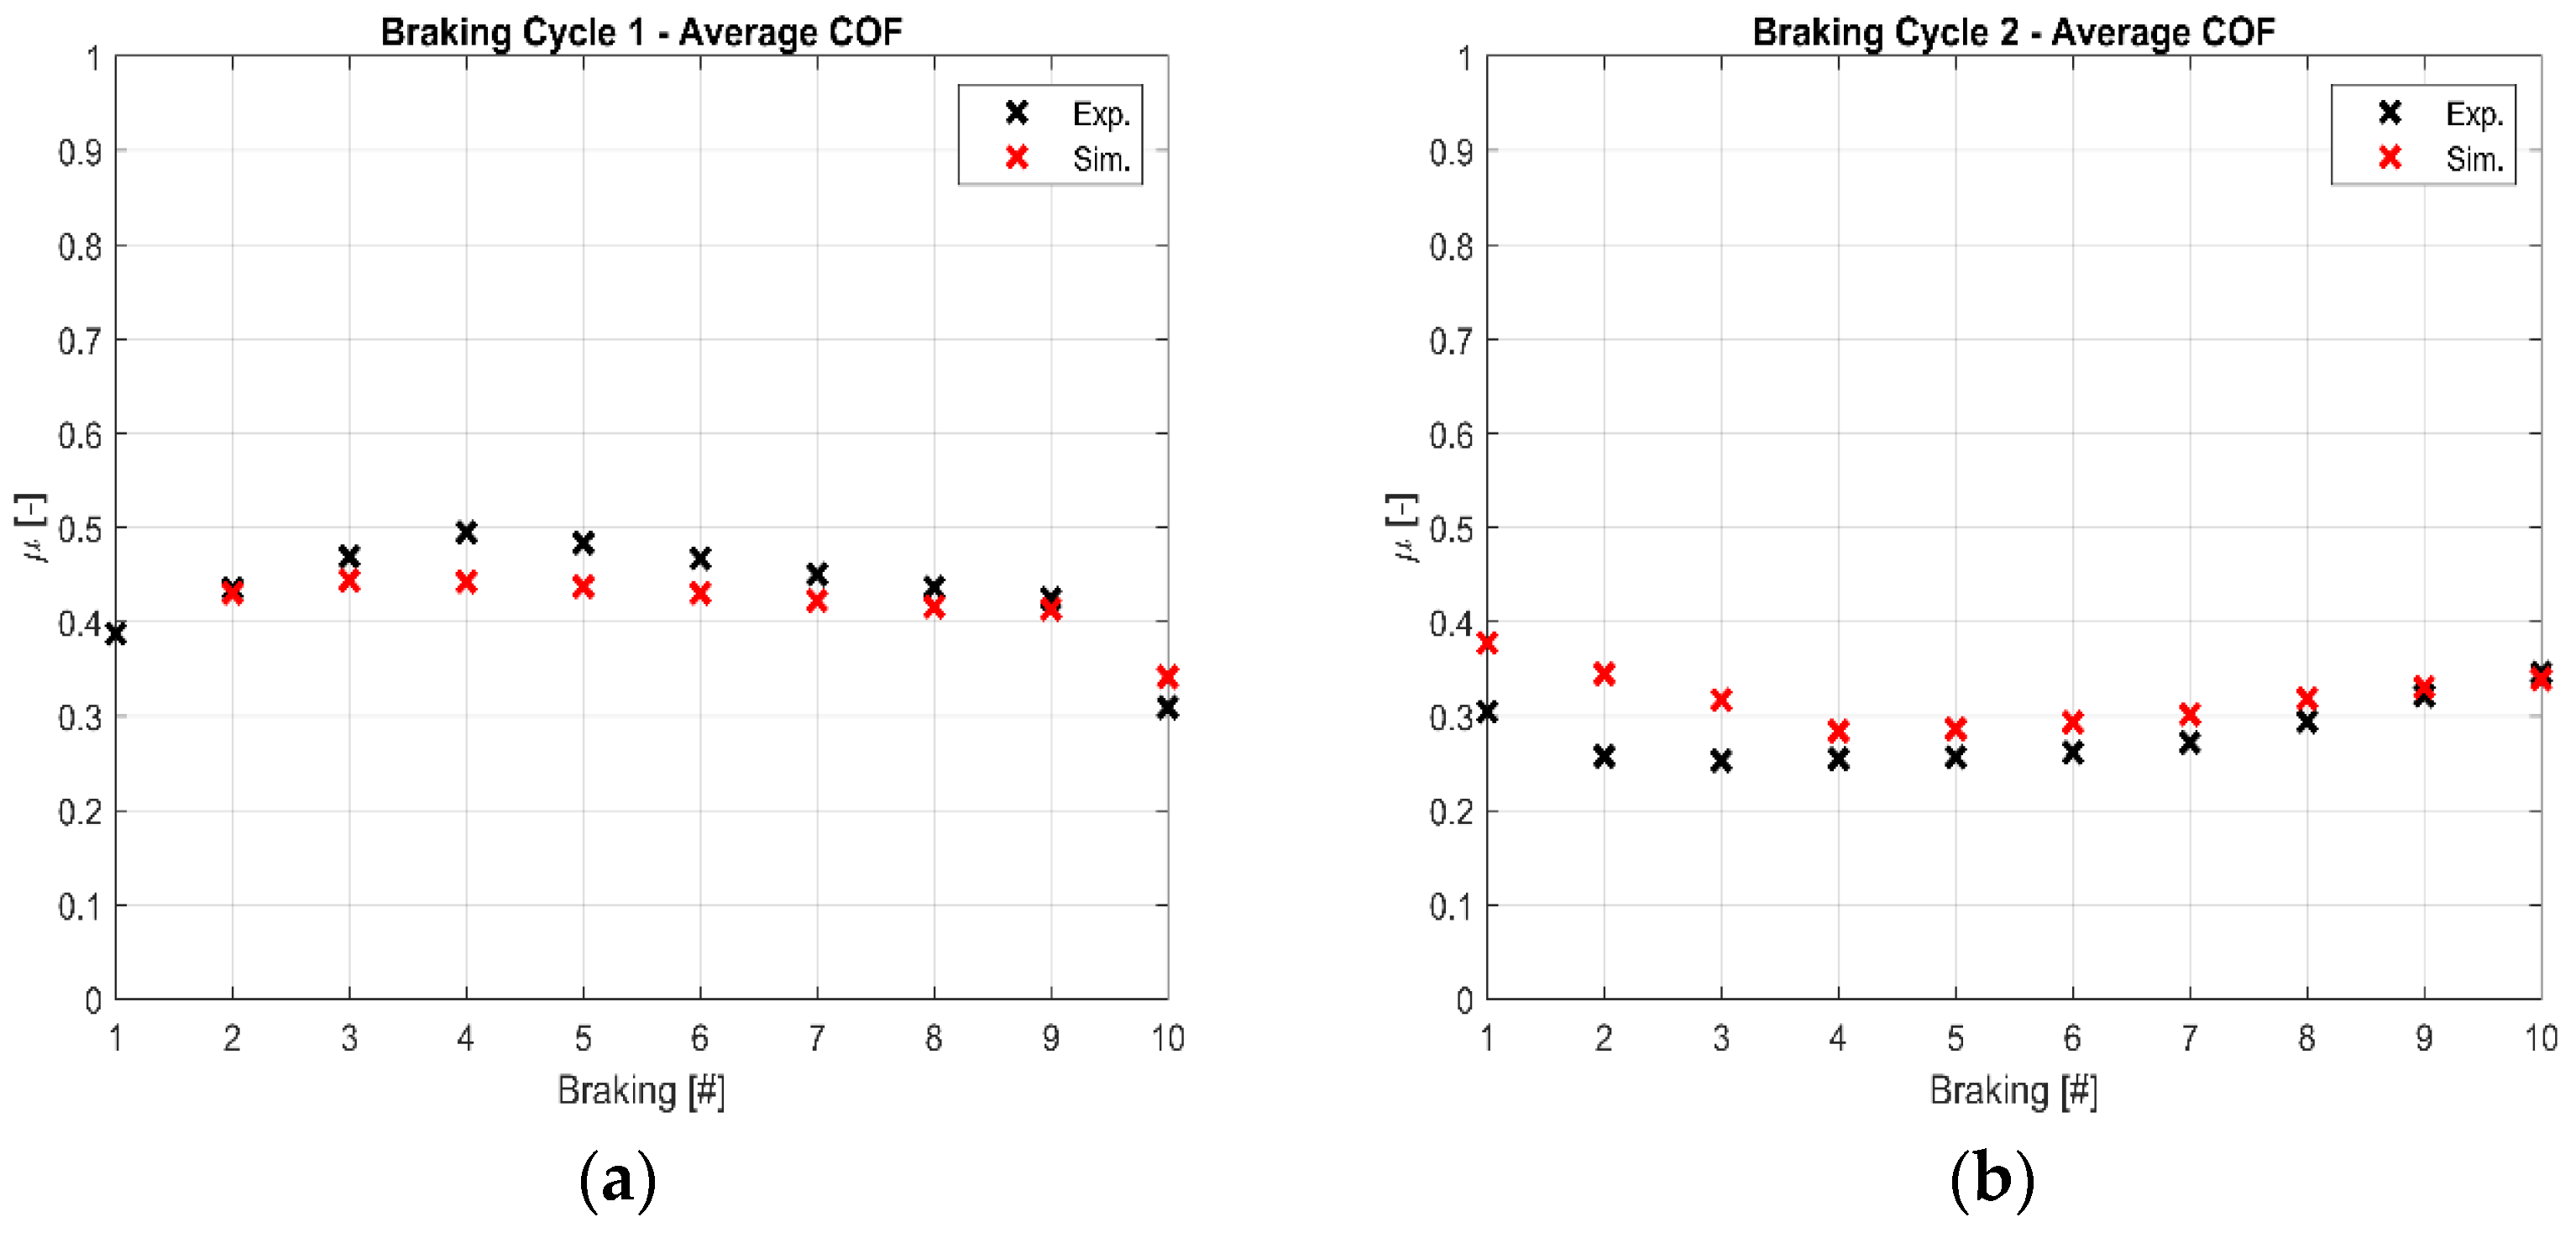
Results coming from querying the reduced scale dyno bench friction map FM3 are shown in
Figure 8.
The difference between experimental and simulated median COF values reported in
Figure 7 and
Figure 8 reflects the difference shown in
Figure 5 and
Figure 6 where the evolution of COF during brake events was represented. Relative errors between the simulated and the experimental results are reported in
Table 5. In the first column, the coupled braking cycle–friction maps are shown; the braking numbers are shown in the first row.
The maximum relative error in the couple BC1–FM1 is around 6%; numerical model overestimates the average COF during the brake event. Using BC1 experimental inputs to query FM3, the simulation returns an underestimation of the median COF values; the maximum relative error is 11%. Focusing on BC2, the couple BC2–FM2 returns a maximum relative error of 40%. Querying FM3 with BC2 experimental inputs, the numerical model underestimates the output with a maximum relative error of 34%. The difference between the predicted median COF value and the experimental one is high at the beginning of the braking cycle for both BC2–FM2 and BC2–FM3 couples, but it tends to significantly decrease from the fourth brake event to the end of the braking cycle. In this range, the maximum relative error shows a value of 12%.
4. Discussion
A numerical simulation has been developed to predict the global COF of a brake system in both its evolution and its mean value during brake events of two different braking cycles BC1 and BC2 using 3D friction pvT-maps obtained from reduced-scale dyno bench tests. A brake system with a low-metallic friction pad and a cast iron brake disc from a D-segment car have been chosen for the analysis.
A verification of the numerical model has been conducted generating 3D friction maps (fm1 and fm2) from the BC1 and BC2 experimental tests performed on the full-scale dyno bench. Then, they have been queried with the same data from which they have been generated. The simulated results replicate exactly the experimental data; this means the procedure to generate pvT-friction maps is robust and the simulation tool to query the friction maps with the experimental input does not introduce any errors.
The next step was to query 3D friction maps obtained by the reduced-scale dyno bench with the same experimental inputs as the verification phase. The results in
Figure 5 show a good correlation, even if some brake events are not completely described by the simulation, since some experimental input values in terms of contact pressure, slip rate and temperature are out of the queried friction map; no extrapolation methods have been chosen in the algorithm to avoid an overly artificial response from the numerical model.
To investigate both BC1 and BC2 with a unique 3D friction map, FM3 was generated from a wider braking cycle BC3 executed at the reduced scale dyno bench.
Figure 6 shows the results querying FM3. Focusing on BC1 (a), the correlation is good although a negative offset is noted for some of the brake events. Otherwise, the simulation for BC2 returns a positive offset through all the braking. A hypothesis is that creating a
pvT-friction map with a wider cycle (718 braking) and then querying it with experimental inputs coming from smaller BC1 and BC2 (10 braking) is not the best way to predict the performance of a brake system in terms of COF. Riva et al. [
10] presented a comparison between experimental and simulated evolution of COF during brake events with a FEA model. Here, the correlation was affected by a positive offset. Varriale et al. [
31] discussed a comparison between experimental and simulated results from two different friction materials, taking the single ingredients of the friction compound into account with a CA-based approach. The maximum relative error was around 1–2% for each friction material tested. Sawczuk et al. [
39] developed multiple regression models based on years of experimental research to predict both the evolution and median values of COF during railway braking events. Then, a comparison with the experimental results was shown. Several parameters have been used as inputs of the numerical model proposed, such as speed, pressure, brake disc mass, brake disc and friction linings wear and the number of holes on the brake disc surface. A relative error in the range of 2–7% was obtained.
As shown in
Figure 3, this study investigates the contact pressure in a range of 0.1 to 6 MPa. The slip rate ranged from 0.1 to 20 m/s and the disc temperature was set from 50 °C to 750 °C to replicate the working range of a real brake system for the abovementioned parameters. In the study conducted by Wahlström et al. [
5], the rotational velocity of the disc was set from 425 to 1700 rpm and the nominal contact pressure from 0.3 to 1.2 MPa; sliding speeds ranged from 1 m/s to 4 m/s. Scaling these values to the real vehicle, they resulted in a range from 10 to 40 km/h. Other tests at both low contact pressure and low slip rate conditions were carried, out setting the values in a range of 0.03–0.28 MPa and 0–3.8 mm/s, respectively [
37]. Candeo et al. [
36] performed experimental tests in a range of 10–80 bar for braking pressure, which corresponds to 0.34–2.73 MPa for the nominal contact pressure range, and from 4.2 to 21 m/s for slip rate (40 km/h to 200 km/h converted into vehicle speed).
Figure 7 and
Figure 8 report the mean COF values for the two cases analyzed in
Figure 5 and
Figure 6. Relative errors between the simulated and experimental results are reported in
Table 5. Considerations about the difference analyzing the median COF values are the same as for the COF evolution. The analysis of the evolution of COF during brake events is important since it returns information about the in-stop increase in the COF and its trend. Medium COF value in a brake event is also a key parameter, since it is used in the braking companies to roughly compare the response of two different brake system geometries under the same working conditions, returning quick feedback on the performance.
The results here proposed about the evolution of the COF during a brake event and its median value are promising, although in some cases, the maximum relative error is up to 10%. It is important to remark that the system tested on the reduced scale dyno bench is not the real brake system tested on the full-scale dyno bench. The main difference concerns the caliper, which has an internal efficiency that the numerical model does not consider. Another possible explanation for the difference between the simulated and the experimental results is that the numerical model proposed in this study does not take the “braking history” effect into account. This phenomenon can affect the response of a friction pad material in terms of COF after several brake events since the performance is strongly dependent on the history of loads (braking pressure and temperature) to which the friction pad has been exposed. The higher the number of brake events in a braking cycle, the higher the “braking history” effect on the friction material pad. This could be the main reason why offsets are noted between predicted and experimental COF values, especially querying the friction maps generated from BC3 with BC1 and BC2 inputs. Further investigation is necessary to include the “braking history” effect in the simulation tool, analyzing data coming from full-scale dyno bench tests to find a mathematical law or a corrective factor to describe this phenomenon. Another possible reason for the presence of some offsets is that some working conditions are not completely described by the reduced scale dyno bench tests; this causes a lack of data in the friction maps, especially when they are queried with BC2 experimental inputs. The prediction shows a high relative error value for the first three brake events in BC2. This can be easily solved by extending the operative range of the experimental tests.
Even if there is a difference between the simulated and the experimental results, 3D friction maps generated from the mini dyno bench data can be useful to provide a tribological characterization of a specific friction material compound, regardless of the geometry of the brake system, caliper dimensions, pad and disc sizes. This is impossible to obtain when executing full-scale dyno bench tests, since it is mandatory to use a predefined brake system. Furthermore, buying and carrying out the maintenance of a reduced-scale dyno bench is far less expensive compared to the overall full-scale dyno bench costs. In addition, the pvT-friction map resulting from a subscale dynamometer can be queried with inputs coming from different car segment brake systems, since it provides a geometrically independent tribological characterization of a friction material pad-to-disc couple. The only two requirements are that the materials of the couple brake disc– friction pad are the same and that the input parameters are inside the friction map values; if the last condition is not fully respected, some brake events cannot be described by the simulation at all.
To summarize, the aim of the simulation tool is to evaluate the possibility of using a reduced-scale dyno bench instead of the more expensive and onerous full-scale one to obtain a tribological characterization of a friction material. This characterization in terms of a 3D friction map can be used to predict the COF evolution and its median value during various braking events under different driving conditions. In this discussion, input parameters coming from experimental results are presented, but contact pressure and slip rate can be easily obtained at the beginning of the design phase if there is knowledge of geometry of the vehicle wheel cut and the brake system. It is possible to estimate the brake disc temperature using a 1D model once the braking cycle parameters to simulate are known. In this way, experimental tests on the full-scale dyno bench are only useful to provide COF values to be compared with the simulated ones.
The presented study represents a preliminary approach to the research question, and it will be strongly developed, taking all the abovementioned phenomena into account, to reach a better correlation between experimental and simulated results.
