Abstract
In this paper, the flow dynamics of polymer greases was investigated using micro-particle image velocimetry. Polymer greases have a different thickener structure, compared to widely used lithium-based greases, and they have the well-known ability to release oil. How these properties affect grease deformation and its ability to flow is investigated and compared to the corresponding behavior of a lithium complex grease with the same consistency. Two main tests were carried out, where velocity profiles in a straight channel were measured and analyzed, and velocity evolution during the transition period from a no-flow to a fully-established flow was measured, respectively. It was found that the polymer grease flow dynamics is different from that of the lithium grease. This indicates that the internal structure of the grease and the grease ability to bleed oil have a strong influence on the deformation on a global scale, which in turn entails other lubricating abilities for the two grease types.
1. Introduction
Lubricating greases are commonly used to lubricate moving parts in various applications. Compared to oil, grease has several advantages. Its sticky consistency with a pronounced yield stress character enables it to adhere to surfaces, hence preventing corrosion; it also has good sealing properties. A lubricating grease is composed of a base oil, additives, and a thickener agent [1]. The thickener agent forms a microstructure able to retain the additives and the oil. Lithium is the most common thickener agent used with a wide range of operation temperatures [2], although lithium greases have poor lubricating properties at low temperatures.
To overcome this disadvantage, greases with a polymer thickener have been proposed to improve anti-wear and anti-friction properties at a wide range of operation temperatures [3,4]. In the literature, there are reports on other characteristics of polymer greases, such as the presence of more pronounced oil bleeding [5,6]. In general, grease oil-bleeding capacity has a direct relation to the thickener [7,8,9]. Gonçalves et al. [10] suggested that it was possible to optimize the thickener content in order to provide sufficient oil-bleeding and necessary grease consistency.
Following an explanation for anti-wear and anti-friction improvement, Leckner et al. [11] monitorized temperature evolution on a SKF R2F-A test using lithium and polymeric thickener agents. The results with polymer grease show temperature stabilization, while those with the lithium complex grease show a trend of increasing temperature. In consequence, they also observed that wear is more pronounced using lithium grease while polymer grease shows improved anti-wear properties. Recently, Salmeron et al. [4] demonstrated that polymer grease can reduce energy losses by 22% in bearings under conditions similar to that in electric motor vehicles. Pursuing the objective to improve grease anti-friction behavior, Shu et al. [12] compared the change in behavior due to the additives. They found an improved additive response with polypropylene grease, compared to the lithium grease. Another attraction of polymer grease is the use of recycled polymeric waste as an effective grease thickener [13]. These recent research works match with the worldwide trend to reduce the costs associated with limited raw materials, leading to a circular economy. The use of polymer grease could also contribute to reducing the costs of lubricants as the demand for lithium is steadily increasing with a rising demand for batteries worldwide.
Focusing on polymeric thickener behavior on lubrication, Gonçalves et al. [14] studied the oil thickness film at the Hertzian contact and concluded that polymer grease produces very large film thickness, which, in some cases, is larger than that for the base oil alone. Oil-bleed behavior was also observed by Muller et al. [15] who verified that polymer greases show fully-reversible, shear-thinning properties. With respect to lubrication, this means that the grease regains a state very close to the fresh condition. Leckner et al. [11] focused on the temperature evolution, which is a clear indicator that oil-bleed not also contributes to increased elastohydrodynamic properties as Gonçalves et al. reported [14], but also contributes to reducing the temperature in the Hertzian contact due to the reduced friction coefficient.
Overall, the lubricating properties of polymer grease is directly dependent on its ability to deform under shear. This cover the dynamics on a system level, where the constitutive relations between shear (deformation rate) and deformation govern the bulk behaviour. However, as introduced above, the internal flow which enables the base oil to be separated from the main bulk is important—not the least for polymer greases, which have such pronounced oil-bleeding properties.
This paper is devoted to the fluid dynamics of polymer greases, with the ambition to provide a deeper insight into the fluidity of polymer greases and its differences compared to lithium grease. In this paper, we assume that polymer grease has oil-bleeding properties, as reported in the literature cited above. We do not measure the oil-bleeding rate in the flow, but make qualitative observations based on the measured velocity distribution in the geometries used. The inner dynamics of the oil-bleeding process is of course highly important and an interesting area to understand more about. This is, however, a scope too large to include in this study, and has been identified as a separate project.
2. Materials and Methods
2.1. Design Principle
A grease flow study was performed on a straight micro-channel 56.52 mm in length and a 1 mm2 square cross-section, as shown in Figure 1D. The channel was made using VeroWhitePlus RGD835 (polymeric material from Stratsys, Eden Prairie, MN, USA) manufactured using a 3D printer from Stratasys, model Object 30. The process to seal the channel was as per Farre-Llados et al. [16].
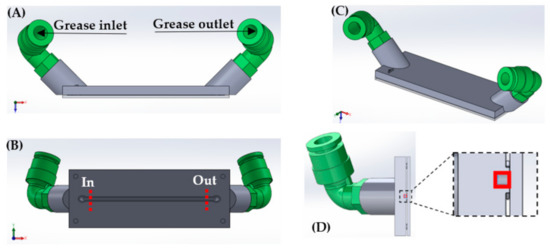
Figure 1.
Straight micro-channel geometry multi-view projection. (A,B) corresponds to elevation and plane view, where the inlet/outlet is located. (C) is the micro-channel isometric projection and (D) shows the out position of (B) the cross-section. The zoomed in detail shows the channel cross-section in red. The total length of the micro-channel is 56.52 mm.
Two grease formulations using Polyalphaolefin (PAO) as a base oil with different thickener agents were used to compare grease flow behavior. The two greases were a polymer grease (PP10) and a Lithium complex grease (LiX10). The polymer grease was composed of a polypropylene complex thickener and a PAO-10 base oil. Polyalphaolefin is the most common major synthetic (synthetic hydrocarbon) base oil used in the industry. Kinematic viscosity was 10 mm2/s at 100 °C. LiX10 was the corresponding lithium grease composed of a lithium complex thickener and the PAO-10 base oil. Additional information related to the composition and manufacturing process is reported by Leckner [5]. Table 1 presents the two types of greases used and their properties by means of base oil viscosity and rheology data from shear rate–shear stress measurements. The rheology data (curves) were fitted to the Herschel–Bulkley rheology model. See Figure 2 for the shear rate vs. the shear stress curves. Interestingly, the two greases show the same consistency and would likely be considered more or less identical by the end user. Based on the Pen-60 result, the NLGI number would also be the same for the polymer and lithium complex grease. However, a close-to-identical consistency does not automatically imply identical performance in e.g., a bearing. In addition, as shown by the rheology data, the two greases differ quite dramatically, especially in their consistency (K value) and shear thinning property (n value). The yield stress value τ0 is also different, with ~50% higher value for the lithium complex grease. The rheology data show that the two greases behave drastically different when being subjected to shear: the lithium complex grease requires a higher shear rate to start deforming (flow), and when the shear rate is ramped up, the polymer grease shows a significantly higher shear-thinning property. This is clearly seen when comparing the red (LiX10) and blue (PP10) curves in Figure 2. The PP10 grease fast approaches a regimen where the response to the shear stress of an increased shear rate is small.

Table 1.
Grease samples used in the study. Viscosity data, cone penetration after 60 strokes (Pen60), and rheology data based on the Herschel–Bulkley model. Here, τ0 is the yield stress, K the consistency (not to be confused with the consistency as measured by the Pen-60 test), and n the Power-law index; see Figure 2.
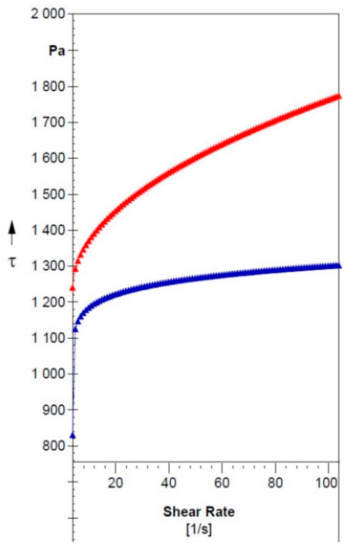
Figure 2.
Results from rheology measurements in a plate–plate rheometer. Blue: PP10 grease, red: LiX10 grease. Here, τ is the measured shear stress.
2.2. Grease Flow Measurements Using µPIV
Figure 1B shows a 3D micro-channel drawing with the locations where micro-particle image velocimetry (µPIV) measurements were performed. Since the introduction of a reference mark in the channel could modify the flow, the exact measuring position was positioned close to the point represented in Figure 1B and no closer than 5 mm from the inlet/outlet to avoid disturbances in the development of the flow. The entrance length (Lentr) at which the flow is fully developed is given by [1]:
where D is the hydraulic diameter (=the width of the channel for this geometry). Re is the Reynolds number. Equation (1) yields a value for Lentr of the order of 1 mm. Note that this yields for a Newtonian fluid. For a Herschel-Bulkley fluid the Reynolds number differ; see e.g., the work by Madlener et al. [17]. Based on the rheology data in Table 1 and a velocity of 0.01 m/s we obtain a Reynolds number of the order of 0.0005, i.e., Re << 1. This in turn mean that the flow for sure—according to the theory—should be fully developed 5 mm from the inlet where the measurements are done.
Lentr = D·Re/15.4
PIV is a non-intrusive method to visualize flows, where the motion of tracer particles inserted into the flowing medium is tracked by a camera using a pulsed laser as light source. The method is hence indirect as it monitors the seeding particles motion. The µPIV system uses a digital CCD sensor adapted on a microscope to capture the images (see Figure 3) and the microscope focal plane defines the PIV measuring 2D plane. The 2D images with single exposure on separate frames were analyzed using the commercial software Insight 3G from TSI (Shoreview, MN, USA). This software uses Fourier transform and a cross-correlation algorithm to obtain the velocity vectors, as presented in detail in the book by Raffel [18].
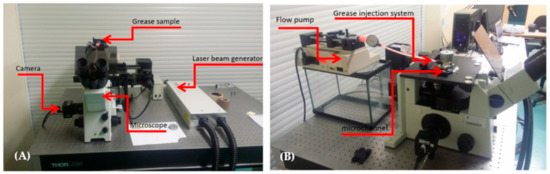
Figure 3.
µPIV setup. (A) Microscope, laser, camera, and grease sample. (B) Side view showing the flow pump and the injection system.
The camera pixel resolution was 2048 × 2048 pixels and a mesh of 64 × 64 pixels with and overlap of 16 pixels was used to perform the cross-correlation. The µPIV tracer particles used were Fluoro-Max Red Dry Fluorescent with a diameter of 6 µm from TSI. Particles were mixed manually on grease samples with a concentration of 2–4 particles per cell.
Figure 3A,B show the µPIV experimental setup. The flow pump injected grease into the channel of Figure 1 allocated on the microscope, as shown in Figure 3B. The high-speed camera assembled on the microscope focused through a 10× objective to an internal grease plane 500 µm below the glass wall to minimize the effects of the wall on the flow. Once the laser illuminated the grease flow seeded with reflective particles, the camera recorded the image, capturing the particle positions. Afterwards, the µPIV technique analyzed the particle positions in the double frame images to obtain the particle vector direction and to measure particle displacement. The velocity modulus using linear motion equation was then calculated from the particle displacement and the time between the laser exposures.
2.3. µPIV Grease Flow Analysis
In order to compare the grease flow behavior, different flow conditions were considered. Table 2 shows the flow rates used for the stationary regime and the laser time step between the exposures for each flow condition. Note that a low flow rate of 0.05 mL/min and a high flow rate one order of magnitude higher were used for each grease sample. Furthermore, the transition from a zero flow until the stationary regime was analyzed using the same samples and equal flow conditions.
Table 2.
PIV and experimental parameters used for stationary flow and transitional flow.
Each PIV test was performed using 50 double frame images (100 images in total). Since the flow was laminar, 50 vectors were analyzed and averaged to improve the results’ quality and reliability. For each test condition, velocity profiles were obtained of the channel middle plane, 500 µm below the glass channel wall to minimize its effect on the fluid.
Sieder et al. [19] used oils to show the relationship between temperature–pressure drop and Sisco [20] studied a mathematical method to calculate grease pressure drops in a pipe. In this study, a straight channel was used (Figure 1) with a total length of 56.5 mm and an effective working length to ensure a fully developed flow of 46.5 mm. Stationary velocity profile measurements were performed at two opposite sides of the micro-channel—at the inlet and outlet, respectively, to achieve the maximum pressure drop difference. Furthermore, the transitional flow was visualized in the middle position of the microchannel and the evolution of the maximum velocity measured at the profile shape over time was plotted.
Table 2 shows the time step between exposures for the stationary grease flow and each grease condition and grease type. It is important to note that for the transitional flow measurements, this parameter must be adapted for each test. The outlet pressure was considered atmospheric pressure; the measured inlet pressure is reported in Table 2.
3. Results
In this section, the experimental flow visualization results for the transitional- and stationary regime are presented. For the stationary regime, velocity profiles are presented for the grease flow at the inlet (higher pressure region) and the outlet (lower pressure region) according to the channel in Figure 1. The velocity profiles at each position are compared using the same flow rate with two different greases, as shown in Table 1. The influence of the pressure drop and grease type are analyzed separately. Figure 4 and Figure 5 compare the velocity profiles at the inlet and the outlet to show the effect of the pressure at each cross-section and grease type. Focusing on the transitional flow regime, the maximum magnitude of the velocity measured at the profile shape over time with the same grease is compared to the stationary value; see Figure 6.
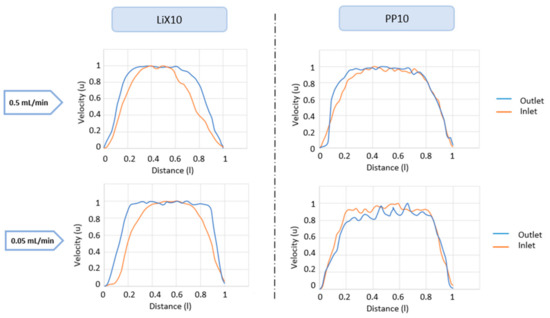
Figure 4.
Normalized velocity profiles for the PP10 and LiX10 greases, respectively. For the normalization, the maximum speed in the channel (plug speed) was used as a characteristic value. Position at the high-pressure inlet (left column) and at the low-pressure outlet (right column) for two different flow rates. Here, 7 bar is the pressure to drive the 0.5 mL/min flow. Dimensionless quantities using a characteristic length scale of 1 mm (channel width) and a characteristic velocity equal to the maximum velocity. On the y-axis is the velocity and on the x-axis the channel width. Upper row: flow rate 0.5 mL/min, bottom row: flow rate 0.05 mL/min.
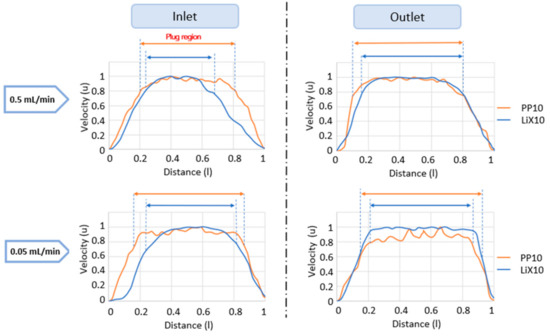
Figure 5.
Normalized velocity profiles for respective grease at different flow rates. Top row: flow rate of 0.5 mL/min, bottom row: 0.05 mL/min. Left column: Inlet, Right column: Outlet.
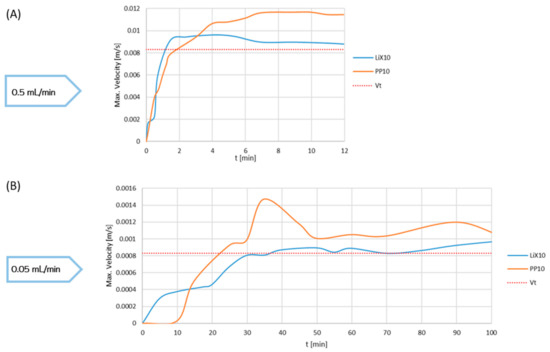
Figure 6.
Maximum velocity evolution during the transition period for the two flow rates of (A) 0.05 mL/min and (B) 0.5 mL/min, respectively.
3.1. Velocity Profiles and Oil Bleeding
Figure 4 shows the velocity profiles for both greases in connection to the inlet region (left column) and the outlet region (right column). Measuring the velocity profiles at these two locations enables us to see the grease response to the driving pressure, i.e., to investigate the difference between the greases by means of a velocity profile at different stages of the flow development. Two flow rates were considered: 0.5 mL/min (top row) and 0.05 mL/min (bottom row), respectively. To create a higher flow rate, a driving pressure of the order of 7 bars was required, meaning the pressure drop between inlet and outlet was around 6 bars—considering the ambient pressure to be 1 bar. The pressure drop for the lower flow rate case (0.05 mL/min) was around 4 bars. Here, the flow rate is directly related to the shear rate in the channel.
Comparing the two flow rate cases, it was noted that the velocity profile plug region for the LiX10—and PP10 greases was larger if the shear rate was lower. The plug region is a result of the shear rate (and consequently the shear stress) in the flow and the value for the grease yield stress. When the shear stress in the flow was below the yield stress value, the grease stopped deforming, leading to a constant velocity (plug). These results are in line with earlier reported findings; e.g., in Westerberg et al. [21]. The explanation lies in the shear thinning rheology, also inhibiting a characteristic yield stress behavior of the grease, which, for the bulk flow, show good agreement with a Herschel–Bulkley fluid; cf. Figure 1 and Table 1. A lower pressure gradient yields a lower shear rate in the channel, which hence is below the yield value for a larger part of the channel width. Comparing the velocity profiles for the respective grease, the plug region for LiX10 was for all conditions smaller, and the difference compared to PP10 was significant as the shear rate increases. The length of the plug region for the PP10 grease was close to unaffected by an increase in shear stress due to the shear rate in the flow. This observation matches the results from the rheology measurements in Figure 1, Table 1. The plug region for the LiX10 grease varied as expected due to the Herschel–Bulkley rheology. According to the experimental conditions, the shear stress was the same—close to the solid boundaries at the inlet and at the outlet of the channel position since the flow rate is constant. Therefore, the working hypothesis to explain the plug region differences here, is—in addition to the different yield stress value—the shearing effect on the oil-bleeding properties [5] for the PP10 grease.
Comparing the velocity profiles for the two greases at the outlet (right column in Figure 4), we see that the difference is very small. A comparison between the inlet and outlet was made in order to investigate the impact of shear over the time taken to travel from the inlet to the outlet. The flow was fully developed at both locations of measurement according to theory (Section 2.2), so any change in velocity profile between the inlet and outlet was coupled to the inner dynamics of the greases (oil-bleeding, thickener structure/orientation etc.). The difference was largest for the LiX10 grease, which undergoes a change from a more parabolic shape to a sharper plug formation. This can be directly coupled to the oil-bleeding properties, enabling a transport of base oil in the bulk grease and forming a higher concentration of base oil close to the boundary (slip layer). With a thicker layer of low-viscous base oil being present close to the solid boundary, the dynamics close to the boundary changed significantly due to the change in rheology for the base oil, compared to the bulk grease. In addition, due to the change in thickener composition, the PP10 grease had a faster oil transport, leading to a faster establishment of the velocity profile, compared to the LiX10 grease, which hence had a slower response to the shear as it traveled through the channel.
In the grease flow boundary layer, the viscous effects were significant, as are the velocity changes (i.e., the velocity gradient, and consequently the shear). With the presence of a low-viscosity base oil layer adjacent to the solid channel wall, the velocity changes (increases) faster, meaning the advection term (u·∇)u in the equation of motion (Navier–Stokes equation) vanishes faster, compared to the case of zero oil-bleeding, and the flow develops faster. Interestingly, as the flow approaches the outlet, the two greases show more or less identical velocity profiles, despite them having radically different rheological properties. The effect of the oil-bleeding on the flow hence seems to be significant during the stage the flow develops. In other words, the oil bleeding effect seems to be different for the two greases as the grease is subject to shear. In terms of applications where grease is used as a lubricant, the results indicate that oil-bleeding will have the most impact where the shear on the grease acts on a short distance in the flow direction, i.e., such as in the lubricated contact in rolling element bearings [22].
To further investigate this, the same data as in Figure 4 is used in Figure 5 but in a different order for the purpose of emphasizing the difference between high and low flow rates for respective greases. Figure 5 shows the velocity profiles for each position (inlet (left column) and outlet (right column) respectively), for each flow rate (rows), and respective grease (PP10 (red), LiX10 (blue)). Figure 5 hence is a variant of Figure 4, comparing the velocity profiles at inlet/outlet in the columns. It is clearly seen that the PP10 grease has the same velocity profile from the inlet to the outlet, while the LiX10 grease shows a larger deviation between the two locations. This is in line with the results in Figure 4: the PP10 grease has a fully developed velocity profile at the inlet as expected form theory (Equation (1)), and retain it throughout the journey in the channel. This is not the case for the LiX10 grease which need the channel length to develop. Reconnecting to the discussion in connection to Figure 4, the reason for this to be found in the inner dynamics of the grease which in turn directly couples to the thickener type and thickener structure, oil transport properties in the bulk grease, and the oil bleeding dynamics adjacent to the solid boundary wall.
Finally, comparing the velocity profiles for the LiX10 grease at the outlet (blue curve) for the two flow rates, we see that the plug region is smaller for the high flow rate case. This result is in line with Westerberg et al. [21] and can be explained by the increased shear rate due to the higher flow rate in the channel. This yields that a larger proportion of the grease will experience a shear rate above the yield value, meaning a larger proportion of the grease is deformed.
3.2. Transitional Flow in the Channel
The results in the previous section indicate that the dynamics is different between the two greases as the flow progresses along the channel. In order to further investigate the effect of time dependency on the flow dynamics, we considered the evolution of the maximum velocity—i.e., peak value of the velocity profile—as a constant flow rate was applied from rest (practically, this is done by applying the given flow rate to the grease pump; see Figure 2. At time t = 0, the pump started to deliver the actual flow rate, which was obtained by pushing the piston of the syringe with proper speed considering the dimensions of the syringe). Figure 6 shows this evolution for the low flow rate (0.05 mL/min) and high flow rate (0.5 mL/min), respectively. Here, Vt is the theoretical maximum velocity based on the flow rate and the cross-section dimension of the channel. For the higher flow rate case, which also corresponds to the case with a higher shear rate, the evolution for the maximum velocity was similar for the two greases, especially the first part, from rest to reaching Vt. Interestingly, the PP10 grease experienced a higher maximum velocity as it stabilized around 7–8 min. The low flow rate case is more interesting in the sense that the shear as implied by the applied flow rate acts more slowly on the flow domain. This results in a slower journey past the critical yield stress value; when exceeded, the grease start to deform. For the low flow rate, the difference between the two greases is more pronounced. The LiX10 grease has a more continuous development from rest to stationary conditions. A stick-slip [23] behavior was observed the first 20 min: the velocity increased linearly the first few minutes and then for around 15 min, it was more or less constant; then, there is another increase period for 10 min before the stationary conditions are reached. The stick–slip behavior is due to the composition (thickener structure) of the grease, which, at low shear rates, gives the grease an elastic behavior. When the syringe piston starts to move, being pushed by the grease pump, energy is built into the grease; however, due to its yield stress behavior, it is not deformed initially. When the shear stress in the grease exceeds the yield stress, energy is released and the grease starts to flow. The energy in the system, i.e., the channel, is however not yet large enough to deform the grease uniformly in the whole domain. Hence, the flow evolution is irregular until the stationary conditions are reached after 30 min.
The scenario is completely different for the PP10 grease, which was stationary the first 8–9 min. This is followed by a rapid increase in velocity, followed by a decrease until stationary velocity was reached towards the end of 40 min. This result is supported by the hypothesis in previous results (velocity profiles) and the well-known oil-bleeding properties of polymer grease: as pressure is built up in the grease domain when the grease pump starts, the internal dynamics of the polymer grease enables the base oil to bleed through the thickener structure and cause a higher concentration of base oil close to the channel boundary. This yields a thin layer where the friction forces are reduced. As the two greases have the same rheology, including a yield stress value of the same order of magnitude, the energy stored in the system is of the same order for both greases. A low-viscous layer in connection to the solid boundaries then results in a more rapid increase in velocity as the forces restricting the flow is reduced. The bulk polymer grease can be viewed as sliding on top of the thin base oil layer.
4. Concluding Remarks
In this paper, the flow dynamics of polymer grease was investigated and compared to the dynamics of a lithium grease. Flow was measured in a straight channel with a square cross-section using micro-particle image velocimetry. It was found that the polymer grease experiences a different evolution in velocity as the grease is deformed. The results support the hypothesis that the formation of a thin base oil layer close to the solid wall causes less friction forces, hence making the polymer grease more efficient in establishing a fully developed flow. Depending on application, this may be of significant importance for grease-lubricating ability.
Author Contributions
Conceptualization, J.F.-L., L.G.W. and J.C.-T.; methodology, J.F.-L., L.G.W. and J.C.-T.; software, J.F.-L. and R.W.; validation J.F.-L., L.G.W., J.C.-T., J.L. and R.W.; formal analysis, J.F.-L., L.G.W. and J.L.; investigation, J.F.-L., L.G.W., J.L. and R.W.; resources, J.F.-L., J.C.-T., J.L. and R.W.; data curation, J.F.-L. and R.W.; writing—original draft preparation, J.F.-L., L.G.W., J.C.-T. and J.L.; writing—review and editing, J.F.-L., L.G.W., J.C.-T. and J.L. All authors have read and agreed to the published version of the manuscript.
Funding
This research received no external funding.
Conflicts of Interest
The authors declare no conflict of interest.
References
- Lugt, P.M. Grease Lubrication in Rolling Bearings; Wiley Edition: Hoboken, NJ, USA, 2013; ISBN 978-1-118-35391-2. [Google Scholar]
- Lugt, P.M. A Review on Grease Lubrication in Rolling Bearings. Tribol. Trans. 2009, 52, 470–480. [Google Scholar] [CrossRef]
- Meijer, D.; Jacobson, B.O.; Lankamp, H. Polymer Thickened Lubricating Grease. Europe Patent 0700986, 28 July 1999. [Google Scholar]
- Salmeron, G.C.; Leckner, J.; Schwack, F.; Westbroek, R.; Glavatskih, S. Greases for electric vehicle motors: Thickener effect and energy saving potential. Tribol. Int. 2022, 167, 107400. [Google Scholar] [CrossRef]
- Leckner, J. Energy efficiency and lubrication mechanisms of polymer thickened greases. In Proceedings of the 27th ELGI Annual General Meeting, Barcelona, Spain, 18–21 April 2015. [Google Scholar]
- Gonçalves, D.; Graça, B.; Campos, A.V.; Seabra, J. On the friction behaviour of polymer greases. Tribol. Int. 2016, 93, 399–410. [Google Scholar] [CrossRef]
- Baart, P.; van der Vorst, B.; Lugt, P.M.; van Ostayen, R.A. Oil-bleeding model for lubricating grease based on viscous flow through a porous microstructure. Tribol. Trans. 2010, 53, 340–348. [Google Scholar] [CrossRef]
- Gonçalves, D.; Graça, B.; Campos, A.V.; Seabra, J.; Leckner, J.; Westbroek, R. Formulation rheology and thermal ageing of polymer greases. Part I: Influence of the thickener content. Tribol. Int. 2015, 87, 160–170. [Google Scholar] [CrossRef]
- Gonçalves, D.; Marques, R.; Graça, B.; Campos, A.V.; Seabra, J.H.; Leckner, J.; Westbroek, R. Formulation, rheology and thermal aging of polymer greases—Part II: Influence of the co-thickener content. Tribol. Int. 2015, 87, 171–177. [Google Scholar] [CrossRef]
- Gonçalves, D.; Pinho, S.; Graça, B.; Campos, A.V.; Seabra, J.H. Friction torque in thrust ball bearings lubricated with polymer greases of different thickener content. Tribol. Int. 2016, 96, 87–96. [Google Scholar] [CrossRef]
- Leckener, J.; Westbroek, R. Polypropylene—A novel thickener technology with many surprises. In Proceedings of the 29th ELGI AGM, Helsinki, Finland, 6–9 May 2017. [Google Scholar]
- Shu, J.; Harris, K.; Munavirov, B.; Westbroek, R.; Leckner, J.; Glavatskih, S. Tribology of polypropylene and Li-complex greases with ZDDP and MoDTC additives. Tribol. Int. 2018, 118, 189–195. [Google Scholar] [CrossRef]
- Martín-Alfonso, J.E.; Valencia, C.; Artega, J.F.; Díaz, M.J.; Franco, J.M. Design of lubricating grease formulations using recycled polypropylene from postconsumer films as thickener agent. J. Appl. Polym. Sci. 2013, 127, 1369–1376. [Google Scholar] [CrossRef]
- Gonçalves, D.; Graça, B.; Campos, A.V.; Seabra, J.; Leckner, J.; Westbroek, R. On the film thickness behaviour of polymer greases at low and high speeds. Tribol. Int. 2015, 90, 435–444. [Google Scholar] [CrossRef]
- Muller, D.; Matta, C.; Thijssen, R.; Bin Yusof, M.N.; Van Eijk, M.C.P.; Chatra, S. Novel polymer grease microstructure and its proposed lubrication mechanism in rolling/sliding contacts. Tribol. Int. 2017, 110, 278–290. [Google Scholar] [CrossRef]
- Farré-Lladós, J.; Casals-Terré, J.; Voltas, J.; Westerberg, L.G. The use of rapid prototyping techniques (RPT) to manufacture micro channels suitable for high operation pressures and μPIV. Rapid Prototyp. J. 2015, 22, 67–76. [Google Scholar] [CrossRef] [Green Version]
- Madlener, K.; Frey, B.; Ciezki, H.K. Generalized reynolds number for non-newtonian fluids. Prog. Propuls. Phys. 2009, 1, 237–250. [Google Scholar] [CrossRef] [Green Version]
- Raffel, M.; Willert, C.E.; Wereley, S.T.; Kopenhans, J. Particle Image Velocimetry; Springer: Berlin, Germany, 2007; ISBN 978-3-030-09855-1/978-3-319-68851-0. [Google Scholar]
- Sieder, E.N.; Tate, G.E. Heat Transferand Pressure Drop of Liquids in Tubes. Ind. Eng. Chem. 1936, 28, 1429–1435. [Google Scholar] [CrossRef]
- Sisko, A.W. The Flow of Lubricating Greases. Ind. Eng. Chem. 1958, 50, 1789–1792. [Google Scholar] [CrossRef]
- Westerberg, L.G.; Lundström, T.S.; Höglund, E.; Lugt, P.M. Investigation of Grease Flow in a Rectangular Channel Including Wall Slip Effects Using Microparticle Image Velocimetry. Tribol. Trans. 2010, 53, 600–609. [Google Scholar] [CrossRef]
- Zhang, Q.; Mugele, F.; van den Ende, D.; Lugt, P.M. A Model Configuration for Studying Stationary Grease Bleed in Rolling Bearings. Tribol. Trans. 2021, 64, 1127–1137. [Google Scholar] [CrossRef]
- Westerberg, L.G.; Farré-Lladós, J.; Li, J.; Höglund, E.; Casals-Terré, J. Grease flow in an elbow channel. Tribol. Lett. 2015, 57, 30. [Google Scholar] [CrossRef]
Publisher’s Note: MDPI stays neutral with regard to jurisdictional claims in published maps and institutional affiliations. |
© 2022 by the authors. Licensee MDPI, Basel, Switzerland. This article is an open access article distributed under the terms and conditions of the Creative Commons Attribution (CC BY) license (https://creativecommons.org/licenses/by/4.0/).