Abstract
The structure and flow behavior of lubricating greases depend on the base oil and the type and concentration of the dissolved thickener. In this study, the linear viscoelastic properties of greases were characterized by combining oscillatory shear and squeeze flow covering a broad frequency range (0.1–105 rad s−1). Multiple-particle tracking (MPT) microrheology and scanning electron microscopy (SEM) provided further insight into local viscoelastic properties and sample structure on a submicron-length scale. The type and viscosity of the base oil did not affect the absolute value of the complex viscosity and the filament shape formed by a given thickener. High-frequency shear modulus data, however, indicated that the thickener lithium 12-hydroxystearate formed stiffer networks/filaments in poly-α-olefins than in mineral oils. As expected, the viscosity increased with increased thickener concentrations, but microscopy and high-frequency rheometry revealed that the thickness, length, and stiffness of the individual filaments did not change. In mineral oil, the 12-hydroxystearate thickeners yielded higher viscosity than the corresponding stearates with the same metal ion. The filamentous lithium thickeners created stronger networks than the roundish aggregates formed by magnesium and zinc stearate. Network mesh sizes varying between approximately 100 nm and 300 nm were consistently determined from SEM image analysis and MPT experiments. The MPT experiments further disclosed the existence of gel-like precursors of approximately 130 µm at thickener concentrations far below the critical value at which a sample-spanning network resulting in a characteristic grease texture is formed.
1. Introduction
Model greases with metal soaps as thickeners have been widely investigated [1,2,3,4,5,6,7]. Thickeners may form a network and keep the base oil in this structure due to van der Waals and capillary forces, dipole–dipole and ionic interactions, or hydrogen bonds [1]. A broad range of experimental techniques including rheological measurements as well as microscopic methods such as scanning electron microscopy (SEM) or atomic force microscopy (AFM) have been employed to elucidate the thickener structure in lubricating greases [2,3,4,5,6,7].
The thickener mainly controls the viscosity of a lubricating grease in the low shear rate range, whereas the base oil determines the viscosity in the high shear range due to the destruction of the thickener structure by shear forces [2].
Small-amplitude oscillatory shear (SAOS) is a nondestructive rheological measurement method. In this method, the storage and loss moduli are determined as functions of the applied angular frequency ω. The storage modulus G′ represents the elasticity of the sample and, in the case of greases, is related to the elastic properties inferred by the thickener network. The loss modulus G″ represents the viscous properties of the sample and, in the case of greases, can be related to the properties of the included base oil. The ratio of G″ to G′ is called loss factor tan(δ). It provides information about the ratio of viscous to elastic properties of the sample, independent of the absolute values of the moduli, and may reflect changes in the thickener network structure, independent of the absolute value of the viscosity. The complex viscosity η* is related to the storage modulus and the loss modulus: η* = (G′ + iG″). Delgado et al. [2] investigated both the complex viscosity and the loss factor tan(δ) as functions of ω. In this study, lubricating greases based on lithium soap and paraffinic mineral oil were investigated and the thickener concentration was varied systematically. The absolute value of the complex viscosity |η*| increased with increased thickener concentrations but was found to be independent of the base oil viscosity. In contrast, the loss factor depended only on the base oil viscosity and not on the thickener concentration. The reason for that behavior remained elusive.
Using microscopic methods (SEM and AFM), it was found that the structure of a lubricating grease containing lithium 12-hydroxystearate as the thickener (and usually mineral oil as the base oil) consisted of twisted and entangled fibers [2,3,4,5,6]. Furthermore, the SEM images in [2] showed that this structure was formed only at thickener concentrations > 14%, and the higher the thickener concentration, the more entanglements were formed. At lower thickener concentrations, platelets were found. The higher the base oil viscosity, the longer the fibers, the larger the cavities, and the less the fibers were entangled. The fiber diameters in lithium greases (lithium 12-hydroxystearate or lithium complex soaps as thickeners), determined from SEM and AFM images, were between 0.1 and 0.5 µm [3,5,6]. For the SEM images, the oil must be removed from the grease. Different fiber diameters found in SEM and AFM images are attributed to the washing out of the base oil from the grease structure [3]. Different base oils have no effect on the fiber diameter [5]. In greases with calcium soaps or polyureas as thickeners, spherical particles or platelets were formed, respectively [4,7].
Despite the numerous efforts described above, understanding the rheological behavior of complex systems such as greases remains a challenging task. It is still not fully understood how the chemical nature and viscosity of a base oil affect the structure of a given metal soap and, in turn, the rheological properties of the grease. The same is true regarding the effect of different metal ions or variations in the hydrocarbon chain of the soap. Therefore, we combined, for the first time, small-amplitude oscillatory shear and squeeze flow measurements to characterize the linear viscoelastic properties of greases in a broad frequency range. This provides new insight into the interplay between the base oil and thickener network. We complemented these investigations of bulk rheological properties with SEM and multiple-particle tracking (MPT) microrheology to gain deeper insight into the microstructure of the greases on a length scale of several hundred nanometers, particularly regarding the mesh size of the thickener network. MPT is used here for the first time to characterize lubricating greases. However, it is a proven measurement method for other complex fluids with heterogeneous structure such as polymeric thickener solutions [8] or fiber suspensions [9]. Based on this comprehensive set of data, we will finally discuss how type and amount of thickener as well as the base oil viscosity determine the microstructural features of greases and how these, in turn, affect the macroscopic viscoelastic properties.
2. Materials and Methods
2.1. Materials
Table 1 lists the base oils used. Lithium 12-hydroxystearate, lithium stearate, calcium 12-hydroxystearate, calcium stearate, zinc stearate, and magnesium stearate were used as thickeners. All compositions of the investigated greases (different base oil/thickener combinations and thickener concentrations between w = 11 and 22 wt %) are listed in the Appendix A in Table A1.

Table 1.
Base oils used in this study; density and viscosity data refer to a temperature of 20 °C.
2.2. Grease Manufacturing
The base oil and the thickener were heated to the melting point of the thickener while continuously stirring until melting was completed. The melting points of the thickeners are listed in Table 2. The resulting greases were then cooled and homogenized on a three-roll mill. Finally, the greases were vented in a vacuum-stirred vessel.
Table 2.
Thickeners used in this work with the corresponding melting temperatures.
2.3. Lubricating Grease Characterization
2.3.1. Oscillatory Shear Experiments
Oscillatory shear experiments were performed at 20 °C within the previously determined linear viscoelastic (LVE) range (shear stress amplitude between 5 and 50 Pa, depending on the sample) in the frequency range from 100 to 0.1 rad s−1 using a Physica MCR 501 from Anton Paar (Ostfildern-Scharnhausen, Germany) equipped with a plate–plate geometry (25 mm diameter, 1 mm gap height). Each measurement was performed three times, each time with a new sample.
2.3.2. Oscillatory Squeeze Flow Experiments
Oscillatory squeeze flow in a piezo axial vibrator (PAV) [10] was used to extend the frequency range up to 105 rad s−1. Measurements were carried out at 20 °C. Each measurement was performed three times, each time with a new sample.
2.3.3. Scanning Electron Microscope (SEM)
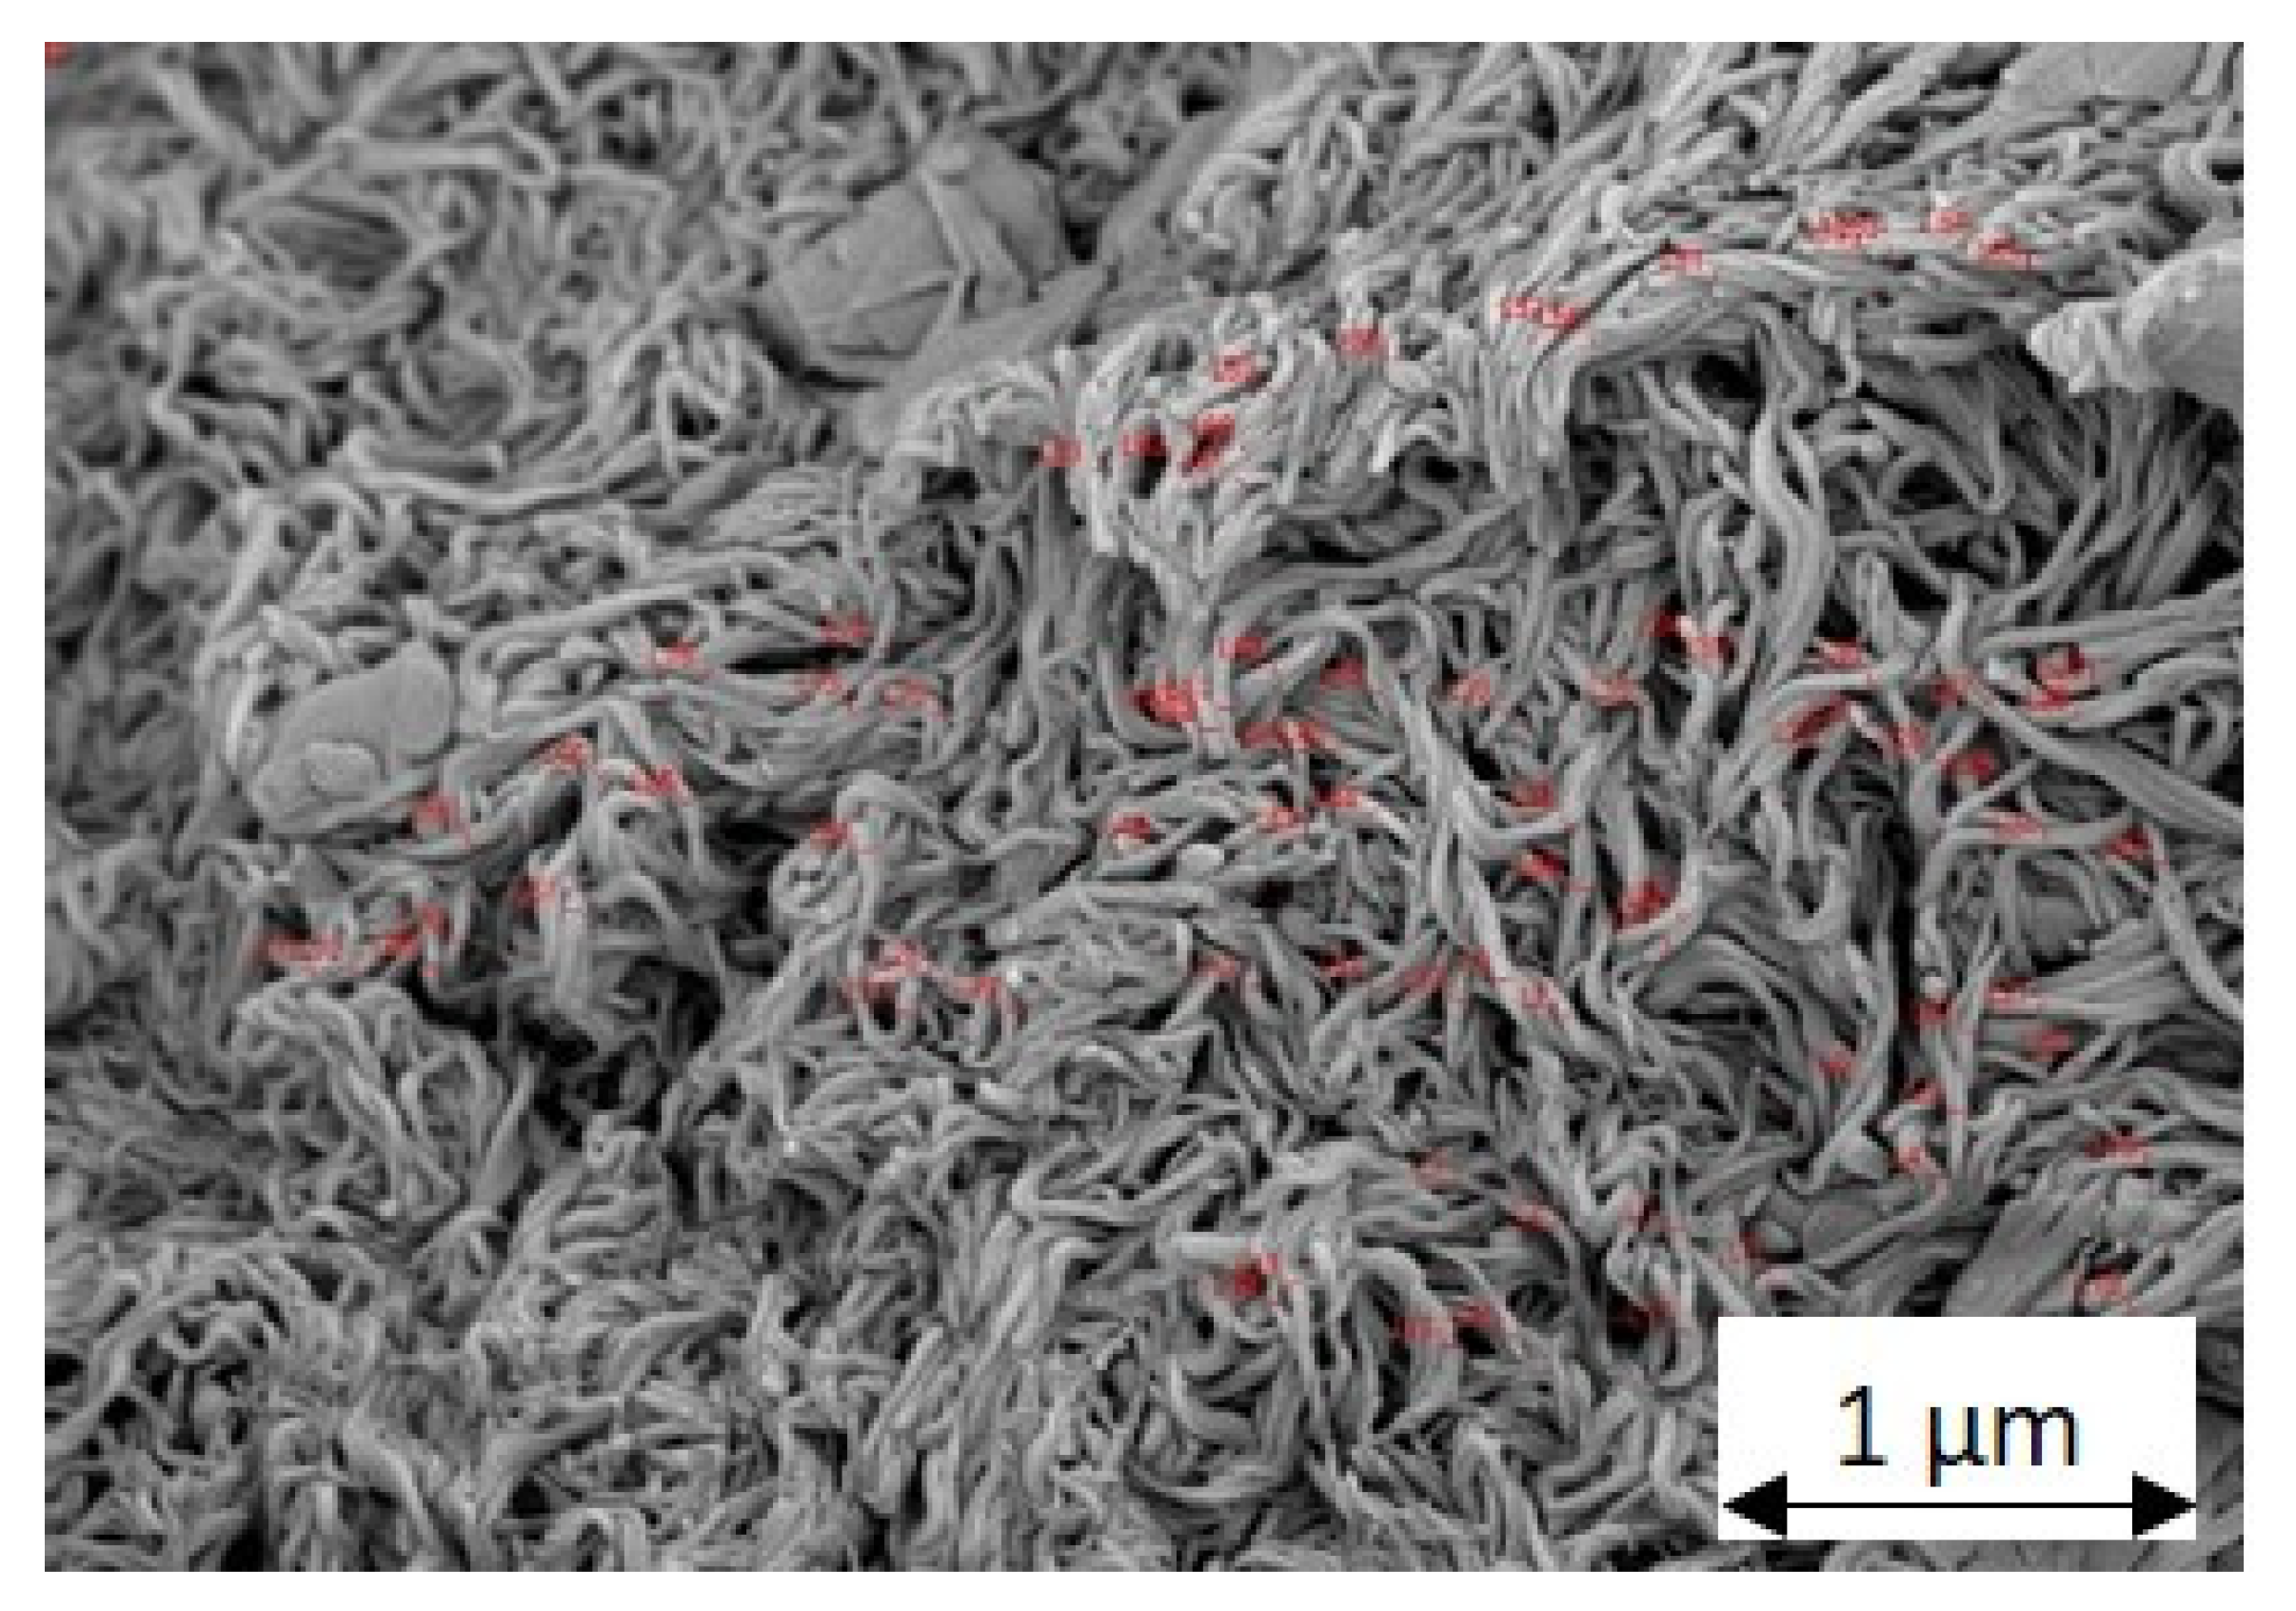
Images were produced with a Hitachi S-4500 scanning electron microscope at an accelerating voltage of 5–7.5 kV. The grease samples were previously prepared as follows. The oil was washed out following the method of Anderson et al. [11]. In the first step, the oil was removed from the grease structure using filter paper and hexane. A thin layer of grease was applied with a spatula to an area of approximately 1 cm² at the edge of the filter paper (VWR 401, diameter 70 mm, particle retention 12–15 µm). The filter paper was rolled and immersed in a beaker (4 mL) containing hexane. The part of the filter roll containing the grease sample remained above the liquid level. After approximately 4–5 h and refilling the hexane 1–2 times, the hexane displaced the base oil and only the dry thickener remained. These were then mounted on a sample holder and sputtered with a platinum/palladium alloy (70/30 wt %). The filament diameters from the SEM images were evaluated using Image Processing System software (iPS, Visiometrics, Konstanz, Germany) (Figure 1).
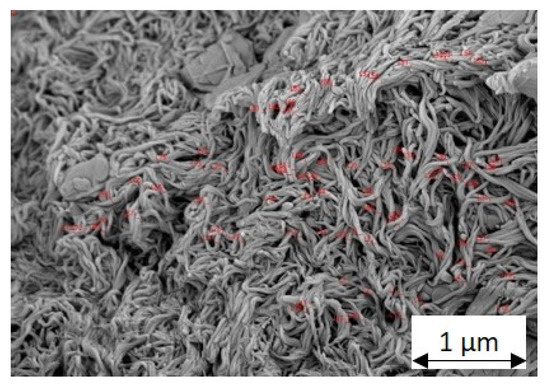
Figure 1.
SEM image of the grease with PAG as base oil and 15 wt % lithium 12-hydroxystearate as thickener. The red lines are the selected and evaluated filament diameters.
To compare the results of the SEM images with the results of the MPT measurements, the mesh size ξ was evaluated using both measurement methods. A simple geometric model was used to estimate the characteristic values of the fiber diameter dFiber and the mesh size ξSEM of the thickener network from the SEM images: the thickener filaments are arranged on a cubic lattice with an edge length a (Figure 2). Each edge corresponds to a cylindrical fiber with the diameter dFiber and the length a. Each cube has 12 edges, but each fiber belongs to four neighboring cells, so in effect, three fibers belong to each cube.
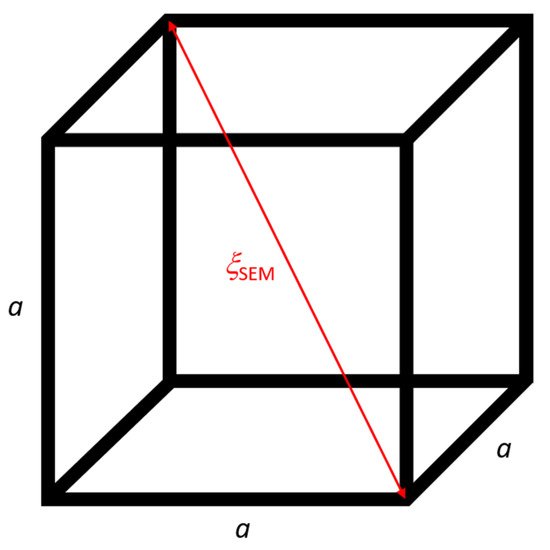
Figure 2.
Basic geometric model for evaluating the mesh size in greases from SEM images: each edge of the cube corresponds to a fiber with diameter dFiber and edge length a; the spatial diagonal corresponds to the mesh size ξSEM of the greases (shown here as red line).
The total volume of fibers in one cube (3Vfiber) results from the thickener concentration ϕ and the total volume of the cube Vcube. The density of the greases was determined to be approximately 1 g cm3, so that the volume concentration ϕ is approximately equal to the mass concentration w:
This gives the edge length a:
The spatial diagonal of the cube, then, corresponds to the mesh size ξSEM of the grease:
This evaluation method assumes that when washing out with hexane, the fiber thickness does not change even if the structure shrinks.
2.3.4. Multiple-Particle Tracking (MPT)
The optical microrheological measurement method MPT is based on observing the Brownian motion of tracer particles introduced into the sample. This method was developed for polymer melts and solutions [12] and was applied to grease structures here for the first time. Each measurement was performed three times at 20 °C, with a new sample each time.
The mean square displacement (MSD), which describes how far a particle has moved within a specific delay or lag time τ, is evaluated from the particle trajectories.
Mason and Weitz [13] derived a relationship between the MSD ⟨⟩, which depends on the lag time τ, and the complex shear modulus G*, which depends on the angular frequency ω. The Laplace transform of the MSD is related to G* via the Stokes–Einstein relation [14,15]:
where R is the radius of the particles, kB is the Boltzmann constant, and T is the temperature.
If the particles are in an ideally elastic surrounding, the shear modulus G0 is given by [16]:
In ideal viscous fluids, the viscosity can be calculated using the diffusion coefficient D [13]:
with
Here, we used hydrophobized fluorescent melamine resin particles with a diameter of 366 nm (PS-FluoOrange-S886-1, microparticles GmbH, Berlin) as tracer particles. These particles were kneaded into the grease directly on a microscope slide with a spatula. To examine the oils, the particles were dispersed by drawing up the mixture several times with a pipette from a microcentrifuge tube; then, the sample was also placed on the microscope slide. The Brownian motion of the tracer particles was observed using an Axio Observer D1 inverted fluorescence microscope (Carl Zeiss, Oberkochen, Germany). Fifty images per second with a size of 127 × 127 µm were recorded with a Zyla X sCMOS camera (Andor Technology, Ireland, with 21.8 mm diagonal of the sensor and 2560 × 2160 pixels squared). N = 20–100 tracers were on each image. Particle motion was analyzed using Image Processing System software (iPS, Visiometrics, Konstanz, Germany) and a customized MATLAB code based on the widely used Crocker and Grier tracking algorithm [17].
If the particles are in a homogeneous surrounding, the mesh size ξ can be calculated from the plateau modulus G0 [12]:
3. Results and Discussion
3.1. Oscillatory Shear and Squeeze Flow Experiments
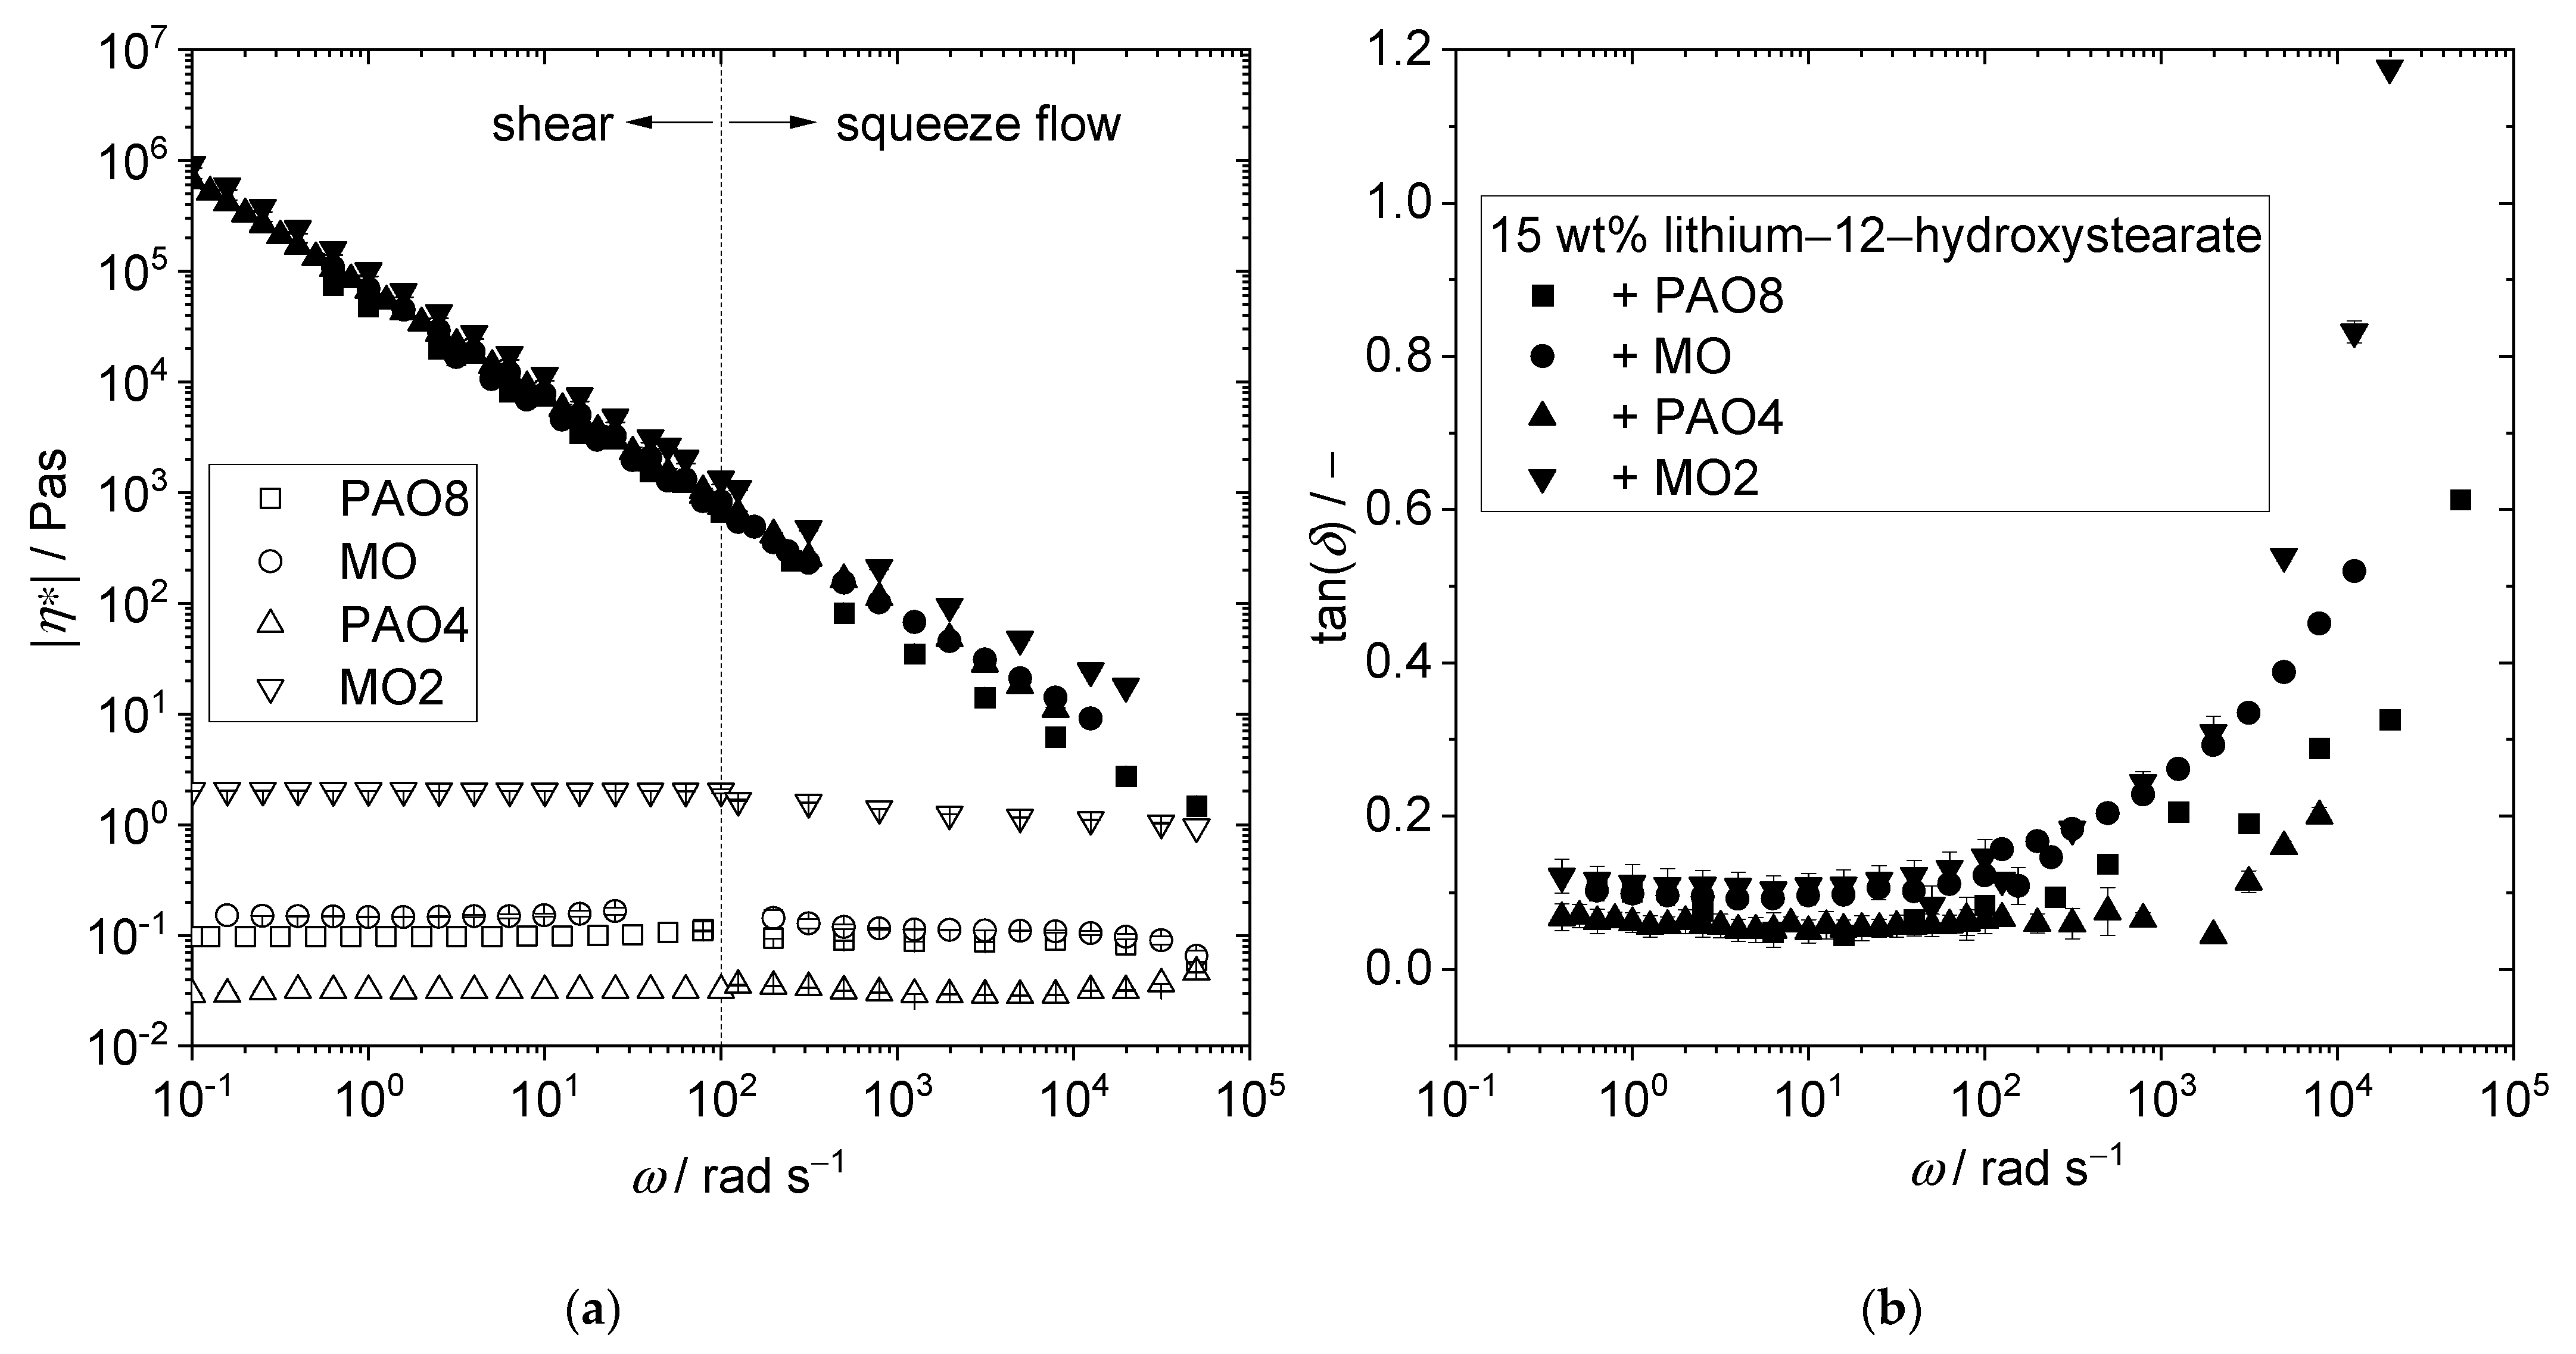
The absolute values of the complex viscosity functions of the greases with 15 wt % lithium 12-hydroxystearate as the thickener and the different mineral and poly-α-olefin base oils were similar, although the absolute value of the complex viscosity of the base oil differed by about two orders of magnitude (Figure 3a). However, the grease made from the highly viscous base oil (MO2) had a complex viscosity only 1.4 times higher than the grease based on the low complex viscosity base oil (MO) (at 1 rad s−1: |η∗|MO2+15% Li-12-OH = 100,000 Pa s and |η∗|MO+15% Li-12-OH = 70,000 Pa s). The complex viscosity of the poly-α-olefins differed by a factor of 3 (|η∗|PAO8 = 0.1 Pa s, |η∗|PAO4 = 0.3 Pa s), but the greases produced with them had approximately the same complex viscosity (at 1 s−1: ηPAO+15% Li-12-OH = 50,000 Pa s). Different base oil viscosities (|η∗|oil = 0.03–2 Pa s) and different chemical compositions (mineral oils and poly-α-olefins) resulted in similar grease complex viscosities (|η∗|grease ( 1 rad s−1) = 50,000–100,000 Pa s). A dependence of grease complex viscosity on the base oil type was only observed in the high frequency range ( 1 rad s−1), where the contribution of the thickener structure was less pronounced. The absolute value of the complex viscosity varied by less than an order of magnitude but with no systematic trend regarding base oil viscosity.
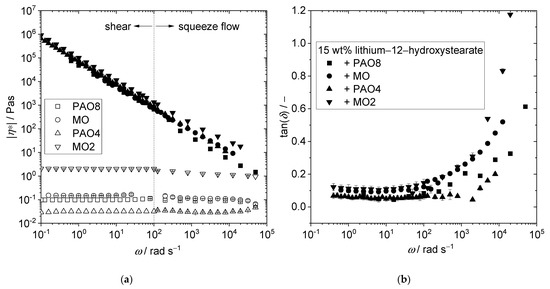
Figure 3.
Influence of base oil viscosity and type on rheological grease properties. (a) Absolute value of complex viscosity |η*| as a function of the angular frequency ω of the pure base oils with different viscosities (open symbols) and corresponding lubricating greases made from 15 wt % lithium 12-hydroxystearate (closed symbols) obtained at 20 °C. The data in the low frequency range (10−1–102 rad s−1) were obtained from oscillatory shear experiments and in the higher frequency range from oscillatory squeeze flow experiments. (b) Corresponding loss factor tan(δ) as a function of ω at 20 °C.
For the grease with MO2 as the base oil, the frequency dependence of the storage and loss moduli, G’ and G’’, respectively, is exemplarily shown in the appendix (Figure A1 in Appendix B). Typically, G’ is larger than G’’ essentially in the angular frequency range up to 104 rad s−1. The crossover of these quantities is approached or reached only in the high frequency range accessible here (ω > 104 rad s−1).
In the following, we discuss the differences between different greases in terms of the loss factor tan(δ) (Equation (9)). Note that the G’’ data were corrected for the base oil contribution, since we were interested only in the contribution from the thickener network.
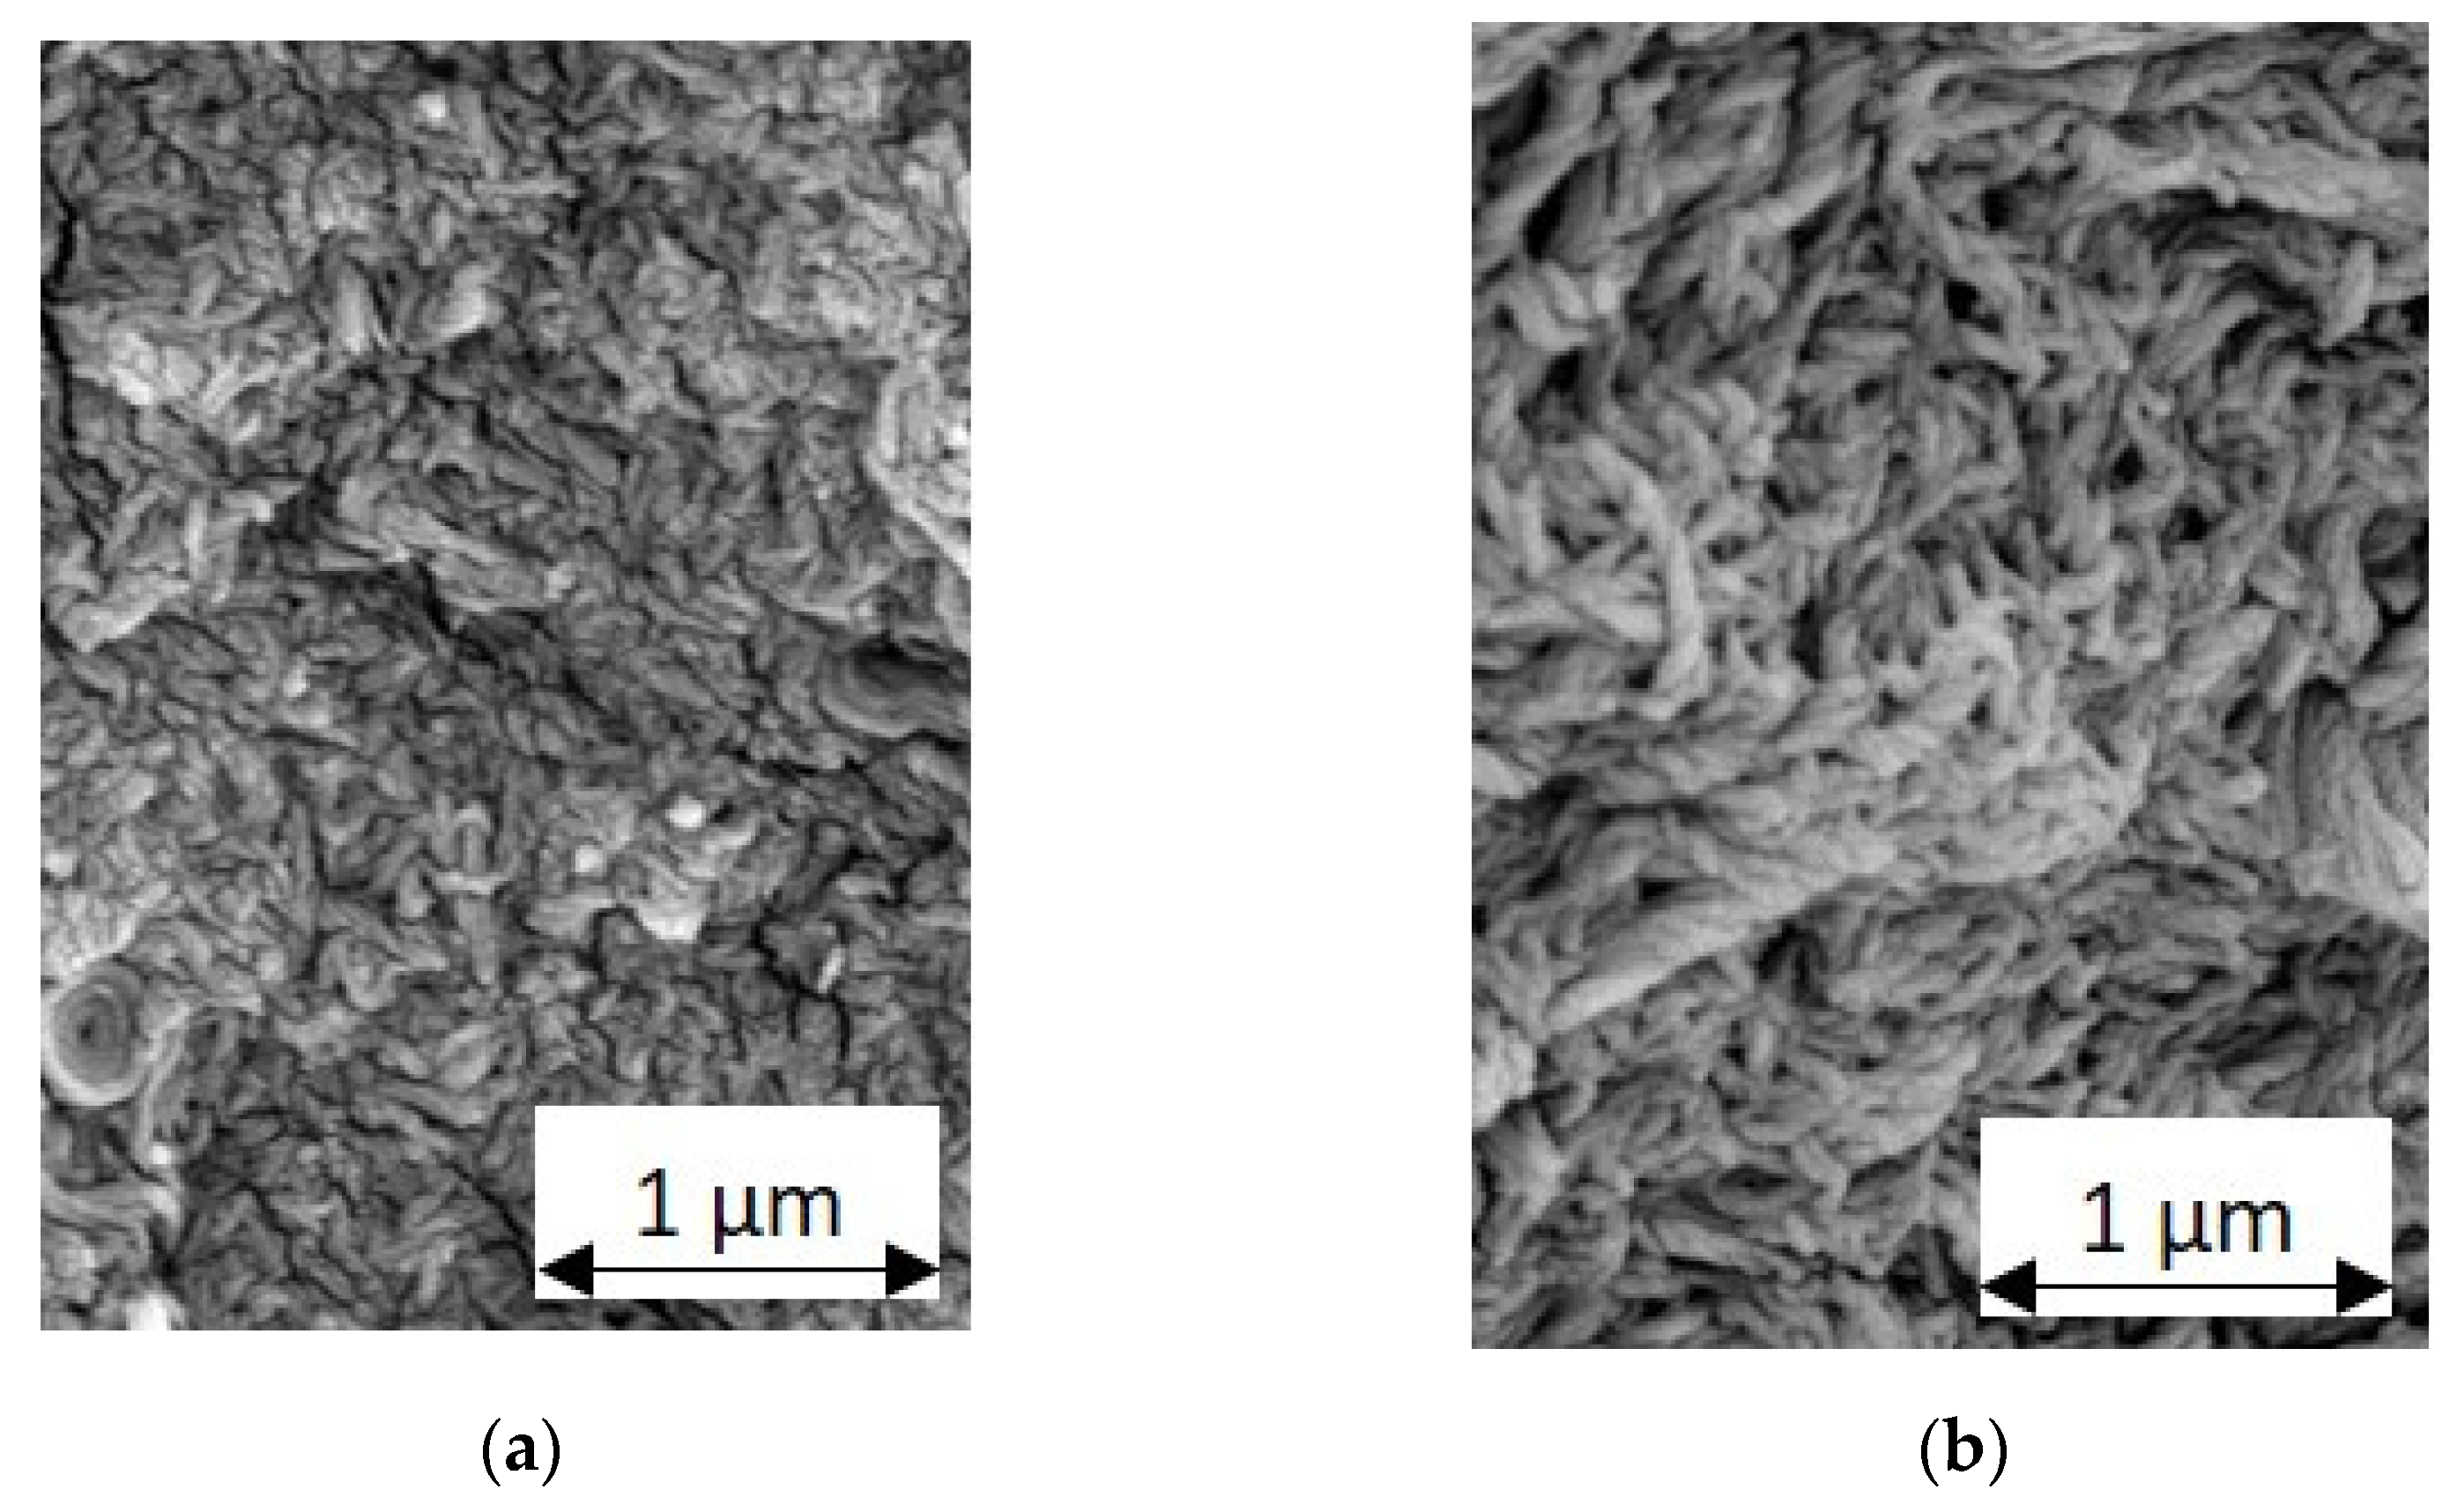
Looking at the loss factors (Figure 3b), differences in the grease structure become apparent. At low frequencies at which the elastic response was dominated by the crosslink or entanglement density, there was little difference between the greases made from different base oils. Considering, however, the loss factor at high frequencies, the greases made from poly-α-olefins (PAO8 and PAO4) exhibited lower tan(δ) values than the greases based on mineral oils (MO and MO2). This means that for the poly-α-olefin-based greases, the elastic properties are more significant, indicating that the thickener formed a stronger network. At high frequencies, the loss factor of the grease with MO2 as the base oil (highest viscosity) was the highest, whereas the grease made from the base oil with the lowest viscosity (PAO4) exhibited the lowest loss factor. Delgado et al. [2] attributed the higher loss factor to the weaker structure (= lower influence of G′) of the network. They drew this conclusion from SEM images that showed that a network with larger fibers, lower entanglement density, and larger cavities was formed with increasing base oil viscosity. These significant structural properties can be seen in the SEM images of the greases examined in this study (Figure 4). Moreover, the tan(δ) data show that the base oil has a significant influence on the structure of the thickener. Given that at high frequencies, the viscoelastic properties are dominated by the contribution from individual thickener filaments, our data indicate that the base oil had a strong impact on the structure of these filaments, e.g., their stiffness.
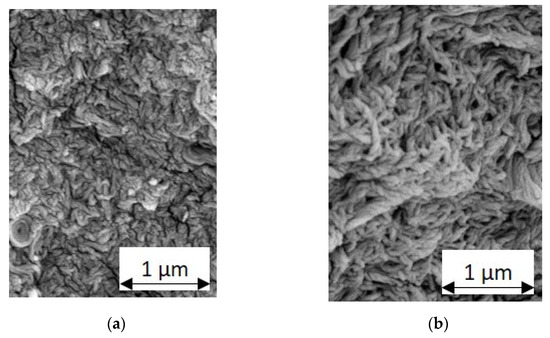
Figure 4.
SEM images of the greases with 15 wt % lithium 12-hydroxystearate as thickener and mineral oil as base oil: (a) base oil viscosity ηMO = 0.12 Pas; (b) base oil viscosity ηMO2 = 2 Pas.
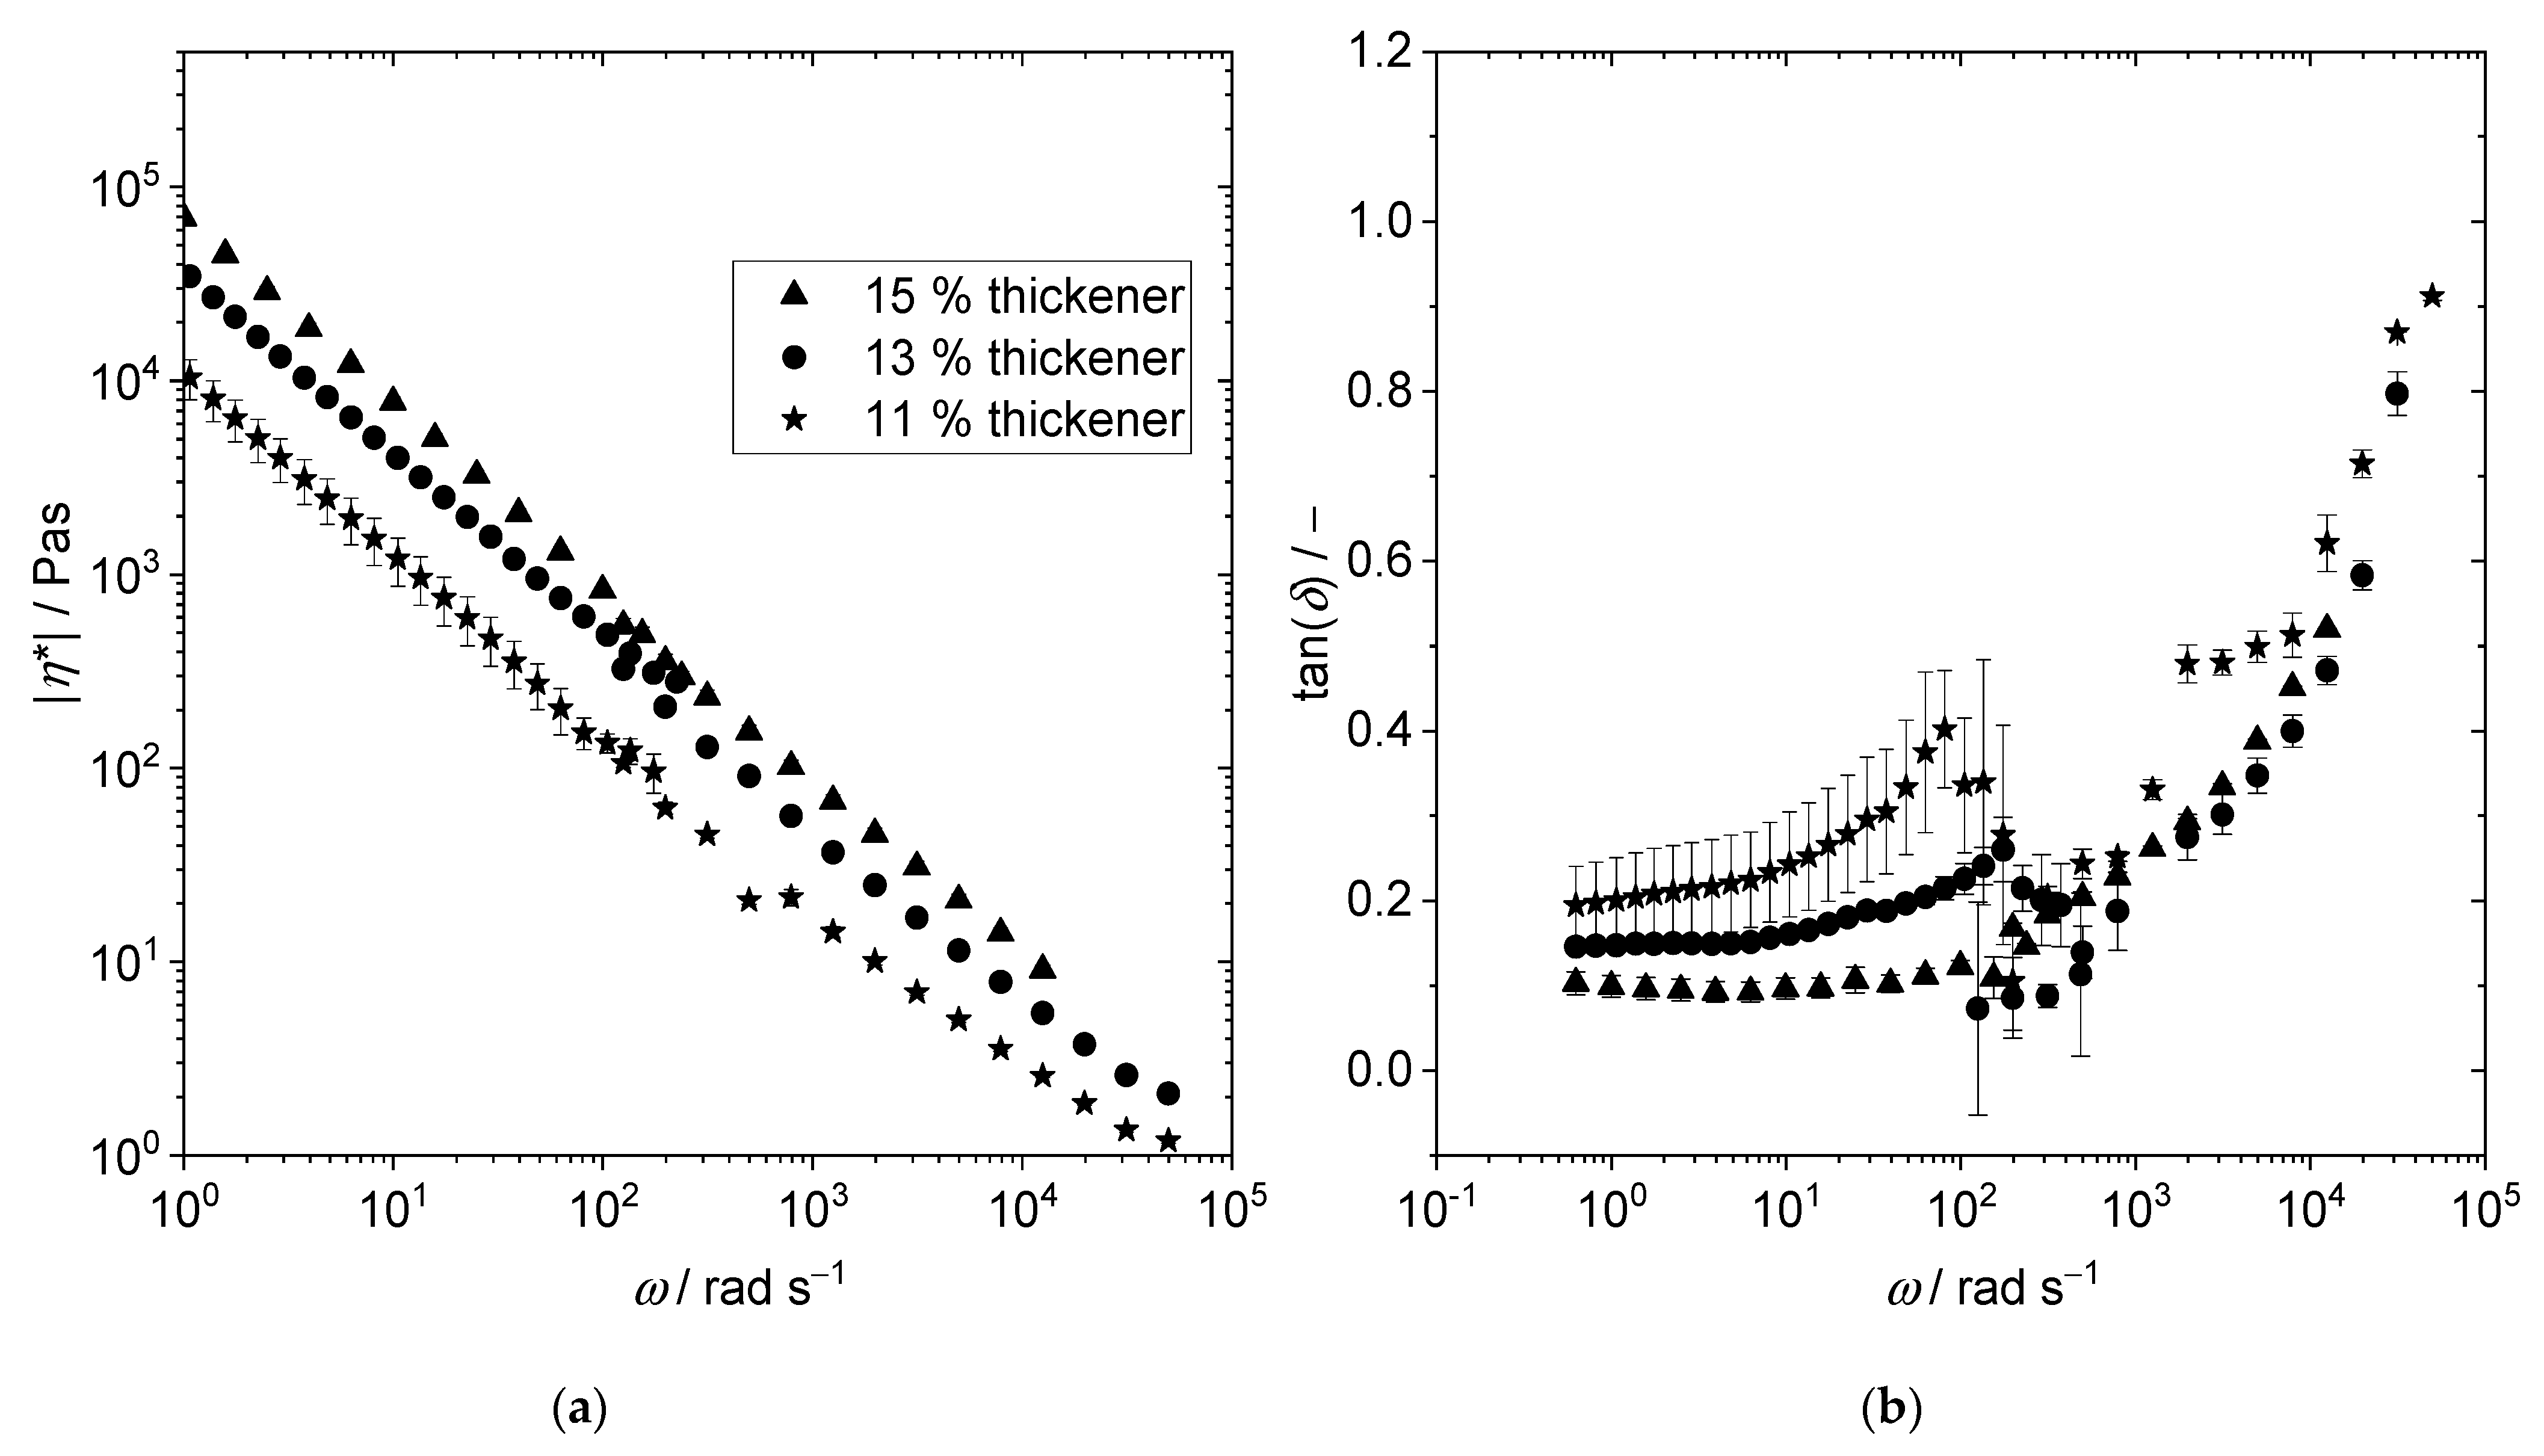
To investigate the influence of thickener concentration on complex viscosity and thickener structure, greases were prepared with mineral oil (MO) as the base oil and lithium 12-hydroxystearate (11, 13, and 15 wt %) as the thickener. As expected, complex viscosity increased with increased thickener concentrations, independent of the angular frequency (Figure 5a).
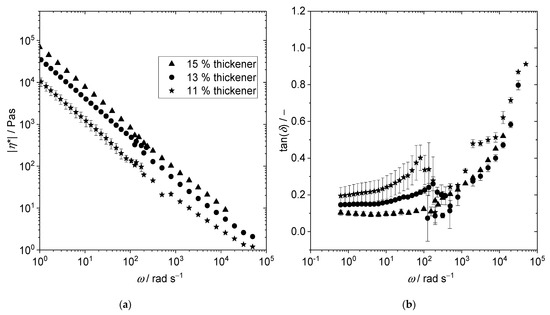
Figure 5.
Influence of thickener concentration on rheological grease properties. (a) Absolute value of complex viscosity |η*| as a function of the angular frequency ω for lubricating greases with mineral oil as base oil and different amounts of lithium 12-hydroxystearate as thickener (11, 13, and 15 wt %) obtained at 20 °C. The data for the low frequency range (10−1–102 rad s−1) were obtained from oscillatory shear experiments and for the higher frequency range from oscillatory squeeze flow experiments. (b) Corresponding loss factor tan(δ) as a function of ω at 20 °C.
The loss factor (Figure 5b) in the low frequency range decreased with increased thickener concentrations, i.e., the contribution of elastic properties increased, indicating that the thickener filament network became stiffer, and its crosslink density increased, which can be concluded from the increase in the value of the shear modulus.
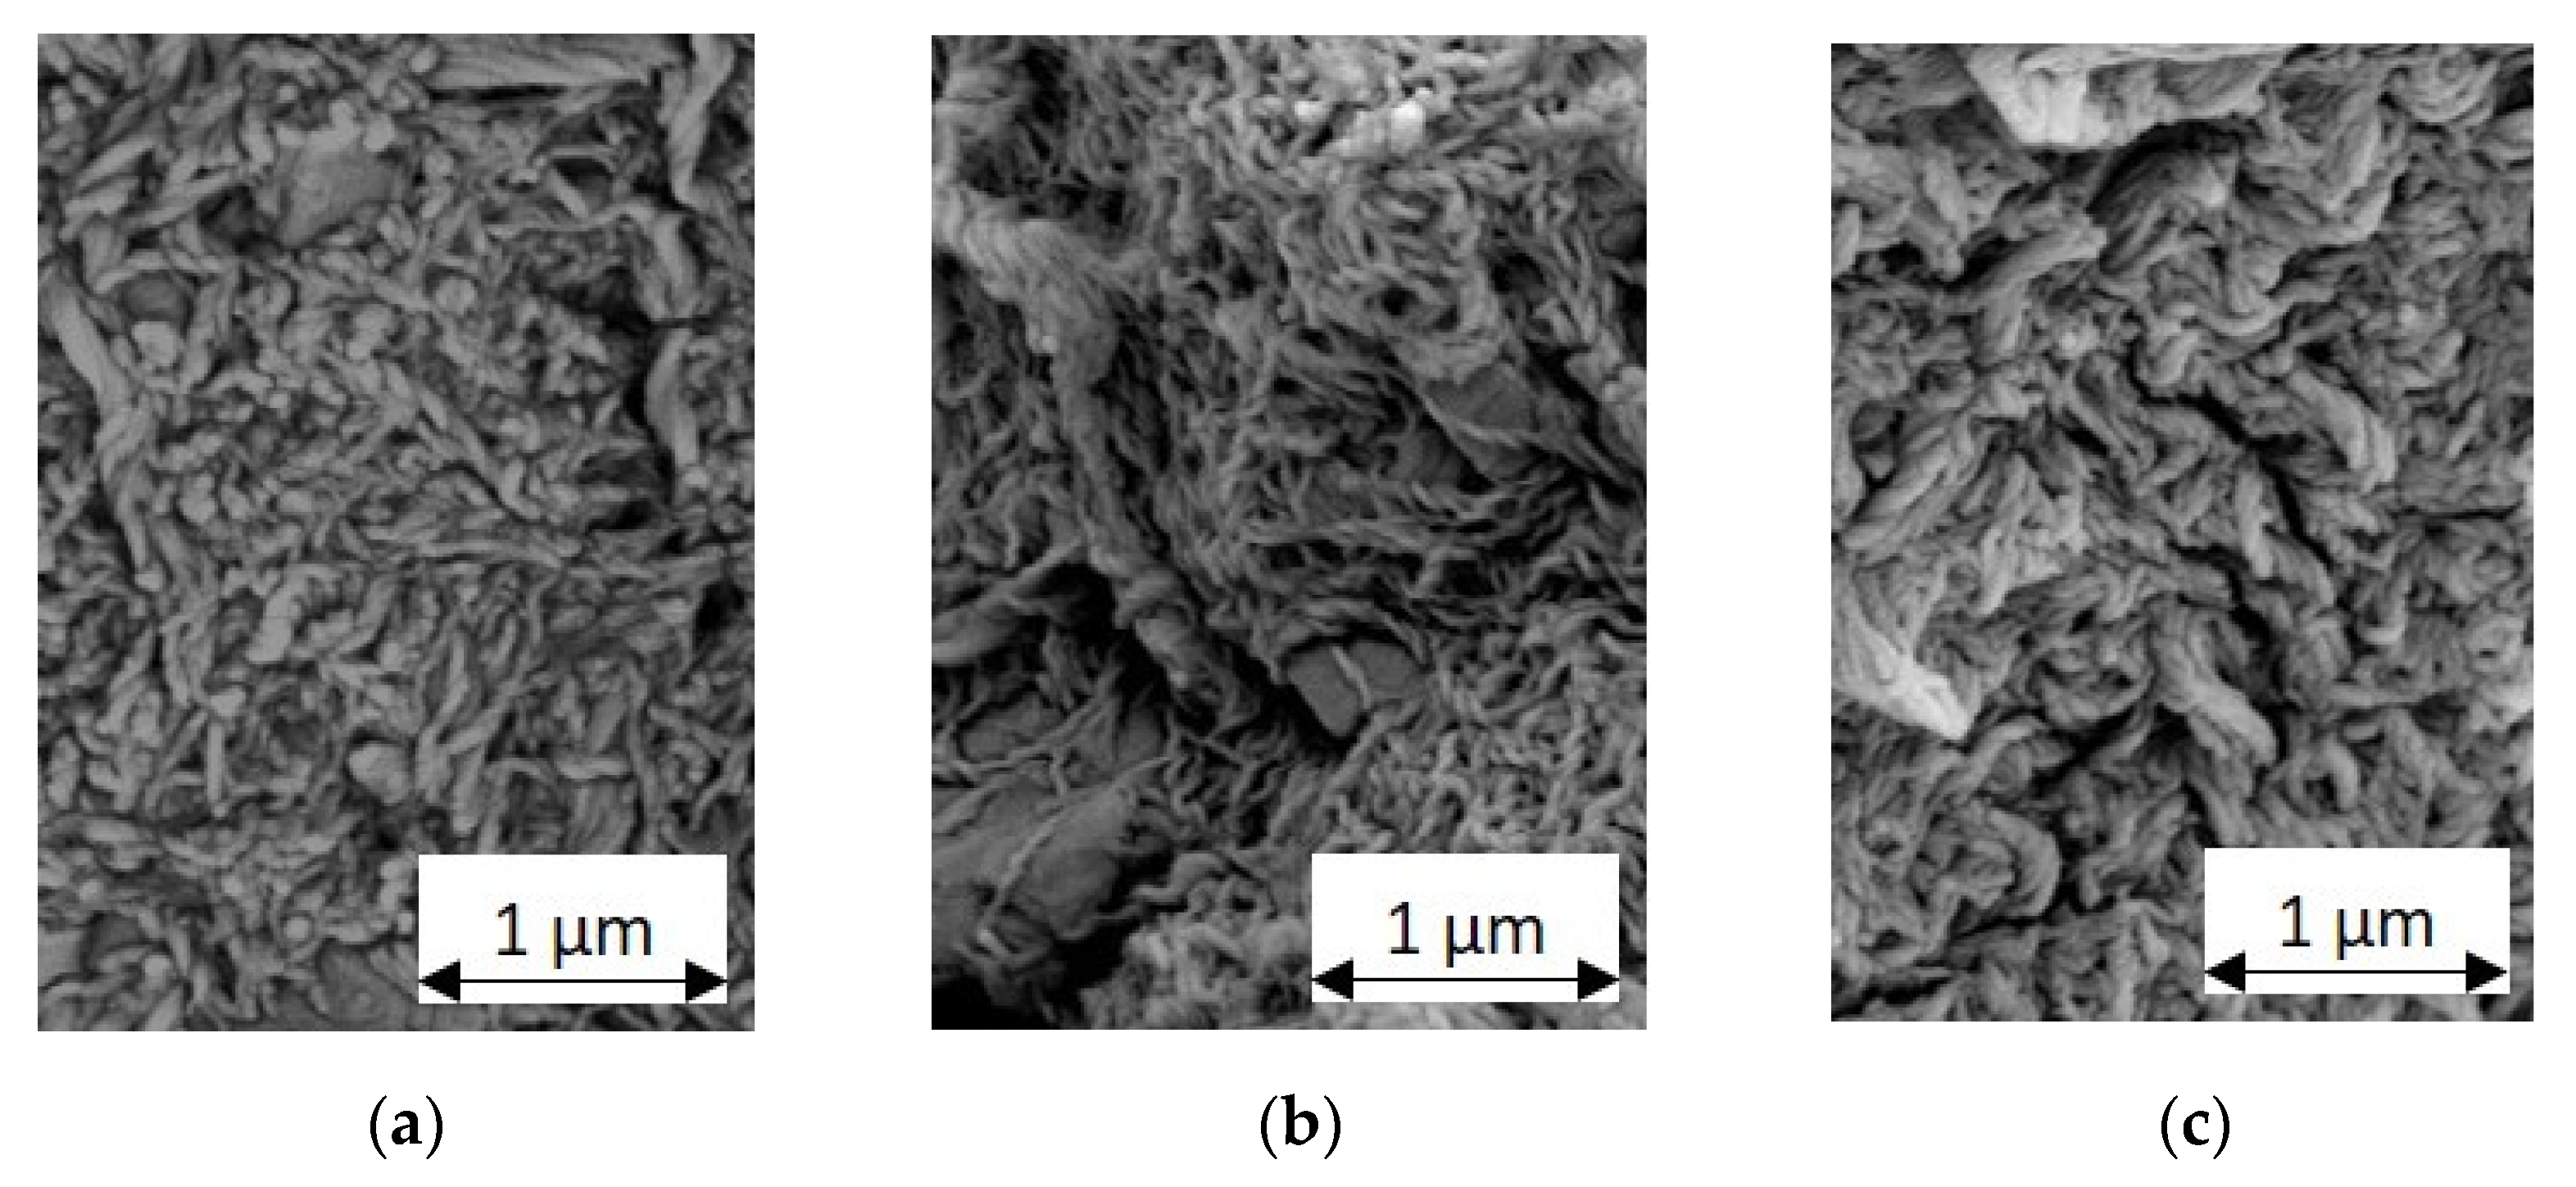
In the high frequency range, the loss factor was dominated by relaxation phenomena occurring at shorter time and length scales. Here, it was independent of the thickener concentration and dominated by the contribution from individual thickener filaments, which do not vary in this sample series. In the SEM images shown in Figure 6, no differences regarding the thickness or length of thickener filaments can be seen for this series of concentrations.
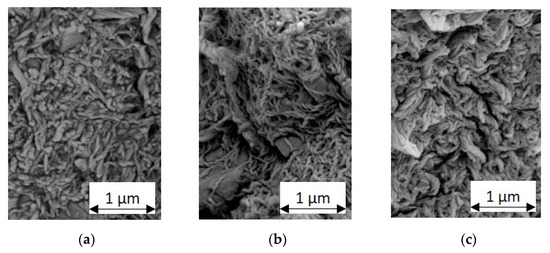
Figure 6.
SEM images of the greases with mineral oil as base oil and lithium 12-hydroxystearate as thickener at different concentrations: (a) 11 wt %; (b) 13 wt %; and (c) 15 wt %.
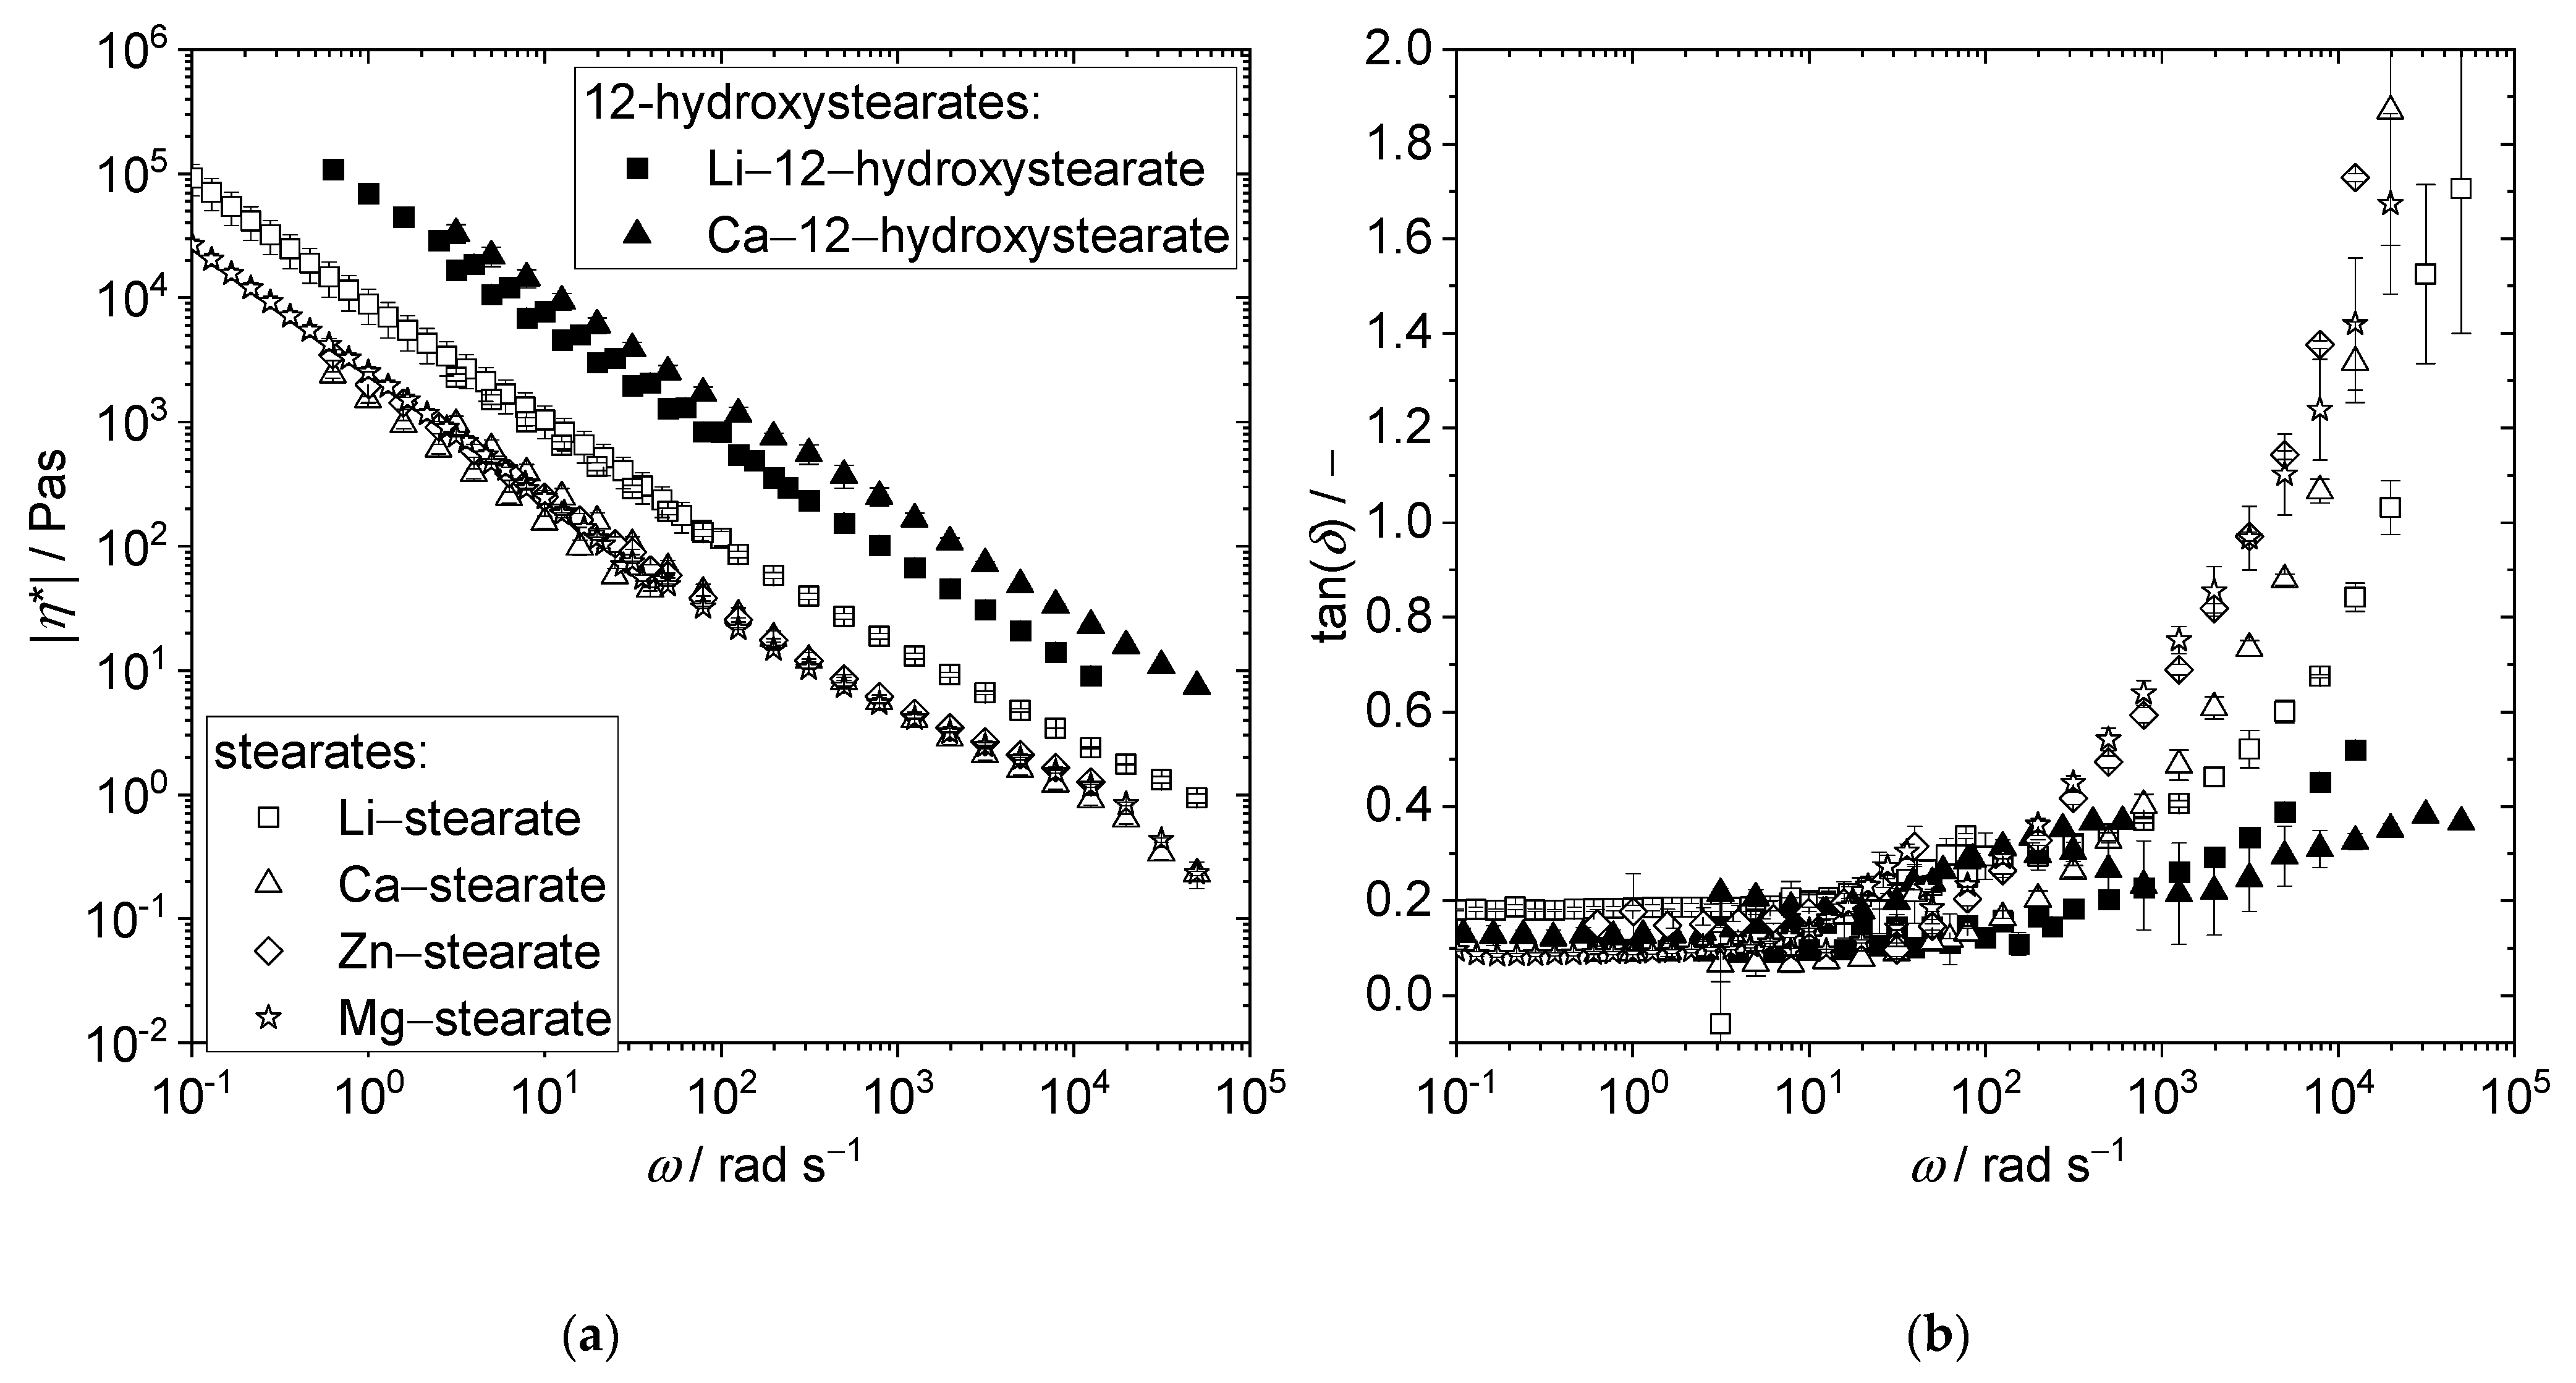
The complex viscosity of the greases with 15 wt % 12-hydroxystearates as thickeners (filled symbols in Figure 7a: lithium 12-hydroxystearate or calcium 12-hydroxystearate) showed higher values than the greases with the corresponding stearates as thickeners (open symbols in Figure 7a: lithium stearate or calcium stearate).

Figure 7.
Influence of thickener type on rheological grease properties. (a) Absolute value of complex viscosity |η*| as a function of the angular frequency ω of lubricating greases made from mineral oil (MO) as base oil and 15 wt % of different thickeners (lithium 12-hydroxystearate, calcium 12-hydroxystearate, lithium stearate, calcium stearate, zinc stearate, and magnesium stearate) obtained at 20 °C. The data for the low frequency range (10−1–102 rad s−1) were obtained from oscillatory shear experiments and for the higher frequency range from oscillatory squeeze flow experiments. (b) Corresponding loss factor tan(δ) as a function of ω at 20 °C.
The effect of the metal ion valence on grease complex viscosity can be seen in the four greases with stearates as thickeners: the monovalent thickener lithium stearate had the highest complex viscosity, whereas the divalent calcium, zinc, and magnesium stearate thickeners exhibited lower complex viscosities independent of the metal ion type.
Figure 7b shows the frequency-dependent loss factors of the different greases. In the low frequency range, the elastic response due to the filament network dominated and tan(δ) values were below 0.2, whereas in the high frequency range, the viscous contribution of the oil became increasingly dominant.
In this range, the greases with 12-hydroxystearates as thickeners had lower loss factors compared to the greases with stearates as thickeners. The loss factor for the grease made from the monovalent thickener was significantly lower than those of the greases based on divalent thickeners. This clearly indicates that different filament and network structures were present in the greases based on the same oil. The drastic differences in tan(δ) at high frequencies may further indicate that some of the thickener was dissolved in the oil, thus increasing its complex viscosity. The hydroxystearates would then be less soluble than the stearates; the highest solubility was indicated for the stearates including two alkyl chains, in line with their higher hydrophobicity.
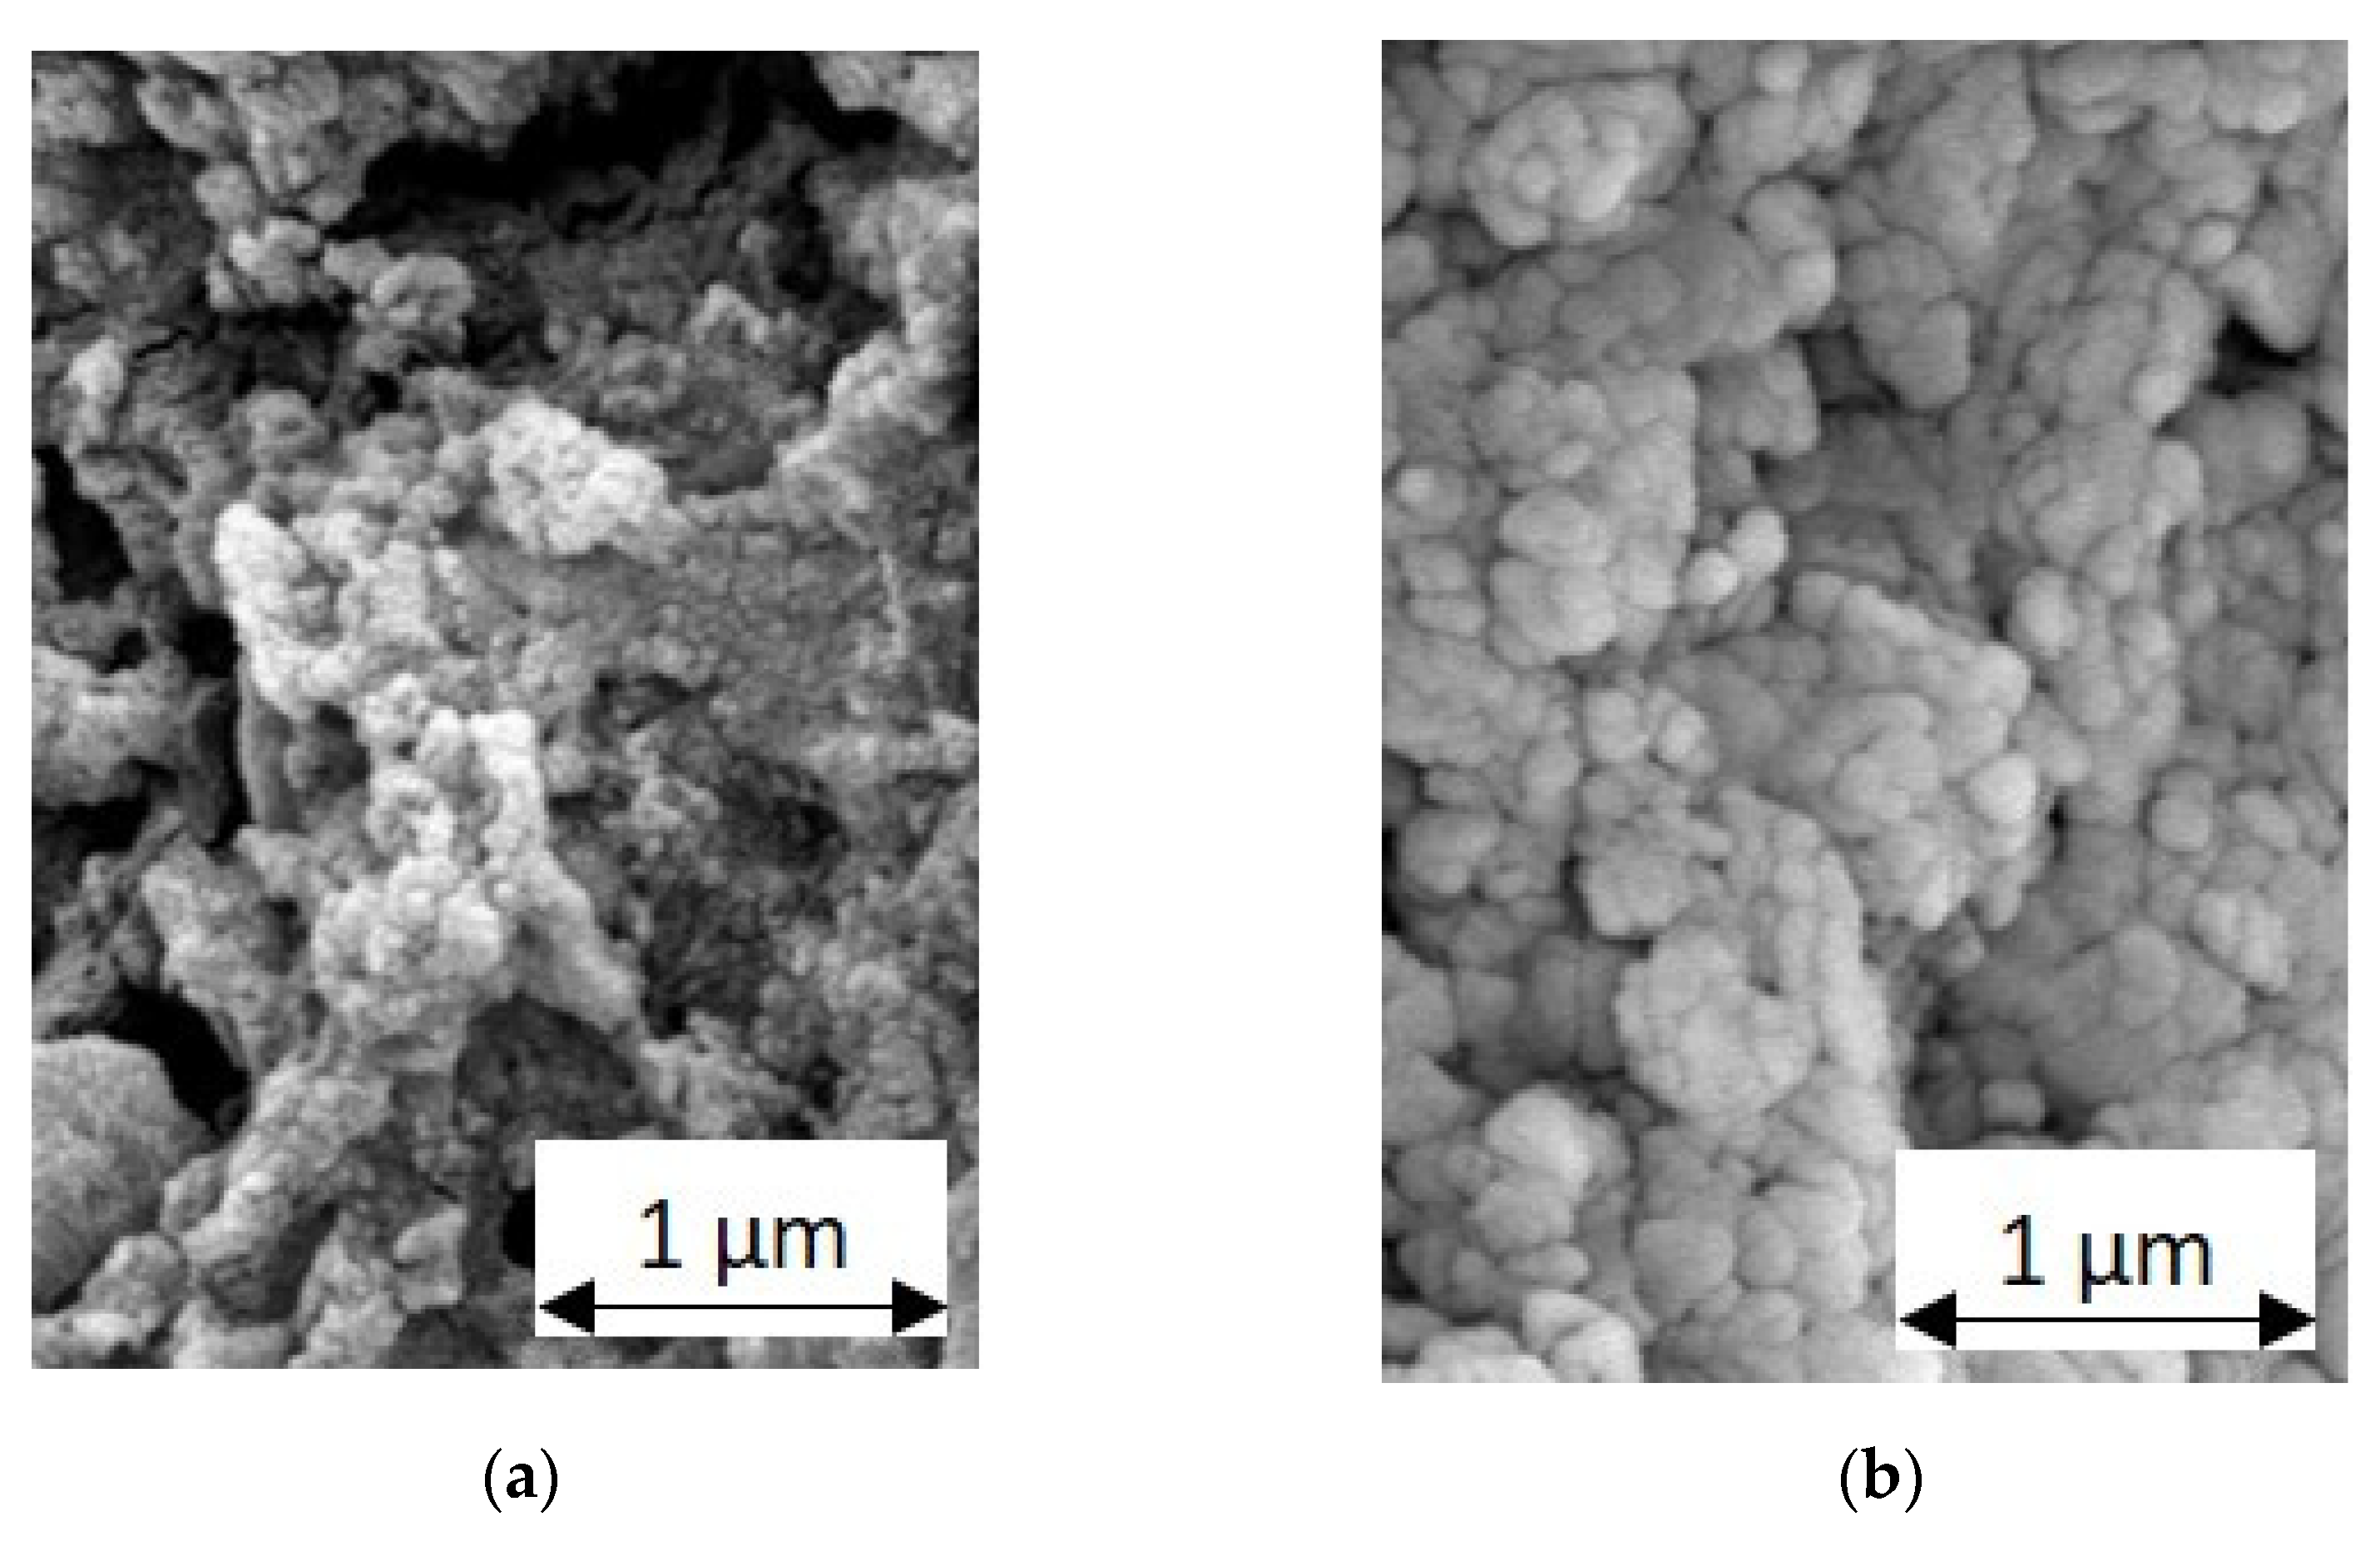
In the series of four greases with stearates as thickeners, the grease with lithium stearate as a thickener had the lowest loss factor, which means that the elastic properties were most significant in this grease. This is because its structure consisted of a network of entangled fibers, as is typical for lithium greases (Figure 4 and Figure 6). This structure was significantly stronger than the structure created in greases with magnesium or zinc stearate as the thickener, forming spherical particles aggregated into sample-spanning networks (Figure 8).
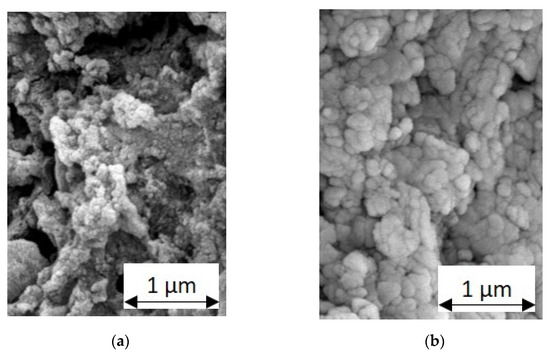
Figure 8.
SEM image of greases with mineral oil as base oil and 15 wt % thickener: (a) magnesium stearate as thickener; (b) zinc stearate as thickener.
3.2. SEM Images
The structure of greases with lithium 12-hydroxystearate as the thickener was microscopically investigated with different base oils, trimellitic acid ester (TMSE), polyalkylene glycol (PAG), paraffinic mineral oil (MO), and poly-α-olefin 8 (PAO8), as this thickener formed the well-known fibrous, entangled networks in all of these oils. The labeling of the greases in Table 3 is composed of the base oil description and the thickener content.
Table 3.
Fiber diameters dFiber of the model greases determined by means of image analysis, and edge lengths a and spatial diagonal ξSEM of the cube calculated therefrom, assuming a cubic grid as the network structure.
In the examined model greases, fibers with diameters dfiber ranging from 30 nm to 80 nm were found. With the described evaluation method and assumptions (cf. Chap. 3), edge lengths of a = 100 nm to 300 nm and mesh sizes ξSEM between 114 nm and 405 nm resulted. All measured and calculated values are listed in Table 3. Considering the crude approximation of a cubic grid, which, of course, does not resemble the true thickener network structure, these values seem to be in a reasonable range. However, no clear correlation could be found between thickener concentration and mesh size, which could be due to the heterogeneous structures. More sophisticated structural models may be required to achieve a deeper understanding of the thickener network.
3.3. MPT Measurements
The mean square displacements (MSDs) of tracer particles in the paraffinic mineral oil (MO) shown in Figure 9a are time-dependent and, on average, increased linearly with lag time τ, which means that the particles diffused freely. The complex viscosity |η*|MPT determined from the MSDs agreed well with the complex viscosity determined from rotational rheometry (|η*|RVM = 0.12 Pa s, |η*|MPT = 0.1 Pa s).
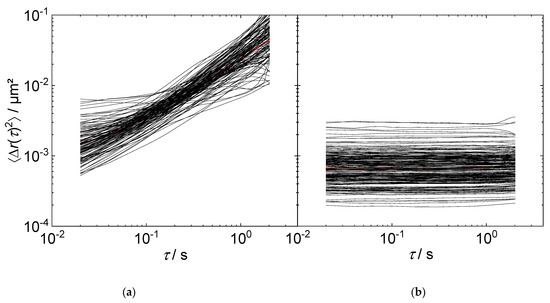
Figure 9.
MSDs: (a) time-dependent MSDs in paraffinic mineral oil (N = 48); (b) time-independent MSDs in grease with paraffinic mineral oil as base oil and 13 wt % lithium 12-hydroxystearate as thickener (N = 98).
The MSDs of the grease produced with this base oil with 13 wt % lithium 12-hydroxystearate as the thickener (Figure 9b) were time-independent, which means that the particles were trapped in an elastic environment. The particles could not diffuse because they were larger than the mesh size of the thickener network. If the particles were smaller than the mesh sizes, they could have diffused through the oil-filled cavities of the thickener network. For both oil and grease, MSD values varied only in a small range at a given lag time, indicating that the samples were homogeneous, and all particles perceive a similar environment. This is indicated by the low value of the parameter α [18], which characterizes the deviation of the MSD values to be found at a given lag time from a Gaussian distribution if all tracer particles explored the same environment. This would correspond to α = 0; here, α ≈ 1 (at lag time τ = 0.1 s).
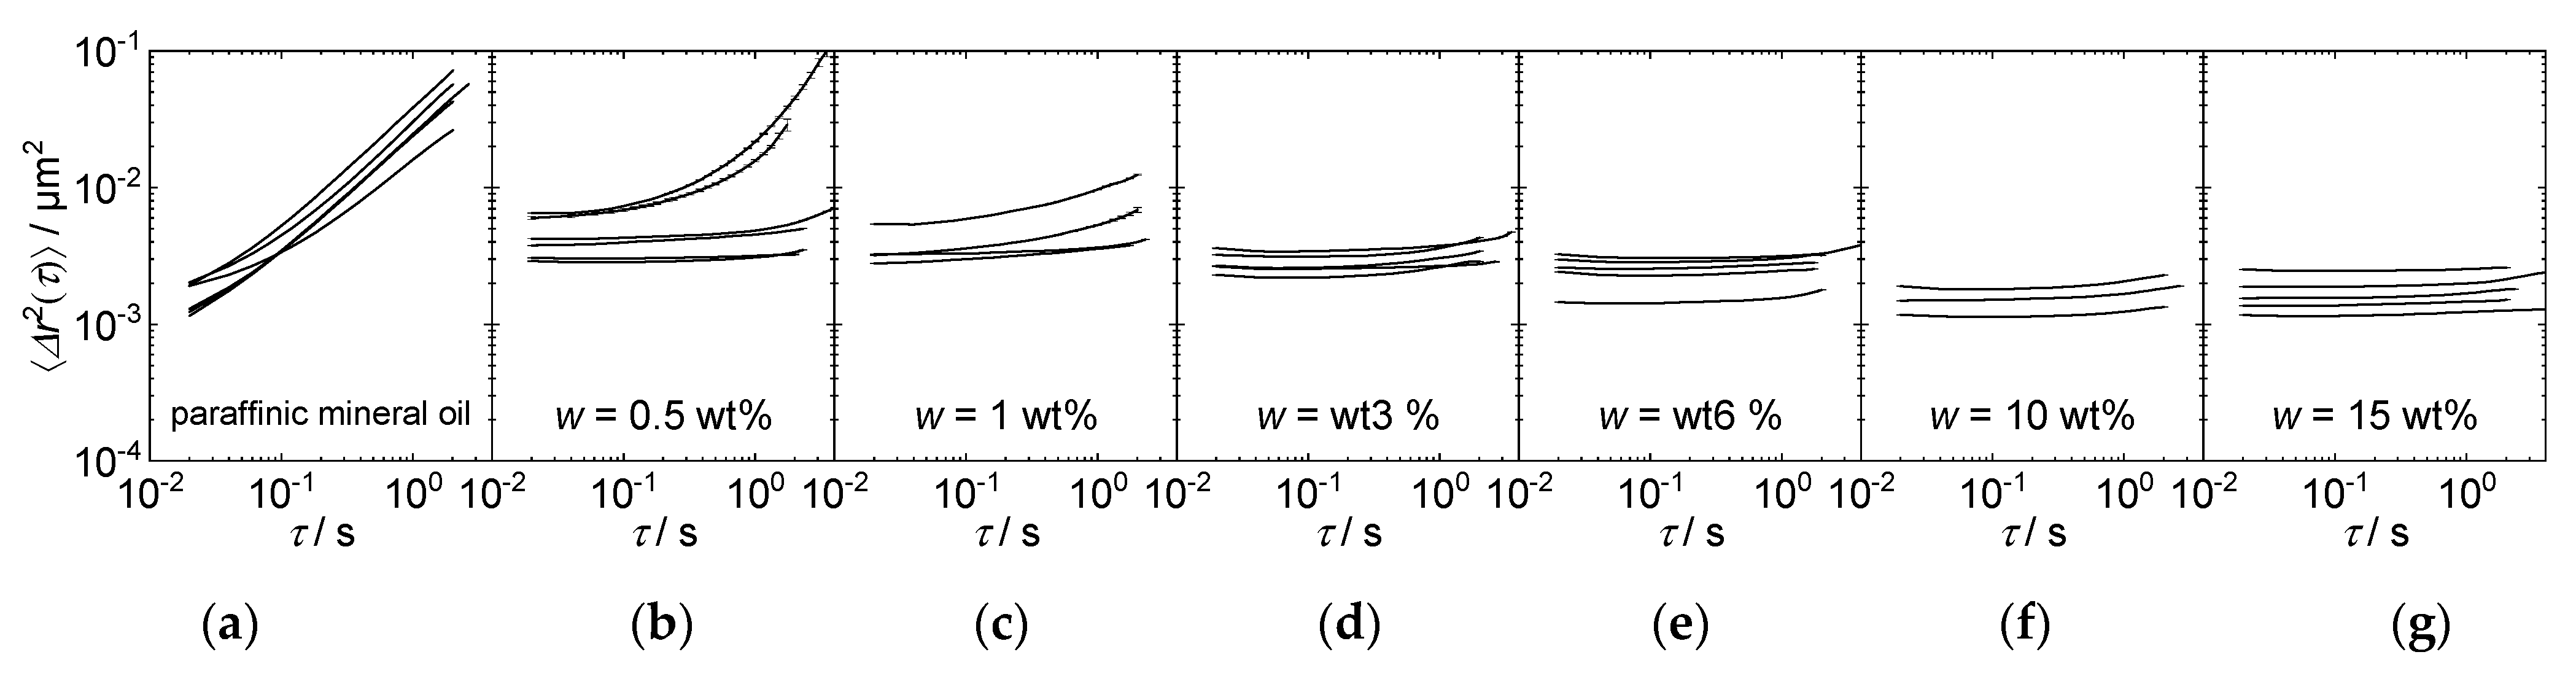
Even when only trace amounts as low as 0.5 wt % thickener are added to an oil, the MSDs become time-independent. Figure 10 shows the mean values of the MSDs of at least three different measurements of a concentration series of paraffinic mineral oil, and corresponding greases with 0.5–15 wt % lithium 12-hydroxystearate as the thickener. A single line represents the mean value of the MSDs of a measurement with about 60 observed particles. Thus, a network was formed, even with a small addition of only 0.5 wt % thickener.
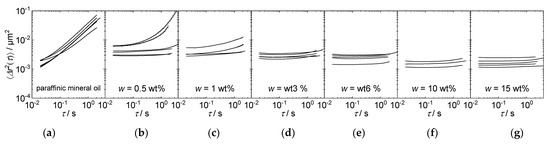
Figure 10.
Mean values of MSDs for a concentration series of (a) paraffinic mineral oil, greases with paraffinic mineral oil as base oil, and (b) 0.5 wt %, (c) 1 wt %, (d) 3 wt %, (e) 6 wt %, (f) 10 wt %, and (g) 15 wt % lithium 12-hydroxystearate as thickener. The mean values of the MSDs of the pure oil increased linearly with time; when adding increased amounts of thickener, the time independence of the MSD vanished, and its absolute value decreased.
The mesh sizes of the grease structures obtained from the SEM images (ξREM = 114–405 nm) were smaller than or equal to the diameter of the tracer particles (dTracer = 366 nm) used for the MPT measurements. It may therefore be assumed that the tracer particles perceived a homogeneous environment. Therefore, from the moduli determined by MPT (Figure 11), the mesh size may be determined according to Equation (8). With increased thickener concentrations, higher shear moduli G0 and thus smaller mesh sizes resulted; absolute values varied from 165 nm at 0.5 wt % thickener to 113 nm at 15 wt % thickener concentrations.
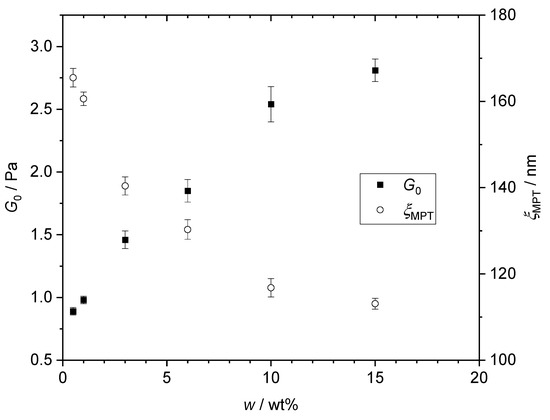
Figure 11.
Concentration series with paraffinic mineral oil as base oil and lithium 12-hydroxystearate as thickener. Shear modulus G0 and mesh size as functions of concentration as obtained from MPT measurements.
For the investigated model greases with lithium 12-hydroxystearate as the thickener (11 to 22 wt %) with different base oils (TMSE, PAG, PAO8, and MO), the MPT measurements revealed mesh sizes ranging between 106 nm and 173 nm (Table 4, ξMPT). The same greases were also examined using SEM images (previous chapter), resulting in mesh sizes of 114–405 nm (Table 4, ξREM). The results are, thus, in the same range, indicating the consistency of these different approaches to characterize the thickener structure in lubricating greases.
Table 4.
Comparison of mesh sizes calculated from SEM images ξREM and from MPT measurements ξMPT for model greases with lithium 12-hydroxystearate as the thickener and different base oils.
Figure 12 shows the frequency dependence of the bulk shear modulus G’ as obtained from small-amplitude oscillatory shear rheometry (a) as well as the corresponding data from MPT experiments (b) for the thickener concentration series. The bulk shear modulus data show a clear transition from a weakly elastic behavior characterized by a strong frequency dependence of G′ to a gel state, as indicated by shear modulus independent of frequency at a thickener concentration of 6 wt %. At this thickener concentration, the typical texture and consistency of a grease is reached. It should be noted that the shear modulus values calculated from the MSD data shown in Figure 11 based on Equation (5) are orders of magnitude lower than those determined from macroscopic bulk rheological measurements. Similar deviations have been observed for other systems with heterogeneous structures (see, e.g., [8,9]). For such systems, the mesh size of the network structure cannot be calculated from the bulk modulus according to Equation (8). On the other hand, G0,MPT characterizes only the local elasticity. However, we assumed that, on this submicron-length scale explored by a single tracer particle, the material was homogeneous and that we could use G0,MPT in combination with Equation (8) to calculate ξ.
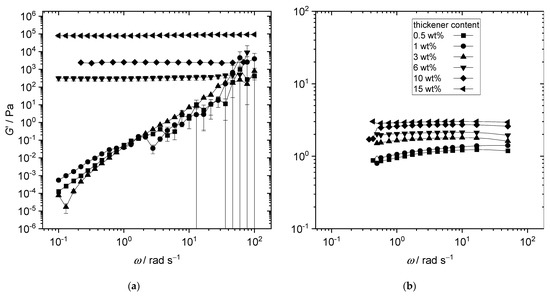
Figure 12.
Storage moduli G’ of greases with lithium 12-hydroxystearate as thickener and MO as base oil from (a) macroscopic small-amplitude oscillatory shear experiments performed using a rotational rheometer (RVM) and (b) from microrheological MPT experiments at 20 °C.
However, the MPT measurements indicated that the network formation set in at thickener concentrations as low as 0.5 wt %. At this concentration, time-independent MSD values and MSD traces monotonically increased over time simultaneously, i.e., some tracers were trapped in an elastic environment, whereas others were diffused in a weakly viscoelastic liquid. This indicates that crosslinked network structures exist as precursors for forming a sample-spanning network, formed at 6 wt % thickener concentration. The MSD values shown in Figure 11b are average values calculated from the individual trajectories, averaging 60 tracer particles per image. The scatter of MSD traces within one image, however, was low; either all trajectories were time-independent, or they increased over time (see Figure A2). The size of these images is 127 × 127 µm, and thus, we conclude that the network nuclei floating in the base oil had a typical length of about 130 μm. The different structures in the 0.5 wt % and 6 wt % samples are schematically shown in Figure 13.
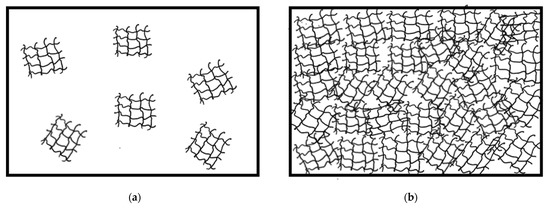
Figure 13.
Schematic illustration of sample structure at low (a) and high (b) thickener concentrations of lithium 12-hydroxystearate.
4. Conclusions
Rheological investigations on lubricating greases containing lithium 12-hydroxystearate and various base oils showed that the complex viscosity of the greases only depended on the thickener concentration and not on the base oil viscosity. The more thickener a grease contained, the higher its complex viscosity was.
More information about the structure can be obtained from the loss factor. The thickener concentration had no influence on tan(δ), but this quantity increased with increased base oil viscosity.
The SEM micrographs of the lithium 12-hydroxystearate greases revealed networks of entangled fibers that were similar to those observed in the literature [2,3,4,5,6,7]. No significant differences could be seen in the SEM images of greases made from different base oils.
If magnesium stearate or zinc stearate were used as thickeners instead of lithium 12-hydroxystearate, the grease had a significantly lower complex viscosity and the loss factor was significantly higher (at the same thickener concentration). The increase in loss factor can be attributed to a softening of the thickener network. This was consistent with the structure visible in the SEM images. Both magnesium and zinc stearate formed a structure with spherical particles in the grease.
Further analysis of SEM images of greases containing lithium 12-hydroxystearate as a thickener and various base oils revealed that the fibers had a diameter of 30–80 nm. Reduced to a simple cubic lattice, this corresponds to mesh sizes of 120–430 nm.
The microrheological measurement method MPT, which was carried out here for the first time on lubricating greases, clearly revealed that the sample-spanning thickener network formation set in at lithium 12-hydroxystearate concentrations as low as 0.5 wt %. Mesh sizes obtained from these experiments ranged between 93 nm and 180 nm. This was in fair agreement with the results from the SEM image analysis, indicating the consistency of these different approaches to characterize the thickener structure in lubricating greases.
Author Contributions
Conceptualization, A.H. and N.W.; methodology, A.H., A.C., B.H., K.-H.J. and N.W.; validation, A.H., A.C. and B.H.; formal analysis, A.H. and A.C.; investigation, A.H. and A.C.; resources, N.W. and K.-H.J.; data curation, A.H.; writing—original draft preparation, A.H.; writing—review and editing, A.H., A.C., B.H., K.-H.J. and N.W.; visualization, A.H.; supervision, N.W. and K.-H.J.; project administration, B.H., K.-H.J., and N.W.; funding acquisition, N.W. and K.-H.J. All authors have read and agreed to the published version of the manuscript.
Funding
This research was funded by Arbeitsgemeinschaft industrieller Forschungsvereinigungen (AiF), grant number 20001N, and Forschungsvereinigung Antriebstechnik (FVA), grant number 829I.
Institutional Review Board Statement
Not applicable.
Informed Consent Statement
Not applicable.
Data Availability Statement
Not applicable.
Acknowledgments
The authors give thanks to the members of the FVA, especially to Fuchs Schmierstoffe GmbH, Castrol Germany GmbH, and King Industries, for providing additional information and the base oils. We acknowledge support by the KIT-Publication Fund of the Karlsruhe Institute of Technology.
Conflicts of Interest
The authors declare no conflict of interest.
Appendix A
Table A1.
All manufactured and tested lubricating greases.
Table A1.
All manufactured and tested lubricating greases.
| Base Oil | Thickener | Thickener Content/% | |
|---|---|---|---|
| Variation of base oil viscosity and type | MO | Lithium 12-hydroxystearate | 15 |
| MO2 | |||
| PAO8 | |||
| PAO4 | |||
| Variation of thickener content | MO | Lithium 12-hydroxystearate | 11 |
| 13 | |||
| 15 | |||
| Variation of thickener type | MO | Lithium 12-hydroxystearate | 15 |
| Lithium stearate | |||
| Calcium 12-hydroxystearate | |||
| Calcium stearate | |||
| Zinc stearate | |||
| Magnesium stearate | |||
| Variation of base oil type and thickener content | TMSE | Lithium 12-hydroxystearate | 12 |
| PAG | 15 | ||
| MO | 13 | ||
| PAO8 | 22 | ||
| TMSE | 11 | ||
| PAG | 11 | ||
| MO | 11 |
Appendix B

Figure A1.
Moduli G′ and G″ of the grease with 15 wt % lithium 12-hydroxystearate and MO2 as base oil.
Figure A1.
Moduli G′ and G″ of the grease with 15 wt % lithium 12-hydroxystearate and MO2 as base oil.
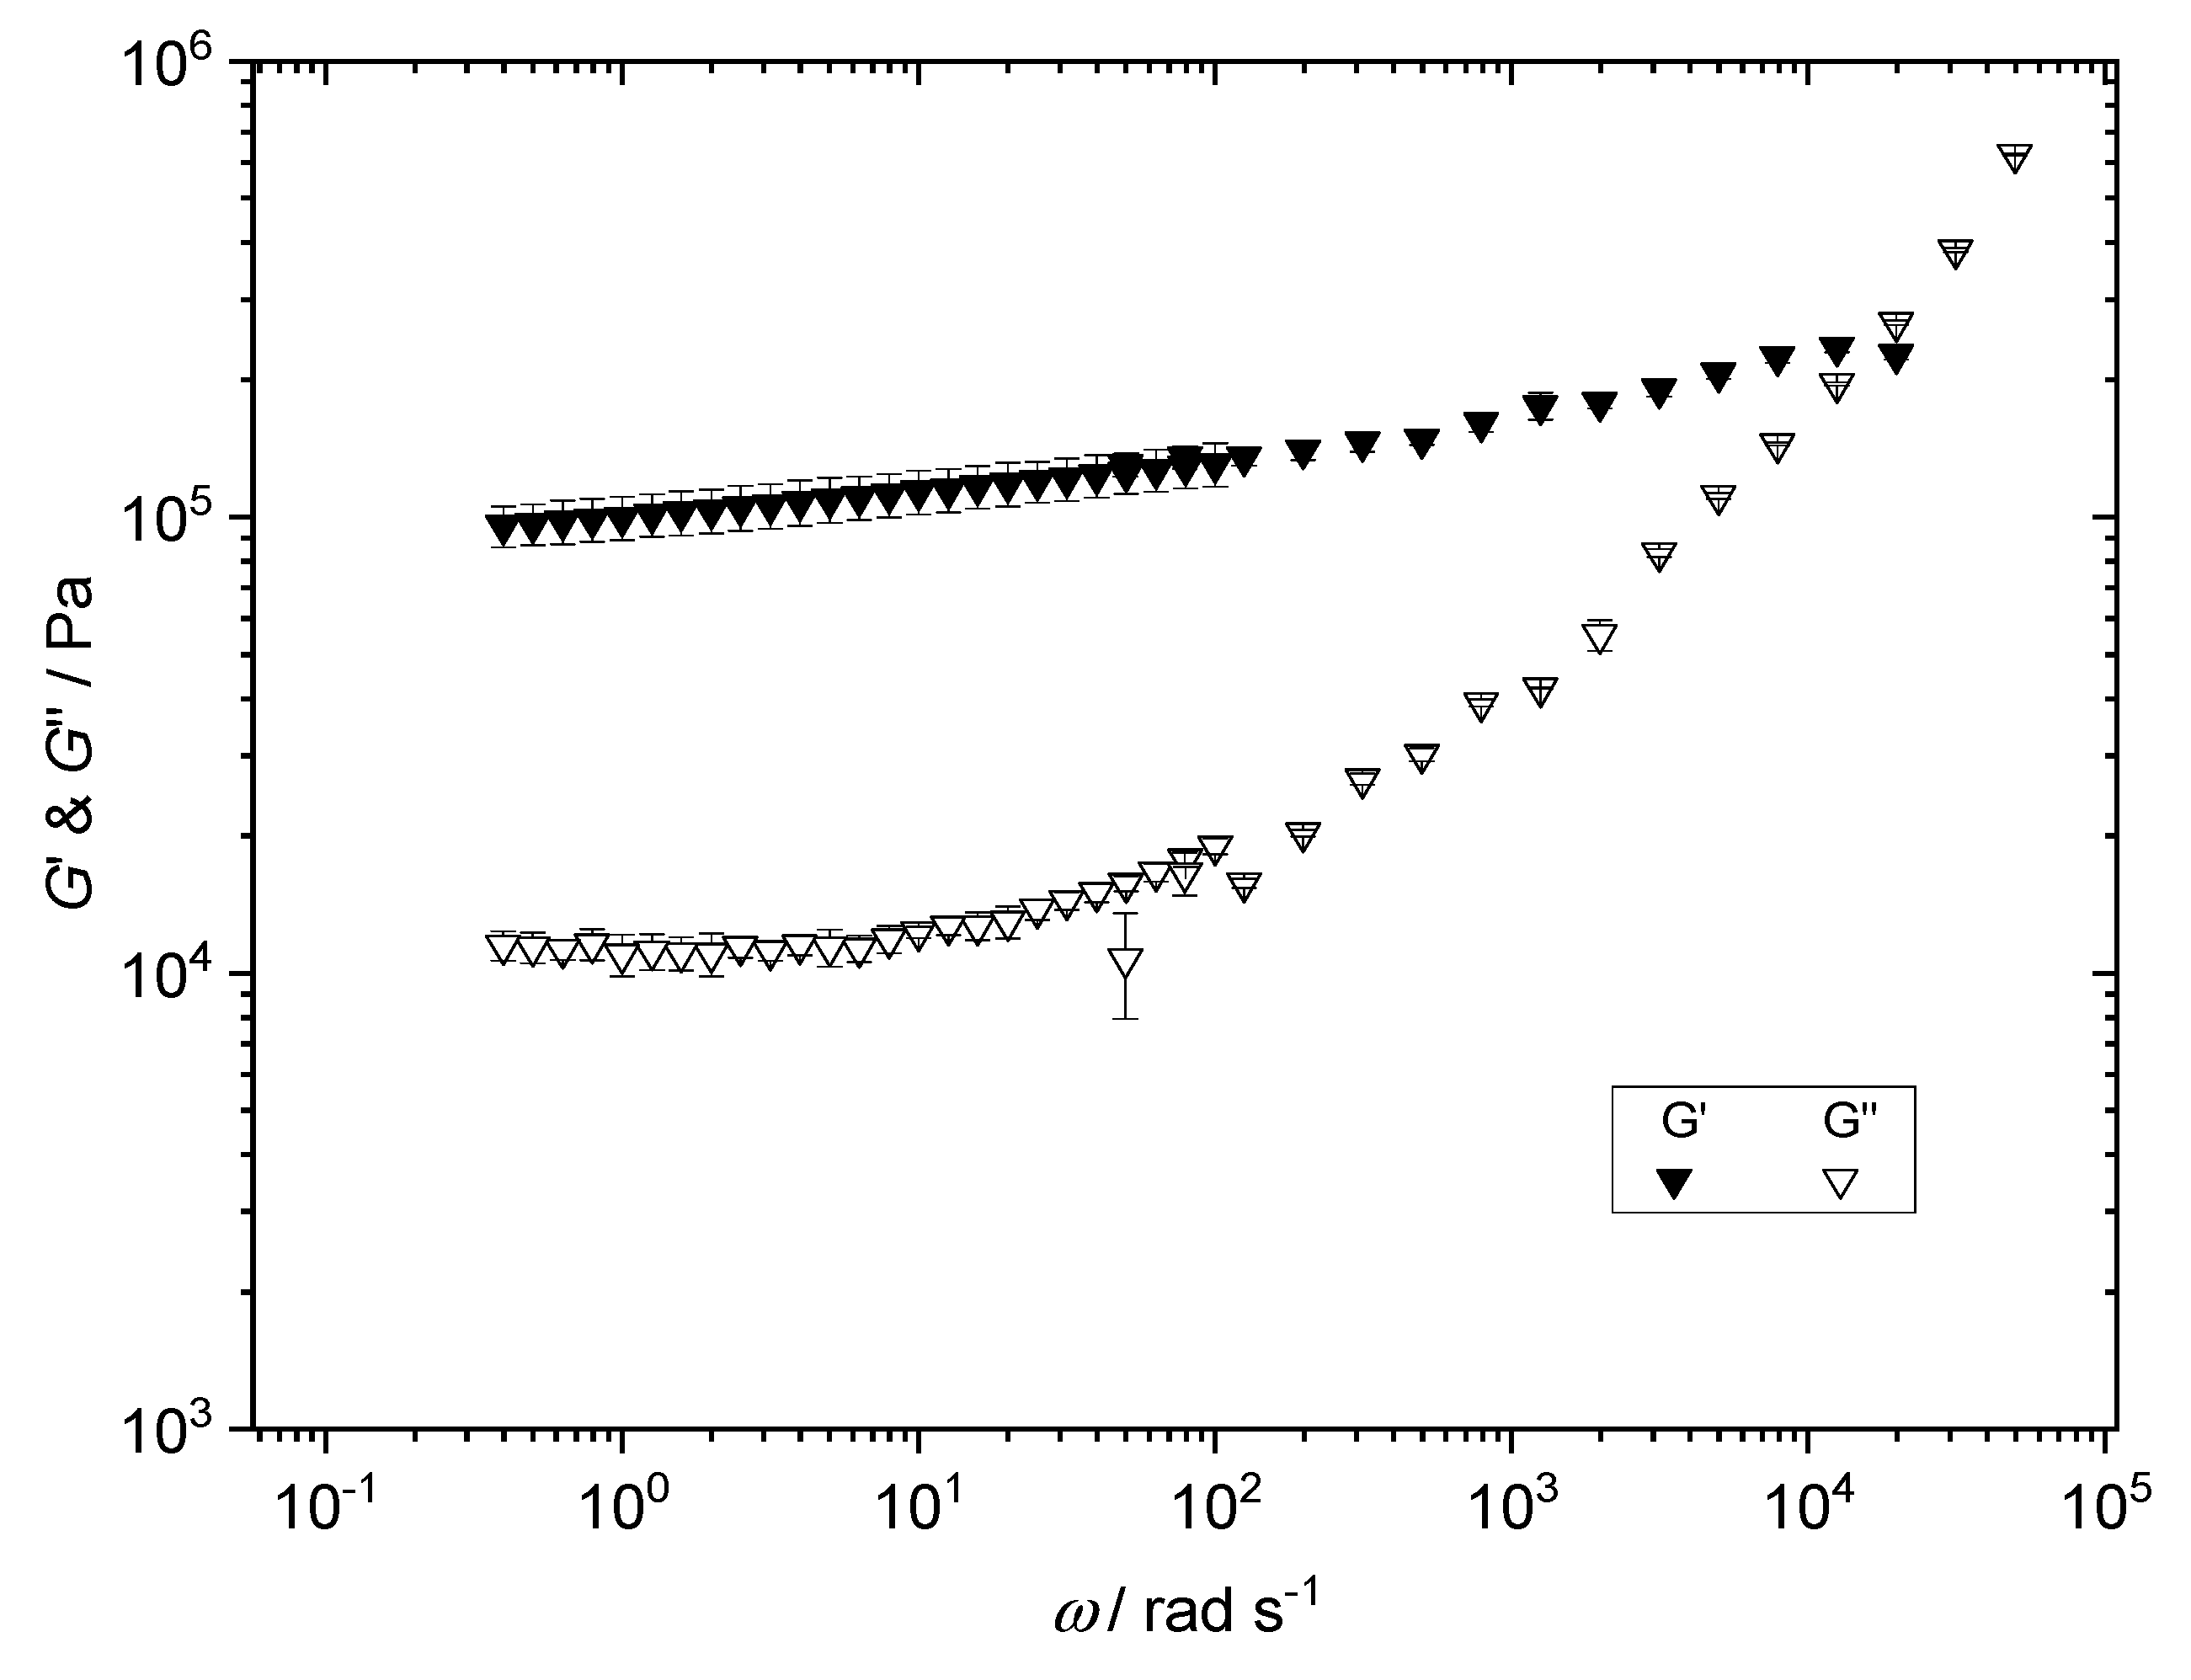
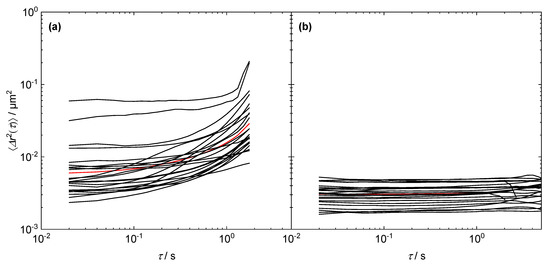
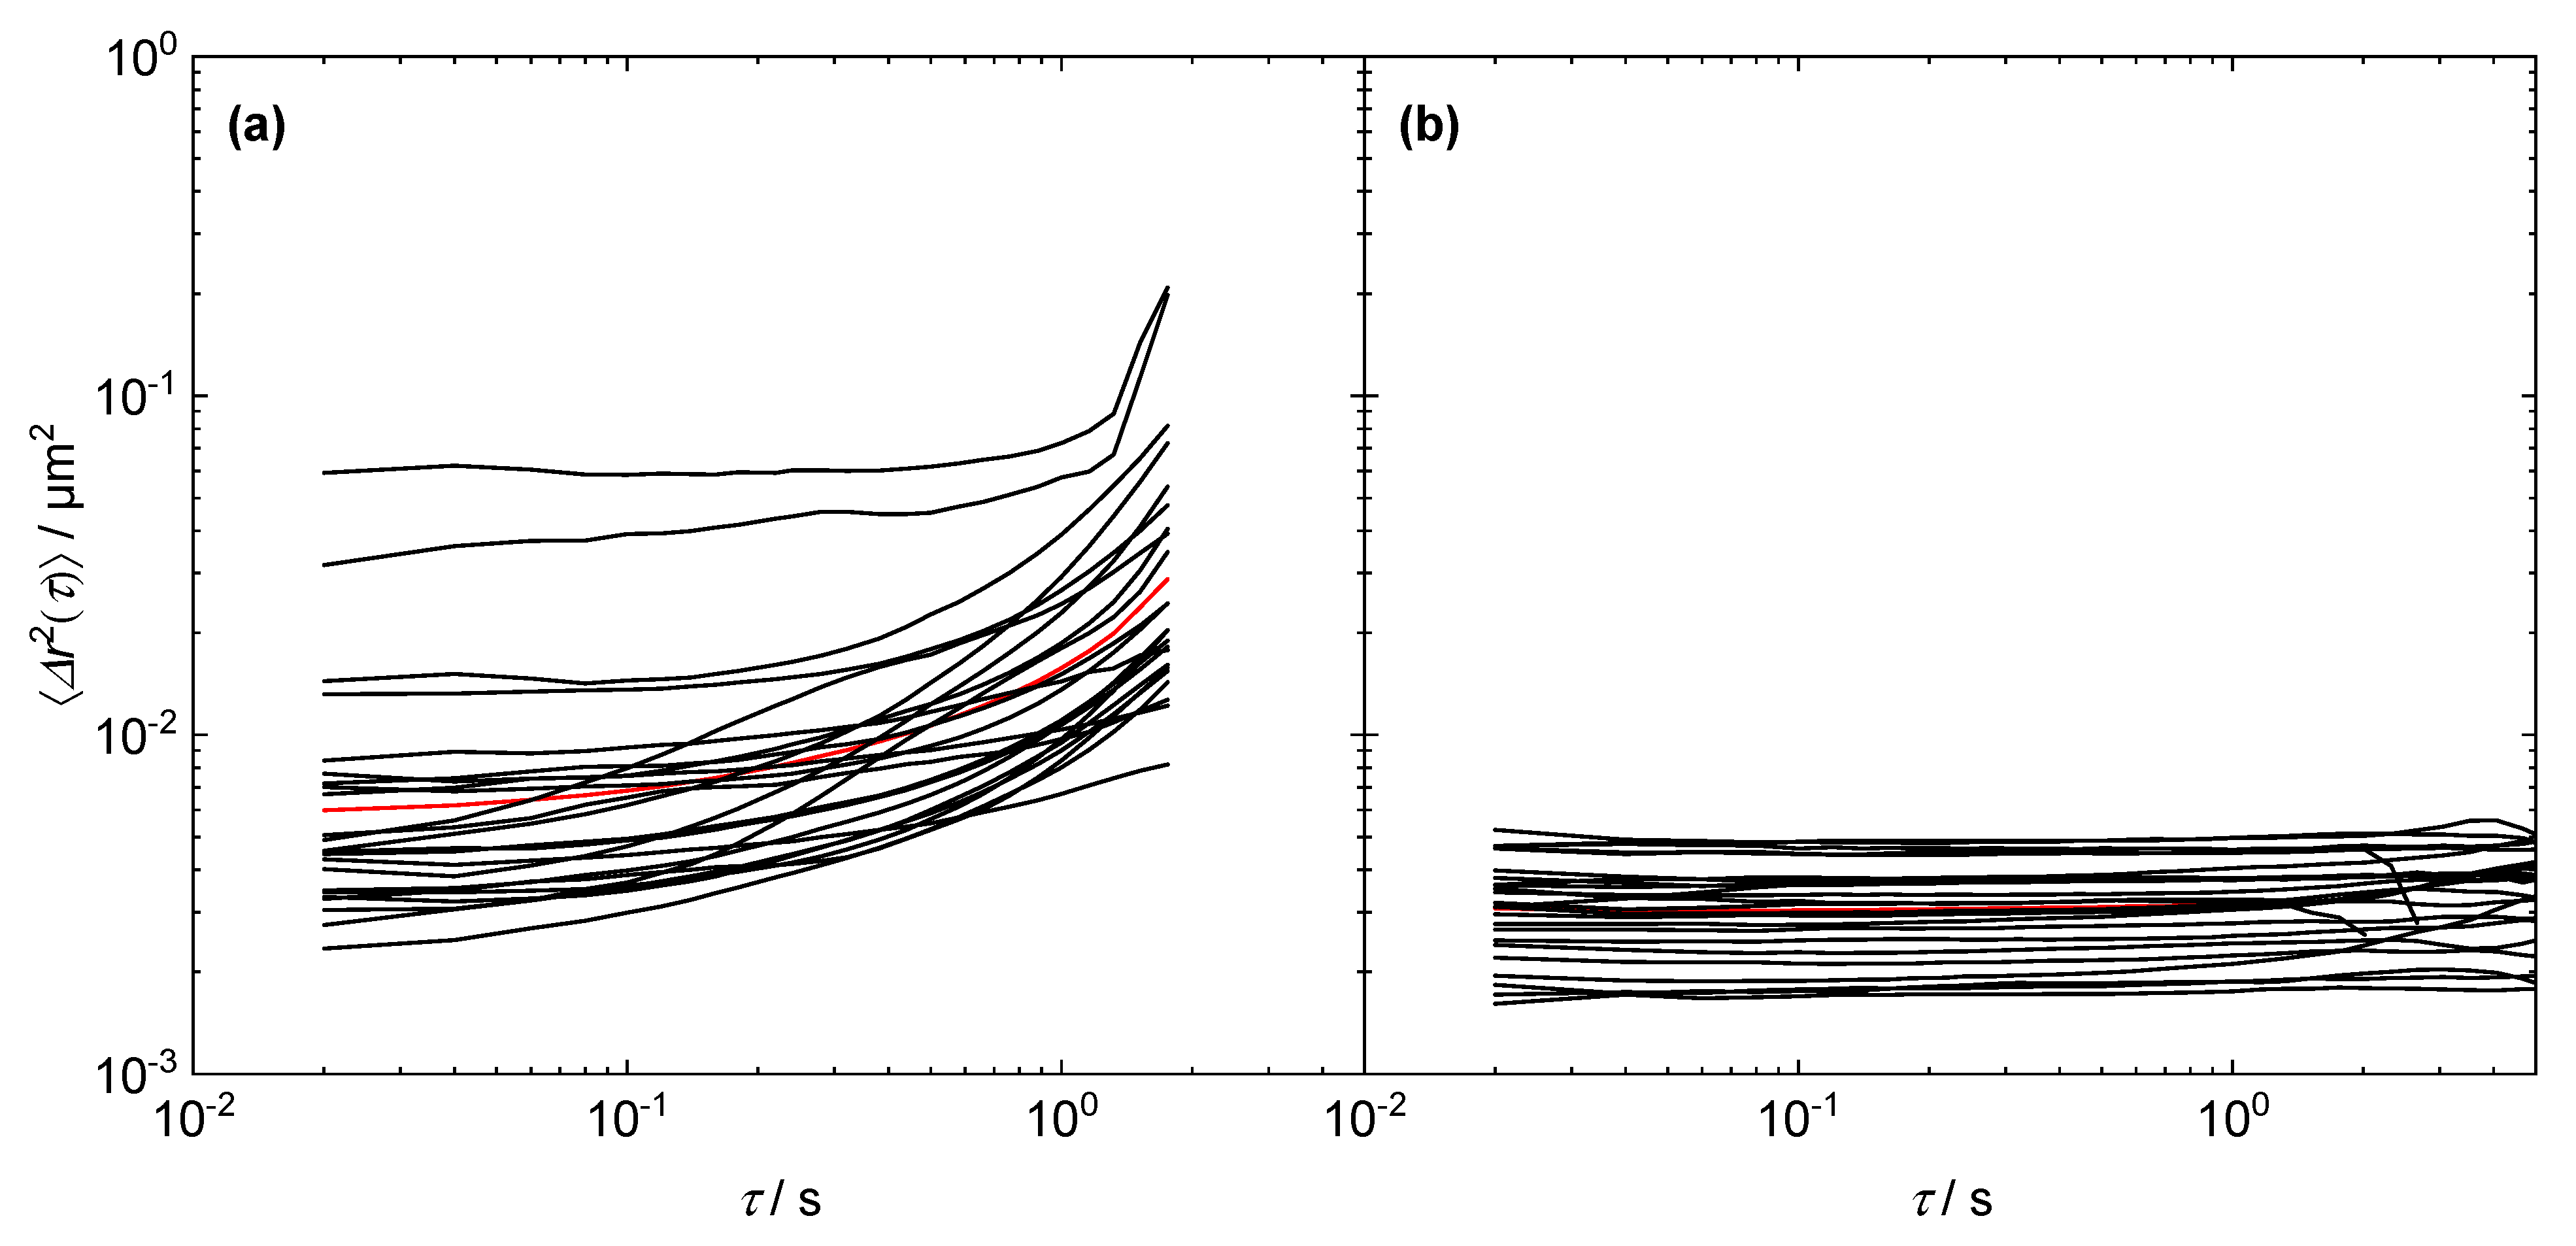
Figure A2.
MSDs of two MPT single measurements of the grease with 0.5 wt % lithium 12-hydroxystearate as thickener and MO as base oil: (a) single measurement in which the tracers (N = 23) diffuse freely in the oil and the MSDs are correspondingly time-dependent; (b) single measurement in which the tracers (N = 24) are trapped in a network and the MSDs are correspondingly time-independent.
References
- Lugt, P.M. A Review on Grease Lubrication in Rolling Bearings. Tribol. Trans. 2009, 52, 470–480. [Google Scholar] [CrossRef]
- Delgado, M.A.; Valencia, C.; Sánchez, M.C.; Franco, J.M.; Gallegos, C. Influence of Soap Concentration and Oil Viscosity on the Rheology and Microstructure of Lubricating Greases. Ind. Eng. Chem. Res. 2006, 45, 1902–1910. [Google Scholar] [CrossRef]
- Hurley, S.; Cann, R.M. Examination of grease structure by SEM and AFM techniques. NLGI Spokesman 2001, 65, 17–26. [Google Scholar]
- Magnin, A.; Piau, J.M. Application of freeze-fracture technique for analyzing the structure of lubricant greases. J. Mater. Res. 1989, 4, 990–995. [Google Scholar] [CrossRef]
- Baart, P.; van der Vorst, B.; Lugt, P.M.; van Ostayen, R.A. Oil-Bleeding Model for Lubricating Grease Based on Viscous Flow Through a Porous Microstructure. Tribol. Trans. 2010, 53, 340–348. [Google Scholar] [CrossRef]
- Cyriac, F.; Lugt, P.M.; Bosman, R.; Padberg, C.J.; Venner, C.H. Effect of Thickener Particle Geometry and Concentration on the Grease EHL Film Thickness at Medium Speeds. Tribol. Lett. 2016, 61, 470. [Google Scholar] [CrossRef] [Green Version]
- Sánchez, M.C.; Franco, J.M.; Valencia, C.; Gallegos, C.; Urquiola, F.; Urchegui, R. Atomic Force Microscopy and Thermo-Rheological Characterisation of Lubricating Greases. Tribol. Lett. 2011, 41, 463–470. [Google Scholar] [CrossRef]
- Kowalczyk, A.; Oelschlaeger, C.; Willenbacher, N. Visualization of micro-scale inhomogeneities in acrylic thickener solutions: A multiple particle tracking study. Polymer 2015, 58, 170–179. [Google Scholar] [CrossRef]
- Hafner, J.; Oelschlaeger, C.; Willenbacher, N. Microrheology imaging of fiber suspensions - a case study for lyophilized collagen I in HCl solutions. Soft Matter. 2020, 16, 9014–9027. [Google Scholar] [CrossRef] [PubMed]
- Crassous, J.J.; Régisser, R.; Ballauff, M.; Willenbacher, N. Characterization of the viscoelastic behavior of complex fluids using the piezoelastic axial vibrator. J. Rheol. 2005, 49, 851–863. [Google Scholar] [CrossRef]
- Anderson, F.W.; Nelson, R.C.; Farley, F.F. Preparation of grease specimens for electron microscopy. NLGI Spokesman 1967, 31, 252. [Google Scholar]
- Rubinstein, M.; Colby, R.H. Polymer Physics; Oxford University Press: New York, NY, USA, 2003. [Google Scholar]
- Mason, T.G.; Weitz, D.A. Optical measurements of frequency-dependent linear viscoelastic moduli of complex fluids. Phys. Rev. Lett. 1995, 74, 1250–1253. [Google Scholar] [CrossRef] [PubMed]
- Waigh, T.A. Microrheology of complex fluids. Rep. Prog. Phys. 2005, 68, 685. [Google Scholar] [CrossRef]
- Breuer, K.S. Microscale Diagnostic Techniques; Springer: Berlin/Heidelberg, Germany, 2005; ISBN 3540230998. [Google Scholar]
- Wirtz, D. Particle-tracking microrheology of living cells: Principles and applications. Ann. Rev. Biophys. 2009, 38, 301–326. [Google Scholar] [CrossRef] [PubMed] [Green Version]
- Crocker, J.C.; Grier, D.G. Methods of digital video microscopy for colloidal studies. J. Coll. Interface Sci. 1996, 179, 298–310. [Google Scholar] [CrossRef] [Green Version]
- Weeks, E.R.; Crocker, J.C.; Levitt, A.C.; Schofield, A.; Weitz, D.A. Three-dimensional direct imaging of structural relaxation near the colloidal glass transition. Science 2000, 287, 627–631. [Google Scholar] [CrossRef] [PubMed] [Green Version]


Publisher’s Note: MDPI stays neutral with regard to jurisdictional claims in published maps and institutional affiliations. |
© 2022 by the authors. Licensee MDPI, Basel, Switzerland. This article is an open access article distributed under the terms and conditions of the Creative Commons Attribution (CC BY) license (https://creativecommons.org/licenses/by/4.0/).