Abstract
In a three-dimensional transient simulation of the elastic–plastic rolling contact, transient effects can be observed at the beginning of the rolling until a stationary state is reached after rolling for a length of several times the contact radius. In most cases, the steady-state regime is in focus of scientific investigations, whereas the transient effects are hardly considered. In the present work, those transient effects at the beginning of a frictionless rolling contact of a rigid sphere on an elastic–plastic plane are studied in detail. The analysis is limited to isotropic strain hardening. In particular, the changes of the contact pressure during rolling, as well as the plastic strain state and plastic deformations remaining after rolling are investigated. This is intended to get to the bottom of existing explanatory approaches from literature, which are based on the change in conformity. Beyond that, a more profound explanation of the transient effects is developed by identifying existing correlations.
1. Introduction
Rolling contact occurs in a variety of applications, such as between wheel and rail or in rolling bearings. If the yield point of the materials is locally exceeded, plastic flow occurs and, depending on the modeling of the material hardening, plastic strains and permanent plastic deformations of the surface are build up [1]. In recent years, increasing computer power had enabled the three-dimensional transient simulation of rolling contacts using the semi-analytical method (SAM) [2,3,4,5,6] in the half space.
In rolling contact simulations, as well as in empirical scratch tests, a regime with transient behavior at the beginning of the rolling can be observed [2,6,7,8,9,10], especially under the assumption of isotropic strain hardening. Figure 1 shows the sectional view of the plastic surface deformation of an elastic–plastic plane that was rolled over by a rigid sphere. In the transient regime, a deep indentation was initially formed, which subsequently flattened out and the depth of the indentation tended toward an asymptotic value. After a sufficient rolling length a steady-state regime was established, which was present until the end of the rolling path. This steady-state regime is usually in focus of investigations. Especially with regard to the evaluation of fatigue under cyclic loading, various works also aimed at the direct estimation of the steady-state regime [11,12,13], although this was usually accompanied by restrictions to certain material models and boundary conditions. The transient regime was completely avoided then.
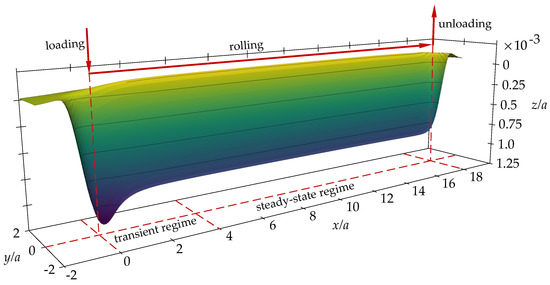
Figure 1.
Sectional view of the plastic surface deformation of an elastic–plastic plane that was rolled over by a rigid sphere. The red arrows indicate the loading, rolling and unloading directions and positions. The contact radius given by Hertzian theory is denoted by a.
From the point of view that, unlike in simulation, in reality every rolling motion must have a starting point, the investigation of transient effects at the beginning of the rolling path also seems relevant. However, these are hardly considered in the literature up to now. In articles covering transient rolling contact simulations, it is mostly only mentioned that the steady-state is reached after a sufficient rolling length [2,3,6]. Further explanation concerning the transient effects are either missing as they are not directly relevant when investigating the steady-state regime or a very short explanatory approach is given. For example, Chaise et al. [6] explain the transient effects by a change in conformity at the beginning of the rolling path. A more detailed analysis and explanation of the transient effects seems to be outstanding in literature, but would extend the understanding of transient rolling contact simulations. This would be of benefit for the planning and interpretation of such simulations as well as empirical studies.
Therefore, within this work, the authors specifically analyze the transient effects at the beginning of the rolling of a rigid sphere on an elastic–plastic plane. The model is limited to an isotropic hardening law. The explanatory approach of the conformity change is to be checked with the aim of the development of a more profound explanation by identifying existing correlations between the characteristic permanent surface deformations as well as the strain distributions and the contact pressure profile. Thereby, this paper is intended as a supplement to the primary references, which present the rolling contact calculation with SAM, but do not provide an explanation of the transient effects that occur.
2. Method and Numerical Modeling
2.1. Rolling Contact Simulation Using a Semi-Analytical Method
In order to obtain the results presented in this paper, a semi-analytical method (SAM) was used for the simulation of the rolling contact. The validity of this approach is limited to the assumption of small deformations and strains. In addition, the dimension of the contact area must be small compared to the radii of the contact partners in order to be considered as a half-space [1,2]. All those assumptions can be considered sufficiently fulfilled for the present calculation, as the largest strains do not exceed 0.25% for the selected contact parameters. Based on the first concept by Jacq et al. [2], the method has been optimized and extended for different applications by various scientists [4,14,15,16]. In [2,3], Nélias and co-workers present the structure and basic principles for the calculations of rolling contacts in detail, so only a brief summary is presented in the following.
As mentioned above, SAM is based on the half-space assumptions, thus using semi-infinite bodies. The computational domain on the surface of the half-space is discretized into equal rectangular elements by an equidistant grid. For each surface element, an averaged value is calculated for each of the quantities of the contact problem. To calculate the load balance (Equation (1)), the surface separation (Equation (2)) and the contact conditions (Equations (3) and (4)), which determine the contact area, the following coupled equations are solved in the contact solver using the conjugate gradient method (CGM) [17]:
The total applied load F corresponds to the integral of the pressure p over the computational domain . The surface separation h is composed of the initial gap , the rigid body displacement and the total surface deformation u. In the contact zone , the surface separation is zero. Outside the contact zone, the surface separation is positive and the pressure is zero. Traction forces and deformations parallel to the surface are not considered in this work.
In the plastic loop, the 2D surface grid of the contact solver is extended perpendicular to the surface into a 3D computational domain which is meshed into constant-sized cuboids. For the cuboid elements, an average value is calculated for each of the stress and strain quantities. The elastic stresses are calculated directly from the pressure distribution on the surface [18]. The residual stresses can be calculated from the plastic strains that may be present [19,20]. Assuming small deformations and strains, the elastic and residual stresses can be superimposed. From the total stress state, a return-mapping algorithm [21] is used to calculate the change in plastic strains. Since a change in the plastic strain state results in a change in the underlying residual stresses, an iterative calculation is performed, as indicates the name plastic loop. The plastic deformation of the surface can then be calculated from the converged strain state [2]. For the fast calculation of convolution products in the determination of residual stresses and plastic deformations, the discrete-convolution fast Fourier transformation (DC-FFT) [22] is applied.
Since the plastic deformations locally change the contact geometry, the overall problem is solved iteratively in an outer loop between contact solver and plastic solver. The iterative calculation is completed when the plastic deformation converges. This is the case when, for each point on the surface grid, the plastic deformation changes by less than a threshold value.
The simulation of the frictionless rolling contact can be performed using a force-driven approach [4] as a sequential calculation of several calculation increments, while each increment followed the previously described elastic–plastic contact calculation. Figure 2 shows the flowchart of the rolling contact algorithm. A vertical initial indentation is performed by applying the load in several increments. During the subsequent rolling, the load remains constant, but the plastic strains, plastic deformations and residual stresses are shifted between each calculation increment in the rolling direction. At the end of the rolling path, the contact is unloaded vertically. This sequence of loading, rolling and unloading is indicated by the red arrows in Figure 1.
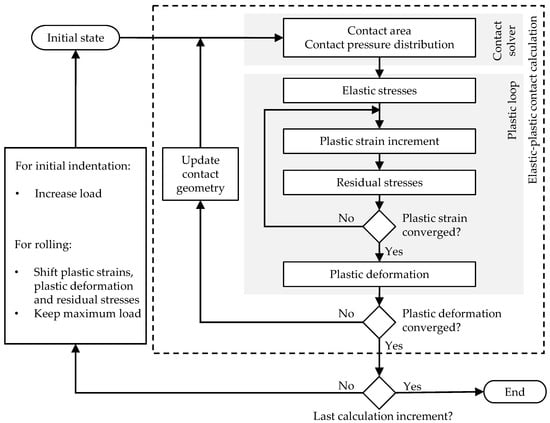
Figure 2.
Flowchart of the rolling contact algorithm.
All the simulation results presented within this paper were generated using the software TELOS from Schaeffler Technologies AG & Co. KG. While TELOS is not publicly available, similar results can be obtained with other SAM-based tools or the finite element analysis.
2.2. Model Setup
A sphere—assumed rigid here for the sake of simplicity—with a radius of R = 10 mm was rolling frictionless on a plane of AISI 52100 bearing steel considering elastic–plastic material behavior. Young’s modulus and Poisson’s ratio were E = 210 GPa and , respectively. The yield surface was modeled by isotropic strain hardening using Swifts’s law [23] according to Equation (5) in conjunction with the Von Mises criterion. Consistent with [3,6], the hardening parameters were , , and with corresponding to the effective plastic strain. The hardening curve is depicted in Figure 3.
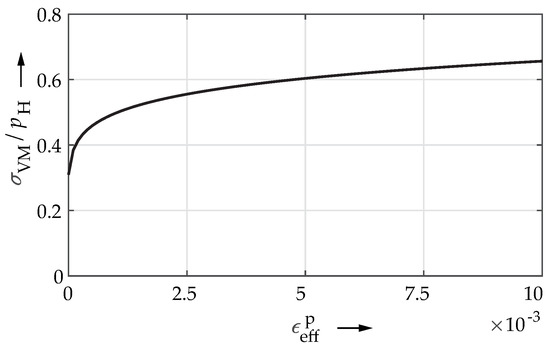
Figure 3.
Hardening curve of AISI 52100 bearing steel for the isotropic swift law, normalized by the maximum contact pressure = 4.39 GPa given by Hertzian theory.
For a normal load of F = 820 N, a maximum pressure of = 4.39 GPa with a contact-radius a = 0.299 mm is to be given by the Hertzian theory. These reference values are used for normalization throughout the paper. According to Hertz, in the elastic case, the chosen load F leads to a maximum von Mises equivalent stress of 200% of the yield point of the material. At the beginning of the rolling path, the load was applied vertically—the initial indentation. The load remained constant while the sphere was rolling for a length of 18a. Afterwards, the sphere was unloaded vertically. The discretization of the half-space was chosen equidistant as in all spatial directions. According to a study carried out, the estimated calculation error can be assumed to be small. Throughout the paper, the coordinate system is positioned at the undeformed surface of the plane in the center of the initial indentation. The positive x-axis corresponds to the rolling direction. The positive z-axis points perpendicular to the surface into the plane.
3. Results and Discussion
Figure 4 shows the longitudinal profile of the plastic surface deformation in the x–z plane for the vertical initial indentation (dashed red line) and for a rolled length of (solid black line).
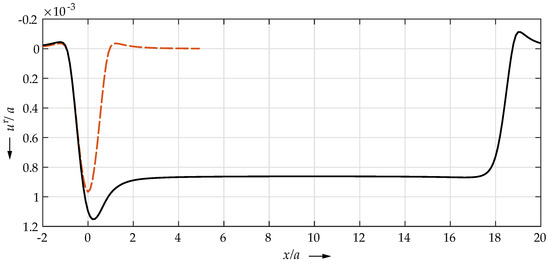
Figure 4.
Longitudinal profile of the plastic surface deformation in the x–z plane for the vertical indentation (dashed red line) and for a rolled length of 18a (solid black line).
The transient effects at the beginning of the rolling path are clearly visible: Starting from the initial indentation at , the depth of the permanent indentation increased to a maximum value shortly after the beginning of rolling at about . From there, the depth decreased towards an asymptotic value after rolling a sufficient length—the steady-state regime was reached. For the presented model, the steady-state regime began at about . From now on, the region, from the beginning of the rolling until the steady-state was reached, will be called a transient regime.
It should be noted that the initial indentation was a bit deeper than the deformation in the steady-state regime. A small shoulder was formed at the start of the rolling path, which almost corresponded to that of the initial indentation. During rolling, the shoulder at the leading contact edge was increasing slightly and remained at the unloading position. The effects of load and ellipticity ratio on the described characteristic longitudinal profile of the permanent surface deformation was discussed by Chaise et al. in [6].
Coupled to the change in the contact geometry due to the plastic deformations, a change in the pressure distribution was to be expected. Figure 5a shows the history of the maximum pressure in the transient regime during rolling. Figure 5b shows the pressure distributions for three discrete moments marked in Figure 5a, i.e., the initial indentation, as well as a rolled length of and . For better comparability, the contact centers are shifted to in each case. Since the changes in the pressure distributions were very small, only the upper part of the curves is shown in enlargement.
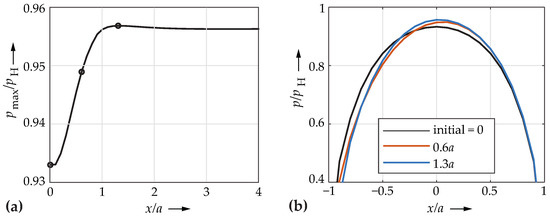
Figure 5.
(a) History of the maximum pressure during rolling in the transient regime; (b) pressure distributions for the initial indentation and for a rolled length of and , centered at .
The maximum pressure increased by about 2.55% of the initial value to the global maximum at a rolled length of approximately . The pressure distribution tilted slightly towards the leading edge, which is in accordance with the results of [6]. The maximum pressure then slowly dropped minimally to its asymptotic value in the steady-state regime that was still about 2.5% higher than the initial value. Since the elastic Hertzian pressure is used for normalization, the normalized pressures were smaller than one due to plastification.
Comparing the profile of the plastic surface deformation in Figure 4 with the history of the maximum pressure in Figure 5a, it is noticeable that the maximum depth of the indentation was reached at about and decreased again, while the pressure reached its maximum at about and only then fell very slightly. These spacial differences suggest that the change in the pressure is obviously not solely responsible for the modification of the surface deformation and thus the conformity. An explanation of the transient effects in terms of the change of the coupled conformity and pressure distribution thus seems insufficient.
3.1. Change of the Pressure Distribution Due to a Change in Conformity
In Figure 6a–c, the pressure distribution and the plastic surface deformation are shown in combination for the moment of the initial indentation and rolled lengths of and of .
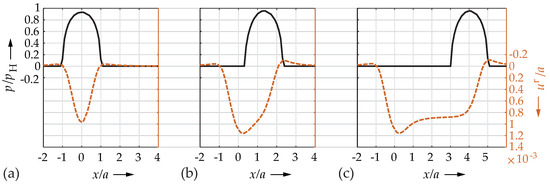
Figure 6.
Pressure distribution p (solid black line) and plastic surface deformation (dashed red line) for the moments of (a) the initial indentation, (b) a rolled length of and (c) a rolled length of .
During the initial indentation, see Figure 6a, initial plastic strains and resulting plastic deformations were build up. The pressure profile was symmetrical centrally over the indentation. Immediately after the beginning of rolling, the contact geometry became visibly asymmetrical due to the existing plastic deformations. In areas that had already been rolled over the indentation was deeper than it was at the leading edge. Additionally, a shoulder formed in front of the leading edge. The pressure increased until the maximum was reached as soon as the trailing edge of the contact zone had reached approximately the lowest point of the plastic deformation, see Figure 6b. The asymmetry resulted in the well-known tilting of the pressure distribution towards the leading edge. As the steady-state regime was approached, the indentation increasingly flattened out, causing the pressure to drop again minimally. In the steady-state regime, see Figure 6c, the contact geometry and the pressure distribution were constant for the entire further rolling path. The previously described change of plastic deformation and pressure is compatible with each other assuming that the pressure profile is determined by the conformity. The conformality, in turn, is determined by the plastic deformation, in particular by the deep indentation in the transient regime. The development of the plastic deformation is hardly a consequence of the change of the pressure distribution, but is determined by the plastic strains that will be discussed in the following.
3.2. Plastic Strains and Associated Plastic Deformations
The plastic deformation is calculated on the basis of the plastic strains . To find an explanation for the deep indentation in the transient regime, the plastic strains were therefore investigated in more detail. In Figure 7, the components of the plastic strain tensor in the x–z plane at depth are plotted. At this depth, the effective plastic strain and the von Mises stress had its maximum. In classical contact calculation, this point of maximum von Mises stress is called Bielayev point.
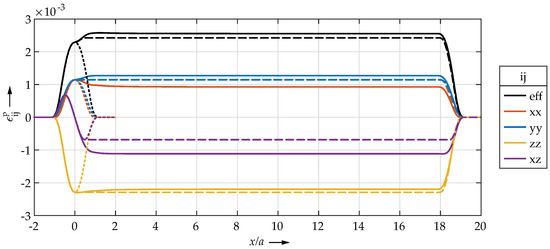
Figure 7.
Plastic strains in the x–z plane at depth for the initial indentation (dotted lines), a rolled length of (solid lines) and a synthesized strain state (dashed lines, see end of Section 3.2). The plastic strains and are zero in the x–z plane and are not shown for a clear view.
In the area of the initial indentation around , the component showed the highest magnitude of all strain tensor components. The magnitudes of , were equal. showed a change of sign equivalent to the known stress state in the point contact, whereby the maxima did not lie in the center of the contact. Starting from the initial indentation, the strains showed a transient behavior until they reached a stationary value in the steady-state regime. The magnitudes of the strains and decreased slightly, while increased. It is interesting to note that the magnitude of increased significantly. The development of the effective plastic strain is largely due to this change in shear strain, as the changes in the normal strain components cancel out in the calculation of .
Although the plastic strains showed transient effects at the beginning of the rolling path, it is not directly obvious why the deep indentation was formed. By using SAM, it is possible to calculate the resulting plastic surface deformations for each strain . Super-positioning all plastic surface deformations results in the permanent deformation of the surface shown in Figure 4. In Figure 8 the plastic surface deformations in the longitudinal profile in the x–z plane are shown as solid lines.
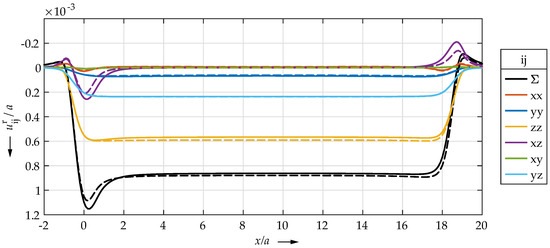
Figure 8.
Longditudinal profile of the plastic deformations of the surface in the x–z plane for each plastic strain for a rolled length of (solid lines) and for the synthesized stress state (dashed line, see end of Section 3.2).
It can be seen that the strain components , and made the most significant contributions to the indentation in the steady-state regime, but beyond that they hardly contributed to the deep indentation in the transient regime. The components , and , on the other hand, hardly contributed at all in the steady-state regime. Most important, the shear strain , in particular, was decisive for the shoulders in front of and behind the rolling path as well as for the deep indentation.
Figure 9 schematically shows the resulting plastic deformation for a near-surface region of plastic shear strain . In the chosen representation, a local region of negative plastic strain led to a shoulder at the surface to the right of the strained region and to a dent to the left of it. For positive strains of the opposite effect occurred. This is indicated by the gray arrows.

Figure 9.
Schematic representation of the relationship between plastic strain and the resulting plastic deformation of the surface .
In Figure 10, the plastic strain and the corresponding plastic deformation from Figure 8 are shown separately. In addition, the gray arrows introduced in Figure 9 for schematic representation of the surface deformation are added corresponding to the profile of the plastic strain.
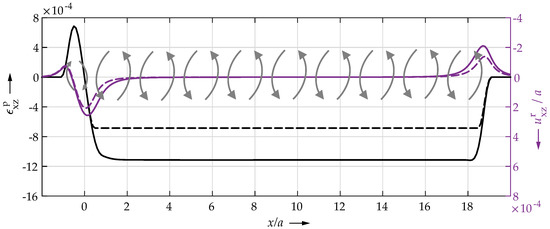
Figure 10.
Longitudinal profile of the plastic strain and the corresponding plastic deformation of the surface in the x–z plane for a rolled length of (solid lines) and the synthesized strain state (dashed line, see end of Section 3.2). The gray arrow pairs schematically show the direction of plastic surface deformation for the locally present plastic strain.
In the steady-state regime, there was a constant strain state along the rolling direction, which is why the deformations caused by the strains of adjacent areas almost completely cancel each other out: The adjacent opposite gray arrow pairs and thus deformations compensate each other. This is different on the leading edge where there was no strain in the area that was not rolled over. The rolled-over area with negative strain thus leads to the shoulder, as there is no counter formation: The rightmost arrow does not have an opposing arrow to its right, see Figure 10. At the beginning of the rolling path, the same effect leads to the indentation. In front of the rolling path, there is an additional area of strain of a lower positive magnitude. This leads to the small shoulder and to an increase in the depth of the indentation: The grey arrows at about point in the same direction, the plastic deformation does not cancel out but adds up. If there were no positive strains, the depth of the indentation at the beginning of the rolling path would be approximately equal to the height of the shoulder at the end.
The characteristic of the plastic surface deformation of a plane that is rolled over is thus decisively determined by the border area between strained and not-strained material. To show this more clearly, a synthetic strain state was generated. All strain components were assumed to be constant in the rolling direction, starting from the strain state of the first indentation. This excluded the influence of a changing strain state due to other effects. The synthetic strain state and the resulting plastic surface deformations are shown as dashed lines in Figure 7, Figure 8 and Figure 10, respectively.
A closer look shows that the synthetic strains as well as the corresponding deformations for the tensor components , , and were symmetrical, i.e., the same at the beginning and end of the rolling path. The component in Figure 10 shows the already discussed profile of the corresponding plastic deformation. Due to the smaller magnitude of synthetic strain in the steady-state regime, the deep indentation in the transient regime as well as the shoulder at the leading edge were less pronounced. Comparing the profiles of the summed deformation resulting of the original and the synthetic strain state, only minor differences can be seen, refer to Figure 8. These differences in plastic deformation are due to the transient change in pressure and plastic strains. Since the transient changes of pressure and plastic deformation are quite small compared to their overall magnitude, only the minor changes mentioned above result. However, it is obvious that the characteristic profile of the plastic deformation with the deep indentation is primarily due to the spatial distribution of the plastic strains, but not by its transient change.
3.3. Development of the Strain Components
In the transient regime, the pressure was increasing as shown in Figure 5a. As a result, increasing stresses and plastic strains could have been expected too. However, as shown in Figure 7, the components and decreased slightly, while the component increased slightly. The shear strain increased more clearly in its magnitude.
The flow of the material and the build-up of the plastic strains is mainly determined by the deviatoric stress state:
In Figure 11, the deviatoric stress state is shown in the x–z plane at a depth of for the moment of the initial indentation and for a rolled length of . Again, for ease of comparison, the contact center is shifted to . It can be seen that the stress state changed only to a very small extent. Thus, the largest difference was caused by the residual stresses that remained on the left side in the region that was already rolled over. This leads to the conclusion that the change of the stress state cannot be solely responsible for the development of the strains in the transient regime.
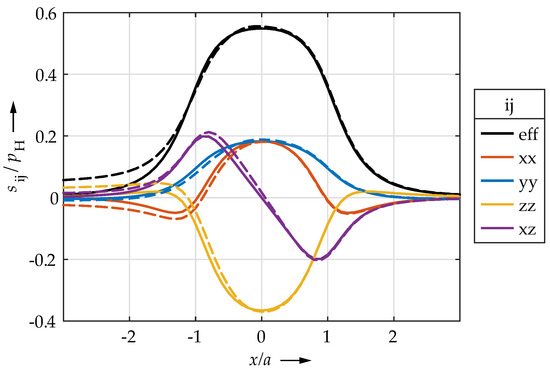
Figure 11.
Deviatoric stresses in the x–z plane for a depth of for the moment of the initial indentation (solid lines) and a rolled length of (dashed lines). The contact centers are shifted to .
Rather, the explanation can be found in the difference between the vertical initial indentation and the subsequent horizontal rolling. Starting the initial indentation (purely vertical), there are initially no strains or residual stresses, i.e., no strain hardening. By increasing the load successively, the material starts to yields and plastic strains build up defined by the hardening curve. Consistent with the stress state, the strongest straining occurs in the contact center with decreasing intensity towards the contact edge. The resulting strain state at full loading is very similar to the deviatoric stress state. The typical sign change of the strain component is formed. During subsequent rolling, the strains and residual stresses that were build up during the initial indentation remain and the material is already locally hardened.
Since the load remains constant and due to isotropic hardening, during rolling, further yielding only occurs between the contact center and the leading edge. Maximum yielding and thus the largest increments of strain change occur in the region of half the contact radius . The intensity decreases towards the contact center due to the already present strain hardening and towards the leading edge due to the present stress gradient. Since the strain increment is defined by the locally present deviatoric stress state, the plastic strains and experience larger increments than the other components of the strain tensor. Thus, higher strains of the and components and lower strains of the and components build up during the horizontal rolling compared to the vertical initial indentation.
At the beginning of the rolling path, the strain state is determined by the vertical initial indentation. In the steady-state regime, on the other hand, the strain state is determined by the horizontal rolling, more precisely the successive plastification at the leading edge. In the transient regime, the transition between the two states occurs. The strains and decrease slightly, while the other strains increase. The increase of the pressure and subsequently of the stresses and to a small extent also of the strains due to the change in conformity is lost in this effect, respectively, leads to a further increase of compared to the initial indentation.
4. Conclusions
In this paper, the transient effects at the beginning of a rigid sphere rolling on an elastic–plastic plane are analyzed. As a result of observing and explaining correlations between the plastic strains and plastic deformations as well as the pressure distributions during rolling, the existing explanatory approach (for example [6]) to those transient effects stating a change in conformity seems solely not to be sufficient. Aiming for more profound explanation, several different effects can be distinguished:
- The strain state at the very beginning of the rolling path is characterized by the vertical initial indentation. In contrast, during rolling, plastification occurs significantly at the leading edge due to the isotropic hardening behavior. The result is a different strain state in the steady-state regime. The transition between the two strain states takes place due to the decaying influence of the initial indentation as the distance from the start of rolling increases.
- The profile of the plastic deformation is only influenced to a minor extend by transient effects. The deep indentation at the beginning, as well as the shoulders at the beginning and end of the rolling path, are rather determined by the spacial distribution of the plastic strains, especially the shear strain with a change of sign at the beginning of the rolling path.
- The history of the pressure distribution is mainly a result of the previously described shape of the plastic deformation of the surface, and therefore the conformity of the contact. Certainly, an increase in pressure is coupled with a change in stresses and strains, and thus in plastic deformation, but for the model considered here, these influences on the transient behavior seem to be very small.
It becomes obvious that different mechanisms underlie the changes of pressure, plastic strains and permanent deformations of the surface at the beginning of a rolling contact. Since these continuum mechanical quantities are nonlinearly dependent on each other, a generally valid explanation is hardly possible. It is noted that the presented results are valid in the context of the presented model of a point contact considering isotropic hardening and a rigid sphere. Further research could deal with the investigation of the influence of different contact parameters, materials and hardening behaviors. This would extend and generalize the results presented here. Improving the understanding of observable transient initial effects of rolling contacts also provides the basis to assess the advantages and disadvantages of transient simulations over steady-state approaches.
Author Contributions
Conceptualization, M.J., M.B., S.T. and S.W.; methodology, M.J. and S.T.; formal analysis, M.J.; investigation, M.J.; writing—original draft preparation, M.J.; writing—review and editing, M.J., S.T., M.B. and S.W.; visualization, M.J.; supervision, M.B., S.T. and S.W.; project administration, S.W. All authors have read and agreed to the published version of the manuscript.
Funding
This research received no external funding.
Institutional Review Board Statement
Not applicable.
Informed Consent Statement
Not applicable.
Data Availability Statement
Data on the simulation software Telos that was used is not available due to trade secrets of Schaeffler Technologies AG & Co. KG. Raw simulation results are available on request from the authors.
Acknowledgments
The authors would like to thank Schaeffler Technologies AG & Co. KG for permission to use the company’s internal software Telos in the context of the research for this paper. In addition, we would like to thank Martin Correns for some fruitful discussions on the topic. We acknowledge financial support by Deutsche Forschungsgemeinschaft and Friedrich-Alexander-Universität Erlangen-Nürnberg within the funding programme “Open Access Publication Funding”.
Conflicts of Interest
The authors declare no conflict of interest.
Nomenclature
| a | contact radius given by Hertzian theory |
| B, C, n | swift isotropic hardening law parameters |
| E | Youngs’s modulus |
| F | applied load |
| h, | surface separation, initial gap |
| i, j | tensor indices |
| k, l | indices of the surface grid |
| p | contact pressure |
| maximum contact pressure given by Hertzian theory | |
| maximum contact pressure | |
| R | radius of the sphere |
| s | deviatoric stress tensor |
| u | total surface deformation |
| plastic surface deformation | |
| x, y, z | space coordinates |
| , | computational domain, contact area |
| mesh size | |
| rigid body displacement | |
| plastic strain tensor | |
| effective plastic strain | |
| Poisson’s ratio | |
| yield stress |
References
- Johnson, K.L. Contact Mechanics; Cambridge University Press: Cambridge, UK, 2012. [Google Scholar]
- Jacq, C.; Nélias, D.; Lormand, G.; Girodin, D. Development of a Three-Dimensional Semi-Analytical Elastic-Plastic Contact Code. J. Tribol. 2002, 124, 653–667. [Google Scholar] [CrossRef]
- Nélias, D.; Antaluca, E.; Boucly, V. Rolling of an Elastic Ellipsoid Upon an Elastic-Plastic Flat. J. Tribol. 2007, 129, 791–800. [Google Scholar] [CrossRef]
- Boucly, V.; Nélias, D.; Green, I. Modeling of the Rolling and Sliding Contact Between Two Asperities. J. Tribol. 2007, 129, 235–245. [Google Scholar] [CrossRef]
- Chen, W.W.; Wang, Q.J.; Wang, F.; Keer, L.M.; Cao, J. Three-Dimensional Repeated Elasto-Plastic Point Contacts, Rolling, and Sliding. J. Appl. Mech. 2008, 75, 021021. [Google Scholar] [CrossRef]
- Chaise, T.; Nélias, D. Contact Pressure and Residual Strain in 3D Elasto-Plastic Rolling Contact for a Circular or Elliptical Point Contact. J. Tribol. 2011, 133, 041402. [Google Scholar] [CrossRef]
- Flores, S.E.; Pontin, M.G.; Zok, F.W. Scratching of Elastic/Plastic Materials with Hard Spherical Indenters. J. Appl. Mech. 2008, 75, 061021. [Google Scholar] [CrossRef]
- van Breemen, L.C.A.; Govaert, L.E.; Meijer, H.E.H. Scratching polycarbonate: A quantitative model. Wear 2012, 274–275, 238–247. [Google Scholar] [CrossRef]
- Pletz, M.; Meyer, K.A.; Künstner, D.; Scheriau, S.; Daves, W. Cyclic plastic deformation of rails in rolling/sliding contact—Quasistatic FE calculations using different plasticity models. Wear 2019, 436–437, 202992. [Google Scholar] [CrossRef]
- Bhargava, V.; Hahn, G.T.; Rubin, C.A. An Elastic-Plastic Finite Element Model of Rolling Contact, Part 1: Analysis of Single Contacts. J. Appl. Mech. 1985, 52, 67–74. [Google Scholar] [CrossRef]
- Dang Van, K.; Maitournam, M.H. Steady-state flow in classical elastoplasticity: Applications to repeated rolling and sliding contact. J. Mech. Phys. Solids 1993, 41, 1691–1710. [Google Scholar] [CrossRef]
- Dang Van, K.; Maitournam, M.H. Rolling contact in railways: Modelling, simulation and damage prediction. Fatigue Fract. Eng. Mater. Struct. 2003, 26, 939–948. [Google Scholar] [CrossRef]
- Meyer, K.A.; Skrypnyk, R.; Pletz, M. Efficient 3d finite element modeling of cyclic elasto-plastic rolling contact. Tribol. Int. 2021, 161, 107053. [Google Scholar] [CrossRef]
- Boucly, V.; Nélias, D.; Liu, S.; Wang, Q.J.; Keer, L.M. Contact Analyses for Bodies With Frictional Heating and Plastic Behavior. J. Tribol. 2005, 127, 335–364. [Google Scholar] [CrossRef]
- Nélias, D.; Boucly, V.; Brunet, M. Elastic-Plastic Contact Between Rough Surfaces: Proposal for a Wear or Running-In Model. J. Tribol. 2006, 128, 236–244. [Google Scholar] [CrossRef]
- Gallego, L.; Nélias, D.; Deyber, S. A fast and efficient contact algorithm for fretting problems applied to fretting modes I, II and III. Wear 2010, 268, 208–222. [Google Scholar] [CrossRef]
- Polonsky, I.A.; Keer, L.M. A numerical method for solving rough contact problems based on the multi-level multi-summation and conjugate gradient techniques. Wear 1999, 231, 206–219. [Google Scholar] [CrossRef]
- Love, A.E.H. IX. The stress produced in a semi-infinite solid by pressure on part of the boundary. Philos. Trans. R. Soc. A 1929, 228, 377–420. [Google Scholar] [CrossRef]
- Chiu, Y.P. On the Stress Field Due to Initial Strains in a Cuboid Surrounded by an Infinite Elastic Space. J. Appl. Mech. 1977, 44, 587–590. [Google Scholar] [CrossRef]
- Chiu, Y.P. On the Stress Field and Surface Deformation in a Half Space With a Cuboidal Zone in Which Initial Strains Are Uniform. J. Appl. Mech. 1977, 45, 302–306. [Google Scholar] [CrossRef]
- Fotiu, P.A.; Nemat-Nasser, S. A universal integration algorithm for rate-dependent elastoplasticity. Comput. Struct. 1996, 59, 1173–1184. [Google Scholar] [CrossRef]
- Liu, S.; Wang, Q.; Liu, G. A versatile method of discrete convolution and FFT (DC-FFT) for contact analyses. Wear 2000, 243, 101–111. [Google Scholar] [CrossRef]
- Swift, H.W. Plastic instability under plane stress. J. Mech. Phys. Solids 1952, 1, 1–18. [Google Scholar] [CrossRef]
Publisher’s Note: MDPI stays neutral with regard to jurisdictional claims in published maps and institutional affiliations. |
© 2022 by the authors. Licensee MDPI, Basel, Switzerland. This article is an open access article distributed under the terms and conditions of the Creative Commons Attribution (CC BY) license (https://creativecommons.org/licenses/by/4.0/).