Article

Oil Change Interval Evaluation of Gearbox Used in Heavy-Duty Truck E-Axle with Oil Analysis Data

1
Automotive Research Institute, China National Heavy Duty Truck Group, Jinan 250101, China
2
National Heavy Vehicle Engineering Technology Research Center, Jinan 250101, China
*
Author to whom correspondence should be addressed.
Lubricants 2022, 10(10), 252; https://doi.org/10.3390/lubricants10100252
Submission received: 14 September 2022 / Revised: 7 October 2022 / Accepted: 8 October 2022 / Published: 11 October 2022

Abstract

:
Regular lubricating oil change in the gearbox is desirable for improving vehicle reliability and reducing operating costs. To achieve this objective, evaluating the oil change interval is necessary. However, due to the complex and dynamic properties of oil degradation, oil change interval evaluation has been a bottleneck in practice. Therefore, a solution strategy is proposed in this paper that utilizes the oil physicochemical properties derived from oil analysis data to determine the optimal oil change interval. With a large amount of oil analysis data collected, the iron (Fe) debris, kinematic viscosity (100 °C), and total acid number (TAN) are considered to be the oil change indicators of lubricating oil. By monitoring the changes in the selected oil change indicators, linear regression is firstly applied to the original oil analysis data to reveal the dynamic degradation process. Then, the Wiener-based stochastic process is used to describe the first hitting time and the increasing trends of the selected oil change indicator. Finally, the oil change interval can be obtained under the concept of the first hitting time. Compared with the planned maintenance time, the proposed method seems reasonable considering the dynamic property of oil degradation. The effectiveness of the proposed method is evaluated using a case study with an oil analysis dataset from an E-axle with a two-shift gearbox. The results show that the oil change interval increased by approximately 10,000 km (50%) compared with the planned maintenance interval. This will reduce vehicle maintenance time and save maintenance costs.

1. Introduction

Lubricating oil is one of the critical parts of the gearbox that has a significant effect on proper operation. It is used to reduce wear in friction couplings, improve thermal conduction with housing, and inhibit corrosion, which is critical to gearbox performance and longevity [1,2,3]. As the gearbox operates, the lubricating oil degrades with viscosity change, acidic substances, insoluble deposits, etc. [4,5,6]. Therefore, lubricating oil must be changed in a timely manner so that the gearbox (or the vehicle) will operate in a healthy state for an extended period of time.
Currently, planned maintenance (PM), which is performed based on scheduled intervals, is always used as the criteria to change the lubricating oil to ensure the gearbox operating status [7]. However, the oil change interval in such applications is usually observed on service time or operating mileage provided by similar equipment or expert experience [8]. In recent years, many original equipment manufacturers (OEMs) have tried to achieve long oil change intervals, and the traditional experience-based oil change interval can no longer meet their pursuits [9,10]. However, many researchers have tried to improve the tribological properties of the oil by using new base oils and adding new additives [11]. On the other hand, seriously degraded oil subsequently leads to severe wear of friction couplings and gearbox failure afterward [12,13]. Therefore, a reasonable oil change interval is necessary for protecting the gearbox, saving lubricant resources, and reducing maintenance costs.
Recently, condition-based maintenance (CBM) has been used in the industry to better evaluate oil change intervals [14,15,16]. Oil analysis data have been used to evaluate the health state of the lubricating oil. Still, to our knowledge, few works have been performed concerning oil condition monitoring data in gearbox applications. Kumar et al. [17,18] used various types of online sensors to investigate the effect of misalignment oil degradation as well as on wear of spur gears, which provide a new direction for oil condition monitoring. Zheng et al. [19] utilize a stochastic process in processing the oil analysis data from a mechanical transmission. The maintenance interval is derived by comparing the oil spectral data with the limit values. Yan et al. [20] proposed a lubricating oil replacement model in a Markov decision process framework. The optimal maintenance interval is determined by considering the oil analysis cost, the preventive maintenance cost, and the machine failure cost. However, these existing studies tried to evaluate the oil change interval from the wear debris concentration monitoring perspective, instead of from physicochemical properties, which may lead to an inaccurate result. Therefore, this paper aims to address an oil change interval evaluation problem for a gearbox with oil physicochemical analysis data.
In this paper, a linear regression analysis of the selected oil analysis data representing the oil physiochemical properties is firstly employed to fit a regression model. The regression coefficients or effects are then obtained, as well as the statistical characteristics of the dataset, namely, the mean value and the standard deviation. Subsequently, a Wiener process is applied to build the oil degradation model. Finally, the first hit time (FHT) is obtained by comparing the predicted degradation value with the predefined oil change threshold concerning oil physiochemical properties. The FHT represents the failure time whereby the oil cannot fulfill its functions during the gearbox operation. It is of practical significance for applying PHM in the field of lubricant to model the oil degradation process and evaluate the oil change interval of lubricating oil with oil analysis data concerning the oil physicochemical properties and, thus, is the main contribution of this paper. To illustrate the proposed approach in this paper, a case study is utilized for lubricating oil in an E-axle with a two-shift gearbox.
The rest of this paper is arranged as follows. Section 2 introduces the origin of the oil analysis data. In Section 3, linear regression is used for preprocessing the oil analysis data. Section 4 shows the degradation modeling, and the evaluation result of the oil change interval is obtained. Section 5 present the results of this work and some future research area.

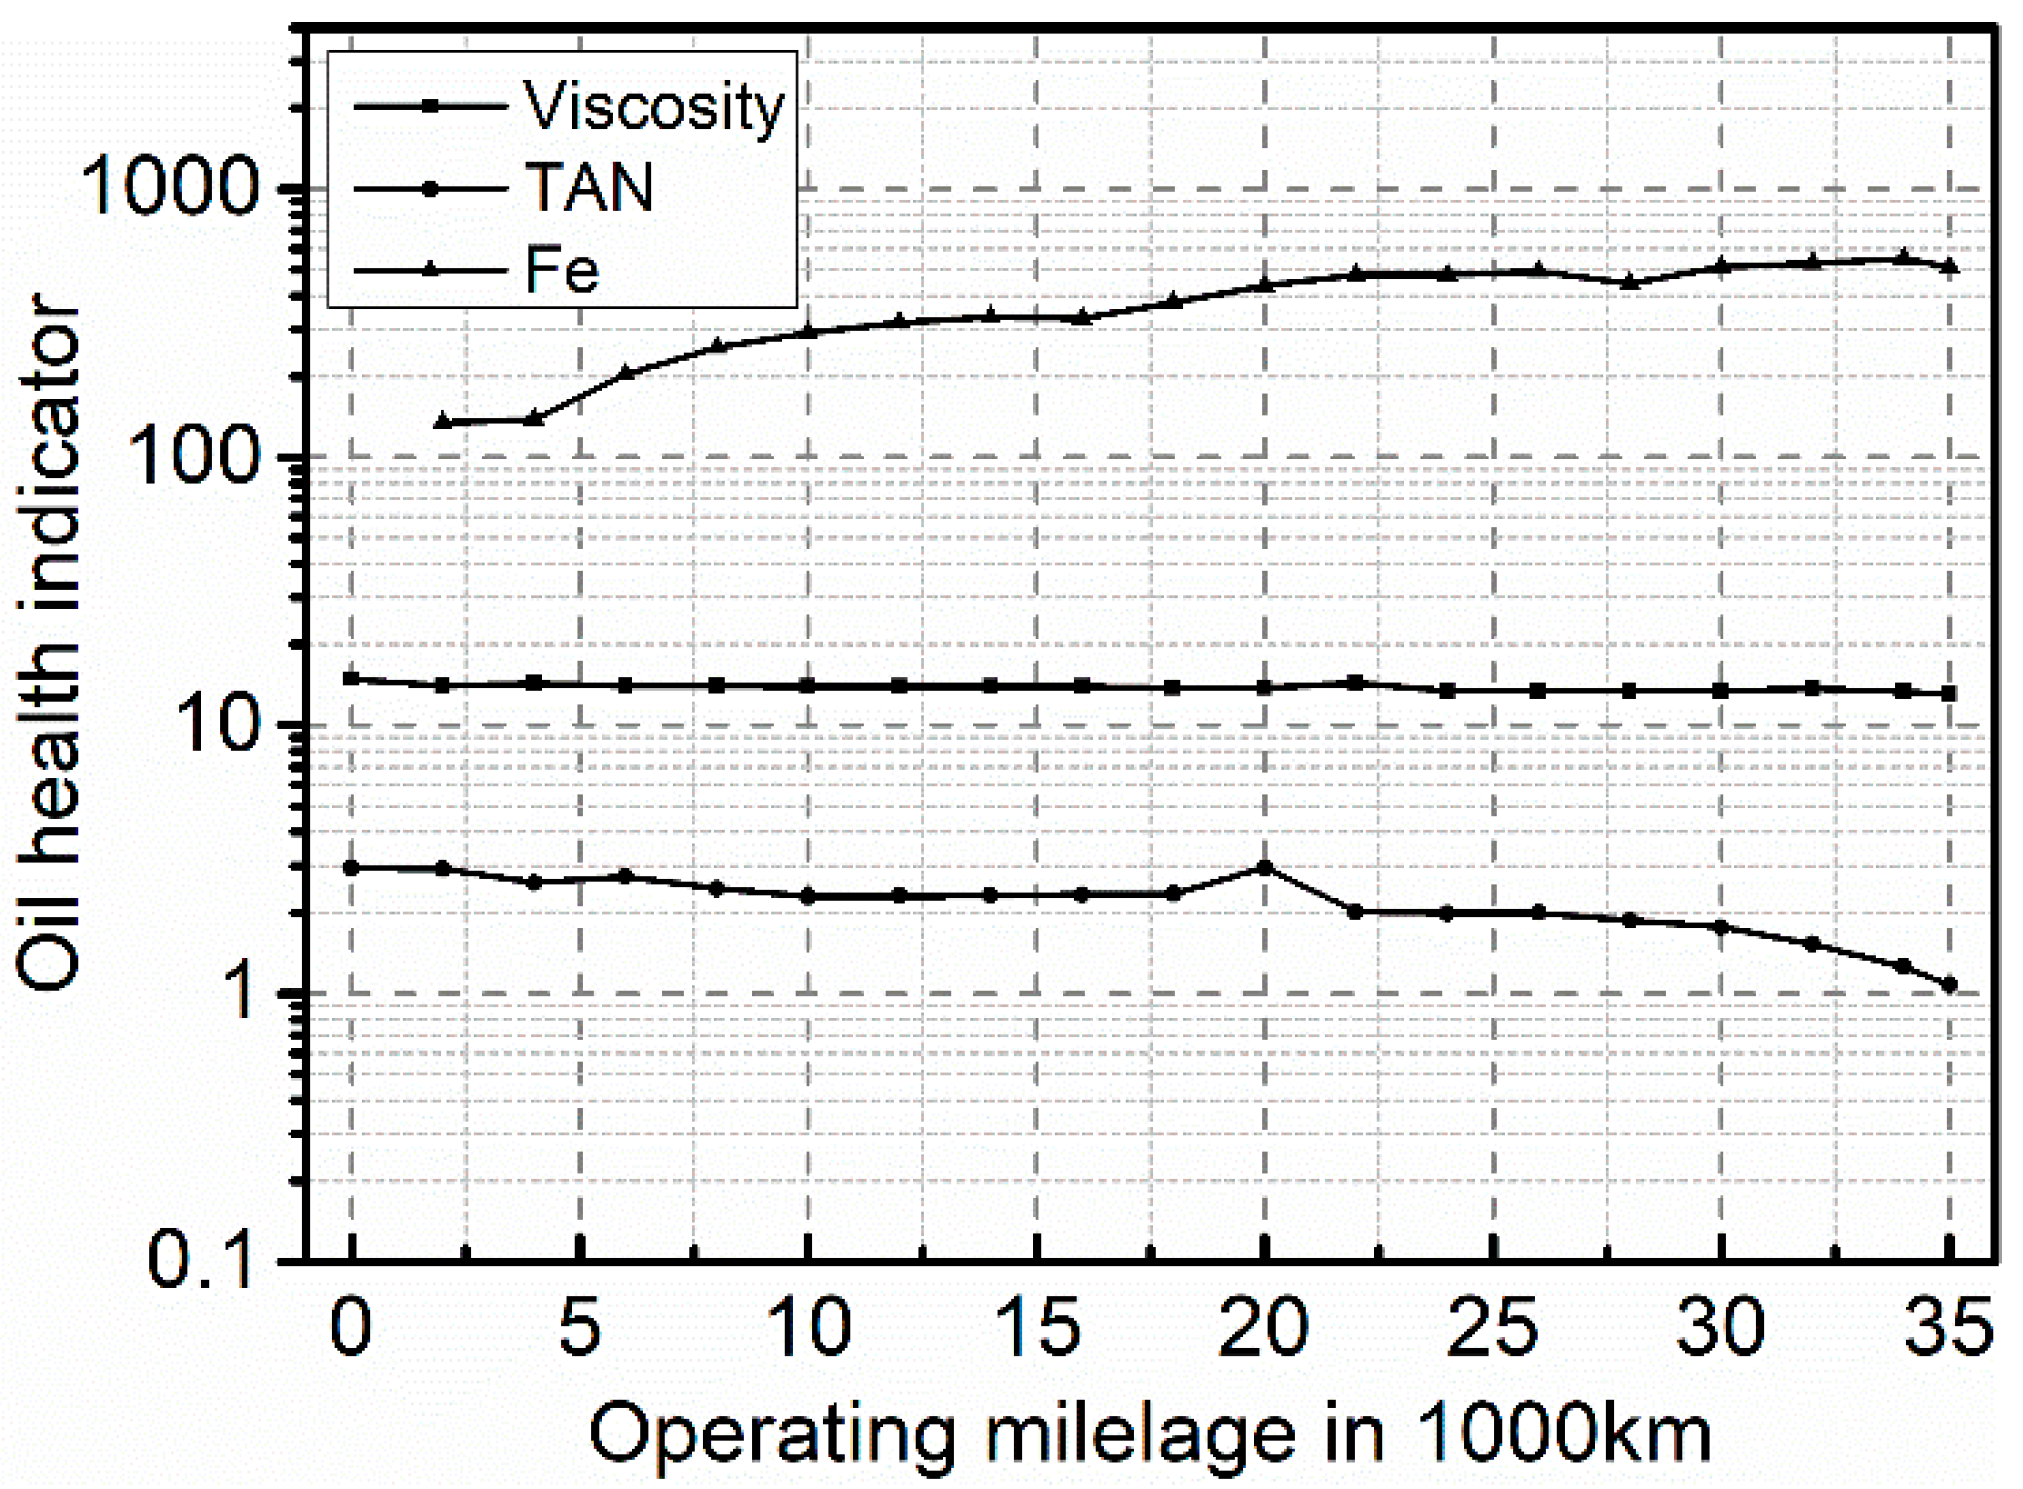
2. Origin of the Oil Analysis Data

The oil analysis data were derived from 35,000 km of regular oil monitoring for an E-axle used in a 6 × 4 test truck, in which the oil change interval was predetermined as 20,000 km. The E-axle combines a two-speed main reducer system with a differential mechanism and a wheel-side reduction system, which is newly developed for dump trucks, sprinklers, and sanitation trucks. The oil analysis data were collected from the reliability road test on a test gourd located in Chongqing, China. The specification and grade of gear oil were 75W/90 and J2360, respectively, and 19 sets of lubricating oil were obtained during the whole test. The sampling location was selected in the middle of the oil pan to obtain representative oil samples, and detailed principles of the sampling and analysis procedures can be found in [20].
After the road test, the experimental oil analysis data containing physical and chemical properties were obtained. The oil analysis data of lubricating oil represent the deterioration of the base oil, the loss of additives, and the oxidation of the oil. In the automotive industry, the selected oil change indicators for gear oil monitoring are kinematic viscosity at 40 °C and 100 °C, total acid number (TAN), N-pentane insoluble, moisture content, Fe debris, and Cu debris concentrations [21]. The kinematic viscosity represents the load-carrying capacity of base oil, where the decrease in kinematic viscosity results in a reduction in the load-carrying capacity. The measurements of TAN represent additives consumption and oil oxidation, where the increase in TAN indicates the acid production of oil. The measurements of the Fe debris concentrations represent the wear of the transmission gear, the rolling bearing, and the conflux planetary gear train, so the integral wear level for the E-axle can be obtained by monitoring the contents of Fe. When the E-axle is in operation, Fe debris spalling from every friction pair is mixed in the oil uniformly, which will lead to abrasive wear of the E-axle. On the other hand, the Fe debris in the oil will act as catalysts, accelerating the oil degradation afterward. So, the Fe debris accumulates in the lubricating oil, and the concentration increases with the E-axel operating, consequently leading to oil degradation [22]. Thus, in this paper, the kinematic viscosity at 100 °C, TAN, and Fe debris concentrations data were deployed to assess the oil degradation. Figure 1 shows the curves of the selected oil change indicator. Moreover, Table 1 shows the statistical characteristics, mean value, and standard deviation of the dataset.

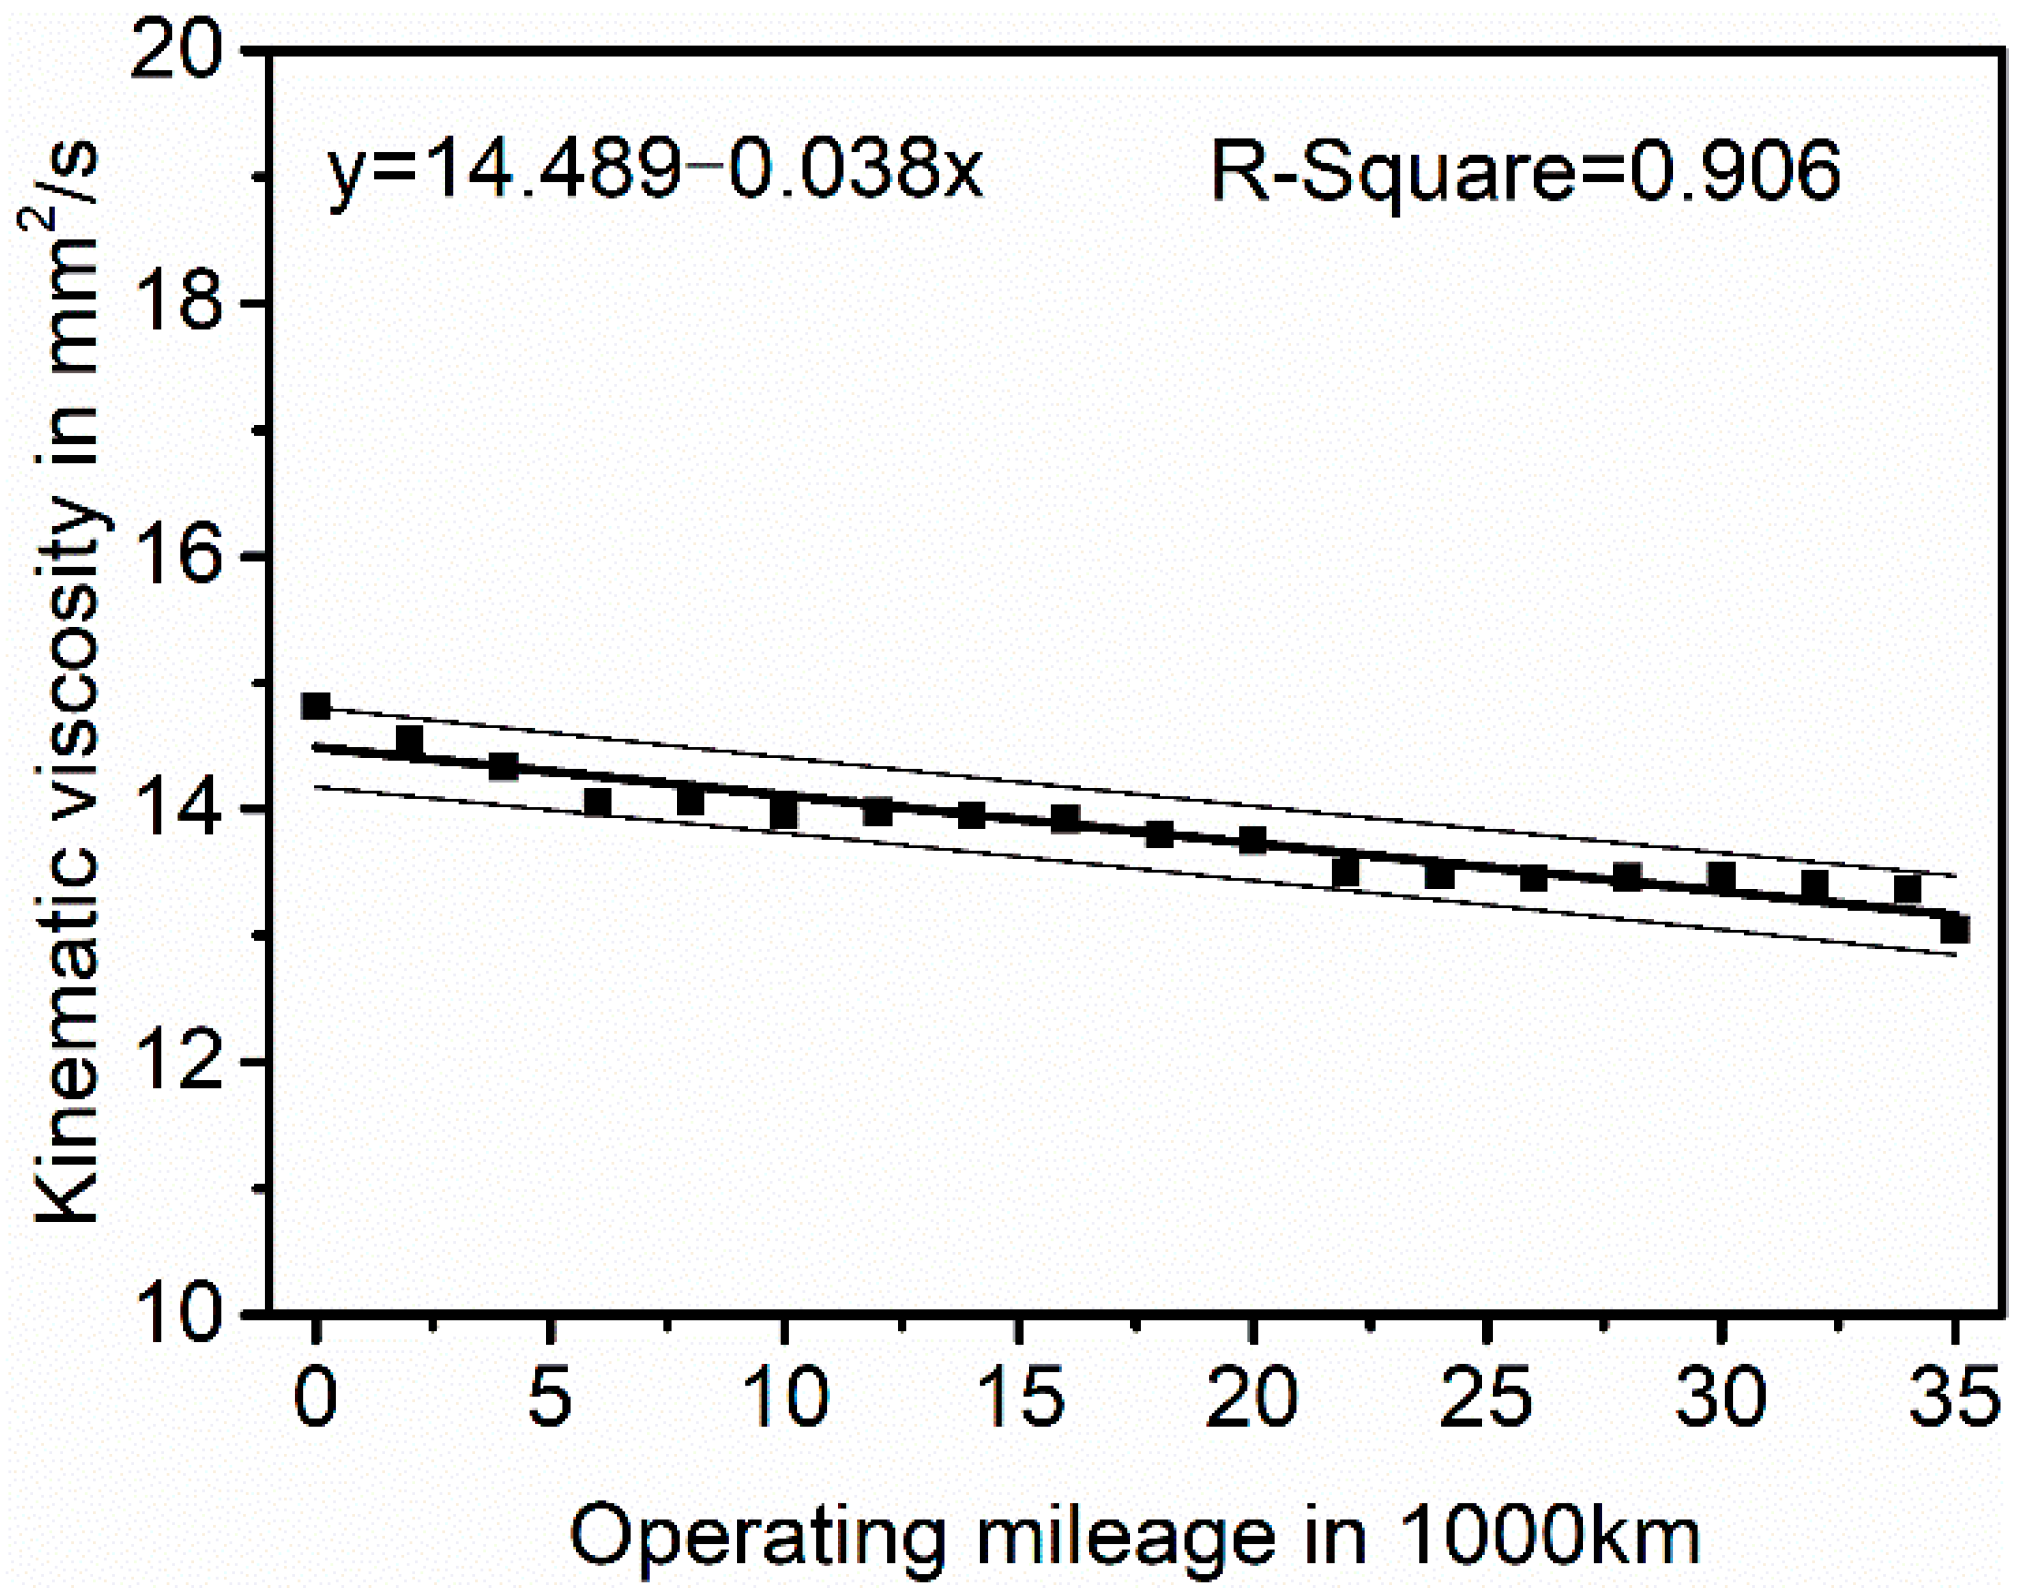
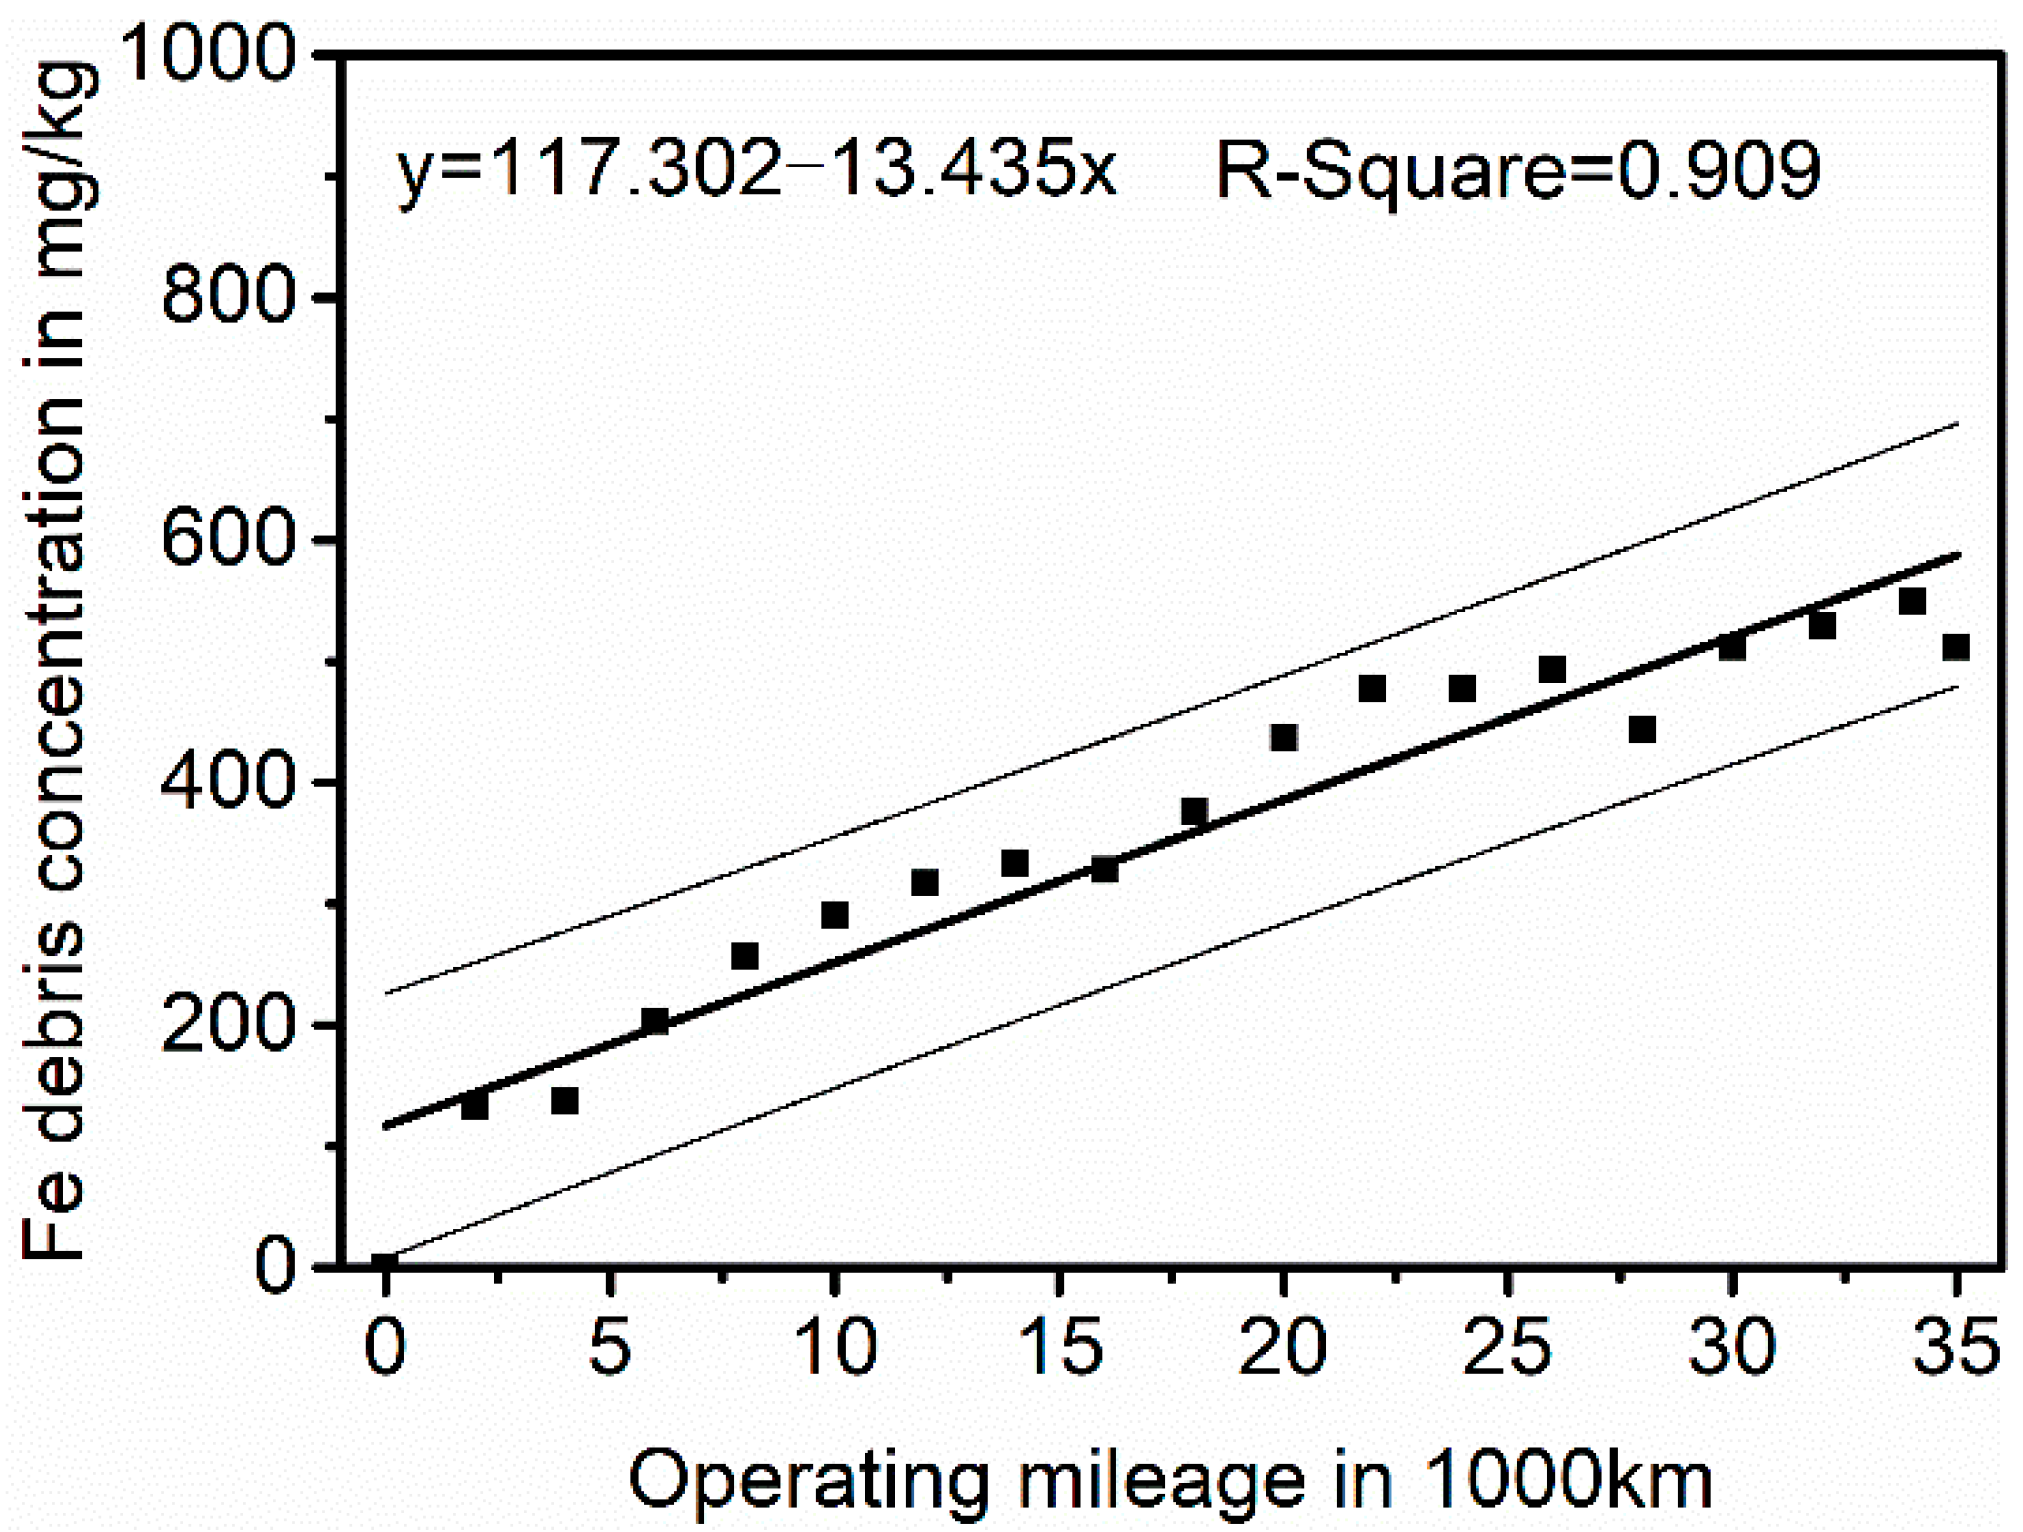
3. Regressive Analysis of the Oil Analysis Data

As described by Liu and Makis [23,24], the oil analysis data are usually considered a time sequence and are modeled as a regressive process given by
y = φ x , β = E ( Y | X = x ) ,
where y is a scalar dependent variable (oil analysis data) and can be denoted by Y, x is an explanatory variable and can be denoted by X = X 1 , X 2 , , X k , and the regression coefficients or effects are denoted as an m-dimensional coefficient vector that is represented by β = β 1 , β 2 , , β m .
As mentioned above, the oil physicochemical properties from the oil analysis data can be measured as y and sampled at various moments in a timely manner f j x . Then, the relationship between y and f j x can be modeled as
y = j = 1 m β j f j x ,
Let m = 2, f 1 x = 1 , and f 2 x = x , then, the formulas can be simplified as
y = β 1 + β 2 x ,
where β 1 represents the initial oil physicochemical properties; β 2 represents the degradation rate of the oil, specifically, the change rate of the oil analysis data.
For our real oil analysis data, as many researchers have conducted [19,25], the introduced linear regression analysis is used to estimate the effects of parameters, β 1 , and β 2 . Using the above-mentioned oil analysis data, the parameters in the Wiener process-based degradation mentioned in the next section can then be initialized. The fitting results are shown in Figure 2, Figure 3 and Figure 4.

4. Wiener Process Modeling and Oil Change Interval Evaluation of Oil

Since the degradation parameters are obtained, the degradation model is preferable for modeling the degradation process of the lubricating oil. Numerically, the selected oil change indicator is modeled using the Wiener process, the degradation level is compared with the corresponding threshold, and then the CBM-based oil change interval is obtained.

4.1. The Wiener Process

The lubricating oil starts working in a healthy state and is subject to oil analysis at regular monitoring times, providing oil degradation characteristics for oil change interval evaluation. In engineering practice, the Wiener process is extensively used to model degradation processes because of its clear concept, in which the drifting parameter models the degradation rate of the concerned system [26]. Therefore, the relationship between the oil’s physicochemical properties and the oil health state is described by using the Wiener process with the oil analysis data. In general, the standard Wiener process has the common properties [12]:
  • X 0 = 0 ;
  • For 0 < t 1 < t 2 < t n ,   X t n X t n 1   of X t , t 0 is a stationary and independent increment, which can be represented as an independent continuous random variable;
  • For t > s > 0, the probability distribution function (PDF) of the increment X t X s is a standard Brownian movement that follows N 0 , t s .
Thus, it can be easily obtained that
E X t = 0 t 0 ,
Var X 2   t = t     t 0 ,
As a special application, the statistical differential function (SDF) for the Wiener process with positive drift has the following form [20]
d Y t = μ · d t + σ · d X t t ,
where μ denotes the drift term, σ denotes the diffusion term, d X t is the increment of the Wiener process, and dt is the time increment.
If the Global Lipchitz condition and linear growth are realized on the diffusion term σ · and the drift term μ · [27], a unique and continuous strong solution is used such as
E 0 T X t 2 d t < ,
On the basis of It o ^ s lemma [28], we assumed that Y t = log W t , then
Y W = 1 W ,   2 Y 2 W = 1 W 2 ,
Accordingly
d Y = Y W d w + 1 2 2 Y 2 W d W t 2 = 1 W μ W d t + σ W d X + 1 2 1 W 2 σ 2 W 2 d t = μ 1 2 σ 2 d t + σ d X
Therefore
Y t = Y 0 + μ 1 2 σ 2 t t 0 + σ X t X t 0 ,
For the oil analysis data from the used gear oil samples, the degradation process very closely follows the random walk process. Therefore, the oil analysis data can be modeled by using the Wiener process.

4.2. Oil Change Interval Evaluation

The predicted values for the oil physicochemical properties of the iron (Fe) debris, kinematic viscosity (100 °C), and total acid number (TAN) are shown in Figure 5, Figure 6 and Figure 7, respectively. In these figures, the vertical dotted line at 20,000 km, which was determined by comparing it with a similar E-axle from competitive manufacturers, indicates the specified PM maintenance threshold. Furthermore, to compare the performance of the proposed method, the FHT of the oil physicochemical properties was also marked out according to the prediction results of the oil analysis data.
Using the oil change indicator of the existing national standard of china, GB/T 30034-2013 [18], the FHT of TAN is 30,000 km, which represents the oil change interval under the CBM concept, as shown in Table 2. Moreover, the oil change thresholds are also listed in the table to facilitate comparison. Specifically, if either indicator exceeds the predetermined threshold value, the lubricating oil needs to be replaced. As for the kinematic viscosity and Fe debris concentration, it is far from reaching its oil change constraints. Consequently, the oil change interval of the E-axle is 30,000 km. Compared with the previously specified PM-based oil change interval (20,000 km), the evaluated CBM-based oil change interval is extended by 10,000 km. With the extension of the oil change interval, the oil change frequency is reduced by 50% and, as a result, will effectively reduce the vehicle’s life cycle costs [29].
By analysis, the specified PM-based oil change interval is determined based on a comparison with other similar gearboxes, which cannot accurately consider the otherness of the oil types, the transmission configuration, the operation conditions, etc. On the other hand, the evaluated CBM-based oil change interval in the paper considers the individual difference between the oil-lubricated gearbox and the random influence of the environment, which helps in improving the estimation accuracy of oil degradation.
Please note that if maintenance actions have not been performed according to the scheduled maintenance plan, the oil may degrade seriously, and critical failure may occur in the gearbox.

5. Conclusions

In this study, the Wiener process was introduced to represent the oil degradation process for evaluating the oil change interval of the gearbox. The oil degradation was represented by the oil physicochemical properties derived from oil analysis data, specifically, the iron (Fe) debris concentration, kinematic viscosity (100 °C), and total acid number (TAN). The linear regression analysis was used to preprocess the oil analysis data to estimate the effects parameter, β 1 and β 2 , of the Wiener process. By doing this, the oil degradation model was established, and the FHT of the concerned oil change indicators was estimated to determine the oil change interval. The results show that the evaluated oil change interval is 10,000 km longer than the PM interval (20,000 km). In other words, the maintenance frequency was reduced by 50%, which will benefit the OEMs and customers by reducing vehicles’ life cycle costs.
Compared with the existing PM-based oil change interval, the interval evaluated in this paper is accurate by considering the actual health state of the lubricating oil, which is useful not only for accurate oil changes but also for CBM optimization and further cost reduction. The main contribution of this paper has not only established a new direction in evaluating the oil change interval by using oil analysis data but also established opportunities for maintenance policy optimization for vehicles. There are some possible directions for future research. Firstly, a degradation modeling method that can fuse multi-group oil analysis data may have to be used when dealing with more oil-lubricated gearboxes. Secondly, the relationship between the oil analysis data with the gearbox’s soft and hard failure should be specifically built. Thirdly, a method to make effective CBM optimization decisions based on the proposed method should be investigated. Last but not least, case verifications dealing with other oil failure modes should be carried out.

Author Contributions

Conceptualization, S.Y. and Z.K.; methodology, S.Y.; software, S.Y. and M.F.; validation, S.Y., H.L. and Z.K.; formal analysis, H.L. and B.L.; investigation, S.Y.; resources, Z.K. and B.L.; data curation, X.Z.; writing—original draft preparation, S.Y.; writing—review and editing, S.Y.; visualization, S.Y.; supervision, Z.K.; project administration, Z.K.; funding acquisition, Z.K. All authors have read and agreed to the published version of the manuscript.

Funding

This research was funded by a New Product R & D Project of the China National Heavy Duty Truck Group for E-Axle, grant number YF01121067D.

Institutional Review Board Statement

Not applicable.

Informed Consent Statement

Not applicable.

Data Availability Statement

Not applicable.

Conflicts of Interest

The authors declare no conflict of interest.

References

  1. Tung, S.C.; McMillan, M.L. Automotive tribology overview of current advances and challenges for the future. Tribol. Int. 2004, 37, 517–536. [Google Scholar] [CrossRef]
  2. Yan, S.; Ma, B.; Zheng, C. Degradation index construction methodology for mechanical transmission based on fusion of multispectral oil data. Ind. Lubr. Tribol. 2018, 72, 271–283. [Google Scholar] [CrossRef]
  3. Tung, S.C.; Woydt, M.; Shah, R. Global insights on future trends of hybrid/EV driveline lubrication and thermal management. Front. Mech. Eng. 2020, 6, 571786. [Google Scholar] [CrossRef]
  4. Zhou, F.; Yang, K.; Li, D.; Shi, X. Acid Number Prediction Model of Lubricating Oil Based on Mid-Infrared Spectroscopy. Lubricants 2022, 10, 205. [Google Scholar] [CrossRef]
  5. Hönig, V.; Procházka, P.; Obergruber, M.; Kučerová, V.; Mejstřík, P.; Macků, J.; Bouček, J. Determination of Tractor engine oil change interval based on material properties. Materials 2020, 13, 5403. [Google Scholar] [CrossRef]
  6. Yan, S.; Ma, B.; Zheng, C.; Chen, J. An optimal lubrication oil replacement method based on selected oil field data. IEEE Access 2019, 7, 92110–92118. [Google Scholar] [CrossRef]
  7. Khaleghei, A.; Makis, V. Reliability estimation of a system subject to condition monitoring with two dependent failure modes. IIE Trans. 2016, 48, 1058–1071. [Google Scholar] [CrossRef]
  8. Ma, B.; Yan, S.; Wang, X.; Chen, J.; Zheng, C. Similarity-based failure threshold determination for system residual life prediction. Eksploat. Niezawodn. 2020, 22, 520–529. [Google Scholar] [CrossRef]
  9. Yan, S.F.; Ma, B.; Zheng, C.S.; Chen, M. Weighted evidential fusion method for fault diagnosis of mechanical transmission based on oil analysis data. Int. J. Automot. Technol. 2019, 20, 989–996. [Google Scholar] [CrossRef]
  10. Yan, S.F.; Ma, B.; Zheng, C.S. Condition-based maintenance for power-shift steering transmission based on oil spectral analysis. Spectrosc. Spect. Anal. 2019, 39, 3470–3474. [Google Scholar] [CrossRef]
  11. Lijesh, K.P.; Muzakkir, S.M.; Hirani, H. Experimental tribological performance evaluation of nano lubricant using multi-walled carbon nano-tubes (MWCNT). Int. J. Appl. Eng. Res. 2015, 10, 14543–14550. [Google Scholar]
  12. Yan, S.F.; Ma, B.; Zheng, C.S. Remaining useful life prediction for power-shift steering transmission based on fusion of multiple oil spectra. Adv. Mech. Eng. 2018, 10. [Google Scholar] [CrossRef] [Green Version]
  13. Yan, S.F.; Ma, B.; Zheng, C.S.; Zhu, L.A.; Chen, J.W.; Li, H.Z. Remaining useful life prediction of power-shift steering transmission based on uncertain oil spectral data. Spectrosc. Spect. Anal. 2019, 39, 553–558. [Google Scholar] [CrossRef]
  14. Du, Y.; Duan, C.; Wu, T. Replacement scheme for lubricating oil based on Bayesian control chart. IEEE Trans. Instrum. Meas. 2020, 70, 1–10. [Google Scholar] [CrossRef]
  15. Tanwar, M.; Raghavan, N. Lubricating Oil remaining useful life prediction using multi-output Gaussian Process regression. IEEE Access 2020, 8, 128897–128907. [Google Scholar] [CrossRef]
  16. Wakiru, J.M.; Pintelon, L.; Muchiri, P.N.; Chemweno, P.K. A review on lubricant condition monitoring information analysis for maintenance decision support. Mech. Syst. Signal. Pract. 2019, 118, 108–132. [Google Scholar] [CrossRef]
  17. Kumar, P.; Hirani, H.; Agrawal, A.K. Online condition monitoring of misaligned meshing gears using wear debris and oil quality sensors. Ind. Lubr. Tribol. 2018, 70, 645–655. [Google Scholar] [CrossRef]
  18. Kumar, P.; Hirani, H.; Agrawal, A.K. Effect of gear misalignment on contact area: Theoretical and experimental studies. Measurement 2019, 132, 359–368. [Google Scholar] [CrossRef]
  19. Zheng, C.; Liu, P.; Liu, Y.; Zhang, Z. Oil-based maintenance interval optimization for power-shift steering transmission. Adv. Mech. Eng. 2018, 10. [Google Scholar] [CrossRef] [Green Version]
  20. Yan, S.; Ma, B.; Zheng, C. A unified system residual life prediction method based on selected tribodiagnostic data. IEEE Access 2019, 7, 44087–44096. [Google Scholar] [CrossRef]
  21. GB/T 30034-2013; GL-5 Gear Oil Change Index for Heavy Duty Vehicles. Standards Press of China: Beijing, China, 2013.
  22. Du, Y.; Wu, T.; Makis, V. Parameter estimation and remaining useful life prediction of lubricating oil with HMM. Wear 2017, 376, 1227–1233. [Google Scholar] [CrossRef]
  23. Liu, Y.; Ma, B.; Zheng, C.; Xie, Y. Failure prediction of power-shift steering transmission based on oil spectral analysis with wiener process. Spectrosc. Spect. Anal. 2015, 35, 2620–2624. [Google Scholar] [CrossRef]
  24. Makis, V.; Wu, J.; Gao, Y. An application of DPCA to oil data for CBM modeling. Eur. J. Oper. Res. 2006, 174, 112–123. [Google Scholar] [CrossRef]
  25. Aslam, M. Performance of Kibria’s method for the heteroscedastic ridge regression model: Some Monte Carlo evidence. Commun. Stat.-Simul. Comput. 2014, 43, 673–686. [Google Scholar] [CrossRef]
  26. Wang, D.; Tsui, K.L. Brownian motion with adaptive drift for remaining useful life prediction: Revisited. Mech. Syst. Signal. Pract. 2018, 99, 691–701. [Google Scholar] [CrossRef]
  27. Mao, X.; Sabanis, S. Numerical solutions of stochastic differential delay equations under local Lipschitz condition. J. Appl. Math. Comput. 2003, 151, 215–227. [Google Scholar] [CrossRef] [Green Version]
  28. Itô, K. Multiple wiener integral. J. Math. Soc. Jpn. 1951, 3, 157–169. [Google Scholar] [CrossRef]
  29. Pecht, M.G. A prognostics and health management roadmap for information and electronics-rich systems. IEICE ESS Fundam. Rev. 2010, 3, 25–32. [Google Scholar] [CrossRef]
Figure 1. Curves of the selected oil change indicators.
Lubricants 10 00252 g001
Figure 2. Linear dependence of viscosity.
Lubricants 10 00252 g002
Figure 3. Linear dependence of TAN.
Lubricants 10 00252 g003
Figure 4. Linear dependence of Fe.
Lubricants 10 00252 g004
Figure 5. Predicted values of kinematic viscosity.
Lubricants 10 00252 g005
Figure 6. Predicted values of TAN.
Lubricants 10 00252 g006
Figure 7. Predicted values of Fe debris concentration.
Lubricants 10 00252 g007
Table 1. Mean value and standard deviation.
Oil Change IndicatorMean Value μStandard Deviation σ
kinematic viscosity at 100 °C13.810.43
TAN2.200.52
Fe debris concentration358.42152.72
Table 2. Comparison of the PM and proposed CBM-based oil change intervals.
Oil Change IndicatorThresholdFHT (1000 km)CBM Interval (1000 km)PM Interval (1000 km)
kinematic viscosity at 100 °C+10%–−15%-3020
TAN±130
Fe debris concentration2000 mg/kg-
Publisher’s Note: MDPI stays neutral with regard to jurisdictional claims in published maps and institutional affiliations.

