Abstract
Experimental results have confirmed that parallel rough surfaces can be separated by a full fluid film. However, such a lift-off effect is not expected by the traditional Reynolds theory. This paper proposes a deterministic mixed lubrication model to understand the mechanism of the lift-off effect. The proposed model considered the interaction between asperities and the micro-elastohydrodynamic lubrication (micro-EHL) at asperities within parallel rough surfaces for the first time. The proposed model is verified by predicting the measured Stribeck curve taken from literature and experiments conducted in this work. The simulation results highlight that the micro-EHL effect at the asperity scale is critical in building load-carrying capacity between parallel rough surfaces. Finally, the drawbacks of the proposed model are addressed and the directions of future research are pointed out.
1. Introduction
The Reynolds equation has been widely used to predict the pressure distribution built up between two mating surfaces experiencing relative motion since 1886 [1]. According to the Reynolds equation, two parallel surfaces cannot generate pressure except in a squeeze motion. However, experimental studies have continuously shown that considerable pressure can be generated between parallel rough surfaces. Fogg [2] tested thrust bearings with parallel surfaces. Results showed considerable evidence, such as low friction losses and absence of wear scars on the surfaces, which indicated that the thrust bearing worked in the full film regime. Lebeck [3] reviewed a series of experimental results of parallel sliding surfaces, including seals and bearings. As the speed was increased, the bearing surface was lifted, and the asperity contact and friction were reduced. Ayadi and Brunetière et al. [4] tested mechanical face seals with various speeds and seal pressure values. The measured friction torque values showed the additional load-carrying capacity of parallel rough surfaces. These studies indirectly showed the considerable load-carrying capacity between parallel rough surfaces through the tribological performance, such as the friction force and wear scars.
A few studies directly measured the film thickness or pressure values between the two mating surfaces. Denny [5] measured fluid pressure between plane parallel thrust surfaces, and the results showed that, even with the absence of pressure differences across the face, the fluid film could bear significant loads. Pape [6] established an apparatus to measure the fluid film thickness between flat surfaces of radial mechanical seals. The results showed that a full lubricant film existed between the two mating surfaces. So and Chen [7] measured the electrical contact voltage between the two mating surfaces to illustrate the film thickness, which showed that the parallel surfaces were utterly separated by the fluid film at high speeds.
As mentioned before, the pressure built up between two parallel surfaces shown in experiments cannot be explained by the Reynolds equation alone. Therefore, researchers have proposed several different mechanisms to understand the lift-up phenomenon. Lebeck [8] evaluated suggested mechanisms for parallel sliding support, including thermal wedge [2], viscosity wedge [9], micro-asperity lubrication [10], asperity-asperity collisions [11], squeeze film [12], and deviation from parallel [6]. He concluded that the deviations from parallelism could result in a substantial hydrodynamic effect, while other mechanisms were not strong enough to explain the experimental results. However, he also stated that this did not mean the other mechanisms were wrong. Considering the complexity of the possible mechanisms, Lebeck [13] developed a semi-empirical model to predict the performance of mechanical seals with parallel surfaces, which used empirical data to predict the hydrodynamic effect. Stanghan-Batch and Iny [14] and Pape [6] stated that waviness with a long wavelength and micron amplitude could generate strong hydrodynamic support. At the same time, So and Chen [7,15] pointed out that micro-wedges formed by micro asperities between the two parallel surfaces provided the load-carrying capacity. In their model, the micro-wedges were simulated by micro tilting pad bearings, while in other micro-asperity lubrication studies [8], the asperities were assumed to form step bearings. The models of Lebeck [8] and So and Chen [15] simplified the parallel sliding problem significantly and made strict assumptions. Thus, there was no fully predictive mixed lubrication model for the parallel sliding problem. Recently, Brunetière and Francisco [16] analyzed the lubrication mechanism of parallel sliding rough surfaces by a deterministic mixed lubrication model for mechanical face seals [17]. Their model used the real measured roughness data and considered the hydrodynamic pressure and asperity contact pressure. The asperity contact was solved by an elliptical Hertzian model. They pointed out that the collective effect produced by asperities was the lubrication mechanism between parallel rough surfaces, not some independent sliding bearings on the generation of hydrodynamic pressure. In detail, the roughness distribution can generate lateral fluid flow locally. These local flows must be balanced because of the conservation of mass. Thus, additional pressure flows exist from place to place, which is the mechanism of building up pressures between parallel rough surfaces.
Although Brunetière and Francisco [16] have made significant progress in understanding the lubrication mechanism between parallel rough surfaces, there are still some shortcomings in the deterministic lubrication model they used. First, the contact of asperities was considered independently of each other. Meanwhile, according to the literature, the interaction between asperities has been proven to significantly influence the rough surface deformation [18,19,20,21,22,23]. Secondly, the influence of fluid pressure on the contact of asperities was ignored. Based on the work of Fowles [11,24,25,26], the influence of fluid pressure on the contact of asperities results in the elastohydrodynamic lubrication (EHL) effect when two asperities are approaching each other. This EHL effect at asperities is called the micro-EHL effect and it can generate significant load-carrying capacity between the nominally parallel rough surfaces. Therefore, this paper will first develop a deterministic lubrication model for parallel rough surfaces, in which the interaction between asperities and the micro-EHL effect at asperities are considered. The lubrication mechanism between parallel rough surfaces is then further explained based on the proposed deterministic model.
Deterministic models take the real surface topography into account, providing localized lubrication and contact information at the interfaces. Most conventional deterministic mixed lubrication models are developed for the non-conformal contact surfaces. Although the surface roughness is considered, the early deterministic mixed lubrication models can only deal with the working conditions without real asperity contacts. Such problems were studied in detail by many researchers, such as Ai and Cheng [27,28], Venner and Lubrecht [29,30,31,32], and others [33,34,35,36]. In 1995, Chang [37,38] first reported a deterministic line contact EHL model incorporating real asperity contacts. His model deals with the fluid regime and contact regime of asperities separately. Subsequently, Jiang et al. [39] reported a similar deterministic mixed EHL model for point contact problems, in which the fluid and asperity contact regimes were calculated separately. Zhu and Hu [40,41] proposed a mixed EHL model with reduced Reynolds equation and semi-system method. The highlight of their model is that the fluid and asperity contact regimes are solved with the same set of equations simultaneously. Their model draws much attention. Venner [42], Zhu [43], Zhu et al. [44], and Wang et al. [45] discussed the accuracy and detailed numerical implementations of the mixed EHL model. Some researchers [46,47] reported the theoretical and experimental verifications of the model. There are also some applications on fatigue analysis based on this mixed EHL model [48,49]. However, this model has not been extended to parallel rough surfaces yet.
Therefore, in this paper, the techniques used by Zhu and Hu [40,41] are used to develop the deterministic lubrication model for parallel rough surfaces. The interaction between asperities and the micro-EHL effect at asperities are involved in the model. The non-dimensionalized parameters and solution procedures are provided in detail, and the proposed model is verified against published experimental results and experiments conducted in the current work. Moreover, simulations without the micro-EHL effect at the asperity scale are also presented to highlight its role in building load-carrying capacity between parallel rough surfaces.
2. Materials and Methods
2.1. The Proposed Deterministic Model
Based on the mixed EHL model reported by Zhu and Hu [40,41], a deterministic mixed lubrication model for parallel surfaces is proposed, with its basic equations and main features addressed in this section. More information about all the symbols used below is given in the Nomenclature.
As nominally parallel surfaces are considered, the nominal fluid pressure between the surfaces should be equal to the flooded lubricant pressure, p0. Furthermore, the nominal parallelism and corresponding constant nominal pressure distribution will not change by ignoring the bulk deformation. Such constant nominal pressure distribution provides convenience in establishing a deterministic mixed lubrication model for parallel rough surfaces. The mixed lubrication performance of the parallel rough surfaces can be represented by a portion of the mating surfaces with roughness. It means that the solution domain does not need to cover the whole nominal contact area. A representative solution domain with equivalent surface roughness but a far smaller extent than the nominal contact area is used to conduct the mixed lubrication simulation. By reducing the solution domain, a large amount of computation is avoided, and the techniques in the mixed EHL model reported by Zhu and Hu [40,41] become applicable. In the meantime, such simplifications can highlight the micro-EHL effects at asperities in mixed lubrication of nominal parallel rough surfaces, which are ignored in previous studies. The boundary condition of the reduced solution domain is equal to the constant nominal pressure value.
The above discussions on reducing the solution domain are equivalent to implementing a two-scale modeling strategy. The nominal parallel rough surface is the macro-scale, and the roughness is the micro-scale. The macro-scale pressure distribution is constant due to the nominal parallelism and ignoring the bulk deformation. Thus, only the micro-scale roughness needs to be considered with a reduced solution domain. It should be noted that the size of the reduced solution domain could affect the simulation results. However, determining an appropriate size of the reduced solution domain needs systematic studies on the surface topographies, which are beyond the scope of the current study. Thus, the current work does not discuss the influence of reduced solution domain size. The size of the reduced solution domain is assumed according to the measurement equipment of roughness and the need for computational efficiency.
Fluid pressure in the reduced solution domain is obtained by solving the iso-thermal steady-state Reynolds equation [40,41],
where the x coordinate is in the direction of the relative motion of the two surfaces and the y coordinate is in the perpendicular direction. As discussed above, the pressure boundary condition can be assumed as the constant nominal pressure value p0, which gives p(x0,y) = p(xe,y) = p(x,y0) = p(x,ye) = p0.
As suggested by Zhu and Hu [40,41], when the lubricant film thickness, h, is approaching zero (h→0), asperity contact is assumed to occur and the Reynolds Equation (1) reduces to [40,41]
Recently, Wang et al. [46] performed a rigorous study utilizing both a dry contact solver and the reduced Reynolds Equation (2) and found that the predictions from both solvers were identical. Thus, it is reasonable to use Equation (2) to solve for asperity contact pressures, and the solution of Equation (2) becomes a subset of the overall solution procedure for solving Equation (1). The boundary condition between the asperity contact and fluid regimes, pl = pc, is automatically satisfied during the solution process.
It is essential to mention that, although the Reynolds Equation (1) and its reduced form (2) can be used together to solve a mixed lubricated contact, using Equation (2) as an independent equation to describe the asperity contacts is not physically relevant. From the numerical simulation perspective, solving Equation (1) with h approaching zero provides contact pressure values identical to the pressure values obtained using a dry contact solver based upon contact mechanics principles. Therefore, Equation (1) is used to solve the fluid and asperity contact regimes in this work.
Another point to note is the treatment of possible inter-asperity cavitation in the current work. The mass-conservation cavitation algorithm proposed by Elrod [50] is the most widely used cavitation boundary condition in lubrication analysis. Several researchers have used it in deterministic mixed lubrication models. The specific models are either conformal contacts without interaction between asperities and the micro-EHL effects at asperities (see Minet et al. [17]) or non-conformal contacts (see Pu et al. [51]). The current work is different from those previous deterministic mixed lubrication models. It is the first time the micro-EHL effects at asperities are considered in modeling mixed lubrication of parallel rough surfaces. Thus, whether the Elrod algorithm can be used in the proposed model still needs detailed investigation. In order to keep the brevity of this paper and focus on the influence of the micro-EHL effect, it is better to use a simple boundary condition to deal with the cavitation. Therefore, the simple Reynolds boundary condition is used in the current study to deal with the inter-asperity cavitation. When the pressure drops below zero at specific nodes, the corresponding pressure value is set to zero.
The film thickness equation is [40,41]
where h0 is adjusted to obtain the load balance in the solution procedures, δ1 is the rough surface data of the stationary surface, the moving surface is assumed to be smooth, and ν (x, y) is the elastic deformation [40,41]:
Equation (4) is the Boussinesq solution based on the half-infinite assumption commonly used in simulating the dry contact of conformal contact surfaces [52,53]. Its detailed derivation can be found in reference [54], chapter 2. For the macro-scale, parallel surfaces configuration, the validity of the half-infinite assumption becomes questionable. However, the elastic deformation mainly occurs at the asperities for the small solution domain considering roughness. Therefore, the solid contact points will share most of the applied load. This condition is similar to the dry contact, and Equation (4) can be used in the current work. Equation (4) is an integral equation linking the surface elastic deformation with the pressure distribution applied on the surface. No isolated asperities are defined or used to calculate the surface elastic deformation. The interaction of asperities is automatically implemented in solving the integral equation.
As the calculated pressure distribution involves the fluid pressure and asperity contact pressure, directly integrating the pressure distribution results in the load-carrying capacity, which should equal the applied load. Hence the load balance equation is [40,41]
where the applied load, w, corresponds to the reduced solution domain.
The lubricant properties are represented by the Barus [55] viscosity-pressure equation,
One point to note is that the viscosity law, Equation (6), can be replaced with other kinds of viscosity laws. The current study is not for discussing the influences of different viscosity laws. Thus, the most widely used Barus law is used.
The Dowson-Higginson [56] equation is used to represent the density-pressure relationship of lubricant:
where p is the pressure in GPa. It is worth mentioning that the viscosity-temperature and density temperature equations are not involved as the isothermal condition is assumed in this work.
The friction force in the mixed lubrication regime consists of asperity friction force and fluid shear force. Generally, the asperity friction force, Fc, is calculated by estimating the load carried by asperities, wc,, and a constant dry friction coefficient, fc, according to the equation: Fc = fc × wc.
In the mixed lubrication regime, the fluid film thickness is very thin, resulting in a very high shear rate. Therefore, although the Newtonian viscosity law, like Equation (6), is widely used, the non-Newtonian fluid model is still used to calculate the shear stresses in previous studies [41,47]. It should be noted that such incompatibility between the viscosity law used in lubrication calculation and shear stress calculation introduces errors. However, considering the focus of this work is not on studying the influence of viscosity laws used, the same manner as previously published works is employed. It means that the Newtonian viscosity law, Equation (6), is used to simulate lubrication and the non-Newtonian fluid model is used to calculate shear stresses. The shear stress model reported by Bair et al. [57] is used to calculate the hydrodynamic traction force as,
where
where τ is the shearing stress, is the shearing rate, τL is the limiting shear stress of lubricant, τL0 is the initial shear stress of the lubricant, γL is the pressure coefficient corresponding to the maximum friction coefficient in hydrodynamic lubrication, and ph is the fluid pressure. According to Bair et al. [57], for oil lubricant, τL0 = 2 MPa and γL = 0.05. The total friction can be written as F = Fc + Fh. The coefficient of friction can be calculated as f = F/w.
The model proposed above involves the interaction between asperities and the micro-EHL effect at the asperity scale. In order to further illustrate the influence of the micro-EHL effect, a schematic diagram comparing models with and without the micro-EHL effect is shown in Figure 1. Figure 1a shows the geometry of the lubricated surfaces without the micro-EHL effect, which is only determined by the dry contact of rough surfaces. In Figure 1b, the lubricating gap is also influenced by fluid pressure, showing the micro-EHL effect.
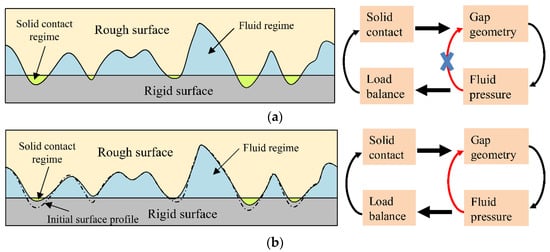
Figure 1.
Geometry of the lubricated gap and illustration of the micro-EHL effect: (a) Without the micro-EHL effect; (b) With the micro-EHL effect.
In the current work, a simple model without the micro-EHL effect is also used to directly illustrate the influence of the micro-EHL effect on the lubrication of parallel rough surfaces. In this simple model, the load shared by asperities solves the dry contact problem. The deformed gap between the rough surfaces is then used to calculate the hydrodynamic pressure. Next, the load carried by the fluid pressure is calculated. The total load-carrying capacity is the sum of the load shared by asperities and fluid and it should be equal to the applied load. If the load balance condition is not satisfied, the load shared by asperities is adjusted.
2.2. Numerical Methods
The numerical procedures used to solve the parallel contact problem formulated in the previous section are also based on the ideas proposed by Zhu and Hu [40,41]. The current study extends these conventional methods to parallel rough surfaces. The corresponding calculation flow chart is shown in Figure 2. The inner loop is designed to solve the pressure distribution, p, iteratively. Once the difference between the two adjacent iterations of pressure distribution is smaller than a predefined tolerance, the pressure distribution converges to the true solution. After the pressure distribution is obtained, the load-carrying capacity is calculated. The load balance equation, Equation (5), is then checked. When Equation (5) is fulfilled, friction forces, COF, and other parameters can be calculated. Otherwise, the rigid film thickness is updated, and the simulation goes back to the inner loop and runs again until Equation (5) is satisfied. The detailed equations for these numerical procedures are provided in Supplementary Material S1. It should be noted that, as the steady-state Reynolds equation, Equation (1), is used, there is no time step loop in Figure 2.
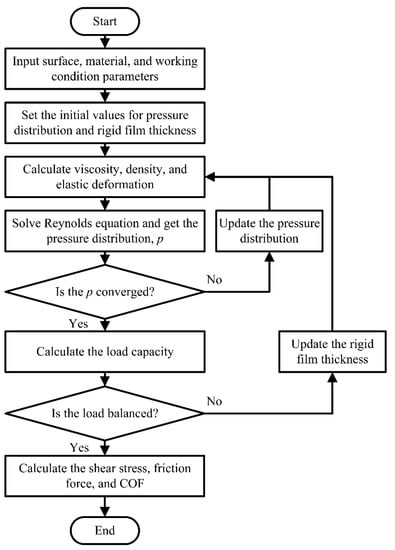
Figure 2.
Flowchart of the proposed method.
Compared to conventional solution procedures, three key factors need to be addressed to establish a dedicated parallel contact mixed lubrication model. The first factor is the procedure to obtain the initial pressure distribution. The second is solving the Reynolds equation with film thickness approaching zero, and the last is updating the rigid film thickness value to satisfy the load balance.
2.2.1. Obtaining the Initial Pressure Distribution
In the EHL problem, the initial pressure distribution used in the iterative procedures is a crucial parameter and is generally set as the Hertzian contact pressure distribution. However, no macro Hertzian contact zone exists when dealing with parallel contact surfaces, and a realistic estimate of the initial pressure distribution is needed. The current study obtains the initial pressure guess by utilizing a dry contact solver. This solver estimates the dry contact pressure distribution between contact surfaces based on the work of Almqvist et al. [53]. The reason for using this dry contact solver is that it provides a convenient way to calculate elastic and pure plastic deformation. In the current model, plastic deformation is only considered while estimating the initial pressure distribution. The strain hardening phenomenon is also ignored to simplify the simulation procedure and focus on the parallel contact mixed lubrication modeling.
2.2.2. Solving Reynolds Equation with Film Thickness Approaching Zero
The semi-system method is used to solve the Reynolds equation with film thickness approaching zero. When the film thickness approaches zero, the traditional simulation methods have numerical difficulties solving the Reynolds equation. The core idea is to improve numerical stability by enforcing the coefficient matrix resulting from the discrete Reynolds equation to be diagonally dominant. It is done by transposing some coefficients in the discrete elastic deformation equation from the right-hand side (RHS) to the left-hand side (LHS) of the discrete Reynolds equation. Detailed discretization equations can be found in Supplementary Material S1.
2.2.3. Updating the Rigid Film Thickness Value
The proportional–integral–derivative (PID) algorithm was applied to update the h0 [58]. The corresponding equation is
where k means the kth iteration, h0(k + 1) represents the h0 value for the (k + 1)th iteration, e(k) = W − Wk, and Kp, Ki, and Kd are constants determined through the solution procedures. The PID method can automatically adjust the updated value of the rigid film thickness to stabilize the simulation procedures and obtain converged results rapidly. Detailed information on using the PID method in lubrication simulations can be found in reference [58].
2.3. Experimental Details
2.3.1. Experimental Materials
Commercial WC-Ni samples named YN6 (WC samples with 6%wt of Ni) and GCr15 samples were used in the present work. The YN6 samples were supplied by the Ningbo Vulcan Mechanical Seals Manufacturing Co., Ltd., China, and were used as the stationary counterpart in the tribo-tests. GCr15 samples were used as the rotating counterpart in the tribo-tests. The lubricant used in this work is a synthetic polyalphaolefin (PAO02, provided by Shanghai fox chemical technology, Co., Ltd., Shanghai, China). The material and lubricant properties are listed in Table 1. The dry friction coefficient, fc, is usually assumed in previous studies. He et al. [47] reported its value varies in a narrow range, such as 0.07~0.15. In the current study, the fc is assumed to be 0.15 based on our experiments.

Table 1.
Material and lubricant properties.
Before tribological testing, the working faces of samples were lapped and polished with diamond slurry and then cleaned within an ultrasonic bath with ethanol. Sodium light and optical flats were used to check the flatness of the samples, which is less than 0.03 μm. A white light interferometer (Nexview, Zygo, Middlefield, CT, USA) was used to investigate the surface topographies before and after the tests. The measured surface is near 833 μm × 833 μm with 1024 × 1024 grids.
2.3.2. Tribological Test
Tribologcial tests were conducted on a standard commercial tribometer (PLINT TE92, Phoenix Tribology, Kingsclere, UK). Figure 3 shows the schematic diagram of the tribometer and a picture of the tribometer. The rotating ring is fixed in the drive shaft, while the stationary ring is assembled at the bottom of the lubricant pool. Between the rotating ring and the drive shaft, there is a self-alignment joint to compensate for manufacturing and assembly errors, by which the parallelism between the rotating and stationary ring surfaces is maintained to a certain extent. The loading cell applies a normal load from the bottom, and the friction force is measured by the frictional torque sensor. A thermocouple records the temperature near the tribological surfaces.
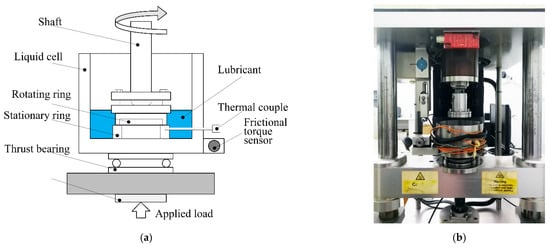
Figure 3.
Schematic diagram of the tribometer (a) and tribometer picture (b).
The structure of rotating and stationary rings is shown in Figure 4. The contact area is reduced by utilizing a specially designed rotating ring structure. The heat generated during the experiments remains under control with smaller contact areas. Thus, the lubricant viscosity and density can be assumed irrelevant to the temperature during the experiments, which is compatible with the proposed isothermal lubrication model. The heat control performance of this designed structure is validated, and the corresponding results are shown in Section 3.3.
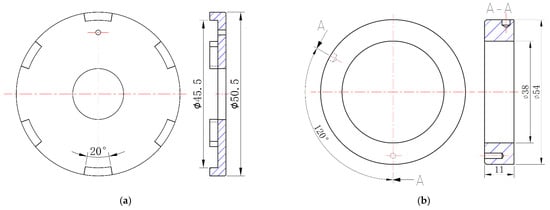
Figure 4.
Structure of the rotating ring (a) and stationary ring (b).
3. Results and Discussion
Lebeck [3] summarized a large amount of parallel sliding experimental data, among which the work of Lenning [59] was summarized with more details about the experimental parameters. Therefore, the proposed model was first verified against Lenning’s work. The model without the micro-EHL effect was then used to highlight the role of the micro-EHL on the generation of load-carrying capacity between parallel rough surfaces. Finally, the proposed model was used to simulate the predefined experiments (described above).
3.1. Verification Based on Lenning’s Results
The experimental parameters from Lenning’s work (summarized by Lebeck [3]) are presented in Table 2. A reduced solution domain with isotropic Gaussian rough surfaces was used in the current study, with rough surfaces generated by Wu’s method [60]. The mesh density of the reduced solution domain used is 256 × 256 points, which is used in the literature [43,49] to balance the accuracy and efficiency. The codes used in this study were verified with different mesh sizes in our published paper [45]. Two parameters are needed to simulate an isotropic Gaussian rough surface: the root-mean-square roughness (Sq) and the autocorrelation length. As Lenning only reported the Sq value of the sample surfaces, the autocorrelation length value needs to be assumed. A non-dimensional autocorrelation length equaling 10 was used in the current study. Generally, the simulated rough surfaces are non-dimensional. The Sq and sampling interval values were then used to restore the dimensions of simulated surfaces. Again, as Lenning did not report the sampling interval used to measure the sample surfaces, the sampling interval values were assumed in the current study. Different sampling interval values (1 μm, 2 μm, 3 μm, 4 μm) were assigned to the generated rough surfaces. It should be noted that the surface size (equaling the solution domain size) and the dimensional autocorrelation length were changed by altering the sampling interval. In other words, changing the sampling interval does not represent resampling a specific rough surface but creating another rough surface with a different size. As the sampling interval increased from 1 mm to 4 mm, the side length of the corresponding rough surface increased from 255 mm to 1020 mm. Moreover, as the Sq and non-dimensional autocorrelation length were assumed constant, the rough surfaces became smoother as the sampling interval increased. The smoothness can be partially reflected by the root mean square gradient (Sdq) of rough surfaces, whose values were 0.125, 0.062, 0.041, and 0.031 for sampling intervals from 1 mm to 4 mm, respectively. The smaller the Sdq is, the smoother the roughness will be. For each sampling interval value, 10 rough surfaces were generated and used as input in the simulations. The simulated coefficient of friction (COF) values were averaged to reduce the random errors resulting from rough surface generation.

Table 2.
Lenning’s experimental parameters.
Figure 5 shows the simulated COFs and Lenning’s experimental results with varying G, as well as the dimensionless duty parameter G = ηUB/W. As G increased, the COF value first dropped to the minimum value then increased, similar to the typical Stribeck curve, reflecting the transition from mixed to hydrodynamic lubrication regimes. Such a transition was also proved by the corresponding contact ratio curve, in which the contact ratio value reduced to zero as the parameter G increases (Figure 5). The corresponding pressure and film thickness distributions at three typical working conditions (G values corresponding to a, b, and c points shown in Figure 5) are shown in Figure 6. The mean film thickness values at the three working conditions were 0.34 μm, 0.57 μm, and 1.26 μm, respectively, directly showing the lifting-off between the two parallel surfaces.
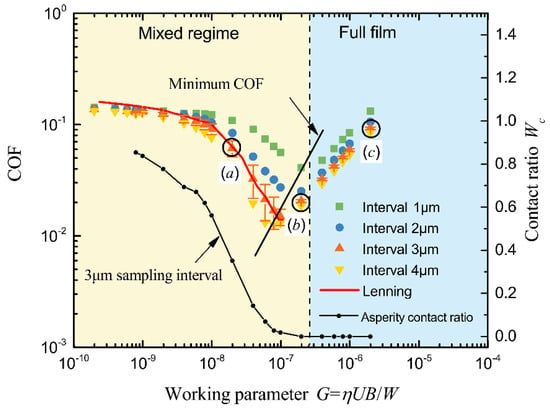
Figure 5.
Comparison of simulated and Lenning’s measured Stribeck curve.
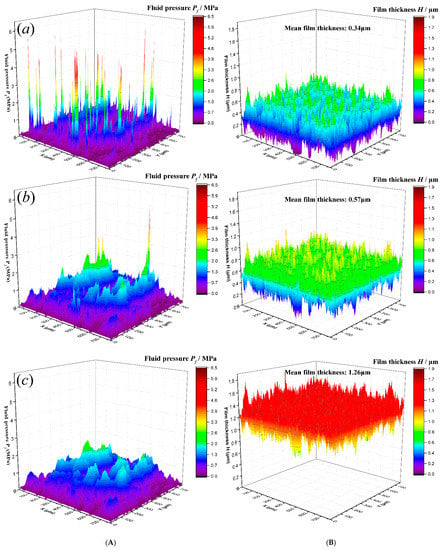
Figure 6.
Pressure distributions (A) and film thickness distributions (B) at points (a) (upper row), (b) (middle row), and (c) (bottom row) in Figure 5 (with the micro-EHL effect).
It can be readily seen from Figure 5 that the different sampling interval values used to simulate the rough surfaces significantly influenced the simulated COF. It should be considered that a larger sampling interval here represents a larger and smoother surface. As the sampling interval value increased, the decrease of COF became quicker (steeper fall in COF) in the mixed lubrication regime. The predicted minimum COF value also decreased and corresponded to smaller G values for larger sampling intervals. These results show that larger and smoother rough surfaces can enhance the mixed lubrication performance between parallel rough surfaces within the parameters studied in the current work. Moreover, as changing the sampling interval did not represent resampling a specific rough surface, the simulated COFs with the different sampling intervals did not converge to the same curve. Furthermore, an interesting point to observe is that, in the full film lubrication regime, the influence of the sampling interval value on the simulated COF was relatively small and became negligible as the sampling interval value increased. These results show that the rough surface size and smoothness have fewer influences on the lubrication performance within the full film regime.
The experimental COF values from Lenning’s work are also plotted in Figure 5. It was found that the simulated COF curve with a 3 μm sampling interval gave the best match against Lenning’s findings. These results indicate that, with the assumed constant Sq and autocorrelation length, the simulated surfaces with 3 μm sampling interval (surface size is 765 μm × 765 μm) should be the most reasonable estimation to represent the sample surfaces used by Lenning. Moreover, such results show that determining the appropriate size of the reduced solution domain is essential to obtain meaningful simulation results compared with the experiments. How to determine such a surface size is beyond the scope of the current study and should be studied in future work.
3.2. The Role of the Micro-EHL on Generating Load-Carrying Capacity
The new proposed model with the micro-EHL effect at the asperity scale has been proved to predict the lubrication status between two rough parallel surfaces. In order to further address the role of the micro-EHL effect, simulations without the micro-EHL effect were conducted with Lenning’s parameters.
Figure 7 shows the simulated COF curves and contact ratio curves with and without the micro-EHL effect. It can be readily seen that the simulation results without the micro-EHL effect could not predict the experimentally measured COF values. Moreover, as the G increased, the differences between simulated COFs with and without the micro-EHL effect first increased then decreased. The difference between the simulations with and without the micro-EHL effect is shown in Figure 1. With the micro-EHL effect, the gap geometry was determined by the combined effects of the fluid pressure and asperity contacts. In comparison, the gap geometry was only determined by the asperity contacts without the micro-EHL effect.
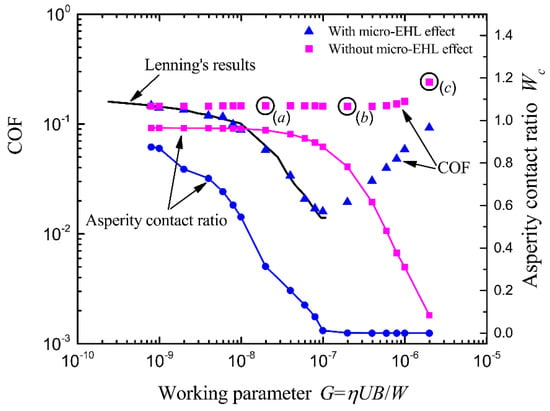
Figure 7.
Comparisons between the simulation results with and without the micro-EHL effect.
When the G value was small enough, the effects of fluid pressure on the gap geometry were insufficient. The asperity contacts shared most of the applied load whether the micro-EHL effect was considered or not. Thus, the two simulations predicted almost the same COF values when the G value was small enough. As the G increased, the effects of fluid pressure on the gap geometry became significant. The deformed gap geometry, in turn, affected the fluid pressure distribution, reducing the percentage of applied load shared by asperity contacts. Thus, the corresponding COF values dropped significantly. In comparison, the geometry gap was not directly affected by the fluid pressure for simulations without the micro-EHL effect, meaning the fluid pressure distribution did not change much. The asperity contacts still mainly bore the applied load. Thus, the corresponding COF values were not significantly reduced. Therefore, differences between simulated COFs with and without micro-EHL effect increased as the G increased from its minimum in Figure 7.
As the G continued to increase, the simulation with the micro-EHL effect entered full film regime, while the simulation without the micro-EHL effect still had asperity contacts. In the full film regime, the COF increased as the G increased. Therefore, the differences between COFs simulated with and without micro-EHL effects decreased when the simulation with micro-EHL effects entered the full film regime.
Figure 8 shows the pressure and film thickness distributions at three working conditions (a, b, and c), with the same G values as those a, b, and c points marked in Figure 5. The corresponding mean film thickness values were 0.43 μm, 0.44 μm, and 0.57 μm, respectively. In comparison, the mean film thickness values shown in Figure 6B were 0.34 μm, 0.57 μm, and 1.26 μm, respectively. Thus, when the micro-EHL effect was not involved, the increase of the mean film thickness was much slower as the G increases. Such results further illustrate the importance of the micro-EHL effect in the lifting-off of parallel rough surfaces.
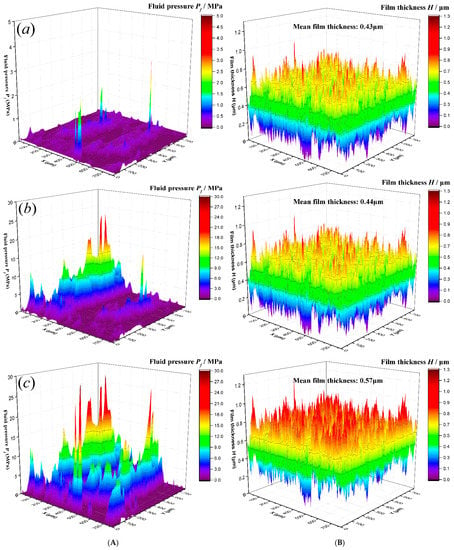
Figure 8.
Pressure distributions (A) and film thickness distributions (B) at points (a) (upper row), (b) (middle row), and (c) (bottom row) in Figure 7 (without the micro-EHL effect).
Furthermore, the central lines of the pressure distributions of the three working conditions shown in Figure 6A or Figure 8A were plotted in Figure 9. Whether the micro-EHL effect was considered or not, the pressure values increased as the G increases from point (a) to (c). A few significant pressure bumps were generated when the micro-EHL effect was not included. At other positions along the central line, the pressure values equaled the cavitation pressure. However, hydrodynamic pressure was generated at almost every central line position when the micro-EHL effect was considered. In other words, the micro-EHL effect reduced the cavitation area. These results directly indicate that the micro-EHL effect plays a significant role in generating hydrodynamic pressure between two parallel rough surfaces. One point that should be noted is that, even within the full film regime and working condition (c), the micro-EHL effects still existed and significantly influenced the fluid pressure distribution. Such results explain why the COFs with and without micro-EHL effects, shown in Figure 7, still have significant differences when the simulation with micro-EHL effects enters the full film regime. Another interesting point in Figure 9 is that the fluid pressure without the micro-EHL effect became far higher than that with the micro-EHL effect at some positions as the G increased from point (a) to point (c). This phenomenon was also due to the coupling effects between fluid pressure and surface deformation. When the effects of fluid pressure on surface deformation were not considered (without the micro-EHL effect), sharp fluid pressure peaks existed, indicating the gap geometry was steep at those positions. In contrast, the micro-EHL effect could flatten those steep geometries, eliminating corresponding sharp fluid pressure peaks. Therefore, the fluid pressure generated by the steep gap geometry (without the micro-EHL effect) could be higher than that generated by the flattened gap geometry (with the micro-EHL effect) when the G value is large enough.
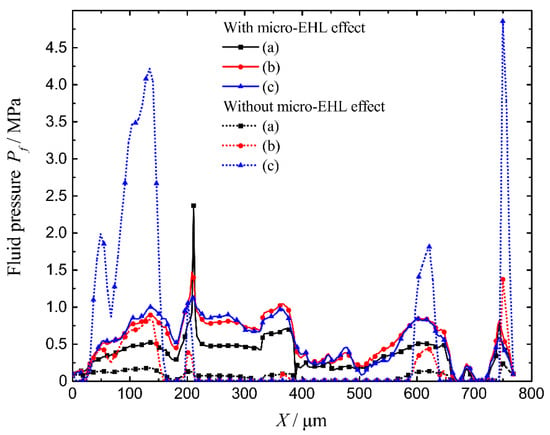
Figure 9.
Central line pressure profiles with and without the micro-EHL effect at points (a), (b), and (c).
Fowles [26] also stated the critical role of micro-EHL in generating hydrodynamic pressure between two asperities with relative motion. He extended a single-asperity EHL model to the macroscale, then calculated the friction force resulting from Lenning’s experimental parameters. However, the results were two or three times larger than the experimental values. Such a large discrepancy was the main reason why Lebeck [8] concluded that micro-EHL at the asperity scale could not generate strong enough load-carrying capacity between parallel rough surfaces. The current work inherited and improved Fowles’s [26] idea. The COF values calculated by the proposed deterministic model show a good agreement with Lenning’s experimental results. The important role of micro-EHL in the lifting-off of parallel sliding rough surfaces was reconfirmed. It should be noted that the collective effect of roughness distribution proposed by Brunetière and Francisco [16] is also intrinsically involved in the proposed model as the roughness distribution was used deterministically. These features make the proposed model a potentially promising tool to analyze the lubrication between parallel rough surfaces.
3.3. Experimental Results
In order to further establish the validity of the findings from the current study, a thorough new experimental study was performed. The working parameters were chosen as follows: applied load equals 100 N, rotating speed increases from 42 r/min to 1150 r/min in a stepwise manner, and then the system runs for 6 min at each speed. The applied load was kept constant during the process of varying the rotating speed.
Firstly, the specialized heat reducing rotating ring was justified by testing if it could keep the temperature near the contacting surface constant. Figure 10 shows that the overall temperature rise was less than 5 °C during the entire experiment, which lasted for nearly 2.5 h. Therefore, the thermal effect on the bulk of the lubricant could be ignored in the experiments. Moreover, this specially designed experimental configuration is valid for comparing the predictions from the proposed isothermal model.
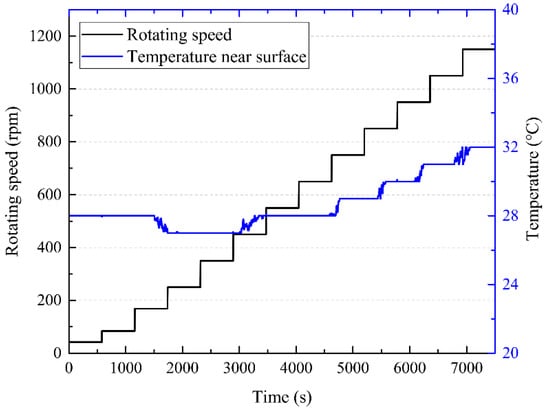
Figure 10.
Temperature rise during the test with stepwise increasing speed.
YN6 is much harder than GCr15 (Table 1), thus lapping and polishing make the contacting surface of YN6 (tens of nanometers) much smoother than that of GCr15 (hundreds of nanometers). Moreover, the harder the material, the smaller the deformation. These physical attributes provide an opportunity to simplify the simulation procedures by assuming one rough deformable surface sliding against a rigid and smooth surface, and only the roughness of the GCr15 sample was considered during the simulation.
As the test runs, the surface of GCr15 changed due to plastic deformation and wear. The 3D topographies before and after the experiment for one GCr15 sample are shown in Figure 11. The roughness within the contact changes significantly and ignoring these changes might result in a loss of accuracy. However, it is still challenging to simulate topography change caused by wear due to limited information about the complicated material wear process. Moreover, if the samples are taken out after each speed to get accurate surface topography, it may introduce errors in the assembly and disassembly processes.

Figure 11.
Surface topographies before and after the experiment of GCr15 sample: (a) Before test; (b) After test.
Therefore, to tackle this problem, several procedures were adopted in this work. First, only the surface topographies before and after the entire experiment were measured. A series of roughness parameters were then assumed, having their magnitude between the two extreme cases (before and after experiments). Such procedures ensure that the effect of the worn surface topography on the predictions, and vice versa, can be roughly estimated. Finally, each set of parameters was used to generate corresponding rough surfaces as input to the simulation framework. This procedure was done to mimic the effect of wear and plastic deformation on the predictions from the model. It is expected that the worn surfaces usually follow a non-Gaussian roughness distribution [61]. Therefore, a non-Gaussian roughness generation method proposed by the authors [62] was used to develop these intermediate surfaces.
Four key roughness parameters were selected to represent the generated surfaces, which are root-mean-square roughness (Sq), skewness (Ssk), kurtosis (Sku), and autocorrelation length (Sal). For the experimental surface roughness estimation, these parameters were calculated based on the measured surfaces from GCr15 samples at the beginning and end of each experiment. Each GCr15 sample had two measuring positions. Table 3 and Table 4 list the measured roughness parameters. Table 5 lists the values of the chosen roughness parameters that were assumed to generate the intermediate rough surfaces. As stated in Section 3.1, the measured surface was near 833 μm × 833 μm with 1024 × 1024 grids, which is too dense to run many simulations. Thus, the proven grid size (256 × 256) and sampling interval (3 μm) in simulating Lenning’s experimental results were used to generate rough surfaces for convenience. Using such grid size and sampling interval also makes the simulated surfaces have similar dimensions to the measured surfaces. It is worth noting that using the 3 μm sampling interval results in only two nodes per autocorrelation length (Sal is set as 7 μm, see Table 5). It is recommended that 10 nodes are needed per autocorrelation length to obtain accurate results at least [63]. For these measured surfaces, grids denser than 1024 × 1024 should be used to satisfy such criteria, resulting in much more computational costs. Considering that the current work is not at the stage to accurately predict COF or other tribological parameters, but focuses on including the micro-EHL effects in the parallel rough surfaces, the accuracy of simulated rough surfaces was compromised to keep the computational efficiency. Ten rough surfaces were generated for each set of parameters. These rough surfaces were used as the reduced solution domain for simulation. Moreover, the relative speed between the two mating surfaces was assumed to be the line speed at the average radius of the rotary ring.

Table 3.
Measured roughness parameters of GCr15 samples before the test.

Table 4.
Measured roughness parameters of GCr15 samples after the test.

Table 5.
The assumed roughness parameters for simulating input rough surfaces.
The simulated and measured COF curves are shown in Figure 12. It can be readily seen that the two measured COF curves had good repeatability. With the surface topography before the test, the simulated COF values in the mixed lubrication regime were much higher than the measured COF values. With the surface topography after the test, the simulated COF values in the mixed lubrication regime were much smaller than the measured COF values. When the surface topography changed from the before test values to the after test values (AS1 to AS6), the COF values in the mixed lubrication regime decreased. Moreover, as the surface topography changed from the before test values to the after test values, the minimum COF value decreased and the G corresponding to this minimum COF value decreased. It is expected that the simulated COFs with these surfaces do not fully match but intersect with measured COFs. Because the surface topography continuously changed as the experiments ran with increasing speed, the surfaces simulated, according to parameters in Table 5, were estimates of the surface topography at a specific moment in the experiment.
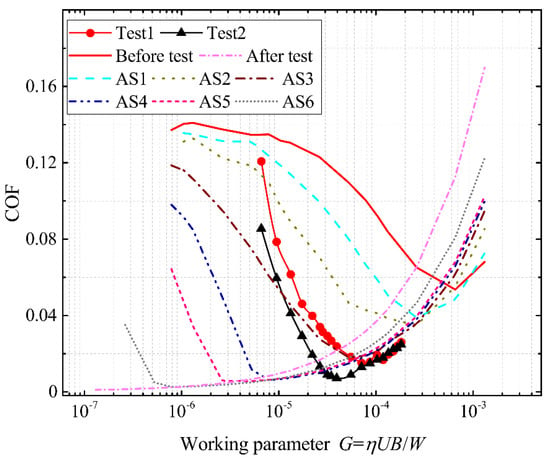
Figure 12.
Average simulated Stribeck curve of each group of surfaces and two groups of measured COF curves.
As the G passed the point corresponding to the minimum COF and continued to increase, the measured and simulated COFs increased, indicating the lifting-off of parallel rough surfaces. It is worth noting that the simulated COF values with surfaces closer to the surface topography after the test increased faster than the measured COF values in this regime. The reason could be that the experimental rig had vibration and other factors, thus could not maintain a steady full film between the testing samples. The measured COF values in this regime could be influenced by mixed friction. According to the Stribeck curve, moving working conditions toward the mixed regime from the full film regime reduces the COF. Therefore, the measured COF values show a slower increase than the simulated COF values obtained within a steady full film lubrication regime.
To further compare the predicted COF curves with the measured ones, discussions must focus on the points where these curves intersect. The measured COF values were given as discrete data. A line was added to the data to facilitate discussion and comparison of the measured COF values against the predicted curves. A close look at these curves shows that as the G increased, the measured COF values first intersected with the simulated curves, which resulted from simulated surfaces with comparatively less wear. This “less wear” surface is due to the fact that the predicted COF values give an approximate idea of the friction coefficient that may be prevailing in the real experiments by utilizing an intermediate roughness. In contrast, the measured COF values for each speed were averaged for the time of constant speed (see Figure 10). Moreover, at even higher G values, the measured COF curves intersected with those with more wear.
Based on the discussions above, the predicted COF values here gave a correct estimate of friction values measured from the experiments performed in this study. However, due to the lack of a real wear model, the study utilized intermediate surfaces. When these surfaces were used as input to the developed parallel contact mixed lubrication solver, the simulated friction was comparable to the friction value measured in experiments. This phenomenon also indicates that the change of measured COF values, as seen in the measured data given in Figure 12, is due to increasing G (caused by increasing speed) and surface wear, thus establishing the validity of the developed model.
4. Drawbacks and Outlooks
Although the current work illustrates the critical role of the micro-EHL effect at the asperity scale in building load-carrying capacity between parallel rough surfaces to some extent, some drawbacks about the proposed model should be addressed for future researches.
The first point is the lack of an appropriate inter-asperity cavitation model. In the current work, the Reynolds boundary condition is used to deal with possible cavitation, which is not mass-conservative. We used this simple boundary condition to keep the brevity of this paper and focus on the influence of the micro-EHL effect because this is the first time the micro-EHL effects at asperities have been considered in modeling mixed lubrication of parallel rough surfaces. However, one should keep in mind that the use of non-conservative and conservative cavitation models could result in significant differences in load prediction [64]. Therefore, based on the current study results, the mass-conservative cavitation boundary, such as the Elrod algorithm, must be implemented in the proposed model in future research to improve the accuracy.
The second point is the use of rheological models. The Newtonian viscosity law and the non-Newtonian shear model are usually used together in previous research [41,47]. The current study also uses such model combinations for convenience. However, these models are incompatible with each other theoretically. Therefore, such incompatibility of rheological models needs to be investigated in future research.
The third point is selecting the size of the reduced solution domain. In the current study, the size of the reduced solution domain was selected arbitrarily for convenience. However, in order to build a realistic model, it should be determined according to the roughness scales relevant to the lubrication problems studied. The reduced solution domain should contain significant features of surfaces while avoiding too fine details to save computational resources. Therefore, the following question should be studied in future research: how to choose an appropriate size of the reduced solution domain.
The fourth point is the lack of wear model in the proposed model. It has been clearly shown that the wear phenomenon plays a significant role in modeling the mixed lubrication between parallel rough surfaces. The current work utilized a series of assumed worn surfaces to simulate the influences caused by surface wear. In order to better understand the influences of wear on the mixed lubrication performance, a realistic wear model should be incorporated in the proposed model in future research.
5. Conclusions
A deterministic mixed lubrication model was proposed to simulate the lubricated contact of parallel surfaces. In the model, the interaction between asperities and the micro-EHL effect at asperities were considered. Numerical procedures previously developed for mixed EHL were improved to be compatible with parallel rough surfaces. Three key issues in the numerical procedures were addressed1) The initial pressure estimation (as the Hertzian assumption is no longer valid) was made using the dry contact simulation results as the starting pressure guess; 2) The semi-system method was recommended to solve the Reynolds equation for ultrathin lubricant films and mixed lubrication conditions; 3 The PID algorithm was recommended for updating the rigid film thickness to improve the stability of the solver.
The proposed model was verified for its ability to simulate COF values compared with published experimental results and some bespoke experiments performed in the current study. By comparing the results simulated with and without the micro-EHL effect at the asperity scale, the micro-EHL effect was proved to be a critical mechanism for building load-carrying capacity between parallel rough surfaces.
Outlooks of the proposed deterministic mixed lubrication model for parallel rough surfaces include: (1) mass-conservation boundary conditions to deal with inter-asperity cavitation; (2) using compatible rheological models in solving Reynolds equation and calculating shear stresses; (3) studying how to choose an appropriate size of the reduced solution domain; (4) incorporating surface topography wear model.
Supplementary Materials
The following are available online at https://www.mdpi.com/article/10.3390/lubricants10010012/s1, Supplementary document S1.
Author Contributions
Conceptualization, Y.W. and G.Z.; methodology, Y.W. and G.Z.; software, Y.W.; validation, Y.W. and G.Z.; formal analysis, Y.W.; writing—original draft preparation, Y.W.; writing—review and editing, Y.W., A.A., G.Z., A.D., Y.L. and M.C.T.W.; visualization, Y.W., A.A. and M.C.T.W.; supervision, Y.L. and A.N.; project administration, Y.L.; funding acquisition, Y.L. and A.N. All authors have read and agreed to the published version of the manuscript.
Funding
This research was funded by the National Basic Research Program of China (973), grant No. 2015CB057303, the National Natural Science Foundation of China, grant number 51975315, the Major National R&D Projects, grant number J2019-IV-0020-0088, the Engineering and Physical Sciences Research Council, grant number EP/001766/1 and EP/S030476/1.
Institutional Review Board Statement
Not applicable.
Informed Consent Statement
Not applicable.
Data Availability Statement
The data that support the findings of this study are available from the corresponding author, Y.W., upon reasonable request.
Conflicts of Interest
The authors declare no conflict of interest. The funders had no role in the design of the study; in the collection, analyses, or interpretation of data; in the writing of the manuscript, or in the decision to publish the results.
Nomenclature
| E′ | effective Young’s modulus |
| F | total friction force |
| Fh | friction force caused by fluid shear |
| Fc | friction force caused by asperity contact |
| f | coefficient of friction |
| fc | dry friction coefficient |
| G | duty parameter |
| h | film thickness |
| Kp, Ki, Kd | coefficients in PID controller |
| p | pressure |
| p0, pl, pc, ph | ambient pressure, lubricant pressure, contact pressure, fluid pressure |
| Sq | root-mean-square roughness |
| Sal | autocorrelation length of roughness |
| Ssk | skewness of roughness |
| Sku | kurtosis of roughness |
| Sdq | root mean square gradient of roughness |
| U | entrainment velocity |
| v | elastic deformation |
| w | load |
| wc | load shared by asperity contact |
| x | x-coordinate |
| y | y-coordinate |
| x, xe | start and end coordinates of solution domain in the x-direction |
| y0, ye | start and end coordinates of solution domain in the y-direction |
| α | pressure-viscosity exponent |
| δ1 | roughness data |
| η | viscosity |
| η0 | viscosity under ambient condition |
| ρ | density |
| ρ0 | density under ambient condition |
| τ | shearing stress |
| τL | limiting shear stress |
| τL0 | initial shear stress of lubricant |
| shearing rate | |
| γL | pressure coefficient |
References
- Reynolds, O., IV. On the theory of lubrication and its application to Mr. Beauchamp tower’s experiments, including an experimental determination of the viscosity of olive oil. Philos. Trans. R. Soc. Lond. 1886, 177, 157–234. [Google Scholar] [CrossRef]
- Fogg, A. Fluid Film Lubrication of Parallel Thrust Surfaces. Proc. Inst. Mech. Eng. 1946, 155, 49–67. [Google Scholar] [CrossRef]
- Lebeck, A.O. Parallel Sliding Load Support in the Mixed Friction Regime. Part 1—The Experimental Data. J. Tribol. 1987, 109, 189–195. [Google Scholar] [CrossRef]
- Ayadi, K.; Brunetiere, N.; Tournerie, B.; Maoui, A. Experimental and numerical study of the lubrication regimes of a liquid mechanical seal. Tribol. Int. 2015, 92, 96–108. [Google Scholar] [CrossRef]
- Denny, D. Some measurements of fluid pressures between plane parallel thrust surfaces with special reference to radial-face seals. Wear 1961, 4, 64–83. [Google Scholar] [CrossRef]
- Pape, J.G. Fundamental Research on a Radial Face Seal. A S L E Trans. 1968, 11, 302–309. [Google Scholar] [CrossRef]
- So, H.; Chen, C. Effects of Micro-Wedges Formed Between Parallel Surfaces on Mixed Lubrication—Part I: Experimental Evidence. Tribol. Lett. 2004, 17, 513–520. [Google Scholar] [CrossRef]
- Lebeck, A.O. Parallel Sliding Load Support in the Mixed Friction Regime. Part 2—Evaluation of the Mechanisms. J. Tribol. 1987, 109, 196–205. [Google Scholar] [CrossRef]
- Cameron, A.; Wood, W.L. Parallel Surface Thrust Bearing. A S L E Trans. 1958, 1, 254–258. [Google Scholar] [CrossRef]
- Dobry, A. The transitions between boundary, mixed and hydrodynamic lubrication. Wear 1964, 7, 290–297. [Google Scholar] [CrossRef]
- Fowles, P.E. The Application of Elastohydrodynamic Lubrication Theory to Individual Asperity-Asperity Collisions. J. Lubr. Technol. 1969, 91, 464–475. [Google Scholar] [CrossRef]
- Kuzma, D.C. Fluid inertia effects in squeeze films. Flow Turbul. Combust. 1968, 18, 15–20. [Google Scholar] [CrossRef]
- Lebeck, A.O. Mixed lubrication in mechanical face seals with plain faces. Proc. Inst. Mech. Eng. Part J J. Eng. Tribol. 1999, 213, 163–175. [Google Scholar] [CrossRef]
- Stanghan-Batch, B.; Iny, E.H. A Hydrodynamic Theory of Radial-Face Mechanical Seals. J. Mech. Eng. Sci. 1973, 15, 17–24. [Google Scholar] [CrossRef]
- So, H.; Chen, C. Effects of micro-wedges formed between parallel surfaces on mixed lubrication–Part II: Modeling. Tribol. Lett. 2005, 19, 83–91. [Google Scholar] [CrossRef]
- Brunetière, N.; Francisco, A. Lubrication Mechanisms Between Parallel Rough Surfaces. Tribol. Lett. 2019, 67, 116. [Google Scholar] [CrossRef] [Green Version]
- Minet, C.; Brunetière, N.; Tournerie, B. A Deterministic Mixed Lubrication Model for Mechanical Seals. J. Tribol. 2011, 133, 042203. [Google Scholar] [CrossRef]
- Greenwood, J.; Wu, J. Surface Roughness and Contact: An Apology. Meccanica 2001, 36, 617–630. [Google Scholar] [CrossRef]
- Lorenz, B.; Carbone, G.; Schulze, C. Average separation between a rough surface and a rubber block: Comparison between theories and experiments. Wear 2010, 268, 984–990. [Google Scholar] [CrossRef]
- Ciavarella, M.; Greenwood, J.; Paggi, M. Inclusion of “interaction” in the Greenwood and Williamson contact theory. Wear 2008, 265, 729–734. [Google Scholar] [CrossRef]
- Yastrebov, V.; Durand, J.; Proudhon, H.; Cailletaud, G. Rough surface contact analysis by means of the Finite Element Method and of a new reduced model. Comptes Rendus Mécanique 2011, 339, 473–490. [Google Scholar] [CrossRef]
- Yastrebov, V.; Anciaux, G.; Molinari, J.-F. From infinitesimal to full contact between rough surfaces: Evolution of the contact area. Int. J. Solids Struct. 2015, 52, 83–102. [Google Scholar] [CrossRef]
- Waddad, Y.; Magnier, V.; Dufrénoy, P.; De Saxcé, G. A multiscale method for frictionless contact mechanics of rough surfaces. Tribol. Int. 2016, 96, 109–121. [Google Scholar] [CrossRef]
- Fowles, P.E. Extension of the Elastohydrodynamic Theory of Individual Asperity-Asperity Collisions to the Second Half of the Collision. J. Lubr. Technol. 1971, 93, 213–215. [Google Scholar] [CrossRef]
- Fowles, P.E. A Thermal Elastohydrodynamic Theory for Individual Asperity-Asperity Collisions. J. Lubr. Technol. 1971, 93, 383–394. [Google Scholar] [CrossRef]
- Fowles, P.E. The Statistical Application of a Thermal EHL Theory for Individual Asperity-Asperity Collisions to the Sliding Contact of Rough Surfaces. J. Lubr. Technol. 1975, 97, 311–318. [Google Scholar] [CrossRef]
- Ai, X.; Cheng, H.S. A Transient EHL Analysis for Line Contacts With Measured Surface Roughness Using Multigrid Technique. J. Tribol. 1994, 116, 549–556. [Google Scholar] [CrossRef]
- Ai, X.; Cheng, H.S. The Effects of Surface Texture on EHL Point Contacts. J. Tribol. 1996, 118, 59–66. [Google Scholar] [CrossRef]
- Venner, C.H.; Lubrecht, A.A. Transient Analysis of Surface Features in an EHL Line Contact in the Case of Sliding. J. Tribol. 1994, 116, 186–193. [Google Scholar] [CrossRef]
- Venner, C.H.; Lubrecht, A.A. Numerical Simulation of a Transverse Ridge in a Circular EHL Contact under Rolling/Sliding. J. Tribol. 1994, 116, 751–761. [Google Scholar] [CrossRef]
- Venner, C.; Lubrecht, A. Numerical Simulation of Waviness in A Circular Ehl Contact, under Rolling/Sliding. Vehicle Tribol. 1995, 30, 259–272. [Google Scholar]
- Venner, C.H.; Lubrecht, A.A. Numerical Analysis of the Influence of Waviness on the Film Thickness of a Circular EHL Contact. J. Tribol. 1996, 118, 153–161. [Google Scholar] [CrossRef]
- Chang, L.; Cusano, C.; Conry, T.F. Effects of Lubricant Rheology and Kinematic Conditions on Micro-Elastohydrodynamic Lubrication. J. Tribol. 1989, 111, 344–351. [Google Scholar] [CrossRef]
- Lee, R.-T.; Hamrock, B.J. A Circular Non-Newtonian Fluid Model: Part II—Used in Microelastohydrodynamic Lubrication. J. Tribol. 1990, 112, 497–505. [Google Scholar] [CrossRef]
- Kweh, C.C.; Patching, M.J.; Evans, H.P.; Snidle, R.W. Simulation of Elastohydrodynamic Contacts Between Rough Surfaces. J. Tribol. 1992, 114, 412–419. [Google Scholar] [CrossRef]
- Chang, L.; Jackson, A.; Webster, M.N. Effects of 3-D Surface Topography on the EHL Film Thickness and Film Breakdown. Tribol. Trans. 1994, 37, 435–444. [Google Scholar] [CrossRef]
- Chang, L. Deterministic modeling and numerical-simulation of lubrication between rough surfaces—A review of recent developments. Wear 1995, 184, 155–160. [Google Scholar] [CrossRef]
- Chang, L. A deterministic model for line-contact partial elastohydrodynamic lubrication. Tribol. Int. 1995, 28, 75–84. [Google Scholar] [CrossRef]
- Jiang, X.; Hua, D.Y.; Cheng, H.S.; Ai, X.; Lee, S.C. A Mixed Elastohydrodynamic Lubrication Model With Asperity Contact. J. Tribol. 1999, 121, 481–491. [Google Scholar] [CrossRef]
- Zhu, D.; Hu, Y.-Z. The Study of Transition from Elastohydrodynamic to Mixed and Boundary Lubrication. The Advancing Frontier of Engineering Tribology, Proceedings of the 1999 STLE/ASME H.S. Cheng Tribology Surveillance. 1999, pp. 150–156. Available online: https://www.researchgate.net/profile/Dong-Zhu-7/publication/283921871_The_study_of_transition_from_full_film_elastohydrodynamic_to_mixed_and_boundary_lubrication/links/56c3bb2308aee3dcd4167a77/The-study-of-transition-from-full-film-elastohydrodynamic-to-mixed-and-boundary-lubrication.pdf (accessed on 1 December 2021).
- Hu, Y.-Z.; Zhu, D. A Full Numerical Solution to the Mixed Lubrication in Point Contacts. J. Tribol. 1999, 122, 1–9. [Google Scholar] [CrossRef]
- Venner, C.H. EHL Film Thickness Computations at Low Speeds: Risk of Artificial Trends as a Result of Poor Accuracy and Implications for Mixed Lubrication Modelling. Proc. Inst. Mech. Eng. Part J J. Eng. Tribol. 2005, 219, 285–290. [Google Scholar] [CrossRef]
- Zhu, D. On some aspects of numerical solutions of thin-film and mixed elastohydrodynamic lubrication. Proc. Inst. Mech. Eng. Part J J. Eng. Tribol. 2007, 221, 561–579. [Google Scholar] [CrossRef]
- Zhu, D.; Liu, Y.; Wang, Q. On the Numerical Accuracy of Rough Surface EHL Solution. Tribol. Trans. 2014, 57, 570–580. [Google Scholar] [CrossRef]
- Wang, Y.; Dorgham, A.; Liu, Y.; Wang, C.; Wilson, M.C.T.; Neville, A.; Azam, A. An Assessment of Quantitative Predictions of Deterministic Mixed Lubrication Solvers. J. Tribol. 2020, 143, 1–42. [Google Scholar] [CrossRef]
- Wang, W.-Z.; Hu, Y.-Z.; Liu, Y.-C.; Zhu, D. Solution agreement between dry contacts and lubrication system at ultra-low speed. Proc. Inst. Mech. Eng. Part J J. Eng. Tribol. 2010, 224, 1049–1060. [Google Scholar] [CrossRef]
- He, T.; Zhu, D.; Wang, J.; Wang, Q.J. Experimental and Numerical Investigations of the Stribeck Curves for Lubricated Counterformal Contacts. J. Tribol. 2016, 139, 021505. [Google Scholar] [CrossRef]
- Li, S.; Kahraman, A. A fatigue model for contacts under mixed elastohydrodynamic lubrication condition. Int. J. Fatigue 2011, 33, 427–436. [Google Scholar] [CrossRef]
- Yan, X.-L.; Wang, X.-L.; Zhang, Y.-Y. A Parametric Study on Fatigue Life for Mixed Elastohydrodynamic Lubrication Point Contacts. J. Tribol. 2013, 135, 041501. [Google Scholar] [CrossRef]
- Elrod, H.G. A cavitation algorithm. Transactions of the ASME. J. Lubr. Technol. 1981, 103, 350–354. [Google Scholar] [CrossRef]
- Pu, W.; Zhu, D.; Wang, J. A Starved Mixed Elastohydrodynamic Lubrication Model for the Prediction of Lubrication Performance, Friction and Flash Temperature With Arbitrary Entrainment Angle. J. Tribol. 2018, 140, 031501. [Google Scholar] [CrossRef]
- Stanley, H.M.; Kato, T. An FFT-Based Method for Rough Surface Contact. J. Tribol. 1997, 119, 481–485. [Google Scholar] [CrossRef]
- Almqvist, A.; Sahlin, F.; Larsson, R.; Glavatskih, S. On the dry elasto-plastic contact of nominally flat surfaces. Tribol. Int. 2007, 40, 574–579. [Google Scholar] [CrossRef]
- Barber, J.R. Contact Mechanics; Springer: Berlin/Heidelberg, Germany, 2018; Volume 250. [Google Scholar]
- Barus, C. ART. X.—Isothermals, Isopiestics and Isometrics relative to Viscosity. Am. J. Sci. (1880–1910) 1893, 45, 87. [Google Scholar] [CrossRef]
- Dowson, D. Elasto-Hydrodynamic Lubrication/by D. Dowson and G. R. Higginson; Chapters 9 and 10 by J.F. Archard and A.W. Crook; International Series on Materials Science and Technology; Oxford [Eng.]; Higginson, G.R., Ed.; Pergamon Press: New York, NY, USA, 1977; Volume 23. [Google Scholar]
- Bair, S.; Winer, W.O. The High Pressure High Shear Stress Rheology of Liquid Lubricants. J. Tribol. 1992, 114, 1–9. [Google Scholar] [CrossRef]
- Wang, Y.; Liu, Y.; Wang, Y. A Method for Improving the Capability of Convergence of Numerical Lubrication Simulation by Using the PID Controller, in Advances in Mechanism and Machine Science; Springer: Berlin/Heidelberg, Germany, 2019; pp. 3845–3854. [Google Scholar]
- Lenning, R.L. The transition from boundary to mixed friction. Lubr. Eng. 1960, 16, 575–582. [Google Scholar]
- Wu, J.-J. Simulation of rough surfaces with FFT. Tribol. Int. 2000, 33, 47–58. [Google Scholar] [CrossRef]
- Reizer, R.; Pawlus, P.; Galda, L.; Grabon, W.; Dzierwa, A. Modeling of worn surface topography formed in a low wear process. Wear 2012, 278-279, 94–100. [Google Scholar] [CrossRef]
- Wang, Y.; Liu, Y.; Zhang, G.; Wang, Y. A Simulation Method for Non-Gaussian Rough Surfaces Using Fast Fourier Transform and Translation Process Theory. J. Tribol. 2018, 140, 021403. [Google Scholar] [CrossRef]
- Brunetiere, N.; Wang, Q.J. Large-Scale Simulation of Fluid Flows for Lubrication of Rough Surfaces. J. Tribol. 2013, 136, 011701. [Google Scholar] [CrossRef]
- Qiu, Y.; Khonsari, M.M. On the Prediction of Cavitation in Dimples Using a Mass-Conservative Algorithm. J. Tribol. 2009, 131, 041702. [Google Scholar] [CrossRef]
Publisher’s Note: MDPI stays neutral with regard to jurisdictional claims in published maps and institutional affiliations. |
© 2022 by the authors. Licensee MDPI, Basel, Switzerland. This article is an open access article distributed under the terms and conditions of the Creative Commons Attribution (CC BY) license (https://creativecommons.org/licenses/by/4.0/).