Abstract
We present the results from a search for high-redshift radio galaxy (HzRG) candidates using 1.28 GHz data in the Abell 2751 field drawn from the MeerKAT Galaxy Cluster Legacy Survey (MGCLS). We used the HzRG criteria that a radio source is undetected in all-sky optical and infrared catalogues and that it has a very steep radio spectrum. We used the likelihood ratio method for cross-matching the radio catalogue against multi-wavelength galaxy catalogues from the Dark Energy Camera Legacy Survey (DECaLS) and the All-sky Wide Infrared Survey Explorer (AllWISE). For those radio sources with no multi-wavelength counterpart, we further implemented a radio spectral index criterium of , using in-band spectral index measurements from the wide-band MeerKAT data. Using a 5 signal-to-noise cut on the radio flux densities, we found a total of 274 HzRG candidates: 179 ultra-steep spectrum sources and 95 potential candidates, which could not be ruled out as they had no spectral information available. The spectral index assignments in this work were complete above a flux density of 0.3 mJy, which is at least an order of magnitude lower than existing studies in this frequency range or when extrapolating from lower frequency limits. Our faintest HzRG candidates with and without an in-band spectral index measurement had a 1.28 GHz flux density of 57 ± 8 Jy and 68 ± 13 Jy, respectively. Although our study is not complete down to these flux densities, our results indicate that the sensitivity and bandwidth of the MGCLS data make them a powerful radio resource to search for HzRG candidates in the Southern sky, with 20 of the MGCLS pointings having similar image quality as the Abell 2751 field and full coverage in both DECaLS and AllWISE. Data at additional radio frequencies will be needed for the faintest source populations, which could be provided in the near future by the MeerKAT UHF band (580–1015 MHz) at a similar resolution (∼8–10″).
1. Introduction
Observing the high redshift Universe is critical to our understanding of cosmological and astrophysical processes. It allows us to probe large-scale structures, galaxy evolution, and the period of time when the first stars formed, known as the epoch of reionisation (). In the radio regime, the high-redshift Universe can be probed through high-redshift radio galaxies (HzRGs). These galaxies, with large volumes of dust and gas (e.g., [1,2]), are expected to be actively forming stars and may be the progenitors of the massive ellipticals seen in the local Universe [3,4]. With their link to high-density environments such as proto-clusters or the centre of galaxy clusters (see the review by Miley and De Breuck [5] and references therein), HzRGs are critical targets to understand the formation and evolution of galaxies at early times and their connection to large scale structure formation.
Creating complete samples of HzRGs is challenging. The radio regime does however produce optically unbiased samples as it is unaffected by dust absorption and is therefore the most efficient band in which to detect high-redshift galaxies [6]. Spinrad [7] was the first to identify a radio galaxy beyond , with the highest redshift radio galaxy currently known being at [8]. Current searches for HzRG candidates require an additional data source, either in the form of multi-wavelength catalogues or multi-frequency radio data.
As HzRGs are by definition at a high redshift (), the effect of redshift dimming can be exploited with HzRG candidates identified as lacking a multi-wavelength counterpart when cross-matching with optical and/or infrared (IR) sky survey catalogues [9]. Where near-IR data are available, the relation [10] has been used to identify potential HzRGs when an infrared counterpart is found (e.g., [11,12]). Norris et al. [13] discovered a population of infrared-faint radio sources (IFRSs) after cross-matching radio and IR data for one of the Australia Telescope Large Area Survey fields. IFRSs are characterised by a radio source with a very faint or non-detection in deep IR data and may be a related to, or a subset of, HzRGs as they are also found at high redshifts [14,15,16].
Where multi-frequency radio data are available, HzRGs candidates have been identified through megahertz-peaked spectrum (MPS) sources [17,18] or by exploiting the now-established correlation between galaxy redshift and radio spectral steepness1 (; [6,19]). The latter method uses ultra-steep spectrum (USS; )2 radio sources to isolate HzRGs candidates. The correlation is not well-understood, with several theories put forward as to what causes the spectral steepening at high redshift (e.g., [9,20,21,22,23]), and the correlation is not exact as USS sources do not represent the entire high-z population (e.g., [24,25]). However, implementing the USS criteria has yielded the largest numbers of HzRG candidates [26,27,28,29,30,31,32,33] and, when combined with multi-wavelength cross-matching, can produce robust candidate lists for spectroscopic follow-up [34,35,36,37,38,39].
Early searches for HzRG candidates were restricted to bright ( mJy) radio sources extracted from available wide-area radio surveys (e.g., [36,40]). This flux density limit is gradually being reduced thanks to sensitive imaging with the new generation of radio interferometers (e.g., [33]), although implementation of the USS cut typically still requires multi-frequency radio observations to obtain spectral indices. The wideband receivers of the current pre-SKA era telescopes may be able to circumvent this requirement. The advancements in the quality of radio data, coupled with the availability of wide-area optical and infrared surveys, such as the Dark Energy Camera Legacy Survey (DECaLS; [41]) and the All-sky Wide-field Infrared Survey Explorer (All-WISE; [42]), are making HzRG searches more accessible.
In this article, we present the first results of a search for HzRG candidates in the Abell 2751 field using deep, wideband imaging from the MeerKAT Galaxy Cluster Legacy Survey (MGCLS; [43]). We cross-match the 1.28 GHz data with the DECaLS and AllWISE catalogues and use spectral index information from the wide MeerKAT band to implement USS cuts. The article is structured as follows. In Section 2, we introduce the radio data used in this study. In Section 3, we describe the multi-stage methodology used to determine HzRG candidates. The results are discussed in Section 4 with a summary and concluding remarks given in Section 5. Throughout this article, we assumed a flat CDM cosmology with km/s/Mpc and .
2. Radio Catalogue: MGCLS Abell 2751 Field
We used the first data release (DR1) of the compact source catalogue from the MeerKAT Galaxy Cluster Legacy Survey (MGCLS; [43]). The MGCLS consists of long-track (6–10 h) observations of 115 galaxy clusters in the Southern sky using MeerKAT’s L-band receiver (900–1670 MHz). For each cluster field, a primary beam-corrected image was produced at an effective observing frequency of 1.28 GHz. Each primary beam-corrected image spans a 1.2 1.2 sky region with a typical central RMS noise of 4−6 Jy beam in the full-resolution survey (≈7.5″−8″ full-width half-maximum (FWHM)). The source catalogue for each field was generated using the Python Blob Detection and Source Finder (pybdsf) package [44] with the default thresholds (3 island RMS and 5 peak RMS), and the final compact source catalogue includes only those sources identified as having only a single Gaussian component by pybdsf. Note that the dimensions of the elliptical Gaussian were free in pybdsf, so single-component sources are not necessarily unresolved.
The MGCLS DR1 images were not calibrated for direction-dependent effects, and therefore some fields present artefacts around the brightest sources. The level of contamination varies with the source brightness and position of the source within the primary beam. The pybdsf source finder incorrectly identifies some of these artefacts as real sources. To mitigate the level of artefact contamination in the final DR1 compact source catalogue, all catalogue sources within a given radius of a sufficiently bright source are removed. With this method, some real sources are removed along with the contaminating artefacts. However, the total number of sources removed (real and artefact) amounts to ∼2% of the total number of catalogued sources, and the removal of real sources was not expected to have a large effect on this work.
For this study, we used the Abell 2751 cluster field, centred at RA , Dec., with coverage from the DECaLS and AllWISE catalogues (see Section 3.2). The primary beam-corrected image had low RMS noise (6.6–11 Jy beam at ∼7.8″ resolution)3 and minimal visual contamination by bright source artefacts. The artefact-excised DR1 compact source catalogue for the Abell 2751 field consists of 3610 radio sources.
3. Identifying HzRG Candidates
We used a multistage approach to identify possible HzRG candidates in our radio catalogue, using sequential cuts to arrive at the final list of candidates. Given the number of sources involved, we used in-house automated tools where possible. In this section, we discuss each step of our process and the resultant whittling down of the catalogue to the final candidate list. Table 1 indicates the fraction of potential candidates remaining after each step of the process.

Table 1.
Selection criteria.
3.1. Step 1: Signal-to-Noise and Angular Size Requirements
Many HzRG searches enforce a flux density cut, with the most recent studies using sub-mJy limits at low (sub-GHz) frequencies (e.g., [33]). Given the sensitivity of the MGCLS data, we could potentially probe down to 35 mJy at the 5 level. However, although we selected one of the MGCLS fields with the fewest bright-source artefacts, the image noise does vary across the field due to the primary beam correction, with the local RMS noise increasing away from the image centre. Rather than implement a fixed flux density cut, we applied a signal-to-noise ratio (SNR) restriction using the fitted flux density versus its associated uncertainty from the source catalogue4 as the first step of the process. After applying a fitted flux density SNR requirement of 5, the radio catalogue was reduced to 1700 sources. It is possible that the input catalogue discussed in Section 2 may be missing faint sources due to the source-finding parameters. However, as the faintest sources were excluded through this SNR cut, this was not expected to affect the number of potential HzRG candidates in this study.
We simultaneously applied an angular size restriction of . Angular size restrictions have been necessary in HzRG searches using lower-resolution (lower-frequency) data in order to preferentially select high redshift sources [33]. Our radio data had a resolution of ∼7.8″, so this requirement may not have been necessary given that we were using a compact/point source catalogue. However, investigation of the catalogue shows that several sources, although meeting the single Gaussian fit requirement, were well resolved. Following Saxena et al. [33], we therefore restricted the catalogue to sources with an angular size smaller than ∼10″. There were 1414 radio sources after applying the SNR and angular size limits.
3.2. Step 2: Multi-Wavelength Cross-Matching
The next step of the process is to determine which radio sources have neither optical nor infrared counterparts using publicly available catalogues. To discard relatively bright nearby galaxies, we first cross-matched our SNR-cut catalogue against the eighth data release of the Dark Energy Camera Legacy Survey (DECaLS; [41]). The DECaLS catalogue includes g-, r-, and z-band magnitudes and has a positional accuracy of ≈20 mas. The sources with no identified DECaLS counterpart were then cross-matched against the All-sky Wide-field Infrared Survey Explorer (AllWISE) catalogue [42], which provides mid-infrared source data. We used the AllWISE W1, W2, and W3 band data, which have 5 median sensitivity limits of 54 Jy, 71 Jy, and 730 Jy, respectively, and astrometric accuracies in the Abell 2751 region of better than 70 mas.
We used the likelihood ratio (LR) method, introduced by Sutherland and Saunders [46] and further adapted by Ciliegi et al. [47], to cross-match our radio and multi-wavelength catalogues and determine optical or infrared counterparts for our radio sources. Here, we summarise the key properties of the LR method and refer the reader to Sutherland and Saunders [46] and Georgakakis et al. [48] for more details. An LR value was determined for each potential match within a specified search radius of a given radio source, where the LR compares the probability that a source match is the true counterpart to that of the same source being a spurious match, i.e.,
where is the expected magnitude distribution for the true counterparts, is the probability distribution function of the positional uncertainties in the involved catalogues, and is the surface density of the unrelated background objects with magnitude m. For our catalogues, the probability distribution function is a two-dimensional Gaussian distribution dependent on the combined positional uncertainties of the sources in both catalogues. We assumed elliptical Gaussian distributions for all catalogues: we used radio positional uncertainties from the MGCLS catalogue, IR positional uncertainties from the AllWISE catalogue, and a conservative systematic positional uncertainty of 0.2″ in both RA and Dec. for DECaLS.
In cases where there is more than one potential match to a given radio source, the LR method can be used to calculate the reliability, , of each match:
where ∑LR is the sum of LR for all possible counterparts to a radio source within our defined search radius and Q is the fraction of the radio sources with catalogue counterparts above the magnitude limit. The LR method can therefore be used to identify the most likely counterpart for a given source in cases where there may be more than one possible match. An estimate of the spurious identification rate (or error rate) can be obtained by comparing with the total number of counterparts above a certain LR value. This cutoff in LR aims to optimize the completeness versus error rate of the cross-matching, where completeness is defined as the fraction of the radio catalogue that is assigned a counterpart. The LR method implementation in the astromatch5 code used in this work provides a facility to automatically optimize the LR cutoff, and we used the code-generated optimal cut in our cross-matching here.
We used a search radius of 4″ for the MGCLS–DECaLS and MGCLS–AllWISE cross-matching, optimised to produce the smallest number of spurious versus real matches. At this search radius, the optimal cutoff in LR was 0.2, shown by the vertical dashed line in the left panel of Figure 1. With LR > 0.2, our cross-matching had a completeness of 59% with an error rate less than 4%. Considering the best matches only, 587 of the radio sources had no identified optical counterpart. We cross-matched these against the AllWISE catalogue. The right panel of Figure 1 shows the completeness and error rate versus all values of LR for the MGCLS–AllWISE cross-matching. The optimal LR cutoff was 0.8 in this case, with ∼29% completeness and an error rate less than 3%. We were left with 415 radio sources with no optical or mid-infrared counterpart.
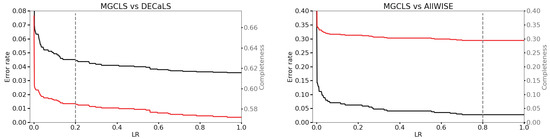
Figure 1.
Cross-matching error rate (black) and completeness (red) versus LR. (Left): MGCLS–DECaLS cross-match results. The vertical dashed line indicates the optimal threshold LR > 0.2. (Right): MGCLS–AllWISE cross-match results where the vertical dashed line indicates the optimal LR cutoff of 0.8.
3.3. Step 3: USS Selection
There was coverage of this field at 843 MHz from the Sydney University Molonglo Sky Survey (SUMSS; [49]); however, the SUMSS data were of significantly lower resolution than the MGCLS data, and source confusion would prohibit accurate spectral index determinations for all but the most isolated sources. There was also coverage from the Very Large Array Sky Survey (VLASS; [50]), which provides ∼2.5″-resolution data at 3 GHz. Cross-matching the list of candidates from the previous step, we obtained spectral indices for only 13 sources. We therefore exploited the wideband nature of the MGCLS data, which covers a ∼700 MHz range in frequency (fractional bandwidth of 0.55), to extract in-band spectral index values for the remaining radio sources with no identified multi-wavelength counterpart.
One of the MGCLS DR1 products was a 12-plane frequency cube for each field. The effective GHz observing frequency of each plane was 0.908, 0.952, 0.997, 1.043, 1.093, 1.145, 1.317, 1.381, 1.448, 1.520, 1.594, and 1.656, respectively. We performed pybdsf source finding, using default settings, in each plane and cross-matched the resultant source catalogues to build up the flux density distribution for each source. We used a weighted Levenberg–Marquardt least-squares fitting procedure to fit a power-law spectrum of the form to each distribution. We only produced a fit if a source was detected in at least two frequency planes—if the source had only two flux density measurements, we further required a minimum frequency separation of 200 MHz in order to proceed with the fit. As flux density measurements are taken from the same dataset, with sub-band images having identical resolution, any spatial variability in the flux density scale should affect all sub-band images. For a given source, we therefore did not expect any bias in the spectral index fitting due to this effect.
We obtained a spectral index fit for 306/415 sources from step 2. Implementing a USS cut of (suitable for low flux density sources; see [31] for details), we had 231/415 potential HzRG candidates. There were 109/415 radio sources that did not have spectral index information as they did not have sufficient flux density information for a fit. We retained these sources as potential candidates.
3.4. Step 4: Manual Cross-Checking with NED and Vizier
As a final step, we manually checked the 340 () candidates against the NASA/IPAC Extragalactic Database (NED; [51]) to look for any redshift information or whether a source exists in other optical/IR catalogues. We used an NED search radius of 4″. Six of the HzRG candidates had available redshift information, five of which had and were therefore discarded from the candidate list. The sixth source, MKTCS J001802.40−313505.5, was confirmed as a high-redshift galaxy at (H-ATLAS J001802.2−3135005; [52]). An additional 60 sources had NED cross-matches from other optical/IR catalogues and were discarded as candidates. Finally, we used Vizier [53] to cross-match against the Million Quasars catalogue (v7.2, [54])—we found no matches within 4″ of our candidates. Our final HzRG candidate list contained a total of 274 sources: 179 USS sources and 95 potential HzRG candidates with no spectral index information.
4. Discussion
An excerpt of the final list of 274 HzRG candidates is given in Table 2. The candidates amount to 8% of the sources in the Abell 2751 MGCLS compact source catalogue, with spectroscopic follow-up or high-quality photometry required to confirm the redshift of the sources.
Table 2.
Excerpt of the final catalogue of 274 HzRG candidates after implementation of an SNR and angular size cut, DECaLS and AllWISE catalogue cross-matching, USS selection, and manual checks with NED. Of the candidates, 25% had no spectral index information and were retained as possible HzRGs (see Section 3.3 for details). The catalogue includes the IAU MGCLS source identifier, the J2000 radio position in decimal degrees, the 1.28 GHz flux density and associated statistical uncertainty, the source size (major and minor axes, and p.a.), and the fitted in-band spectral index (where available). Note that the sizes were after convolution with the CLEAN beam, and the intrinsic sizes will typically be smaller. The full catalogue is available online at https://github.com/kendak333/MGCLS_HzRGs (accessed on 1 October 2021).
The flux density distribution of all the candidates is shown in the left panel of Figure 2. As expected, a large fraction of the fainter sources (Jy) were lacking a spectral index measurement due to the source having insufficient SNR across the band. However, we had complete spectral index coverage above a flux density of 0.3 mJy, which was the faintest source population inspected for HzRG candidates at GHz frequencies to date.
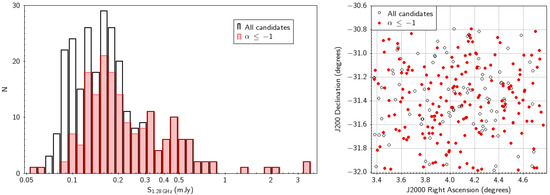
Figure 2.
(Left): Flux density distribution of the 274 HzRG candidates (empty bins). The distribution of the 179 USS sources is shown by the shaded bins. Spectral index measurements for candidates were complete above 0.3 mJy and largely incomplete below ∼120 Jy. (Right): Sky distribution of the HzRG candidates, with the USS sources by filled red circles. Clusters of candidates may indicate positions of potential proto-clusters.
To investigate a potential positional effect (e.g., from the primary beam correction at different frequencies) on the ability to assign a spectral index value for a source, we plotted the sky positions of all 340 candidates in Figure 2. The sources are coloured by whether the source had a spectral index or not, and we saw no positional trend with respect to the undetermined values. This may be a positive indication that the SNR cut adequately takes into account the changes in noise levels across the primary beam-corrected field of view for these data.
5. Summary and Conclusions
We presented the results of a search for high-redshift radio galaxy (HzRG) candidates at 1.28 GHz using one of the 115 cluster fields, namely, Abell 2751 from the MeerKAT Galaxy Cluster Legacy Survey (MGCLS; [43]). We used a multi-stage approach, first implementing a signal-to-noise and <10″ angular size cut on the radio catalogue before cross-matching against catalogues from DECaLS and AllWISE. Taking advantage of the wideband MeerKAT data, we were able to determine in-band spectral index measurements for 74% of the radio sources that had no multi-wavelength counterpart after the cross-matching. Using an ultra-steep spectrum cut of , and performing manual checks for supplementary redshift information in NED, we compiled a final catalogue of 274 HzRG candidates, 95 of which had no available spectral index information and could not be excluded. Our spectral index coverage was complete above a flux density of 300 Jy. This is the lowest flux density at GHz frequencies to be probed for HzRGs to date.
This study shows the great potential in the MGCLS DR1 data, and indeed any long-track MeerKAT L-band data, for finding HzRG candidates. With 20 of the 115 MGCLS fields having good dynamic range and full coverage in both DECaLS and AllWISE, extending this study to these fields may produce more than ∼4000 HzRG candidates for spectroscopic follow-up. Additional frequency radio data will still be needed in order to obtain spectral index measurements for sources in the sub-100 Jy flux density ranges probed by MeerKAT. MeerKAT’s UHF band, with ∼7.5″ resolution at near-uniform weighting, could provide such data with a small request of telescope time.
Author Contributions
K.K. (Kenda Knowles) and S.M. contributed equally to this work with their main responsibilities as follows: K.K. (Kenda Knowles)—conceptualization, interpretation of results, analysis, draft writing, and editing; S.M.—implementing methodology, analysis, and draft writing. Other contributions: draft review—M.F.B., W.D.C., M.H., K.K. (Konstantinos Kolokythas), S.I.L. and N.O.; data resources—W.D.C. and M.H.; methodology (cross-matching)—M.H., S.I.L. and N.O. All authors have read and agreed to the submitted version of the manuscript.
Funding
K.K. (Kenda Knowles) is supported by the New Scientific Frontiers grant of the South African Radio Astronomy Observatory. S.M. acknowledges funding from the South African Radio Astronomy Observatory and the National Research Foundation (NRF Grant Number: 97800). S.I.L. is partially funded by National Research Foundation of South Africa (NRF Grant Number: 120850).
Institutional Review Board Statement
Not applicable.
Informed Consent Statement
Not applicable.
Data Availability Statement
The MGCLS data products used in this work are proprietary until the survey article [43] has been accepted for publication.
Acknowledgments
MGCLS data products were provided by the South African Radio Astronomy Observatory and the MGCLS team and were derived from observations with the MeerKAT radio telescope. The MeerKAT telescope is operated by the South African Radio Astronomy Observatory, which is a facility of the National Research Foundation, an agency of the Department of Science and Innovation. DECam data were obtained through the Legacy Surveys imaging of the DESI footprint, which is supported by the Director, Office of Science, Office of High Energy Physics of the U.S. Department of Energy under Contract No. DE-AC02-05CH1123, by the National Energy Research Scientific Computing Center, a DOE Office of Science User Facility under the same contract, and by the U.S. National Science Foundation, Division of Astronomical Sciences under Contract No. AST-0950945 to NOAO. DECam data were also obtained from the Astro Data Lab at NSF’s National Optical-Infrared Astronomy Research Laboratory. NOIRLab is operated by the Association of Universities for Research in Astronomy (AURA), Inc. under a cooperative agreement with the National Science Foundation. The NASA/IPAC Extragalactic Database is operated by the Jet Propulsion Laboratory, California Institute of Technology, under contract with the National Aeronautics and Space Administration. This research has made use of the VizieR catalogue access tool, CDS, Strasbourg, France (doi:10.26093/cds/vizier). The original description of the VizieR service was published in A&AS 143, 23.
Conflicts of Interest
The authors declare no conflict of interest.
Notes
| 1 | Here, we assumed the flux density convention where is the spectral index. |
| 2 | Many earlier studies use a USS criterium of . |
| 3 | The noise increases from the centre of the image outwards due to primary beam-correction. |
| 4 | pybdsf calculates uncertainties as per Condon [45]. |
| 5 | https://github.com/ruizca/astromatch (accessed on 1 October 2021). |
References
- Eales, S.A.; Rawlings, S. A Panoramic View of Radio Galaxy Evolution from a Redshift of 0 to a Redshift of 4.3. Astrophys. J. 1996, 460, 68. [Google Scholar] [CrossRef]
- De Breuck, C.; Downes, D.; Neri, R.; van Breugel, W.; Reuland, M.; Omont, A.; Ivison, R. Detection of two massive CO systems in 4C 41.17 at z = 3.8. Astron. Astrophys. 2005, 430, L1–L4. [Google Scholar] [CrossRef][Green Version]
- Best, P.N.; Longair, M.S.; Roettgering, H.J.A. HST, radio and infrared observations of 28 3CR radio galaxies at redshift z∼1—II. Old stellar populations in central cluster galaxies. Mon. Not. R. Astron. Soc. 1998, 295, 549–567. [Google Scholar] [CrossRef]
- Archibald, E.N.; Dunlop, J.S.; Hughes, D.H.; Rawlings, S.; Eales, S.A.; Ivison, R.J. A submillimetre survey of the star formation history of radio galaxies. Mon. Not. R. Astron. Soc. 2001, 323, 417–444. [Google Scholar] [CrossRef]
- Miley, G.; De Breuck, C. Distant radio galaxies and their environments. Astron. Astrophys. Rev. 2008, 15, 67–144. [Google Scholar] [CrossRef]
- Ishwara-Chandra, C.H.; Sirothia, S.K.; Wadadekar, Y.; Pal, S.; Windhorst, R. Deep GMRT 150-MHz observations of the LBDS-Lynx region: Ultrasteep spectrum radio sources. Mon. Not. R. Astron. Soc. 2010, 405, 436–446. [Google Scholar] [CrossRef]
- Spinrad, H. Redshifts and spectroscopy of very distant radio galaxies with strong emission lines. Publ. Astron. Soc. Pac. 1982, 94, 397–403. [Google Scholar] [CrossRef]
- Saxena, A.; Marinello, M.; Overzier, R.A.; Best, P.N.; Röttgering, H.J.A.; Duncan, K.J.; Prandoni, I.; Pentericci, L.; Magliocchetti, M.; Paris, D.; et al. Discovery of a radio galaxy at z = 5.72. Mon. Not. R. Astron. Soc. 2018, 480, 2733–2742. [Google Scholar] [CrossRef]
- Ker, L.M.; Best, P.N.; Rigby, E.E.; Röttgering, H.J.A.; Gendre, M.A. New insights on the z–α correlation from complete radio samples. Mon. Not. R. Astron. Soc. 2012, 420, 2644–2661. [Google Scholar] [CrossRef]
- Lilly, S.J.; Longair, M.S. Stellar populations in distant radio galaxies. Mon. Not. R. Astron. Soc. 1984, 211, 833–855. [Google Scholar] [CrossRef]
- Jarvis, M.J.; Rawlings, S.; Eales, S.; Blundell, K.M.; Bunker, A.J.; Croft, S.; McLure, R.J.; Willott, C.J. A sample of 6C radio sources designed to find objects at redshift z>4—III. Imaging and the radio galaxy K-z relation. Mon. Not. R. Astron. Soc. 2001, 326, 1585–1600. [Google Scholar] [CrossRef]
- Schmidt, S.J.; Connolly, A.J.; Hopkins, A.M. The DRaGONS Survey: A Search for High-Redshift Radio Galaxies and Heavily Obscured Active Galactic Nuclei. Astrophys. J. 2006, 649, 63–78. [Google Scholar] [CrossRef]
- Norris, R.P.; Afonso, J.; Appleton, P.N.; Boyle, B.J.; Ciliegi, P.; Croom, S.M.; Huynh, M.T.; Jackson, C.A.; Koekemoer, A.M.; Lonsdale, C.J.; et al. Deep ATLAS Radio Observations of the Chandra Deep Field-South/Spitzer Wide-Area Infrared Extragalactic Field. Astron. J. 2006, 132, 2409–2423. [Google Scholar] [CrossRef]
- Middelberg, E.; Norris, R.P.; Hales, C.A.; Seymour, N.; Johnston-Hollitt, M.; Huynh, M.T.; Lenc, E.; Mao, M.Y. The radio properties of infrared-faint radio sources. Astron. Astrophys. 2011, 526, A8. [Google Scholar] [CrossRef][Green Version]
- Collier, J.D.; Banfield, J.K.; Norris, R.P.; Schnitzeler, D.H.F.M.; Kimball, A.E.; Filipović, M.D.; Jarrett, T.H.; Lonsdale, C.J.; Tothill, N.F.H. Infrared-faint radio sources: A new population of high-redshift radio galaxies. Mon. Not. R. Astron. Soc. 2014, 439, 545–565. [Google Scholar] [CrossRef][Green Version]
- Herzog, A.; Middelberg, E.; Norris, R.P.; Sharp, R.; Spitler, L.R.; Parker, Q.A. Infrared-faint radio sources are at high redshifts. Spectroscopic redshift determination of infrared-faint radio sources using the Very Large Telescope. Astron. Astrophys. 2014, 567, A104. [Google Scholar] [CrossRef][Green Version]
- Falcke, H.; Körding, E.; Nagar, N.M. Compact radio cores: From the first black holes to the last. New Astron. Rev. 2004, 48, 1157–1171. [Google Scholar] [CrossRef]
- Coppejans, R.; Cseh, D.; Williams, W.L.; van Velzen, S.; Falcke, H. Megahertz peaked-spectrum sources in the Boötes field I—A route towards finding high-redshift AGN. Mon. Not. R. Astron. Soc. 2015, 450, 1477–1485. [Google Scholar] [CrossRef]
- Roettgering, H.J.A.; Lacy, M.; Miley, G.K.; Chambers, K.C.; Saunders, R. Samples of ultra-steep spectrum radio sources. Astron. Astrophys. Suppl. Ser. 1994, 108, 79–141. [Google Scholar]
- Krolik, J.H.; Chen, W. Steep Radio Spectra in High-Redshift Radio Galaxies. Astron. J. 1991, 102, 1659. [Google Scholar] [CrossRef]
- Klamer, I.J.; Ekers, R.D.; Bryant, J.J.; Hunstead, R.W.; Sadler, E.M.; De Breuck, C. A search for distant radio galaxies from SUMSS and NVSS—III. Radio spectral energy distributions and the z-α correlation. Mon. Not. R. Astron. Soc. 2006, 371, 852–866. [Google Scholar] [CrossRef][Green Version]
- Bornancini, C.G.; O’Mill, A.L.; Gurovich, S.; Lambas, D.G. Radio galaxies in the Sloan Digital Sky Survey: Spectral index-environment correlations. Mon. Not. R. Astron. Soc. 2010, 406, 197–207. [Google Scholar] [CrossRef]
- Morabito, L.K.; Harwood, J.J. Investigating the cause of the α-z relation. Mon. Not. R. Astron. Soc. 2018, 480, 2726–2732. [Google Scholar] [CrossRef]
- Pedani, M. On the efficiency of the Ultra Steep Spectrum technique in finding high- z radiogalaxies. New Astron. 2003, 8, 805–815. [Google Scholar] [CrossRef]
- Jarvis, M.J.; Teimourian, H.; Simpson, C.; Smith, D.J.B.; Rawlings, S.; Bonfield, D. The discovery of a typical radio galaxy at z = 4.88. Mon. Not. R. Astron. Soc. 2009, 398, L83–L87. [Google Scholar] [CrossRef]
- De Breuck, C.; van Breugel, W.; Röttgering, H.J.A.; Miley, G. A sample of 669 ultra steep spectrum radio sources to find high redshift radio galaxies. Astron. Astrophys. Suppl. Ser. 2000, 143, 303–333. [Google Scholar] [CrossRef]
- Cruz, M.J.; Jarvis, M.J.; Blundell, K.M.; Rawlings, S.; Croft, S.; Klöckner, H.R.; McLure, R.J.; Simpson, C.; Targett, T.A.; Willott, C.J. The 6C** sample of steep-spectrum radio sources—I. Radio data, near-infrared imaging and optical spectroscopy. Mon. Not. R. Astron. Soc. 2006, 373, 1531–1562. [Google Scholar] [CrossRef]
- Broderick, J.W.; Bryant, J.J.; Hunstead, R.W.; Sadler, E.M.; Murphy, T. A new search for distant radio galaxies in the Southern hemisphere—I. Sample definition and radio properties. Mon. Not. R. Astron. Soc. 2007, 381, 341–366. [Google Scholar] [CrossRef]
- Afonso, J.; Bizzocchi, L.; Ibar, E.; Grossi, M.; Simpson, C.; Chapman, S.; Jarvis, M.J.; Rottgering, H.; Norris, R.P.; Dunlop, J.; et al. Ultra Steep Spectrum Radio Sources in the Lockman Hole: SERVS Identifications and Redshift Distribution at the Faintest Radio Fluxes. Astrophys. J. 2011, 743, 122. [Google Scholar] [CrossRef]
- Ishwara-Chandra, C.H.; Sirothia, S.K.; Wadadekar, Y.; Pal, S. High-Redshift Radio Galaxies from Deep Fields. J. Astrophys. Astron. 2011, 32, 609–612. [Google Scholar] [CrossRef]
- Singh, V.; Beelen, A.; Wadadekar, Y.; Sirothia, S.; Ishwara-Chandra, C.H.; Basu, A.; Omont, A.; McAlpine, K.; Ivison, R.J.; Oliver, S.; et al. Multiwavelength characterization of faint ultra steep spectrum radio sources: A search for high-redshift radio galaxies. Astron. Astrophys. 2014, 569, A52. [Google Scholar] [CrossRef]
- van Weeren, R.J.; Williams, W.L.; Tasse, C.; Röttgering, H.J.A.; Rafferty, D.A.; van der Tol, S.; Heald, G.; White, G.J.; Shulevski, A.; Best, P.; et al. LOFAR Low-band Antenna Observations of the 3C 295 and Boötes Fields: Source Counts and Ultra-steep Spectrum Sources. Astrophys. J. 2014, 793, 82. [Google Scholar] [CrossRef]
- Saxena, A.; Jagannathan, P.; Röttgering, H.J.A.; Best, P.N.; Intema, H.T.; Zhang, M.; Duncan, K.J.; Carilli, C.L.; Miley, G.K. A search for faint high-redshift radio galaxy candidates at 150 MHz. Mon. Not. R. Astron. Soc. 2018, 475, 5041–5058. [Google Scholar] [CrossRef]
- Reuland, M.; Röttgering, H.; van Breugel, W. SCUBA observations of high redshift radio galaxies. New Astron. Rev. 2003, 47, 303–307. [Google Scholar] [CrossRef][Green Version]
- Bornancini, C.G.; De Breuck, C.; de Vries, W.; Croft, S.; van Breugel, W.; Röttgering, H.; Minniti, D. Imaging and spectroscopy of ultrasteep spectrum radio sources. Mon. Not. R. Astron. Soc. 2007, 378, 551–562. [Google Scholar] [CrossRef]
- Bryant, J.J.; Johnston, H.M.; Broderick, J.W.; Hunstead, R.W.; De Breuck, C.; Gaensler, B.M. A new search for distant radio galaxies in the Southern hemisphere - III. Optical spectroscopy and analysis of the MRCR-SUMSS sample†. Mon. Not. R. Astron. Soc. 2009, 395, 1099–1120. [Google Scholar] [CrossRef]
- De Breuck, C.; Seymour, N.; Stern, D.; Willner, S.P.; Eisenhardt, P.R.M.; Fazio, G.G.; Galametz, A.; Lacy, M.; Rettura, A.; Rocca-Volmerange, B.; et al. The Spitzer High-redshift Radio Galaxy Survey. Astrophys. J. 2010, 725, 36–62. [Google Scholar] [CrossRef]
- George, S.J.; Stevens, I.R. Optical observations of Ultra Steep Spectrum radio sources. Bull. Astron. Soc. India 2011, 39, 539–545. [Google Scholar]
- Saxena, A.; Röttgering, H.J.A.; Duncan, K.J.; Hill, G.J.; Best, P.N.; Indahl, B.L.; Marinello, M.; Overzier, R.A.; Pentericci, L.; Prandoni, I.; et al. The nature of faint radio galaxies at high redshifts. Mon. Not. R. Astron. Soc. 2019, 489, 5053–5075. [Google Scholar] [CrossRef]
- De Breuck, C.; Tang, Y.; de Bruyn, A.G.; Röttgering, H.; van Breugel, W. A sample of ultra steep spectrum sources selected from the Westerbork In the Southern Hemisphere (WISH) survey. Astron. Astrophys. 2002, 394, 59–69. [Google Scholar] [CrossRef][Green Version]
- Dey, A.; Schlegel, D.J.; Lang, D.; Blum, R.; Burleigh, K.; Fan, X.; Findlay, J.R.; Finkbeiner, D.; Herrera, D.; Juneau, S.; et al. Overview of the DESI Legacy Imaging Surveys. Astron. J. 2019, 157, 168. [Google Scholar] [CrossRef]
- Cutri, R.M.; Wright, E.L.; Conrow, T.; Fowler, J.W.; Eisenhardt, P.R.M.; Grillmair, C.; Kirkpatrick, J.D.; Masci, F.; McCallon, H.L.; Wheelock, S.L.; et al. VizieR Online Data Catalog: AllWISE Data Release (Cutri+ 2013). 2013. Available online: https://ui.adsabs.harvard.edu/abs/2014yCat.2328....0C/abstract (accessed on 1 October 2021).
- Knowles, K.; Cotton, W.D.; Rudnick, L.; Camilo, F.; Goedhart, S.; Deane, R.; Ramatsoku, M.; Bietenholz, M.F.; Brüggen, M.; Button, C.; et al. The MeerKAT Galaxy Cluster Legacy Survey: I—Overview and Highlights. arXiv 2021. arXiv:2110.14986. Available online: https://arxiv.org/pdf/2111.05673.pdf (accessed on 1 October 2021).
- Mohan, N.; Rafferty, D. PyBDSF: Python Blob Detection and Source Finder. 2015. Available online: http://xxx.lanl.gov/abs/1502.007. (accessed on 1 October 2021).
- Condon, J.J. Errors in Elliptical Gaussian Fits. Publ. Astron. Soc. Pac. 1997, 109, 166–172. [Google Scholar] [CrossRef]
- Sutherland, W.; Saunders, W. On the likelihood ratio for source identification. Mon. Not. R. Astron. Soc. 1992, 259, 413–420. [Google Scholar] [CrossRef]
- Ciliegi, P.; Zamorani, G.; Hasinger, G.; Lehmann, I.; Szokoly, G.; Wilson, G. A deep VLA survey at 6 cm in the Lockman Hole. Astron. Astrophys. 2003, 398, 901–918. [Google Scholar] [CrossRef]
- Georgakakis, A.; Coil, A.L.; Laird, E.S.; Griffith, R.L.; Nandra, K.; Lotz, J.M.; Pierce, C.M.; Cooper, M.C.; Newman, J.A.; Koekemoer, A.M. Host galaxy morphologies of X-ray selected AGN: Assessing the significance of different black hole fuelling mechanisms to the accretion density of the Universe at z∼1. Mon. Not. R. Astron. Soc. 2009, 397, 623–633. [Google Scholar] [CrossRef]
- Mauch, T.; Murphy, T.; Buttery, H.J.; Curran, J.; Hunstead, R.W.; Piestrzynski, B.; Robertson, J.G.; Sadler, E.M. SUMSS: A wide-field radio imaging survey of the southern sky—II. The source catalogue. Mon. Not. R. Astron. Soc. 2003, 342, 1117–1130. [Google Scholar] [CrossRef]
- Lacy, M.; Baum, S.A.; Chandler, C.J.; Chatterjee, S.; Clarke, T.E.; Deustua, S.; English, J.; Farnes, J.; Gaensler, B.M.; Gugliucci, N.; et al. The Karl G. Jansky Very Large Array Sky Survey (VLASS). Science Case and Survey Design. Publ. Astron. Soc. Pac. 2020, 132, 035001. [Google Scholar] [CrossRef]
- Helou, G.; Madore, B.F.; Schmitz, M.; Bicay, M.D.; Wu, X.; Bennett, J. The NASA/IPAC extragalactic database. In Databases and On-Line Data in Astronomy; Albrecht, M.A., Egret, D., Eds.; Astrophysics and Space Science Library; Springer: Berlin, Germany, 1991; Volume 171, pp. 89–106. [Google Scholar] [CrossRef]
- Bakx, T.J.L.C.; Eales, S.A.; Negrello, M.; Smith, M.W.L.; Valiante, E.; Holland, W.S.; Baes, M.; Bourne, N.; Clements, D.L.; Dannerbauer, H.; et al. The Herschel Bright Sources (HerBS): Sample definition and SCUBA-2 observations. Mon. Not. R. Astron. Soc. 2018, 473, 1751–1773. [Google Scholar] [CrossRef]
- Ochsenbein, F.; Bauer, P.; Marcout, J. The VizieR database of astronomical catalogues. Astron. Astrophys. Suppl. Ser. 2000, 143, 23–32. [Google Scholar] [CrossRef]
- Flesch, E.W. VizieR Online Data Catalog: The Million Quasars (Milliquas) catalogue, version 7.2 (Flesch, 2021). VizieR Online Data Cat 2021, VII/290. Available online: https://ui.adsabs.harvard.edu/abs/2021yCat.7290....0F/abstract (accessed on 1 October 2021).


Publisher’s Note: MDPI stays neutral with regard to jurisdictional claims in published maps and institutional affiliations. |
© 2021 by the authors. Licensee MDPI, Basel, Switzerland. This article is an open access article distributed under the terms and conditions of the Creative Commons Attribution (CC BY) license (https://creativecommons.org/licenses/by/4.0/).