
Combining LOFAR and Apertif Data for Understanding the Life Cycle of Radio Galaxies

 , , , , , , , , and
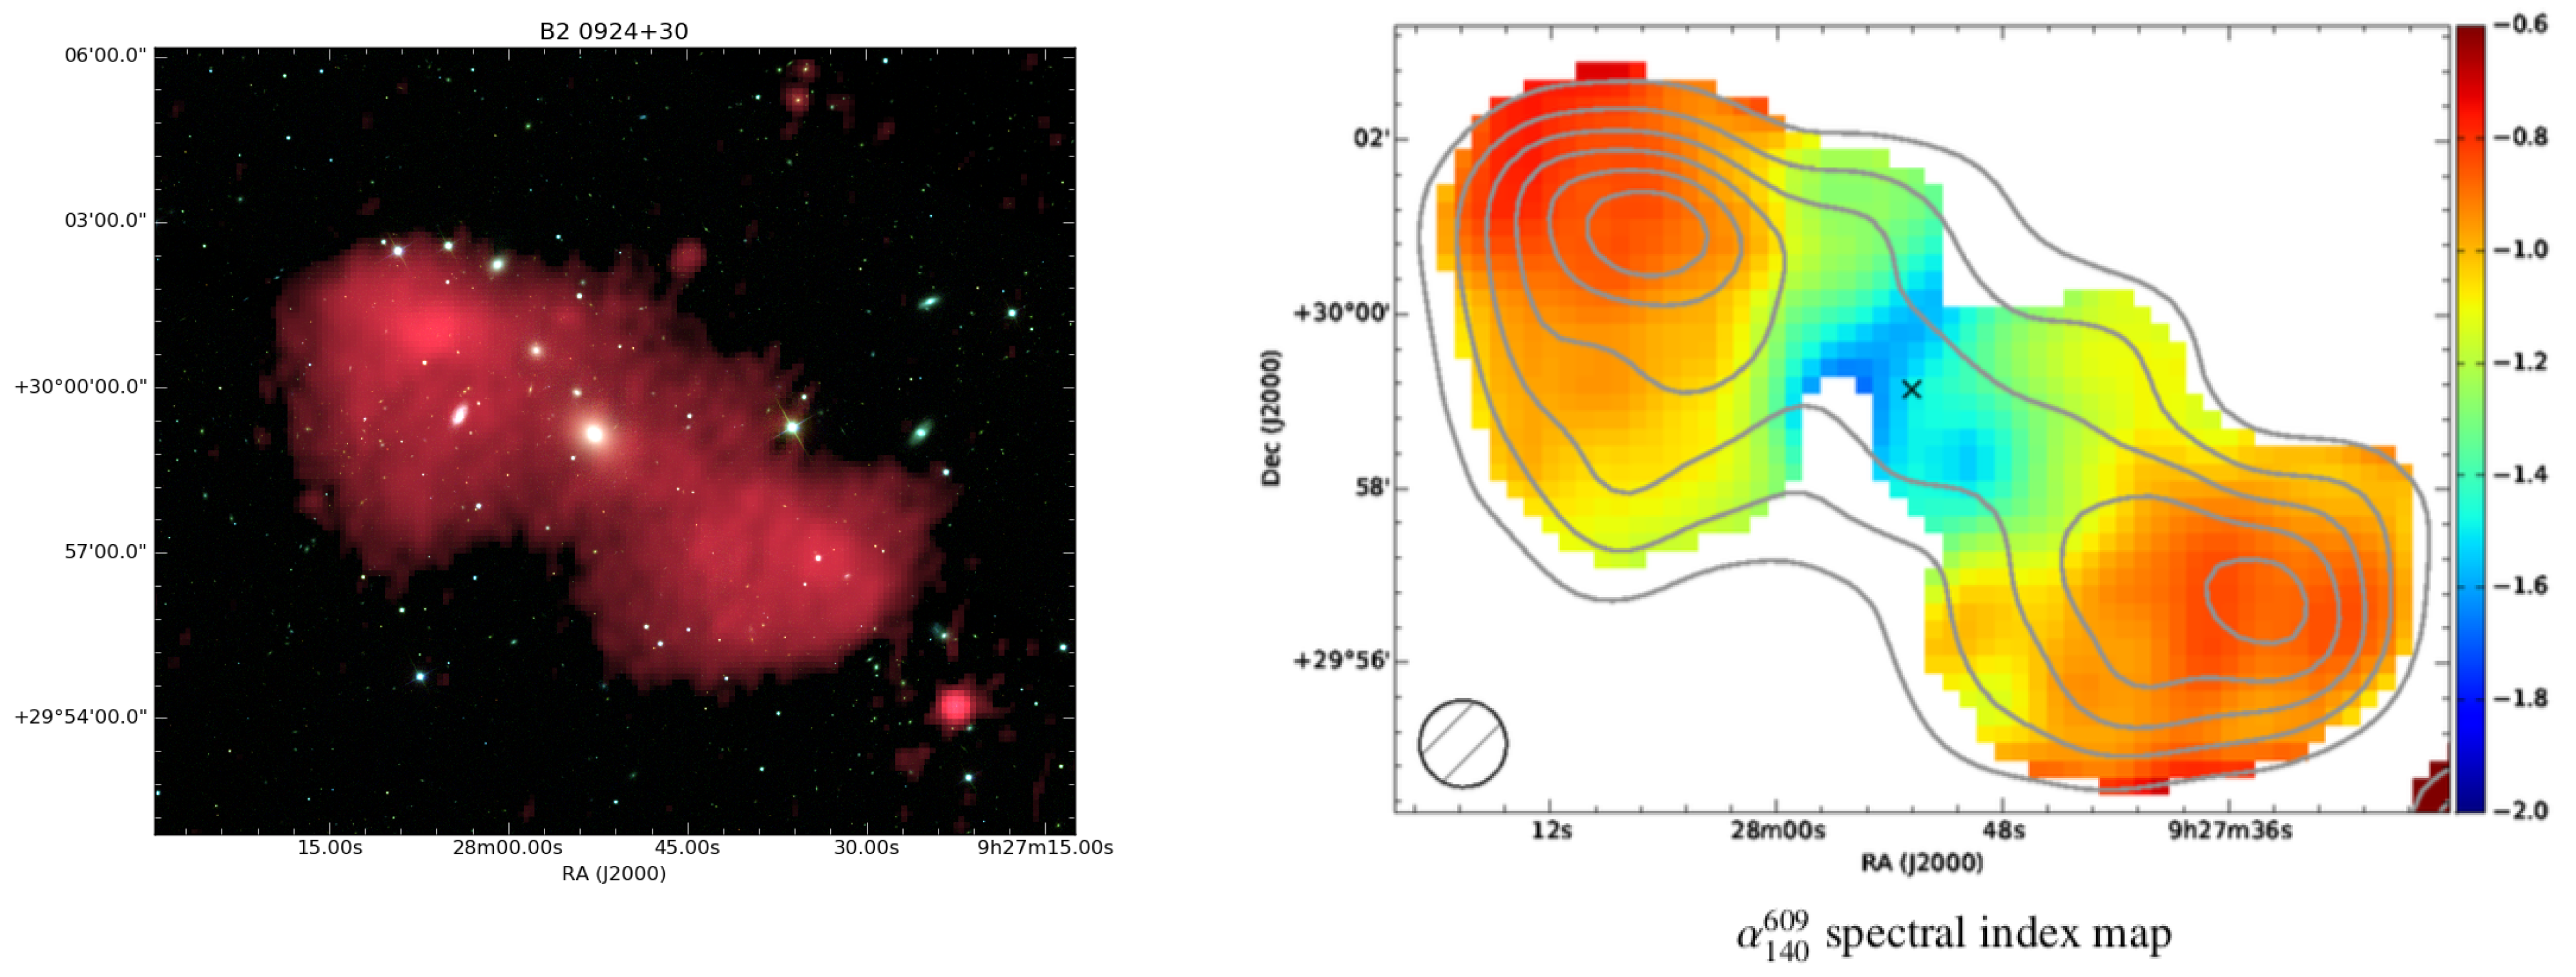
Abstract
1. Introduction
2. LOFAR and Apertif: The New Possibilities they Offer
2.1. LOFAR Surveys and Deep Fields
2.2. The Apertif Surveys at 1400 MHz
3. Lessons Learned from Single Object, Low-Frequency Studies
4. Building Large Samples of Remnant and Restarted Radio Galaxies
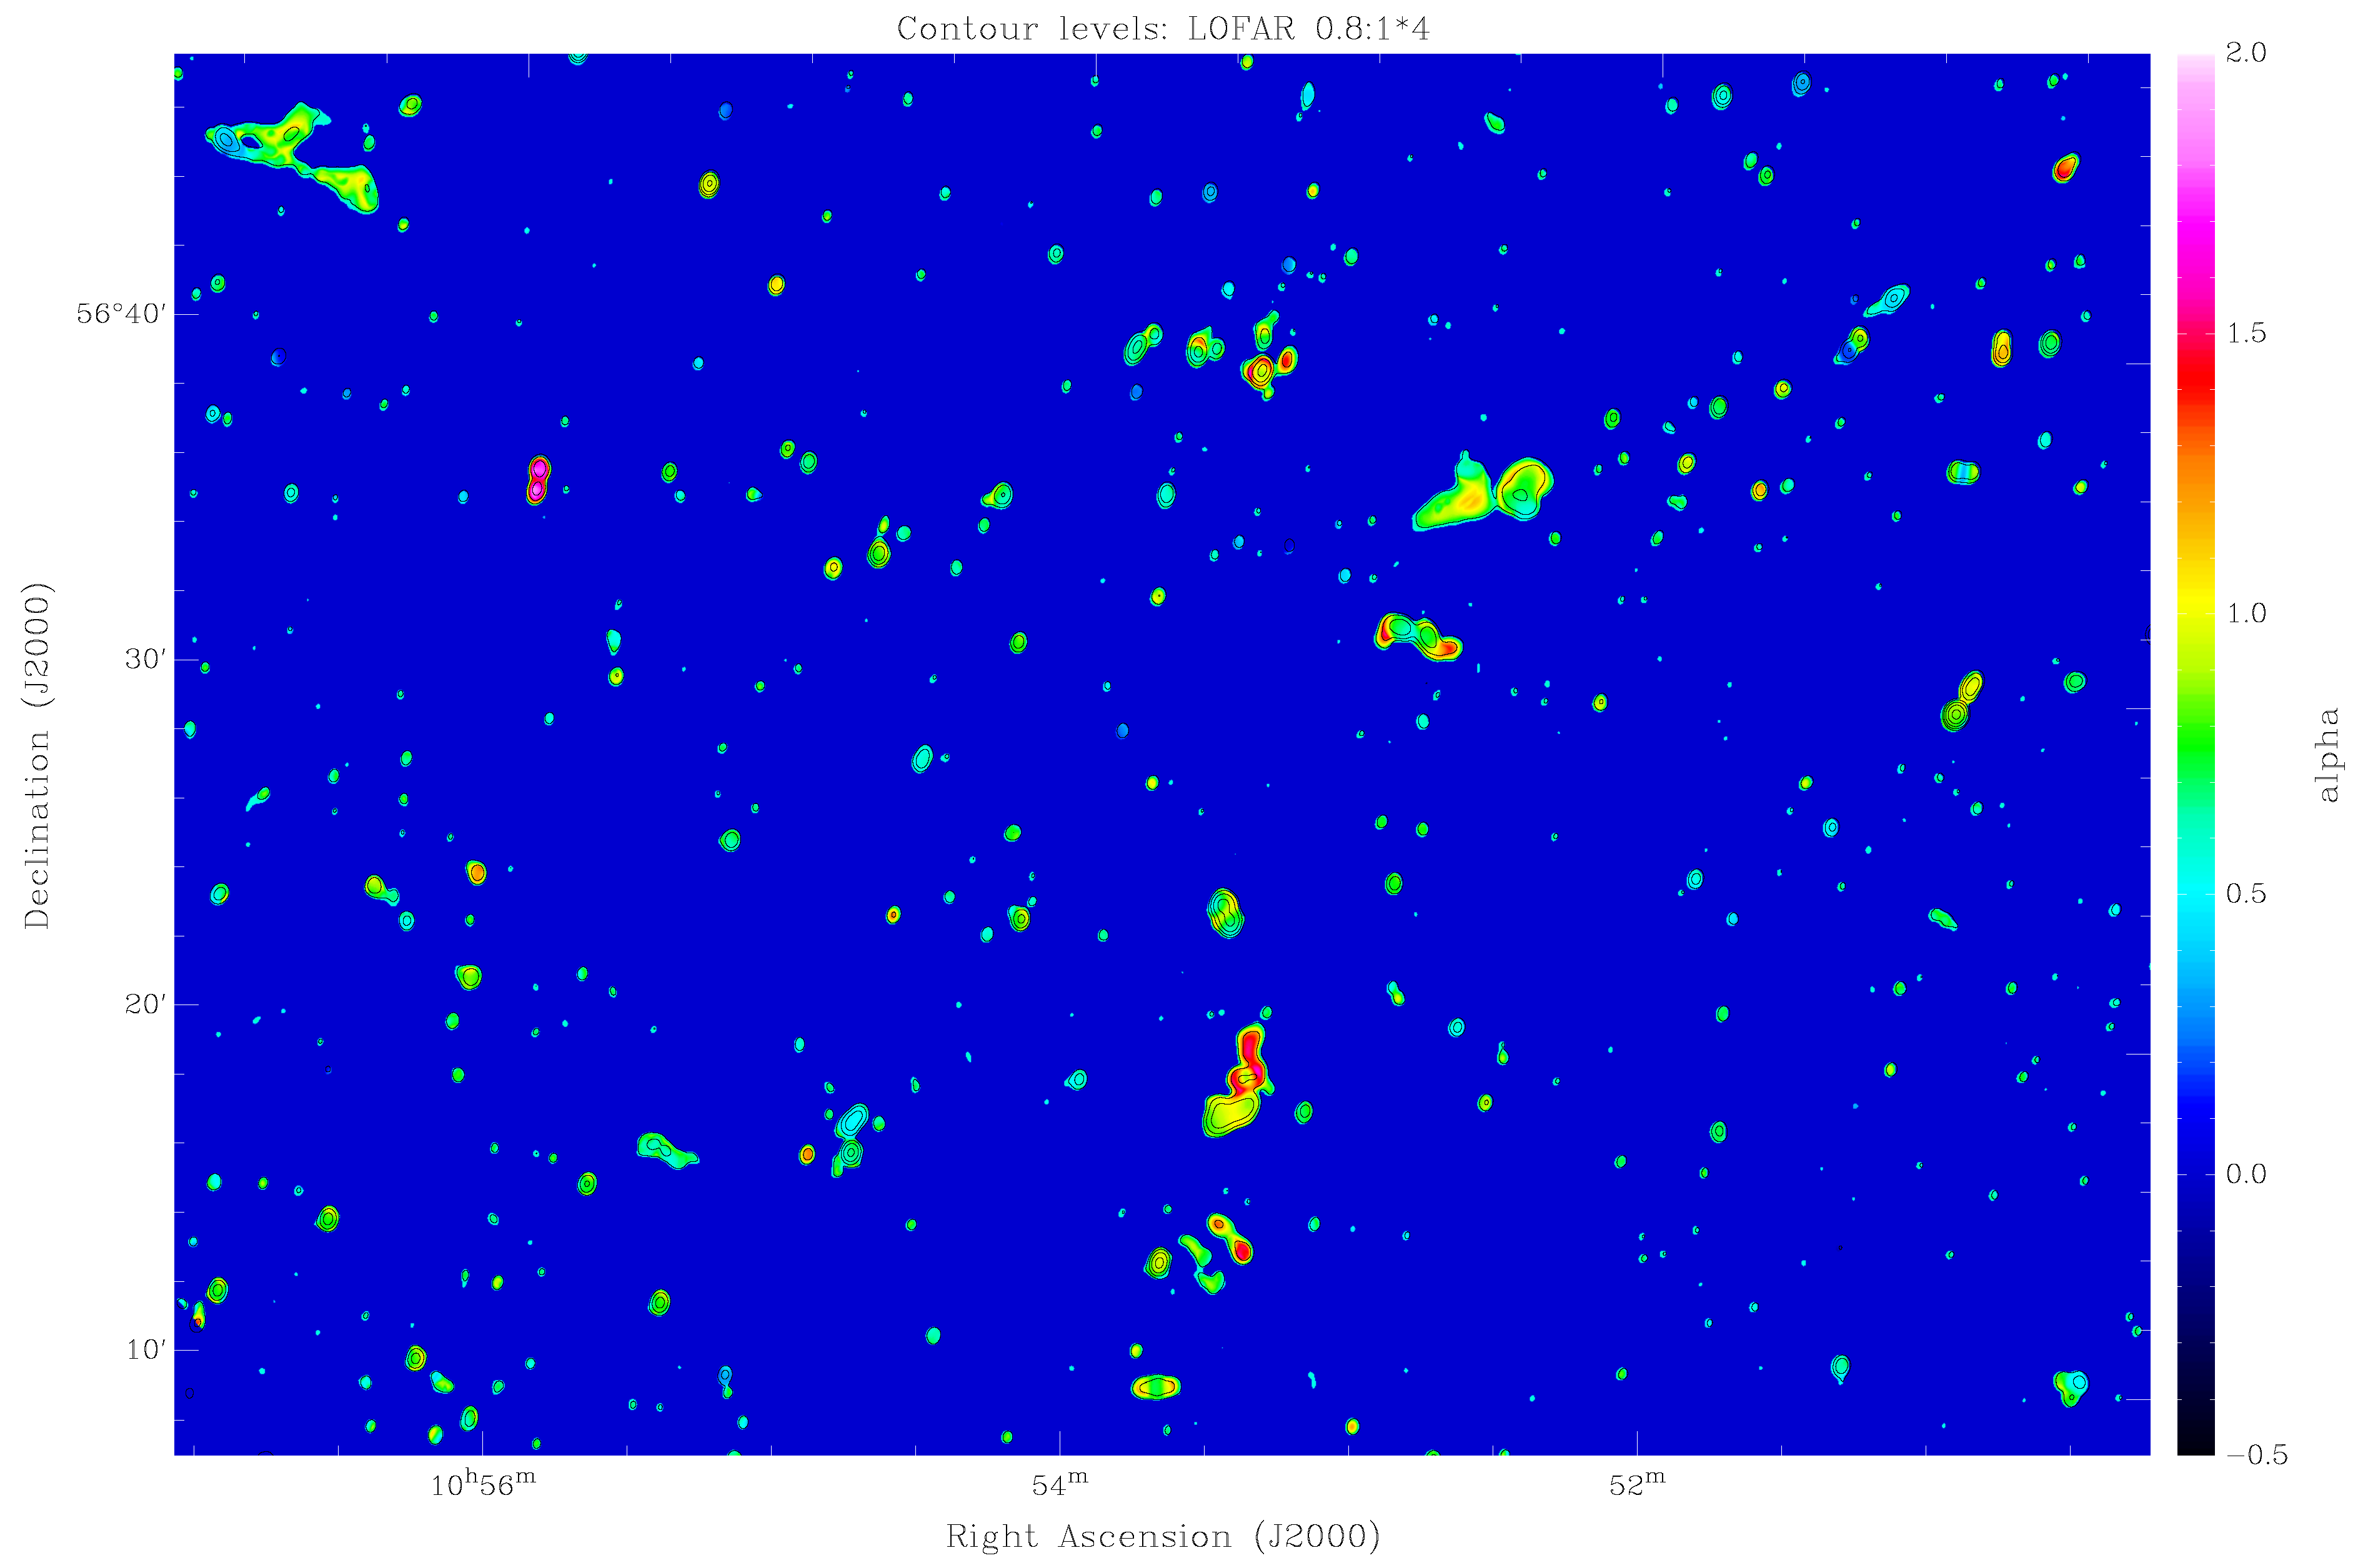
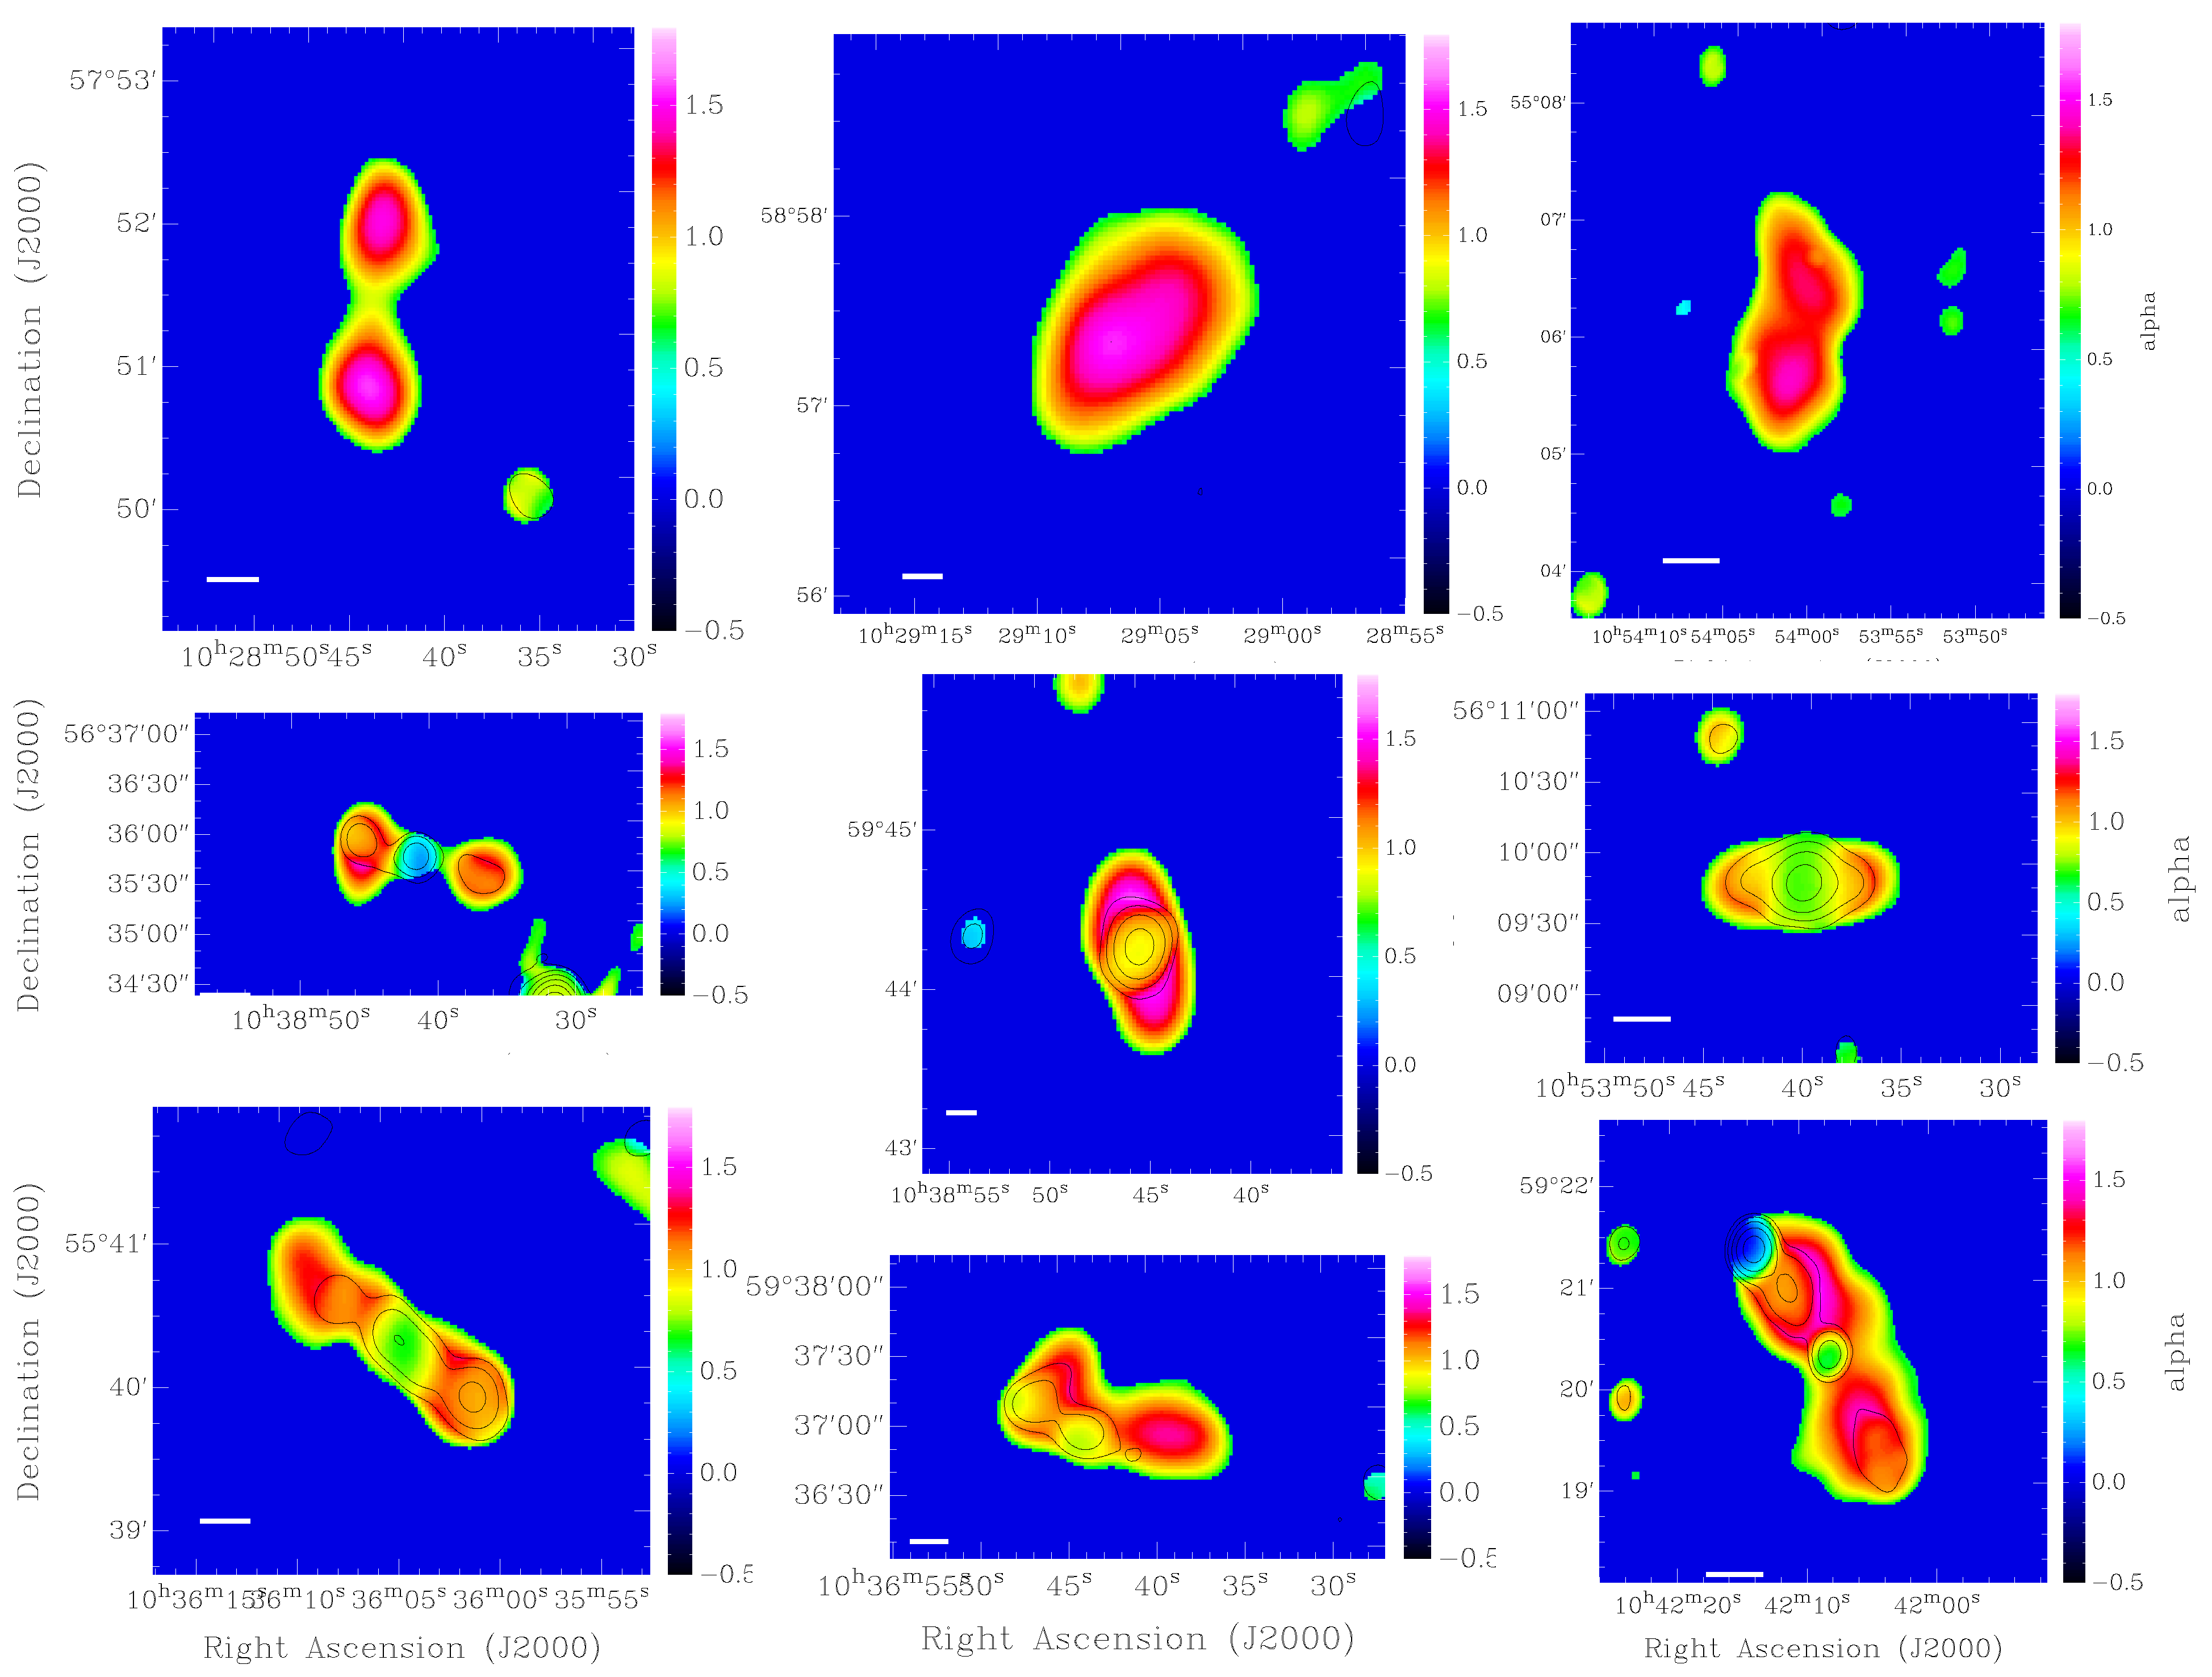
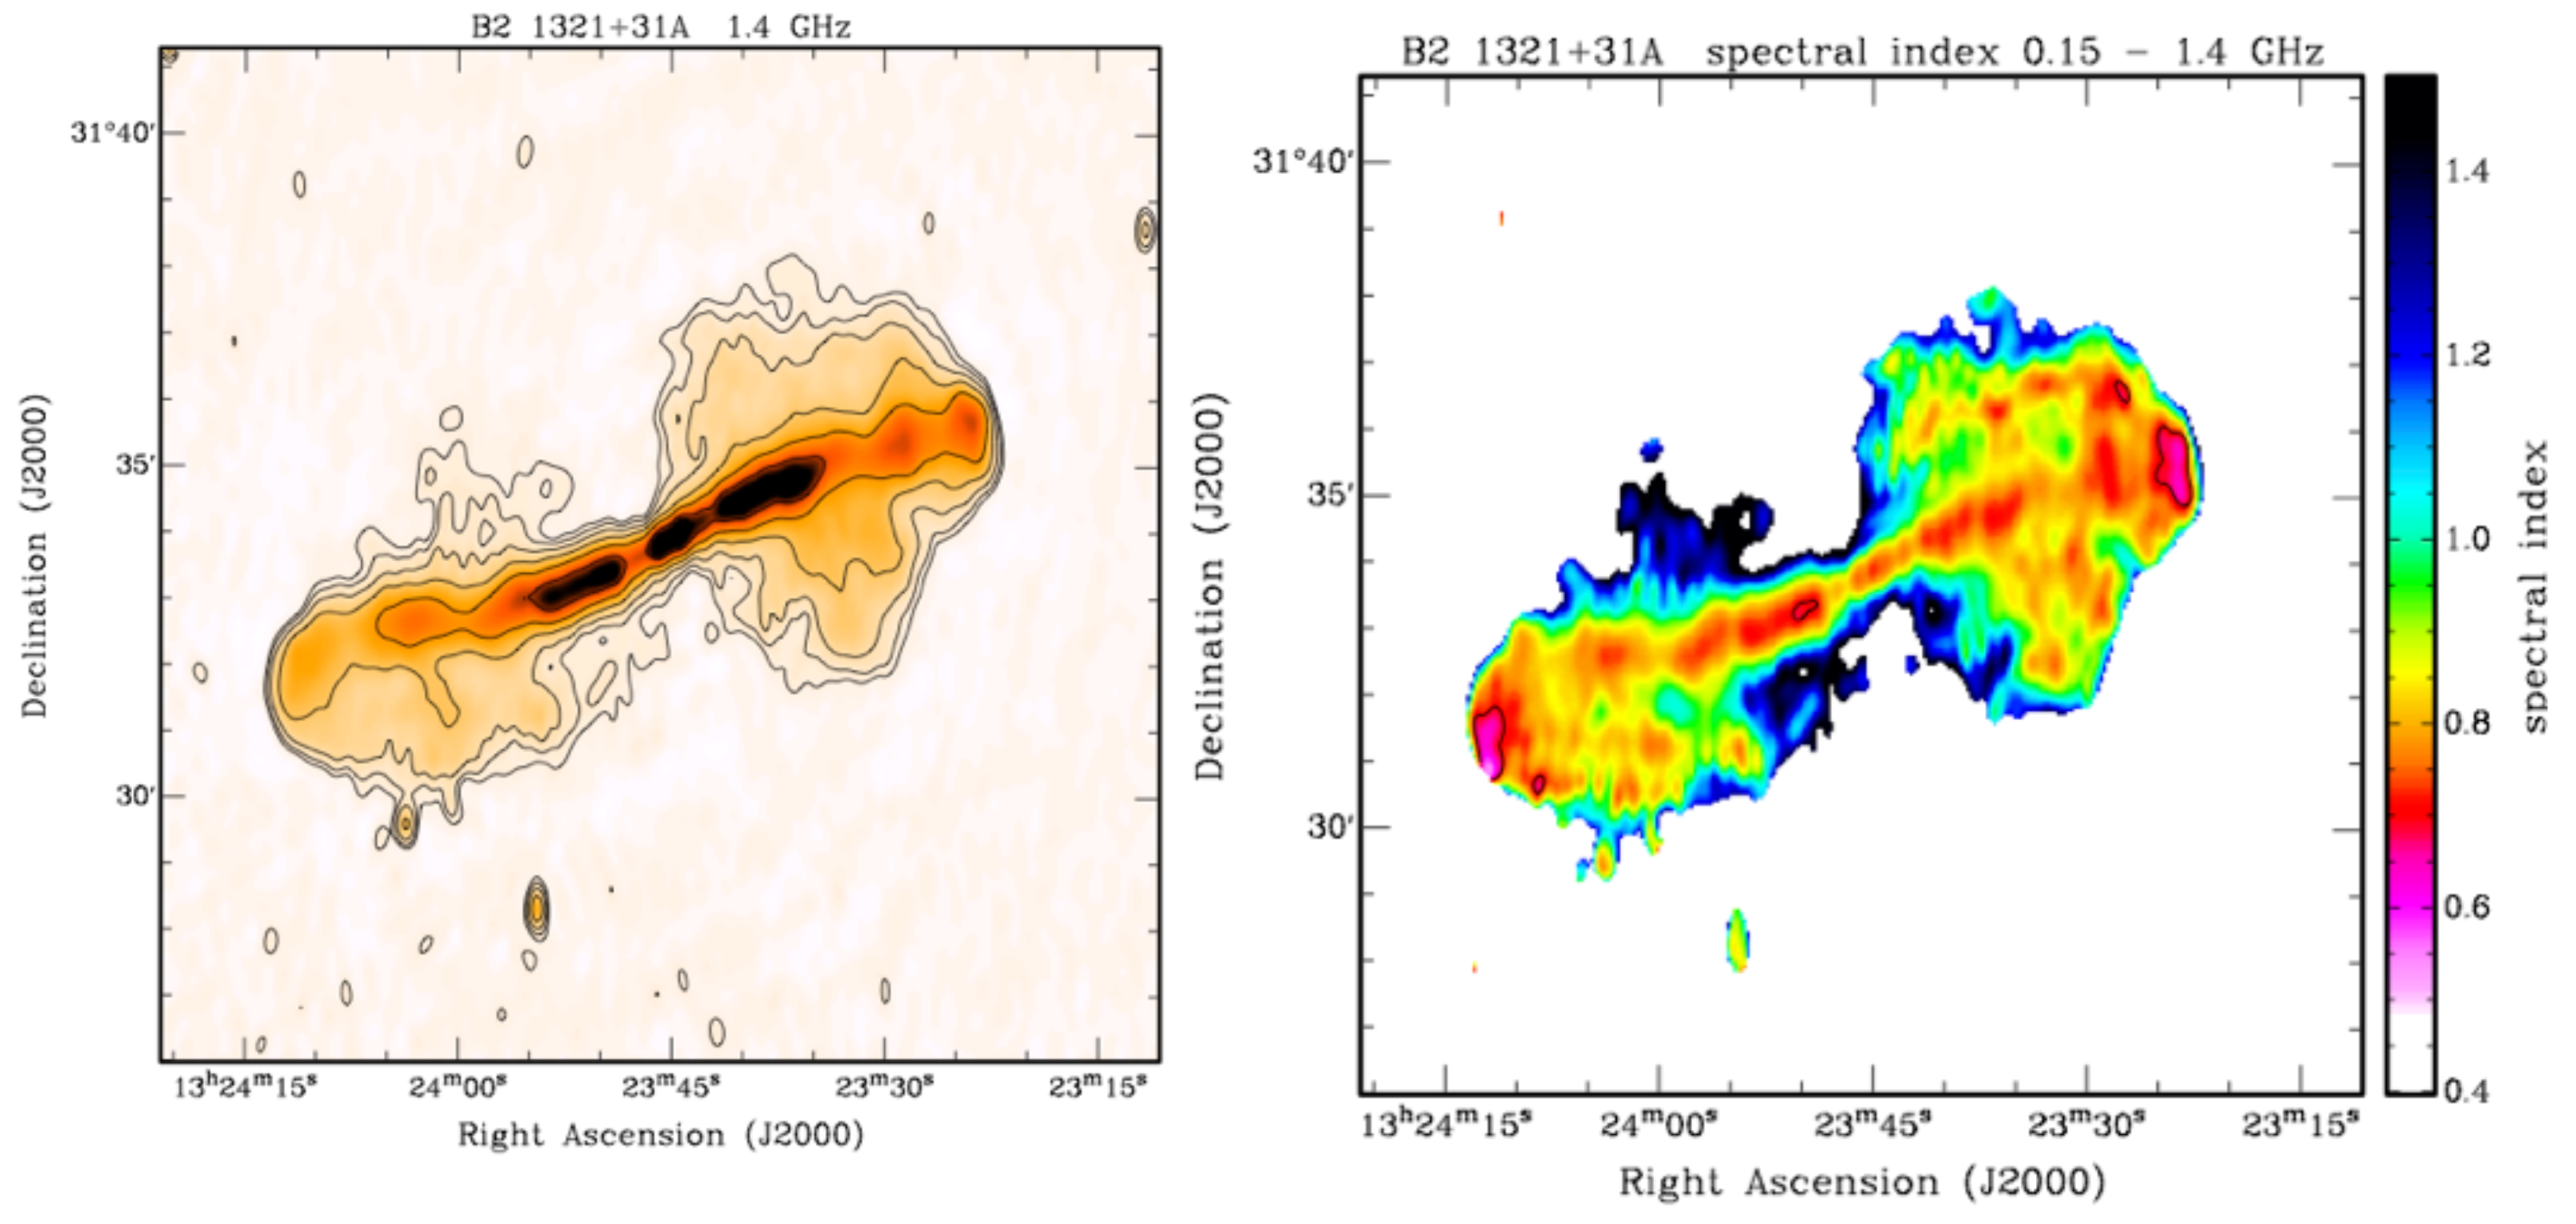
5. Exploring the Spatially-Resolved Spectral Indices Distribution of Radio Galaxies in the Lockman Hole Region
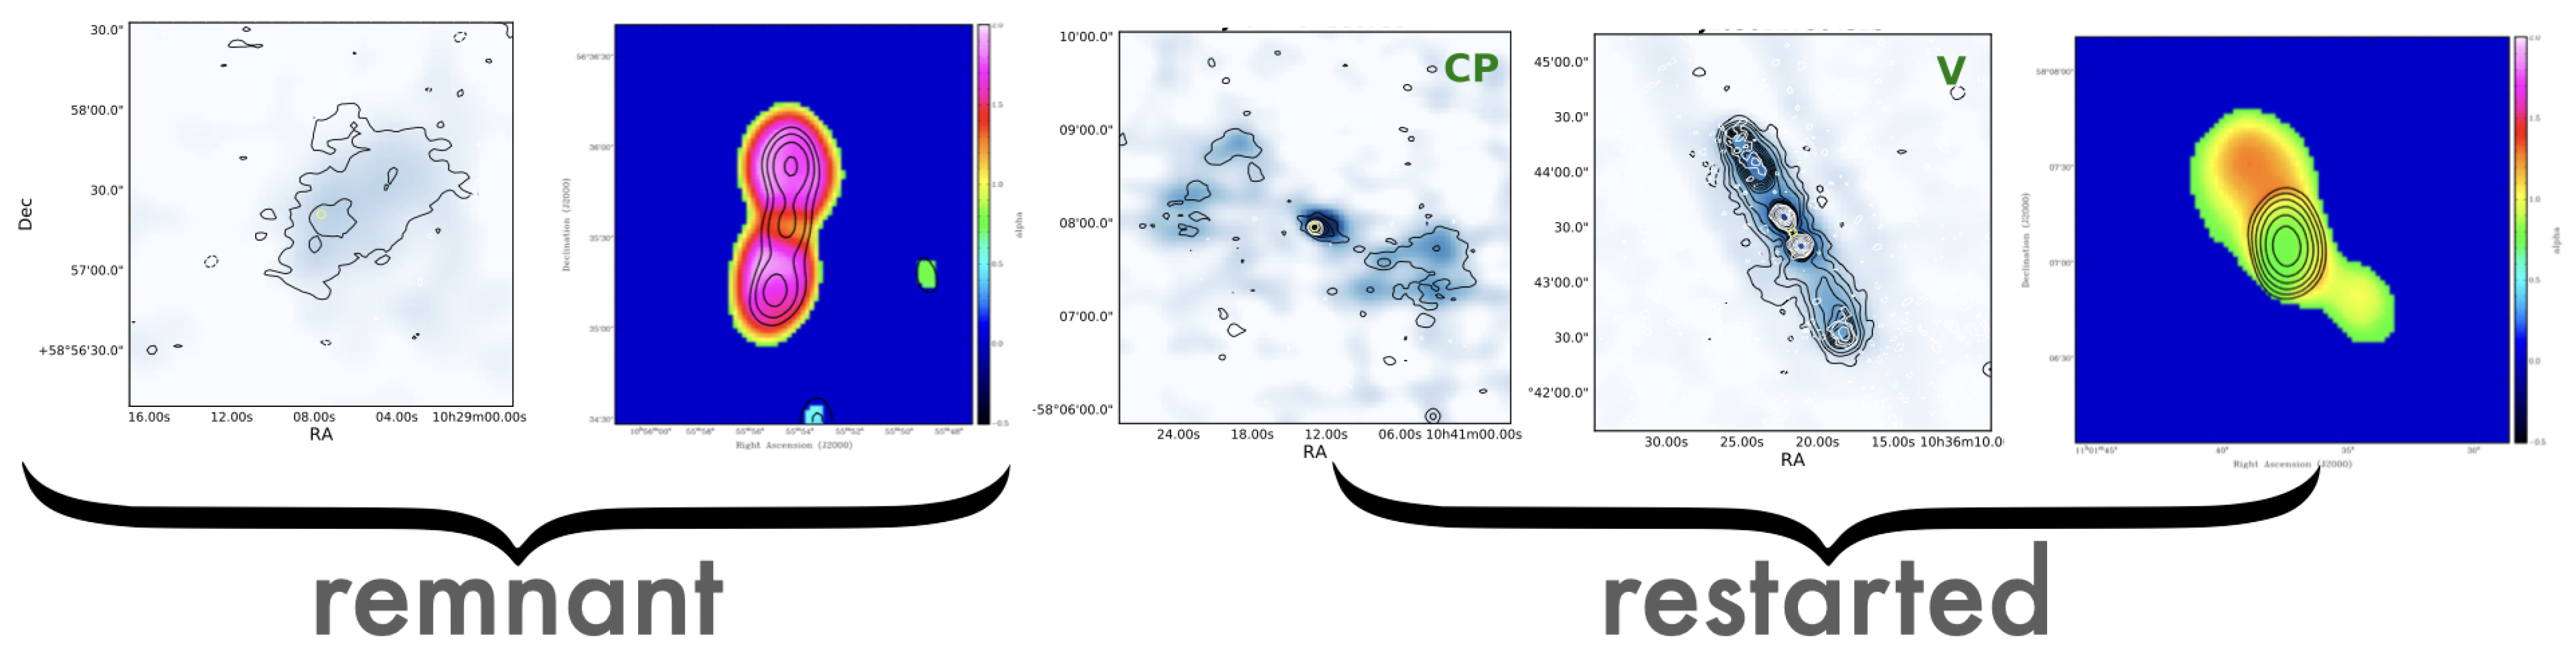
6. General Findings on Remnant and Restarted Radio Galaxies
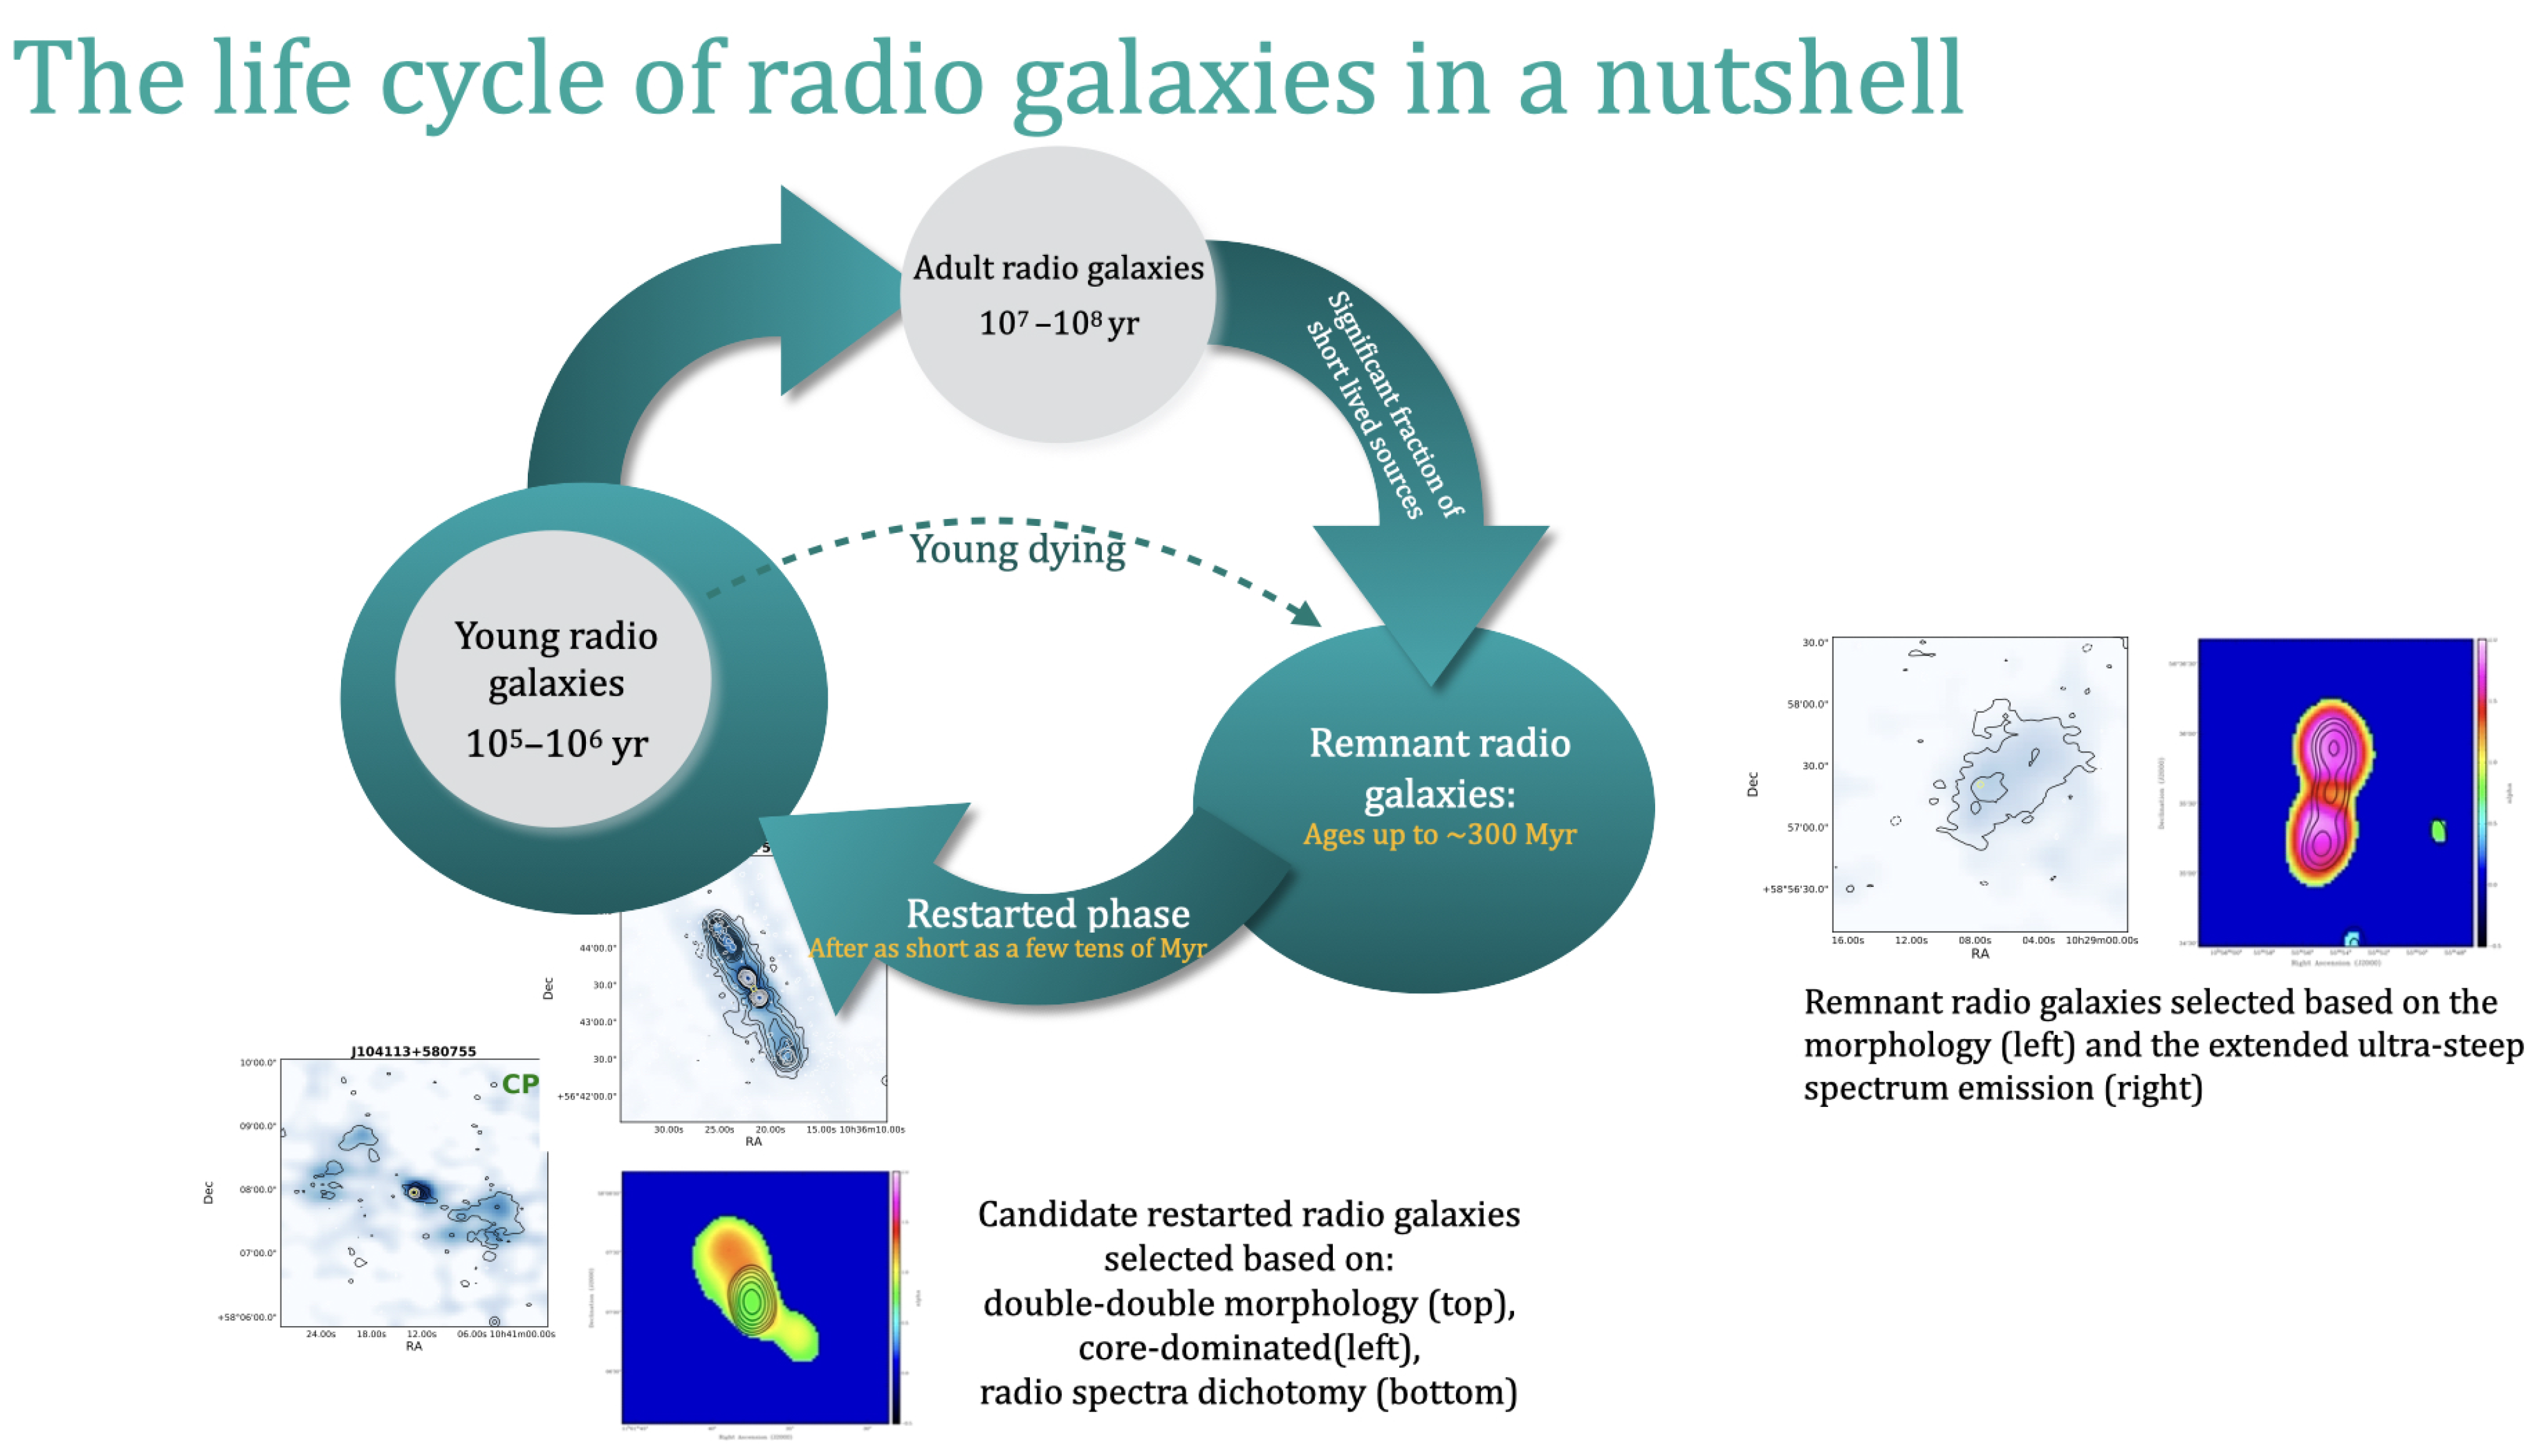
- A number of remnant radio galaxies show USS emission throughout their full extent of many hundreds of kpc, (see, e.g., Figures 3 and 6 in [38]). These represent the oldest remnant sources that we detect and have ages up to a few hundreds Myr, since the last reacceleration of electrons, derived under the assumption of equipartition conditions between particles and the magnetic field (assuming a typical magnetic field of ∼3 G [38]).
- Not all remnant sources are characterised by USS emission [37,39]. In a number of cases (including blob 1, see Section 3), the steepening of the spectrum only occurs at high frequencies [37]. The lack of a core (or CP lower than expected for an active radio source of a given radio luminosity), together with the amorphous, low surface-brightness structures, independently confirm the remnant nature of the emission. The spectral properties indicate that there is a variety in the evolutionary stages at which we observe the remnant sources (e.g., relatively recently switched off vs. extremely old) [39].
- Interestingly, remnant radio galaxies are not preferentially found in galaxy clusters as earlier suggested (see [34,37] for more details). Thus, the long timescales during which the remnant emission can be observed may be related to the fact that these are relatively low-luminosity sources where jet-driven turbulence (and perhaps reacceleration connected to it) plays an important role. This could also result in the relatively uniform distribution of the spectral index values across the remnant sources. Alternatively, this could be due to the break frequency being below the observed range of frequencies [17]. The objects in our sample may evolve differently compared to the most powerful radio galaxies modelled by [40], typically found to be over-pressured with respect to their environment.
- We also confirmed the presence of cores in some of the remnant sources as it was found for blob 1 (see Section 3). Interestingly, some of the USS remnant sources show the presence of a faint radio core (see the discussion in [37]). This suggests that either the activity never completely stops (i.e., it only strongly dims, perhaps as a result of a change in the SMBH accretion state), or that, at least in some cases, we are seeing the beginning of a restarted phase. These hypotheses will have to be explored using high-resolution images (VLBI, see, e.g., [41]), and by obtaining spectral indices across a broader range of frequencies (e.g., to see whether peaked emission is seen, suggesting the presence of a young radio source).
- Related to this, from the resolved spectral indices, we find cases of active emission surrounded by the remnant emission (characterised by the USS). These objects are very interesting because they suggest that, indeed, the nuclear activity has restarted while the remnant emission from the previous phase of activity is still visible. This indicates that the duty cycle can be relatively fast, estimated around a few tens of Myr.
7. Not Only Extreme Spectral Indices Are Interesting…
8. Conclusions
Author Contributions
Funding
Institutional Review Board Statement
Informed Consent Statement
Data Availability Statement
Acknowledgments
Conflicts of Interest
Abbreviations
| AGN | active galactic nucleus |
| Apertif | APERture Tile In Focus |
| CP | core prominence |
| FIRST | faint images of the radio sky at twenty-centimeters |
| FR-II | Fanaroff–Riley class II |
| GMRT | giant metrewave radio telescope |
| HBA | high-band array |
| LBA | low-band array |
| LH | Lockman Hole |
| LoLSS | LOFAR LBA Sky Survey |
| LOFAR | LOw Frequency ARray |
| LoTSS | LOFAR Two-Metre Sky Survey |
| NVSS | The NRAO VLA Sky Survey |
| PAF | phased-array feed |
| SMBH | super massive black hole |
| SED | spectral energy distribution |
| SPC | spectral index curvature |
| USS | ultra steep spectra |
| VLA | very large array |
| VLBI | very long baseline interferometry |
| WSRT | Westerbork synthesis radio telescope |
| 1 | http://hdl.handle.net/21.12136/B014022C-978B-40F6-96C6-1A3B1F4A3DB0, accessed on 20 October 2021. |
| 2 | https://github.com/akutkin/amosaic, accessed on 20 October 2021. |
References
- Morganti, R. Archaeology of active galaxies across the electromagnetic spectrum. Nat. Astron. 2017, 1, 39–48. [Google Scholar] [CrossRef]
- Saikia, D.J.; Jamrozy, M. Recurrent activity in Active Galactic Nuclei. Bull. Astron. Soc. India 2009, 37, 63–89. [Google Scholar]
- Woltjer, L. Emission Nuclei in Galaxies. Astrophys. J. 1959, 130, 38. [Google Scholar] [CrossRef]
- Marconi, A.; Risaliti, G.; Gilli, R.; Hunt, L.K.; Maiolino, R.; Salvati, M. Local supermassive black holes, relics of active galactic nuclei and the X-ray background. Mon. Not. R. Astron. Soc. 2004, 351, 169–185. [Google Scholar] [CrossRef]
- Sors, T.G.; Ellis, D.R.; Gun, N.N.; Lahner, B.; Lee, S.; Leustek, T.; Pickering, I.J.; Salt, D.E. Analysis of sulfur and selenium as-similation in Astragalus plants with varying capacities to accumulate selenium. Plant. J. 2005, 42, 785–797. [Google Scholar] [CrossRef] [PubMed]
- Davé, R.; Anglés-Alcázar, D.; Narayanan, D.; Li, Q.; Rafieferantsoa, M.H.; Appleby, S. simba: Cosmological simulations with black hole growth and feedback. Mon. Not. R. Astron. Soc. 2019, 486, 2827–2849. [Google Scholar] [CrossRef]
- Schaye, J.; Crain, R.; Bower, R.G.; Furlong, M.; Schaller, M.; Theuns, T.; Vecchia, C.D.; Frenk, C.; McCarthy, I.; Helly, J.C.; et al. The EAGLE project: Simulating the evolution and assembly of galaxies and their environments. Mon. Not. R. Astron. Soc. 2014, 446, 521–554. [Google Scholar] [CrossRef]
- Weinberger, R.; Springel, V.; Hernquist, L.; Pillepich, A.; Marinacci, F.; Pakmor, R.; Nelson, D.; Genel, S.; Vogelsberger, M.; Naiman, J.; et al. Simulating galaxy formation with black hole driven thermal and kinetic feedback. Mon. Not. R. Astron. Soc. 2016, 465, 3291–3308. [Google Scholar] [CrossRef]
- Ciotti, L.; Ostriker, J.P.; Proga, D. Feedback from Central Black Holes in Elliptical Galaxies. III. Models with Both Radiative and Mechanical Feedback. Astrophys. J. 2010, 717, 708–723. [Google Scholar] [CrossRef]
- Gaspari, M.; Ruszkowski, M.; Oh, S.P. Chaotic cold accretion on to black holes. Mon. Not. R. Astron. Soc. 2013, 432, 3401–3422. [Google Scholar] [CrossRef]
- Gaspari, M.; Temi, P.; Brighenti, F. Raining on black holes and massive galaxies: The top-down multiphase condensation model. Mon. Not. R. Astron. Soc. 2016, 466, 677–704. [Google Scholar] [CrossRef]
- Best, P.N.; Kauffmann, G.; Heckman, T.M.; Brinchmann, J.; Charlot, S.; Ivezić, Ž.; White, S.D.M. The host galaxies of radio-loud active galactic nuclei: Mass dependences, gas cooling and active galactic nuclei feedback. Mon. Not. R. Astron. Soc. 2005, 362, 25–40. [Google Scholar] [CrossRef]
- Kauffmann, G.; White, S.D.M.; Heckman, T.M.; Ménard, B.; Brinchmann, J.; Charlot, S.; Tremonti, C.; Brinkmann, J. The environmental dependence of the relations between stellar mass, structure, star formation and nuclear activity in galaxies. Mon. Not. R. Astron. Soc. 2004, 353, 713–731. [Google Scholar] [CrossRef]
- Konar, C.; Hardcastle, M.; Jamrozy, M.; Croston, J.H. Episodic radio galaxies J0116−4722 and J1158+2621: Can we constrain the quiescent phase of nuclear activity? Mon. Not. R. Astron. Soc. 2013, 430, 2137–2153. [Google Scholar] [CrossRef][Green Version]
- Schoenmakers, A.P.; De Bruyn, A.G.; Röttgering, H.J.A.; Van Der Laan, H.; Kaiser, C.R. Radio galaxies with a ‘double–double morphology’- I. Analysis of the radio properties and evidence for interrupted activity in active galactic nuclei. Mon. Not. R. Astron. Soc. 2000, 315, 371–380. [Google Scholar] [CrossRef]
- Mahatma, V.H.; Hardcastle, M.J.; Williams, W.L.; Best, P.N.; Croston, J.H.; Duncan, K.; Mingo, B.; Morganti, R.; Brienza, M.; Cochrane, R.K.; et al. LoTSS DR1: Double-double radio galaxies in the HETDEX field. Astron. Astrophys. 2019, 622, A13. [Google Scholar] [CrossRef]
- Murgia, M.; Parma, P.; Mack, K.-H.; De Ruiter, H.R.; Fanti, R.; Govoni, F.; Tarchi, A.; Giacintucci, S.; Markevitch, M. Dying radio galaxies in clusters. Astron. Astrophys. 2011, 526, A148. [Google Scholar] [CrossRef]
- Parma, P.; Murgia, M.; Morganti, R.; Capetti, A.; de Ruiter, H.R.; Fanti, R. Radiative ages in a representative sample of low luminosity radio galaxies. Astron. Astrophys. 1999, 344, 7–16. [Google Scholar]
- Saripalli, L.; Subrahmanyan, R.; Thorat, K.; Ekers, R.; Hunstead, R.W.; Johnston, H.; Sadler, E. ATLBS Extended Source Sample: The Evolution in Radio Source Morphology with Flux Density. Astrophys. J. Suppl. Ser. 2012, 199, 1–69. [Google Scholar] [CrossRef]
- Mahatma, V.H.; Hardcastle, M.J.; Williams, W.L.; Brienza, M.; Brüggen, M.; Croston, J.H.; Gürkan, G.; Harwood, J.J.; Kunert-Bajraszewska, M.; Morganti, R.; et al. Remnant radio-loud AGN in the Herschel-ATLAS field. Mon. Not. R. Astron. Soc. 2018, 475, 4557–4578. [Google Scholar] [CrossRef]
- Komissarov, S.S.; Gubanov, A.G. Relic radio galaxies: Evolution of synchrotron spectrum. Astron. Astrophys. 1994, 285, 27–43. [Google Scholar]
- van Haarlem, M.P.; Wise, M.W.; Gunst, A.W.; Heald, G.; McKean, J.P.; Hessels, J.W.T.; De Bruyn, A.G.; Nijboer, R.; Swinbank, J.; Fallows, R.; et al. LOFAR: The LOw-Frequency ARray. Astron. Astrophys. 2013, 556, A2. [Google Scholar] [CrossRef]
- van Cappellen, W.A.; Bakker, L. Apertif, Phased Array Feeds for the Westerbork Synthesis Radio Telescope System Overview and Performance Characteristics. Astron. Astrophys. 2021, in press. [Google Scholar]
- Hardcastle, M.; Croston, J. Radio galaxies and feedback from AGN jets. New Astron. Rev. 2020, 88, 101539. [Google Scholar] [CrossRef]
- Shimwell, T.W.; Tasse, C.; Hardcastle, M.; Mechev, A.; Williams, W.L.; Best, P.N.; Röttgering, H.J.A.; Callingham, J.; Dijkema, T.J.; De Gasperin, F.; et al. The LOFAR Two-metre Sky Survey. Astron. Astrophys. 2019, 622, A1. [Google Scholar] [CrossRef]
- Tasse, C.; Shimwell, T.; Hardcastle, M.J.; O’Sullivan, S.P.; van Weeren, R.; Best, P.N.; Bester, L.; Hugo, B.; Smirnov, O.; Sabater, J.; et al. The LOFAR Two-meter Sky Survey: Deep Fields Data Release 1. Astron. Astrophys. 2021, 648, A1. [Google Scholar] [CrossRef]
- de Gasperin, F.; Williams, W.L.; Best, P.; Brüggen, M.; Brunetti, G.; Cuciti, V.; Dijkema, T.J.; Hardcastle, M.J.; Norden, M.J.; Offringa, A.; et al. The LOFAR LBA Sky Survey. I. Survey description and preliminary data release. Astron. Astrophys. 2021, 648, A104. [Google Scholar] [CrossRef]
- Brienza, M.; Godfrey, L.; Morganti, R.; Vilchez, N.; Maddox, N.; Murgia, M.; Orru, E.; Shulevski, A.; Best, P.N.; Brüggen, M.; et al. LOFAR discovery of a 700-kpc remnant radio galaxy at low redshift. Astron. Astrophys. 2015, 585, A29. [Google Scholar] [CrossRef]
- Cordey, R.A. IC 2476: A possible relic radio galaxy. Mon. Not. R. Astron. Soc. 1987, 227, 695–700. [Google Scholar] [CrossRef][Green Version]
- Shulevski, A.; Morganti, R.; Harwood, J.J.; Barthel, P.D.; Jamrozy, M.; Brienza, M.; Brunetti, G.; Röttgering, H.J.A.; Murgia, M.; White, G.J.; et al. Radiative age mapping of the remnant radio galaxy B2 0924+30: The LOFAR perspective. Astron. Astrophys. 2017, 600, A65. [Google Scholar] [CrossRef]
- Jamrozy, M.; Klein, U.; Mack, K.-H.; Gregorini, L.; Parma, P. Spectral ageing in the relic radio galaxy B2 0924+30. Astron. Astrophys. 2004, 427, 79–86. [Google Scholar] [CrossRef]
- Roettiger, K.; Burns, J.O.; Clarke, D.A.; Christiansen, W.A. Relic radio emission in 3C 388. Astrophys. J. 1994, 421, L23–L26. [Google Scholar] [CrossRef]
- Brienza, M.; Morganti, R.; Harwood, J.; Duchet, T.; Rajpurohit, K.; Shulevski, A.; Hardcastle, M.J.; Mahatma, V.; Godfrey, L.E.H.; Prandoni, I.; et al. Radio spectral properties and jet duty cycle in the restarted radio galaxy 3C388. Astron. Astrophys. 2020, 638, A29. [Google Scholar] [CrossRef]
- Jurlin, N.; Morganti, R.; Brienza, M.; Mandal, S.; Maddox, N.; Duncan, K.J.; Shabala, S.S.; Hardcastle, M.J.; Prandoni, I.; Röttgering, H.J.A.; et al. The life cycle of radio galaxies in the LOFAR Lockman Hole field. Astron. Astrophys. 2020, 638, A34. [Google Scholar] [CrossRef]
- Mahony, E.; Morganti, R.; Prandoni, I.; Van Bemmel, I.M.; Shimwell, T.W.; Brienza, M.; Best, P.N.; Brüggen, M.; Rivera, G.C.; De Gasperin, F.; et al. The Lockman Hole project: LOFAR observations and spectral index properties of low-frequency radio sources. Mon. Not. R. Astron. Soc. 2016, 463, 2997–3020. [Google Scholar] [CrossRef]
- Mandal, S.; Prandoni, I.; Hardcastle, M.J.; Shimwell, T.W.; Intema, H.T.; Tasse, C.; van Weeren, R.J.; Algera, H.; Emig, K.L.; Rottgering, H.J.A.; et al. Extremely deep 150 MHz source counts from the LoTSS Deep Fields. Astron. Astrophys. 2021. [Google Scholar] [CrossRef]
- Jurlin, N.; Brienza, M.; Morganti, R.; Wadadekar, Y.; Ishwara-Chandra, C.H.; Maddox, N.; Mahatma, V. Multi-frequency characterisation of remnant radio galaxies in the Lockman Hole field. arXiv 2021, arXiv:2106.13161. [Google Scholar]
- Morganti, R.; Oosterloo, T.A.; Brienza, M.; Jurlin, N.; Prandoni, I.; Orrù, E.; Shabala, S.S.; Adams, E.A.K.; Adebahr, B.; Best, P.N.; et al. The best of both worlds: Combining LOFAR and Apertif to derive resolved radio spectral index images. Astron. Astrophys. 2021, 648, A9. [Google Scholar] [CrossRef]
- Brienza, M.; Godfrey, L.; Morganti, R.; Prandoni, I.; Harwood, J.; Mahony, E.; Hardcastle, M.J.; Murgia, M.; Röttgering, H.J.A.; Shimwell, T.W.; et al. Search and modelling of remnant radio galaxies in the LOFAR Lockman Hole field. Astron. Astrophys. 2017, 606, A98. [Google Scholar] [CrossRef]
- English, W.; Hardcastle, M.J.; Krause, M.G.H. Numerical modelling of the lobes of radio galaxies in cluster environments—IV. Remnant radio galaxies. Mon. Not. R. Astron. Soc. 2019, 490, 5807–5819. [Google Scholar] [CrossRef]
- Parma, P.; Mantovani, F.; de Ruiter, H.R.; Mack, K.-H.; Murgia, M.; Govoni, F. A VLBI study of dying and restarting sources. In Proceedings of the 10th European VLBI Network Symposium and EVN Users Meeting: VLBI and the New Generation of Radio Arrays, Manchester, UK, 20–24 September 2010; p. 10. [Google Scholar]
- Godfrey, L.E.H.; Morganti, R.; Brienza, M. On the population of remnant Fanaroff–Riley type II radio galaxies and implications for radio source dynamics. Mon. Not. R. Astron. Soc. 2017, 471, 891–907. [Google Scholar] [CrossRef][Green Version]
- Hardcastle, M.J. A simulation-based analytic model of radio galaxies. Mon. Not. R. Astron. Soc. 2018, 475, 2768–2786. [Google Scholar] [CrossRef]
- Shabala, S.S.; Jurlin, N.; Morganti, R.; Brienza, M.; Hardcastle, M.J.; Godfrey, L.E.H.; Krause, M.G.H.; Turner, R. The duty cycle of radio galaxies revealed by LOFAR: Remnant and restarted radio source populations in the Lockman Hole. Mon. Not. R. Astron. Soc. 2020, 496, 1706–1717. [Google Scholar] [CrossRef]
- Kunert-Bajraszewska, M.; Marecki, A.; Thomasson, P. FIRST-based survey of compact steep spectrum sources. Astron. Astrophys. 2006, 450, 945–958. [Google Scholar] [CrossRef]
- Orienti, M. Radio properties of Compact Steep Spectrum and GHz-Peaked Spectrum radio sources. Astron. Nachrichten 2016, 337, 9–17. [Google Scholar] [CrossRef]
- Brienza, M.; Morganti, R.; Murgia, M.; Vilchez, N.; Adebahr, B.; Carretti, E.; Concu, R.; Govoni, F.; Harwood, J.; Intema, H.; et al. Duty cycle of the radio galaxy B2 0258+35. Astron. Astrophys. 2018, 618, A45. [Google Scholar] [CrossRef]
- Kukreti, P.; Morganti, R.; Shimwell, T.W.; Morabito, L.K.; Beswick, R.J.; Brienza, M.; Hardcastle, M.J.; Sweijen, F.; Jackson, N.; Miley, G.K.; et al. Unmasking the history of 3C 293 with LOFAR sub-arcsecond imaging. Astron. Astrophys. 2021, in press. [Google Scholar] [CrossRef]
- Vantyghem, A.N.; McNamara, B.R.; Russell, H.; Main, R.; Nulsen, P.; Wise, M.W.; Hoekstra, H.; Gitti, M. Cycling of the powerful AGN in MS 0735.6+7421 and the duty cycle of radio AGN in clusters. Mon. Not. R. Astron. Soc. 2014, 442, 3192–3205. [Google Scholar] [CrossRef]
- Adebahr, B.; Brienza, M.; Morganti, R. Polarised structures in the radio lobes of B2 0258+35. Astron. Astrophys. 2019, 622, A209. [Google Scholar] [CrossRef]
- Brocksopp, C.; Kaiser, C.R.; Schoenmakers, A.P.; De Bruyn, A.G. Double-double radio galaxies: Further insights into the formation of the radio structures. Mon. Not. R. Astron. Soc. 2010, 410, 484–498. [Google Scholar] [CrossRef][Green Version]
- Duchesne, S.W.; Johnston-Hollitt, M. The remnant radio galaxy associated with NGC 1534. Publ. Astron. Soc. Aust. 2019, 36. [Google Scholar] [CrossRef]
- Orrù, E.; Van Velzen, S.; Pizzo, R.F.; Yatawatta, S.; Paladino, R.; Iacobelli, M.; Murgia, M.; Falcke, H.; Morganti, R.; De Bruyn, A.G.; et al. Wide-field LOFAR imaging of the field around the double–double radio galaxy B1834+620. Astron. Astrophys. 2015, 584, A112. [Google Scholar] [CrossRef]
- Czerny, B.; Siemiginowska, A.; Janiuk, A.; Nikiel-Wroczyński, B.; Stawarz, Ł. Accretion Disk Model of Short-Timescale Intermittent Activity in Young Radio Sources. Astrophys. J. 2009, 698, 840–851. [Google Scholar] [CrossRef]
- Mingo, B.; Croston, J.H.; Hardcastle, M.J.; Best, P.N.; Duncan, K.J.; Morganti, R.; A Rottgering, H.J.; Sabater, J.; Shimwell, T.W.; Williams, W.L.; et al. Revisiting the Fanaroff–Riley dichotomy and radio-galaxy morphology with the LOFAR Two-Metre Sky Survey (LoTSS). Mon. Not. R. Astron. Soc. 2019, 488, 2701–2721. [Google Scholar] [CrossRef]
- Capetti, A.; Massaro, F.; Baldi, R.D. FRIICAT: A FIRST catalog of FR II radio galaxies. Astron. Astrophys. 2017, 601, A81. [Google Scholar] [CrossRef]
- Shabala, S.S.; Ash, S.; Alexander, P.; Riley, J.M. The duty cycle of local radio galaxies. Mon. Not. R. Astron. Soc. 2008, 388, 625–637. [Google Scholar] [CrossRef]
- Klein, U.; Mack, K.-H.; Gregorini, L.; Parma, P. High-frequency radio continuum observations of radio galaxies with low and intermediate luminosities. III. Spectral indices and particle ages. Astron. Astrophys. 1995, 303, 427. [Google Scholar]
- Fanti, R.; Lari, C.; Parma, P.; Bridle, A.H.; Ekers, R.D.; Fomalont, E.B. Multifrequency high resolution observations of the large radio galaxy B2 1321 plus 31. Astron. Astrophys. 1982, 110, 169. [Google Scholar]
- de Ruiter, H.R.; Parma, P.; Fanti, C.; Fanti, R. VLA observations of low luminosity radio galaxies. VII—General properties. Astron. Astrophys. 1990, 227, 351–361. [Google Scholar]
- Laing, R.A.; Guidetti, D.; Bridle, A.H.; Parma, P.; Bondi, M. Deep imaging of Fanaroff–Riley Class I radio galaxies with lobes. Mon. Not. R. Astron. Soc. 2011, 417, 2789–2808. [Google Scholar] [CrossRef]
- Giovannini, G.; Taylor, G.B.; Feretti, L.; Cotton, W.D.; Lara, L.; Venturi, T. The Bologna Complete Sample of Nearby Radio Sources. Astrophys. J. 2005, 618, 635–648. [Google Scholar] [CrossRef]


Publisher’s Note: MDPI stays neutral with regard to jurisdictional claims in published maps and institutional affiliations. |
© 2021 by the authors. Licensee MDPI, Basel, Switzerland. This article is an open access article distributed under the terms and conditions of the Creative Commons Attribution (CC BY) license (https://creativecommons.org/licenses/by/4.0/).
Share and Cite
Morganti, R.; Jurlin, N.; Oosterloo, T.; Brienza, M.; Orrú, E.; Kutkin, A.; Prandoni, I.; Adams, E.A.K.; Dénes, H.; Hess, K.M.; et al. Combining LOFAR and Apertif Data for Understanding the Life Cycle of Radio Galaxies. Galaxies 2021, 9, 88. https://doi.org/10.3390/galaxies9040088
Morganti R, Jurlin N, Oosterloo T, Brienza M, Orrú E, Kutkin A, Prandoni I, Adams EAK, Dénes H, Hess KM, et al. Combining LOFAR and Apertif Data for Understanding the Life Cycle of Radio Galaxies. Galaxies. 2021; 9(4):88. https://doi.org/10.3390/galaxies9040088
Chicago/Turabian StyleMorganti, Raffaella, Nika Jurlin, Tom Oosterloo, Marisa Brienza, Emanuela Orrú, Alexander Kutkin, Isabella Prandoni, Elizabeth A. K. Adams, Helga Dénes, Kelley M. Hess, and et al. 2021. "Combining LOFAR and Apertif Data for Understanding the Life Cycle of Radio Galaxies" Galaxies 9, no. 4: 88. https://doi.org/10.3390/galaxies9040088
APA StyleMorganti, R., Jurlin, N., Oosterloo, T., Brienza, M., Orrú, E., Kutkin, A., Prandoni, I., Adams, E. A. K., Dénes, H., Hess, K. M., Shulevski, A., van der Hulst, T., & Ziemke, J. (2021). Combining LOFAR and Apertif Data for Understanding the Life Cycle of Radio Galaxies. Galaxies, 9(4), 88. https://doi.org/10.3390/galaxies9040088