
Radio and X-ray Observations of the Restarted Radio Galaxy in the Galaxy Cluster CL 0838+1948


Abstract
1. Introduction
2. Observations and Data Reduction
2.1. VLITE 338 MHz Data
2.2. GMRT 610 MHz Data
2.3. Chandra X-ray Data
3. Results
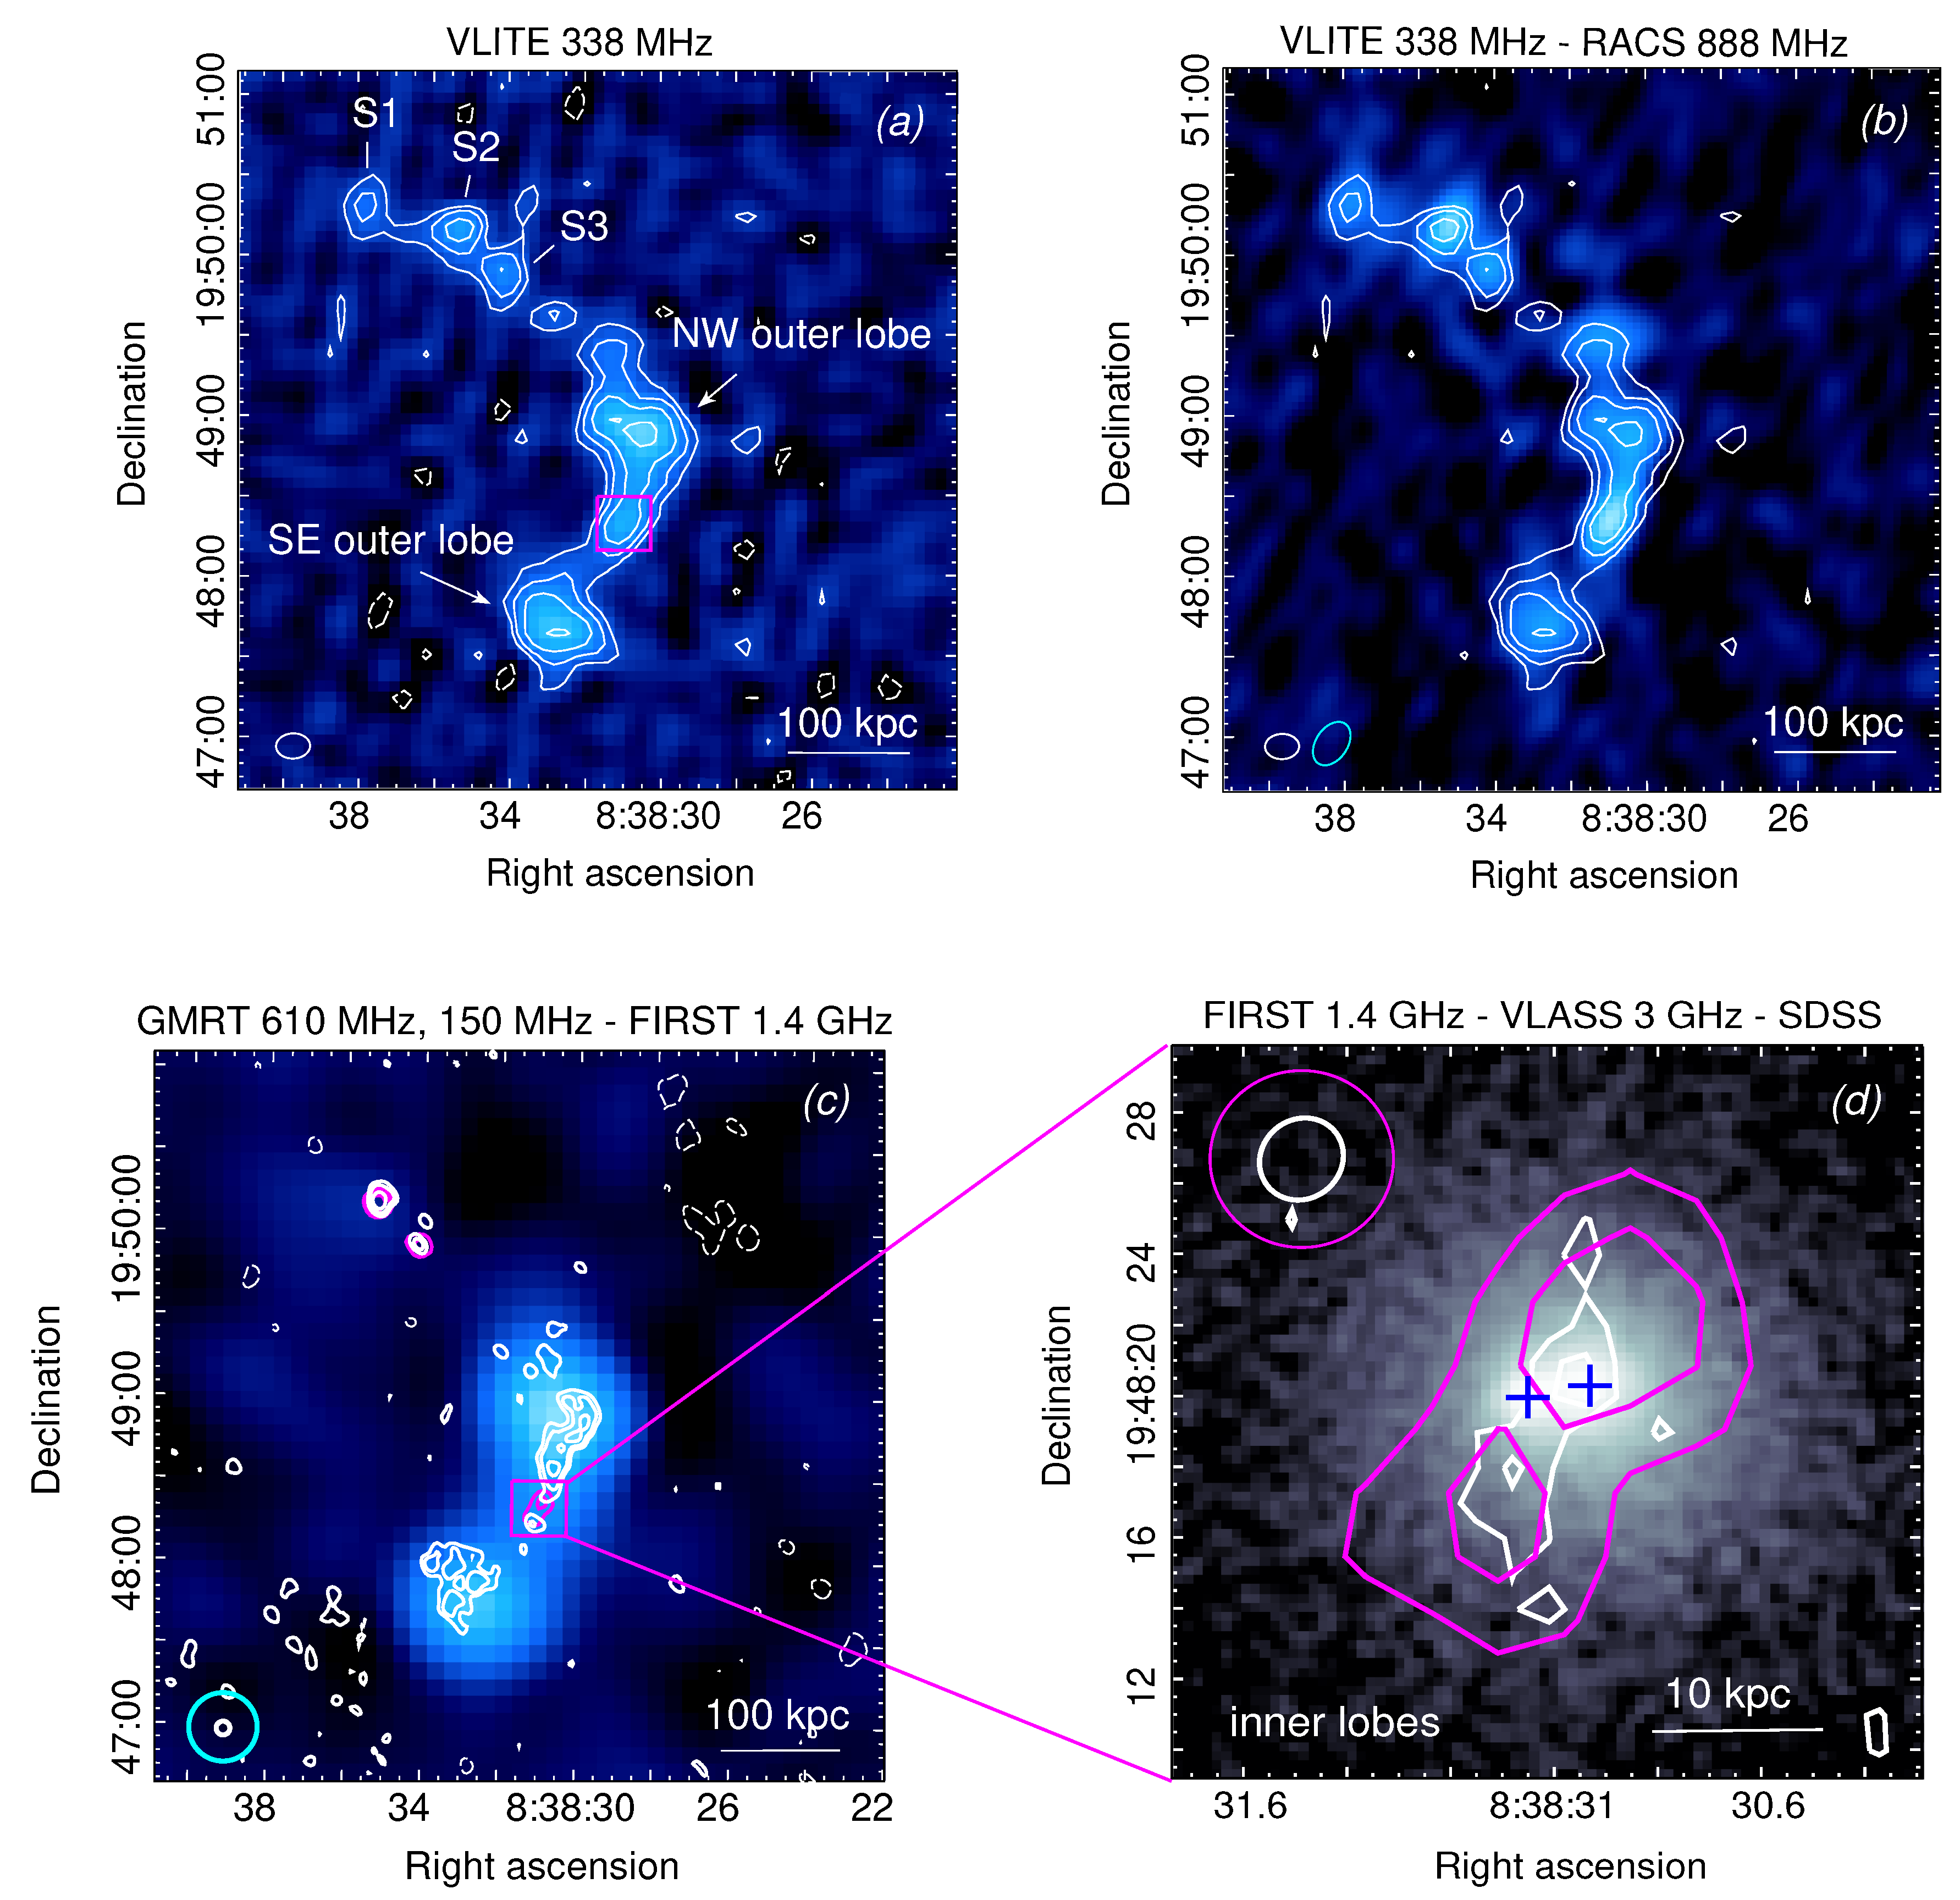
3.1. Radio Images
3.2. Radio Flux Densities
3.3. Radio Spectral Analysis and Modeling
3.4. Equipartition Parameters and Radiative Ages
3.5. Chandra X-ray Analysis
3.5.1. X-ray Images
3.5.2. Global Cluster Temperature and Mass
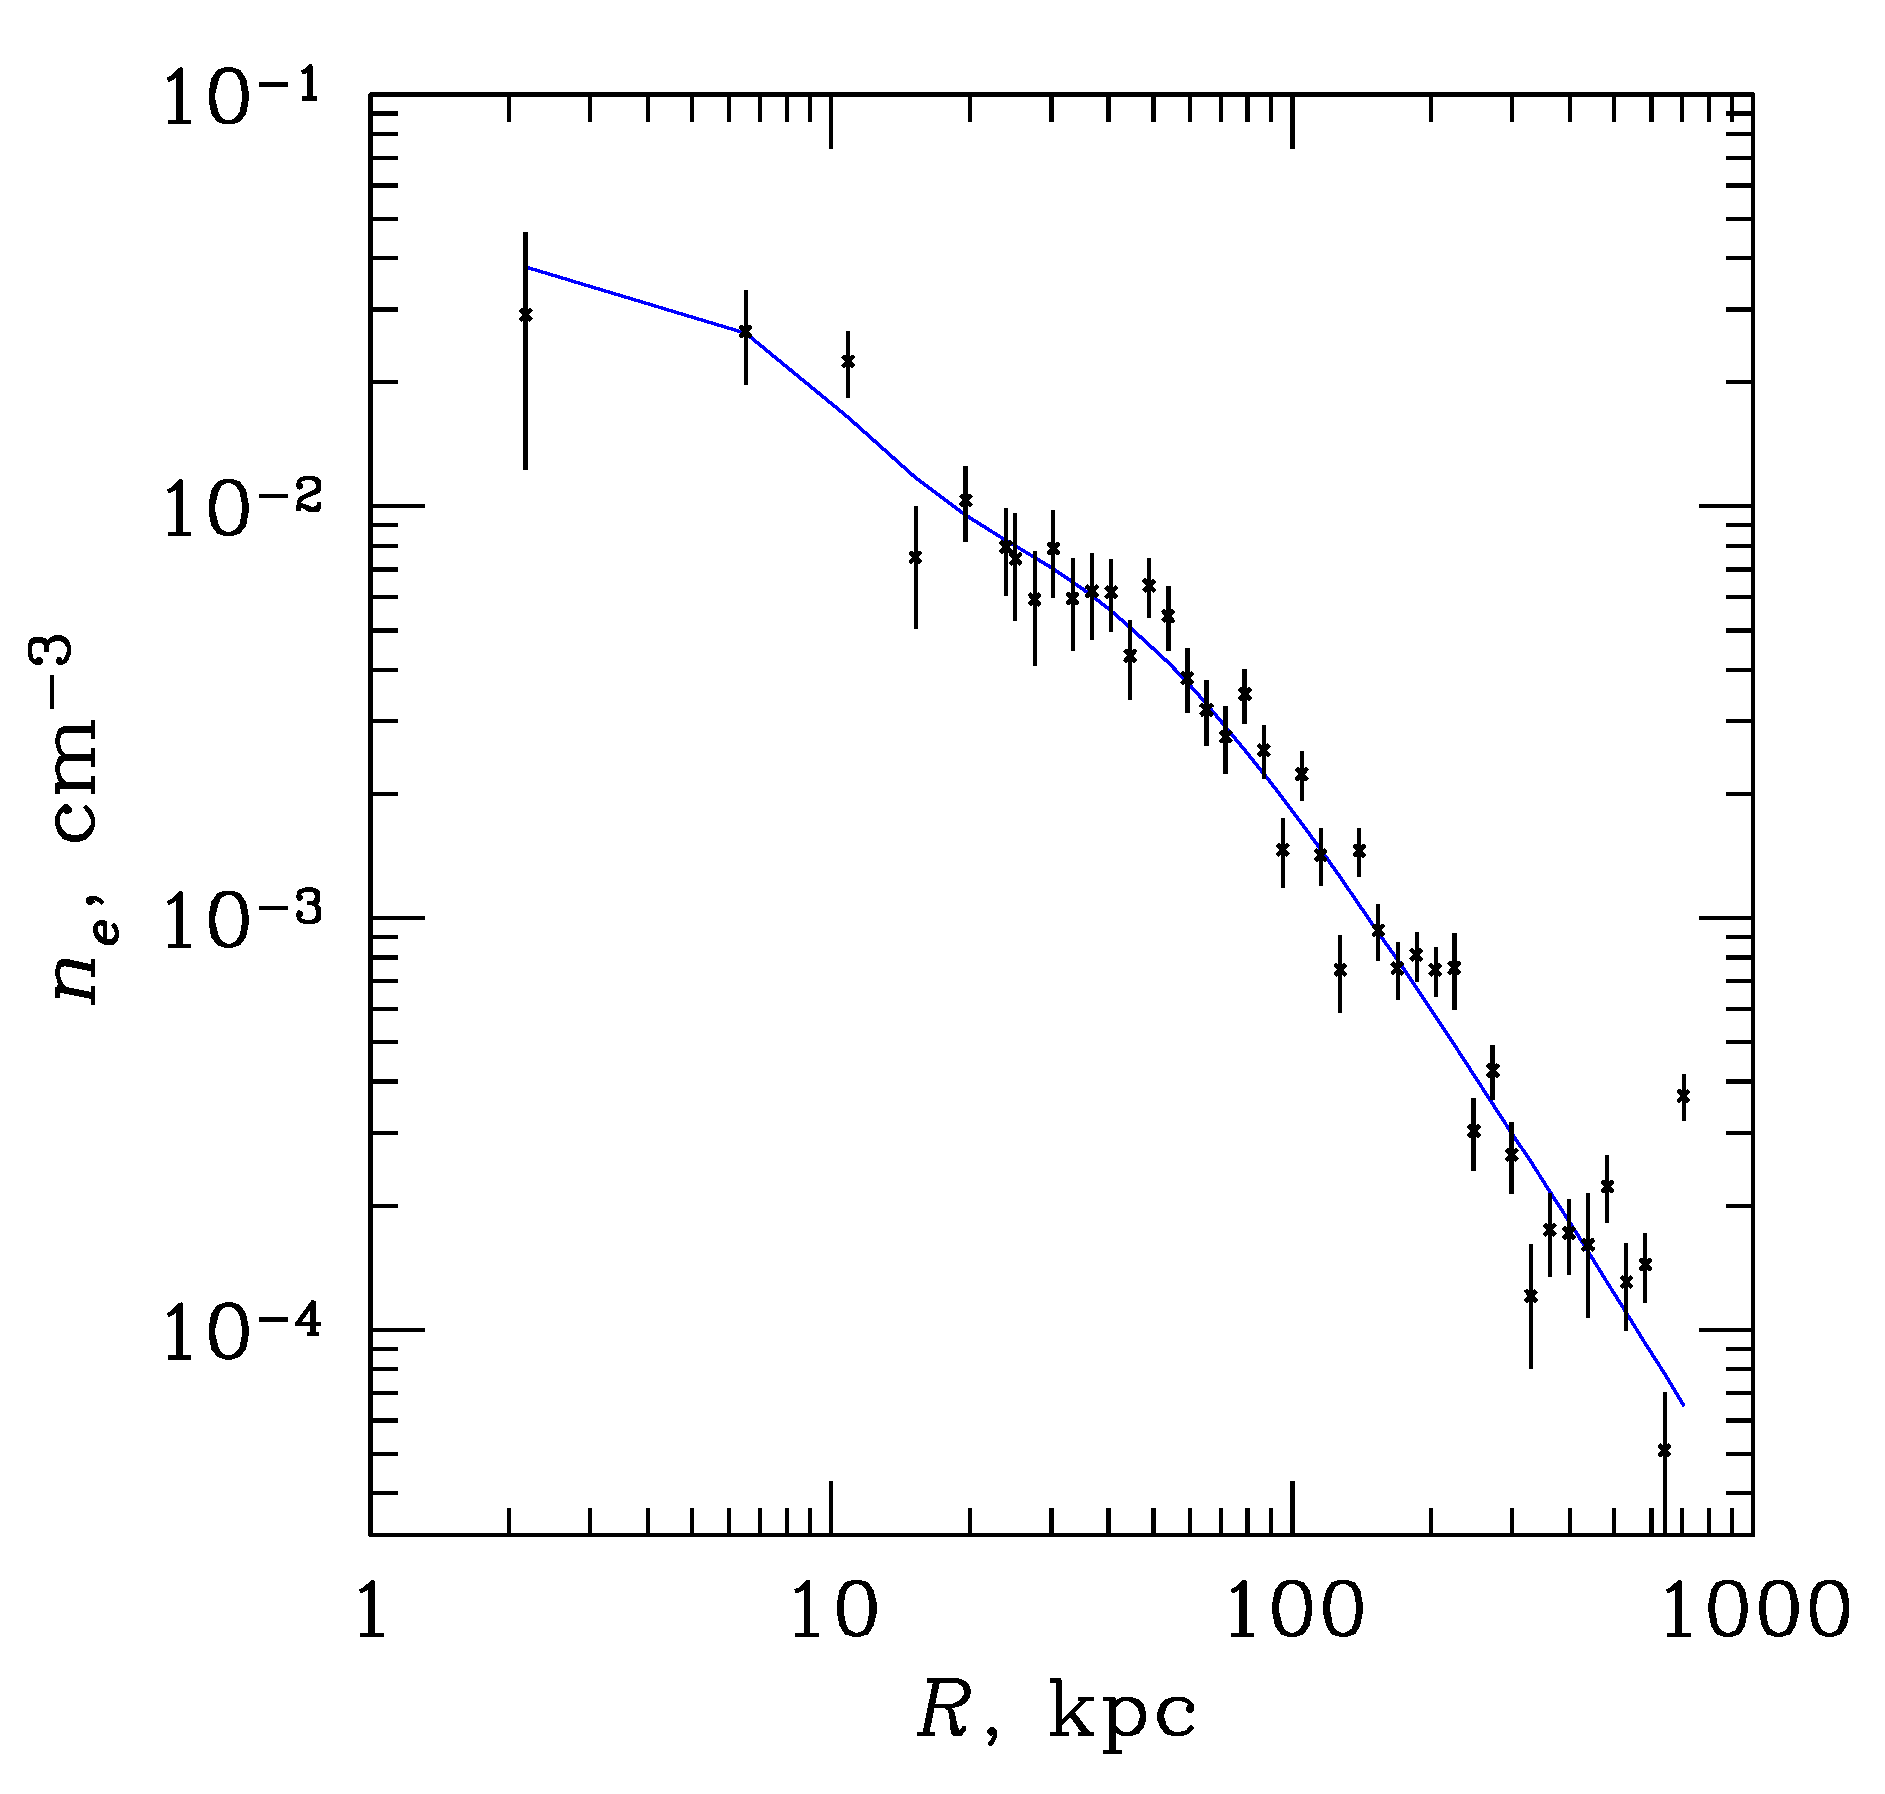
3.5.3. Gas Density Profile
4. Discussion
4.1. A Diffuse Radio Tail Hinting at Jet Precession?
4.2. Radio/X-ray Interaction
4.3. Outburst Energy
4.4. Cluster Environment
4.5. Thermal/Non-Thermal Pressure Comparison
4.6. Galactic Corona or Cool-Core Remnant?
5. Conclusions
- the cluster central galaxy hosts an extended radio source (250 kpc), whose radio emission is composed of a pair of large and steep-spectrum () outer lobes and two smaller-scale (30 kpc) inner lobes characterized by a much flatter spectral index (). The combination of morphology and different spectral indices suggests that the source is a restarted radio galaxy: the inner lobes are associated with a young radio source, whereas the outer lobes are fossil emission remaining from a former episode of activity;
- modeling of the integrated spectrum using a dying radio source (; e.g., [8]) model supports a scenario in which the outer lobes are the remnant of a past AGN outburst. Under equipartition assumptions, we estimated that their synchrotron emission is no more than 110 Myr old and that the prior phase of activity had lasted at least 12 Myr. For the inner lobes, whose spectral shape is typical for an active radio source, we estimated that they are younger than 52 Myr;
- a possible tail of diffuse emission, misaligned with respect to the lobe axis, is detected North-East of the cluster center. If associated with the restarted radio galaxy, this misaligned tail may hint at jet precession. The optical and infrared images of the central galaxy suggests the presence of two distinct nuclei, ∼4 kpc apart. The precession of the jet axis may be linked to this candidate binary system. However, more radio data are needed to confirm the diffuse tail and resolve the core and inner jets in the center to determine their relation to the dual-nuclei system;
- the Chandra images show that the cluster is relaxed. The radio galaxy is centrally located, and its outer lobes extend beyond the central core, while the inner lobes are contained within the innermost and brightest X-ray region;
- we measured a cluster average temperature (core-excised) of 3.28 keV and estimated a mass of M⊙ from the -T relation;
- the intracluster gas density profile is well described by a double -model, while a single -model is not able to reproduce the observed profile at kpc. This region is associated with a compact component in the X-ray images, which encloses the brightest X-ray emission, and is contained within the optical extended envelope of the central galaxy. It is possible that this component is thermal emission arising from a galactic corona. Alternatively, it could be a cool-core remnant left after the outermost regions of a pre-existing, larger-scale cool core have been heated up by the AGN activity. This activity could be the same past outburst that has generated the radio lobes outside the compact core. The current Chandra exposure provides insufficient photon statistics to reliably image the small-scale structure of this central compact core and measure its temperature. Deeper observations are needed to examine in detail the structure and thermodynamic properties of this component and shed light on its interstellar vs intracluster medium origin;
- the Chandra images show no X-ray cavities or other substructures associated with the radio source. The possible lack of cavities may suggest that the radio lobes contain a significant amount of hot thermal gas (for instance, entrained and transported by the radio jets). However, deeper X-ray observations are needed to confirm the lack of cavities in this system;
- due to the lack of X-ray cavities, we were not able to investigate the evolution of the mean jet mechanical energy between the two epochs of AGN activity that have created the inner and outer lobes. We were able to compare the energy radiated as synchrotron emission, which is believed to be only a small fraction of the total energy of a radio source. We found that the past outburst has radiated an energy of at least ∼ erg, whereas the younger activity has released no more than ∼ erg. If the mean jet mechanical power has not changed significantly over the source history, this may indicate that the AGN total energy output has decreased between the two epochs of activity. However, if the current epoch of activity is still ongoing, it is possible that the mechanical power may become larger.
- the restarted radio galaxy studied here resides in the center of a cool-core cluster [25], which is a very dense thermal environment. Other dying/restarted sources have been found at cluster or group centers (e.g., [75]); however, it is still unclear whether these sources preferentially reside in dense environments [7]. In the dense cores of groups and clusters, such as CL 0838, the high thermal pressure of the external gas may be able to confine the lobes and reduce the energy losses caused by adiabatic expansion, thus extending the lobes lifetime compared to a dying source in a less dense environment;
- comparison of the lobe internal pressure, computed under the assumption of minimum energy conditions, to a rough order-of-magnitude estimate of thermal gas pressure indicates a pressure unbalance of two orders of magnitude for both pairs of lobes. This implies that an additional contribution to the lobe pressure, for instance from non-radiating relativistic particles or hot thermal material in the lobes, is needed to maintain pressure balance (assuming that the source is not significantly far from equipartition conditions between relativistic particle and magnetic field energy densities).
Author Contributions
Funding
Institutional Review Board Statement
Informed Consent Statement
Data Availability Statement
Acknowledgments
Conflicts of Interest
| 1 | The radio spectral index is defined according to , where is the flux density at the frequency . |
| 2 | LOFAR Two-metre Sky Survey [17]. |
| 3 | MeerKAT Galaxy Cluster Legacy Survey [18]. |
| 4 | Rapid ASKAP Continuum Survey [19]. |
| 5 | LOw-Frequency ARray [20]. |
| 6 | Murchison Widefield Array [21]. |
| 7 | upgraded Giant Metrewave Radio Telescope [22]. |
| 8 | Australian Square Kilometre Array Pathfinder [24]. |
| 9 | Sloan Digital Sky Survey [47]. |
| 10 | UKIRT Infrared Deep Sky Survey [48]. |
| 11 | Panoramic Survey Telescope and Rapid Response System [49]. |
| 12 | is the radius that encloses a mean overdensity of 500 with respect to the critical density at the cluster redshift. |
References
- Saikia, D.J.; Jamrozy, M. Recurrent activity in Active Galactic Nuclei. Bull. Astron. Soc. India 2009, 37, 63–89. [Google Scholar]
- Schoenmakers, A.P.; de Bruyn, A.G.; Röttgering, H.J.A.; van der Laan, H.; Kaiser, C.R. Radio galaxies with a ‘double-double morphology’—I. Analysis of the radio properties and evidence for interrupted activity in active galactic nuclei. Mon. Not. R. Astron. Soc. 2000, 315, 371–380. [Google Scholar] [CrossRef]
- Condon, J.J. Radio emission from normal galaxies. Annu. Rev. Astron. Astrophys. 1992, 30, 575–611. [Google Scholar] [CrossRef]
- Giacintucci, S.; O’Sullivan, E.; Clarke, T.E.; Murgia, M.; Vrtilek, J.M.; Venturi, T.; David, L.P.; Raychaudhury, S.; Athreya, R.M. Recurrent Radio Outbursts at the Center of the NGC 1407 Galaxy Group. Astrophys. J. 2012, 755, 172. [Google Scholar] [CrossRef]
- Murgia, M.; Parma, P.; Mack, K.-H.; de Ruiter, H.R.; Fanti, R.; Govoni, F.; Tarchi, A.; Giacintucci, S.; Markevitch, M. Dying radio galaxies in clusters. Astron. Astrophys. 2011, 526, A148. [Google Scholar] [CrossRef]
- Slee, O.B.; Roy, A.L.; Murgia, M.; Andernach, H.; Ehle, M. Four Extreme Relic Radio Sources in Clusters of Galaxies. Astron. J. 2001, 122, 1172–1193. [Google Scholar] [CrossRef]
- Jurlin, N.; Morganti, R.; Brienza, M.; Mandal, S.; Maddox, N.; Duncan, K.J.; Shabala, S.S.; Hardcastle, M.J.; Prandoni, I.; Röttgering, H.J.A.; et al. The life cycle of radio galaxies in the LOFAR Lockman Hole field. Astron. Astrophys. 2020, 638, A34. [Google Scholar] [CrossRef]
- Parma, P.; Murgia, M.; de Ruiter, H.R.; Fanti, R.; Mack, K.-H.; Govoni, F. In search of dying radio sources in the local universe. Astron. Astrophys. 2007, 470, 875–888. [Google Scholar] [CrossRef]
- Quici, B.; Hurley-Walker, N.; Seymour, N. Remnant radio galaxies discovered in a multi-frequency survey. Publ. Astron. Soc. Aust. 2021, 38, e008. [Google Scholar] [CrossRef]
- Saripalli, L.; Subrahmanyan, R.; Thorat, K.; Ekers, R.D.; Hunstead, R.W.; Johnston, H.M.; Sadler, E.M. ATLBS Extended Source Sample: The Evolution in Radio Source Morphology with Flux Density. Astrophys. J. Suppl. Ser. 2012, 199, 27. [Google Scholar] [CrossRef]
- Brienza, M.; Morganti, R.; Harwood, J.; Duchet, T.; Rajpurohit, K.; Shulevski, A.; Hardcastle, M.J.; Mahatma, V.; Godfrey, L.E.H.; Prandoni, I.; et al. Radio spectral properties and jet duty cycle in the restarted radio galaxy 3C388. Astron. Astrophys. 2020, 638, A29. [Google Scholar] [CrossRef]
- Clarke, T.E.; Blanton, E.L.; Sarazin, C.L.; Anderson, L.D.; Gopal-Krishna; Douglass, E.M.; Kassim, N.E. Tracing Multiple Generations of Active Galactic Nucleus Feedback in the Core of Abell 262. Astrophys. J. 2009, 697, 1481–1492. [Google Scholar] [CrossRef]
- Giacintucci, S.; Venturi, T.; Murgia, M.; Dallacasa, D.; Athreya, R.; Bardelli, S.; Mazzotta, P.; Saikia, D.J. Radio morphology and spectral analysis of cD galaxies in rich and poor galaxy clusters. Astron. Astrophys. 2007, 476, 99–119. [Google Scholar] [CrossRef]
- Shulevski, A.; Morganti, R.; Harwood, J.J. Radiative age mapping of the remnant radio galaxy B2 0924+30: The LOFAR perspective. Astron. Astrophys. 2007, 476, 99–119. [Google Scholar] [CrossRef]
- Kuźmicz, A.; Jamrozy, M.; Kozieł-Wierzbowska, D.; Weżgowiec, M. Optical and radio properties of extragalactic radio sources with recurrent jet activity. Mon. Not. R. Astron. Soc. 2017, 471, 3806–3826. [Google Scholar] [CrossRef]
- Brienza, M.; Godfrey, L.; Morganti, R.; Prandoni, I.; Harwood, J.; Mahony, E.K.; Hardcastle, M.J.; Murgia, M.; Röttgering, H.J.A.; Shimwell, T.W.; et al. Search and modelling of remnant radio galaxies in the LOFAR Lockman Hole field. Astron. Astrophys. 2017, 606, A98. [Google Scholar] [CrossRef]
- Shimwell, T.W.; Röttgering, H.J.A.; Best, P.N.; Williams, W.L.; Dijkema, T.J.; de Gasperin, F.; Hardcastle, M.J.; Heald, G.H.; Hoang, D.N.; Horneffer, A.; et al. The LOFAR Two-metre Sky Survey. I. Survey description and preliminary data release. Astron. Astrophys. 2017, 598, A104. [Google Scholar] [CrossRef]
- Knowles, K.; Cotton, W.D.; Rudnick, L.; Camilo, F.; Goedhart, S.; Deane, R.; Ramatsoku, M.; Bietenholz, M.F.; Brüggen, M.; Button, C.; et al. The MeerKAT Galaxy Cluster Legacy Survey I. Survey Overview and Highlights. arXiv 2021, arXiv:2111.05673. [Google Scholar]
- Hale, C.L.; McConnell, D.; Thomson, A.J.M.; Lenc, E.; Heald, G.H.; Hotan, A.W.; Leung, J.K.; Moss, V.A.; Murphy, T.; Pritchard, J.; et al. The Rapid ASKAP Continuum Survey Paper II: First Stokes I Source Catalogue Data Release. arXiv 2021, arXiv:2109.00956. [Google Scholar]
- Van Haarlem, M.P.; Wise, M.W.; Gunst, A.W.; Heald, G.; McKean, J.P.; Hessels, J.W.T.; de Bruyn, A.G.; Nijboer, R.; Swinbank, J.; Fallows, R.; et al. LOFAR: The LOw-Frequency ARray. Astron. Astrophys. 2013, 556, A2. [Google Scholar] [CrossRef]
- Tingay, S.J.; Goeke, R.; Bowman, J.D.; Emrich, D.; Ord, S.M.; Mitchell, D.A.; Morales, M.F.; Booler, T.; Crosse, B.; Wayth, R.B.; et al. The Murchison Widefield Array: The Square Kilometre Array Precursor at Low Radio Frequencies. Publ. Astron. Soc. Aust. 2013, 30, e007. [Google Scholar] [CrossRef]
- Gupta, Y.; Ajithkumar, B.; Kale, H.S.; Nayak, S.; Sabhapathy, S.; Sureshkumar, S.; Swami, R.V.; Chengalur, J.N.; Ghosh, S.K.; Ishwara-Chandra, C.H. The upgraded GMRT: Opening new windows on the radio Universe. Publ. Curr. Sci. 2017, 113, 707. [Google Scholar] [CrossRef]
- Camilo, F.; Scholz, P.; Serylak, M.; Buchner, S.; Merryfield, M.; Kaspi, V.M.; Archibald, R.F.; Bailes, M.; Jameson, A.; van Straten, W.; et al. Revival of the Magnetar PSR J1622-4950: Observations with MeerKAT, Parkes, XMM-Newton, Swift, Chandra, and NuSTAR. Astrophys. J. 2018, 856, 180. [Google Scholar] [CrossRef]
- Johnston, S.; Taylor, R.; Bailes, M.; Bartel, N.; Baugh, C.; Bietenholz, M.; Blake, C.; Braun, R.; Brown, J.; Chatterjee, S.; et al. Science with ASKAP. The Australian square-kilometre-array pathfinder. Exp. Astron. 2008, 22, 151. [Google Scholar] [CrossRef]
- Zou, S.; Maughan, B.J.; Giles, P.A.; Vikhlinin, A.; Pacaud, F.; Burenin, R.; Hornstrup, A. The X-ray luminosity-temperature relation of a complete sample of low-mass galaxy clusters. Mon. Not. R. Astron. Soc. 2016, 463, 820–831. [Google Scholar] [CrossRef]
- Wayth, R.B.; Lenc, E.; Bell, M.E.; Callingham, J.R.; Dwarakanath, K.S.; Franzen, T.M.O.; For, B.-Q.; Gaensler, B.; Hancock, P.; Hindson, L.; et al. GLEAM: The GaLactic and Extragalactic All-Sky MWA Survey. Publ. Astron. Soc. Aust. 2015, 32, e025. [Google Scholar] [CrossRef]
- Lane, W.M.; Cotton, W.D.; van Velzen, S.; Clarke, T.E.; Kassim, N.E.; Helmboldt, J.F.; Lazio, T.J.W.; Cohen, A.S. The Very Large Array Low-frequency Sky Survey Redux (VLSSr). Mon. Not. R. Astron. Soc. 2014, 440, 327–338. [Google Scholar] [CrossRef]
- Intema, H.T.; Jagannathan, P.; Mooley, K.P.; Frail, D.A. The GMRT 150 MHz all-sky radio survey. First alternative data release TGSS ADR1. Astron. Astrophys. 2017, 598, A78. [Google Scholar] [CrossRef]
- Condon, J.J.; Cotton, W.D.; Greisen, E.W.; Yin, Q.F.; Perley, R.A.; Taylor, G.B.; Broderick, J.J. The NRAO VLA Sky Survey. Astron. J. 1998, 115, 1693–1716. [Google Scholar] [CrossRef]
- Becker, R.H.; White, R.L.; Helfand, D.J. The VLA’s FIRST Survey. Astron. Data Anal. Softw. Syst. 1994, 61, 165. [Google Scholar]
- Lacy, M.; Baum, S.A.; Chandler, C.J.; Chatterjee, S.; Clarke, T.E.; Deustua, S.; English, J.; Farnes, J.; Gaensler, B.M.; Gugliucci, N.; et al. The Karl G. Jansky Very Large Array Sky Survey (VLASS). Science Case and Survey Design. Publ. Astron. Soc. Pac. 2020, 132, 035001. [Google Scholar] [CrossRef]
- Clarke, T.E.; Kassim, N.E.; Brisken, W.; Helmboldt, J.; Peters, W.; Ray, P.S.; Polisensky, E.; Giacintucci, S. Commensal low frequency observing on the NRAO VLA: VLITE status and future plans. In Ground-Based and Airborne Telescopes VI; Hall, H.J., Gilmozzi, R., Marshall, H.K., Eds.; Society of Photo-Optical Instrumentation Engineers (SPIE) Conference Series; International Society for Optics and Photonics: Bellingham, WA, USA, 2016; Volume 9906, p. 99065B. [Google Scholar]
- Clarke, T.E.; Perley, R.A.; Kassim, N.E.; Hicks, B.C.; Owen, F.N.; Durand, S.; Kutz, C.; Pospieszalski, M.; Weiler, K.W.; Wilson, T. The Expanded Very Large Array Low Band Upgrade. General Assembly and Scientific Symposium, E5. 2011. Available online: https://ieeexplore.ieee.org/document/6051196 (accessed on 29 June 2021).
- Deller, A.T.; Tingay, S.J.; Bailes, M.; West, C. DiFX: A Software Correlator for Very Long Baseline Interferometry Using Multiprocessor Computing Environments. Publ. Astron. Soc. Pac. 2007, 119, 318–336. [Google Scholar] [CrossRef]
- Burenin, R.A.; Vikhlinin, A.; Hornstrup, A.; Ebeling, H.; Quintana, H.; Mescheryakov, A. The 400 Square Degree ROSAT PSPC Galaxy Cluster Survey: Catalog and Statistical Calibration. Astrophys. J. Suppl. Ser. 2007, 172, 561–582. [Google Scholar] [CrossRef]
- Cotton, W.D. Obit: A Development Environment for Astronomical Algorithms. Publ. Astron. Soc. Pac. 2008, 120, 439. [Google Scholar] [CrossRef]
- Van Moorsel, G.; Kemball, A.; Greisen, E. AIPS Developments in the Nineties. Astron. Data Anal. Softw. Syst. V 1996, 101, 37. [Google Scholar]
- Polisensky, E.; Lane, W.M.; Hyman, S.D.; Kassim, N.E.; Giacintucci, S.; Clarke, T.E.; Cotton, W.D.; Cleland, E.; Frail, D.A. Exploring the Transient Radio Sky with VLITE: Early Results. Astrophys. J. 2016, 832, 60. [Google Scholar] [CrossRef]
- Perley, R.A.; Butler, B.J. An Accurate Flux Density Scale from 50 MHz to 50 GHz. Astrophys. J. Suppl. Ser. 2017, 230, 7. [Google Scholar] [CrossRef]
- Offringa, A.R.; McKinley, B.; Hurley-Walker, N.; Briggs, F.H.; Wayth, R.B.; Kaplan, D.L.; Bell, M.E.; Feng, L.; Neben, A.R.; Hughes, J.D.; et al. WSCLEAN: An implementation of a fast, generic wide-field imager for radio astronomy. Mon. Not. R. Astron. Soc. 2014, 444, 606–619. [Google Scholar] [CrossRef]
- Briggs, D.S. High Fidelity Interferometric Imaging: Robust Weighting and NNLS Deconvolution. Ph.D. Thesis, New Mexico Institute of Mining Technology, Socorro, NM, USA, 1995. [Google Scholar]
- Chandra, P.; Ray, A.; Bhatnagar, S. The Late-Time Radio Emission from SN 1993J at Meter Wavelengths. Astrophys. J. 2004, 612, 974–987. [Google Scholar] [CrossRef]
- Vikhlinin, A.; Markevitch, M.; Murray, S.S.; Jones, C.; Forman, W.; Van Speybroeck, L. Chandra Temperature Profiles for a Sample of Nearby Relaxed Galaxy Clusters. Astrophys. J. 2005, 628, 655–672. [Google Scholar] [CrossRef]
- Markevitch, M.; Mazzotta, P.; Vikhlinin, A.; Burke, D.; Butt, Y.; David, L.; Donnelly, H.; Forman, W.R.; Harris, D.; Kim, D.-W.; et al. Chandra Temperature Map of A754 and Constraints on Thermal Conduction. Astrophys. J. 2003, 586, L19–L23. [Google Scholar] [CrossRef]
- Markevitch, M.; Ponman, T.J.; Nulsen, P.E.J.; Bautz, M.W.; Burke, D.J.; David, L.P.; Davis, D.; Donnelly, R.H.; Forman, W.R.; Jones, C.; et al. Chandra Observation of Abell 2142: Survival of Dense Subcluster Cores in a Merger. Astrophys. J. 2000, 541, 542–549. [Google Scholar] [CrossRef]
- Kalberla, P.M.W.; Burton, W.B.; Hartmann, D.; Arnal, E.M.; Bajaja, E.; Morras, R.; Pöppel, W.G.L. The Leiden/Argentine/Bonn (LAB) Survey of Galactic HI. Final data release of the combined LDS and IAR surveys with improved stray-radiation corrections. Astron. Astrophys. 2005, 440, 775–782. [Google Scholar] [CrossRef]
- York, D.G.; Adelman, J.; Anderson, J.E.; Anderson, S.F.; Annis, J.; Bahcall, N.A.; Bakken, J.A.; Barkhouser, R.; Bastian, S.; Berman, E.; et al. The Sloan Digital Sky Survey: Technical Summary. Astron. J. 2000, 120, 1579. [Google Scholar] [CrossRef]
- Lawrence, A.; Warren, S.J.; Almaini, O.; Edge, A.C.; Hambly, N.C.; Jameson, R.F.; Lucas, P.; Casali, M.; Adamson, A.; Dye, S.; et al. The UKIRT Infrared Deep Sky Survey (UKIDSS). Mon. Not. R. Astron. Soc. 2007, 379, 1599–1617. [Google Scholar] [CrossRef]
- Chambers, K.C.; Magnier, E.A.; Metcalfe, N.; Flewelling, H.A.; Huber, M.E.; Waters, C.Z.; Denneau, L.; Draper, P.W.; Farrow, D.; Finkbeiner, D.P.; et al. The Pan-STARRS1 Surveys. arXiv 2016, arXiv:1612.05560. [Google Scholar]
- Beck, R.; Krause, M. Revised equipartition and minimum energy formula for magnetic field strength estimates from radio synchrotron observations. Astron. Nachrichten 2005, 326, 414–427. [Google Scholar] [CrossRef]
- Brunetti, G.; Setti, G.; Comastri, A. Inverse Compton X-rays from strong FRII radio-galaxies. Astron. Astrophys. 1997, 325, 898–910. [Google Scholar]
- Vikhlinin, A.; Burenin, R.A.; Ebeling, H.; Forman, W.R.; Hornstrup, A.; Jones, C.; Kravtsov, A.V.; Murray, S.S.; Nagai, D.; Quintana, H.; et al. Chandra Cluster Cosmology Project. II. Samples and X-ray Data Reduction. Astrophys. J. 2009, 692, 1033–1059. [Google Scholar] [CrossRef]
- Jones, C.; Forman, W. The structure of clusters of galaxies observed with Einstein. Astrophys. J. 1984, 276, 38–55. [Google Scholar] [CrossRef]
- Nandi, S.; Saikia, D.J.; Roy, R.; Dabhade, P.; Wadadekar, Y.; Larsson, J.; Baes, M.; Chandola, H.C.; Singh, M. A low-frequency study of recently identified double-double radio galaxies. Mon. Not. R. Astron. Soc. 2019, 486, 5158–5170. [Google Scholar] [CrossRef]
- Pajdosz-Śmierciak, U.; Jamrozy, M.; Soida, M.; Stawarz, L. Megaparsec-scale Radio Structure Associated with a Hybrid Blazar SBS B1646+499: Episodic Jet Activity with Precessing Axis. Astrophys. J. 2018, 868, 64. [Google Scholar] [CrossRef]
- Nandi, S.; Jamrozy, M.; Roy, R.; Larsson, J.; Saikia, D.J.; Baes, M.; Singh, M. Tale of J1328+2752: A misaligned double-double radio galaxy hosted by a binary black hole? Mon. Not. R. Astron. Soc. 2017, 467, L56–L60. [Google Scholar] [CrossRef]
- Merritt, D.; Ekers, R.D. Tracing Black Hole Mergers through Radio Lobe Morphology. Science 2002, 297, 1310–1313. [Google Scholar] [CrossRef] [PubMed]
- Liu, F.K.; Wu, X.-B.; Cao, S.L. Double-double radio galaxies: Remnants of merged supermassive binary black holes. Mon. Not. R. Astron. Soc. 2003, 340, 411–416. [Google Scholar] [CrossRef]
- Nulsen, P.E.J.; McNamara, B.R.; Wise, M.W. The Cluster-Scale AGN Outburst in Hydra A. Astrophys. J. 2005, 628, 629–636. [Google Scholar] [CrossRef]
- Simionescu, A.; Roediger, E.; Nulsen, P.E.J. The large-scale shock in the cluster of galaxies Hydra A. Astron. Astrophys. 2009, 495, 721–732. [Google Scholar] [CrossRef]
- Bîrzan, L.; McNamara, B.R.; Nulsen, P.E.J.; Carilli, C.L.; Wise, M.W. Radiative Efficiency and Content of Extragalactic Radio Sources: Toward a Universal Scaling Relation between Jet Power and Radio Power. Astrophys. J. 2008, 686, 859–880. [Google Scholar] [CrossRef]
- O’Sullivan, E.; Giacintucci, S.; David, L.P.; Vrtilek, J.M.; Raychaudhury, S. A deep Chandra observation of the poor cluster AWM 4—II. The role of the radio jets in enriching the intracluster medium. Mon. Not. R. Astron. Soc. 2011, 411, 1833–1842. [Google Scholar] [CrossRef]
- Shin, J.; Woo, J.-H.; Mulchaey, J.S. A Systematic Search for X-ray Cavities in Galaxy Clusters, Groups, and Elliptical Galaxies. Astrophys. J. Suppl. Ser. 2016, 227, 31. [Google Scholar] [CrossRef]
- Giacintucci, S.; Markevitch, M.; Johnston-Hollitt, M.; Wik, D.R.; Wang, Q.H.S.; Clarke, T.E. Discovery of a Giant Radio Fossil in the Ophiuchus Galaxy Cluster. Astrophys. J. 2020, 891, 1. [Google Scholar] [CrossRef]
- Sanders, J.S.; Fabian, A.C.; Taylor, G.B. Giant cavities, cooling and metallicity substructure in Abell 2204. Mon. Not. R. Astron. Soc. 2009, 393, 71–82. [Google Scholar] [CrossRef][Green Version]
- Wise, M.W.; McNamara, B.R.; Nulsen, P.E.J.; Houck, J.C.; David, L.P. X-ray Supercavities in the Hydra A Cluster and the Outburst History of the Central Galaxy’s Active Nucleus. Astrophys. J. 2007, 659, 1153–1158. [Google Scholar] [CrossRef]
- McNamara, B.R.; Nulsen, P.E.J. Heating Hot Atmospheres with Active Galactic Nuclei. Annu. Rev. Astron. Astrophys. 2007, 45, 117–175. [Google Scholar] [CrossRef]
- Werner, N.; McNamara, B.R.; Churazov, E.; Scannapieco, E. Hot Atmospheres, Cold Gas, AGN Feedback and the Evolution of Early Type Galaxies: A Topical Perspective. Space Sci. Rev. 2019, 215, 5. [Google Scholar] [CrossRef]
- Bîrzan, L.; Rafferty, D.A.; McNamara, B.R.; Nulsen, P.E.J.; Wise, M.W. The Detectability of AGN Cavities in Cooling-Flow Clusters. AIP Conf. Proc. 2009, 1201, 301–304. [Google Scholar]
- O’Sullivan, E.; Giacintucci, S.; David, L.P.; Vrtilek, J.M.; Raychaudhury, S. A deep Chandra observation of the poor cluster AWM 4—I. Properties of the central radio galaxy and its effects on the intracluster medium. Mon. Not. R. Astron. Soc. 2010, 407, 321–338. [Google Scholar] [CrossRef]
- Randall, S.W.; Forman, W.R.; Giacintucci, S. Shocks and Cavities from Multiple Outbursts in the Galaxy Group NGC 5813: A Window to Active Galactic Nucleus Feedback. Astrophys. J. 2011, 726, 86. [Google Scholar] [CrossRef]
- O’Dea, C.P.; Owen, F.N. Astrophysical Implications of the Multifrequency VLA Observations of NGC 1265. Astrophys. J. 1987, 316, 95. [Google Scholar] [CrossRef]
- Croston, J.H.; Hardcastle, M.J.; Birkinshaw, M.; Worrall, D.M.; Laing, R.A. An XMM-Newton study of the environments, particle content and impact of low-power radio galaxies. Mon. Not. R. Astron. Soc. 2008, 386, 1709–1728. [Google Scholar] [CrossRef][Green Version]
- Biava, N.; Brienza, M.; Bonafede, A.; Gitti, M.; Bonnassieux, E.; Harwood, J.; Edge, A.C.; Gitti, M.; Bonnassieux, E.; Harwood, J.; et al. Constraining the AGN duty cycle in the cool-core cluster MS 0735.6+7421 with LOFAR data. Astron. Astrophys. 2021, 650, A170. [Google Scholar] [CrossRef]
- Murgia, M.; Markevitch, M.; Govoni, F.; Parma, P.; Fanti, R.; de Ruiter, H.R.; Mack, K.-H. Chandra observations of dying radio sources in galaxy clusters. Astron. Astrophys. 2012, 548, A75. [Google Scholar] [CrossRef]
- Croston, J.H.; Hardcastle, M.J. The particle content of low-power radio galaxies in groups and clusters. Mon. Not. R. Astron. Soc. 2014, 438, 3310–3321. [Google Scholar] [CrossRef]
- Sun, M.; Jones, C.; Forman, W.; Vikhlinin, A.; Donahue, M.; Voit, M. X-ray Thermal Coronae of Galaxies in Hot Clusters: Ubiquity of Embedded Mini-Cooling Cores. Astrophys. J. 2007, 657, 197–231. [Google Scholar] [CrossRef]
- Cheung, C.C.; Giacintucci, S.; Clarke, T.E. Extended Radio Structures and a Compact X-ray Cool-core in the Cluster Source PKS 1353-341. Astrophys. J. 2019, 875, 108. [Google Scholar] [CrossRef]
- Sun, M.; Forman, W.; Vikhlinin, A.; Hornstrup, A.; Jones, C.; Murray, S.S. ESO 3060170: A Massive Fossil Galaxy Group with a Heated Gas Core? Astrophys. J. 2004, 612, 805–816. [Google Scholar] [CrossRef]


| Frequency (MHz) | Flux Density (mJy) | Reference | Spectral Index | |
|---|---|---|---|---|
| Total | 74 | VLSSr, this work | ||
| 76 | GLEAM | |||
| 107 | GLEAM | |||
| 143 | GLEAM | |||
| 150 | TGSS, this work | |||
| 174 | GLEAM | |||
| 212 | GLEAM | |||
| 338 | VLITE, this work | |||
| 610 | GMRT, this work | |||
| 888 | RACS, this work | |||
| 1400 | NVSS, this work | |||
| Inner | 338 | VLITE, this work | ||
| lobes | 610 | GMRT, this work | ||
| 888 | RACS, this work | |||
| 1400 | FIRST, this work | |||
| 3000 | VLASS 1.2, this work | |||
| Outer | 150 | TGSS-ADR, this work | ||
| lobes | 338 | VLITE, this work | ||
| 610 | GMRT, this work | |||
| 888 | RACS, this work | |||
| 1400 | NVSS, this work | |||
| S1 | 338 | VLITE, this work | ||
| 888 | RACS | |||
| 1400 | this work | |||
| S2 | 338 | VLITE, this work | ||
| 888 | RACS | |||
| 1400 | FIRST | |||
| S3 | 338 | VLITE, this work | ||
| 888 | RACS | |||
| 1400 | FIRST |
| Component | (MHz) | (Myr) | (Myr) | (Myr) | ||
|---|---|---|---|---|---|---|
| inner lobes | ⋯ | ≳3000 | ≲52 | ⋯ | ||
| outer lobes | ≲740 | ≳122 | ≲0.9 | ≳12 | ≲110 |
| Component | (W Hz−1) | (μG) | (erg cm−3) | (erg cm−3) | (erg cm−3) |
|---|---|---|---|---|---|
| inner lobes | 4.3 | ∼ | |||
| outer lobes | 2.1 | ∼ |
Publisher’s Note: MDPI stays neutral with regard to jurisdictional claims in published maps and institutional affiliations. |
© 2021 by the authors. Licensee MDPI, Basel, Switzerland. This article is an open access article distributed under the terms and conditions of the Creative Commons Attribution (CC BY) license (https://creativecommons.org/licenses/by/4.0/).
Share and Cite
Giacintucci, S.; Clarke, T.; Kassim, N.E.; Peters, W.; Polisensky, E. Radio and X-ray Observations of the Restarted Radio Galaxy in the Galaxy Cluster CL 0838+1948. Galaxies 2021, 9, 108. https://doi.org/10.3390/galaxies9040108
Giacintucci S, Clarke T, Kassim NE, Peters W, Polisensky E. Radio and X-ray Observations of the Restarted Radio Galaxy in the Galaxy Cluster CL 0838+1948. Galaxies. 2021; 9(4):108. https://doi.org/10.3390/galaxies9040108
Chicago/Turabian StyleGiacintucci, Simona, Tracy Clarke, Namir E. Kassim, Wendy Peters, and Emil Polisensky. 2021. "Radio and X-ray Observations of the Restarted Radio Galaxy in the Galaxy Cluster CL 0838+1948" Galaxies 9, no. 4: 108. https://doi.org/10.3390/galaxies9040108
APA StyleGiacintucci, S., Clarke, T., Kassim, N. E., Peters, W., & Polisensky, E. (2021). Radio and X-ray Observations of the Restarted Radio Galaxy in the Galaxy Cluster CL 0838+1948. Galaxies, 9(4), 108. https://doi.org/10.3390/galaxies9040108